FARSTAD SHIPPING ASA ANNUAL REPORT 2001 · and 10 AHTS are owned through IOS, ... are operated in...
30
FARSTAD SHIPPING ASA ANNUAL REPORT 2001
Transcript of FARSTAD SHIPPING ASA ANNUAL REPORT 2001 · and 10 AHTS are owned through IOS, ... are operated in...
FARSTAD SHIPPING ASA
ANNUAL REPORT 2001

3
80
100
60
40
20
0
%
800
1000
600
400
200
0
(mill. NOK)
1993 1994 1995 1996 1997 1998 1999 2000 2001
1200
FINANCIAL DEVELOPMENT FARSTAD SHIPPING
Freight income Cash flow *) CF-margin
*) Cash flow (CF) is defined as result before tax and sales of operating assets + depreciation +/- unrealised disagio/agio concerning mortgage dept in foreign currency.
THIS IS FARSTAD SHIPPING ASA
Farstad Shipping’s strategy is to grow and maintain a long-term presence as a substantial operator of large and modern offshore service vessels on a world wide basis. The Company has focused its activities in the market segment that demands the largest and most advanced tonnage; anchor handling vessels (AHTS) with engine power greater than 10,000 BHP and platform supply vessels (PSV) with loading capacity greater than 2,000 DWT.
Farstad Shipping started its offshore activities in 1973 as one of the pioneers in the North Sea. At this time, the Company contracted its first supply vessel, an AHTS model UT 704. This was the first order of a UT vessel design that the Ulstein Group
received, a design that was to become standard in the industry. Since the initial order, the Company has ordered a total of 37 vessels of this type. In addition, favourable timing of trading of vessels has been instrumental in building the Company’s fleet as it remains today.
The Company has been traded on the stock exchange as a public company since 1988. In 1993, the Company was fully integrated when all its operations were consolidated. Through co-operation with P&O, Australia, and Petroserv, Brazil, Farstad Shipping has solidified its international commitment.
The Company’s fleet consists of 43 vessels, 21 of which are PSV’s and 22 are AHTS. Of these vessels, 4 PSV and 10 AHTS are owned through IOS, a joint venture with P&O, Australia, of which the Company owns 50%. In addition, 1 AHTS is chartered through a bare-boat agreement. The contract coverage is 83% for 2002 and 63% for 2003. The Company intends to maintain a long-term chartering profile.
Currently, Farstad Shipping has no vessels under construction. However, through its joint venture, Brazil Offshore Services (BOS), the Company is optimistic about securing 3 contracts with Petrobras, and winning these contracts would necessitate contracting new tonnage. Presently, IOS has 2 AHTS on order for delivery in March and July 2003.
The Company’s activities are managed by 55 employees in offices located in Ålesund, Aberdeen and Macae, Brazil. Vessels in the Far East/Australia are managed by our partner in Melbourne, P&O Maritime Services. At this time, 3 vessels are underway to new markets. When these are employed, 20 vessels will be located in the North Sea, 7 in Brazil, 7 in Australia, 5 in the Far East, 1 in West Africa and 1 in the Black Sea. There are a total of 950 sailing crew.
Farstad Shipping has approximately 1,700 shareholders. In the middle of March 2002, the price per share was NOK 47.00, which gives the Company a market value of approx. NOK 1.9 Bn.
Far Grip - Photo: Jan Fredrik Midtflå
2
This is Farstad Shipping ASA 3Status and the road ahead 4Highlights in 2001 5Administration and organisation 6Main financial figures 8Analycal information 10Shareholder details 13Market strategy 16 The market for offshore supply vessels 17HSE-philosophy 28Helth, Safety and Environment 29Recruitment 33The Board of Directors 34Annual report 35Profit and loss account 42Balance sheet 43Cash flow statement 44 Notes to financial statement 45Auditor's report 53 Fleet gallery 54The Farstad Fleet - employment 55Glossary 57
CONTENTThe Farstad Fleet (100%):AHTS BHP> 10.000 11PSV DWT> 2.000 15PSV DWT< 2.000 2 28The IOS fleet (50%):AHTS BHP> 10.000 8AHTS newbuilds BHP> 10.000 2AHTS BHP< 10.000 3PSV DWT> 2.000 4 17
Total number of vessels 45

4 5
Last year, the American magazine Marine Money completed an analysis of profitability and solidity among 50 shipping and offshore companies. Based on fiscal 2000 results, all companies were ranked by six criteria, including net result and the balance sheet. Farstad Shipping ASA was ranked second only to Coflexip Stena Offshore.
The prize was awarded at J.P. Morgan’s offices in New York during Marine Money Week in June 2001.
We are very pleased to have maintained our profitability despite doubling our revenues since 1997.
STATUS AND THE ROAD AHEAD
Again we have put another successful year behind us. The year finished more favourable than anticipated in many areas, although there were some disappointments as well. The most significant events, either positive or negative, are summarised on the opposite page.
Despite the drama of terror and war as well as a worldwide recession, the offshore market showed strength until the end of December. Subsequently, the financial results were better than the previous year and favourable against the budget as well. With a strong result behind us, and a high contract coverage going into 2002, Farstad Shipping ASA is in an excellent position to continue its success in 2002.
In the early years, the growth strategy was to secure long-term charters prior to ordering a newbuild. During the latter part of the 90’s, we had achieved sufficient financial strength to order new vessels without securing charters in advance. Subsequently, when we envisaged market growth in 2000, we had the ability to order vessels at favourable prices and delivery dates. During the year 2000, the Company ordered 5 vessels without long-term contracts and 2 vessels (ordered through IOS - 50% owned) with contracts, representing a total investment of NOK 1,1 Bn. Today, all the vessels have been delivered, and 3 additional vessels have been purchased from Woodside and P&O. Four of the five wholly owned vessels have entered into long-term contracts.
The additional activity has put many parts of the organisation under considerable pressure. A great thanks is owed to all for great efforts throughout the year! The Company could not be successful without its motivated and skilled staff, both on and offshore. In order to continue to develop and maintain our position as one of the top performers, we need creative team members who have the drive to further improve the organisation.
We must recognise that safety and security is among the most valued aspects in life, both privately and professionally. We desire secure jobs, safety and recognition in a community, and safety for life and health. At Farstad Shipping, we want all our employees to feel secure and safe. We also want the spouses of all those who are at work either on land or at sea feel that their families are in a safe environment at work. Everyone’s support is needed in order to achieve and maintain such an environment. Safety and sound financial results are our top benchmarks for how we measure success.
We see it as a mission to include everyone in the community of our organisation and motivate employees at all levels to actively pursue improved safety at work in the time ahead.
Terje J. K. Andersen CEO
FOCUS ON PROFITABILITY
HIGHLIGHTS IN 2001
NEGATIVEOne vessel collided with an oil rig
Delay in the delivery of a new vessel to IOS by a Korean shipyard
Many new vessels under construction
High Norwegian interest rate levels
An uncertainty about the oil price
POSITIVEFocus on Health, Safety and Environment (HSE)No serious injuries to personnelExcellent and thorough work on safetyReceived Best Supplier Award from Petrobas in the large contracts category Overall high quality operations
A good year for the ownersGenerated significantly higher revenues than anticipatedMaintained the value of the Company’s tonnage (fleet)A rise in the Company’s stockA dividend increaseA buy-back of own shares equivalent to 8.2% of outstanding shares
A favourable North Sea marketNew tonnage absorbed into the marketHigh activity level in the markets outside the North SeaA good balance between demand for, and supply of tonnage
A positive development for subsidiariesEfficient and profitable operations of our subsidiaries in Aberdeen and Macae (Brazil)Significant growth experienced by IOS
Substantial increase of the fleetThe delivery of four new, wholly owned vessels on time and within budgetary constraints.The delivery of one new vessel to IOSIOS’s acquisition of the Woodside fleet (3 vessels)
Long-term employmentSolid contracts coverage for the Company’s vesselsSeveral new, long-term contracts obtained by existing tonnageSecuring long-term contracts for all five newly delivered vessels
Sale of the Lochnagar
Low interest rate levels internationally
Strong USD and GBP
Far Supplier operating in the North Sea - Photo: Espen Kvale
6 7
John R. MaxwellManaging Director
Jim WattShip Manager
Helen WilsonPersonnel Officer
Richard StablesAccountant
Mike GibbonOperation Manager
Fiona DawsonAssistant Chartering Manager
Dawn HughesAccounts Assistant
Dennis SangsterTransportation
Marilyn GibbonAdministration Manager
George GrantShip Manager
Trevor ReidShip Manager
FARSTAD SHIPPING ASA
FARSTAD SHIPPING LTD FARSTAD BRASIL AS
BOS NAVEGAÇÃO LTDA
FARSTAD SUPPLY AS
FARSTAD INTERNATIONAL AS
P/R INTERNATIONAL OFFSHORE SERVICES ANS
100%
100%100%100%
50%
50%
P&O, Australia
50%
Petroserv, Brasil
50%
Felipe MeiraGeneral Manager
Tobias CepelowiczDelegate Manager
Fernando BorgerthTech. & Comm. Manager
Luciana FelizardoAccountant
Cláudio SantosPersonnel superv.
Nadimo NakhleOperation superv.
Cleiton BarcellosOperation agent
Ernesto LacerdaPurchases/Transport
Marco MeloPurchases/Transport
Aristido ReichertController
Tania SalesAccount Assistant
Viviane SilveiraAdm Assistant
Patricia BersotReceptionist/Assistant
Vera ParetoGeneral Services
FARSTAD SHIPPING ASA FARSTAD SHIPPING LTD.
BOS NAVEGAÇÃO LTDA.
Finance DepartmentTechnical Department
Terje J. K. AndersenManaging Director
Torstein L. StavsengFinance Director
Karl-Johan BakkenDirektør Market/Operation
Sylvi L. EliassenCharterer
Jan H. FarstadProject Manager
Helge WarholmPurchasing Manager
Magnar GjerdeQuality-/Safety Manager
Rolf SynnesCrewing Manager
Arild EgenessTechnical Manager
Idar GjerdeFinance Manager
Kjetil DreyerCommunikation & IT-Manager
Hallkjell DahleFinance Manager IOS
Odd Brand-HansenÅshild Huse
Eli-Inger HjelleRigmor lindgaardRagnhild Fylling
Hildegunn BlindheimWenche Slinning
Solveig Basso
Hege ThorvikController
Roald MorkEDB-Consultant
Trine G. Sandvik
Lars FevågRoar Skjeret
Torstein DavikJan E. Myklebust
Berit MøllRikke Hartmann
Kari SkusethGeir Hjelle
Sissel SkulstadSolveig Roald
Reidun EikelandAdm. secretary
Anne Dyb LiaaenPersonnelconsultant
Crewing Department
ADMINISTRATON AND ORGANISATION
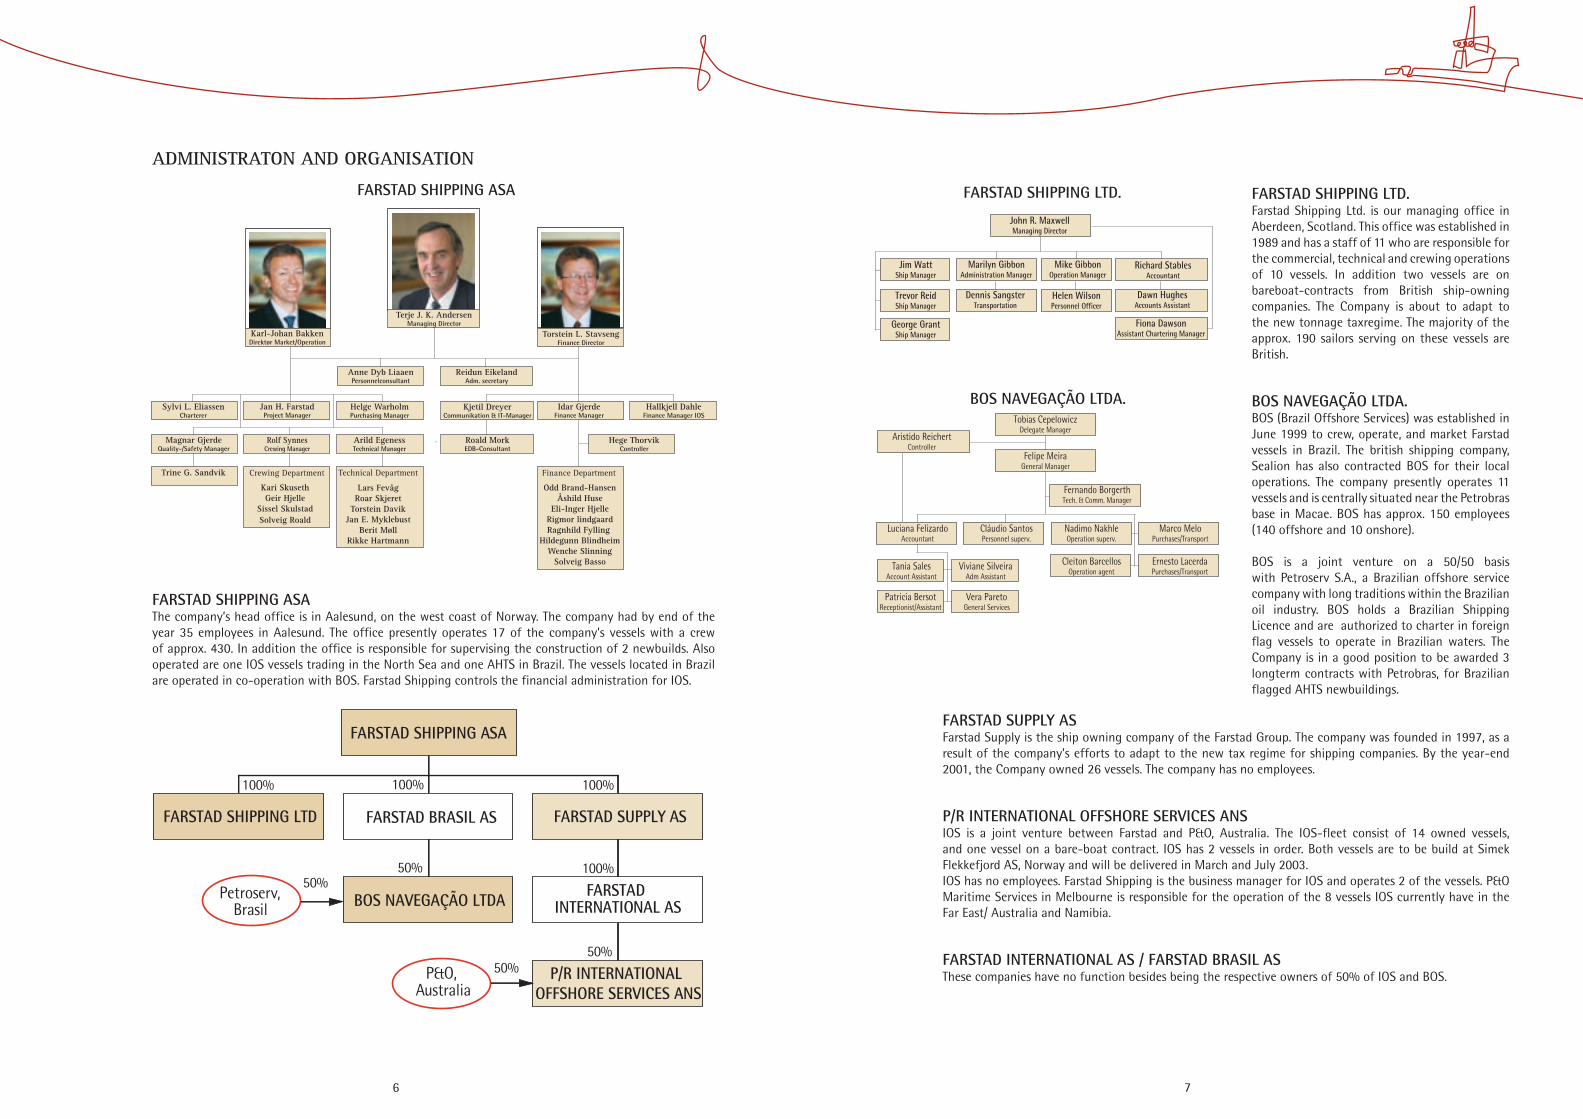
FARSTAD SHIPPING ASAThe company’s head office is in Aalesund, on the west coast of Norway. The company had by end of the year 35 employees in Aalesund. The office presently operates 17 of the company’s vessels with a crew of approx. 430. In addition the office is responsible for supervising the construction of 2 newbuilds. Also operated are one IOS vessels trading in the North Sea and one AHTS in Brazil. The vessels located in Brazil are operated in co-operation with BOS. Farstad Shipping controls the financial administration for IOS.
FARSTAD SHIPPING LTD. Farstad Shipping Ltd. is our managing office in Aberdeen, Scotland. This office was established in 1989 and has a staff of 11 who are responsible for the commercial, technical and crewing operations of 10 vessels. In addition two vessels are on bareboat-contracts from British ship-owning companies. The Company is about to adapt to the new tonnage taxregime. The majority of the approx. 190 sailors serving on these vessels are British.
BOS NAVEGAÇÃO LTDA.BOS (Brazil Offshore Services) was established in June 1999 to crew, operate, and market Farstad vessels in Brazil. The british shipping company, Sealion has also contracted BOS for their local operations. The company presently operates 11 vessels and is centrally situated near the Petrobras base in Macae. BOS has approx. 150 employees (140 offshore and 10 onshore).
BOS is a joint venture on a 50/50 basis with Petroserv S.A., a Brazilian offshore service company with long traditions within the Brazilian oil industry. BOS holds a Brazilian Shipping Licence and are authorized to charter in foreign flag vessels to operate in Brazilian waters. The Company is in a good position to be awarded 3 longterm contracts with Petrobras, for Brazilian flagged AHTS newbuildings.
FARSTAD SUPPLY ASFarstad Supply is the ship owning company of the Farstad Group. The company was founded in 1997, as a result of the company’s efforts to adapt to the new tax regime for shipping companies. By the year-end 2001, the Company owned 26 vessels. The company has no employees.
P/R INTERNATIONAL OFFSHORE SERVICES ANSIOS is a joint venture between Farstad and P&O, Australia. The IOS-fleet consist of 14 owned vessels, and one vessel on a bare-boat contract. IOS has 2 vessels in order. Both vessels are to be build at Simek Flekkefjord AS, Norway and will be delivered in March and July 2003.IOS has no employees. Farstad Shipping is the business manager for IOS and operates 2 of the vessels. P&O Maritime Services in Melbourne is responsible for the operation of the 8 vessels IOS currently have in the Far East/ Australia and Namibia.
FARSTAD INTERNATIONAL AS / FARSTAD BRASIL ASThese companies have no function besides being the respective owners of 50% of IOS and BOS.

8 9
1996 1997 19981999 2000 2001
120
150
90
60
30
0
250
300
200
150
100
0
50
1996 1997 19981999 2000 2001
(mill. NOK)(mill. NOK)
20
60
80
100
40
01995 1997 1998 20001999
%
1996 2001
200
600
800
1200
400
0
mill. NOK
1000
1995 1997 1998 200019991996 2001
(NOK)
Share capital (NOK mill.)Market price at 31.12 Market capitalisation (4) (NOK mill.)Share price high Share price low Earnings per share including sales profit (5) Earnings per share excluding sales profit Cash flow per share including sales profit (6)Cash flow per share excluding sales profit Dividend per shareRISK-amount (7)Average number of outstanding shares
SHARE KEY FIGURES
FARSTAD SHIPPING ASA - GROUP
2001 44.2 45.00 1,827.0 49.90 28.00 9.57 8.14 13.55 12.08 1.50 -0.96 42,910,872
2000 45.3 35.40 1,564.8 40.50 23.30 5.41 3.75 10.25 8.59 1.25 -1.00 44,653,088
1999 45.3 25.50 1,155.9 26.80 19.00 1.77 1.77 6.34 6.34 1.00 -1.00 45,329,370
1998 45.3 21.00 951.9 43.00 19.80 5.67 4.30 8.15 6.78 1.00 -1.00 45,329,370
1997 45.3 42.00 1,903.8 50.50 24.00 5.30 3.65 8.12 6.47 1.00 -0.00 45,329,370
DEFINITIONS:
(1) Current assets - short-term liabilities.
(2) Pre-tax profit - taxes paid + depreciation + change in revaluation of liabilities.
(3) Equity capital as a % of total assets.
(4) Total share outstanding x share price at 31.12.
(5) Pre-tax profit - taxes paid, divided by average number of shares outstanding.
(6) (2) divided by average shares outstanding.
(7) 01.01. of the year shown in the actual column.
MAIN FINANCIAL FIGURES
1997
598.3 75.1 (275.0) 398.5 (124.5) 274.0 (33.6) 240.4
1,709.2 259.3 1,968.5 976.9 877.3 114.3
167.6 145.0 368.3
1,968.5 976.9 49.6%
1,579.0 875.9
2001
1,177.5 63.2 (509.6) 731,0 (185.7) 545.4 (119.0) 426.3
3,449,1 708.0 4,157.1 1,587.6 2,366.2 203.3
438.9 504.7 580.2
4,157.1 1,587.6 38.2%
3,408.2 2,243.0
2000
989.2 74.2 (481.0) 582.4 (182.4) 400.0 (151.7) 248.3
2,866.7 554.1 3,420.8 1,373.0 1,871.9 175.8
302.2 378.3 457.7
3,420.8 1,373.0 40.1%
2,707.7 1,870.2
PROFIT AND LOSS ACCOUNT (NOK mill.)
Operating income ex. sale of fixed assetsProfit on sale of fixed assetsOperating expensesOperating profit before depreciationDepreciationOperating profitNet financial itemsPre-tax profit
BALANCE SHEET
Fixed assetsCurrent assetsTotal assetsEquity capitalLong-term liabilitiesShort-term liabilities
LIQUIDITY
Liquid assets Working capital (1)Cash flow (2)
CAPITAL
Total assets Equity capitalEquity ratio (3)
FLEET
Book value of vessels, interest in vesselsMortgage debt
1999
801.3 0.2 (426.5) 375.0 (159.6) 215.4 (129.3) 86.0
2,688.8 392.9 3,081.7 1,223.7 1,693.2 164.8
186.8 228.2 287.3
3,081.7 1,223.7 39.7%
2,613.1 1,693.1
1998
706.7 62.0 (347.6) 421.1 (118.9) 302.2 (43.4) 258.7
2,087.7 281.4 2,369.1 1,188,6 1,047.5 133.1
133.4 148.4 369.5
2,369.1 1,188.6 50.2%
1,866.2 1,045.4
FARSTAD SHIPPING ASA - GROUP
OPERATING INCOME(excl. profit on sales)
CASH FLOW(before tax and profit on sales)
1 quarter 2 quarter 3 quarter 4 quarter 1 quarter 2 quarter 3 quarter 4 quarter
Norway UK Brazil Far East/Australia Other
FREIGHT INCOME FARSTAD SHIPPING IN % AND NOK SORTED BY SECTOR

10 11
250
200
150
100
50
0UT 745
(Far Service) UT 705
(Far Scandia)UT 722
(Far Grip)ME 303 II (Far Sea)
6000
5000
4000
3000
2000
1000
0 31.12.92 31.12.93 31.12.94 31.12.95 31.12.96 31.12.97 31.12.98 31.12.99 31.12.00 31.12.01
PSV AHTS(NOK mill.)
(NOK mill.)
1995 1996 1997 1998 1999 2000 2001
1200
1000
800
600
400
200
0
60
50
40
30
20
10
0
92 93 94 95 96 97 98 99 00 01
3500
3000
2500
2000
1500
1000
500
0
(NOK mill.)
(NOK mill.)
2000 2001
VESSELS SEGMENT2001 2000 2001 2000
OPERATING INCOME SORTED BY BUSINESS SEGMENT
AHTS PSV Norwegian sector UK sector
Brazsil Far East / Australia Others
EBIT IN % OF OPERATING INCOMESORTED BY REGION
Norwegian British Brazil Far East Australia
VALUE ADJUSTED EQUITY VS. MARKET CAPITALISATION
VAE 31.12.01 Total Per share*) (NOK mill.) (NOK)
Market value vessels 5,053.1 124.46Book value vessels 3,404.6 83.86Excess value vessels 1,648.5 40.60Book equity 1,587.4 39.10VAE 3,236.1 79.70 *) number of 40.6 mill
Value adjusted equity Market capitalisation
Total (NOK mill.)
DEVELOPMENT IN VALUE OF VESSELS
Market value Book value Mortgage
AREAS OF OPERATIONSIn note no. 19 in the financial statements, the Company’s activities are categorized by type of vessel and geography. In this footnote, a detailed account of each segment is given. A detailed account is also shown in the section describing each market segment, page 20 to 27. However, it should be noted that this breakdown does not support a complete profitability evaluation by segment. There is some degree of uncertainty associated with this type of breakdown by cost, revenues and balance sheet allocations. There are many other factors to consider; the markets’ different needs and requirement for tonnage, the vessels’ varying life cycle depending on which market they serve, the age of the tonnage, the contract terms, operational demands, tax laws, need for local partner, and the varying degree of administrative/marketing support required by each individual vessel.
VALUE ADJUSTED EQUITY (VAE)Following a 10% decrease in 1999, the value adjusted equity increased by approximately 42% in the year 2000. During the year 2001, it rose another 14%. VAE was estimated at NOK 3.2 billion at the end of year 2001 vs. NOK 2.8 billion at the end of year 2000. The market value of the Company (share price multiplied by number of shares outstanding) during the same time period increased by approximately 17%, after rising 35% in year 2001. At the end of 2000, the market value was NOK 1,827 million (vs. NOK 1,565 million at the end of year 2000).
MARKET VALUE OF VESSELSThe market value is based on estimates from three independent Norwegian brokers at the end of year 2001. An overview of estimated value for each vessel can be found in Fleet Overview on page 55. The valuations assume that the vessels are free of charter and immediately available for sale. All valuations are given in Norwegian currency.
The exhibit on the next page displays the growth in value for 2 PSV’s and 2 AHTS during recent years. After a decrease of 7% in 1998 and 12% in 1999, the year 2000 saw an increase of 17%. There was no material change in value in 2001. The recent trading of vessels in the second hand market has shown that our current value estimates are prudent.
ANALYTICAL INFORMATION
VARIATION IN BROKERS’ ESTIMATESThe brokers’ estimates use high/low intervals. Taking the average on the high end produces a fleet value of NOK 5,151 million (equivalent to VAE of NOK 82.10 per share), whereas the low end average gives a fleet value of NOK 4,955.2 million (equivalent to VAE of NOK 77.30 per share). A value appreciation of 10% would yield a change in VAE of NOK 12.45 per share, or 15.6%.
EXCESS VALUESThe calculation of value adjusted equity takes into account differences between the market value of the vessels and their book value. Any other factors that would impact value are excluded. The value estimates further assume that the vessels can and will be sold individually. No adjustments have been made for the potential value of chartering contracts nor for vessels under construction. Thus, the potential increase or decrease in value by selling the entire fleet in one piece, or the Company as a going concern is not contemplated in the calculation of value adjusted equity. However, the acquisitions seen during recent years have shown that buyers are willing to pay a significant premium in exchange for control over a company.
TAXATIONTax adjusted equity has not been estimated. The Company has, since 1997, conformed to the new taxation laws for the offshore industry. Due to substantial investments in new tonnage, the Company nonetheless would not be liable for income tax in Norway for several years. The transition regulations made it advantageous to conform to the new tax laws starting in 1997 and onward.
VALUE OF VESSELS VS. MORTGAGE DEBT

12 13
500
400
300
200
1,601,401,201,000,800,600,40 0,200,00
93 94 95 96 97 98 99 00 01
100
0
50
45
40
35
30
25
20
15
10
5
0
50
40
30
20
10
0 1997 1998 1999 2000 2001
%
600
1992 1993 1994 1995 1996 1997 1998 1999 2000 2001
1992 1993 1994 1995 1996 1997 1998 1999 2000 2001
Farstad Shipping ASA
Farstad Shipping ASA
MORTGAGE SORTED BY CURRENCY
DEVELOPMENT IN EBIT MARGINS(Operating result divided by Operating income)
MORTGAGE SORTED BY LENDER
Mortgage is inclusive UK-lease and Farstad Shipping’s share of the mortgage in IOS
PAYMENT TO SHAREHOLDERS(NOK per share)
SHAREPRICE DEVELOPMENT 1992 - 2002(NOK per share)
DEVELOPMENT IN SHAREPRICE VS. OSLO EXCHANGE BENCHMARK INDEX 1992 - 2002
Oslo Stock Exchange Index
The consolidated Company’s total tax liability in the future is dependent upon the results in those subsidiaries that are excluded from the special offshore taxation laws, as well as the size of operations on the Australian continent and operations on those continents subject to withholding tax. Please see Note 13 in the financial statements for additional details
KEY FIGURESWhen calculating key figures, the average number of own shares held by the Company was subtracted from the total number of shares outstanding. The entire holding is subtracted from estimates made as of 31.12. For definitions of key figures, please see page 9.
OPERATING MARGINS When calculating operating margins, any profit made on a sale of a vessel has been subtracted. Other companies in the industry may practice different accounting principles, possibly preventing margins from being comparable between the various companies.
INTEREST AND FOREIGN EXCHANGE EXPOSURES (see note 12 on page 49)At the beginning of year 2001, the interest exposure was estimated to impact cash flow by NOK 0.05 per share for every percentage point change in US interest rates. A similar change in the NOK and GBP rates would yield a cash flow impact of NOK 0.10 and NOK 0.075 per share, respectively. The interest exposure is sought reduced on an ongoing basis through hedging.
The Company expects the following currency distribution for its 2002 freight revenues: GBP, 38%, USD, 36%, NOK, 20%, AUD, 6%. For the portion of revenues that is not matched by a corresponding operating cost or finance expenses or principal payments in same currency, foreign exchange exposure is sought reduced on an ongoing basis through various types of derivatives. The effect from currency fluctuations will depend upon what trading position the Company has taken at any given moment. Generally, a strong USD, GBP and AUD is favourable. Note 16 on page 51 displays our trading positions as of 31.12.01.
The exhibit to the left displays an overview of the Company’s largest lenders and mortgage debt by currency. Payments made on long term debt totalled NOK 282 million in year 2001. In 2002, payments are expected to reach NOK 285 million. Additionally, in conjunction with the deliveries of new vessels in 2002, the Company expects to increase its debt/leasing obligations by NOK 335 million.
USD (47,5%)
GBP (26,1%)
NOK (25,4%)
AUD (1,0%)
Sparebanken Moere (23,9%)
Nordea - Farstad Supply (22,2%)
Fokus Bank (15,0%)
Nordea - IOS (14,0%)
DnB - other (10,0%)
Gjensidige NOR (5,9%)
DnB - lease (5,0%)
Fortis Bank (4,0%)
SHAREHOLDER DETAILS
DIVIDENDThe aim of the Board of Directors is to give the Company’s shareholders a competitive return on invested capital over time. This return must be realized through a combination of an increase in the Company’s share price as well as dividend payments.
In the light of 2001 and the Company’s equity position, the Board has proposed a dividend of NOK 1.50 per share. Only those who are shareholders at the time of the Annual Meeting are entitled to receive a dividend. The Annual Meeting is held on the Company’s premises on May 7th, 2002 and the dividend to be approved at this meeting will be paid on May 27th. The Company intends to continue the policy of dividend payments in the future. The size of the dividend will be subject to consideration based on factors such as profits, investments and our stock buyback program.
STOCK BUYBACKBy the end of February 2002, the Company had purchased 5,326,370 of its own shares. The total investment is NOK 193.7 million, an average of NOK 36.35 per share.
SHARE PRICE AND MARKET VALUEAt the beginning of 2001, the Company’s share price was NOK 35.40. At the end of the year, it had increased to NOK 45.00. The 27% growth in share price, paid dividends of NOK 1.25 per share (paid in May 2001) and a 24% increase in the Company’s value adjusted equity made 2001 an overall excellent year for the shareholders.
At the end of 2001, the Company’s market value was NOK 1.83 Bn. compared to NOK 1.56 Bn. in the previous year. The high/low share price in 2001 was NOK 49.90 and NOK 28.00, respectively.
SHAREHOLDER COMPOSITIONOn 31.12.01, there were 1,745 shareholders, compared to 2,031 at the end of 2000. 44 foreign shareholders owned 7,1% of shares outstanding. By law, foreign investors can own up to 33 1/3% of the shares. In 2001, 23,2 million shares were traded, vs. 16.4 million shares in 2000. The stock was traded on 241 out of a total of 251 trading days.
Year Number Price Average of shares mill. NOK NOK2000: 1) 1,126,100 35.8 31.83 2001: 2) 3,103,270 113.3 36.502001/02: 3) 1,100,000 44.6 40.53
1)are deleted. 2)will be deleted in April 2002.3)will be aproved deleted in May 2002.
14 15
FINANCE CALANDAR (subject to be changed)
Resultfor 1 quarter 7 May Annual General Meeting 7 MayPayment to shareholders 27 May Result for 1 halfyear 22 Aug.Result for 3 quarter 31 Oct.
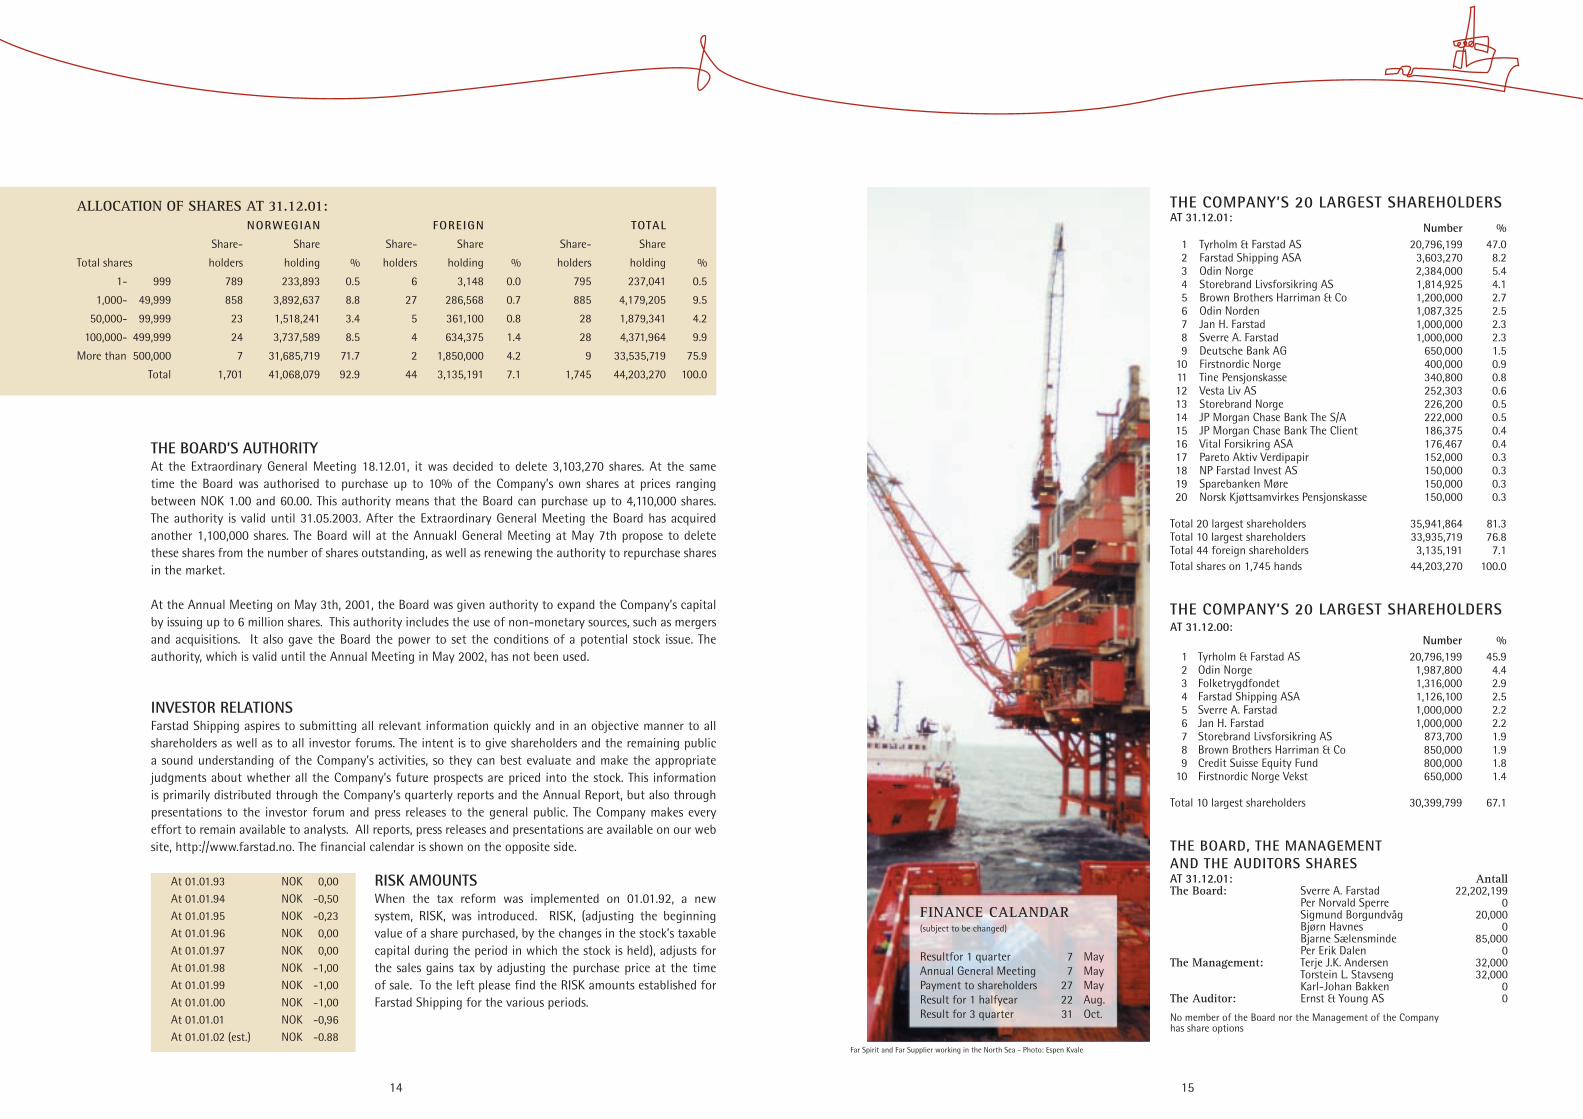
ALLOCATION OF SHARES AT 31.12.01: NORWEGIAN FOREIGN TOTAL
Share- Share Share- Share Share- Share
Total shares holders holding % holders holding % holders holding %
1- 999 789 233,893 0.5 6 3,148 0.0 795 237,041 0.5
1,000- 49,999 858 3,892,637 8.8 27 286,568 0.7 885 4,179,205 9.5
50,000- 99,999 23 1,518,241 3.4 5 361,100 0.8 28 1,879,341 4.2
100,000- 499,999 24 3,737,589 8.5 4 634,375 1.4 28 4,371,964 9.9
More than 500,000 7 31,685,719 71.7 2 1,850,000 4.2 9 33,535,719 75.9
Total 1,701 41,068,079 92.9 44 3,135,191 7.1 1,745 44,203,270 100.0
THE COMPANY’S 20 LARGEST SHAREHOLDERS AT 31.12.01: Number % 1 Tyrholm & Farstad AS 20,796,199 47.0 2 Farstad Shipping ASA 3,603,270 8.2 3 Odin Norge 2,384,000 5.4 4 Storebrand Livsforsikring AS 1,814,925 4.1 5 Brown Brothers Harriman & Co 1,200,000 2.7 6 Odin Norden 1,087,325 2.5 7 Jan H. Farstad 1,000,000 2.3 8 Sverre A. Farstad 1,000,000 2.3 9 Deutsche Bank AG 650,000 1.5 10 Firstnordic Norge 400,000 0.9 11 Tine Pensjonskasse 340,800 0.8 12 Vesta Liv AS 252,303 0.6 13 Storebrand Norge 226,200 0.5 14 JP Morgan Chase Bank The S/A 222,000 0.5 15 JP Morgan Chase Bank The Client 186,375 0.4 16 Vital Forsikring ASA 176,467 0.4 17 Pareto Aktiv Verdipapir 152,000 0.3 18 NP Farstad Invest AS 150,000 0.3 19 Sparebanken Møre 150,000 0.3 20 Norsk Kjøttsamvirkes Pensjonskasse 150,000 0.3 Total 20 largest shareholders 35,941,864 81.3Total 10 largest shareholders 33,935,719 76.8Total 44 foreign shareholders 3,135,191 7.1 Total shares on 1,745 hands 44,203,270 100.0
THE COMPANY’S 20 LARGEST SHAREHOLDERS AT 31.12.00: Number % 1 Tyrholm & Farstad AS 20,796,199 45.9 2 Odin Norge 1,987,800 4.4 3 Folketrygdfondet 1,316,000 2.9 4 Farstad Shipping ASA 1,126,100 2.5 5 Sverre A. Farstad 1,000,000 2.2 6 Jan H. Farstad 1,000,000 2.2 7 Storebrand Livsforsikring AS 873,700 1.9 8 Brown Brothers Harriman & Co 850,000 1.9 9 Credit Suisse Equity Fund 800,000 1.8 10 Firstnordic Norge Vekst 650,000 1.4 Total 10 largest shareholders 30,399,799 67.1
THE BOARD, THE MANAGEMENT AND THE AUDITORS SHARESAT 31.12.01: Antall The Board: Sverre A. Farstad 22,202,199 Per Norvald Sperre 0 Sigmund Borgundvåg 20,000 Bjørn Havnes 0 Bjarne Sælensminde 85,000 Per Erik Dalen 0The Management: Terje J.K. Andersen 32,000 Torstein L. Stavseng 32,000 Karl-Johan Bakken 0The Auditor: Ernst & Young AS 0
No member of the Board nor the Management of the Company has share options
THE BOARD’S AUTHORITYAt the Extraordinary General Meeting 18.12.01, it was decided to delete 3,103,270 shares. At the same time the Board was authorised to purchase up to 10% of the Company’s own shares at prices ranging between NOK 1.00 and 60.00. This authority means that the Board can purchase up to 4,110,000 shares. The authority is valid until 31.05.2003. After the Extraordinary General Meeting the Board has acquired another 1,100,000 shares. The Board will at the Annuakl General Meeting at May 7th propose to delete these shares from the number of shares outstanding, as well as renewing the authority to repurchase shares in the market.
At the Annual Meeting on May 3th, 2001, the Board was given authority to expand the Company’s capital by issuing up to 6 million shares. This authority includes the use of non-monetary sources, such as mergers and acquisitions. It also gave the Board the power to set the conditions of a potential stock issue. The authority, which is valid until the Annual Meeting in May 2002, has not been used.
INVESTOR RELATIONSFarstad Shipping aspires to submitting all relevant information quickly and in an objective manner to all shareholders as well as to all investor forums. The intent is to give shareholders and the remaining public a sound understanding of the Company’s activities, so they can best evaluate and make the appropriate judgments about whether all the Company’s future prospects are priced into the stock. This information is primarily distributed through the Company’s quarterly reports and the Annual Report, but also through presentations to the investor forum and press releases to the general public. The Company makes every effort to remain available to analysts. All reports, press releases and presentations are available on our web site, http://www.farstad.no. The financial calendar is shown on the opposite side.
RISK AMOUNTSWhen the tax reform was implemented on 01.01.92, a new system, RISK, was introduced. RISK, (adjusting the beginning value of a share purchased, by the changes in the stock’s taxable capital during the period in which the stock is held), adjusts for the sales gains tax by adjusting the purchase price at the time of sale. To the left please find the RISK amounts established for Farstad Shipping for the various periods.
At 01.01.93 NOK 0,00 At 01.01.94 NOK -0,50 At 01.01.95 NOK -0,23 At 01.01.96 NOK 0,00 At 01.01.97 NOK 0,00 At 01.01.98 NOK -1,00 At 01.01.99 NOK -1,00 At 01.01.00 NOK -1,00 At 01.01.01 NOK -0,96At 01.01.02 (est.) NOK -0.88
Far Spirit and Far Supplier working in the North Sea - Photo: Espen Kvale

1716
20%
Approx.1.800 vessels worldwide
PSV>2.000 DWT
161 + 57*)AHTS>10.000 BHP
160 + 31*)
DWT BHP
Farstad Shipping’s strategy is to grow and maintain a long-term presence as a substantial operator of large and modern offshore service vessels worldwide. The Company is focused on the market segment that demands the largest and most advanced tonnage; anchor handling vessels (AHTS) > 10,000 BHP and platform supply vessels (PSV) > 2,000 DWT.
In order to solidify the Company’s financial position to fund future growth, it intends to maintain its profile of long term chartering, and combine this with trading older vessels. Also, Farstad will prioritise international growth. In 2001, 73% of the Company’s revenues came from markets outside Norway. This share is expected to grow in the time ahead. Farstad’s established operations infrastructure in Aberdeen, Macae, Brazil
and Melbourne gives the Company a high degree of flexibility to move vessels between the various markets.
In recent years, several of the established supply vessel operators have chosen to invest heavily to take advantage of opportunities in the areas of seismic, sub-sea and cable laying activities. Instead, Farstad has chosen to continue its investments within supply and anchor handling vessels. However, a portion of our newer and larger tonnage could be considered for other types of activities, provided that contractual obligations can be fulfilled without permanent alterations to the vessels. Such permanent alterations could, in addition to reducing the versatility of the vessel, also lower its resale value.
MARKET STRATEGY
THE MARKET FOR OFFSHORE SUPPLY VESSELS
GENERAL MARKET DEVELOPMENTHistorically, the oil industry has migrated from land to sea, and from shallow waters to deep sea. This has generated a completely different set of demands for technology. In our industry, activity in deeper waters has increased the demand for engine capacity, manoeuvrability, and winch capacity for AHTS. It is necessary that the vessels are able to operate safely and effectively in the tough weather conditions that often characterises deep-sea oil installations. The increased focus on safe operations has significantly contributed to the use of technology onboard our vessels.
The oil companies have increased their focus on cost, causing rationalisation efforts in transportation to and from oil field installations. The result is an increasing trend to use fewer, but larger PSV’s with large deck areas and substantial
tank capacities, allowing simultaneous transportation of various types of cargo. In the North Sea, this has been standard practice for years, and other markets are now following this trend.
The increased number of floating production units (FPSO/FPU) have significantly increased the demand for high levels of station keeping and manoeuvrability for the supply vessels. This is one of the causes of the increased number of large platform vessels in markets outside the North Sea.
The supply vessel fleet totals approximately 1,700-1,800 units worldwide, depending on the definition of “supply vessel”. About 20% of the world tonnage is found in our target market, AHTS with engine power greater than 10,000 BHP and PSV’s with loading capacity greater than 2,000 DWT.
Of today’s total fleet, about 850 units are in excess of 20 years old. By the end of 2003, an additional 400 vessels will be over 20 years old. These numbers signal an inherent need for fleet renewal, and with the help of market forces, the most outdated tonnage will be replaced by newer and more modern tonnage. Excess tonnage will either disappear from the market, or seek employment in other, less developed markets. In the short term, we do not expect the market to be impacted by this development.
Far Grip, Far Scandia and Far Star at the base of Mongstad - Photo: Jarle Furset
*) Number of vessels + number of vessels in order per January -02
20
15
10
5
0
18 19
80
60
40
20
0
100
80
60
40
20
0
0 10 20 30 40 50 60
35302520151050
2002 2003 2004
Jan. 2002 Jan. 1998
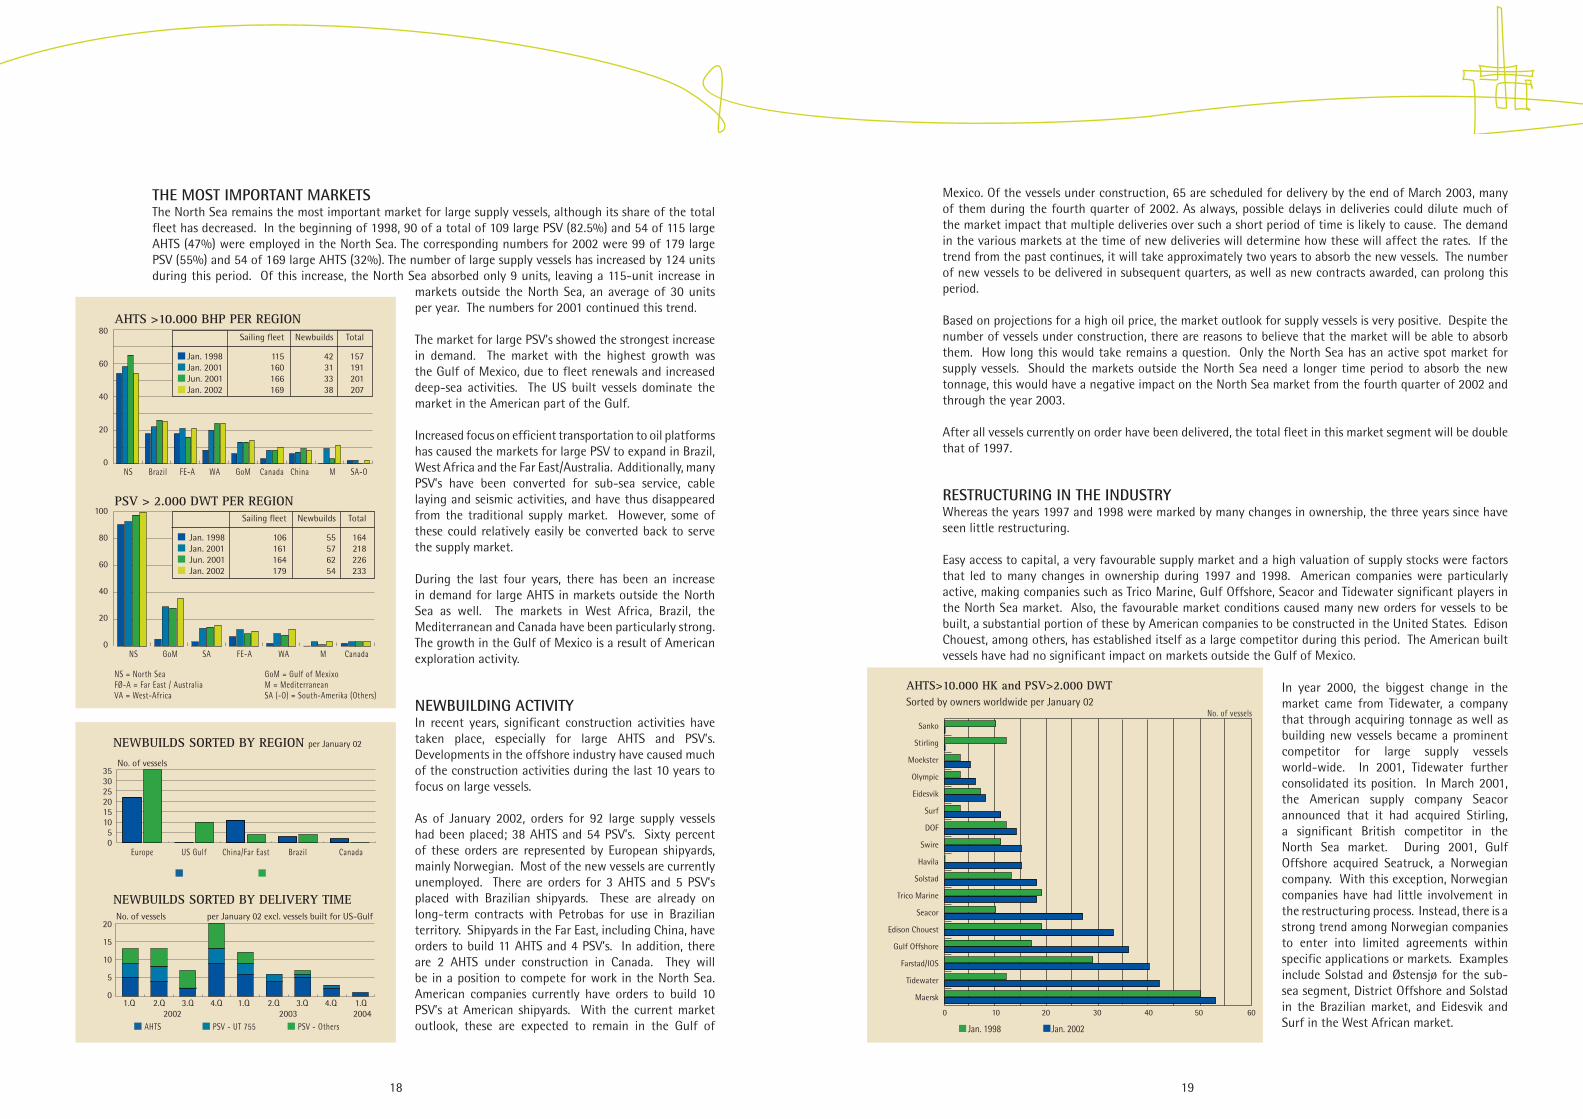
AHTS>10.000 HK and PSV>2.000 DWT Sorted by owners worldwide per January 02
Sanko
Stirling
Moekster
Olympic
Eidesvik
Surf
DOF
Swire
Havila
Solstad
Trico Marine
Seacor
Edison Chouest
Gulf Offshore
Farstad/IOS
Tidewater
Maersk
No. of vessels
1.Q 2.Q 3.Q 4.Q 1.Q 2.Q 3.Q 4.Q 1.Q
NEWBUILDS SORTED BY DELIVERY TIME
AHTS PSV - UT 755 PSV - Others
No. of vessels per January 02 excl. vessels built for US-Gulf
NEWBUILDS SORTED BY REGION per January 02
No. of vessels
Europe US Gulf Brazil Canada
AHTS >10.000 BHP PER REGION
PSV > 2.000 DWT PER REGION
Sailing fleet Newbuilds Total
Jan. 1998 115 42 157 Jan. 2001 160 31 191 Jun. 2001 166 33 201 Jan. 2002 169 38 207
Sailing fleet Newbuilds Total
Jan. 1998 106 55 164 Jan. 2001 161 57 218 Jun. 2001 164 62 226 Jan. 2002 179 54 233
NS Brazil FE-A WA GoM Canada China M SA-O
NS GoM SA FE-A WA M Canada
NS = North SeaFØ-A = Far East / AustraliaVA = West-Africa
GoM = Gulf of MexixoM = MediterraneanSA (-O) = South-Amerika (Others)
THE MOST IMPORTANT MARKETSThe North Sea remains the most important market for large supply vessels, although its share of the total fleet has decreased. In the beginning of 1998, 90 of a total of 109 large PSV (82.5%) and 54 of 115 large AHTS (47%) were employed in the North Sea. The corresponding numbers for 2002 were 99 of 179 large PSV (55%) and 54 of 169 large AHTS (32%). The number of large supply vessels has increased by 124 units during this period. Of this increase, the North Sea absorbed only 9 units, leaving a 115-unit increase in
markets outside the North Sea, an average of 30 units per year. The numbers for 2001 continued this trend.
The market for large PSV’s showed the strongest increase in demand. The market with the highest growth was the Gulf of Mexico, due to fleet renewals and increased deep-sea activities. The US built vessels dominate the market in the American part of the Gulf.
Increased focus on efficient transportation to oil platforms has caused the markets for large PSV to expand in Brazil, West Africa and the Far East/Australia. Additionally, many PSV’s have been converted for sub-sea service, cable laying and seismic activities, and have thus disappeared from the traditional supply market. However, some of these could relatively easily be converted back to serve the supply market.
During the last four years, there has been an increase in demand for large AHTS in markets outside the North Sea as well. The markets in West Africa, Brazil, the Mediterranean and Canada have been particularly strong. The growth in the Gulf of Mexico is a result of American exploration activity.
NEWBUILDING ACTIVITYIn recent years, significant construction activities have taken place, especially for large AHTS and PSV’s. Developments in the offshore industry have caused much of the construction activities during the last 10 years to focus on large vessels.
As of January 2002, orders for 92 large supply vessels had been placed; 38 AHTS and 54 PSV’s. Sixty percent of these orders are represented by European shipyards, mainly Norwegian. Most of the new vessels are currently unemployed. There are orders for 3 AHTS and 5 PSV’s placed with Brazilian shipyards. These are already on long-term contracts with Petrobas for use in Brazilian territory. Shipyards in the Far East, including China, have orders to build 11 AHTS and 4 PSV’s. In addition, there are 2 AHTS under construction in Canada. They will be in a position to compete for work in the North Sea. American companies currently have orders to build 10 PSV’s at American shipyards. With the current market outlook, these are expected to remain in the Gulf of
Mexico. Of the vessels under construction, 65 are scheduled for delivery by the end of March 2003, many of them during the fourth quarter of 2002. As always, possible delays in deliveries could dilute much of the market impact that multiple deliveries over such a short period of time is likely to cause. The demand in the various markets at the time of new deliveries will determine how these will affect the rates. If the trend from the past continues, it will take approximately two years to absorb the new vessels. The number of new vessels to be delivered in subsequent quarters, as well as new contracts awarded, can prolong this period.
Based on projections for a high oil price, the market outlook for supply vessels is very positive. Despite the number of vessels under construction, there are reasons to believe that the market will be able to absorb them. How long this would take remains a question. Only the North Sea has an active spot market for supply vessels. Should the markets outside the North Sea need a longer time period to absorb the new tonnage, this would have a negative impact on the North Sea market from the fourth quarter of 2002 and through the year 2003.
After all vessels currently on order have been delivered, the total fleet in this market segment will be double that of 1997.
RESTRUCTURING IN THE INDUSTRYWhereas the years 1997 and 1998 were marked by many changes in ownership, the three years since have seen little restructuring.
Easy access to capital, a very favourable supply market and a high valuation of supply stocks were factors that led to many changes in ownership during 1997 and 1998. American companies were particularly active, making companies such as Trico Marine, Gulf Offshore, Seacor and Tidewater significant players in the North Sea market. Also, the favourable market conditions caused many new orders for vessels to be built, a substantial portion of these by American companies to be constructed in the United States. Edison Chouest, among others, has established itself as a large competitor during this period. The American built vessels have had no significant impact on markets outside the Gulf of Mexico.
In year 2000, the biggest change in the market came from Tidewater, a company that through acquiring tonnage as well as building new vessels became a prominent competitor for large supply vessels world-wide. In 2001, Tidewater further consolidated its position. In March 2001, the American supply company Seacor announced that it had acquired Stirling, a significant British competitor in the North Sea market. During 2001, Gulf Offshore acquired Seatruck, a Norwegian company. With this exception, Norwegian companies have had little involvement in the restructuring process. Instead, there is a strong trend among Norwegian companies to enter into limited agreements within specific applications or markets. Examples include Solstad and Østensjø for the sub-sea segment, District Offshore and Solstad in the Brazilian market, and Eidesvik and Surf in the West African market.
China/Far East

20 21
1994 1995 1996 1997 1998 1999 2000 2001 E-2002
200
150
100
50
0
200
150
100
50
0 1994 1995 1996 1997 1998 1999 2000 2001 E-2002
300
250
200
150
100
50
0 92 93 94 95 96 97 98 99 00 01 E-02
100
80
60
40
20
0
%
0 5 10 15 20 25 30
0 5 10 15 20
Jan. 2001 Jan. 2002
Jan. 2001 Jan. 2002
CoastguardMaersk O+G
TeamBP Amoco
PhillipsSeaforth
Norsk HydroShellAsco
Statoil
EidesvikTFDS OffshoreMaersk Supply
District OffshoreSolstad RederiHavila Supply
SeacorTrico Supply
Gulf OffshoreFarstad Shipping
TERM DEMAND SORTED BY SECTOR
UK sectorNorwegian sector North Sea others
Boat-years
Production Construction Drilling Other Spot
TERM DEMAND SORTED BY ACTIVITY
TERM DEMAND SORTED BY OWNERS
Boat-years
TERM DEMAND SORTED BY OPERATOR
Boat-years
Boat-years
Boat-years
Supply Demand Utilisation
DEVELOPMENT IN DEMAND FOROFFSHORE SERVICE VESSELS
THE MARKET BALANCEThe average utilisation of the available fleet indicates the market balance. If the utilisation is above 90%, rates will be significantly impacted, although the top rates are achieved at 95% or higher.
The North Sea Market outlook for 2001 was positive. At the beginning of the year, utilisation rates were projected at around 91%. The actual average for the year came in at 94%, vs. 90% in the previous year. The utilisation was at or above 95% for all months during the second and third quarter in 2001. Only January came in below 90%. As a result, all supply vessels experienced excellent rates throughout the year.
For the fourth quarter, the utilisation degree was projected at 84%, but instead it came in at 93%, thus contributing to making 2001 an excellent year overall. In this quarter, the positive market was caused by a combination of high activity and the shift of vessels from the North Sea to other markets. The actual utilisation degree by quarter was: Q1 - 90% (82% in year 2000), Q2 - 97.5% (92%), Q3 - 95.5 (94%), and Q4 - 93% (92).
The demand side in the North Sea market has remained relatively stable in recent years. The supply side has therefore played a pivotal role in creating the market conditions. An extensive expansion program has contributed to a considerable increase in the size of the fleet, but the potential impact of this build-up has been partially offset by the strength of other markets world wide. During 2001, the number of supply vessels increased by 27 units to 348 units worldwide. During the same period, the North Sea market increased by only 3, to 153 units.
For 2002, the average utilisation percentage is projected to be 92%, assuming that all vessels under construction (except those built in the U.S. and Brazil) are being added to the North Sea fleet. However, projections for demand in other markets indicate that the trend of net decrease in the North Sea fleet is going to continue in 2002 as well. The second and third quarter in particular are expected to yield a positive spot market in the North Sea.
THE NORTH SEA MARKET
DEMAND FOR SUPPLY VESSELSFollowing a relatively weak first quarter, demand really picked up in the second quarter, and stayed strong during the remainder of the year. On average, the demand in the North Sea increased by six boat-years in 2001, but remained eight boat-years lower than the record-breaking year 1998.
Average demand for supply vessels is projected to increase in 2002. A demand for 199 boat-years would be the best market since 1993.
MARKET FOR SHORT-TERM CONTRACTSAfter declining by 16 boat-years for 1999 and 2000 combined (or 10%), the market for short-term contracts came back in 2001 to a level comparable to 1998. The growth has been particularly strong in the British sector. For 2002, the market is projected to remain flat.
Farstad Shipping is the largest supplier of short-term contracts in the North Sea market, with the number of contracts increasing in 2001. Despite this, the largest competitor, Gulf Offshore, almost closed the gap in 2001. On the demand side, Statoil is the operator with the most vessels contracted on a short-term basis, with ASCO in second place. Currently, Farstad has no short-term contracts with Statoil, but ended last year with six contracts with ASCO. With only one contract less, Norsk Hydro is Farstad Shipping’s second largest client.
Periods of favourable market conditions typically cause a shift towards short-term contracts. While this market represented 81% of total demand in both 1997 and 1998, it fell to 76.8% in 1999, and to 76% in year 2000. It rose again during 2001 and ended at 82%. For 2002, it is expected to remain stable. Projections for the delivery of new tonnage are the major driver in the market for short-term contracts as well as for the spot market.
SUPPORTING OIL-PRODUCING FIELDS AND STANDBY DUTIESFields in the production phase represent the largest component of the short-term market. In 2001, the demand totalled 115 boat-years, 6 boat-years higher than in the previous year. All production related activities represented 72% of short-term demand in 2001. For 2002, this number is projected to remain stable. Comparable numbers for previous years are 77% in 2000, 78% in 1999, and 73% in 1998. In 1991/1992, this number was as low as 50%.
Far Supplier - Photo: Jan Fredrik Midtflå

22 23
0 5 10 15 20 25
Jan. 2002Jan. 1996
VESSELS IN THE NORTH SEA SORTED BY OWNERS
OIL
Stirling
Smith Loyd
Viking
Olympic
Toisa
TFDS
Oestensjoe
Moekster
Eidesvik
Broevig
DOF
Tidewater
Solstad
Havila/Saevik
Maersk
Trico Marine
Seacor
Farstad/IOS
Gulf
No. of vessels
In spite of the Brazilian currency (Real) fluctuation, the domestic power supply shortage during the second half of the year and the close Argentinean crisis, the Brazilian economy performed reasonably well during 2001. The year closed with a trade balance surplus of USD 1.2 billion, the first in years, setting the pace for a sustainable growth in the surplus for the coming years. Inflation (consumer price index) closed the year at 7.7% against a governmental inflation target of 6%. The country’s economic outlook for 2002 is generally good. The economy is expected to grow between 2.5% and 3%. Governmental inflation target for 2002 is set for 3.5% .
In June 2001 the Brazilian Petroleum Board (ANP) promoted its third round of licensing for E&P blocks in Brazil. The round attracted newcomers, such as Phillips, Wintershall, Maersk and Ocean Energy. Petrobras was once more the dominant winner with 13 blocks awarded out of the 53 offered.
In August, the three-year exploration period set by the Law 9478/97 for the first partnership contracts awarded to Petrobras and other international operators expired. As a result, 57 exploration areas were relinquished back to ANP and, under the contract terms, as amended in 1999, 28 blocks with oil and/or gas discoveries made were granted an extension of additional two years in the exploration phase. Of these, three important discoveries in offshore blocks were confirmed; BC-2 (Campos Basin; operator Total, Fina and Elf), BS-4 (Santos Basin; operator Shell) and BCAM-40 (Camamú Basin; operator Petrobras).
Petrobras is still the largest oil and natural gas producer in Brazil, and closed 2001 with a record crude production peaking at 1,568,000 bopd, of which 1,274,000 bopd from the Campos Basin.
At Campos Basin, the coming into production of platforms P-40 and P-38 contributed significantly to offset the production loss resulted from the P-36 accident. The exceptional performance of P-40 subsea wells, like the record breaker MLS-42 (1,212 meters water depth) which is producing about 40,000 bopd, has to be mentioned as an important event.
Other operators like Enterprise Oil and Chevron-Texaco have also started the development of oilfields in the Campos Basin where first production from a non-PETROBRAS operated field, Enterprise’s Bijupirá and Salema, is expected to begin in mid 2003.
RESULT PER SECTOR Norwegian sector British sector
2001 2000 2001 2000
Freight income 315.397 309.292 413.936 199.455
Operation- and administration cost 157.641 133.109 146.775 106.664
Operating result before depreciation (EDBIT) 157.756 176.183 267.161 92.791
Depreciation 56.323 57.831 56.135 30.791
Operating result vessels (EBIT) 101.433 118.352 211.026 62.000
EDBIT % 50,0% 57,0% 64,5% 46,5%
EBIT % 32,2% 38,3% 51,0% 31,1%
Supplying fields in production mostly consists of containerised deck cargo. A modern supply vessel can transport many other products as well; Methanol, mixed drill fluids, brine, water and oil. In addition, there is dry bulk such as cement, barite and bentonite.
Large AHTS are used for standby services in production fields because they, in addition to their tow and anchor handling capabilities, are equipped to fight fires, perform rescue services and anti-pollution duties.
DEVELOPMENT ACTIVITIES AND OTHER ACTIVITIESThe demand for service associated with field development activities, such as new fields and infrastructure, pipelines, pumping stations and loading buoys, only made up 12 boat-years in 2001. In addition, 12 supply vessels have been involved with sub-sea, cable laying activities and rescue/coast guard duties. The record year for this segment was in 1998, when 26 boat-years were contracted for in development related activities. For 2002, no increases are projected.
EXPLORATION ACTIVITIESAs a result of significant improvement in productivity and logistics, the number of offshore service vessels contracted to support exploration activities has decreased in recent years. This trend was amplified in 1999, due to cost cutting activities by oil companies, which resulted in a reduction of rig activities. Sometime during 2000, this trend turned around. In 1992, the demand for supply vessels for this type of activity was 61 boat-years. In 1999 and 2000, the demand totalled 10 and 13 boat-years, respectively. In 2001, demand increased to 20 boat-years and is projected to remain at this level in 2002.
SPOT MARKETHistorically, the spot market has represented 20-25% of total demand. During boom years, such as 1997 and 1998, this share fell to under 20%. This happened again in 2001. The tightening in the spot market is a result of favourable market projections that causes the oil companies to attempt to secure supply by signing up for more vessels on short-term contracts, leaving fewer vessels available in the spot market. For 2002, the spot market’s share of the total is projected to be 20%. A substantial portion of the spot activity comes from Aberdeen and on British sector, and is directed towards all the activities described above.
THE MARKET IN BRASIL
Far Santana participate at the towing of “PETROBRAS P-40” outside Rio de Janeiro
24 25
0 2 4 6 8 10 12
0 10 20 30 40
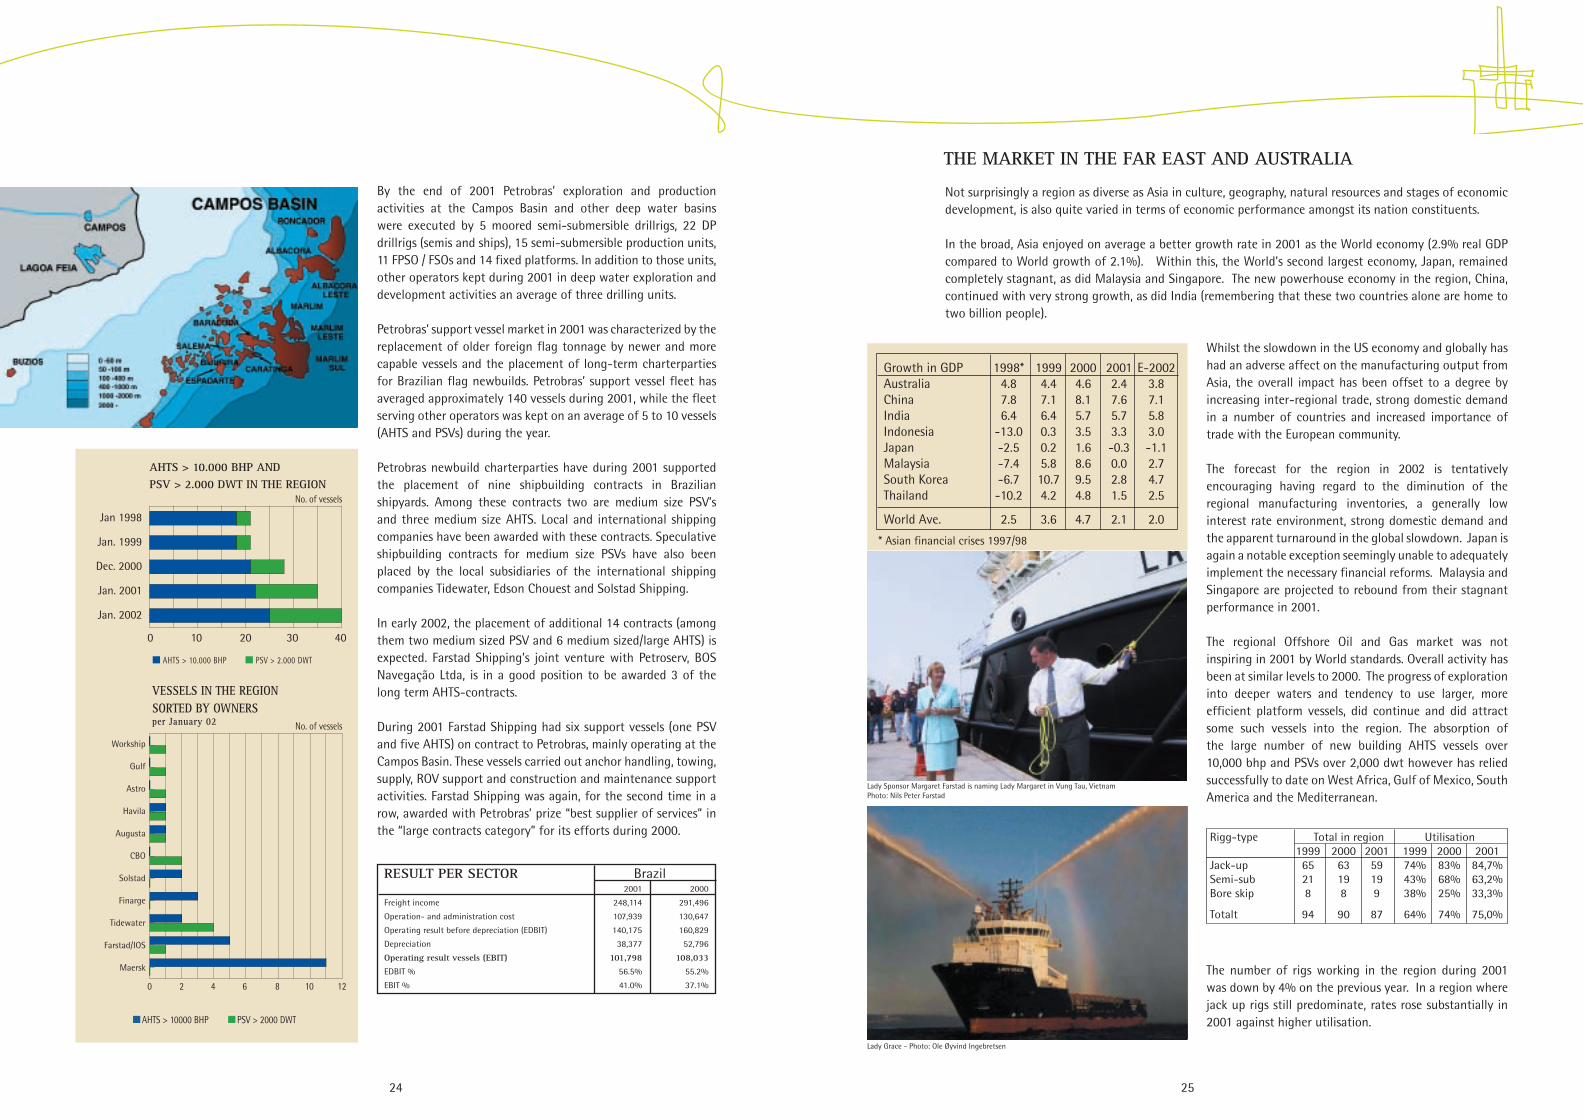
Not surprisingly a region as diverse as Asia in culture, geography, natural resources and stages of economic development, is also quite varied in terms of economic performance amongst its nation constituents.
In the broad, Asia enjoyed on average a better growth rate in 2001 as the World economy (2.9% real GDP compared to World growth of 2.1%). Within this, the World’s second largest economy, Japan, remained completely stagnant, as did Malaysia and Singapore. The new powerhouse economy in the region, China, continued with very strong growth, as did India (remembering that these two countries alone are home to two billion people).
Whilst the slowdown in the US economy and globally has had an adverse affect on the manufacturing output from Asia, the overall impact has been offset to a degree by increasing inter-regional trade, strong domestic demand in a number of countries and increased importance of trade with the European community.
The forecast for the region in 2002 is tentatively encouraging having regard to the diminution of the regional manufacturing inventories, a generally low interest rate environment, strong domestic demand and the apparent turnaround in the global slowdown. Japan is again a notable exception seemingly unable to adequately implement the necessary financial reforms. Malaysia and Singapore are projected to rebound from their stagnant performance in 2001.
The regional Offshore Oil and Gas market was not inspiring in 2001 by World standards. Overall activity has been at similar levels to 2000. The progress of exploration into deeper waters and tendency to use larger, more efficient platform vessels, did continue and did attract some such vessels into the region. The absorption of the large number of new building AHTS vessels over 10,000 bhp and PSVs over 2,000 dwt however has relied successfully to date on West Africa, Gulf of Mexico, South America and the Mediterranean.
The number of rigs working in the region during 2001 was down by 4% on the previous year. In a region where jack up rigs still predominate, rates rose substantially in 2001 against higher utilisation.
Rigg-type Total in region Utilisation 1999 2000 2001 1999 2000 2001Jack-up 65 63 59 74% 83% 84,7%Semi-sub 21 19 19 43% 68% 63,2%Bore skip 8 8 9 38% 25% 33,3%
Totalt 94 90 87 64% 74% 75,0%
* Asian financial crises 1997/98
Growth in GDP 1998* 1999 2000 2001 E-2002Australia 4.8 4.4 4.6 2.4 3.8China 7.8 7.1 8.1 7.6 7.1India 6.4 6.4 5.7 5.7 5.8Indonesia -13.0 0.3 3.5 3.3 3.0Japan -2.5 0.2 1.6 -0.3 -1.1Malaysia -7.4 5.8 8.6 0.0 2.7South Korea -6.7 10.7 9.5 2.8 4.7Thailand -10.2 4.2 4.8 1.5 2.5
World Ave. 2.5 3.6 4.7 2.1 2.0
RESULT PER SECTOR Brazil 2001 2000
Freight income 248,114 291,496
Operation- and administration cost 107,939 130,647
Operating result before depreciation (EDBIT) 140,175 160,829
Depreciation 38,377 52,796
Operating result vessels (EBIT) 101,798 108,033
EDBIT % 56.5% 55.2%
EBIT % 41.0% 37.1%
By the end of 2001 Petrobras’ exploration and production activities at the Campos Basin and other deep water basins were executed by 5 moored semi-submersible drillrigs, 22 DP drillrigs (semis and ships), 15 semi-submersible production units, 11 FPSO / FSOs and 14 fixed platforms. In addition to those units, other operators kept during 2001 in deep water exploration and development activities an average of three drilling units.
Petrobras’ support vessel market in 2001 was characterized by the replacement of older foreign flag tonnage by newer and more capable vessels and the placement of long-term charterparties for Brazilian flag newbuilds. Petrobras’ support vessel fleet has averaged approximately 140 vessels during 2001, while the fleet serving other operators was kept on an average of 5 to 10 vessels (AHTS and PSVs) during the year.
Petrobras newbuild charterparties have during 2001 supported the placement of nine shipbuilding contracts in Brazilian shipyards. Among these contracts two are medium size PSV’s and three medium size AHTS. Local and international shipping companies have been awarded with these contracts. Speculative shipbuilding contracts for medium size PSVs have also been placed by the local subsidiaries of the international shipping companies Tidewater, Edson Chouest and Solstad Shipping.
In early 2002, the placement of additional 14 contracts (among them two medium sized PSV and 6 medium sized/large AHTS) is expected. Farstad Shipping’s joint venture with Petroserv, BOS Navegação Ltda, is in a good position to be awarded 3 of the long term AHTS-contracts.
During 2001 Farstad Shipping had six support vessels (one PSV and five AHTS) on contract to Petrobras, mainly operating at the Campos Basin. These vessels carried out anchor handling, towing, supply, ROV support and construction and maintenance support activities. Farstad Shipping was again, for the second time in a row, awarded with Petrobras’ prize “best supplier of services” in the “large contracts category” for its efforts during 2000.
PSV > 2000 DWT AHTS > 10000 BHP
VESSELS IN THE REGION SORTED BY OWNERS per January 02
AHTS > 10.000 BHP AND PSV > 2.000 DWT IN THE REGION
AHTS > 10.000 BHP PSV > 2.000 DWT
No. of vessels
No. of vessels
Workship
Gulf
Astro
Havila
Augusta
CBO
Solstad
Finarge
Tidewater
Farstad/IOS
Maersk
Jan 1998
Jan. 1999
Dec. 2000
Jan. 2001
Jan. 2002
THE MARKET IN THE FAR EAST AND AUSTRALIA
Lady Sponsor Margaret Farstad is naming Lady Margaret in Vung Tau, Vietnam Photo: Nils Peter Farstad
Lady Grace - Photo: Ole Øyvind Ingebretsen

26 27
0 2 4 6 8 10 12
0 10 20 30 40
0 3 6 9 12 15
0 10 20 30 40 50
0 10 20 30 40
0 3 6 9 12 15
Vessel owners enjoyed good trading due, to the fine balance between supply and demand. Vessel utilisation, whilst hard to provide an exact figure, was estimated to be around 93% for the over 8,000 bhp AHTS vessels and close to 100% on the PSV’s. Whilst the outlook for 2002 gives owners confidence in being able to maintain high utilisation and satisfactory rate levels, the region continues to be characterised by multiple well programs. The sprinkling of these programs throughout the region and their timing is such as to maintain a sensitivity in the market to the balance between supply and demand. In essence, the market remains a sound one for owners, providing the migration of vessels from the North Sea and US Gulf is against an incremental expansion in the market and this will only be incremental in 2002.
Both IOS and other shipowners will within shortly bring other vessels into the region to meet the gradual increase in demand. Tidewater will bring another PSV to the region for term work. Similarly, BOA has recently moved their two Chinese new build AHTS vessels back from the North Sea against a specific drilling program in Malaysia and Farstad will also move a vessel in for the BP Vietnam Lan Tay field development.
IOS will introduce two more PSV’s early in 2002 One of the vessels is the newbuild Lady Grace, UT 755, delivered from Aker Brevik in March 2002, and which will enter into a 7 year contract to Woodside, working out of Dampier, Australia. The other PSV is Far Scotsman, which has achieved a two year time charter with Phillips in Australia commencing April 2002. The PSV is in turn being bareboat chartered from Farstad Shipping ASA for a minimum of two years. In August IOS took delivery of the 3 Woodside vessels, Lady Margaret, Lady Gerda and Lady Christine. The last one is a PSV which at the delivery entered into a 7 year contract to Woodside. At the end of October, Lady Guro, a UT 719-2 design multipurpose vessel, was delivered from the the Korean shipyard INP Heavy Industries Co Ltd and entered into a long-term contract with Shell Phillippines. Of the company’s vessels in the region for the time being 3 AHTS and 3 PSV are in Australia, 1 AHTS in Malaysia, 2 AHTS in Vietnam and 2 AHTS Philippines. Lady Audrey was fixed for 2 wells + 2x1 well options to Shell Namibia from early January 2002. The vessel had been working for Shell in the Philippines up till december when she mobilized for Namibia.
In November IOS has contracted two anchor handling support vessels at the Simek AS yard in Norway. Delivery of the vessels will take place in March and July 2003. The vessels are a new type of UT 712 of 12,240 bhp with DP and a double drum 370 tonne winch for employment in international markets.
PSV > 2000 DWT AHTS > 10000 BHP
Algosaibi
Seaworks
Rovde
Gulf
Tidewater
BOA
Workship
Swire
Maersk
Seacor
Farstad/IOS
Chinese
VESSELS IN THE REGIONSORTED BY OWNERS per January 02
AHTS > 10.000 BHP ANDPSV > 2.000 DWT IN THE REGION
Jan 1998
Jan. 1999
Dec. 2000
Jan. 2001
Jan. 2002
AHTS > 10.000 BHP PSV > 2.000 DWT
No. of vessels
No. of vessels
AHTS > 10.000 BHP AND PSV > 2.000 DWT
Jan 1998
Jan. 1999
Dec. 2000
Jan. 2001
Jan. 2002
No. of vessels
IN THE GULF OF MEXICO
Jan 1998
Jan. 1999
Dec. 2000
Jan. 2001
Jan. 2002
IN WEST-AFRICA Jan 1998
Jan. 1999
Dec. 2000
Jan. 2001
Jan. 2002
AHTS > 10.000 BHP PSV > 2.000 DWT
IN THE MEDITERRANEAN
Jan 1998
Jan. 1999
Dec. 2000
Jan. 2001
Jan. 2002
IN CANADA
No. of vessels No. of vessels
No. of vessels
OTHER MARKETS
RESULT PER SECTOR Far East/Australia 2001 2000
Freight income 151.229 134.127
Operation- and administration cost 84.922 78.151
Operation profit before depreciation (EDBIT) 66.922 55.976
Depreciation 30.475 29.123
Operating result vessels (EBIT) 35.832 26.853
EDBIT % 44,3% 41,7%
EBIT % 23,7% 29,0%
This is a short presentation of emerging markets that have an increasing need for large units. A positive development in these markets could play a role in the North Sea market conditions as well. There are large expectations to activities in West Africa in particular. Today, IOS has one vessel, Lady Audrey employed on a contract in Namibia. Demand for tonnage has also increased significantly in the Mediterranean. Currently, the Far Grimshader, a platform supply vessel, is transporting pipes in the Black Sea as part of a project to lay a 2 x 380 km. long pipeline, and the Far Sovereign has been employed for 3 months in the US Gulf.
Lady Audrey in Namibia - Photo: Karl Johan Bakken
28 29
The Company’s HSE-philosophy was formulated in this declaration in 1993:“The focus on Health and Safety for our employees, offshore and onshore, and the concern for the Environment is given the highest priority in the daily operation of our vessels. The operations are based on the company policy which was established in 1993 and is distributed to all employees:"Farstad Shipping has undertaken to offer and maintain a safe working environment. The Company expects that all individuals will contribute to enhance safety, regardless of their position, rank offshore or onshore. Every individual should have an understanding of responsibility towards themselves, their family, their colleagues and the company in all matters concerning health and safety.
Each individual's attitude and actions, as others see and observe them, will be setting standards, and this can serve the purpose to encourage others to perform their job in a way that can contribute to the achievement of an accident free, healthy and environmentally friendly work place.We have common responsibility for protecting and improving the environment, onshore and offshore, and accordingly, we should use all means to work towards reducing any risk of damaging the environment by waste, pollutants or unnecessary use of nonenvironmentally friendly substances.Farstad Shipping invites each employees suggestions towards promoting health, safety and environmental issues, and the Company will offer the necessary resources to reach the goals set forth in this policy."
HSE-PHILOSOPHY
DEVELOPMENT IN HSE AT FARSTAD SHIPPINGThe Company has, trough its focus on helth, safety and environment been among the leading actors in our business for many years. The Implementation of our efforts can be summarised like this: 1988: Farstad Shipping began to systematically record all unwanted events.1990: All vessels began to systematically record and report non-conformance incidents (NCR).1993: A comprehensive HSE policy was developed and the Company has since complied with this policy.1994: The Company was ISO 9002 certified.1997: The offices and two vessels were ISM D.O.C. approved (Document of Compliance).2000: The North Sea and the Australian fleet were ISM certified.2001: The Brazilian fleet was ISM certified, with the exception of three vessels.
Today, Farstad Shipping employs a complete quality assurance system that focuses on the operational procedures and programs for the development of all human resources. The quality assurance standards are maintained at the same elevated level for all operations throughout the Company. In order to maintain and continue to raise this standard, an active focus and participation is needed from all parts of the organization. The Company’s HSE philosophy is based upon international laws, regulations and standard practices.
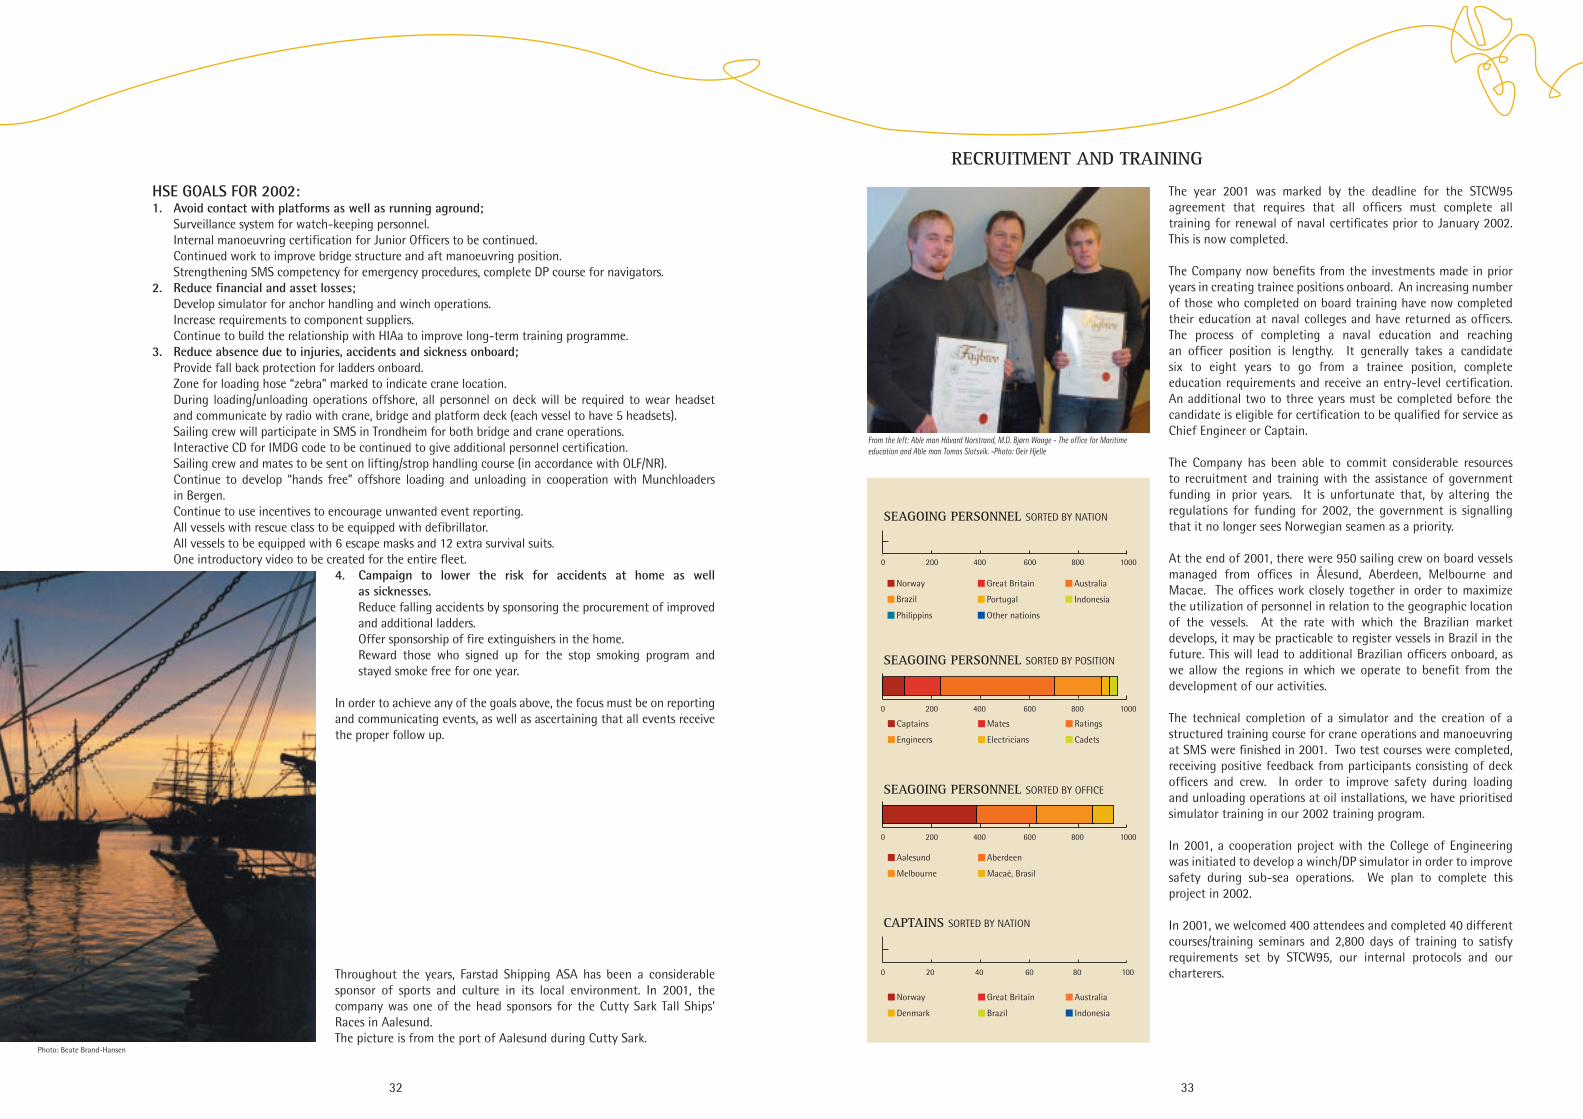
REACHING THE HSE GOALS FOR 2001• Lost time incidents (LTI): The goal for 2001 was zero LTI. The end result was two LTI on vessels managed from Ålesund, and three lost LTI on vessels managed from Aberdeen. Of these, two were injuries on duty, while the remaining three were injuries related to off duty activities.• Incidents of contact: We did not reach our goal of zero incidents of contact between vessel and platform. We had one serious incident, which impacted the hull on our vessel, and one light contact incident.• Personal equipment such as helmets with integrated eye protection and safety vests is now implemented.• There are now conference meetings held in Norway, the UK and in Brazil for all officers. • The creation of an internal “ship manoeuvring certificate” for junior officers has been established. • The creation of an internal “ship manoeuvring certificate” for junior officers has been established. • FUMAR and SIKT have been integrated into the Company’s education systems as sub-projects. • Preliminary research has started in Brazil to investigate training for STCW 95 certification. • All watch-keeping crew in the Company have been STCW 95 certified.• Courses have been completed for the use and maintenance of Anchorhandling winches on board. • Interactive courses for the IMDG code has been completed for 30 sailing crew, and is expected to be continued in year 2002. • A form to perform risk analysis has been implemented for use on board all vessels• There are 3 vessels remaining to be ISM certified in Brazil, and 2 vessels under construction. • The company has agreed a contracted to update and maintain all maps and publications on board all vessels from Norway, with a simular service being provides to all vessels in the UK• All vessels are now equipped with oxygen equipment, or “resusipacks”.• Campaign literature such as “16 steps towards a healthier life” is distributed. • 39 employees have signed the stop smoking program. • All vessels now have lotion available by all exits to deck to fight salt and other discharges from installations. Everyone is pleased with the results from the various actions that were taken.
HEALTH, SAFETY AND ENVIRONMENT
Testing oil recovery equipment on Far Grip - Photo: Jan Fredrik Midtflå
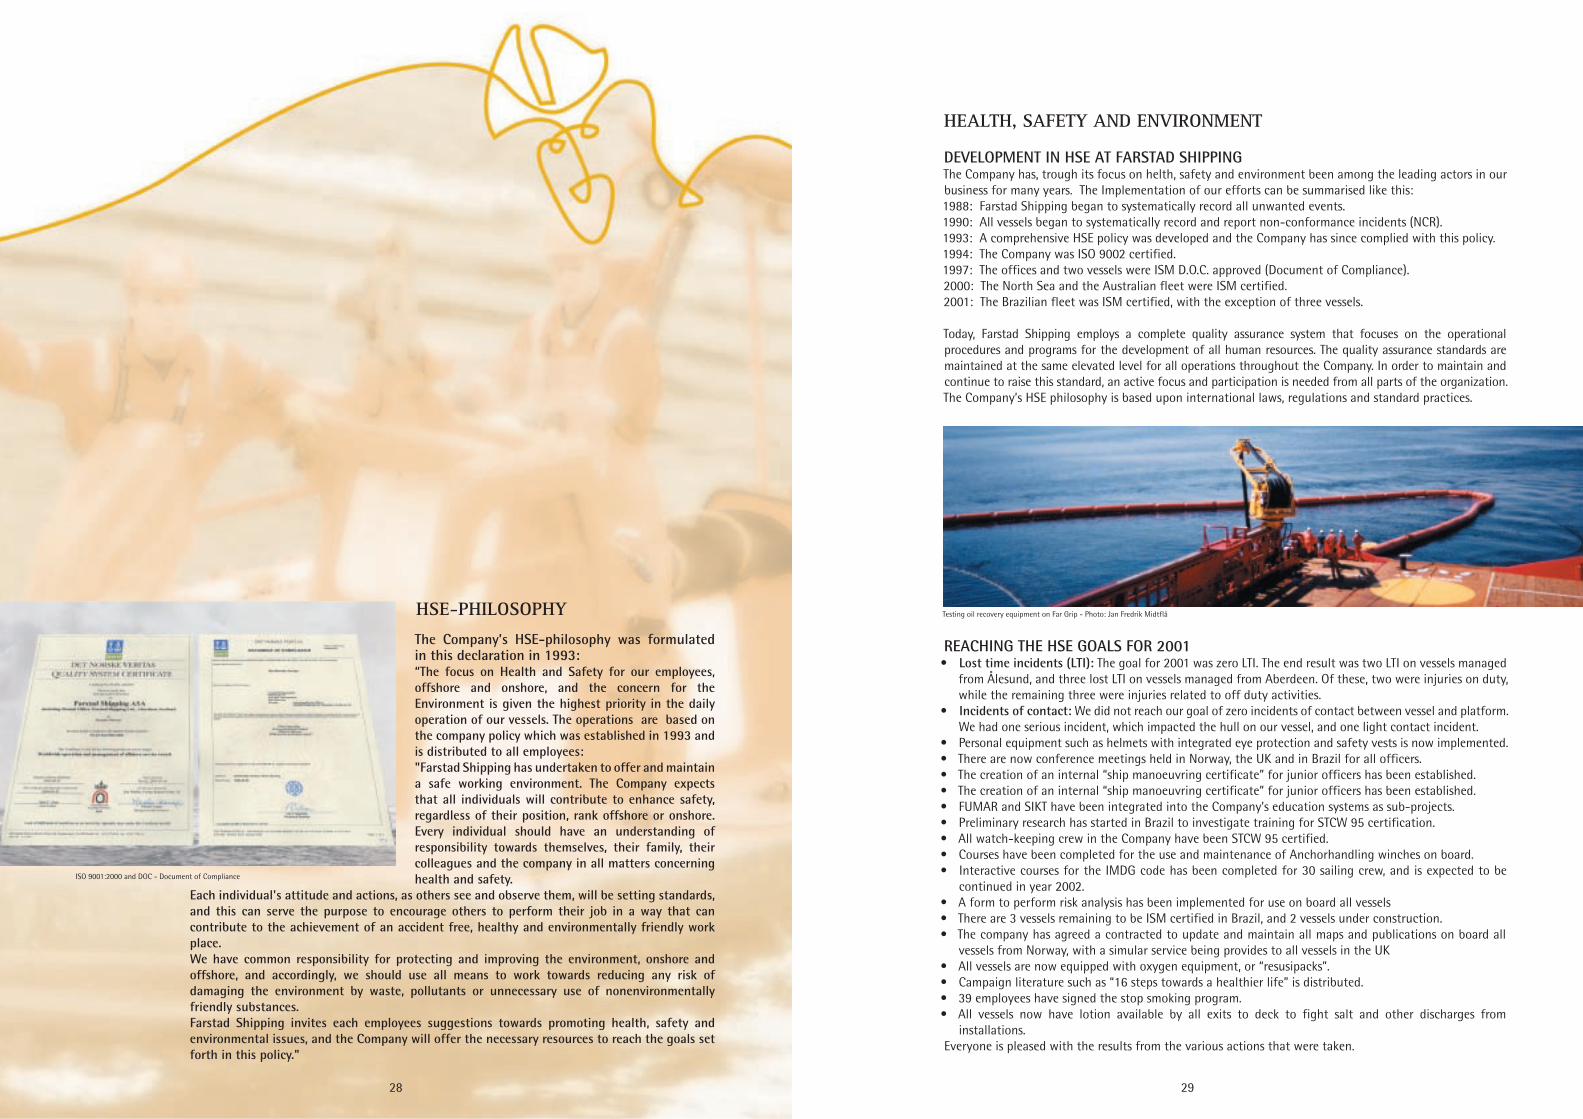
ISO 9001:2000 and DOC - Document of Compliance

30 31
88 89 90 91 92 93 94 95 96 97 98 99 00 01
15
12
9
6
3
0 90 91 92 93 94 95 96 97 98 99 00 01
1200
1000
800
600
400
200
0
UNWANTED EVENTS AND NON-CONFORMANCE REPORTS (NCR)For the fleet managed from Ålesund and Aberdeen there were 58 NCR in 2001 vs. 73 NCR in 2000. NCR reports deviances as a result of disruptions in operations and/or internal audits and inspections in accordance with the Company’s quality assurance system.
There were a total of 1054 unwanted events in 2001 compared to 1004 in 2000 (317 in 1999). The explosive increase from 1999 to 2000 is caused by incentives given to encourage correct reporting. A modest increase in 2001 should be considered an excellent result. Personal injuries gave an LTI number of 1.8 in 2001 compared to 2.4 in year 2000 and 1999 (see exhibit). The percentage of sick time for 660 sailing crew (Norway, UK and Brazil) was 1.85% in 2001, down from 2.82% in 2000.
ACTIONS TO IMPROVE HSEFarstad Shipping has taken initiative to and participate in several HSE related projects. Several of these projects has been possible due to the maritime environment in the North-western Norway. Based on our HSE policy, many activities have taken place to provide the development of new equipment to improve the working conditions and to strengthen the training of our crew.
For 2001 we will highlight the following actions:Installaton of garbage disposal units on all vessels in Norway.
Monitoring equipment for watch-keeping personnel.Should something happen to the watch-keeper; the system will sound after a pre-defined period of time. The alarm will sound on the bridge, in the Captains cabin, Mate’s cabin and recreational rooms. Integrated training infrastructure for Farstad Shipping.
The training program is developed in cooperation with the College of Engineering in Ålesund (HIA), Marintek, NTNU and Norsk Sjøoffisersforbund (Norwegian Association of Naval Officers). The goal is to increase the competency for personnel on offshore vessels by applying modern technology in a structured program.Utviklet rederistandard for utforming av bropult.
Emergency manoeuvring: Worked out simplyfied procedure by change-over from standard to emergency situation, and also integrating other functions.
Clean Ship, “Clean” is a Class Notation by DNV, founded on environmental motivated efforts related to pollution’s from ships towards the marine and the air environment. It define standards and requirements to the installed equipment and systems management related to handling of any waste produced onboard. The company have during 2001 built two vessels complying to the Class Notation, and further one vessel will be converted in 2002, in order to achieve the same standard. In addition founds made available for the coming year to implement some of the said requirements onboard sailing ships.
“Comfort Class” is a Class Notation by DNV, founded in order to improve the work environment onboard, all based upon approved standards for the indoor climate, noise and vibrations. Farstad have for several of the newbulidings delivered to the company in 2001, taken extensive investments to improve the standard and life quality onboard our vessels. In 2001 we built four vessels with flexible mounted main engines, where off two vessels installed with supersilent thrusters. One vessel was delivered in 2001 with the Class Notation
“Comfort” and further one more vessel will be converted in 2002 complying to the same standard.
In earlier years the following measures have been implemented to improve HSE:
1987: Two-step generator adopted to improve fuel efficiency.1992: Installed the first VAR-generator to improve fuel efficiency.1996: Took the initiative to develop a ship bridge simulator in Trondheim for supply vessels.1996: Improved existing VAR-generator with variable frequency.1996: Developed system for self-cleaning mud-tanks.1997: Development of integrated manoeuvring chair.1998: Development of remote controlled deck mani- pulator.1999: Contributed to development and installation of simulator for dynamic positioning at the College of Engineering in Ålesund.1999: Installed integrated manoeuvring chair as the co-pilot chair for training navigators on board.1999: Railmounted deck-crane on Far Santana.2000: Hands free loading/unloading in cooperation with Munchloaders.2000: Acoustic alarm to warn of movement of tow-pins and sharkjaws.
The intention behind actions taken by the Company every year during the last 10-15 years has been to improve safety as well as the working conditions on board, and on a broader scale, keep our vessels and personnel competitive in a market that continues to demand modern vessels manned by qualified people.
BEST SUPPLIER IN 2000In 2001, the Campos Basin Contract Department (E&P - BC/GETRAT) of Petrobras awarded Farstad Shipping the award for Best Service Supplier in 2000 in the large contracts category. This is the second time the Company received this award, after first winning it in 1999. The award was given to Farstad Shipping following a selection process, which included a careful evaluation in the areas of service performance, health, safety and environment.
The DP-simulator at HIAa, and the manoeuvring bridge on Far Scotia
RUE (number of reported unwanted events)
LTI - Tall (Lost Time Incidents)(number of incidents per million of hours worked)
3332
0
0 200 400 600 800 1000
0 200 400 600 800 1000
0 200 400 600 800 1000
0 20 40 60 80 100
HSE GOALS FOR 2002: 1. Avoid contact with platforms as well as running aground; Surveillance system for watch-keeping personnel. Internal manoeuvring certification for Junior Officers to be continued. Continued work to improve bridge structure and aft manoeuvring position. Strengthening SMS competency for emergency procedures, complete DP course for navigators.2. Reduce financial and asset losses; Develop simulator for anchor handling and winch operations. Increase requirements to component suppliers. Continue to build the relationship with HIAa to improve long-term training programme.3. Reduce absence due to injuries, accidents and sickness onboard; Provide fall back protection for ladders onboard. Zone for loading hose “zebra” marked to indicate crane location. During loading/unloading operations offshore, all personnel on deck will be required to wear headset and communicate by radio with crane, bridge and platform deck (each vessel to have 5 headsets). Sailing crew will participate in SMS in Trondheim for both bridge and crane operations. Interactive CD for IMDG code to be continued to give additional personnel certification. Sailing crew and mates to be sent on lifting/strop handling course (in accordance with OLF/NR). Continue to develop “hands free” offshore loading and unloading in cooperation with Munchloaders in Bergen. Continue to use incentives to encourage unwanted event reporting. All vessels with rescue class to be equipped with defibrillator. All vessels to be equipped with 6 escape masks and 12 extra survival suits. One introductory video to be created for the entire fleet.
4. Campaign to lower the risk for accidents at home as well as sicknesses. Reduce falling accidents by sponsoring the procurement of improved and additional ladders. Offer sponsorship of fire extinguishers in the home. Reward those who signed up for the stop smoking program and stayed smoke free for one year.
In order to achieve any of the goals above, the focus must be on reporting and communicating events, as well as ascertaining that all events receive the proper follow up.
Throughout the years, Farstad Shipping ASA has been a considerable sponsor of sports and culture in its local environment. In 2001, the company was one of the head sponsors for the Cutty Sark Tall Ships’ Races in Aalesund. The picture is from the port of Aalesund during Cutty Sark.
The year 2001 was marked by the deadline for the STCW95 agreement that requires that all officers must complete all training for renewal of naval certificates prior to January 2002. This is now completed.
The Company now benefits from the investments made in prior years in creating trainee positions onboard. An increasing number of those who completed on board training have now completed their education at naval colleges and have returned as officers. The process of completing a naval education and reaching an officer position is lengthy. It generally takes a candidate six to eight years to go from a trainee position, complete education requirements and receive an entry-level certification. An additional two to three years must be completed before the candidate is eligible for certification to be qualified for service as Chief Engineer or Captain.
The Company has been able to commit considerable resources to recruitment and training with the assistance of government funding in prior years. It is unfortunate that, by altering the regulations for funding for 2002, the government is signalling that it no longer sees Norwegian seamen as a priority.
At the end of 2001, there were 950 sailing crew on board vessels managed from offices in Ålesund, Aberdeen, Melbourne and Macae. The offices work closely together in order to maximize the utilization of personnel in relation to the geographic location of the vessels. At the rate with which the Brazilian market develops, it may be practicable to register vessels in Brazil in the future. This will lead to additional Brazilian officers onboard, as we allow the regions in which we operate to benefit from the development of our activities.
The technical completion of a simulator and the creation of a structured training course for crane operations and manoeuvring at SMS were finished in 2001. Two test courses were completed, receiving positive feedback from participants consisting of deck officers and crew. In order to improve safety during loading and unloading operations at oil installations, we have prioritised simulator training in our 2002 training program.
In 2001, a cooperation project with the College of Engineering was initiated to develop a winch/DP simulator in order to improve safety during sub-sea operations. We plan to complete this project in 2002.
In 2001, we welcomed 400 attendees and completed 40 different courses/training seminars and 2,800 days of training to satisfy requirements set by STCW95, our internal protocols and our charterers.
RECRUITMENT AND TRAINING
Norway Great Britain
Portugal
Australia
Indonesia
Philippins Other natioins
SEAGOING PERSONNEL SORTED BY NATION
From the left: Able man Håvard Norstrand, M.D. Bjørn Waage - The office for Maritime education and Able man Tomas Slotsvik. -Photo: Geir Hjelle
SEAGOING PERSONNEL SORTED BY POSITION
CAPTAINS SORTED BY NATION
SEAGOING PERSONNEL SORTED BY OFFICE
Captains Mates
Engineers Electricians
Ratings
Cadets
Aalesund Aberdeen
Melbourne Macaé, Brasil
Norway Great Britain
Denmark Brazil
Australia
Indonesia
Brazil
Photo: Beate Brand-Hansen
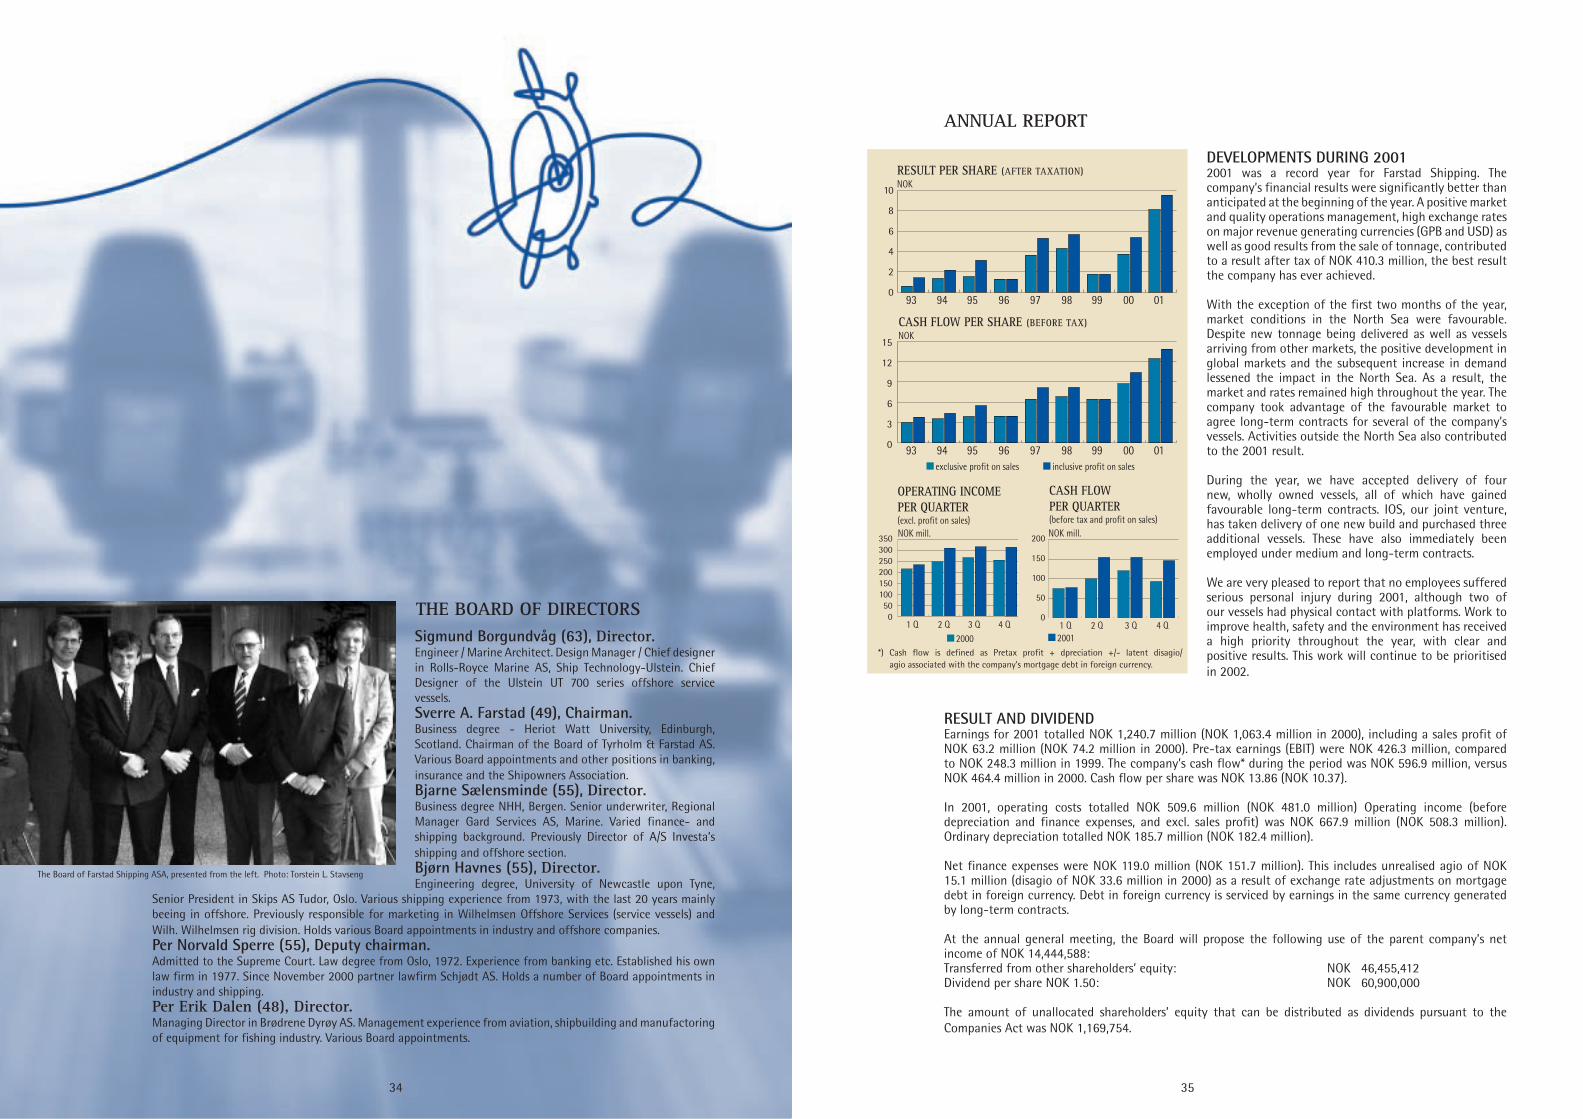
28 35
15
12
9
6
3
0
350300250200150100500
200
150
100
50
0
NOK
NOK mill.
34
NOK mill.
93 94 95 96 97 98 99 00 01
NOK
93 94 95 96 97 98 99 00 01
10
8
6
4
2
0
20012000 *) Cash flow is defined as Pretax profit + dpreciation +/- latent disagio/ agio associated with the company’s mortgage debt in foreign currency.
CASH FLOW PER SHARE (BEFORE TAX)
inclusive profit on salesexclusive profit on sales
OPERATING INCOME PER QUARTER(excl. profit on sales)
CASH FLOWPER QUARTER(before tax and profit on sales)
1 Q 2 Q 3 Q 4 Q 1 Q 2 Q 3 Q 4 Q
RESULT PER SHARE (AFTER TAXATION)
THE BOARD OF DIRECTORS
ANNUAL REPORT
DEVELOPMENTS DURING 20012001 was a record year for Farstad Shipping. The company’s financial results were significantly better than anticipated at the beginning of the year. A positive market and quality operations management, high exchange rates on major revenue generating currencies (GPB and USD) as well as good results from the sale of tonnage, contributed to a result after tax of NOK 410.3 million, the best result the company has ever achieved.
With the exception of the first two months of the year, market conditions in the North Sea were favourable. Despite new tonnage being delivered as well as vessels arriving from other markets, the positive development in global markets and the subsequent increase in demand lessened the impact in the North Sea. As a result, the market and rates remained high throughout the year. The company took advantage of the favourable market to agree long-term contracts for several of the company’s vessels. Activities outside the North Sea also contributed to the 2001 result.
During the year, we have accepted delivery of four new, wholly owned vessels, all of which have gained favourable long-term contracts. IOS, our joint venture, has taken delivery of one new build and purchased three additional vessels. These have also immediately been employed under medium and long-term contracts.
We are very pleased to report that no employees suffered serious personal injury during 2001, although two of our vessels had physical contact with platforms. Work to improve health, safety and the environment has received a high priority throughout the year, with clear and positive results. This work will continue to be prioritised in 2002.
RESULT AND DIVIDENDEarnings for 2001 totalled NOK 1,240.7 million (NOK 1,063.4 million in 2000), including a sales profit of NOK 63.2 million (NOK 74.2 million in 2000). Pre-tax earnings (EBIT) were NOK 426.3 million, compared to NOK 248.3 million in 1999. The company’s cash flow* during the period was NOK 596.9 million, versus NOK 464.4 million in 2000. Cash flow per share was NOK 13.86 (NOK 10.37).
In 2001, operating costs totalled NOK 509.6 million (NOK 481.0 million) Operating income (before depreciation and finance expenses, and excl. sales profit) was NOK 667.9 million (NOK 508.3 million). Ordinary depreciation totalled NOK 185.7 million (NOK 182.4 million).
Net finance expenses were NOK 119.0 million (NOK 151.7 million). This includes unrealised agio of NOK 15.1 million (disagio of NOK 33.6 million in 2000) as a result of exchange rate adjustments on mortgage debt in foreign currency. Debt in foreign currency is serviced by earnings in the same currency generated by long-term contracts.
At the annual general meeting, the Board will propose the following use of the parent company’s net income of NOK 14,444,588:Transferred from other shareholders’ equity: NOK 46,455,412Dividend per share NOK 1.50: NOK 60,900,000
The amount of unallocated shareholders’ equity that can be distributed as dividends pursuant to the Companies Act was NOK 1,169,754.
Sigmund Borgundvåg (63), Director.Engineer / Marine Architect. Design Manager / Chief designer in Rolls-Royce Marine AS, Ship Technology-Ulstein. Chief Designer of the Ulstein UT 700 series offshore service vessels.Sverre A. Farstad (49), Chairman.Business degree - Heriot Watt University, Edinburgh, Scotland. Chairman of the Board of Tyrholm & Farstad AS. Various Board appointments and other positions in banking, insurance and the Shipowners Association. Bjarne Sælensminde (55), Director.Business degree NHH, Bergen. Senior underwriter, Regional Manager Gard Services AS, Marine. Varied finance- and shipping background. Previously Director of A/S Investa’s shipping and offshore section.Bjørn Havnes (55), Director.Engineering degree, University of Newcastle upon Tyne,
Senior President in Skips AS Tudor, Oslo. Various shipping experience from 1973, with the last 20 years mainly beeing in offshore. Previously responsible for marketing in Wilhelmsen Offshore Services (service vessels) and Wilh. Wilhelmsen rig division. Holds various Board appointments in industry and offshore companies.Per Norvald Sperre (55), Deputy chairman.Admitted to the Supreme Court. Law degree from Oslo, 1972. Experience from banking etc. Established his own law firm in 1977. Since November 2000 partner lawfirm Schjødt AS. Holds a number of Board appointments in industry and shipping. Per Erik Dalen (48), Director.Managing Director in Brødrene Dyrøy AS. Management experience from aviation, shipbuilding and manufactoring of equipment for fishing industry. Various Board appointments.
The Board of Farstad Shipping ASA, presented from the left. Photo: Torstein L. Stavseng
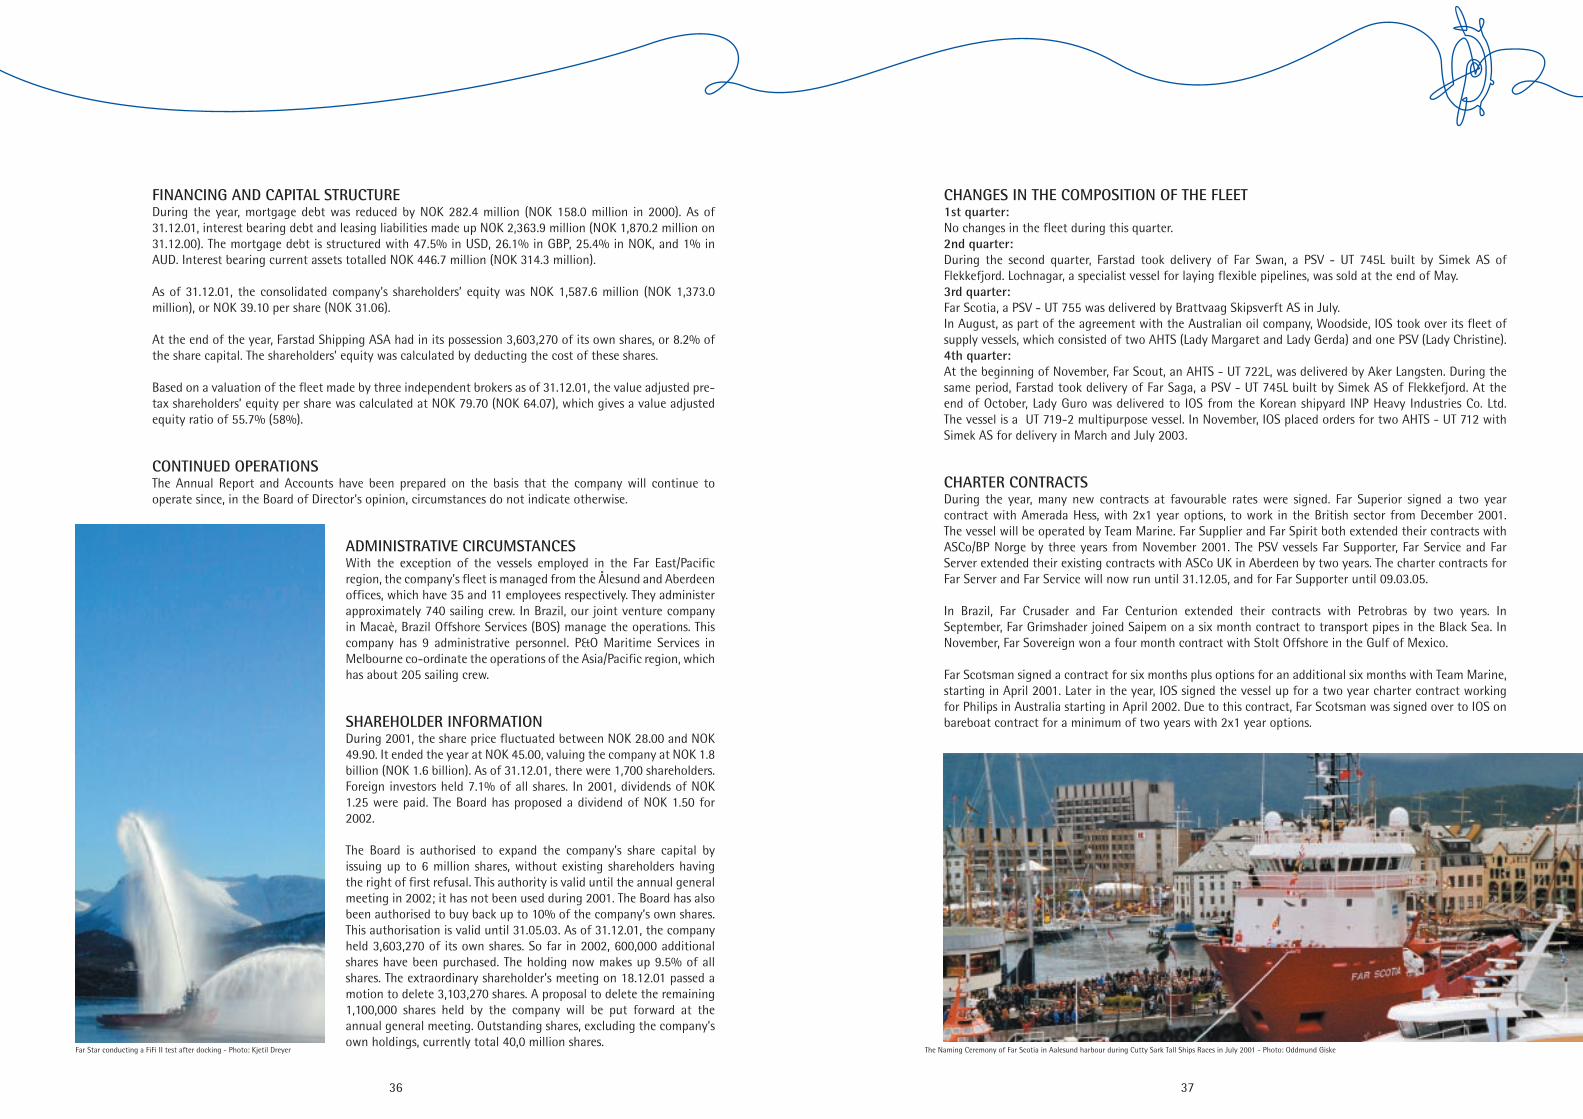
36 37
CHANGES IN THE COMPOSITION OF THE FLEET1st quarter:No changes in the fleet during this quarter.2nd quarter:During the second quarter, Farstad took delivery of Far Swan, a PSV - UT 745L built by Simek AS of Flekkefjord. Lochnagar, a specialist vessel for laying flexible pipelines, was sold at the end of May.3rd quarter:Far Scotia, a PSV - UT 755 was delivered by Brattvaag Skipsverft AS in July. In August, as part of the agreement with the Australian oil company, Woodside, IOS took over its fleet of supply vessels, which consisted of two AHTS (Lady Margaret and Lady Gerda) and one PSV (Lady Christine). 4th quarter:At the beginning of November, Far Scout, an AHTS - UT 722L, was delivered by Aker Langsten. During the same period, Farstad took delivery of Far Saga, a PSV - UT 745L built by Simek AS of Flekkefjord. At the end of October, Lady Guro was delivered to IOS from the Korean shipyard INP Heavy Industries Co. Ltd. The vessel is a UT 719-2 multipurpose vessel. In November, IOS placed orders for two AHTS - UT 712 with Simek AS for delivery in March and July 2003.
CHARTER CONTRACTSDuring the year, many new contracts at favourable rates were signed. Far Superior signed a two year contract with Amerada Hess, with 2x1 year options, to work in the British sector from December 2001. The vessel will be operated by Team Marine. Far Supplier and Far Spirit both extended their contracts with ASCo/BP Norge by three years from November 2001. The PSV vessels Far Supporter, Far Service and Far Server extended their existing contracts with ASCo UK in Aberdeen by two years. The charter contracts for Far Server and Far Service will now run until 31.12.05, and for Far Supporter until 09.03.05.
In Brazil, Far Crusader and Far Centurion extended their contracts with Petrobras by two years. In September, Far Grimshader joined Saipem on a six month contract to transport pipes in the Black Sea. In November, Far Sovereign won a four month contract with Stolt Offshore in the Gulf of Mexico.
Far Scotsman signed a contract for six months plus options for an additional six months with Team Marine, starting in April 2001. Later in the year, IOS signed the vessel up for a two year charter contract working for Philips in Australia starting in April 2002. Due to this contract, Far Scotsman was signed over to IOS on bareboat contract for a minimum of two years with 2x1 year options.
FINANCING AND CAPITAL STRUCTUREDuring the year, mortgage debt was reduced by NOK 282.4 million (NOK 158.0 million in 2000). As of 31.12.01, interest bearing debt and leasing liabilities made up NOK 2,363.9 million (NOK 1,870.2 million on 31.12.00). The mortgage debt is structured with 47.5% in USD, 26.1% in GBP, 25.4% in NOK, and 1% in AUD. Interest bearing current assets totalled NOK 446.7 million (NOK 314.3 million).
As of 31.12.01, the consolidated company’s shareholders’ equity was NOK 1,587.6 million (NOK 1,373.0 million), or NOK 39.10 per share (NOK 31.06).
At the end of the year, Farstad Shipping ASA had in its possession 3,603,270 of its own shares, or 8.2% of the share capital. The shareholders’ equity was calculated by deducting the cost of these shares.
Based on a valuation of the fleet made by three independent brokers as of 31.12.01, the value adjusted pre-tax shareholders’ equity per share was calculated at NOK 79.70 (NOK 64.07), which gives a value adjusted equity ratio of 55.7% (58%).
CONTINUED OPERATIONSThe Annual Report and Accounts have been prepared on the basis that the company will continue to operate since, in the Board of Director’s opinion, circumstances do not indicate otherwise.
ADMINISTRATIVE CIRCUMSTANCESWith the exception of the vessels employed in the Far East/Pacific region, the company’s fleet is managed from the Ålesund and Aberdeen offices, which have 35 and 11 employees respectively. They administer approximately 740 sailing crew. In Brazil, our joint venture company in Macaè, Brazil Offshore Services (BOS) manage the operations. This company has 9 administrative personnel. P&O Maritime Services in Melbourne co-ordinate the operations of the Asia/Pacific region, which has about 205 sailing crew.
SHAREHOLDER INFORMATIONDuring 2001, the share price fluctuated between NOK 28.00 and NOK 49.90. It ended the year at NOK 45.00, valuing the company at NOK 1.8 billion (NOK 1.6 billion). As of 31.12.01, there were 1,700 shareholders. Foreign investors held 7.1% of all shares. In 2001, dividends of NOK 1.25 were paid. The Board has proposed a dividend of NOK 1.50 for 2002.
The Board is authorised to expand the company’s share capital by issuing up to 6 million shares, without existing shareholders having the right of first refusal. This authority is valid until the annual general meeting in 2002; it has not been used during 2001. The Board has also been authorised to buy back up to 10% of the company’s own shares. This authorisation is valid until 31.05.03. As of 31.12.01, the company held 3,603,270 of its own shares. So far in 2002, 600,000 additional shares have been purchased. The holding now makes up 9.5% of all shares. The extraordinary shareholder’s meeting on 18.12.01 passed a motion to delete 3,103,270 shares. A proposal to delete the remaining 1,100,000 shares held by the company will be put forward at the annual general meeting. Outstanding shares, excluding the company’s own holdings, currently total 40,0 million shares.
Far Star conducting a FiFi II test after docking - Photo: Kjetil Dreyer The Naming Ceremony of Far Scotia in Aalesund harbour during Cutty Sark Tall Ships Races in July 2001 - Photo: Oddmund Giske
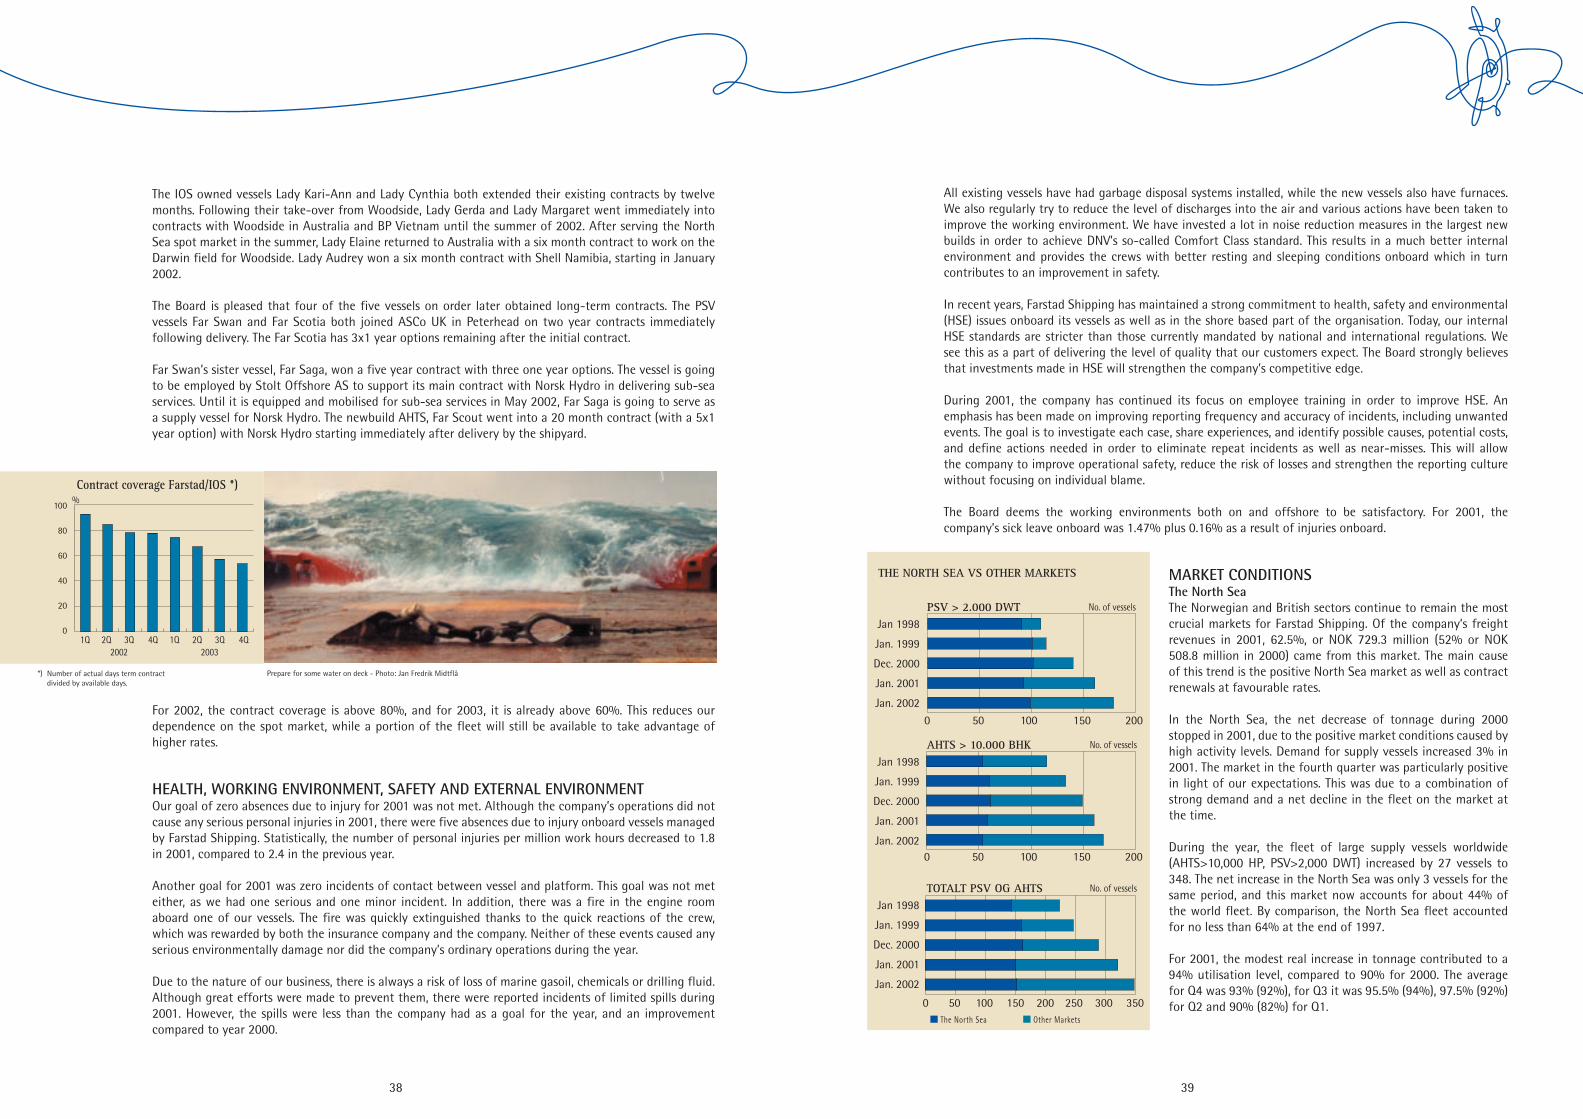
38 39
%100
80
60
40
20
0
0 50 100 150 200
0 50 100 150 200
0 50 100 150 200 250 300 350
The IOS owned vessels Lady Kari-Ann and Lady Cynthia both extended their existing contracts by twelve months. Following their take-over from Woodside, Lady Gerda and Lady Margaret went immediately into contracts with Woodside in Australia and BP Vietnam until the summer of 2002. After serving the North Sea spot market in the summer, Lady Elaine returned to Australia with a six month contract to work on the Darwin field for Woodside. Lady Audrey won a six month contract with Shell Namibia, starting in January 2002.
The Board is pleased that four of the five vessels on order later obtained long-term contracts. The PSV vessels Far Swan and Far Scotia both joined ASCo UK in Peterhead on two year contracts immediately following delivery. The Far Scotia has 3x1 year options remaining after the initial contract.
Far Swan’s sister vessel, Far Saga, won a five year contract with three one year options. The vessel is going to be employed by Stolt Offshore AS to support its main contract with Norsk Hydro in delivering sub-sea services. Until it is equipped and mobilised for sub-sea services in May 2002, Far Saga is going to serve as a supply vessel for Norsk Hydro. The newbuild AHTS, Far Scout went into a 20 month contract (with a 5x1 year option) with Norsk Hydro starting immediately after delivery by the shipyard.
For 2002, the contract coverage is above 80%, and for 2003, it is already above 60%. This reduces our dependence on the spot market, while a portion of the fleet will still be available to take advantage of higher rates.
HEALTH, WORKING ENVIRONMENT, SAFETY AND EXTERNAL ENVIRONMENTOur goal of zero absences due to injury for 2001 was not met. Although the company’s operations did not cause any serious personal injuries in 2001, there were five absences due to injury onboard vessels managed by Farstad Shipping. Statistically, the number of personal injuries per million work hours decreased to 1.8 in 2001, compared to 2.4 in the previous year.
Another goal for 2001 was zero incidents of contact between vessel and platform. This goal was not met either, as we had one serious and one minor incident. In addition, there was a fire in the engine room aboard one of our vessels. The fire was quickly extinguished thanks to the quick reactions of the crew, which was rewarded by both the insurance company and the company. Neither of these events caused any serious environmentally damage nor did the company’s ordinary operations during the year.
Due to the nature of our business, there is always a risk of loss of marine gasoil, chemicals or drilling fluid. Although great efforts were made to prevent them, there were reported incidents of limited spills during 2001. However, the spills were less than the company had as a goal for the year, and an improvement compared to year 2000.
All existing vessels have had garbage disposal systems installed, while the new vessels also have furnaces. We also regularly try to reduce the level of discharges into the air and various actions have been taken to improve the working environment. We have invested a lot in noise reduction measures in the largest new builds in order to achieve DNV’s so-called Comfort Class standard. This results in a much better internal environment and provides the crews with better resting and sleeping conditions onboard which in turn contributes to an improvement in safety.
In recent years, Farstad Shipping has maintained a strong commitment to health, safety and environmental (HSE) issues onboard its vessels as well as in the shore based part of the organisation. Today, our internal HSE standards are stricter than those currently mandated by national and international regulations. We see this as a part of delivering the level of quality that our customers expect. The Board strongly believes that investments made in HSE will strengthen the company’s competitive edge.
During 2001, the company has continued its focus on employee training in order to improve HSE. An emphasis has been made on improving reporting frequency and accuracy of incidents, including unwanted events. The goal is to investigate each case, share experiences, and identify possible causes, potential costs, and define actions needed in order to eliminate repeat incidents as well as near-misses. This will allow the company to improve operational safety, reduce the risk of losses and strengthen the reporting culture without focusing on individual blame.
The Board deems the working environments both on and offshore to be satisfactory. For 2001, the company’s sick leave onboard was 1.47% plus 0.16% as a result of injuries onboard.
MARKET CONDITIONSThe North SeaThe Norwegian and British sectors continue to remain the most crucial markets for Farstad Shipping. Of the company’s freight revenues in 2001, 62.5%, or NOK 729.3 million (52% or NOK 508.8 million in 2000) came from this market. The main cause of this trend is the positive North Sea market as well as contract renewals at favourable rates.
In the North Sea, the net decrease of tonnage during 2000 stopped in 2001, due to the positive market conditions caused by high activity levels. Demand for supply vessels increased 3% in 2001. The market in the fourth quarter was particularly positive in light of our expectations. This was due to a combination of strong demand and a net decline in the fleet on the market at the time.
During the year, the fleet of large supply vessels worldwide (AHTS>10,000 HP, PSV>2,000 DWT) increased by 27 vessels to 348. The net increase in the North Sea was only 3 vessels for the same period, and this market now accounts for about 44% of the world fleet. By comparison, the North Sea fleet accounted for no less than 64% at the end of 1997.
For 2001, the modest real increase in tonnage contributed to a 94% utilisation level, compared to 90% for 2000. The average for Q4 was 93% (92%), for Q3 it was 95.5% (94%), 97.5% (92%) for Q2 and 90% (82%) for Q1.
Prepare for some water on deck - Photo: Jan Fredrik Midtflå*) Number of actual days term contract divided by available days.
Contract coverage Farstad/IOS *)
1Q 2Q 3Q 4Q 1Q 2Q 3Q 4Q 2002 2003
PSV > 2.000 DWT
THE NORTH SEA VS OTHER MARKETS
TOTALT PSV OG AHTS
AHTS > 10.000 BHK
Jan 1998
Jan. 1999
Dec. 2000
Jan. 2001
Jan. 2002
Jan 1998
Jan. 1999
Dec. 2000
Jan. 2001
Jan. 2002
Jan 1998
Jan. 1999
Dec. 2000
Jan. 2001
Jan. 2002
No. of vessels
No. of vessels
No. of vessels
The North Sea Other Markets
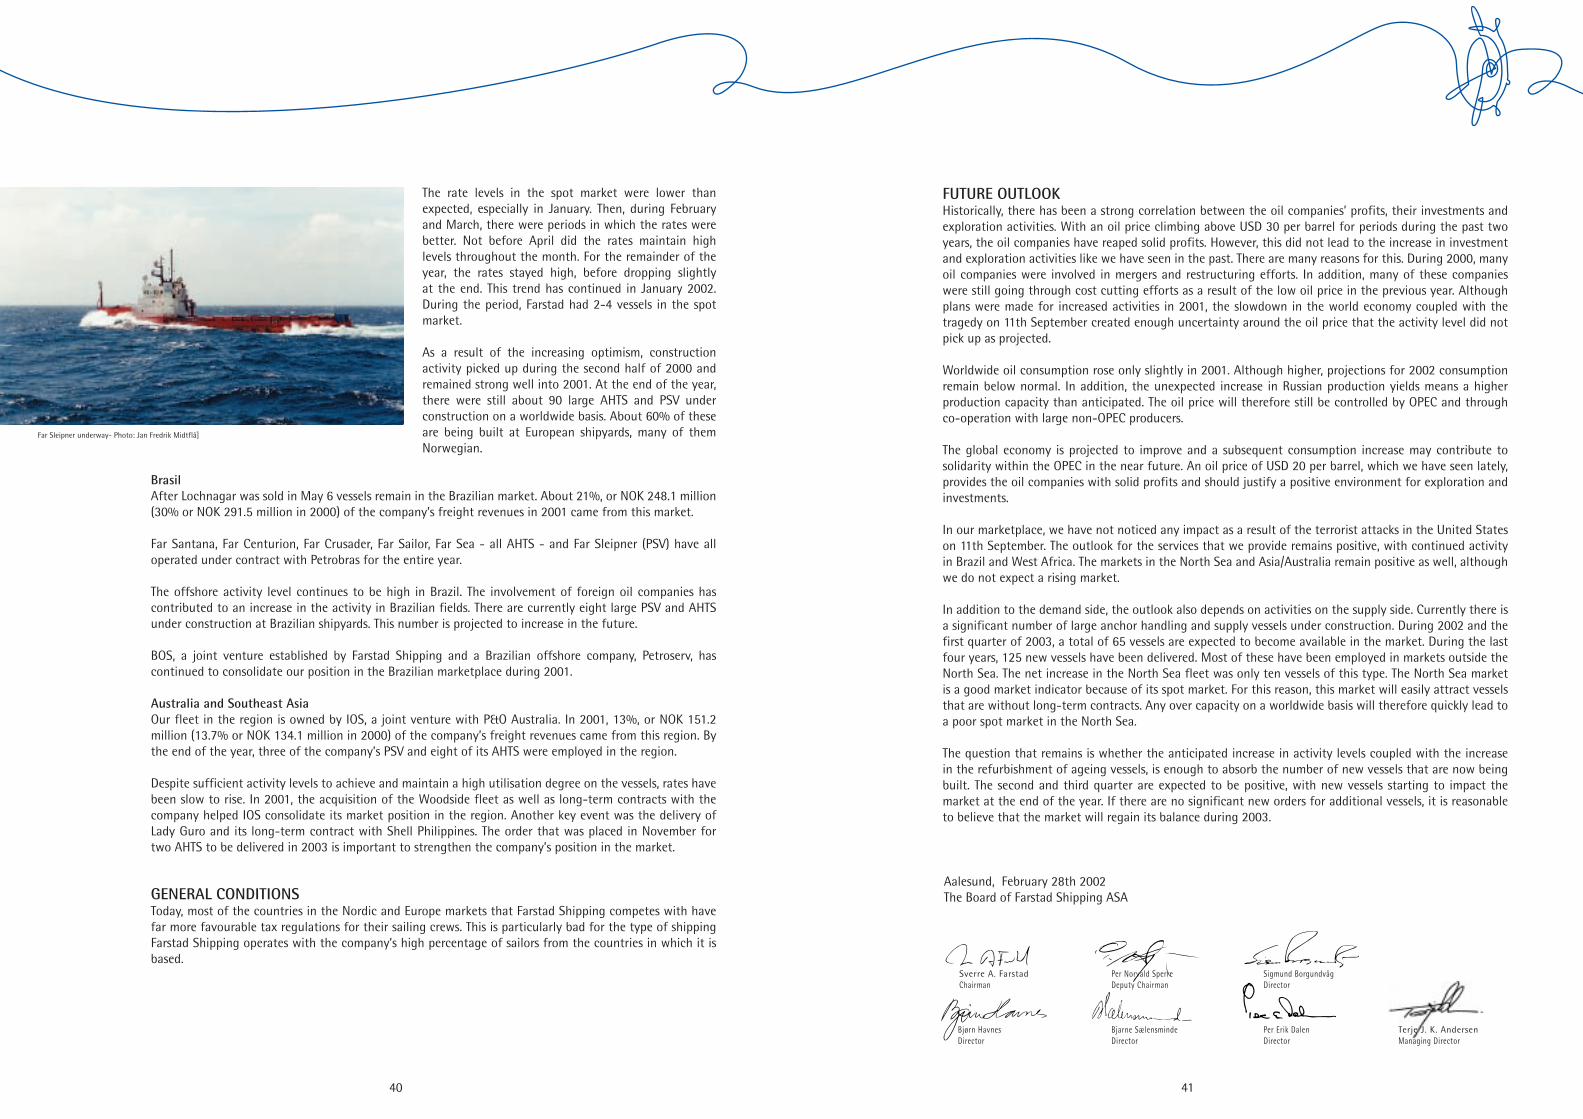
40 41
Far Sleipner underway- Photo: Jan Fredrik Midtflå]
The rate levels in the spot market were lower than expected, especially in January. Then, during February and March, there were periods in which the rates were better. Not before April did the rates maintain high levels throughout the month. For the remainder of the year, the rates stayed high, before dropping slightly at the end. This trend has continued in January 2002. During the period, Farstad had 2-4 vessels in the spot market.
As a result of the increasing optimism, construction activity picked up during the second half of 2000 and remained strong well into 2001. At the end of the year, there were still about 90 large AHTS and PSV under construction on a worldwide basis. About 60% of these are being built at European shipyards, many of them Norwegian.
BrasilAfter Lochnagar was sold in May 6 vessels remain in the Brazilian market. About 21%, or NOK 248.1 million (30% or NOK 291.5 million in 2000) of the company’s freight revenues in 2001 came from this market.
Far Santana, Far Centurion, Far Crusader, Far Sailor, Far Sea - all AHTS - and Far Sleipner (PSV) have all operated under contract with Petrobras for the entire year.
The offshore activity level continues to be high in Brazil. The involvement of foreign oil companies has contributed to an increase in the activity in Brazilian fields. There are currently eight large PSV and AHTS under construction at Brazilian shipyards. This number is projected to increase in the future.
BOS, a joint venture established by Farstad Shipping and a Brazilian offshore company, Petroserv, has continued to consolidate our position in the Brazilian marketplace during 2001.
Australia and Southeast AsiaOur fleet in the region is owned by IOS, a joint venture with P&O Australia. In 2001, 13%, or NOK 151.2 million (13.7% or NOK 134.1 million in 2000) of the company’s freight revenues came from this region. By the end of the year, three of the company’s PSV and eight of its AHTS were employed in the region.
Despite sufficient activity levels to achieve and maintain a high utilisation degree on the vessels, rates have been slow to rise. In 2001, the acquisition of the Woodside fleet as well as long-term contracts with the company helped IOS consolidate its market position in the region. Another key event was the delivery of Lady Guro and its long-term contract with Shell Philippines. The order that was placed in November for two AHTS to be delivered in 2003 is important to strengthen the company’s position in the market.
GENERAL CONDITIONSToday, most of the countries in the Nordic and Europe markets that Farstad Shipping competes with have far more favourable tax regulations for their sailing crews. This is particularly bad for the type of shipping Farstad Shipping operates with the company’s high percentage of sailors from the countries in which it is based.
FUTURE OUTLOOKHistorically, there has been a strong correlation between the oil companies’ profits, their investments and exploration activities. With an oil price climbing above USD 30 per barrel for periods during the past two years, the oil companies have reaped solid profits. However, this did not lead to the increase in investment and exploration activities like we have seen in the past. There are many reasons for this. During 2000, many oil companies were involved in mergers and restructuring efforts. In addition, many of these companies were still going through cost cutting efforts as a result of the low oil price in the previous year. Although plans were made for increased activities in 2001, the slowdown in the world economy coupled with the tragedy on 11th September created enough uncertainty around the oil price that the activity level did not pick up as projected.
Worldwide oil consumption rose only slightly in 2001. Although higher, projections for 2002 consumption remain below normal. In addition, the unexpected increase in Russian production yields means a higher production capacity than anticipated. The oil price will therefore still be controlled by OPEC and through co-operation with large non-OPEC producers.
The global economy is projected to improve and a subsequent consumption increase may contribute to solidarity within the OPEC in the near future. An oil price of USD 20 per barrel, which we have seen lately, provides the oil companies with solid profits and should justify a positive environment for exploration and investments.
In our marketplace, we have not noticed any impact as a result of the terrorist attacks in the United States on 11th September. The outlook for the services that we provide remains positive, with continued activity in Brazil and West Africa. The markets in the North Sea and Asia/Australia remain positive as well, although we do not expect a rising market.
In addition to the demand side, the outlook also depends on activities on the supply side. Currently there is a significant number of large anchor handling and supply vessels under construction. During 2002 and the first quarter of 2003, a total of 65 vessels are expected to become available in the market. During the last four years, 125 new vessels have been delivered. Most of these have been employed in markets outside the North Sea. The net increase in the North Sea fleet was only ten vessels of this type. The North Sea market is a good market indicator because of its spot market. For this reason, this market will easily attract vessels that are without long-term contracts. Any over capacity on a worldwide basis will therefore quickly lead to a poor spot market in the North Sea.
The question that remains is whether the anticipated increase in activity levels coupled with the increase in the refurbishment of ageing vessels, is enough to absorb the number of new vessels that are now being built. The second and third quarter are expected to be positive, with new vessels starting to impact the market at the end of the year. If there are no significant new orders for additional vessels, it is reasonable to believe that the market will regain its balance during 2003.
Aalesund, February 28th 2002The Board of Farstad Shipping ASA
Per Erik DalenDirector
Sverre A. FarstadChairman
Per Norvald SperreDeputy Chairman
Bjarne SælensmindeDirector
Sigmund BorgundvågDirector
Bjørn HavnesDirector
Terje J. K. AndersenManaging Director

4342
PARENT COMPANY FARSTAD SHIPPING ASA (NOK 1000) GROUP
Operating income:Freight incomeOther incomeProfit on sales of fixed assets
Total operating income
Operating expenses:Crewing expenses vesselsOther operating expenses vesselsAdministration
Total operating expenses
Operating profit before depreciation
Depreciation
Operating result
Financial items:Financial incomeFinancial expensesUrealised agio (disagio)
Net financial items
Pretax profit
Tax
Profit of the year
Information about:
Allocated dividend
Profit per share (NOK)
2001
- 39,670 367
40,037
- 19 (43,317)
(43,298)
(3,261)
(2,387)
(5,648)
28,136 (1,108) -
27,028
21,380
(6,935)
14,445
60,900
0.34
2000
978,744 10,476 74,166
1,063,386
(258,837) (175,606) (46,517) (480,960)
582,426
(182,383)
400,043
46,996 (165,063) (33,642)
(151,709)
248,334
(7,883)
240,451
5.38
1999
795,844 5,492 154
801,490
(231,946) (148,423) (46,117) (426,486)
375,004
(159,638)
215,366
28,958 (111,037) (47,257)
(129,336)
86,030
(5,576)
80,454
1.77
2000
- 37,076 89
37,165
- - (39,212)
(39,212)
(2,047)
(2,351)
(4,398)
19,995 (2,807) -
17,188
12,790
(2,067)
10,723
55,254 0.24
NOTE
19
2
15
21
19
8
19
333
13
6
20
14
18
4
144
PROFIT AND LOSS ACCOUNT
2001
1,165,740 11,759 63,151
1,240,650
(282,233) (175,505) (51,888) (509,626)
731,024
(185,673)
545,351
42,356 (176,512) 15,140
(119,016)
426,335
(16,068)
410,267
9.56
2001
1,575 3,372,043 47,295 24,956 863 - 2,354
3,449,086
201,391 67,736 138,784 300,112
708,023
4,157,109
2000
3,151 2,672,266 44,471 143,289 1,150 2,354
2,866,681
185,312 66,655 53,011 249,150
554,128
3,420,809
1999
4,727 2,583,487 39,049 60,202 675- - 650
2,688,790
154,577 51,505 31,367 155,463
392,912
3,081,702
FARSTAD SHIPPING ASA (NOK 1000) GROUP
ASSETSFixed assets:GoodwillVessels etc.Deferred maintenance costContracts newbuildingsOther long-term receivablesReceivables from Group companiesShares
Total fixed assets
Current assets:Account receivables, freight incomeOther short-term receivablesOther securitiesBank deposits
Total currrent assets
Total assets
PARENT COMPANY
NOTE
2000 242,599 1,130,441 1,373,040
1,703
1,870,242
1,871,945
36,975 55,254 83,595
175,824
2,047,769
3,420,809
1999 243,725 980,023 1,223,748
126- - 1,693,066
1,693,192
38,102 45,329 81,331
164,762
1,857,954
3,081,702
2000 3,151 2,044 - - 1,109 96,202 1,475,390
1,577,896
4,516 24,566 53,011 51,932 134,025
1,711,921
2001 1,575 1,708 - - 819 56,367 1,175,256
1,235,725
4,764 35,819 138,784 148,289 327,656
1,563,381
2000 242,599 1,351,676 1,594,275
1,313
-
1,313
17,737 55,254 43,342
116,333
117,646
1,711,921
2001 238,996 1,176,122 1,415,118
812- - -
812
25,746 60,900 60,805
147,451
148,263
1,563,381
EQUITY AND LIABILITIESEquity:Paid-in capitalRetained earnings
Total equity capital
Liabilities:Long-term liabilities:Provision for liabilitiesLeasing obligationsInterest-bearing mortgage debt
Total long-term liabilities
Short-term liabilities:Debt to suppliersAllocated dividendOther short-term liabilities
Total short-term liabilities
Total liabilities
Total equity and liabilities
NOTE
BALANCE SHEET
Per Erik DalenDirector
Sverre A. FarstadChairman
Per Norvald SperreDeputy Chairman
Bjarne SælensmindeDirector
Sigmund BorgundvågDirector
Bjørn HavnesDirector
Terje J. K. AndersenManaging Director
Ålesund, February 28th 2002The Board of Farstad Shipping ASA
2001 238,996 1,348,610 1,587,606
2,346 120,861 2,243,009
2,366,216
56,194 60,900 86,193
203,287
2,569,503
4,157,109
88
111477
5717
8
2020
141717
9
1010
131212
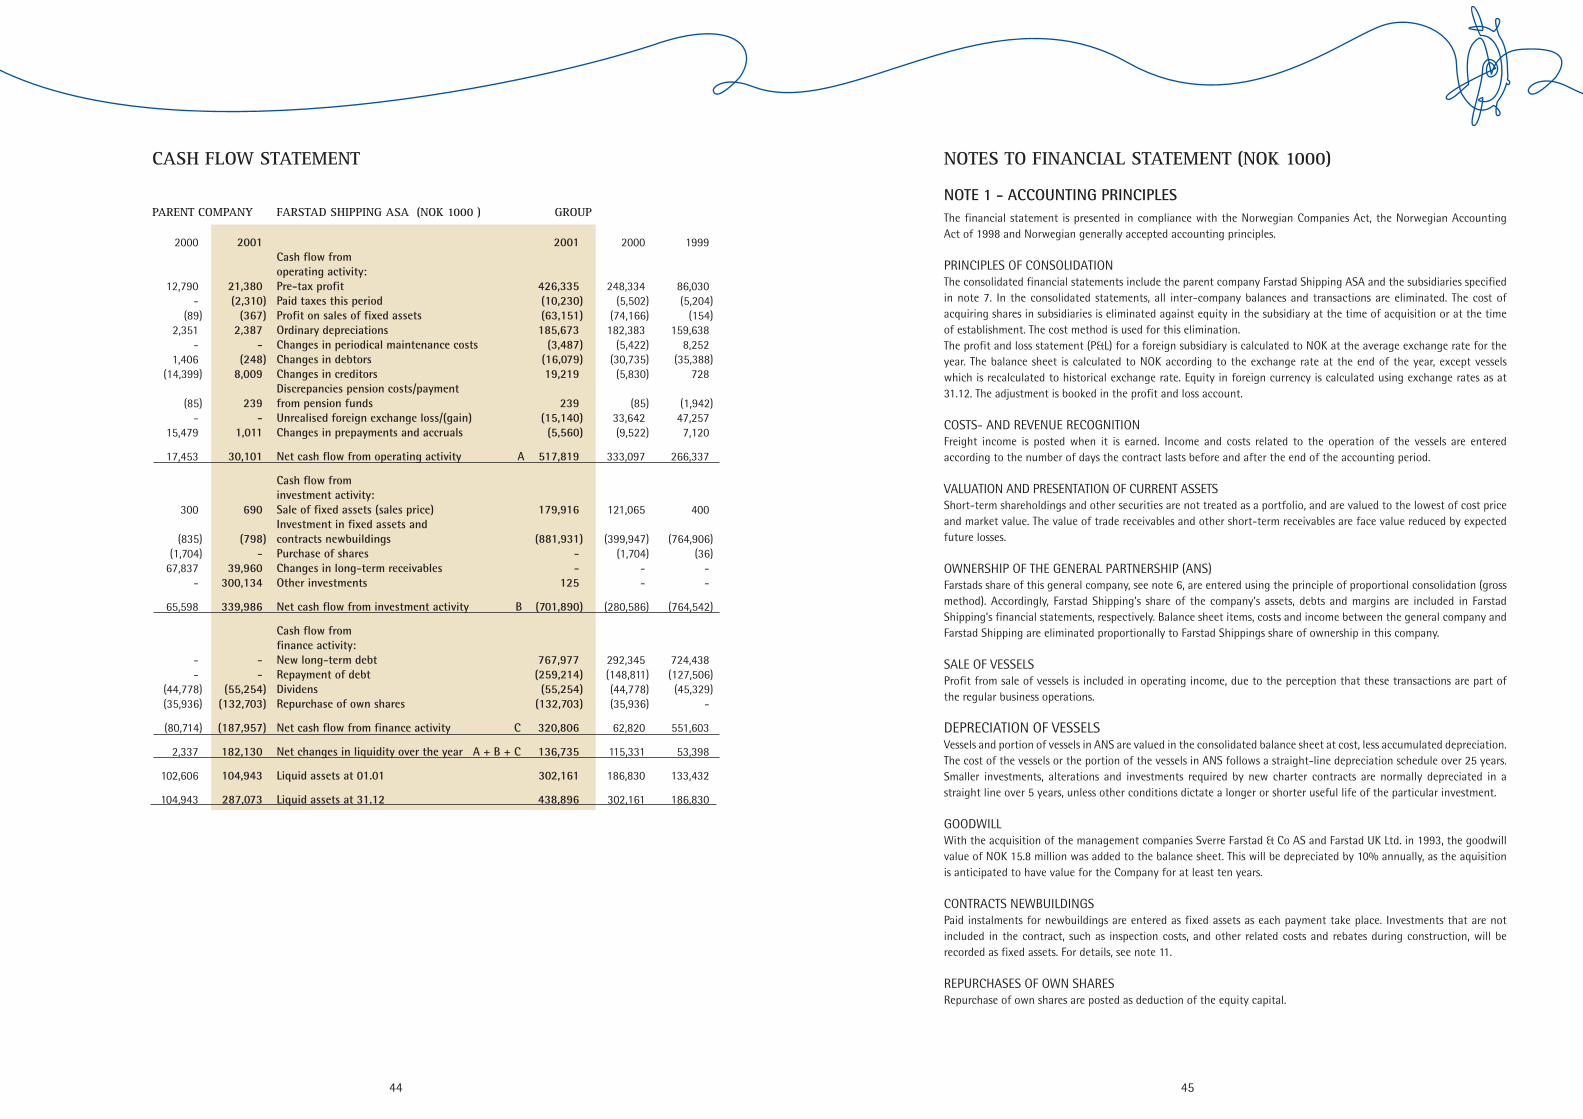
44 45
2001
21,380 (2,310) (367) 2,387 - (248) 8,009
239 - 1,011
30,101
690 (798) - 39,960 300,134
339,986
- - (55,254) (132,703) (187,957)
182,130
104,943 287,073
2000
248,334 (5,502) (74,166) 182,383 (5,422) (30,735) (5,830) (85) 33,642 (9,522)
333,097
121,065 (399,947) (1,704) - - (280,586)
292,345 (148,811) (44,778) (35,936)
62,820
115,331
186,830 302,161
2000
12,790 - (89) 2,351 - 1,406 (14,399) (85) - 15,479
17,453
300 (835) (1,704) 67,837 -
65,598
- - (44,778) (35,936) (80,714)
2,337
102,606 104,943
1999
86,030 (5,204) (154) 159,638 8,252 (35,388) 728 (1,942) 47,257 7,120
266,337
400 (764,906) (36) - - (764,542)
724,438 (127,506) (45,329) -
551,603
53,398
133,432 186,830
Cash flow fromoperating activity:Pre-tax profitPaid taxes this periodProfit on sales of fixed assetsOrdinary depreciationsChanges in periodical maintenance costsChanges in debtorsChanges in creditorsDiscrepancies pension costs/paymentfrom pension fundsUnrealised foreign exchange loss/(gain)Changes in prepayments and accruals
Net cash flow from operating activity
Cash flow from investment activity:Sale of fixed assets (sales price)Investment in fixed assets andcontracts newbuildingsPurchase of sharesChanges in long-term receivablesOther investments
Net cash flow from investment activity B
Cash flow fromfinance activity:New long-term debtRepayment of debtDividensRepurchase of own shares
Net cash flow from finance activity
Net changes in liquidity over the year A + B + C
Liquid assets at 01.01
Liquid assets at 31.12
FARSTAD SHIPPING ASA (NOK 1000 ) GROUP PARENT COMPANY
CASH FLOW STATEMENT
2001
426,335 (10,230) (63,151) 185,673 (3,487) (16,079) 19,219 239 (15,140) (5,560)
A 517,819
179,916 (881,931) - - 125
(701,890)
767,977 (259,214) (55,254) (132,703)
C 320,806
136,735
302,161 438,896
NOTES TO FINANCIAL STATEMENT (NOK 1000)
NOTE 1 - ACCOUNTING PRINCIPLESThe financial statement is presented in compliance with the Norwegian Companies Act, the Norwegian Accounting Act of 1998 and Norwegian generally accepted accounting principles.
PRINCIPLES OF CONSOLIDATIONThe consolidated financial statements include the parent company Farstad Shipping ASA and the subsidiaries specified in note 7. In the consolidated statements, all inter-company balances and transactions are eliminated. The cost of acquiring shares in subsidiaries is eliminated against equity in the subsidiary at the time of acquisition or at the time of establishment. The cost method is used for this elimination.The profit and loss statement (P&L) for a foreign subsidiary is calculated to NOK at the average exchange rate for the year. The balance sheet is calculated to NOK according to the exchange rate at the end of the year, except vessels which is recalculated to historical exchange rate. Equity in foreign currency is calculated using exchange rates as at 31.12. The adjustment is booked in the profit and loss account.
COSTS- AND REVENUE RECOGNITIONFreight income is posted when it is earned. Income and costs related to the operation of the vessels are entered according to the number of days the contract lasts before and after the end of the accounting period.
VALUATION AND PRESENTATION OF CURRENT ASSETSShort-term shareholdings and other securities are not treated as a portfolio, and are valued to the lowest of cost price and market value. The value of trade receivables and other short-term receivables are face value reduced by expected future losses.
OWNERSHIP OF THE GENERAL PARTNERSHIP (ANS)Farstads share of this general company, see note 6, are entered using the principle of proportional consolidation (gross method). Accordingly, Farstad Shipping’s share of the company’s assets, debts and margins are included in Farstad Shipping’s financial statements, respectively. Balance sheet items, costs and income between the general company and Farstad Shipping are eliminated proportionally to Farstad Shippings share of ownership in this company.
SALE OF VESSELSProfit from sale of vessels is included in operating income, due to the perception that these transactions are part of the regular business operations.
DEPRECIATION OF VESSELSVessels and portion of vessels in ANS are valued in the consolidated balance sheet at cost, less accumulated depreciation. The cost of the vessels or the portion of the vessels in ANS follows a straight-line depreciation schedule over 25 years. Smaller investments, alterations and investments required by new charter contracts are normally depreciated in a straight line over 5 years, unless other conditions dictate a longer or shorter useful life of the particular investment.
GOODWILLWith the acquisition of the management companies Sverre Farstad & Co AS and Farstad UK Ltd. in 1993, the goodwill value of NOK 15.8 million was added to the balance sheet. This will be depreciated by 10% annually, as the aquisition is anticipated to have value for the Company for at least ten years.
CONTRACTS NEWBUILDINGSPaid instalments for newbuildings are entered as fixed assets as each payment take place. Investments that are not included in the contract, such as inspection costs, and other related costs and rebates during construction, will be recorded as fixed assets. For details, see note 11.
REPURCHASES OF OWN SHARESRepurchase of own shares are posted as deduction of the equity capital.
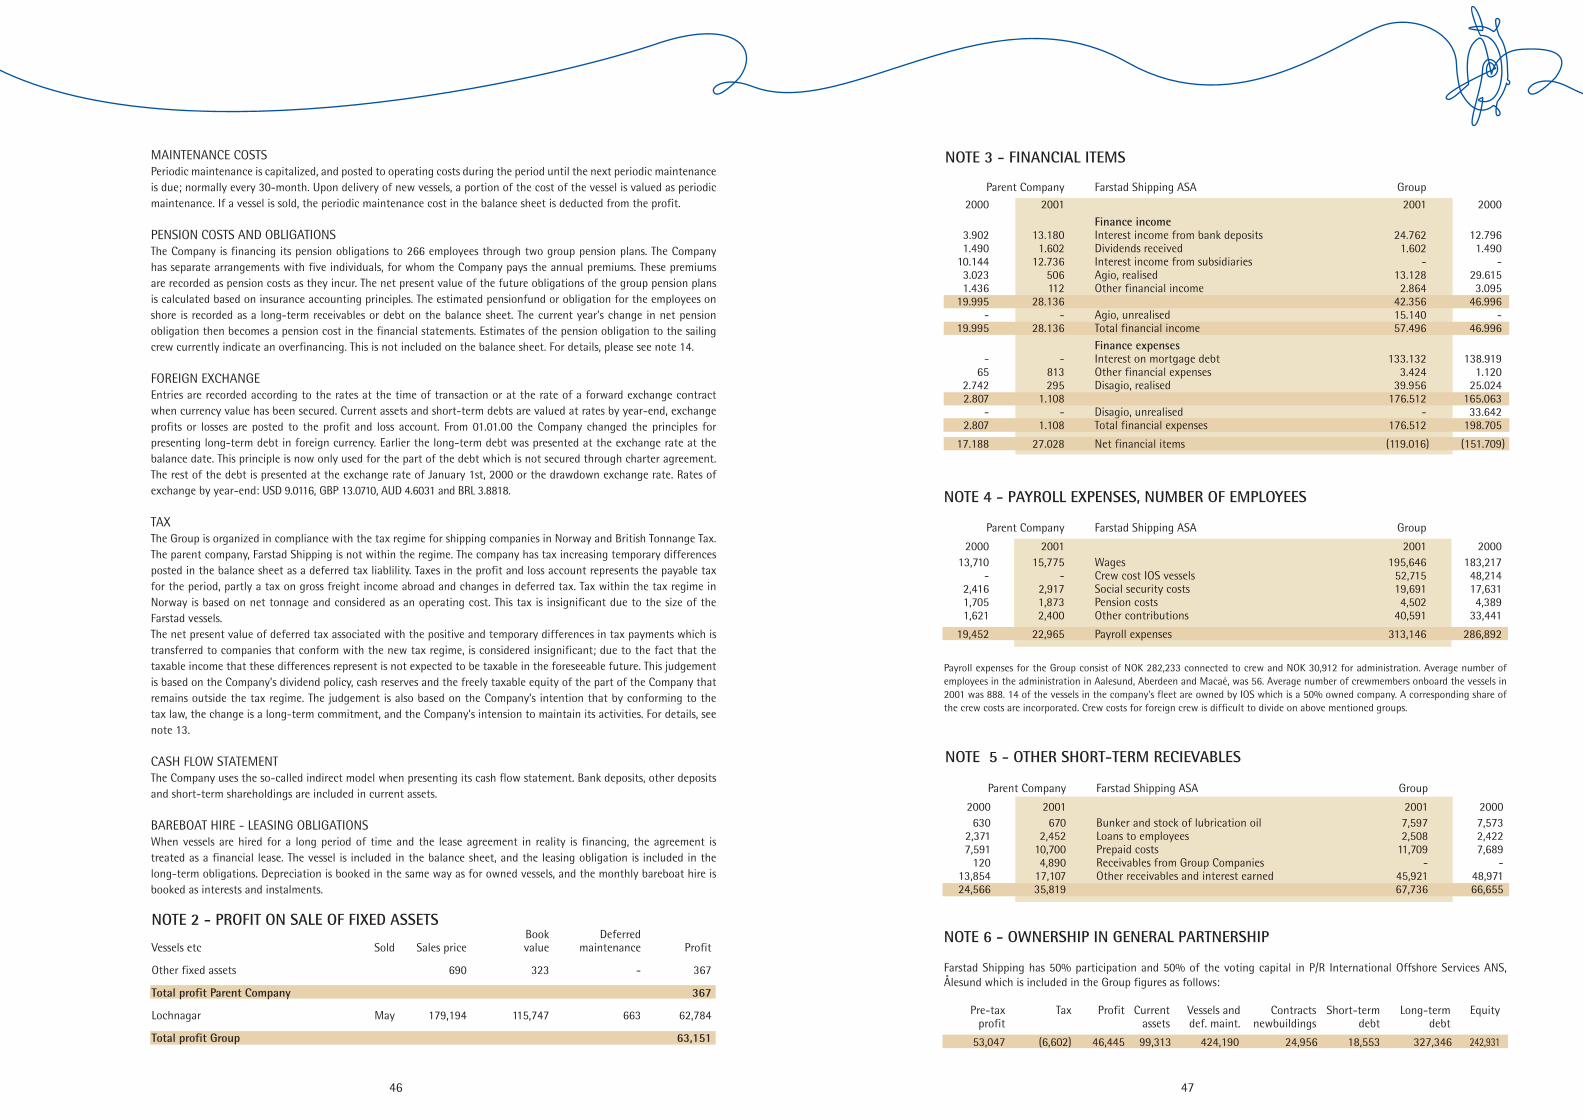
46 47
NOTE 2 - PROFIT ON SALE OF FIXED ASSETS Book Deferred Vessels etc Sold Sales price value maintenance Profit
Other fixed assets 690 323 - 367
Total profit Parent Company 367
Lochnagar May 179,194 115,747 663 62,784
Total profit Group 63,151
NOTE 3 - FINANCIAL ITEMS
Parent Company Farstad Shipping ASA Group 2000 2001 2001 2000 Finance income 3.902 13.180 Interest income from bank deposits 24.762 12.796 1.490 1.602 Dividends received 1.602 1.490 10.144 12.736 Interest income from subsidiaries - - 3.023 506 Agio, realised 13.128 29.615 1.436 112 Other financial income 2.864 3.095 19.995 28.136 42.356 46.996 - - Agio, unrealised 15.140 - 19.995 28.136 Total financial income 57.496 46.996 Finance expenses - - Interest on mortgage debt 133.132 138.919 65 813 Other financial expenses 3.424 1.120 2.742 295 Disagio, realised 39.956 25.024 2.807 1.108 176.512 165.063 - - Disagio, unrealised - 33.642 2.807 1.108 Total financial expenses 176.512 198.705
17.188 27.028 Net financial items (119.016) (151.709)
Payroll expenses for the Group consist of NOK 282,233 connected to crew and NOK 30,912 for administration. Average number of employees in the administration in Aalesund, Aberdeen and Macaé, was 56. Average number of crewmembers onboard the vessels in 2001 was 888. 14 of the vessels in the company's fleet are owned by IOS which is a 50% owned company. A corresponding share of the crew costs are incorporated. Crew costs for foreign crew is difficult to divide on above mentioned groups.
NOTE 4 - PAYROLL EXPENSES, NUMBER OF EMPLOYEES
Parent Company Farstad Shipping ASA Group
2000 2001 2001 2000 13,710 15,775 Wages 195,646 183,217 - - Crew cost IOS vessels 52,715 48,214 2,416 2,917 Social security costs 19,691 17,631 1,705 1,873 Pension costs 4,502 4,389 1,621 2,400 Other contributions 40,591 33,441
19,452 22,965 Payroll expenses 313,146 286,892
NOTE 5 - OTHER SHORT-TERM RECIEVABLES
Parent Company Farstad Shipping ASA Group
2000 2001 2001 2000 630 670 Bunker and stock of lubrication oil 7,597 7,573 2,371 2,452 Loans to employees 2,508 2,422 7,591 10,700 Prepaid costs 11,709 7,689 120 4,890 Receivables from Group Companies - - 13,854 17,107 Other receivables and interest earned 45,921 48,971 24,566 35,819 67,736 66,655
NOTE 6 - OWNERSHIP IN GENERAL PARTNERSHIP
Farstad Shipping has 50% participation and 50% of the voting capital in P/R International Offshore Services ANS, Ålesund which is included in the Group figures as follows:
Pre-tax Tax Profit Current Vessels and Contracts Short-term Long-term Equity profit assets def. maint. newbuildings debt debt
53,047 (6,602) 46,445 99,313 424,190 24,956 18,553 327,346 242,931
MAINTENANCE COSTSPeriodic maintenance is capitalized, and posted to operating costs during the period until the next periodic maintenance is due; normally every 30-month. Upon delivery of new vessels, a portion of the cost of the vessel is valued as periodic maintenance. If a vessel is sold, the periodic maintenance cost in the balance sheet is deducted from the profit. PENSION COSTS AND OBLIGATIONSThe Company is financing its pension obligations to 266 employees through two group pension plans. The Company has separate arrangements with five individuals, for whom the Company pays the annual premiums. These premiums are recorded as pension costs as they incur. The net present value of the future obligations of the group pension plans is calculated based on insurance accounting principles. The estimated pensionfund or obligation for the employees on shore is recorded as a long-term receivables or debt on the balance sheet. The current year’s change in net pension obligation then becomes a pension cost in the financial statements. Estimates of the pension obligation to the sailing crew currently indicate an overfinancing. This is not included on the balance sheet. For details, please see note 14.
FOREIGN EXCHANGEEntries are recorded according to the rates at the time of transaction or at the rate of a forward exchange contract when currency value has been secured. Current assets and short-term debts are valued at rates by year-end, exchange profits or losses are posted to the profit and loss account. From 01.01.00 the Company changed the principles for presenting long-term debt in foreign currency. Earlier the long-term debt was presented at the exchange rate at the balance date. This principle is now only used for the part of the debt which is not secured through charter agreement. The rest of the debt is presented at the exchange rate of January 1st, 2000 or the drawdown exchange rate. Rates of exchange by year-end: USD 9.0116, GBP 13.0710, AUD 4.6031 and BRL 3.8818.
TAXThe Group is organized in compliance with the tax regime for shipping companies in Norway and British Tonnange Tax. The parent company, Farstad Shipping is not within the regime. The company has tax increasing temporary differences posted in the balance sheet as a deferred tax liablility. Taxes in the profit and loss account represents the payable tax for the period, partly a tax on gross freight income abroad and changes in deferred tax. Tax within the tax regime in Norway is based on net tonnage and considered as an operating cost. This tax is insignificant due to the size of the Farstad vessels.The net present value of deferred tax associated with the positive and temporary differences in tax payments which is transferred to companies that conform with the new tax regime, is considered insignificant; due to the fact that the taxable income that these differences represent is not expected to be taxable in the foreseeable future. This judgement is based on the Company’s dividend policy, cash reserves and the freely taxable equity of the part of the Company that remains outside the tax regime. The judgement is also based on the Company’s intention that by conforming to the tax law, the change is a long-term commitment, and the Company’s intension to maintain its activities. For details, see note 13.
CASH FLOW STATEMENTThe Company uses the so-called indirect model when presenting its cash flow statement. Bank deposits, other deposits and short-term shareholdings are included in current assets.
BAREBOAT HIRE - LEASING OBLIGATIONSWhen vessels are hired for a long period of time and the lease agreement in reality is financing, the agreement is treated as a financial lease. The vessel is included in the balance sheet, and the leasing obligation is included in the long-term obligations. Depreciation is booked in the same way as for owned vessels, and the monthly bareboat hire is booked as interests and instalments.
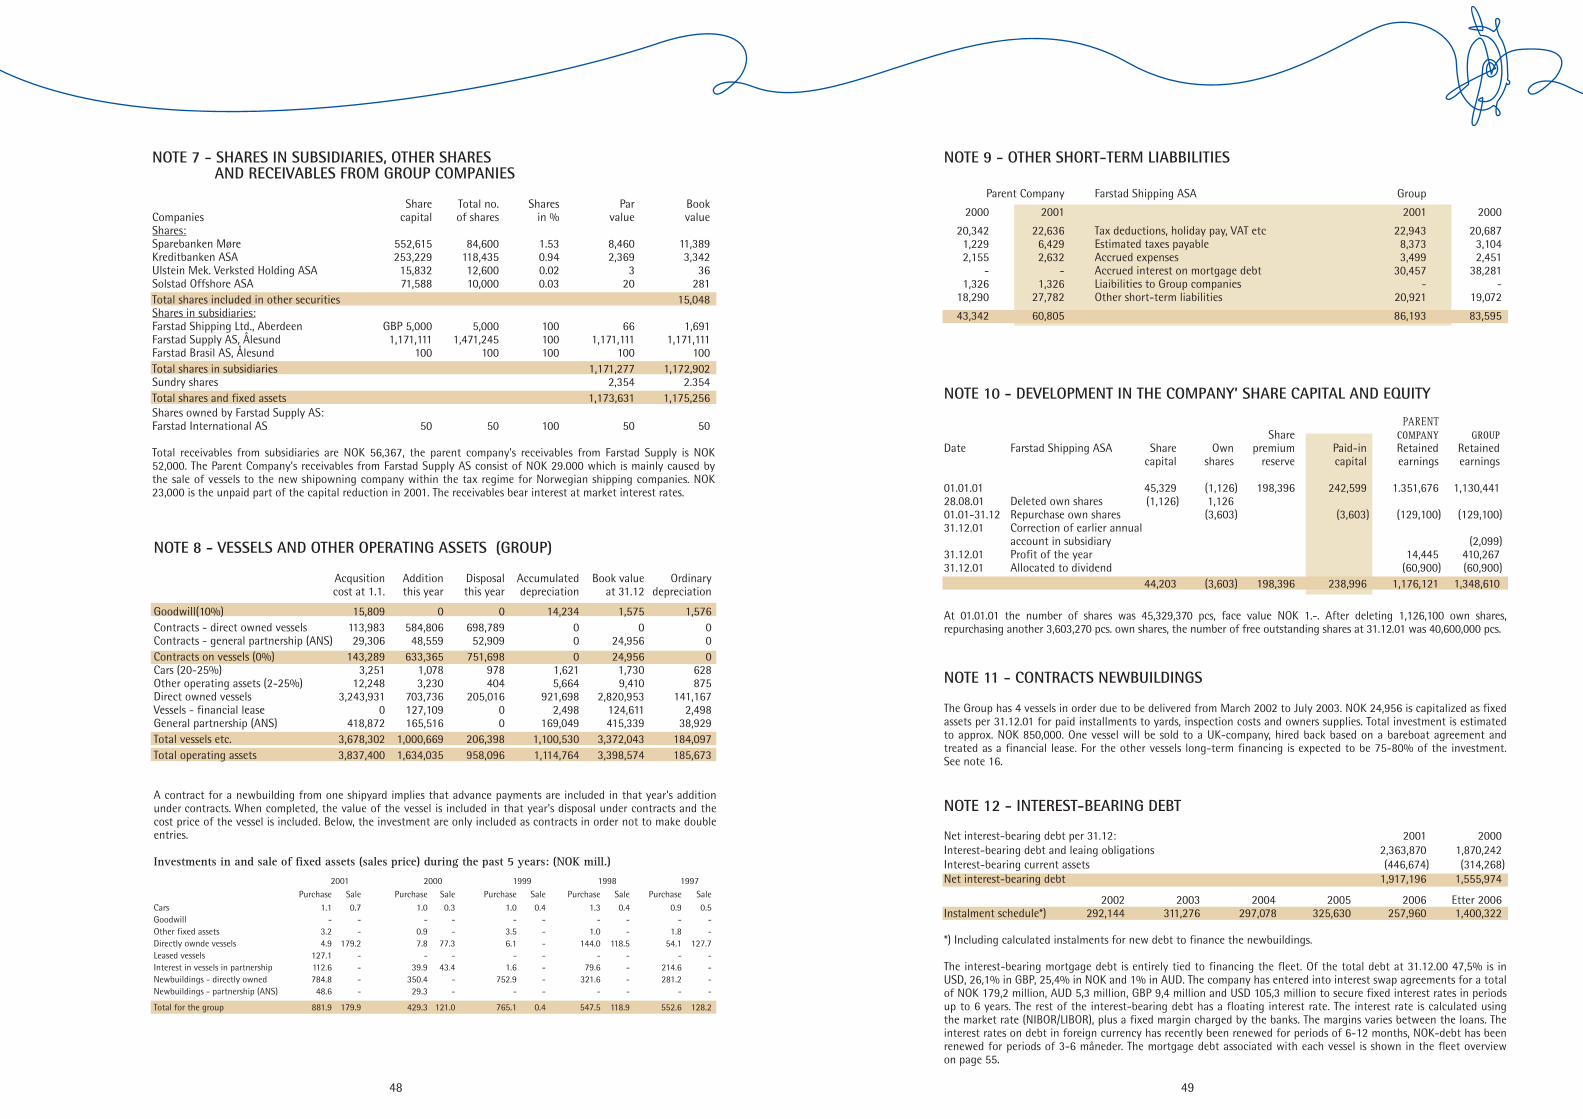
48 49
NOTE 7 - SHARES IN SUBSIDIARIES, OTHER SHARES AND RECEIVABLES FROM GROUP COMPANIES
Share Total no. Shares Par BookCompanies capital of shares in % value value Shares:Sparebanken Møre 552,615 84,600 1.53 8,460 11,389Kreditbanken ASA 253,229 118,435 0.94 2,369 3,342Ulstein Mek. Verksted Holding ASA 15,832 12,600 0.02 3 36Solstad Offshore ASA 71,588 10,000 0.03 20 281Total shares included in other securities 15,048Shares in subsidiaries:Farstad Shipping Ltd., Aberdeen GBP 5,000 5,000 100 66 1,691Farstad Supply AS, Ålesund 1,171,111 1,471,245 100 1,171,111 1,171,111Farstad Brasil AS, Ålesund 100 100 100 100 100Total shares in subsidiaries 1,171,277 1,172,902Sundry shares 2,354 2.354Total shares and fixed assets 1,173,631 1,175,256Shares owned by Farstad Supply AS:Farstad International AS 50 50 100 50 50
Total receivables from subsidiaries are NOK 56,367, the parent company's receivables from Farstad Supply is NOK 52,000. The Parent Company’s receivables from Farstad Supply AS consist of NOK 29.000 which is mainly caused by the sale of vessels to the new shipowning company within the tax regime for Norwegian shipping companies. NOK 23,000 is the unpaid part of the capital reduction in 2001. The receivables bear interest at market interest rates.
NOTE 8 - VESSELS AND OTHER OPERATING ASSETS (GROUP)
Acqusition Addition Disposal Accumulated Book value Ordinary cost at 1.1. this year this year depreciation at 31.12 depreciation
Goodwill(10%) 15,809 0 0 14,234 1,575 1,576Contracts - direct owned vessels 113,983 584,806 698,789 0 0 0 Contracts - general partnership (ANS) 29,306 48,559 52,909 0 24,956 0Contracts on vessels (0%) 143,289 633,365 751,698 0 24,956 0Cars (20-25%) 3,251 1,078 978 1,621 1,730 628Other operating assets (2-25%) 12,248 3,230 404 5,664 9,410 875Direct owned vessels 3,243,931 703,736 205,016 921,698 2,820,953 141,167Vessels - financial lease 0 127,109 0 2,498 124,611 2,498General partnership (ANS) 418,872 165,516 0 169,049 415,339 38,929Total vessels etc. 3,678,302 1,000,669 206,398 1,100,530 3,372,043 184,097Total operating assets 3,837,400 1,634,035 958,096 1,114,764 3,398,574 185,673
A contract for a newbuilding from one shipyard implies that advance payments are included in that year's addition under contracts. When completed, the value of the vessel is included in that year's disposal under contracts and the cost price of the vessel is included. Below, the investment are only included as contracts in order not to make double entries.
Investments in and sale of fixed assets (sales price) during the past 5 years: (NOK mill.)
2001 2000 1999 1998 1997 Purchase Sale Purchase Sale Purchase Sale Purchase Sale Purchase SaleCars 1.1 0.7 1.0 0.3 1.0 0.4 1.3 0.4 0.9 0.5Goodwill - - - - - - - - - - Other fixed assets 3.2 - 0.9 - 3.5 - 1.0 - 1.8 - Directly ownde vessels 4.9 179.2 7.8 77.3 6.1 - 144.0 118.5 54.1 127.7 Leased vessels 127.1 - - - - - - - - -Interest in vessels in partnership 112.6 - 39.9 43.4 1.6 - 79.6 - 214.6 - Newbuildings - directly owned 784.8 - 350.4 - 752.9 - 321.6 - 281.2 - Newbuildings - partnership (ANS) 48.6 - 29.3 - - - - - - -
Total for the group 881.9 179.9 429.3 121.0 765.1 0.4 547.5 118.9 552.6 128.2
NOTE 9 - OTHER SHORT-TERM LIABBILITIES
Parent Company Farstad Shipping ASA Group
2000 2001 2001 2000
20,342 22,636 Tax deductions, holiday pay, VAT etc 22,943 20,687 1,229 6,429 Estimated taxes payable 8,373 3,104 2,155 2,632 Accrued expenses 3,499 2,451 - - Accrued interest on mortgage debt 30,457 38,281 1,326 1,326 Liaibilities to Group companies - - 18,290 27,782 Other short-term liabilities 20,921 19,072
43,342 60,805 86,193 83,595
NOTE 12 - INTEREST-BEARING DEBT
Net interest-bearing debt per 31.12: 2001 2000 Interest-bearing debt and leaing obligations 2,363,870 1,870,242 Interest-bearing current assets (446,674) (314,268) Net interest-bearing debt 1,917,196 1,555,974
2002 2003 2004 2005 2006 Etter 2006Instalment schedule*) 292,144 311,276 297,078 325,630 257,960 1,400,322 *) Including calculated instalments for new debt to finance the newbuildings.
The interest-bearing mortgage debt is entirely tied to financing the fleet. Of the total debt at 31.12.00 47,5% is in USD, 26,1% in GBP, 25,4% in NOK and 1% in AUD. The company has entered into interest swap agreements for a total of NOK 179,2 million, AUD 5,3 million, GBP 9,4 million and USD 105,3 million to secure fixed interest rates in periods up to 6 years. The rest of the interest-bearing debt has a floating interest rate. The interest rate is calculated using the market rate (NIBOR/LIBOR), plus a fixed margin charged by the banks. The margins varies between the loans. The interest rates on debt in foreign currency has recently been renewed for periods of 6-12 months, NOK-debt has been renewed for periods of 3-6 måneder. The mortgage debt associated with each vessel is shown in the fleet overview on page 55.
NOTE 11 - CONTRACTS NEWBUILDINGS
The Group has 4 vessels in order due to be delivered from March 2002 to July 2003. NOK 24,956 is capitalized as fixed assets per 31.12.01 for paid installments to yards, inspection costs and owners supplies. Total investment is estimated to approx. NOK 850,000. One vessel will be sold to a UK-company, hired back based on a bareboat agreement and treated as a financial lease. For the other vessels long-term financing is expected to be 75-80% of the investment. See note 16.
NOTE 10 - DEVELOPMENT IN THE COMPANY’ SHARE CAPITAL AND EQUITY
PARENT Share COMPANY GROUPDate Farstad Shipping ASA Share Own premium Paid-in Retained Retained capital shares reserve capital earnings earnings
01.01.01 45,329 (1,126) 198,396 242,599 1.351,676 1,130,44128.08.01 Deleted own shares (1,126) 1,126 01.01-31.12 Repurchase own shares (3,603) (3,603) (129,100) (129,100)31.12.01 Correction of earlier annual account in subsidiary (2,099)31.12.01 Profit of the year 14,445 410,26731.12.01 Allocated to dividend (60,900) (60,900) 44,203 (3,603) 198,396 238,996 1,176,121 1,348,610
At 01.01.01 the number of shares was 45,329,370 pcs, face value NOK 1.-. After deleting 1,126,100 own shares, repurchasing another 3,603,270 pcs. own shares, the number of free outstanding shares at 31.12.01 was 40,600,000 pcs.

50 51
NOTE 14 - PENSIONS
For accounting purposes, the Company's pension plan is treated in accordance with standard for pension expenses. See further details under accounting principles on page 45.The Company's net pension funds and liabilities, can be specified as follows, and are classified in the balance sheet under long-term receivables and long-term debt: 31.12.01 31.12.00Insured pension rights earned 13,052 11,282 Non-insured pension rights earned 77 81Pension funds (actual value) (11,620) (10,912) Estimated contribution to social security 26 (5) Actuarial corrections (1,255) (405) Net pension funds 1) 269 434
Net pension liabilities 549 475 Calculations are based on the following financial and actuarial assumptions:Discount rate 7.0% 7.0%Expected return on pension funds 8.0% 8.0% Annual expected wage growth and G adjustment 3.3% 3.3%Adjustment in pension paid 2.5% 2.5%Expected use of AFP 30.0% 30.0%This year's net pension cost is calculated as follows:Pension payment from operation 14 15Pension cost from supplemental schemes 906 950Pension cost, sailing crew, from operation 1) 3,585 3,424
Net pension costs 4,505 4,389
1) Actuarial calculations for the sailing crew show that the fund is overfinanced by NOK 4,352. The Company has decided not to include this element in the balance sheet
NOTE 15 - GOVERNMENT GRANTS
Parent Company Farstad Shipping ASA Group
2000 2001 2001 2000
Government refund scheme to secure - - employment of Norwegian seamen 12,560 11,452 Refund scheme for temporary positions - - for seamen during training 1,020 517 0 0 Government grants for reduction of crew costs 13,580 11,969
NOTE 16 - OFF-BALANCE FINANCIAL INSTRUMENTS
In order to secure the currency exchange rate of short-term receivables and freight income in foreign currency, the Company has entered into the following agreements at 31.12.01:
a) Forward agreement for an amount of GBP 29.2 million due from January 2002 to March 2005. Forward rates varies between NOK 13.0050 and 13.4820.
b) Forward agreement for an amount of USD 29,2 million due from January 2002 to July 2007. Forward rates varies between NOK 8.909 og 9.5277.
To secure the planned financing of a newbuilding to be delivered March 2002, the Company has per 31.12.01 entered into forward agreement to buy DKK 161.96 mill. at a rate of NOK 110,08. IOS, included in the Group figures with 50%, has for their newbuilding due to be delivered March 2002 entered into forward agreement to sell USD 10.754 mill. at an average rate of 9.5965. Additionally, IOS has entered into forward agreement to sell USD 23.963 mill. at an average rate of 9.3132 and USD 23.781 at an average rate of 9.3845 in connection with two newbuildings to be delivered March and July 2003.
NOTE 17 - MORTGAGE AND GUARANTEE LIABILITIES
Farstad Shipping ASA Parent Company Group
Mortgages: Debt, lease obligation and interest secured by mortgage 0 2,394,327
Securities included: Bank deposits 37,421 81,748Account receiables - 191,097Vessels, at book value - 3,360,903 37,421 3,633,748
In addition the Company has assigned future freight income, and any insurance payment as security for the debt. Taxes owned on behalf of employees, NOK 4,097 are committed resources deposited into a separate account, but are included in bank deposits.
Guarantee : Guarantee liabilities not included in the balance sheet 1,817,198 342,516
Mortgage debt has been transferred from Farstad Shipping to Farstad Supply as a part of the adaptation to the new tax regime for Norwegian shipping companies. Farstad Shipping remains as guarantor for this debt, amounting to NOK 1,452,236 at 31.12.01.
NOTE 18 - CONNECTED COMPANIES
Tyrholm & Farstad AS, Aalesund, is the company's largest shareholder (47%), is defined as a connected company. On 01.01.98 the Company signed a 5 year extension of an agreement with Tyrholm & Farstad AS with regard to rent of office accommodation. Further agreements were made 01.01.99 for use of computers for 5 years and other office services for 3 years. All agreements are for the head office in Aalesund and represent an annual cost of NOK 3,331. The Company has no receivables or liabilities to Tyrholm & Farstad AS at 31.12.01.
NOTE 13 - TAX SITUATION
Parent Company Farstad Shipping ASA Group 2000 2001 2001 2000 Calculation of taxable profit: 12.790 21.380 Operating income before taxes 968 1.204 Permanent discrepancies Changes in temporary discrepancies related to: (85) 0 Current assets / Short-term liabilities 1.739 1.980 Fixed assets / Long-term liabilities (6.579) 0 Loss to be carried forward 8.833 24.564 Taxable profit 2.473 6.878 Payable tax on ordinary result (1.244) (449) Dividend tax credit - 1.082 Tax regarding earlier year 1.229 7.511 Payable tax Calculation of deferred tax. Specification of discrepancies: (41) 0 Current assets / Short-term liabilities 5.479 1.351 3.034 939 Fixed assets 939 3.034
2.993 939 Calculation base for deferred taxes 6.418 4.385
838 263 Deferred tax 1.797 1.228 Specification of taxes in profit and loss account: 1.229 7.511 Taxes payable in Norway 7.511 1.713 - - Taxes payable abroad 7.989 4.943 838 (576) Changes in deferred tax 568 1.227 2.067 6.935 Total tax costs 16.068 7.883

5253
NOTE 19 - RESULT SORTED BY BUSINESS SEGMENTS
Operating Operating Operating pro- Depreciation Operating pro- Book value income costs fit I (EBDIT) fit II (EBIT) vessels*)
AHTS 627.036 253.462 373.574 98.796 274.778 1.892.097PSV 538.704 256.164 282.540 83.798 198.742 1.512.476Other 11.759 11.759 11.759Total vessels 1.177.499 509.626 667.873 182.594 485.279 3.404.572Norwegian sector 315.397 157.641 157.756 56.323 101.433 1.411.670British sector 413.936 146.775 267.161 56.135 211.026 758.498Brazil 248.114 107.939 140.175 38.377 101.798 534.894Far East/Australia 151.229 84.922 66.307 30.475 35.832 320.863Other 48.823 12.349 36.474 1.284 35.190 378.648Total sector 1.177.499 509.626 667.873 182.594 485.279 3.404.572
For 2001 the investment has been NOK 428.449 in new AHTS vessels and NOK 564.291 in new PSV vessels. Total investment NOK 992.740. Operating profit (EBIT) for Farstad Shipping are NOK 545.351. The difference of NOK 60.072 is devided between sales of fixed assets NOK 63.151 and other depreciations NOK 3.079.*) The book value breakdown per vessel by geographical location was determined using the end of 2001 as basis. Book value as of 31.12.01 was used, and includes the individual vessel's accrued periodic maintenance costs as of that date.
NOTE 20 - SHAREHOLDER DETAILS / OWN SHARES
The company’s share capital is NOK 44,203 divided on 44,203,370 shares at NOK 1.00 per share in one share class. At the Annual General Meeting one share has one vote.At the Annual General Meeting 03.05.01 the Board of Directors was given the authority to increase the share capital by up to 6 million shares. The authority also includes an increase in capital for a consideration other than cash, so that the Board may carry out mergers, purchases of business, assets etc. The authority also permits the Board to establish the terms for issuing the shares. The authority has not been used and will apply until the annual general meeting in May 2002. The board has authority to acquire on behalf of the company up to 10% of the company’s own shares after write-down, equivalent to maxium 4,110,000 shares. The highest and lowest amount that can be paid for the shares is NOK 1.- and NOK 60.-. The authority will apply until 31.05.2003. No member of the Board nor the Management of the Company has share options.
OWN SHARESTotal numbers of shares in Farstad Shipping ASA is 44,203,270 face value NOK 1,00 per share. During year 2001 the Company has purchased 3,603,270 own shares (8.15%) at a total cost of NOK 132,703, giving an average price
per share of NOK 38.83. At the Extraordinary General Meeting 18.12.01, it was decided to delete 3,103,270 shares. Average number of free outstanding shares for the financial year was 42,910,872.
The reason for this purchase of own shares was that stockmarket price has been considerable below value adjusted equity per share. The Board will at the Annual meeting 07.05.2002 propose a write-down of 1,100,000 shares in the company by deleting the company’s own shares.
THE COMPANY’S 20 LARGEST SHAREHOLDERS AT 31.12.01: Number % 1 Tyrholm & Farstad AS 20,796,199 47.0 2 Farstad Shipping ASA 3,603,370 8.1 3 Odin Norge 2,384,000 5.4 4 Storebrand Livsforsikring AS 1,814,925 4.1 5 Brown Brothers Harriman & Co 1,200,000 2.7 6 Odin Norden 1,087,325 2.5 7 Jan H. Farstad 1,000,000 2.3 8 Sverre A. Farstad 1,000,000 2.3 9 Deutsche Bank AG 650,000 1.5 10 Firstnordic Norge 400,000 0.9 11 Tine Pensjonskasse 340,800 0.8 12 Vesta Liv AS 252,303 0.6 13 Storebrand Norge 226,200 0.5 14 JP Morgan Chase Bank The S/A 222,000 0.5 15 JP Morgan Chase Bank The Client 186,375 0.4 16 Vital Forsikring ASA 176,467 0.4 17 Pareto Aktiv Verdipapir 152,000 0.3 18 NP Farstad Invest AS 150,000 0.3 19 Sparebanken Møre 150,000 0.3 20 Norsk Kjøttsamvirkes Pensjonskasse 150,000 0.3 Total 20 largest shareholders 35,941,864 81.3Total 10 largest shareholders 33,935,719 76.8Total 44 foreign shareholders 3,135,191 7.1 Total shares on 1.745 hands 44,203,270 100.0
THE BOARD, THE MANAGEMENT AND THE AUDITOR’S SHARES AT 31.12.01: (Norwegian accounting Act § 7-26) NumberThe Board: Sverre A. Farstad 22,202,199 Per Norvald Sperre 0 Sigmund Borgundvåg 20,000 Bjørn Havnes 0 Bjarne Sælensminde 85,000 Per Erik Dalen 0The Management: Terje J.K. Andersen 32,000 Torstein L. Stavseng 32,000 Karl Johan Bakken 0The Auditor: Ernst & Young AS 0
NOTE 21 - REMUNERATION TO EXECUTIVES, BOARD OF DIRECTORS AND AUDITOR'S
Farstad Shipping ASA - Parent Company 2001 2000 Managing DirectorWages 1,283 1,211 Pension liabilities 211 300 Other remuneration 498 370 1,992 1,881 Directors feeChairman of the Board 525 500 5 members of the Board 687 655 1,212 1,155
Auditor’s feeFee for auditing 202 116 Consulting fee 119 274 321 390
If the Managing Director or the Finance Director due to company takeover decides to resign or get dissmissed, they both have the right to a compensation of two yearly wages. It is agreed that the Managing Director has an agreement for resign remuneration, this is by 31.12.01 accumulated to NOK 533,333.-. The Managing Director has a mutual agreement for early retirement by the age of 60.No members of the Board nor the Management of the Company has share options in Farstad Shipping. The Management (three persons) have a bonus agreement based on company profit, limited to NOK 500,000.- per person. The Board evaluates both agreements annual.Loan to managers and shareholdersThe Company has granted loans to the Managing Director of NOK 1,200,000.- the Finance Director of NOK 643,000.- and the Market/Operation Director of NOK 130,000.- The interest is fixed to the lowest non-taxable interest, this is 6% for the time beeing. Loans are not granted to members of the Board or shareholders.
AUDITOR’S REPORT FOR 2001
TO THE ANNUAL SHAREHOLDERS MEETING OF FARSTAD SHIPPING ASA
We have audited the annual financial statements of the Farstad Shipping ASA as of 31 December 2001, showing a profit of NOK 14,444,588.- for the parent company and a profit of NOK 410,267,000.- for the Group. We have also audited the information in the Board of Directors’ report concerning the financial statements, the going concern assumption and the proposal for the allocation of the profit. The financial statements comprise the balance sheet, the income and cash flow statements, the accompanying notes and the Group accounts. These financial statements are the responsibility of the Company’s Board of Directors and the Managing Director. Our responsibility is to express an opinion on the financial statements and on other information as required by the Norwegian Act on Auditing and Auditors.We conducted our audit in accordance with the Norwegian Act on Auditing and Auditors and generally accepted auditing principles in Norway. These principles require that we plan and perform the audit to obtain reasonable assurance about whether the financial statements are free of material misstatement. An audit includes examining, on a test basis, evidence supporting the amounts and disclosures in the financial statements. An audit also includes assessing the accounting principles used and the significant estimates made by Management, as well as evaluating the overall financial statement presentation. To the extent required by law and generally accepted auditing principles, an audit also comprises a review of the management of the Company’s financial affairs and its accounting and internal control systems. We believe that our audit provides a reasonable basis for our opinion.In our opinion,· the financial statements are prepared in accordance with Norwegian law and regulations and present fairly, in all material respects, the financial position of the Company and of the Group as of 31 December, 2001, and the results of its operations and cash flows for the year then ended, in accordance with generally accepted accounting principles in Norway.· the company’s management fulfilled its duty to properly register and document the accounting information in accordance with Norwegian law and generally accepted accounting principles in Norway.· the information in the Board of Directors’ report concerning the financial statements, the going concern assumption, and the proposal for the allocation of the profit are consistent with the financial statements and comply with Norwegian law and regulations.
Aalesund, March 12th 2002
ERNST & YOUNG ASOdd Jarle DoevingState Authorised Public Accountant (Norway)
Note: This translation from Norwegian has been prepared for infomation purposes only.
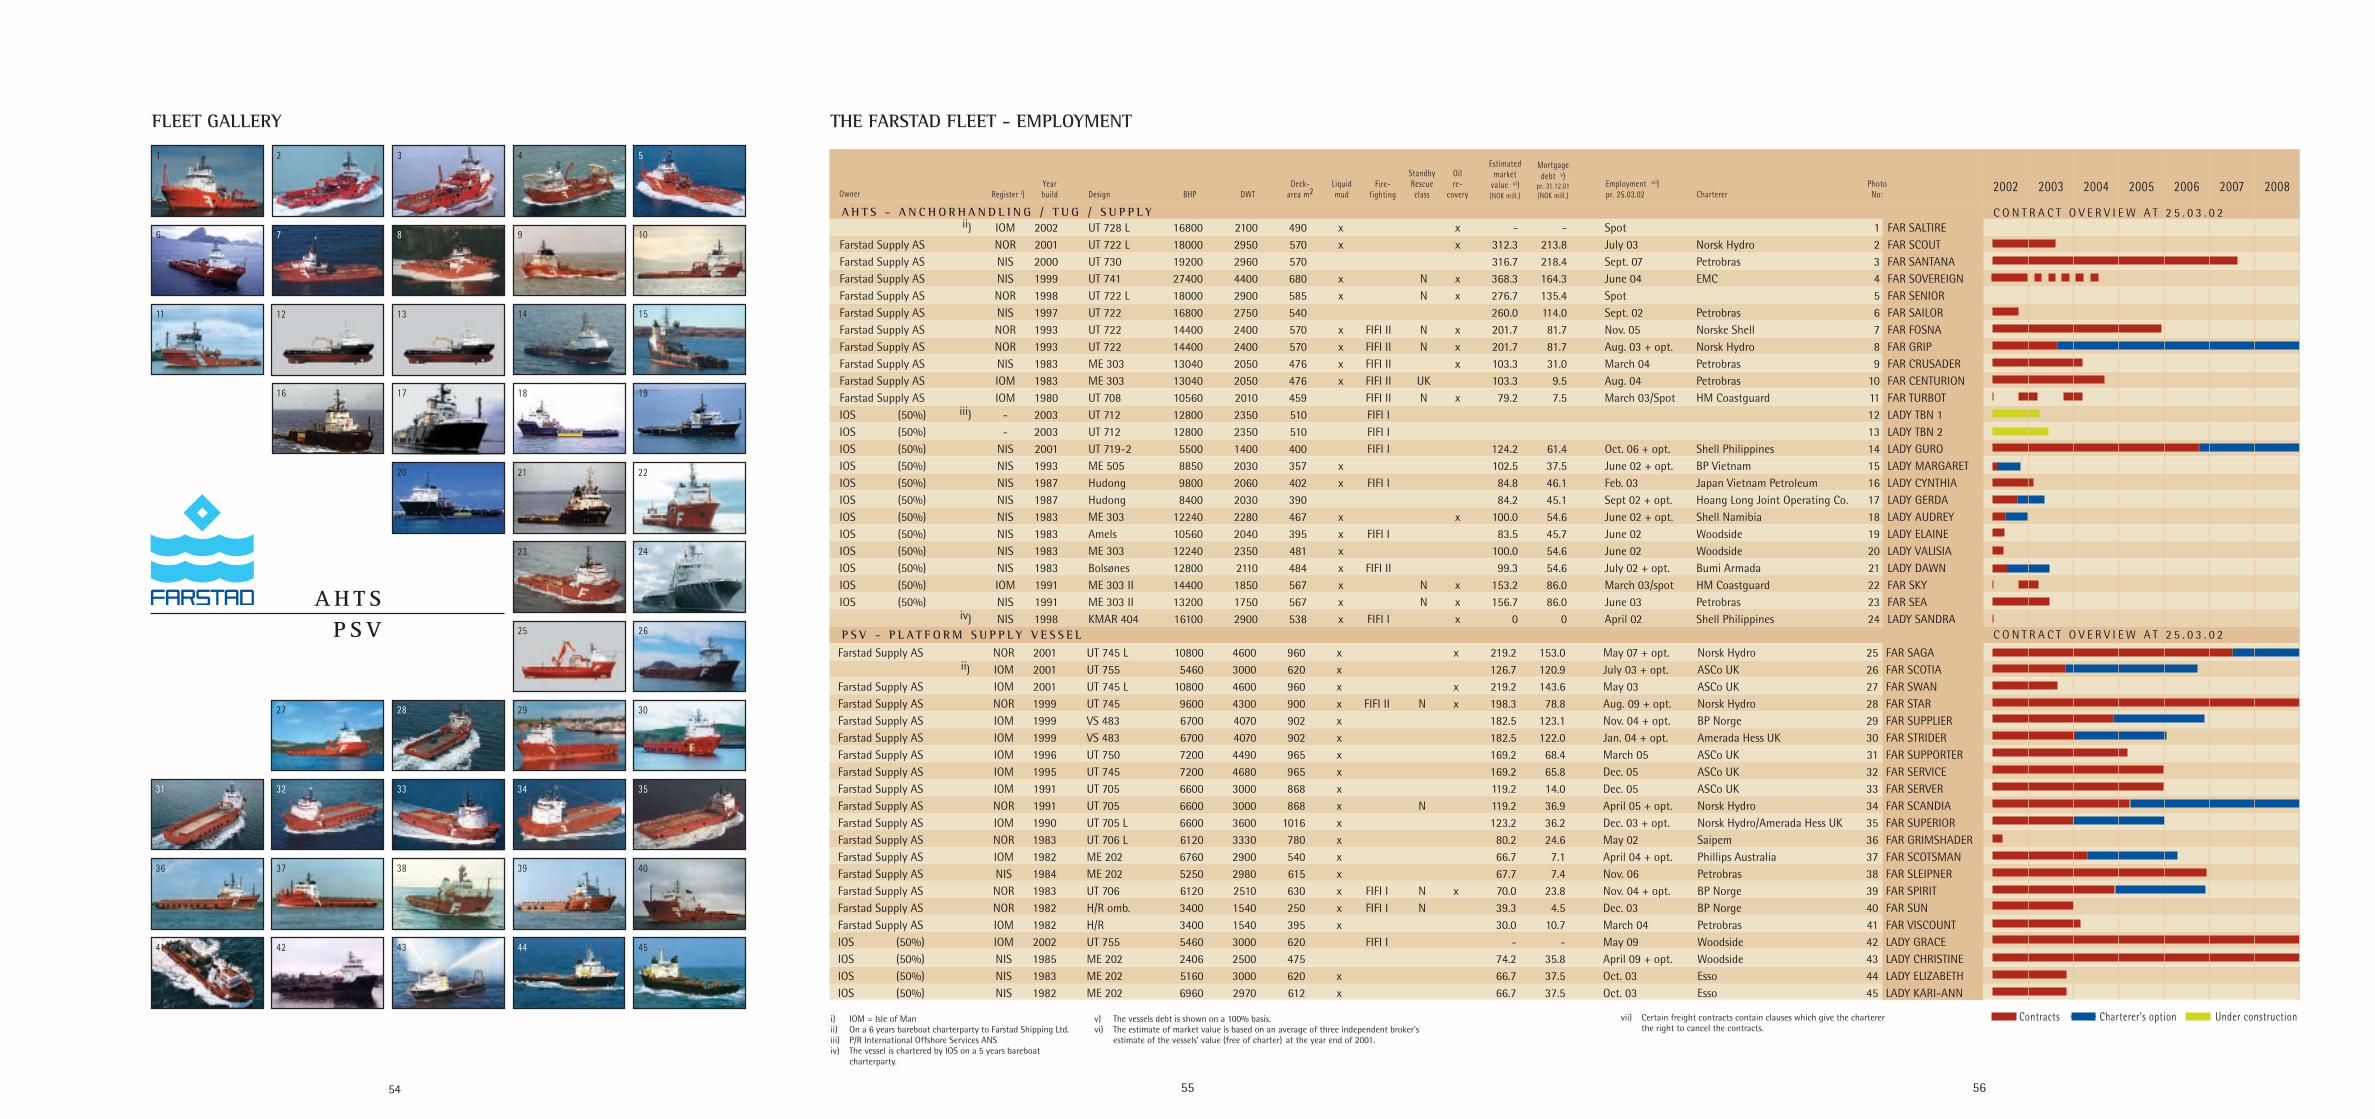
55 56
2002 2003 2004 2005 2006 2007 2008
54
51 2 3 4 5
6 7 8 9 10
11 14 15
16 17 18 19
20 21
24
25 26
27 28 29
31 32 33 34 35
36 37 38 39
30
40
41 44
A H T SP S V
42
22
23
4543
12 13
FLEET GALLERY THE FARSTAD FLEET - EMPLOYMENT
Contracts Charterer's option Under construction
Mortgagedebt v)
pr. 31.12.01 (NOK mill.)
Estimated market
value vi) (NOK mill.)Register i)
Yearbuild Design BHP DWT
Deck-area m2
Liquid mud
Fire-fighting
Standby Rescue class
Oilre-
covery Owner Employment vii) pr. 25.03.02 Charterer
Photo No:
ii) IOM 2002 UT 728 L 16800 2100 490 x x - - Spot 1 FAR SALTIRE Farstad Supply AS NOR 2001 UT 722 L 18000 2950 570 x x 312.3 213.8 July 03 Norsk Hydro 2 FAR SCOUT Farstad Supply AS NIS 2000 UT 730 19200 2960 570 316.7 218.4 Sept. 07 Petrobras 3 FAR SANTANA Farstad Supply AS NIS 1999 UT 741 27400 4400 680 x N x 368.3 164.3 June 04 EMC 4 FAR SOVEREIGN Farstad Supply AS NOR 1998 UT 722 L 18000 2900 585 x N x 276.7 135.4 Spot 5 FAR SENIOR Farstad Supply AS NIS 1997 UT 722 16800 2750 540 260.0 114.0 Sept. 02 Petrobras 6 FAR SAILOR Farstad Supply AS NOR 1993 UT 722 14400 2400 570 x FIFI II N x 201.7 81.7 Nov. 05 Norske Shell 7 FAR FOSNA Farstad Supply AS NOR 1993 UT 722 14400 2400 570 x FIFI II N x 201.7 81.7 Aug. 03 + opt. Norsk Hydro 8 FAR GRIP Farstad Supply AS NIS 1983 ME 303 13040 2050 476 x FIFI II x 103.3 31.0 March 04 Petrobras 9 FAR CRUSADER Farstad Supply AS IOM 1983 ME 303 13040 2050 476 x FIFI II UK 103.3 9.5 Aug. 04 Petrobras 10 FAR CENTURION Farstad Supply AS IOM 1980 UT 708 10560 2010 459 FIFI II N x 79.2 7.5 March 03/Spot HM Coastguard 11 FAR TURBOT IOS (50%) iii) - 2003 UT 712 12800 2350 510 FIFI I 12 LADY TBN 1 IOS (50%) - 2003 UT 712 12800 2350 510 FIFI I 13 LADY TBN 2 IOS (50%) NIS 2001 UT 719-2 5500 1400 400 FIFI I 124.2 61.4 Oct. 06 + opt. Shell Philippines 14 LADY GURO IOS (50%) NIS 1993 ME 505 8850 2030 357 x 102.5 37.5 June 02 + opt. BP Vietnam 15 LADY MARGARET IOS (50%) NIS 1987 Hudong 9800 2060 402 x FIFI I 84.8 46.1 Feb. 03 Japan Vietnam Petroleum 16 LADY CYNTHIA IOS (50%) NIS 1987 Hudong 8400 2030 390 84.2 45.1 Sept 02 + opt. Hoang Long Joint Operating Co. 17 LADY GERDA IOS (50%) NIS 1983 ME 303 12240 2280 467 x x 100.0 54.6 June 02 + opt. Shell Namibia 18 LADY AUDREY IOS (50%) NIS 1983 Amels 10560 2040 395 x FIFI I 83.5 45.7 June 02 Woodside 19 LADY ELAINE IOS (50%) NIS 1983 ME 303 12240 2350 481 x 100.0 54.6 June 02 Woodside 20 LADY VALISIA IOS (50%) NIS 1983 Bolsønes 12800 2110 484 x FIFI II 99.3 54.6 July 02 + opt. Bumi Armada 21 LADY DAWN IOS (50%) IOM 1991 ME 303 II 14400 1850 567 x N x 153.2 86.0 March 03/spot HM Coastguard 22 FAR SKY IOS (50%) NIS 1991 ME 303 II 13200 1750 567 x N x 156.7 86.0 June 03 Petrobras 23 FAR SEA iv) NIS 1998 KMAR 404 16100 2900 538 x FIFI I x 0 0 April 02 Shell Philippines 24 LADY SANDRA
Farstad Supply AS NOR 2001 UT 745 L 10800 4600 960 x x 219.2 153.0 May 07 + opt. Norsk Hydro 25 FAR SAGA ii) IOM 2001 UT 755 5460 3000 620 x 126.7 120.9 July 03 + opt. ASCo UK 26 FAR SCOTIA Farstad Supply AS IOM 2001 UT 745 L 10800 4600 960 x x 219.2 143.6 May 03 ASCo UK 27 FAR SWAN Farstad Supply AS NOR 1999 UT 745 9600 4300 900 x FIFI II N x 198.3 78.8 Aug. 09 + opt. Norsk Hydro 28 FAR STAR Farstad Supply AS IOM 1999 VS 483 6700 4070 902 x 182.5 123.1 Nov. 04 + opt. BP Norge 29 FAR SUPPLIER Farstad Supply AS IOM 1999 VS 483 6700 4070 902 x 182.5 122.0 Jan. 04 + opt. Amerada Hess UK 30 FAR STRIDER Farstad Supply AS IOM 1996 UT 750 7200 4490 965 x 169.2 68.4 March 05 ASCo UK 31 FAR SUPPORTER Farstad Supply AS IOM 1995 UT 745 7200 4680 965 x 169.2 65.8 Dec. 05 ASCo UK 32 FAR SERVICE Farstad Supply AS IOM 1991 UT 705 6600 3000 868 x 119.2 14.0 Dec. 05 ASCo UK 33 FAR SERVER Farstad Supply AS NOR 1991 UT 705 6600 3000 868 x N 119.2 36.9 April 05 + opt. Norsk Hydro 34 FAR SCANDIA Farstad Supply AS IOM 1990 UT 705 L 6600 3600 1016 x 123.2 36.2 Dec. 03 + opt. Norsk Hydro/Amerada Hess UK 35 FAR SUPERIOR Farstad Supply AS NOR 1983 UT 706 L 6120 3330 780 x 80.2 24.6 May 02 Saipem 36 FAR GRIMSHADER Farstad Supply AS IOM 1982 ME 202 6760 2900 540 x 66.7 7.1 April 04 + opt. Phillips Australia 37 FAR SCOTSMAN Farstad Supply AS NIS 1984 ME 202 5250 2980 615 x 67.7 7.4 Nov. 06 Petrobras 38 FAR SLEIPNER Farstad Supply AS NOR 1983 UT 706 6120 2510 630 x FIFI I N x 70.0 23.8 Nov. 04 + opt. BP Norge 39 FAR SPIRIT Farstad Supply AS NOR 1982 H/R omb. 3400 1540 250 x FIFI I N 39.3 4.5 Dec. 03 BP Norge 40 FAR SUN Farstad Supply AS IOM 1982 H/R 3400 1540 395 x 30.0 10.7 March 04 Petrobras 41 FAR VISCOUNT IOS (50%) IOM 2002 UT 755 5460 3000 620 FIFI I - - May 09 Woodside 42 LADY GRACE IOS (50%) NIS 1985 ME 202 2406 2500 475 74.2 35.8 April 09 + opt. Woodside 43 LADY CHRISTINE IOS (50%) NIS 1983 ME 202 5160 3000 620 x 66.7 37.5 Oct. 03 Esso 44 LADY ELIZABETH IOS (50%) NIS 1982 ME 202 6960 2970 612 x 66.7 37.5 Oct. 03 Esso 45 LADY KARI-ANN
i) IOM = Isle of Manii) On a 6 years bareboat charterparty to Farstad Shipping Ltd.iii) P/R International Offshore Services ANSiv) The vessel is chartered by IOS on a 5 years bareboat charterparty.
vii) Certain freight contracts contain clauses which give the charterer the right to cancel the contracts.
v) The vessels debt is shown on a 100% basis.vi) The estimate of market value is based on an average of three independent broker's estimate of the vessels' value (free of charter) at the year end of 2001.
P S V - P L A T F O R M S U P P L Y V E S S E L
A H T S - A N C H O R H A N D L I N G / T U G / S U P P L Y C O N T R A C T O V E R V I E W A T 2 5 . 0 3 . 0 2
C O N T R A C T O V E R V I E W A T 2 5 . 0 3 . 0 2
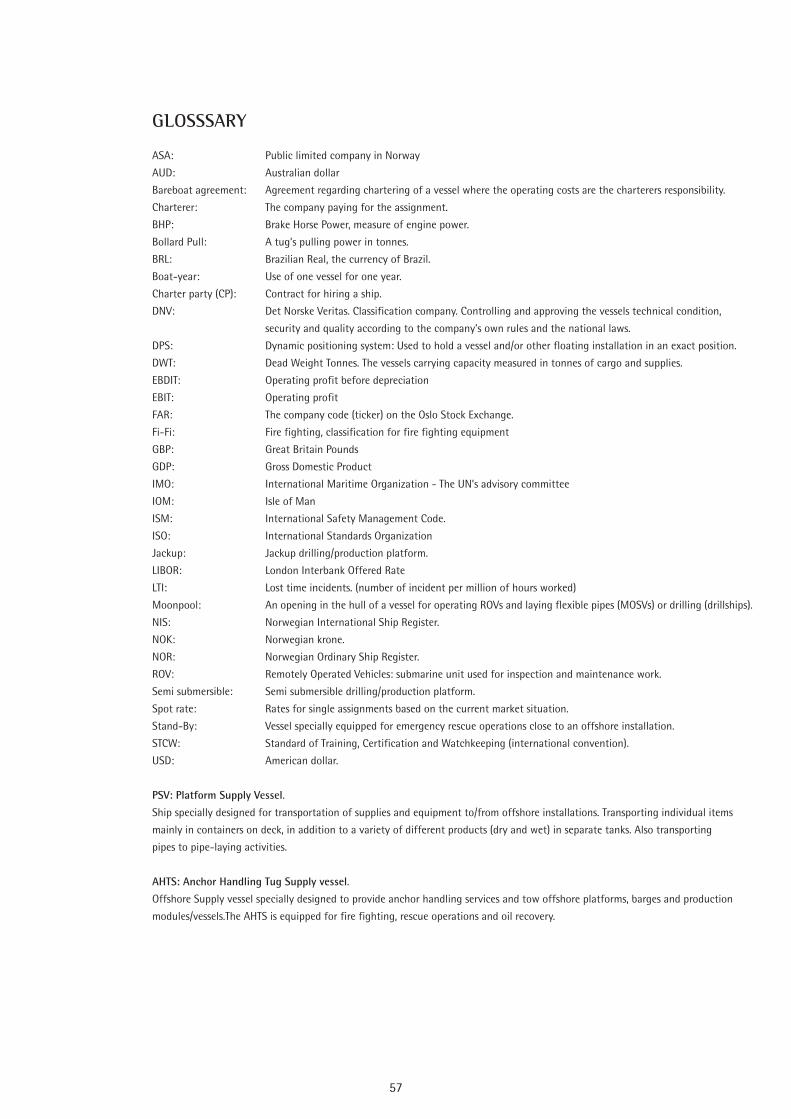
57
ASA: Public limited company in Norway
AUD: Australian dollar
Bareboat agreement: Agreement regarding chartering of a vessel where the operating costs are the charterers responsibility.
Charterer: The company paying for the assignment.
BHP: Brake Horse Power, measure of engine power.
Bollard Pull: A tug’s pulling power in tonnes.
BRL: Brazilian Real, the currency of Brazil.
Boat-year: Use of one vessel for one year.
Charter party (CP): Contract for hiring a ship.
DNV: Det Norske Veritas. Classification company. Controlling and approving the vessels technical condition,
security and quality according to the company’s own rules and the national laws.
DPS: Dynamic positioning system: Used to hold a vessel and/or other floating installation in an exact position.
DWT: Dead Weight Tonnes. The vessels carrying capacity measured in tonnes of cargo and supplies.
EBDIT: Operating profit before depreciation
EBIT: Operating profit
FAR: The company code (ticker) on the Oslo Stock Exchange.
Fi-Fi: Fire fighting, classification for fire fighting equipment
GBP: Great Britain Pounds
GDP: Gross Domestic Product
IMO: International Maritime Organization - The UN’s advisory committee
IOM: Isle of Man
ISM: International Safety Management Code.
ISO: International Standards Organization
Jackup: Jackup drilling/production platform.
LIBOR: London Interbank Offered Rate
LTI: Lost time incidents. (number of incident per million of hours worked)
Moonpool: An opening in the hull of a vessel for operating ROVs and laying flexible pipes (MOSVs) or drilling (drillships).
NIS: Norwegian International Ship Register.
NOK: Norwegian krone.
NOR: Norwegian Ordinary Ship Register.
ROV: Remotely Operated Vehicles: submarine unit used for inspection and maintenance work.
Semi submersible: Semi submersible drilling/production platform.
Spot rate: Rates for single assignments based on the current market situation.
Stand-By: Vessel specially equipped for emergency rescue operations close to an offshore installation.
STCW: Standard of Training, Certification and Watchkeeping (international convention).
USD: American dollar.
PSV: Platform Supply Vessel.
Ship specially designed for transportation of supplies and equipment to/from offshore installations. Transporting individual items
mainly in containers on deck, in addition to a variety of different products (dry and wet) in separate tanks. Also transporting
pipes to pipe-laying activities.
AHTS: Anchor Handling Tug Supply vessel.
Offshore Supply vessel specially designed to provide anchor handling services and tow offshore platforms, barges and production
modules/vessels.The AHTS is equipped for fire fighting, rescue operations and oil recovery.
GLOSSSARY

FARSTAD SHIPPING ASAP.O.Box 1301, 6001 Ålesund, Notenesgt.14, NorgeTel: +47 70 12 44 60 - Fax: +47 70 12 85 30 - http://www.farstad.no - e-mail: [email protected]
FARSTAD SHIPPING LTD.Farstad House, Badentoy Avenue, Badentoy Park, Portlethen, Aberdeen AB12 4YB, Scotland Tel: +44 1 224 784 000 - Fax: +44 1 224 783 340 - e-mail: [email protected]
IOS (P/R INTERNATIONAL OFFSHORE SERVICES ANS)c/o P&O Maritime Services Pty Ltd., GPO Box 88 A, Melbourne, 3001, 99 Queensbridge Street, Southbank, Victoria, 3006Tel: +61 3 9254 1666 - Fax: +61 3 9686 9268 -e-mail: [email protected]
BOS NAVEGAÇÃO LTDA (BRAZIL OFFSHORE SERVICES)Rua Abilio Moreira de Miranda, 606 Parque Valentina Miranda, CEP 27915-250 Macae - RJ, BrasilTel: +55 22 2762 1959 - Fax: +55 22 2762 0593 - e-mail: [email protected]