Farm Equipment Prices, Margins, and Related...
22
' 919052 : I. I I r fARM EQUIPMENT PRICES, MARGINS, AND. RELATED l , I: MARKETING COSTS:J I': Leland Southard I l \ Property 01 t.merican Agricultural EconomicS . Documentation Ccnle! DE.C 2.1 j978 r " u.s. Department of Agriculture " r' f . Economics, Statistics, and Cooperatives Service , r "
Transcript of Farm Equipment Prices, Margins, and Related...
I
919052 I
I I
rfARM EQUIPMENT PRICES MARGINS AND RELATEDl
I MARKETING COSTSJ
I Leland Southard
I l
Property 01 tmerican Agricultural EconomicS
Documentation Ccnle
DEC 21 j978
r
us Department of Agriculture r f Economics Statistics and Cooperatives Service j
r
BIBLIOGRAPHIC DATA 11 R~pon No r2ESCS-28 3p~cip~nt~7 ~cOeibot9degS SHEET
4 Tide a-rid Subtitle - 5 ReDan Date
October 1978FARM EQUIPMENT PRICES middotMARGINSbull AND RELATED MARKETING COSTS
6 ~
7 Aiuhor(s) 8 -PerforminJt OrgaZisectation Rep_t Leland Southard No SC shy
9 Pe-rforming Organization Name andAddress 10 ProjectTa~kWork UnillNo~ Natiltn~l Eco-noinic Analysis Division Economics Stattstics and Cooperatives Service 11 Conrrac[Grllnt No
U S Depart~ent of ~griculture
~ashington DC 20250 12 Sponsoring OrganizationName a-nd Address 13 Type DC Report amp Period
Covered
Final--197277
14
15 ~upplementari Notes
16 Abs-tracts
Farm equipment prices rose 83 percent compared to 65 percent for all production items-during 1972-77 Increases in dealer costs the largest component of prices paid accaunted for 81 percent f th_e increase accarding to data collected from farm equipment dealers Price increases were particular~y s1arp during 1973-75 with sale prices increasing 42 percentbull Dealer margins were the second largest component of prices paid accounting for another 12 percent Dealer margins avera-ged 143 percent of the sale price
17 KeyWorassnd Docu~ent Analysis 170 Descriptors
Agricultural machinery Tractors Cost analy-sis Economic anatysis EquIpment Expenses Farms Machi~ery Marketing
Prices Sales
17b IdentifiersOpenmiddotEnded Terms
Combines Dealer costs Farm equipment 22 Cilrrent NTISPriCes Margins Paper $400
Fiche $300 NTIS pr~ces subject to change_ NTIS price codes will be A02
17lt COSATlFieldGroup 02-B 13-F 13-G 13-I for paper and AOl for fiche 18 A vai [s bi liey Staeement 19 e-cui-ity Clas-s (This 21 No oLPages
Availalle from NATIONAL TECHNICAL INFORMATION Re~~~~ oqFIEn 23 SERVICE 5285 Port Royal Rd bull 20 Security Clas-s (This 22 PriceSpringfield VA 22161
Page See aboveUNCLASSIFIED FORM NTISo31 lREV 10-7l) ENOORSEO BY ANSI AND UNESCO THIS FORM MAY BE REPRODUCED USCOMMmiddotOC 82t5-P7~
CONTENTS
Page
iv SUMMARY
t 1INTRODUCTION
5I COMPONENTS OF FARM EQUIPMENT PRICE INCREASES
6PRICES AND MARKETING COSTS 6
Tractors 8 Combines 10Forage Equipment 10Tillage Equipment 11 O~her Equipment
11OPTIONAl EQUIPMENT PURCHASES AND COSTS 12i Frequency of Purchase 13Costs
17FACTORS AFFECTING PRICES AND MARGINS 17
Supply and Demand Conditions 17 Dealer ~~rgins 18 Appraisal- of Trape-ins
-
October 1978 Washington DC 20250
iii
Sill1MARY
Farm equ~pment prices rose 83 percent compared to 65 percent middotfor all production items during1972-77 Moreover farm equipment prices increaseo twice as much as the general price level as measured by the GNP Implicit price de-flator This report examines farm equipment dealer costs and profit mar~ins -to heip understand these rapidly rising prices
Price incr-eases for farm machiI~ery were particularly sharp during 197375 wIth sale price-s increasIng 42 percent About 83 percent of the pri_ce increase reflected a 44-percent jump in wholesale prices paid by farm equipment dealers to manufacturers The sharp incre9-se in manufac turerS I prices reflected a s_urge in demand for equipment and a subsequent shortage of c~iticiil IDterials- and certain component parts Increased sales and prices of farm machinery during 197-3-75 suggest a high correlation between levels of farm income and farm equipment demand Longer range inffationary forces however have continued to push prices of farm machinery higher in spite of the decline in farm income and demand since 1974
Dealer margins which increased 39 percent during 1973-75 accounted for 12 pershycent of the rise ih farn equipment prices and reflected increases in the cost of do~ng business Dealer margins also appear~d to be affected by chang~s in supply and demand conditions increasi1jg as a percentage of sales prices from 141 percent in 1973 to 149 percent in 1974 but declining to 138 percent in 1975 as suppIy increased
Increases in fr~ight setup and delivery charges accounted for the remaining 5 percent of the price increases Freight charges increased 45 percent due to higher rates increased weights and distances hauled setup and delivery costs went up ~4 percent during the period
Prices pai~ by- dealers to manufacturers (dealer cost) made up the largest component of sales prices averaging 81 percent for all equipment during ~he 3year period 1973-75 Hargins of equipment dealers were the secoI)d largest compone~t averaging ~4 percent of the sales price Freight charges and setup and delivery cost accounted for 3 percent and 2 percent of the selling price respectively
Optional equipIl~nt was purchaseCl more frequently on -large than on small units In 1975 optional equipment a~ a percentage of sales price ranged from 13 percent for large tractors to 4 percent for small tractors
~
iv
- bullbullbull ~ ~ ~ gtIun 0 Jgtti(ti-LIS 1-SHEET I PB 2 g7 06 is
~ Title and Subtitle Sbull Report Date
September 1978FARM EQUIPMENT PRICES MARGINS AND RELATED MARKETING COSTS 6
7 Author(s) 8 PcrformiE OrsectanizacioD ReptoLeland Southard No SC -28
9 Performing Organization Name and Address 10 ProjectTaskWork Unit No National Economic Analysis Division bullEconomics Statistics and Cooperatives Service 11 CODtraCtGrane No US Department of Agriculture
I
Washington D C 20250 I
12 Sponsoring Organization ~ame and Address 13 Type of Repon amp Period Covered
Final--197277
14
15 Supplementary Notes
16 Abstracts bull
Farm equipment prices rose 83 percent compared to 65 percent for all production items during 1972-77 bull Increases in dealer costs the largest component of prices paid accounted for 81 percent of the increase according to data collected from farm equipment dealers Price increases were particularly sharp during 1973-75 with sale prices increasing 42 percent Dealer margins were the second largest component of prices paid accounting for another 12 percent Dealer margins averaged l43middotpercent of the sale price
~1a) A2~~ AG~3pound 1-11 EgtfScyS U S J)~~ ~n( E~n Sfa1 CQ)i)
~-ery 17 Key Words and Document Analysis n7a Destripcors
AgaetllttHsl machin-eiY Tractors Cost analysis -Economic analysis Equipment FT asEs
Farms Machinery Marketing
Prices
Sales 17b IdentifiersOpen~Eilded Terms
Coli) i7lS -~e ~eI ~ 22 Current NTIS Pricesfaj~q i nt M~ g s Paper $tbullbull ro
Fiche $3~0
NTIS prices subject to change NTIS price codes ill be A02
17 c C0S T FieJ (~~Op 02-R 13-F l3-G IJ-I for ar(r ond VJl ro1 fich~
Available from NATIONAL TECHNICAL INFORNATION 23 20 S(clrry Cbss (This 22 PrinSERVICE 5285 Port Koyal Rd Springfie1d VA 22161
rlt1fe See aboveI~CLA)rFlrD
TillS Ol~l ~iS 8~ REPrWDliCED USCOtmiddotmiddotlC e2(j~74
FARM EQUIPMENT PRICESj
MARGINS AND RELATED
MARKETING COSTS
by Leland Southard
INTRODUCTION
Prices paid for farm equipment have been increasing Jaster than for all farm
During 1972-77 farm eq~ipment pri7esrose 83 percent while pricespioduction items
Moreover farm equipment--prices~or all production items rose 65 percent (table 1)
increased twice as mucl1 as the general price level as measured hy the GNP i~plicit
price deflator (fig 1)
The rapid rise in farm equipment prices followed sharp increas~s in farm prices
Farm prices for all agricultural Poducts rose 54and incomes in 1973 and 1974
percent during 1972-74 but have declined slighlly since that time 1rlhile farm
equipment prices continued to ri_se
Largely as the result of rising prices farm eq~ipment expenditures rose from
$46 billion in i972 fo $73 billion in 1977 These expenditures hae averaged io
percent of total production costs For farm operations such as wheat farming
however equipmen_t ownership charges account for about one-third a f total production
costs
Fann equipment de-aler costs and margins w~re examined to better understand
the~e rapidly rls-ing prices and e~penditures--Phis informltion may be useful to
farmers in dlscussing purchases withJa~achinery dea_lers and to the farm equipment
indust-ry _in deve-loping_ pr_od~on-and ma~keting pIan-s The findings will aid
government and universitmiddoty-researchers in analyses of the fact9rs associated with
higher fam machiilerY prices ~
f Data for the study wer-e obtained by surveying 230 -~arm equipmeD-t dealers in 25
leading agricultural States during April-May of 1974 1975 and 1976 (blc~)
These Sta_tes accounted for about 75 perc-ent of unit _sales of middottractors over 35 horseshy
power The number of dealers surveyed per State was based _on the distribution of
The respondents were chosen randomly from a-tracenttor sales among the 25 States
commercial list of all farm machinery dealers~
The author is an economist National Economic Analysis Divis-ion Economics
Statistics and Cooperatives Service US Department of Agriculture
1
Prices paid by farmers for farm eqoipmentprices received for farm products and implicitprice deflator 1968-77 of 1967
225
Prices200 received 4It liltN ~ c
175 I 1
I -15()
I
bullbullbullbullbullbullbullbullbull ImplicitI bullbullbullbull price
I deflator
125
100~~-L----~--~-----L----~--~----~--~~--~1968 1971 1974 1977
Figure 1
-~-- --~-- - ~- shy------ ---~ - --shy
w u
Table I--ECpenditures for- far-m equipment and all
equipment and price indxes production items 1972-77
of farm
Expenditures Tractors
Prices
Year Tractors
Other farm equipment
Total and self-propelled
Other equipment
All production items
equipment
-----------_~---- Million dollars ------------------------1967 ~ 100
1972 1418 3231 4649 128 130 121
1973 1923 4581 6504 137 139 146
1974 2236 4790 7026 161 159 166
1975 2460 4320 7280 195 197 132
1976 2720 4930 7650 217 225 193
1977 2883P 4880P 1 7763 234 238 200
JJ Prelim~_Ilary
Source Fann Income Statistics ESCS 1973-77 for expenditures for farm equipment Agricultural Prices for indexes (B9th published by the Economics Statistics and Cooperatives Service US Department of Agri_culture)
Table 2--~umper of respondents per State J farm tractor and eqiJipment price survey 1973-75
1 State Number of respondents
Alabama 6 Arkansas 7 California 6 Georgia 7 Illinois 16
Indiana 11 Iowa 17 Kansas 10 Kentucky 7 Louisiana 5
Michigan 8 Minnesota 14 Mssissippi 7 Missouri 11 Nebraska 11
New York 8 North Carolina 9 North Dakota 6 Ohio 11 Oklahoma 6
Pennsylvania 8 Tennessee 7 Texas 17 Virginia 5
TJiscorisin 10
25-State total 230
Data were obtained on 5 sizes of tractors 2 slzes of combines a-nd 19 other equipment items ~lthough the enllmerators collected data on the last three transshyactions from -the time of the visit the data probably re~lect prices and margins charged dur~ng the latter part of calendar years 197-3 19-7~ and 1975 th~re m-ay have been a time lag of up to 6 months between the ordering of a tractor or combine and the delivery -of -the machine to the farm D~ta f9r only 12 othe~_ equipment items ae reported due to their small incidence of purchase-s Dealers were ~skea to give the following informatiof on the middotlast t~ree transactions
1 Dealer cost--price paid by the dealer to the manufacturer or wholesaler for the item including all optional equipm~nt installed at the factory
2 Suggested retail price--the list price set by the manufacturer or the mariuJacturerl s suggested -retail price including all factory-ins tailed options but excluding dealer-instal1e-d options
3 Freigh~ charges--transportation cha-rges foT moving the item (rom manufa~turer or wholesaler to the dealer
4 Setup ~nd delivery charges--charges made by dealer to set up and deliver the item to tne farm sometimes known as a dealer preparation charge
5 Actual sales price--the amount of money paid by the farmer f_or the item including freight and setup and deImiddotivery charges but excluding State sales taxes If a tradein were involved the actual sales price -Jas determined by reducilg ~he suggested retaii price by any net overallowance--the dif~erence betwee1 the tradein allowance and the net sales value of the item after it was reconditioned Fqllowing is an example illustrating how the ~ctual sales price was derived when a trade-in was involved
a Retail price of a tractor including all options freight and dealer preparation _ ~- $15000
b Trade-in allowance $ 5000 c Purchas~rs cash outlay _ $10000 d Cost of reconditioning or repair of trade-in $ 300 e Actual or expected sale price qf ~rade-in _ ~ ~300 f Net expected sale of trade-in (item e Tlinus item d) - $ -))00 g Dealers net overallowance on t-rade-in (item b minus item f) bull $ 2000 n Actual sale price (item a minus item g) $13000
COMPONENTS OF FARN EQUIP~ENT PRICE INCREASES
Actual prices paid fcir farm equipment were broken down i[lto dealer cOfts freight charges setup and delivery charges and dealer margins_ to determine the factors responsible for incrt=ases in farm machinery prices Dealer margin equals the difference between the dealer price (what the dealer pays to the manufacturer) and sale price
De~ler costs or prices paid to the manufaeturer averaged 81 percent of total retail sales prices ~or all equipment over the 3-year per~od Margins of equipment deal~(s were the sec_and largest cost component averaging 14 percerit of retail sale_s l
prices Between the two other costs freight clia_rges averaged 3 percent of selling price and set~p and delivery charges averageq 2 percent over the ]year period
Based on the cost data collected from dealers most of the increase in the selling prices of farm equipment during 1973-75 reflected ri~ing dealer costs Of the 42shypercent incre~se in actual sales prices dealer costs accounted for 35 percentage paints 0pound t~e increase dealer margins 5 percentage points and freight and middotset1lp and delivey charges for 2 percentage points Dea-ler costs for farm equipmen~ increased an average of 44 percent during 1973-75 slightly more than re~~_il sales prices (table 3) Costs for nonpower~d equipment rose- 51 percent compared to 4-0 percent for powered equipment Among equipment purchased increases in deaier costs ranged from 33 percent for mefti~m tractors to ~2 percent for til_lag-e impl~ment~
Dealer margins representing salaries and commission-s of salesper~ons and other costs of operating a d~alership ro~e 39 percent during 197]-75--a1so slightly less than farm equi-pment prices Margins on powered equipment rose 43 percent compared with 34 p_e~rcent for nonpowered equipment Increases in margins v~ried widely among groups ranging from 6 penent for forage equipment to 73 perce~t for combines
5
Table 3-Inc-rease in fam machinery prices dealer costs Ilargins and other charges 193-75
Actual Se~upandDeare~ Frefght De-alerItem sale deliverycosts charges maginsprices charges
Percent
All farm equipme_nt 41 8 442 450 338 393
Powered equipment 401 399 453 305 427
Small tractors 370 418 44 7 240 11 2 Medium tractors 331 332 325 294 324 Large ~rac to~s 452 460 679 255 394 Combines 474 435 529 366 72 9
Nonpowered equipment 446 513 444 392 337
Forage equipment 315 360 479 293 60 Tillage equipment 582 621 51 7 509 421 Other equipment 396 389 320 337 487
Dealer margins for farm equipment d~~lined slightly as -~ percentage of ~ctual sale prices In 1975 ma~giri-s -averaged 138 percent of sale pr_ices compared with 149 percent tn 1974 and 141 percent in 1973 Margins on all three tractor siz-es and most equipment were slightly lower in 19i5 than in 1973 or 1974 (table 4)
Over the 3 years- freight charges for frm equipment in~reased 44 percertt Increases occurred uniformly on all equipment types (table 5)
Dealer charges (or setup and delfvery increased 34 percent during 1973-75 the smallest cost increas-e Most of the increase occurred during 1973-74 (table 5) Dealer s-harges for powerid equ~pment incpeased 31 percent in the 3-year period compared with 39 perc~nt fbi -nonpowered equipment
PRICES AND MARKETING COSTS
The suryey covered prices and costs for 19 items of P9wered and nOfpowered equipment The powered equip~ent included smll medium an-d large tractors and combines includ_ing cornheads for combines whil_e the -nonpowered equipment included forage tillage a~d other equipment
Tractors
During 1973-75 tractor prices rose 36 percent compared to lj2 percent for all farm equipment Price -increases ranged from 3~ percent for medium tractors to 52 perceurol)t for the large~t sized tractors- (table 6) Stronger demand and a tighter supply along with improved quality largely explain why prices increased mOre fot the largest -sized tractors than for others
6
Table 4--Farm equipment dealer margins for equipment by group and ~i tein 1973-75
J-yearHeightItem 1
1973 1974
1975 average
Percent
138 143All (arm equipment 100 141 149
14 0 142Powered equip-ment 62 138 147
Small tractor IS 149 124 122 112
8 147 129 115 1303~-49 hp50-69 hp 7 152 11 9 130 134
Medium tractor 70-99 hp 20 135 141 134 137
Large trac~o~s 4 141 168 135 148
100-129 hp 2 148 168 137 151
130 and over hp 2 133 168 133 145
163 157 152Comb1n~s 23 135
Medillffi capacity 14 132 163 159 nl Large capacity 4 134 162 154 150
156 154Cornhead 5 142 163
134 144Nonpowered equipment 38 145 152
164 142 132 116Forage equipment 11 Forage harvester 4 158 149 146 151
Hayba1er 3 178 142 125 148
Haunted mower 3 157 134 126 119
Hay rake 1 163 142 116 140
14 8 157 133 ll6Tillage equipmeIt 15
147 135 141
Mo1dboardplow 4 14 9 14 5 127 142_
Gang harrow 4 154
137 l56Corn planter 5 152 179
129 133~ultivator 2 123 146
128 154 137 140Other equipql_en t 12 143
Manure spreader 2 136 168 126
Front-end loader 5 130 153 136 140
5 123 1-50 i41 138Pow_er -forage wagon
-J) Heights were taken from the Indexes of Prices Paid bl Farmers I ESCS with some
changes
7
I
Table 5-~Indexes of freight charges and setup and delivery charges for farm equipment by major categories 1974-75
Freight Setup and Item charges delivery charges
1974 1975 1974 1975
i973 100
All farm equipment 122 145 126 134 Powered 120 145 125 131 Noripo~ered 125 144 128 139
Most of the increases in tractor prices reflected -increases in the manuEacturers I prices Dealer cost- increases were about the same as the increases in sales prices Increases in dealer costs accounted for about 87 percent of t~actor price increases
Dealer margins varied widely ~ong tractor sizes Margins for small tractors rose an average of 11 percent during 1973-75 which was consideratily less than tractor prices and other costs Dealers may thus have been trying to increase saleS of these tractors
In contrast dealer margins for the largest sized tractor rose 51 percent during 1973-75 which in part accounted for the relatively 1ar3e increase in themiddot prices of these tractors Dealers faced with strong demand and a tight supply of these tractors increased their margin by the same perceqtage that the manufacturers increase~ their prices
Increases in freight charges also varied wide1y among tractor si~esl ~anging fror 32 percent formedium tractors tO 98 percent for the largest size The relatively large increase for large tractors was due to increases in the weights of these tractors and the av~rage distances shipped from man-ufacturers to dealers
Setup an4 delivery charges increased the most uniform amount among tractor sizes during 1973-75 Increases averaged 27 percent the $mallest rise among the components of sale prices and only three-fourths ~smuch as tract0~ prices
Combines
Sale prices of medium and large combines increased an average of 52 percent during this period (table 7) Dealer costs accounted for about three-fourths the increase a slightly smaller ~ontribution than to price increases of tractors An increase of over 80 percent in dealer margins accounted for a fitth of the sale price increase Dealer margins for combines and cornheads averaged 152 percent of sales prices over the 3-year period or about 2 percentage points higher than for tractors
J
8
Table 6--Average-prices and marketing sharges for small medium an~
lar-ge tractors 1973~75
Item 1973
Small tractors 35-49 hp Actual sale pr-ice 4934 Freight 124 SetiJp and delivery charges 81 Dealer -cost 4002
Dealer margin 727
Small tractors 50-69 hp Actual sale price 7044 Freight 143 Setup and delivery charges 92 Dealer cost 5735 Dealer margin 1074
Medium tractors 70-99 hp Ac tual sale price 10099 Freight 194 Setup and deliverymiddot charges 109 Dealer cost 8435 Dealer margin 1361
Large tractors 100~129 hp Actual sale price 13289 freight 240 S_etup and delivery charges 130 Dealer cost 10951 Dealer margin 1968
Large tactors 130 and over hp Ac t uaI sale price 17445 Freight 291 Setup and delivery charges 154 Dealer cost 14676 Dealer margin 2324
~bull
1974
Dollars
5770 147
83 4792
745
8346 178 103
7070 995
12162 209
13p 10107
1716
17058 iiI 148
13774 2865
23709 356 185
19196 3972
1975
6808 180
99 5749
780
9572 206 116
8007 1243
13437 257 141
11237 1802
18443 331 161
15432 2519
26444 576 196
2167 3505
Change 1973-75
Percent
38 45 22 44
7
36 44 26 40 16
33 32 29 33 32
39 38 24 41 28
52 98 27 51 51
9
Tabie 7--Average prices and lllarketing charges for combines and comheads 1973-75
ChangeItem 1973 1974 1975 1973~75
Dollars ------------- Percent------~~--------
Medium combines Actual sale price 17 420 23424 25~84 49 Freight 313 391 434 39 Setup anddeliverycharges 255 165 345 35 Dealer Cost 14531 i8858 20987 44 Dealer margin 2303 3ino 4118 79
Large comoinesi Actual sale pdce 22425 3i045 36676 64 Freight 366 500 6Ql 64 Setup and delivery charges 267 427 406 52 Dealer cost 18796 25095 30005 60 Dealer margin 2996 5023 5664 89
Comhead -Actual sale price 4866 6002 6369 31 Freight 91 132 149 64 Setup and delivetycharges 82 103 105 28 Dealer cost 4001 4787 5121 28 Dea1ermargin 692 980 994 44
Fatase Eguiement
Prices paid by farmers for fotage equ~pment increased an average of 32 percent during 1973-75~ the smallest price increase among subgroups of farm eq~ipnient (table 8) Price increases were largest for hay rakes and lowest for forape narvesiers Risingmiddot dea1er costs accouDted ~for 89 percent of the price increase for forage equipment Freight setup anddelivery charges accounted for 7 percent of the increase and dede margins for the remaining 4 percent
Dealer margins for liay balers and hay rakesdec1ined during this period Margins for forage equipment averaged 146 percent of sale pri~es for the) years
Tillage Equiement
5les prices of tUlage equipment increased an average of58 percent during 1973-75 (table 9) Dealer coSts increased 62 percent and accounted for 83 percent of t~e prlte 1~crea8e8 Increases in dealer m~rgin~s acc_ounf~d fOT 11 percent of the sales price i~crease and other charges middotfor tJte remailling 6 percent
iricreases in sales prices of middotc_orn planters and disk harrows ii2 times greater than the increases for cultivators and floldloardplows reflected the relatively greater increages in dedermiddot costs for thege first two types of tillage equipment
10
Table 8--Average prices and marketinp charges for forage equ~pment 1973-75
ChangeItem 1973 1974 1975 1973-75
----------------- Dollars ------------- Percent
Forage harvester Actual sale price 4585 5007 5716 25 Freight 102 125 140 37 Setup and delivery charges 85 98 107 26 Dealer cost 3672 4036 4637 26 Dealer margin 726 748 832 15
Hay baler Actual sale price 2898 3482 3956 37 Freight 86 116 125 45 Setup and delivery charges 69 79 91) 30 Dealer cost 2227 279~ 3245 46 Dealer margin 516 94 496 ~4
Mounted mower Actual sale price 784 992 I 1042 33 Freight 27 39 45 67 Setup and delivery charges 29 ]7 38 31 Dealer cost 605 783 828 37 Dealer margin 123 133 131 7
Hay rake Actual sale price 826 1007 1151 40 Freight 34 42 48 41 Setup and delivery charges 32 34 43 34 Dealer cost 650 783 928 43 Dealer margin 135 143 U4 -1
Other E9ui12ment
Sales prices of mRoure spreaders front-end loaders and forage wagonsrose an average of 40 percent during 1973-75 (table 10) Increases in dealer costs accounted for 77 percent of the price increase Margi~s contributed 16 percent and other charges the remaining 7 percent
OPTIONAL EQUIPMENT PURCHASES A~D COST
The optional equipment bought on tractors and combines varies widely due to weather crop and field conditions where the machine wi~l be operated There are many options and accessories available on these machines to improveperfor~ance protect the operator and improve working conditions Thes~ include weights roll bars (a frame to protect the operator) cabs heaters and air conditioners
11
Table ll--Tractor and combine optional equipment purchased as a percentage of units sold 1973-75
Item and optional equipment
Small tractors 3549 hp Power adjusted wheels Real we~ghts Front weights Auxiliary hydraulic controls Roll bar
Small tractors 50-69 hp Power adjusted wheels Rear weights Front weights Auxiliary hydraulic controls Roll bar
Medium t-rac tors 70-99 hp Power adjusted wheels Rear weights Front weights Auxiliary hydraulic controls Roll bar Cab Heater Air conditioner Dual Wheels
Large trac tors 120-129 hp Rear weights Front weights Auxiliary hydraulfc controls Cab Heater Air condHioner Dual wheels
Large tractors 130 and over hp Rear weights Front weights Auxiliary hydraulic controls Cab Heater Air conditioner Dual wheels
1973
27 21 26 44
6
41 34 40 71 5
28 53 72 84 10 33 29 21 15
59 78 89 60 54 42 33
36 65 94 81 73 65 51
1974
Percent
31 15 21
55 11
42 36 46 74 12
36 49 64 87 16 35 32 21 13
59 73 73 66 66 62 41
49 60 93 85 82 82 57
1975
37 27 29 64 i8
34 42 49 79 19
38 43 66 79 22 35 30 21 16
53 77 n 75 68 64 47
51 66 79 90 85 85 69
Continued-shy
14
Table ll--Tractor and combine optional equipment purchased as a percentage of units sold 1973-75--Continued
Item and optional equipment 1973
Medium combines Floating cutter bar 24 Automatic header height-control 69 Heater 69 Air conditIoner 27
Large combines Floating cutter bar 33 Automatic header height control 61 Heater 75 Air conditioner 50
1974
Percent
53 74 80 47
46 64 97 79
1975
50 60 84 57
52 66 88 82
15
Table 12--Dea1er coSts and sctual sale prices of selected optional equip~ent purcha~ed for tr~ctors and combines 19i375
1975 Actual Actual Actual
1973 1974
Dealer Dearer Dealer Item and optional equipment sale sale salecost cost c~st
price 1 price price 1 Dollars
Small tractors 35-49 hp Power adjusted wheels Rear weights
103 i6
120 89
117 103
1)4 118
111 111
126 126
Front weightE 80 93 103 U8 101 114 Auxiliary hydraulic controls 127 148 143 164 164 186 Roll bar 162 189 215 246 2j5 266
Small tT8~tors =shy 50-69 hp Power adjusted wheels 105 124 151 171 15A 182 aear weights 91 107 124 141 127 146 Front eights 97 114 127 144 127 146 Auxiliary hydraulic controls Roll bar
139 1 q2
164 il5
162 217
lA4 i69
17] 23j
199 iii
MediUm tractors 70-99 hp Power adjusted wheels 114 132 153 178 169 195
Relilr weights 117 129 135 middot157 154 US Front weights Auxiliary hydrauiic controls
126 151
146 175
1-77 183
206 213
179 188
206 iii
Roll bar 31Smiddot 368 289 336 333 384 Cab 1 Air conditioner
1226 492
1411 569
1-495 644
1740 750
1680 661
1941 763
~arge tractors 100-129 hp Rear weights Front weights Dual wheels Alixil1ary hydrau1c cOtLtrol~
Cab 21 All cond1tioner
115 151 674 170
1308 501
135 177 791 200
1536 588
183 204 AOl 229
l69 639
220 245 963 275
2037 768
207 i21 Po7] 207
1852 660
240 256
lO~6 240
2-146 765
Large tractors 130 and over Rear weights Front weights Dual whe~19 Auxiliary hydraulic controls
CabmiddotlI Air conditioner
127 161 784 175
1374 520
146 186 904 202
15BlI 600
187 218
1017 235 I i~6
648
225 262
1222 282 I
2099 i79
238 248
1102 212
l90~ 658
275 286
1271 245
2200 758
~d ium comb ine
Floating cutter bar Automatic header heigh_t Air co-nditio~er
con~r-l 704 266 547
812 307 63i
742 297 688
887 355 S22
889 341 767
1057 405 912
Lalge combine Floating cutter bar Automatic header heignt Air conditioner
control 640 259 535
739 299 618
759 303 648
905 361 713
949 359 744
1i2j 424 879
11 Actual sale price is estimated by mu1tip_1ying the dealer cost by the average yearly rna-rkup for the part~cu1ar siz_e of tractor or combine
1 Includes enclosed cab heater and air conditioner
16
FACTORS AFFECTING PRICES AND MARGINS
Price~ and margins of farm equipment are inpoundluen~ed by three factors supply and demand cond-itions costs of doing btIsiness and appraisal of trade-ins The first two factors can be measured quantitatively while evaluating the third is more subjective
Supply and Demand Conditions
Farm equipment sales tend to vary according to fluctuating farm income and d~~and for farm machinery When farm incomes rise demand usually increases as farme(s replace old equipment (previously postpned due to lack of income) or expana prod~ction capacity In the short run ~o~ever manufacturers are limited to thei~ a-biIity to respond to increas-es in demand Plant capacities and the availability of materials and component parts are fixed
The surge in foreign demin4 for US agricultural products in I 72 broifght higher prices for U S fa-rm produc ts These higher prices brougnt abou t a 6-percent increase
jn cropland acreage in 1973 which in turn required more middotfarm equipment Hith increased production farm income rose Net realized farm income in the United States which had iaqged between $11middot billion and $14 billion in the sixties rose to $178 billion in 1972 and to $299 billion the following yea Farm inc~me has ~ince geclined from the 1973 record level but has remained above $20 billion T1te de~a~d for farm machinery has likewise remained strong Production of farm equipIl)centnt in i
fact hit record levels if both 1973 and 1974 In 1974middot demand was so srong thatmiddot middotshipme~ts loere held down only by supply constrain~s All seen major producers experienced material and component middotshortagE~s in some cases severe Some manufacfurers found it necessary to allocate equipment p~rticularly tractors and combines to dealers
The mate~ial supply constraints of 1974 ineVitably resulted in pr~uction -cost pressurEs The largest cost increases stemmed from ~isirlg material prices particular~y for mechanical components ~nd iron a~d steel parts The prices of farm equipment increased to cover the higher costs and to provide manufacturers with higher profit tilaqjins t according to a study by the Council on Vage and Price Staility 1 While these higher profits have brought som~ expansion in capital- expenditure and production capacity of the farm equip~ent industry continued upward cost pressures have resulted in higher dealer Costs for farm equipment In view 8f the expansion in prod~cti9n capacity however cost pressures and thus prlce ~ncreases haye been milder than those of 1974 and 1975
Dealer Margins -
~ bull bull bull bull J I
Increased demand and limited supply lessened competi-tion among dealers anci r
margins widened in 1974 Dealer margins were the highest in 1974 (14 9 percenmiddott)middotmiddotwhen farm equipment demand increased and the fndustry was operating at full capac~ty Dealer margins in turn declined in 1975 as the supply increased lt
Dealer margins were also related to t1te costs Cf doiI1g business As shown by the data obtained from the National Farm and Pltwer Equipment Dealers Association (~all 13) th~ r~~e -in Cpera~itg margins in 1974 Bccompanied an increase in operating expenses Similarily operating margin and expenses declined in 1975
Margins for repair parts and service labor were more than dpublemiddot the margi~ for new equipment
] Executive Office of the Presiqent Council on Wage ~nd Price Stability Report ~o--n--Prioc=-e=-s=----for---Agricult=u-r-al---Ma-ch-i~n~eor~YLa~n~d-2Eclqleu-i~p~me2n~t~J May I9 7 6 p 21
17
Table l3--S_elected operating averages for all dealers 1973-75
Dealer margin 1 New e~uipment
Year margin Total Expenses )) Net profit middotY
Percent
le973 1153 1609 1278 331 1974 1492 1735 1361 374 1975 1343 1622 1329 292
3 -Dealer margins eJpenses and net profits reflect all operations of the firms includ-ing the parts and seryice departments
Source Farm Power and Equipment National Farm and Power Equipment Dealers Associati09- M~y -ssues- t974-76
Appraisal of Trade-ins
Since many farm equipment purchases inv-olye trade-ins the app-r~ised value of middottrade-i[ls may significantty raise or tower- dealer margins Competition within a market may larg-~ly govern- trade-in allowances If farm equipment dealers are competitive liberal trade-in allowances may be -used to attract new business However dealers must realize an adequate margin to mainta~in s-atfsfactory service since many farmers consider faetors other than price (such as the ayailability and quarity of parts and service) in their buying decisions
ltlU_ S GOVER1JME~T PRlNTUltlG OfFICE 1978 261~9blij I
18middot
UNITED STA TESDEPARTMENT OF AGRICULTURE POSTAQE ANO-FEESPAIO
WASHINGTON DC 202iO us DpoundfIAATMENTOF AGRicULTURE
AGR 101
THIRD CLASS
1 1
I j
1 1
I
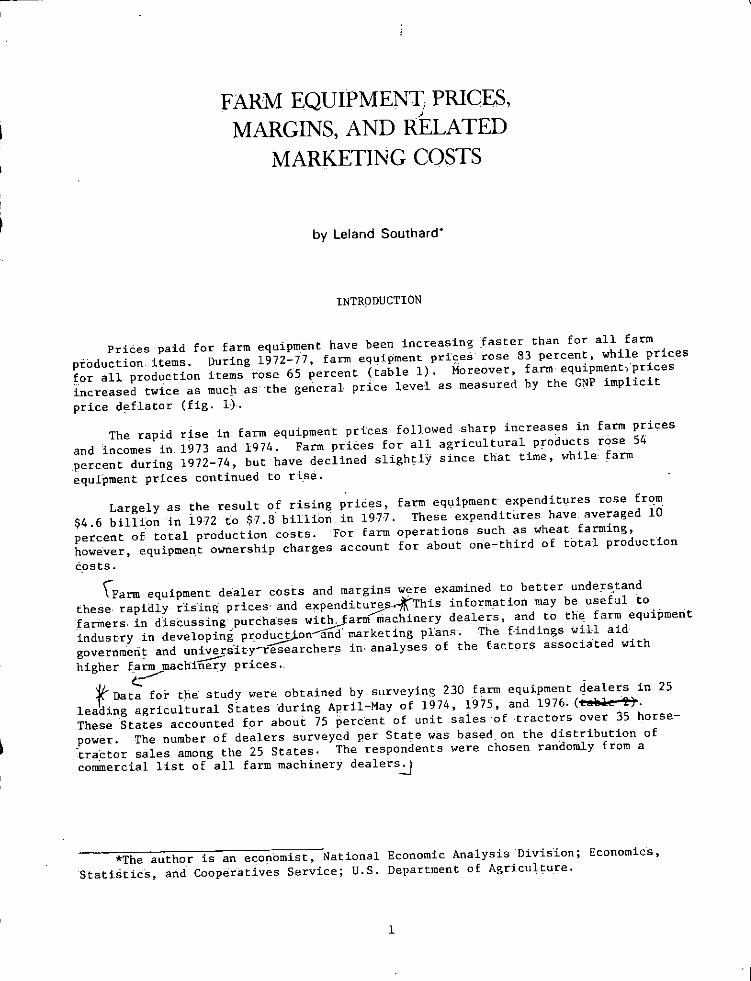
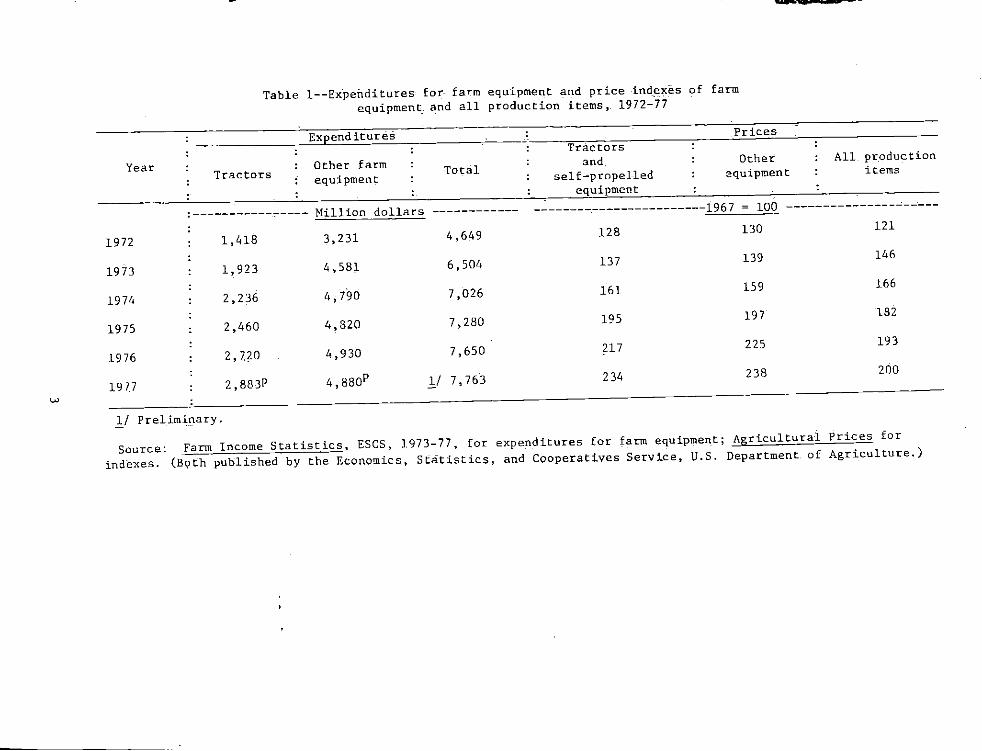
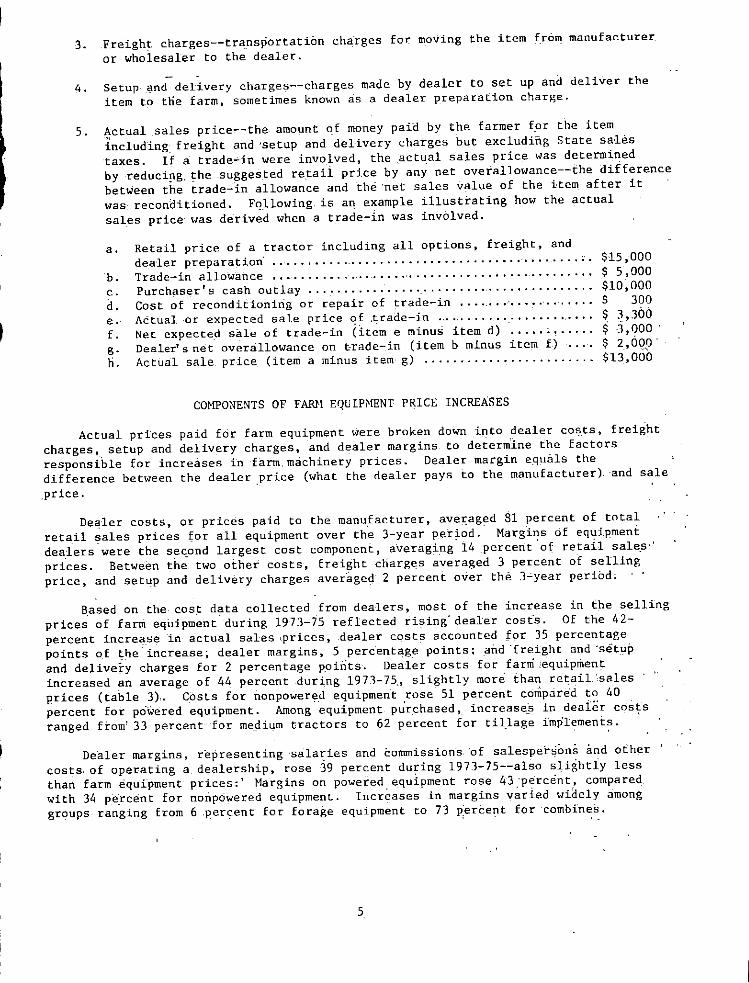
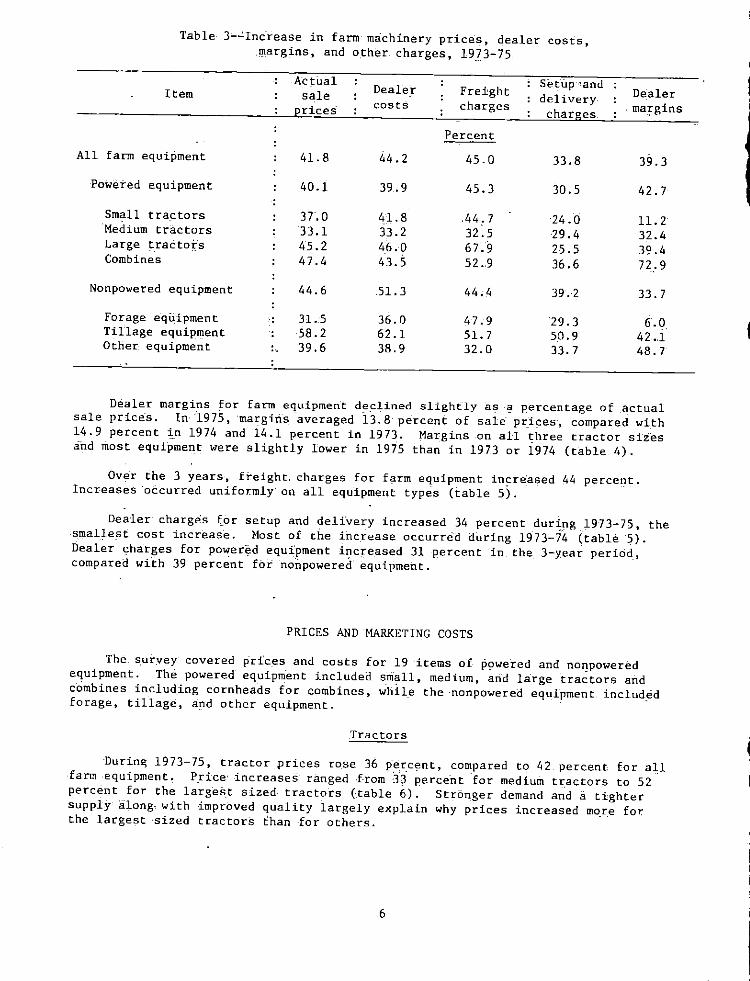
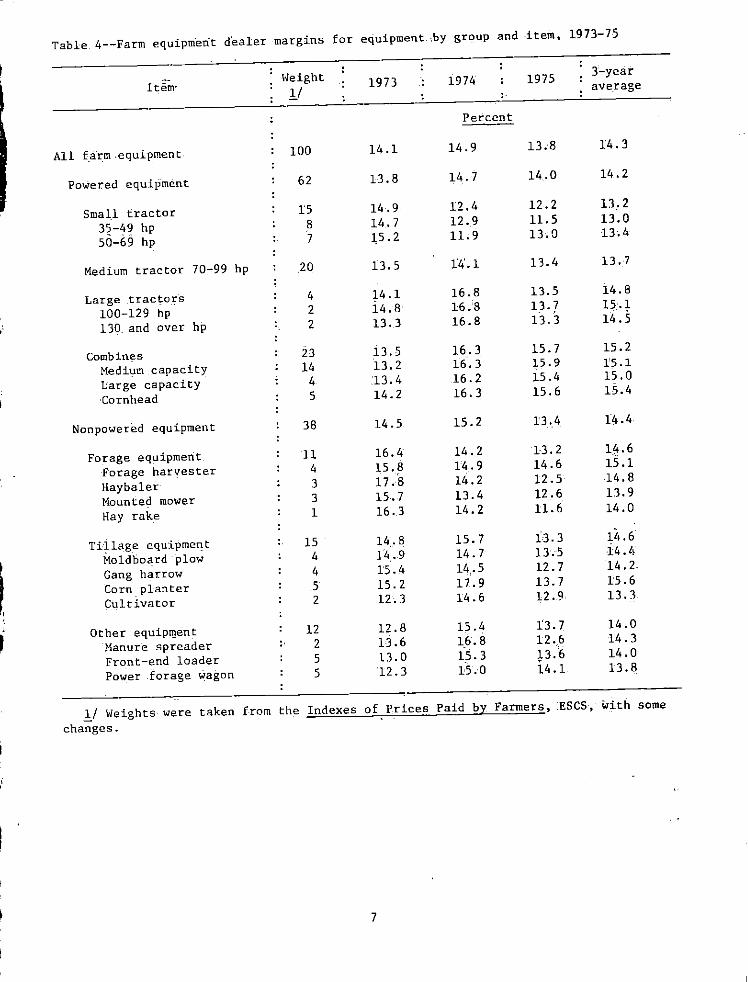

I
Table 5-~Indexes of freight charges and setup and delivery charges for farm equipment by major categories 1974-75
Freight Setup and Item charges delivery charges
1974 1975 1974 1975
i973 100
All farm equipment 122 145 126 134 Powered 120 145 125 131 Noripo~ered 125 144 128 139
Most of the increases in tractor prices reflected -increases in the manuEacturers I prices Dealer cost- increases were about the same as the increases in sales prices Increases in dealer costs accounted for about 87 percent of t~actor price increases
Dealer margins varied widely ~ong tractor sizes Margins for small tractors rose an average of 11 percent during 1973-75 which was consideratily less than tractor prices and other costs Dealers may thus have been trying to increase saleS of these tractors
In contrast dealer margins for the largest sized tractor rose 51 percent during 1973-75 which in part accounted for the relatively 1ar3e increase in themiddot prices of these tractors Dealers faced with strong demand and a tight supply of these tractors increased their margin by the same perceqtage that the manufacturers increase~ their prices
Increases in freight charges also varied wide1y among tractor si~esl ~anging fror 32 percent formedium tractors tO 98 percent for the largest size The relatively large increase for large tractors was due to increases in the weights of these tractors and the av~rage distances shipped from man-ufacturers to dealers
Setup an4 delivery charges increased the most uniform amount among tractor sizes during 1973-75 Increases averaged 27 percent the $mallest rise among the components of sale prices and only three-fourths ~smuch as tract0~ prices
Combines
Sale prices of medium and large combines increased an average of 52 percent during this period (table 7) Dealer costs accounted for about three-fourths the increase a slightly smaller ~ontribution than to price increases of tractors An increase of over 80 percent in dealer margins accounted for a fitth of the sale price increase Dealer margins for combines and cornheads averaged 152 percent of sales prices over the 3-year period or about 2 percentage points higher than for tractors
J
8
Table 6--Average-prices and marketing sharges for small medium an~
lar-ge tractors 1973~75
Item 1973
Small tractors 35-49 hp Actual sale pr-ice 4934 Freight 124 SetiJp and delivery charges 81 Dealer -cost 4002
Dealer margin 727
Small tractors 50-69 hp Actual sale price 7044 Freight 143 Setup and delivery charges 92 Dealer cost 5735 Dealer margin 1074
Medium tractors 70-99 hp Ac tual sale price 10099 Freight 194 Setup and deliverymiddot charges 109 Dealer cost 8435 Dealer margin 1361
Large tractors 100~129 hp Actual sale price 13289 freight 240 S_etup and delivery charges 130 Dealer cost 10951 Dealer margin 1968
Large tactors 130 and over hp Ac t uaI sale price 17445 Freight 291 Setup and delivery charges 154 Dealer cost 14676 Dealer margin 2324
~bull
1974
Dollars
5770 147
83 4792
745
8346 178 103
7070 995
12162 209
13p 10107
1716
17058 iiI 148
13774 2865
23709 356 185
19196 3972
1975
6808 180
99 5749
780
9572 206 116
8007 1243
13437 257 141
11237 1802
18443 331 161
15432 2519
26444 576 196
2167 3505
Change 1973-75
Percent
38 45 22 44
7
36 44 26 40 16
33 32 29 33 32
39 38 24 41 28
52 98 27 51 51
9
Tabie 7--Average prices and lllarketing charges for combines and comheads 1973-75
ChangeItem 1973 1974 1975 1973~75
Dollars ------------- Percent------~~--------
Medium combines Actual sale price 17 420 23424 25~84 49 Freight 313 391 434 39 Setup anddeliverycharges 255 165 345 35 Dealer Cost 14531 i8858 20987 44 Dealer margin 2303 3ino 4118 79
Large comoinesi Actual sale pdce 22425 3i045 36676 64 Freight 366 500 6Ql 64 Setup and delivery charges 267 427 406 52 Dealer cost 18796 25095 30005 60 Dealer margin 2996 5023 5664 89
Comhead -Actual sale price 4866 6002 6369 31 Freight 91 132 149 64 Setup and delivetycharges 82 103 105 28 Dealer cost 4001 4787 5121 28 Dea1ermargin 692 980 994 44
Fatase Eguiement
Prices paid by farmers for fotage equ~pment increased an average of 32 percent during 1973-75~ the smallest price increase among subgroups of farm eq~ipnient (table 8) Price increases were largest for hay rakes and lowest for forape narvesiers Risingmiddot dea1er costs accouDted ~for 89 percent of the price increase for forage equipment Freight setup anddelivery charges accounted for 7 percent of the increase and dede margins for the remaining 4 percent
Dealer margins for liay balers and hay rakesdec1ined during this period Margins for forage equipment averaged 146 percent of sale pri~es for the) years
Tillage Equiement
5les prices of tUlage equipment increased an average of58 percent during 1973-75 (table 9) Dealer coSts increased 62 percent and accounted for 83 percent of t~e prlte 1~crea8e8 Increases in dealer m~rgin~s acc_ounf~d fOT 11 percent of the sales price i~crease and other charges middotfor tJte remailling 6 percent
iricreases in sales prices of middotc_orn planters and disk harrows ii2 times greater than the increases for cultivators and floldloardplows reflected the relatively greater increages in dedermiddot costs for thege first two types of tillage equipment
10
Table 8--Average prices and marketinp charges for forage equ~pment 1973-75
ChangeItem 1973 1974 1975 1973-75
----------------- Dollars ------------- Percent
Forage harvester Actual sale price 4585 5007 5716 25 Freight 102 125 140 37 Setup and delivery charges 85 98 107 26 Dealer cost 3672 4036 4637 26 Dealer margin 726 748 832 15
Hay baler Actual sale price 2898 3482 3956 37 Freight 86 116 125 45 Setup and delivery charges 69 79 91) 30 Dealer cost 2227 279~ 3245 46 Dealer margin 516 94 496 ~4
Mounted mower Actual sale price 784 992 I 1042 33 Freight 27 39 45 67 Setup and delivery charges 29 ]7 38 31 Dealer cost 605 783 828 37 Dealer margin 123 133 131 7
Hay rake Actual sale price 826 1007 1151 40 Freight 34 42 48 41 Setup and delivery charges 32 34 43 34 Dealer cost 650 783 928 43 Dealer margin 135 143 U4 -1
Other E9ui12ment
Sales prices of mRoure spreaders front-end loaders and forage wagonsrose an average of 40 percent during 1973-75 (table 10) Increases in dealer costs accounted for 77 percent of the price increase Margi~s contributed 16 percent and other charges the remaining 7 percent
OPTIONAL EQUIPMENT PURCHASES A~D COST
The optional equipment bought on tractors and combines varies widely due to weather crop and field conditions where the machine wi~l be operated There are many options and accessories available on these machines to improveperfor~ance protect the operator and improve working conditions Thes~ include weights roll bars (a frame to protect the operator) cabs heaters and air conditioners
11
Table ll--Tractor and combine optional equipment purchased as a percentage of units sold 1973-75
Item and optional equipment
Small tractors 3549 hp Power adjusted wheels Real we~ghts Front weights Auxiliary hydraulic controls Roll bar
Small tractors 50-69 hp Power adjusted wheels Rear weights Front weights Auxiliary hydraulic controls Roll bar
Medium t-rac tors 70-99 hp Power adjusted wheels Rear weights Front weights Auxiliary hydraulic controls Roll bar Cab Heater Air conditioner Dual Wheels
Large trac tors 120-129 hp Rear weights Front weights Auxiliary hydraulfc controls Cab Heater Air condHioner Dual wheels
Large tractors 130 and over hp Rear weights Front weights Auxiliary hydraulic controls Cab Heater Air conditioner Dual wheels
1973
27 21 26 44
6
41 34 40 71 5
28 53 72 84 10 33 29 21 15
59 78 89 60 54 42 33
36 65 94 81 73 65 51
1974
Percent
31 15 21
55 11
42 36 46 74 12
36 49 64 87 16 35 32 21 13
59 73 73 66 66 62 41
49 60 93 85 82 82 57
1975
37 27 29 64 i8
34 42 49 79 19
38 43 66 79 22 35 30 21 16
53 77 n 75 68 64 47
51 66 79 90 85 85 69
Continued-shy
14
Table ll--Tractor and combine optional equipment purchased as a percentage of units sold 1973-75--Continued
Item and optional equipment 1973
Medium combines Floating cutter bar 24 Automatic header height-control 69 Heater 69 Air conditIoner 27
Large combines Floating cutter bar 33 Automatic header height control 61 Heater 75 Air conditioner 50
1974
Percent
53 74 80 47
46 64 97 79
1975
50 60 84 57
52 66 88 82
15
Table 12--Dea1er coSts and sctual sale prices of selected optional equip~ent purcha~ed for tr~ctors and combines 19i375
1975 Actual Actual Actual
1973 1974
Dealer Dearer Dealer Item and optional equipment sale sale salecost cost c~st
price 1 price price 1 Dollars
Small tractors 35-49 hp Power adjusted wheels Rear weights
103 i6
120 89
117 103
1)4 118
111 111
126 126
Front weightE 80 93 103 U8 101 114 Auxiliary hydraulic controls 127 148 143 164 164 186 Roll bar 162 189 215 246 2j5 266
Small tT8~tors =shy 50-69 hp Power adjusted wheels 105 124 151 171 15A 182 aear weights 91 107 124 141 127 146 Front eights 97 114 127 144 127 146 Auxiliary hydraulic controls Roll bar
139 1 q2
164 il5
162 217
lA4 i69
17] 23j
199 iii
MediUm tractors 70-99 hp Power adjusted wheels 114 132 153 178 169 195
Relilr weights 117 129 135 middot157 154 US Front weights Auxiliary hydrauiic controls
126 151
146 175
1-77 183
206 213
179 188
206 iii
Roll bar 31Smiddot 368 289 336 333 384 Cab 1 Air conditioner
1226 492
1411 569
1-495 644
1740 750
1680 661
1941 763
~arge tractors 100-129 hp Rear weights Front weights Dual wheels Alixil1ary hydrau1c cOtLtrol~
Cab 21 All cond1tioner
115 151 674 170
1308 501
135 177 791 200
1536 588
183 204 AOl 229
l69 639
220 245 963 275
2037 768
207 i21 Po7] 207
1852 660
240 256
lO~6 240
2-146 765
Large tractors 130 and over Rear weights Front weights Dual whe~19 Auxiliary hydraulic controls
CabmiddotlI Air conditioner
127 161 784 175
1374 520
146 186 904 202
15BlI 600
187 218
1017 235 I i~6
648
225 262
1222 282 I
2099 i79
238 248
1102 212
l90~ 658
275 286
1271 245
2200 758
~d ium comb ine
Floating cutter bar Automatic header heigh_t Air co-nditio~er
con~r-l 704 266 547
812 307 63i
742 297 688
887 355 S22
889 341 767
1057 405 912
Lalge combine Floating cutter bar Automatic header heignt Air conditioner
control 640 259 535
739 299 618
759 303 648
905 361 713
949 359 744
1i2j 424 879
11 Actual sale price is estimated by mu1tip_1ying the dealer cost by the average yearly rna-rkup for the part~cu1ar siz_e of tractor or combine
1 Includes enclosed cab heater and air conditioner
16
FACTORS AFFECTING PRICES AND MARGINS
Price~ and margins of farm equipment are inpoundluen~ed by three factors supply and demand cond-itions costs of doing btIsiness and appraisal of trade-ins The first two factors can be measured quantitatively while evaluating the third is more subjective
Supply and Demand Conditions
Farm equipment sales tend to vary according to fluctuating farm income and d~~and for farm machinery When farm incomes rise demand usually increases as farme(s replace old equipment (previously postpned due to lack of income) or expana prod~ction capacity In the short run ~o~ever manufacturers are limited to thei~ a-biIity to respond to increas-es in demand Plant capacities and the availability of materials and component parts are fixed
The surge in foreign demin4 for US agricultural products in I 72 broifght higher prices for U S fa-rm produc ts These higher prices brougnt abou t a 6-percent increase
jn cropland acreage in 1973 which in turn required more middotfarm equipment Hith increased production farm income rose Net realized farm income in the United States which had iaqged between $11middot billion and $14 billion in the sixties rose to $178 billion in 1972 and to $299 billion the following yea Farm inc~me has ~ince geclined from the 1973 record level but has remained above $20 billion T1te de~a~d for farm machinery has likewise remained strong Production of farm equipIl)centnt in i
fact hit record levels if both 1973 and 1974 In 1974middot demand was so srong thatmiddot middotshipme~ts loere held down only by supply constrain~s All seen major producers experienced material and component middotshortagE~s in some cases severe Some manufacfurers found it necessary to allocate equipment p~rticularly tractors and combines to dealers
The mate~ial supply constraints of 1974 ineVitably resulted in pr~uction -cost pressurEs The largest cost increases stemmed from ~isirlg material prices particular~y for mechanical components ~nd iron a~d steel parts The prices of farm equipment increased to cover the higher costs and to provide manufacturers with higher profit tilaqjins t according to a study by the Council on Vage and Price Staility 1 While these higher profits have brought som~ expansion in capital- expenditure and production capacity of the farm equip~ent industry continued upward cost pressures have resulted in higher dealer Costs for farm equipment In view 8f the expansion in prod~cti9n capacity however cost pressures and thus prlce ~ncreases haye been milder than those of 1974 and 1975
Dealer Margins -
~ bull bull bull bull J I
Increased demand and limited supply lessened competi-tion among dealers anci r
margins widened in 1974 Dealer margins were the highest in 1974 (14 9 percenmiddott)middotmiddotwhen farm equipment demand increased and the fndustry was operating at full capac~ty Dealer margins in turn declined in 1975 as the supply increased lt
Dealer margins were also related to t1te costs Cf doiI1g business As shown by the data obtained from the National Farm and Pltwer Equipment Dealers Association (~all 13) th~ r~~e -in Cpera~itg margins in 1974 Bccompanied an increase in operating expenses Similarily operating margin and expenses declined in 1975
Margins for repair parts and service labor were more than dpublemiddot the margi~ for new equipment
] Executive Office of the Presiqent Council on Wage ~nd Price Stability Report ~o--n--Prioc=-e=-s=----for---Agricult=u-r-al---Ma-ch-i~n~eor~YLa~n~d-2Eclqleu-i~p~me2n~t~J May I9 7 6 p 21
17
Table l3--S_elected operating averages for all dealers 1973-75
Dealer margin 1 New e~uipment
Year margin Total Expenses )) Net profit middotY
Percent
le973 1153 1609 1278 331 1974 1492 1735 1361 374 1975 1343 1622 1329 292
3 -Dealer margins eJpenses and net profits reflect all operations of the firms includ-ing the parts and seryice departments
Source Farm Power and Equipment National Farm and Power Equipment Dealers Associati09- M~y -ssues- t974-76
Appraisal of Trade-ins
Since many farm equipment purchases inv-olye trade-ins the app-r~ised value of middottrade-i[ls may significantty raise or tower- dealer margins Competition within a market may larg-~ly govern- trade-in allowances If farm equipment dealers are competitive liberal trade-in allowances may be -used to attract new business However dealers must realize an adequate margin to mainta~in s-atfsfactory service since many farmers consider faetors other than price (such as the ayailability and quarity of parts and service) in their buying decisions
ltlU_ S GOVER1JME~T PRlNTUltlG OfFICE 1978 261~9blij I
18middot
UNITED STA TESDEPARTMENT OF AGRICULTURE POSTAQE ANO-FEESPAIO
WASHINGTON DC 202iO us DpoundfIAATMENTOF AGRicULTURE
AGR 101
THIRD CLASS
1 1
I j
1 1
I
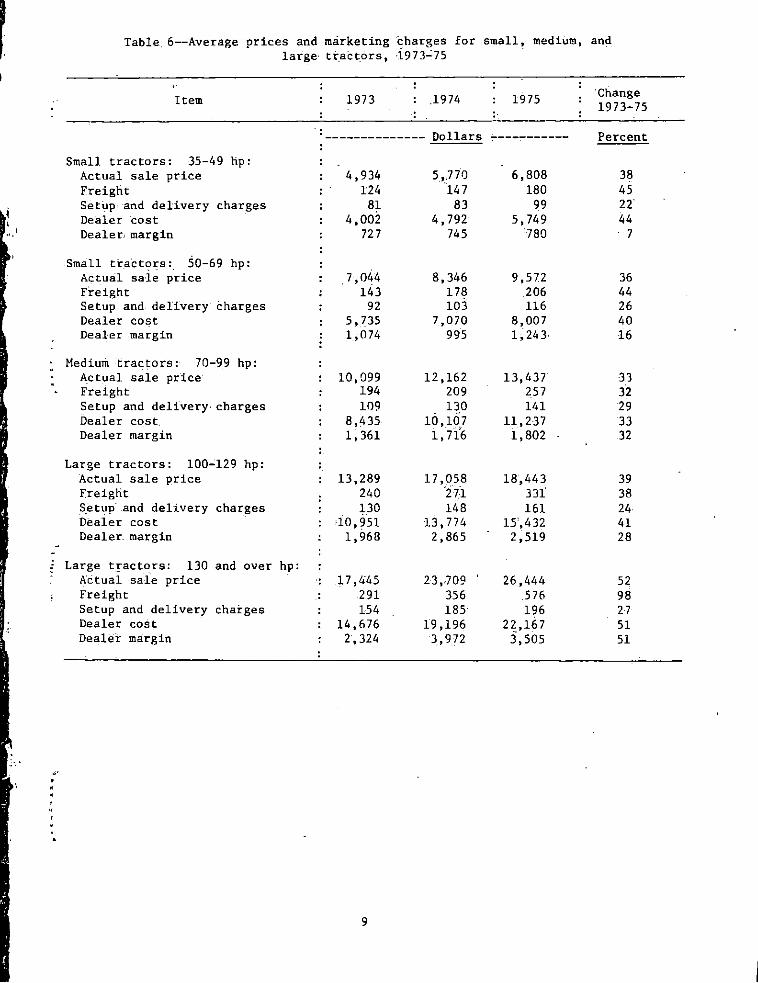
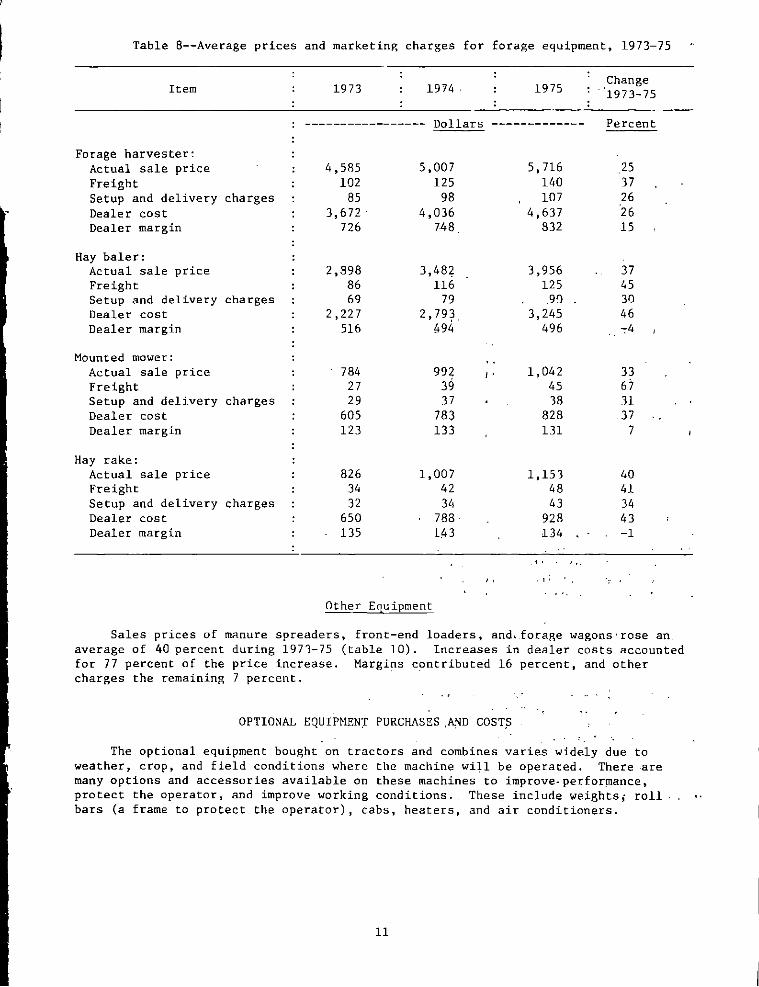
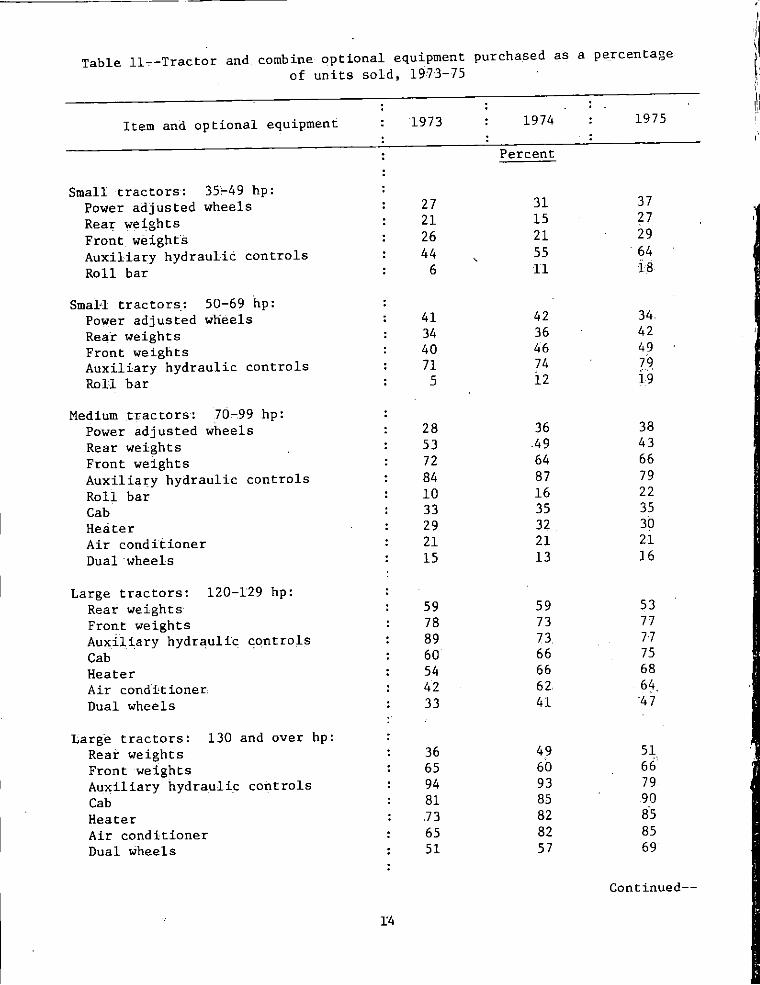
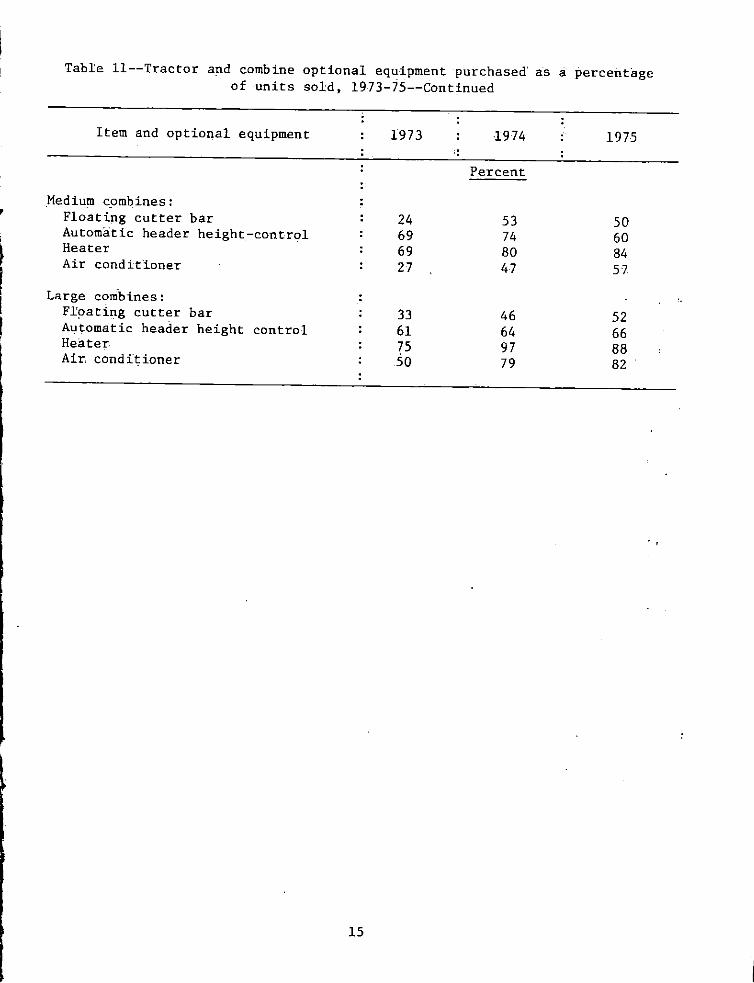
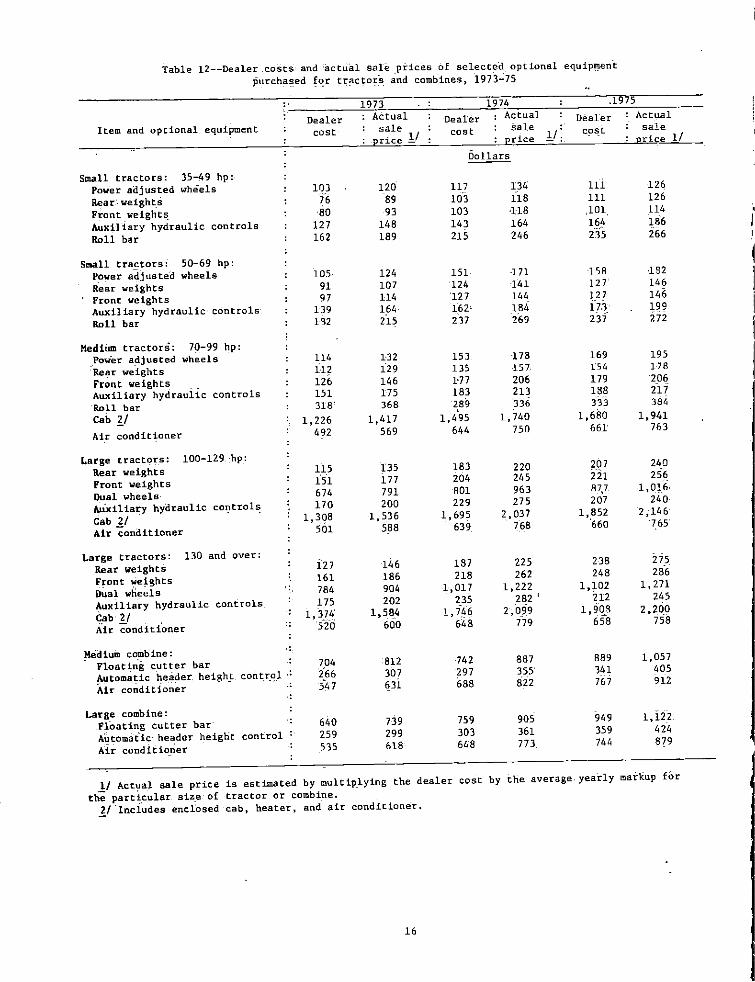
UNITED STA TESDEPARTMENT OF AGRICULTURE POSTAQE ANO-FEESPAIO
WASHINGTON DC 202iO us DpoundfIAATMENTOF AGRicULTURE
AGR 101
THIRD CLASS
1 1
I j
1 1
I