Calculating Fiber Loss and Distance Estimates _ Fiber Optic Training & Tutorials - FAQ, Tips & News
Upload
michael-yamadaCategory
view
528download
0
FAQ for power-based training (version 12.04)
by Charles Howe, with contributions from members of the Wattage Forum at Topica.com
CONTENTS
Introduction/General Concerns
1. What is power?
2. Why is training by power suddenly so important?
3. Why should I train by power?
4. Has power-based training obviated training by
heart rate and by ‘feel’ (perceived exertion)?
5. What are some of the various power-measuring
systems on the market?
6. How do power-measuring devices work?
7. Where can I buy a power-measuring system?
8. Which model is best?
9. Why does memory capacity vary so much?
10. What is the difference between signal rate,
display interval, and recording interval?
11. How do I make use of all the workout data?
12. Why does power fluctuate so much while riding?
13. What is a ‘good’ power output?
14. What is CDA?
15. How can I test my progress with a power meter?
16. What are normalized power, intensity factor, and
training stress score?
17. How does altitude affect power output?
18. Where can I learn more about training by power?
19. What about power-based training indoors?
20. Isn’t the consistency of the data what really
counts, moreso than accuracy?
21. Can a power meter be used as an aid to weight
loss and dieting?
Use and Operation
22. Does temperature affect accuracy of a strain-
gauge based system (i.e., SRM and PowerTap)?
23. How do I calibrate my power meter?
24. Can I race using a power meter?
25. How does the PowerTap calculate cadence
without a sensor?
26. Can I use the PT Standard model just as a
computer, without the hub?
Solutions
27. The drive-side bearing cone in my both PT Pro and
Standard hubs wore out quickly. Any suggestions?
28. How can I make my PT hub more waterproof?
29. How do I build a custom wheel around a PT hub?
30. What about for a 135 mm hub?
31. How do I build a PT hub into a fixed gear wheel?
32. How can I mount my PT on the handlebar stem?
33. Can I use a PT Shimano freehub with a
Campagnolo derailleur?
34. Which of the two PT pickups should I use?
35. How can I transfer data to a Mac Powerbook
from my Polar S-710 with an IR connector?
36. Hey wait! I’m using Virtual PC 6 with OSX, no
problem.
37. How much memory is needed to run VPC 6?
38. I’m having trouble installing my Polar power
meter. Any suggestions besides the manual?
39. The cadence magnet for my Polar power meter
won’t stay in place.
40. As an aside, how does the Polar power module
‘know’ the free length of the chain?
41. Does downloading drain the battery in the PT
Standard computer?
42. I can’t get the PT Link software to install.
43. How can I download the PT to a USB port?
44. My PT Standard often stops downloading at 250
records. How can I “rescue” the file?
45. I can’t open a PT file that was e-mailed to me.
46. I forgot to zero out the torque on my PT hub; how
do I correct the file after downloading?
47. What should smoothing percentage be set at?
48. My PT seems to have a case of the data drops.
How do I stop them?
49. How can I open a PT database file in Microsoft
Access?
Q: What is power?
A: To Henry Kissinger it was an aphrodisiac, but for our purposes, the definition comes from physics, and inparticular the science of dynamics, which is a branch of mechanics. Power is the rate of doing work ortransferring energy, such that power = work/time, or P = W/Δt. As relates to cycling, it is measured ininternational system (SI) units called Watts (W), rather than the familiar english unit of horsepower that is usedas a measure of engine power (1 horsepower = 746 W). Since work = force applied through a distance, or W =F × Δx, these two expressions can be combined and rearranged to express power as the product of force andspeed, i.e., P = F × s, and this may be the best way to think of it: the speed you can maintain times the totalforce resisting your forward motion. Similarly, power can be defined as pedal force (i.e., torque, which equals =[measured frequency - zero offset]/slope) × cadence, which means you can increase power by exerting moreforce on the pedals at a given cadence, by increasing cadence while exerting the same pedal force, or byincreasing both force and cadence.
4/23/2010 FAQ for training with power
midweekclub.ca/powerFAQ.htm#Q17 1/20
Here are some examples that give an appreciation for units of power:
A 68 kilogram (150 lb) rider traveling on an 8.6 kg (19 lb) bike at 20 mph in on flat ground in with no windrequires about 177 W.
56.5 W are required to raise a 20 lb dumbbell 25 in. overhead in one second.
Q: Why is power-based training so important all of a sudden? A: It’s no more so than it was previously, in fact, exercise physiologists have used calibrated ergometers for years
to impose precise loads on study subjects. Rather, the introduction of affordable on-bike power measurementsystems (power/speed measuring device, handlebar-mounted computer, receiver/wiring and computer mountingbracket, download interface, software) have made it possible to use power in everyday training as well as racing,then analyze the resulting workout data. This, and their widening use among both amateur and professionalriders has generated considerable “buzz.”
Q: Why should I train by power? A: (Eddie Monnier and Andrew Coggan) Because it is the objective measure of exercise intensity, and as such
directly determines physiological and perceptual responses to exercise, so training by power provides immediateand quantitative feedback on the intensity of effort. 300 Watts is 300 Watts, no matter how hot, windy, or hilly itis, or what your heart rate is – though it may “feel” easier or harder, depending on various conditions. Three variables to control in any training program are intensity, duration, and frequency; of these, the latter twoare easy to quantify objectively – duration is measured in hours, and frequency in sessions per week (the productof the two is volume). Intensity, on the other hand, has traditionally been measured by perceived exertion (PE)and/or heart rate (HR). HR is reliable enough at lower (i.e., aerobic-only) intensities, but for more race-specific(i.e., shorter but more intense) training, it becomes a much less effective proxy for intensity. Besides beingsubject to numerous environmental and physiological variables (e.g., temperature, humidity, hydration status,altitude, overtraining, lack of sleep, nervousness, and upward “drift” as exercise progresses), HR respondsslowly to workload demands, and thus is a lagging indicator of effort. That is, it will be lower than power andduring the early part of an effort, and higher afterward. For example, if you bound up a few flights of stairs,your heart rate will take a while to reflect the effort, and will continue to beat at an elevated rate for a whileeven after you have stopped climbing steps. The shorter the duration of an effort, the less useful HR is.
Q: So power-based training has made perceived exertion and heart rate obsolete? A: Not quite, but they seem to have been relegated to a definite second and distant third, respectively! Many still
cling to HR an indicator of overtraining – though declining power for a given PE is the deciding (and often first)sign of that, too. Nonetheless, there persists some popular, if not scientific controversy as to the role of HR, withsome claiming that it indicates metabolic intensity, and therefore one should train by HR, while monitoringpower. In fact, just the reverse is true; particularly during outdoor cycling, metabolic load is more accuratelyreflected by power, integrated with PE, the latter being more reliable than HR and incorporating morephysiological variables. Power provides an objective standard by which effort can be quantified, thereby‘calibrating’ PE, while PE serves to modulate power output.
Q: How do I measure power – I mean, what are some of the various power-measuring systems available? A: Here are the four bicycle-based systems presently available, with links to each manufacturer’s site:
Ergomo Sport (a torque-measuring bottom bracket available in Campagnolo square-taper or Shimano OctaLink):http://www.ergomo-usa.com and www.ergomo.de/eng_main.html
Polar S-720i or S-710i (uses a chain vibration sensor that mounts on the right chainstay):http://www.polarusa.com/consumer/productfinder/productfinder.asp or http://www.polar.fi/power_output. User’s manuals are on-line at http://tinyurl.com/xyny and http://tinyurl.com/xys4 PowerTap (a torque-measuring hub that you build into a wheel): http://www.power-tap.com/
SRM Powercrank (a torque-measuring crank that replaces your present model): http://srm.de andhttp://www.thebikeage.com
4/23/2010 FAQ for training with power
midweekclub.ca/powerFAQ.htm#Q17 2/20
Note: contrary to claims, Ciclosport models do not actually measure power, rather, they only give a roughestimate based on speed, total mass (rider/equipment), and road grade, which may be accurate on steepergrades, but is useless on flat terrain, particularly in group rides or if any wind is present.
Finally, you don’t need a high-tech gizmosystem to figure your power. For instance, you can use a hill with asteady grade of ~7% or more by timing yourself over a measured portion of it, and then calculate power quiteaccurately (so long as air was sufficiently calm) using http://analyticcycling.com. You can even get a consistentestimate running up a constant grade or a flight of continuous steps, such as in a stadium: Watts = (mass in kg
´ 9.81 ´ net elevation gain in meters)/time in seconds; kg = lbs ´ 0.4536.
Q: How do power-measuring devices work?
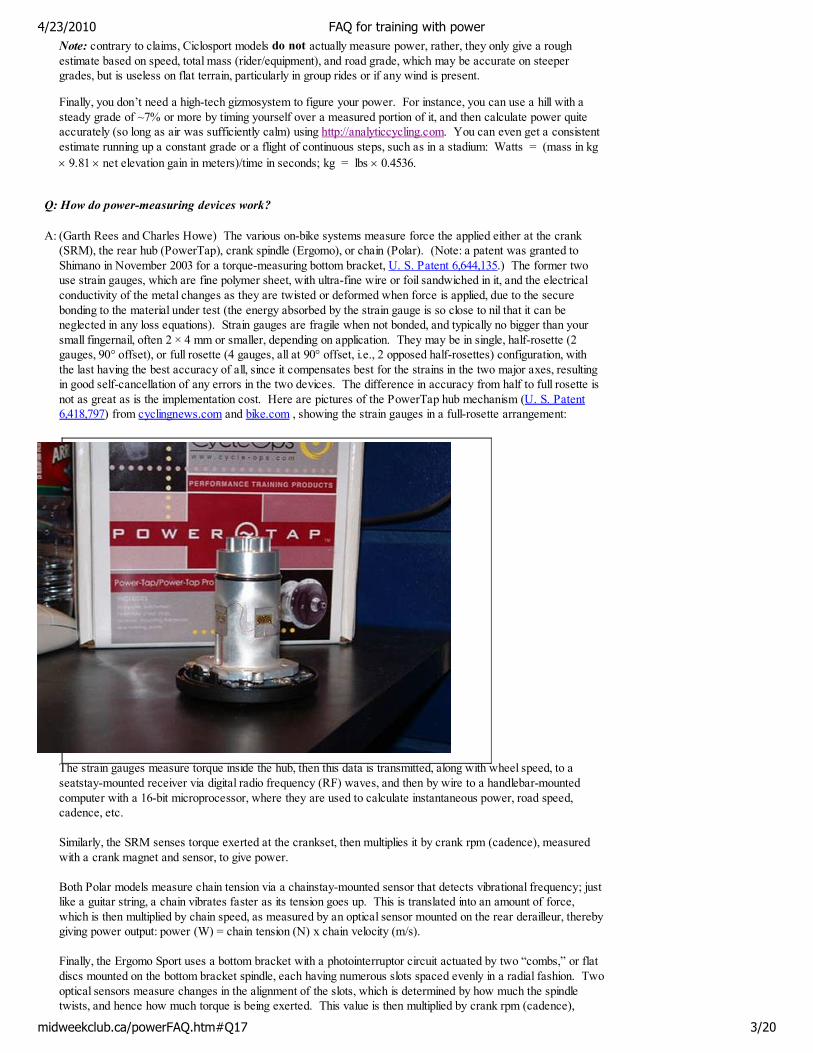
A: (Garth Rees and Charles Howe) The various on-bike systems measure force the applied either at the crank(SRM), the rear hub (PowerTap), crank spindle (Ergomo), or chain (Polar). (Note: a patent was granted toShimano in November 2003 for a torque-measuring bottom bracket, U. S. Patent 6,644,135.) The former twouse strain gauges, which are fine polymer sheet, with ultra-fine wire or foil sandwiched in it, and the electricalconductivity of the metal changes as they are twisted or deformed when force is applied, due to the securebonding to the material under test (the energy absorbed by the strain gauge is so close to nil that it can beneglected in any loss equations). Strain gauges are fragile when not bonded, and typically no bigger than yoursmall fingernail, often 2 × 4 mm or smaller, depending on application. They may be in single, half-rosette (2gauges, 90° offset), or full rosette (4 gauges, all at 90° offset, i.e., 2 opposed half-rosettes) configuration, withthe last having the best accuracy of all, since it compensates best for the strains in the two major axes, resultingin good self-cancellation of any errors in the two devices. The difference in accuracy from half to full rosette isnot as great as is the implementation cost. Here are pictures of the PowerTap hub mechanism (U. S. Patent6,418,797) from cyclingnews.com and bike.com , showing the strain gauges in a full-rosette arrangement:
The strain gauges measure torque inside the hub, then this data is transmitted, along with wheel speed, to aseatstay-mounted receiver via digital radio frequency (RF) waves, and then by wire to a handlebar-mountedcomputer with a 16-bit microprocessor, where they are used to calculate instantaneous power, road speed,cadence, etc. Similarly, the SRM senses torque exerted at the crankset, then multiplies it by crank rpm (cadence), measuredwith a crank magnet and sensor, to give power. Both Polar models measure chain tension via a chainstay-mounted sensor that detects vibrational frequency; justlike a guitar string, a chain vibrates faster as its tension goes up. This is translated into an amount of force,which is then multiplied by chain speed, as measured by an optical sensor mounted on the rear derailleur, therebygiving power output: power (W) = chain tension (N) x chain velocity (m/s). Finally, the Ergomo Sport uses a bottom bracket with a photointerruptor circuit actuated by two “combs,” or flatdiscs mounted on the bottom bracket spindle, each having numerous slots spaced evenly in a radial fashion. Twooptical sensors measure changes in the alignment of the slots, which is determined by how much the spindletwists, and hence how much torque is being exerted. This value is then multiplied by crank rpm (cadence),
4/23/2010 FAQ for training with power
midweekclub.ca/powerFAQ.htm#Q17 3/20
which is measured by the bottom bracket unit, thereby yielding a value for power.
Q: Where can I buy a power-measuring system? A: Check with your local bicycle or triathlete shop, or the manufacturers’ web sites for dealer listings. You may
also find the products in cycling catalogs and/or on the web, and many coaches are also dealers for the severalsystems.
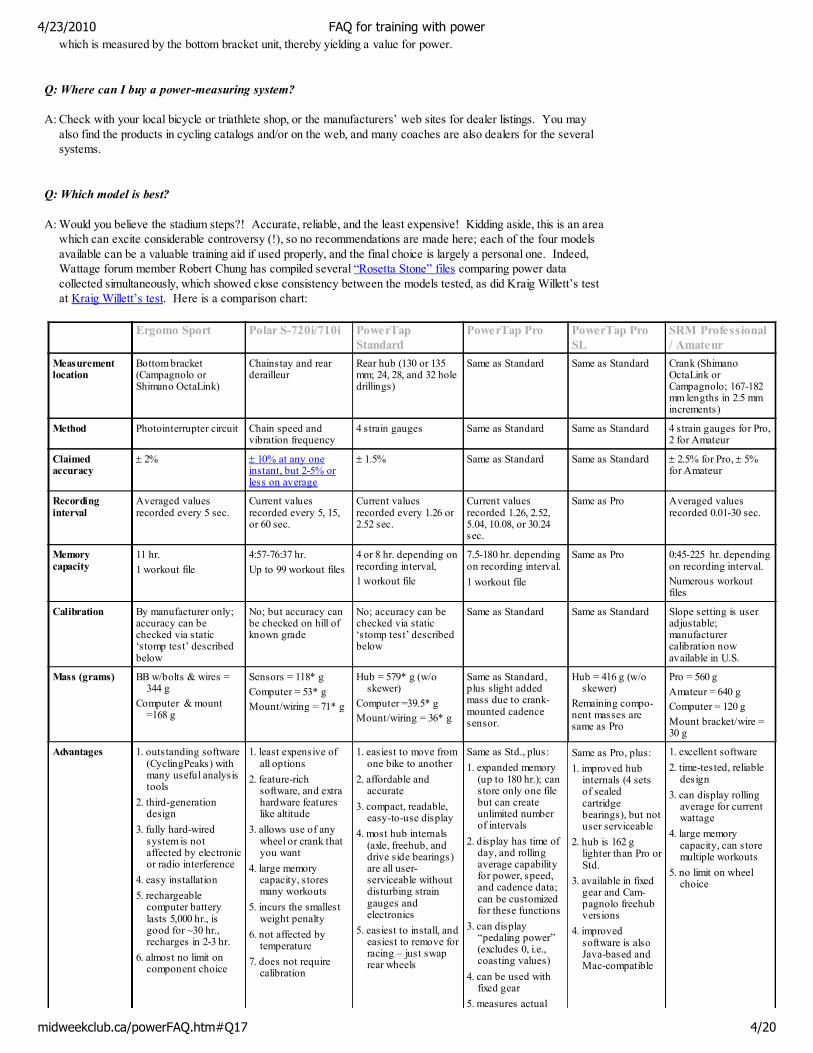
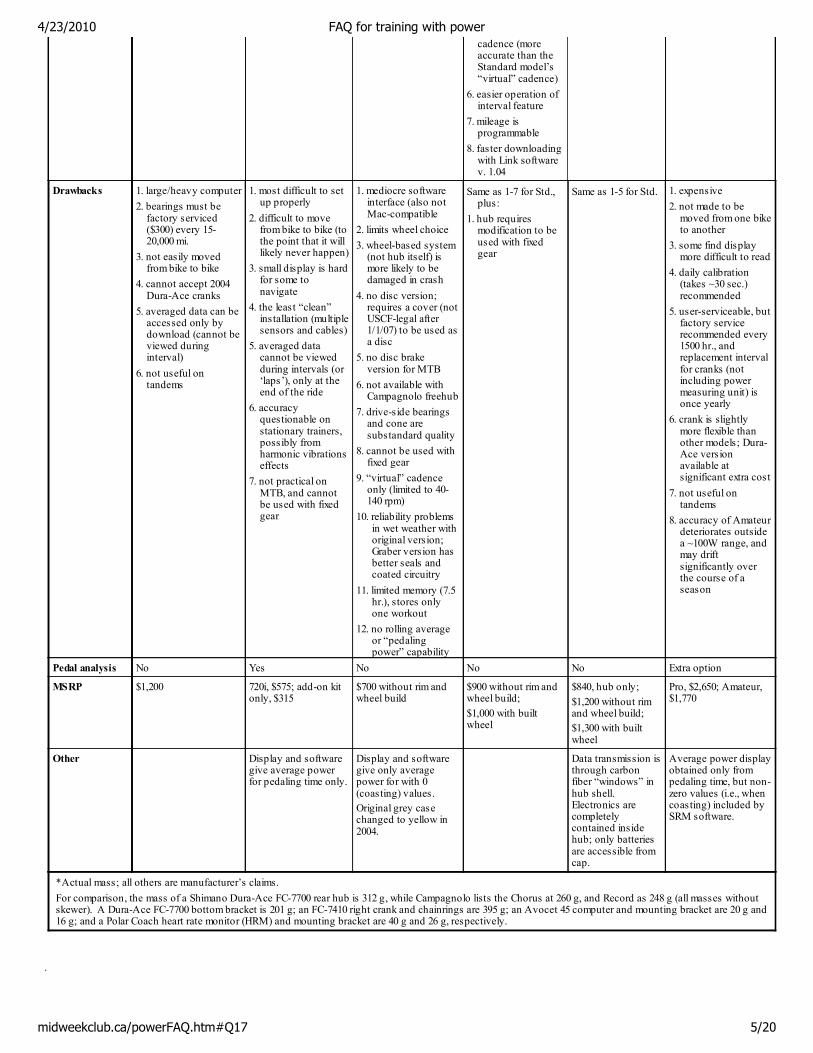
Q: Which model is best? A: Would you believe the stadium steps?! Accurate, reliable, and the least expensive! Kidding aside, this is an area
which can excite considerable controversy (!), so no recommendations are made here; each of the four modelsavailable can be a valuable training aid if used properly, and the final choice is largely a personal one. Indeed,Wattage forum member Robert Chung has compiled several “Rosetta Stone” files comparing power datacollected simultaneously, which showed close consistency between the models tested, as did Kraig Willett’s testat Kraig Willett’s test. Here is a comparison chart:
Ergomo Sport Polar S-720i/710i PowerTapStandard
PowerTap Pro PowerTap ProSL
SRM Professional/ Amateur
Measurementlocation
Bottom bracket(Campagnolo orShimano OctaLink)
Chainstay and rearderailleur
Rear hub (130 or 135mm; 24, 28, and 32 holedrillings)
Same as Standard Same as Standard Crank (ShimanoOctaLink orCampagnolo; 167-182mm lengths in 2.5 mmincrements)
Method Photointerrupter circuit Chain speed andvibration frequency
4 strain gauges Same as Standard Same as Standard 4 strain gauges for Pro,2 for Amateur
Claimedaccuracy
± 2% ± 10% at any oneinstant, but 2-5% orless on average
± 1.5% Same as Standard Same as Standard ± 2.5% for Pro, ± 5%for Amateur
Recordinginterval
Averaged valuesrecorded every 5 sec.
Current valuesrecorded every 5, 15,or 60 sec.
Current valuesrecorded every 1.26 or2.52 sec.
Current valuesrecorded 1.26, 2.52,5.04, 10.08, or 30.24sec.
Same as Pro Averaged valuesrecorded 0.01-30 sec.
Memorycapacity
11 hr.
1 workout file
4:57-76:37 hr.
Up to 99 workout files
4 or 8 hr. depending onrecording interval,
1 workout file
7.5-180 hr. dependingon recording interval.
1 workout file
Same as Pro 0:45-225 hr. dependingon recording interval.
Numerous workoutfiles
Calibration By manufacturer only;accuracy can bechecked via static‘stomp test’ describedbelow
No; but accuracy canbe checked on hill ofknown grade
No; accuracy can bechecked via static‘stomp test’ describedbelow
Same as Standard Same as Standard Slope setting is useradjustable;manufacturercalibration nowavailable in U.S.
Mass (grams) BB w/bolts & wires =344 g
Computer & mount=168 g
Sensors = 118* g
Computer = 53* g
Mount/wiring = 71* g
Hub = 579* g (w/oskewer)
Computer =39.5* g
Mount/wiring = 36* g
Same as Standard,plus slight addedmass due to crank-mounted cadencesensor.
Hub = 416 g (w/oskewer)
Remaining compo-nent masses aresame as Pro
Pro = 560 g
Amateur = 640 g
Computer = 120 g
Mount bracket/wire =30 g
Advantages 1. outstanding software(CyclingPeaks) withmany useful analysistools
2. third-generationdesign
3. fully hard-wiredsystem is notaffected by electronicor radio interference
4. easy installation
5. rechargeablecomputer batterylasts 5,000 hr., isgood for ~30 hr.,recharges in 2-3 hr.
6. almost no limit oncomponent choice
1. least expensive ofall options
2. feature-richsoftware, and extrahardware featureslike altitude
3. allows use of anywheel or crank thatyou want
4. large memorycapacity, storesmany workouts
5. incurs the smallestweight penalty
6. not affected bytemperature
7. does not requirecalibration
1. easiest to move fromone bike to another
2. affordable andaccurate
3. compact, readable,easy-to-use display
4. most hub internals(axle, freehub, anddrive side bearings)are all user-serviceable withoutdisturbing straingauges andelectronics
5. easiest to install, andeasiest to remove forracing – just swaprear wheels
Same as Std., plus:
1. expanded memory(up to 180 hr.); canstore only one filebut can createunlimited numberof intervals
2. display has time ofday, and rollingaverage capabilityfor power, speed,and cadence data;can be customizedfor these functions
3. can display“pedaling power”(excludes 0, i.e.,coasting values)
4. can be used withfixed gear
5. measures actual
Same as Pro, plus:
1. improved hubinternals (4 setsof sealedcartridgebearings), but notuser serviceable
2. hub is 162 glighter than Pro orStd.
3. available in fixedgear and Cam-pagnolo freehubversions
4. improvedsoftware is alsoJava-based andMac-compatible
1. excellent software
2. time-tested, reliabledesign
3. can display rollingaverage for currentwattage
4. large memorycapacity, can storemultiple workouts
5. no limit on wheelchoice
4/23/2010 FAQ for training with power
midweekclub.ca/powerFAQ.htm#Q17 4/20
5. measures actualcadence (moreaccurate than theStandard model’s“virtual” cadence)
6. easier operation ofinterval feature
7. mileage isprogrammable
8. faster downloadingwith Link softwarev. 1.04
Drawbacks 1. large/heavy computer
2. bearings must befactory serviced($300) every 15-20,000 mi.
3. not easily movedfrom bike to bike
4. cannot accept 2004Dura-Ace cranks
5. averaged data can beaccessed only bydownload (cannot beviewed duringinterval)
6. not useful ontandems
1. most difficult to setup properly
2. difficult to movefrom bike to bike (tothe point that it willlikely never happen)
3. small display is hardfor some tonavigate
4. the least “clean”installation (multiplesensors and cables)
5. averaged datacannot be viewedduring intervals (or‘laps’), only at theend of the ride
6. accuracyquestionable onstationary trainers,possibly fromharmonic vibrationseffects
7. not practical onMTB, and cannotbe used with fixedgear
1. mediocre softwareinterface (also notMac-compatible
2. limits wheel choice
3. wheel-based system(not hub itself) ismore likely to bedamaged in crash
4. no disc version;requires a cover (notUSCF-legal after1/1/07) to be used asa disc
5. no disc brakeversion for MTB
6. not available withCampagnolo freehub
7. drive-side bearingsand cone aresubstandard quality
8. cannot be used withfixed gear
9. “virtual” cadenceonly (limited to 40-140 rpm)
10. reliability problemsin wet weather withoriginal version;Graber version hasbetter seals andcoated circuitry
11. limited memory (7.5hr.), stores onlyone workout
12. no rolling averageor “pedalingpower” capability
Same as 1-7 for Std.,plus:
1. hub requiresmodification to beused with fixedgear
Same as 1-5 for Std.
1. expensive
2. not made to bemoved from one biketo another
3. some find displaymore difficult to read
4. daily calibration(takes ~30 sec.)recommended
5. user-serviceable, butfactory servicerecommended every1500 hr., andreplacement intervalfor cranks (notincluding powermeasuring unit) isonce yearly
6. crank is slightlymore flexible thanother models; Dura-Ace versionavailable atsignificant extra cost
7. not useful ontandems
8. accuracy of Amateurdeteriorates outsidea ~100W range, andmay driftsignificantly overthe course of aseason
Pedal analysis No Yes No No No Extra option
MSRP $1,200 720i, $575; add-on kitonly, $315
$700 without rim andwheel build
$900 without rim andwheel build;
$1,000 with builtwheel
$840, hub only;
$1,200 without rimand wheel build;
$1,300 with builtwheel
Pro, $2,650; Amateur,$1,770
Other Display and softwaregive average powerfor pedaling time only.
Display and softwaregive only averagepower for with 0(coasting) values.
Original grey casechanged to yellow in2004.
Data transmission isthrough carbonfiber “windows” inhub shell. Electronics arecompletelycontained insidehub; only batteriesare accessible fromcap.
Average power displayobtained only frompedaling time, but non-zero values (i.e., whencoasting) included bySRM software.
*Actual mass; all others are manufacturer’s claims.
For comparison, the mass of a Shimano Dura-Ace FC-7700 rear hub is 312 g, while Campagnolo lists the Chorus at 260 g, and Record as 248 g (all masses withoutskewer). A Dura-Ace FC-7700 bottom bracket is 201 g; an FC-7410 right crank and chainrings are 395 g; an Avocet 45 computer and mounting bracket are 20 g and16 g; and a Polar Coach heart rate monitor (HRM) and mounting bracket are 40 g and 26 g, respectively.
.
4/23/2010 FAQ for training with power
midweekclub.ca/powerFAQ.htm#Q17 5/20
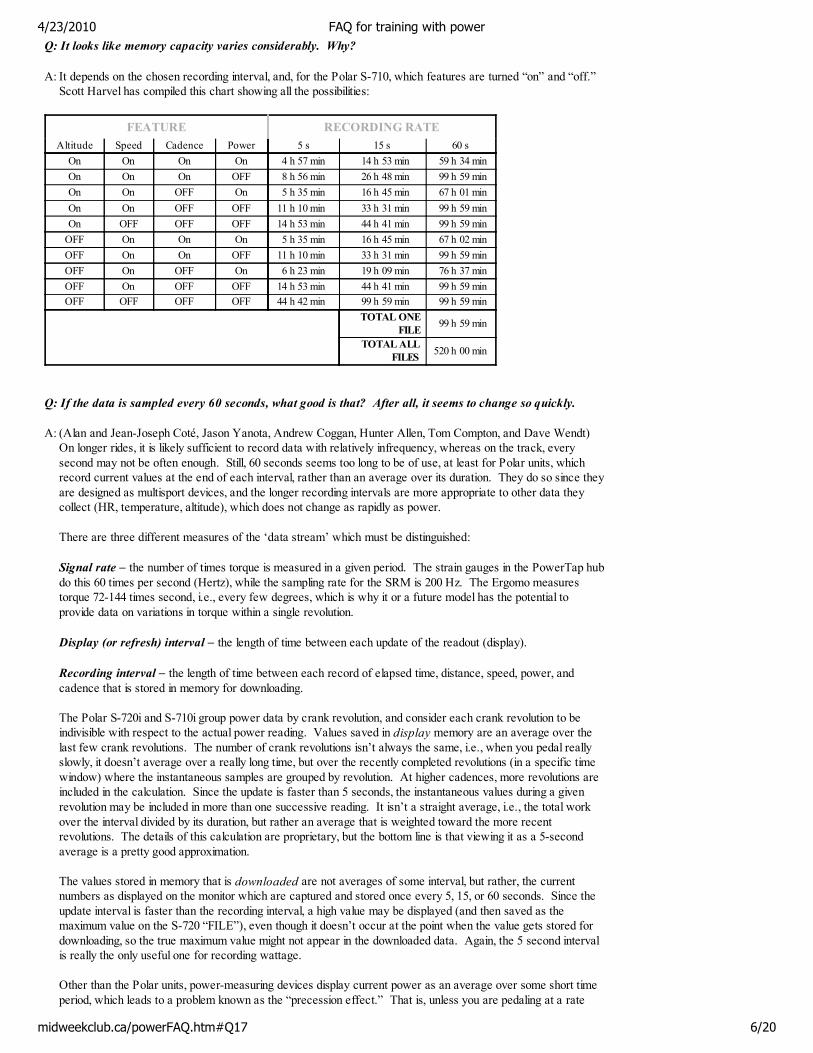
Q: It looks like memory capacity varies considerably. Why?
A: It depends on the chosen recording interval, and, for the Polar S-710, which features are turned “on” and “off.” Scott Harvel has compiled this chart showing all the possibilities:
FEATURE RECORDING RATE
Altitude Speed Cadence Power 5 s 15 s 60 s
On On On On 4 h 57 min 14 h 53 min 59 h 34 min
On On On OFF 8 h 56 min 26 h 48 min 99 h 59 min
On On OFF On 5 h 35 min 16 h 45 min 67 h 01 min
On On OFF OFF 11 h 10 min 33 h 31 min 99 h 59 min
On OFF OFF OFF 14 h 53 min 44 h 41 min 99 h 59 min
OFF On On On 5 h 35 min 16 h 45 min 67 h 02 min
OFF On On OFF 11 h 10 min 33 h 31 min 99 h 59 min
OFF On OFF On 6 h 23 min 19 h 09 min 76 h 37 min
OFF On OFF OFF 14 h 53 min 44 h 41 min 99 h 59 min
OFF OFF OFF OFF 44 h 42 min 99 h 59 min 99 h 59 min
TOTAL ONEFILE
99 h 59 min
TOTAL ALLFILES
520 h 00 min
Q: If the data is sampled every 60 seconds, what good is that? After all, it seems to change so quickly. A: (Alan and Jean-Joseph Coté, Jason Yanota, Andrew Coggan, Hunter Allen, Tom Compton, and Dave Wendt)
On longer rides, it is likely sufficient to record data with relatively infrequency, whereas on the track, everysecond may not be often enough. Still, 60 seconds seems too long to be of use, at least for Polar units, whichrecord current values at the end of each interval, rather than an average over its duration. They do so since theyare designed as multisport devices, and the longer recording intervals are more appropriate to other data theycollect (HR, temperature, altitude), which does not change as rapidly as power. There are three different measures of the ‘data stream’ which must be distinguished:
Signal rate – the number of times torque is measured in a given period. The strain gauges in the PowerTap hubdo this 60 times per second (Hertz), while the sampling rate for the SRM is 200 Hz. The Ergomo measurestorque 72-144 times second, i.e., every few degrees, which is why it or a future model has the potential toprovide data on variations in torque within a single revolution.
Display (or refresh) interval – the length of time between each update of the readout (display).
Recording interval – the length of time between each record of elapsed time, distance, speed, power, andcadence that is stored in memory for downloading. The Polar S-720i and S-710i group power data by crank revolution, and consider each crank revolution to beindivisible with respect to the actual power reading. Values saved in display memory are an average over thelast few crank revolutions. The number of crank revolutions isn’t always the same, i.e., when you pedal reallyslowly, it doesn’t average over a really long time, but over the recently completed revolutions (in a specific timewindow) where the instantaneous samples are grouped by revolution. At higher cadences, more revolutions areincluded in the calculation. Since the update is faster than 5 seconds, the instantaneous values during a givenrevolution may be included in more than one successive reading. It isn’t a straight average, i.e., the total workover the interval divided by its duration, but rather an average that is weighted toward the more recentrevolutions. The details of this calculation are proprietary, but the bottom line is that viewing it as a 5-secondaverage is a pretty good approximation. The values stored in memory that is downloaded are not averages of some interval, but rather, the currentnumbers as displayed on the monitor which are captured and stored once every 5, 15, or 60 seconds. Since theupdate interval is faster than the recording interval, a high value may be displayed (and then saved as themaximum value on the S-720 “FILE”), even though it doesn’t occur at the point when the value gets stored fordownloading, so the true maximum value might not appear in the downloaded data. Again, the 5 second intervalis really the only useful one for recording wattage. Other than the Polar units, power-measuring devices display current power as an average over some short timeperiod, which leads to a problem known as the “precession effect.” That is, unless you are pedaling at a rate
4/23/2010 FAQ for training with power
midweekclub.ca/powerFAQ.htm#Q17 6/20
where one or several revolutions are exactly completed in each averaging interval, an extra quarter-revolutioncan occur, and that partial turn of the crank may be either a power stroke or a dead-center (and perhaps theopposite for the next sampling period), which will produce a less consistent reading, especially for short intervals;the maximum power value captured in the PowerTap’s display memory, for example, is significantly affected,since it is the highest average value achieved over just 1.26 seconds. Thus, averaging over one (or just a few)crank revolutions would reduce variability in the current power display, track power more nearly as a ridersenses it, and result in more accurate maximum values for instantaneous power. Recorded power values could,and perhaps should, still be based on time. For current power, the PowerTap Standard displays only the power calculated every 1.26 seconds, and when setto record every 2.52 seconds, discards values calculated at 1.26 seconds, i.e., it records every other valuewithout averaging. The Pro model, on the other hand, can display average over the last 1.26, 2.52, 5.04, 10.08,or 30.24 seconds for the current power value, but like the Standard, it records the instantaneous value at theselected recording interval, so for instance, when at the 10.08 second recording interval, every 8th value isstored, and the other 7 are discarded. Some have noted that displayed memory is often a couple Watts higherthan what is downloaded. In fact, the “raw,” recorded data represents is the most accurate and unalteredinformation, coming directly from the hub. The reason the display is slightly off is that it uses lower-precisionarithmetic, rounds improperly, or computes running averages using a method that is prone to accumulated errorsor truncation. These corners are cut because memory and CPU computing power are at a premium. The SRM averages torque during each pedal revolution, then multiplies the result by the average angular velocity(cadence) during the revolution, then makes calculations according to the specified interval:
0.1 second – all completed revolutions are averaged, if a revolution hasn’t been completed then theprevious data is sampled again. 1 second – all completed revolutions in the previous second are averaged. One revolution will be sampledin the first sample, two revs will be used in the second sample, etc. 10 second – all completed revolutions are averaged; at 90 rpm this would mean the average of the previous15 pedal revolutions.
Instantaneous power is estimated using the torque analysis function, which samples torque at 200 Hz, and in thisway, SRM claims there are no artifacts in its power calculations, however, this is only an estimation ofinstantaneous power, because we don’t know instantaneous crank speed, and speed variations, though slight, dooccur while pedaling. The crank torque and angular velocity that are combined to calculate power aren’tnecessarily time-aligned properly, which can be an issue if cadence is changing rapidly. As previously mentioned, the Ergomo takes 72-144 measurements per second (depending on cadence), averagesthem each second, and temporarily saves the result. Each 1-second average in turn is averaged every 5seconds, and then this number is recorded for download. For example, 300 W, 300 W, 300 W, 305 W, and 310W will be averaged by the computer and recorded as 303 W. The Ergomo display is updated every second froma rolling average of the last 8 rpm, so a new number appears in the display each second as the rolling average iskicking out the last number. Although both the Ergomo and SRM measure the torque, or twisting force, generated by the rider’s leg(s), theErgomo measures it at the bottom bracket, whereas with the SRM, it is measured between the chainrings andthe right crank arm. When you push down with the left pedal, that torque is transmitted through the bottombracket spindle, to the spider, and then to the chainrings. When you push down with your right leg, however, thetorque is transmitted only through the spider to the chainrings – none is transferred to the bottom bracket spindle,hence, the Ergomo measures the power output of the left leg only (and then doubles it), whereas the SRMmeasures the power output of both legs. (If you use your right leg to help lift your left back to the top of thestroke – and many of us do – then there is some torque applied to the bottom bracket spindle. This is, however,considerably smaller than the torque generated during the downstroke with either leg, furthermore, it is in theopposite direction.) Some therefore claim that an imbalance between left and right leg strength (due perhaps toan injury or even just occurring normally) renders the Ergomo inaccurate, even as it may give consistent andrepeatable values, however, this has yet to be demonstrated.
Q: It sounds like each ride produces a lot of data. How to make sense of it all? A: Software is included with each system, and there are also several aftermarket packages with enhanced
capabilities, including http://cyclingpeakssoftware.com, http://www.crosstrak.com, andhttp://www.powercoach.ch (comes in versions for both Mac and PC). Lastly, http://analyticcycling.com hassome useful analysis features.
4/23/2010 FAQ for training with power
midweekclub.ca/powerFAQ.htm#Q17 7/20

Q: I just had my first ride with my new power meter. Is it normal for current power to fluctuate so much? A: First-time power meter users are almost invariably surprised at how “jumpy” the current power display is, and
question the readout’s reliability. This is a result of having become accustomed to the heart rate monitor (HRM)as a gauge of intensity, and being fooled into thinking that the energy requirements of outdoor cycling arerelatively steady by the delayed response heart rate to changes in intensity, an effect that is accentuated by thesmoothing algorithm incorporated in the HRM’s firmware. Although some of the variability in power is due toinstrument artifact (the “precession effect,” as just discussed), the energy demands of road cycling do indeedfluctuate very rapidly and widely (sometimes referred to as the “stochastic” nature of on-road power output),something that can easily be verified by comparing power data collected outdoors against that obtained frommost any indoor trainer. Using your power meter’s interval feature, if it has one, or setting it to smooth(average) readout data over a period of time such as 30 seconds can help to ‘settle’ the display.
Q: My friend says he can average 275 Watts for 30 minutes. Is that any good? A: It all depends. Power is somewhat ‘personal,’ such that three riders traveling the same flat section of road
together, at the same speed, side-by-side (not drafting each other), might each have considerably different poweroutputs, so absolute Watts do not necessarily provide a valid basis of comparison. This is even moreoutstandingly true going uphill, where the force you must overcome is determined largely (75%+ for an 80 kgbike/rider putting out 300 W on grades over 5%) by weight. For instance, if Dan’s mass is 70 kg and heaverages 315 W on a particular climb, while Felicia is 49 kg and maintains “only” 270 W on the same hill, shewill drop him easily, since she is putting out 5.5 W/kg, while he generates only 4.5 W/kg. On flat terrain, bycontrast, the main resistance (80%+) is from air, so speed is a question of Watts per square meter of effectivefrontal area (CDA), which determines air drag.
The amount of good data on power-generating capabilities for cyclists across different skill levels, disciplines,and gender is limited, and of course, statistics don’t determine the outcome of a race; if they did, we could justset up trainers at the starting line, run a few tests, and proclaim the winner! Still, it may be useful to gauge yourown power against others, or those with whom you hope to compete, and if so, be sure to “normalize” (divideby) body mass or frontal area. For timed events, such as a 40 km time trial, you can get a reasonable idea of thepower needed to achieve a certain time for yourself by using an online model like those available athttp://www.kreuzotter.de/english/espeed.htm, http://analyticcycling.com, or http://www.machinehead-software.co.uk. For his World Hour Record in 1996, Chris Boardman averaged an estimated 442 W, while Miguel Indurainneeded about 510 W when he broke the same standard in 1994 (both about 6.5 W/kg), and an analysis of LanceArmstong’s time of 38 minutes 1 second in climbing L’Alpe d’Huez during the 2001 Tour de France producedan estimate of 6.5 W/kg, which came at the end of a 209 km long stage featuring two prior “hors categorie”(beyond category) climbs. In setting a new women’s record of 54 minutes 2 seconds at the 2002 Mt.Washington (NH) Hillclimb, Geneviève Jeanson averaged an estimated 278 W (5.56 W/kg). At the other end ofthe power-duration relationship, the best male match sprinters have hit 23 W/kg, females ~20 W/kg, however,comparable and even higher values than these have (somewhat surprisingly) been recorded by non-cyclists, suchas weightlifters, hockey players, etc.
Q: What in the heck is this ‘CDA’ you refer to?
A: It’s the product of your aerodynamic drag coefficient, CD, and frontal area A. Let’s start with A, which is
simply the area of the profile a rider presents to the air they move through. Stand directly in front of a rider, lookat his or her outline, and you’ll see that a smaller rider has a smaller frontal area, while larger rider has morearea to push through the air, and therefore must put out more power for a particular speed. CD is a measure of how ‘streamlined’ you are, i.e., how smoothly air flows around your body/bike without
swirling behind you. Imagine two riders of exactly the same size and position, where one is using a Cervélo, anaero helmet, shoe covers, etc., while the other has a standard round-tubed bicycle, a Pneumo helmet, and noshoe covers (both wheelsets have 42 spokes, but the first has 58 mm deep-section rims, while the second hasstandard box-section rims). Although both riders present the same frontal area, the former will have a lowerCD, encounter less aerodynamic drag, and go faster at a given power output.
The product of these two components is CDA, or effective frontal area, and it is most accurately determined in a
wind tunnel, but it may be possible to measure it with a power meter, on a flat course in calm air. As a rough
4/23/2010 FAQ for training with power
midweekclub.ca/powerFAQ.htm#Q17 8/20
rule of thumb, an 0.005 m2 reduction in CDA = 0.5 seconds/kilometer = 0.1 lbs difference in drag at 30 mph = 5
W.
Q: How can I test my progress when training by power? A: (Eddie Monnier) Keep in mind that testing does not necessarily guarantee racing results, rather, it allows for
periodic evaluation of your condition and training program. If you do this often enough, you will have a bad testfrom time to time, so it’s important not to get too hung up on any one result. There are several test protocols to determine what might be termed ‘functional threshold power,’ including thecritical power and maximal aerobic power (MAP) tests (the latter is usually administered indoors). The methodproposed in the training guide referenced further on, however, is not a lab test, but a functional test of averagepower for a 40 to 60 minute time trial which is used for determining training levels since it integrates theunderlying physiological mechanisms of endurance exercise: maximal VO2, lactate threshold, and efficiency,
thereby giving a sort of “bottom line” measure of fitness. You may also want to test your power-generating capacity at various durations, depending on race objectivesand personal development needs; for instance, a criterium specialist will be more interested in maximal andaverage power over a 200-meter sprint than a climber, who will tend to focus more on average power on aparticular climb. In this regard, something like Power Profiling can be helpful.
Q: What are “normalized” power, intensity factor, and training stress score? A: Created by Andrew Coggan, Ph.D., a noted exercise physiologist, this is obtained via an algorithm that adjusts
for variations in power with reference to lactate threshold and other physiological responses. Suppose you race a 1 hour criterium, where you are frequently sprinting out of corners, covering breaks, etc.,and you race to your limit, such that there are very few if any slack periods. Average power with coasting timewill nonetheless be considerably lower than a flat 1 hour time trial where you paced steadily and had nothing leftat the end, yet you feel just as stressed physically. The normalizing algorithm adjusts for variations in power,such that the resulting normalized power value will be very close to what you would have achieved in a TT ofequivalent duration. In short, it is meant to more accurately reflect the actual metabolic strain that the bodyincurs, rather than the average stress load imposed. Here’s how it is calculated: first, a rolling 30-second average (mean of the last 30 seconds) is applied to thewattage values from the downloaded workout file, since the body does not respond instantaneously to rapidchanges in exercise intensity, rather, most physiological responses follow a predictable time course with a half-life of approximately 30 seconds. Next, each of the values obtained from this is raised to the 4th power, just as
blood lactate response has been shown to closely fit the plot of y = x4, where y = blood lactate and x = poweroutput; indeed, many critical physiological responses (e.g., glycogen utilization, lactate production, stress hormonelevels) are similarly related to exercise intensity in a curvilinear, rather than linear relationship. Finally, all thesevalues are averaged, and the 4th root is taken. If that all seems a bit complex, just think of adjusted power as the equivalent power you would have achieved ifthe race course had been perfectly flat and the pace perfectly steady, with no variations. Two other metrics of workout performance, intensity factor (IF) and training stress score (TSS), are derivedfrom normalized power, though space considerations preclude further discussion; the previously-mentionedCyclingPeaks Software includes all three of these features and has a nice explanatory article as well, athttp://www.cyclingpeakssoftware.com/defined.html, while there is a free on-line calculator athttp://www.virtusphysica.com/htmlspecialedition2003.htm.
Q: How does altitude affect power output? A: The effects of altitude on VO2 uptake (and hence aerobic power) are highly individual, so it is difficult to predict
to what extent any one person will be affected, although as a general rule it has been shown that elite athletes,as compared to normal individuals, have a greater decline in VO2max under conditions of reduced ambient pO2
(partial oxygen pressure). This is caused by their higher cardiac output, which results in a decreased meantransit time for the erythrocytes (red blood cells) within the pulmonary capillary, and thus less time forequilibration between alveolar air and blood in the pulmonary capillary.
4/23/2010 FAQ for training with power
midweekclub.ca/powerFAQ.htm#Q17 9/20

These equations from Bassett et al.1 were generated from 4 groups of highly trained or elite runners, so they arepopulation-specific to that group, but can be used to estimate aerobic power at a given altitude as a percentage yof what is normally available at sea level, where x = elevation above sea level in km:
acclimatized athletes (several weeks at altitude): y = -1.12x2 - 1.90x + 99.9 (R
2 = 0.973)
non-acclimatized athletes (1-7 days at altitude): y = 0.178x3 - 1.43x
2 - 4.07x + 100 (R2 = 0.974)
whereas Peronnet et al.2 found y = -0.003x3 + 0.0081x
2 - 0.0381x + 1. Here is a table derived from theseequations:
ELEVATION AVAILABLE AEROBIC POWER
(feet above sea level)Bassett et al.1 Peronnet et al.2
acclimatized non-acclimatized
0 99.9% 100.0% 99.9%
1,000 99.2% 98.6% 98.8%
2,000 98.3% 97.0% 97.8%
3,000 97.2% 95.2% 96.8%
4,000 95.9% 93.2% 95.8%
5,000 94.4% 91.1% 94.7%
6,000 92.7% 88.9% 93.5%
7,000 90.7% 86.5% 92.2%
8,000 88.6% 84.2% 90.7%
9,000 86.3% 81.7% 88.9%
10,000 83.7% 79.3% 86.7%
11,000 80.9% 77.0% 84.3%
12,000 78.0% 74.7% 81.4%
13,000 74.8% 72.5% 78.0%
14,000 71.4% 70.4% 74.2%
1Bassett, D.R. Jr., C.R. Kyle, L. Passfield, J.P. Broker, and E.R. Burke. Comparing cycling world hour records, 1967-1996:modeling with empirical data. Medicine and Science in Sports and Exercise 31:1665-76, 1999.
2Peronnet, F., P. Bouissou, H. Perrault, and J Ricci. A comparison of cyclists’ time records according to altitude and materialsused. Canadian Journal of Sport Science 14(2):93-8, June 1989.
Thanks to David Bassett, Jr., Ph.D., for his contributions to this section. Q: Where can I get more information on training by power? A: Wattage forum member Andrew Coggan has created a ‘schema’ of Power-based training levels (backup sites
#1 and #2), which Charles Howe has included in Part 1 of The Road Cyclist’s Guide to Training by Power, athttp://pdqcleveland.org/power.htm. Another article by Coggan is Racing and Training With a Power Meter(backup sites #1 and #2), while a number of power-related articles can be found at the Power Tap (archived),SRM (plus more at The Bike Age), and Cycling Peak Software web sites. Additionally, Robert Chung and AmitGhosh have personal web sites with many good articles, as do http://analyticcycling.com andhttp://bicyclewattage.com. Finally, the Wattage Forum (http://topica.com/lists/wattage) can provide much help and advice from that list’smany members; supplemental list archives are at http://users.icubed.com/~mayhew/wattage as a StuffIt file,while the StuffIt Expander utility needed to open this file is at http://stuffit.com.
Q: What about power-based training indoors? A: (Charles Howe, Andrew Coggan, and Bruce Sargent) Stationary trainers can offer an important form of
supplementary training, not merely over the winter months or when the weather is foul, but even during goodweather when a controlled, structured workout is desired. Stand-alone trainers such as the SRM and Velotronappear to be well-calibrated, as is most any good lab ergometer, such as those manufactured by Lode. Inevaluating the wattage readout accuracy claims of bike-stand models, however, it is important to realize that justbecause a device has a digital display (such as the Computrainer, Cateye CS-1000, and various Tacx models)does not mean it accurately or reliably reports power output – and precision in administering the exercise load isone of the most important benefits of power-based training. Indeed, of the various models that claim to be
4/23/2010 FAQ for training with power
midweekclub.ca/powerFAQ.htm#Q17 10/20

calibrated for power, only the Velodyne (http://www.velodynesports.com) appears to be consistently accurateand precise (see http://tinyurl.com/36j5v), while realistically replicating the actual demands of cycling on theroad. It achieves this with a feedback control system that measures and adjusts the resistance of an electrically-controlled brake as well as a 10 kg flywheel that simulates the “inertial” forces encountered during actual riding. When properly calibrated, it faithfully reproduces the experimentally validated speed-to-power equation (bysoftware design), although it assumes a set value for frontal area which may or may not correspond to that ofthe individual riding it. Additionally, it will simulate drafting (though the magnitude of the simulated reduction inair resistance is unknown), but not headwinds or tailwinds. In ergometer mode, it will hold wattage constantdown to ~5 mph, i.e., power will not vary as your speed changes at levels over 100 Watts. The ability tomaintain constant power in “erg” mode is a bit speed-dependent in the other direction too, i.e., rolling resistanceaccounts a large enough fraction of the total power demand that it is hard to get the power down when wheelspeed is too high. Overall, an on-bike power meter in combination with most any bike-stand load generator is the most affordable,flexible, and accurate arrangement for precision power-based training indoors; those with a flywheel adequatelyheavy to simulate inertial forces (designated with an “*” below) are recommended. Except for the Velodyne, anaccurate power meter is the only way to know the energy requirement of bike-stand models, which renders theload generator’s readout superfluous. (Note: the accuracy of the Polar S-720i/710i on indoor trainers hasfrequently been observed to be highly unreliable.) Stand-alone trainers:
Cardgirus – http://www.cardgirus.com/english.htm (See also Andy Birko’s review)Cyclesimulator – http://www.cyclesimulator.comKettler Ergo Racer – http://www.worldclasscycles.com/kettler_ergo_racer.htm or http://www.kettler.netLode ergometers – http://www.lode.nl/en/index.html PowerTap – http://www.power-tap.com SRM – http://www.srm.de/trainerclothing.htmlVelotron – http://www.velotron.com/index.asp Bike stands:
1up USA CPR A-2000 – http://www.1upusa.com/bike_trainer.html*Bike Technologies Advanced Training System – http://www.biketechnologies.com/products/ats/ats.html and
http://www.usauzziesales.com/training_system_details.htmBlackburn Fluid and Mag Trainers – http://www.blackburndesign.com/2004/trainers_04.htmCateye CS-1000 – http://www.cateye.com/products/accessories/CS_1000.html*Chaindriver – http://www.chaindriver.com Cycleops – http://cycleops.comKinetic – http://kurtkinetic.com (*custom version: http://analyticcycling.com/ThingsWeSell.html)Kreitler – http://www.kreitler.com Tacx – http://ww.tacx.nl Power requirements of numerous bike-stand models have been charted athttp://www.geocities.com/almost_fast/trainerpower, while Robert Wells has posted a careful evaluation of theTacx Flow at http://home.comcast.net/~rwwells/Tacx/DOEFlow.html.
Q: What does accuracy matter anyway, so long as a unit’s readout is consistent? A: (Andrew Coggan) Accuracy is important if:
1. you wish to compare your performance over the long term with different devices;2. you wish to compare your performance to others;3. you want to use a self-assessment tool such as use my “Power Profiling” tables, or4. you wish to do any modeling, e.g., to predict your time on a new course.
It is true, however, that precision (reproducibility) is probably more important than accuracy – but that includesacross various power outputs, pedaling speeds, etc., as well as across brands of powermeter. Care must beexercised when comparing data collected using different power meters, even if they have all been carefullycalibrated. In my own case, for example, the slight improvement in power I’ve seen at various longer durationsrecently, as compared to previous years, can potentially be accounted for entirely by my switch to SRM fromPowerTap, since the former measures power “upstream” of the chain, whereas the PowerTap measures it“downstream,” or after the chain. On the other hand, my power at 5 seconds is down significantly, as are peakvalues at 10, 15, and 30 seconds, but 1 minute isn’t, which makes me believe that it is real, and not an artifact ofthe change in systems. Without careful assessment of the data collected with each powermeter, however, anincorrect conclusion about whether a certain type of training is or isn’t working might be reached.
Q: Can a power meter be used as an aid in dieting?
4/23/2010 FAQ for training with power
midweekclub.ca/powerFAQ.htm#Q17 11/20

A: Since they accurately measure energy output, power meters can be used to estimate metabolic energy
expenditure in kilocalories (simply “calories” in common usage.) Most models give the total work for a ride inkilojoules (kJ), but if not, average power output for the ride can be converted to kJ when multiplied by rideduration in hours (decimal form) and a factor of 3.6. For instance, if you averaged 142 Watts for 1 hour 22
minutes, that’s 142 W ´ 1.37 hr ´ 3.6 = 699 kJ. Since the body is ~20-25% thermodynamically efficient, thisroughly cancels out the unit conversion factor (4.184 kJ = 1 kcal), and the work accomplished in kJ during a rideis pretty near equal to kcal burned by the body. Unfortunately, efficiency varies during a ride, increasing directlywith intensity, and it must be determined in a lab, but here are factors for converting kJ to kcal over a range ofvalues for efficiency:
If you are 25% efficient, kJ × 0.96 = kcal, and 87.1 W are produced by each liter of oxygen uptake
for 24% efficiency, kJ × 1.00 = kcal, and 83.6 W are produced by each L of O2 uptake
for 23% efficiency, kJ × 1.04 = kcal, and 80.1 W are produced by each L of O2 uptake
for 22% efficiency, kJ × 1.09 = kcal, and 76.6 W are produced by each L of O2 uptake
for 21% efficiency, kJ × 1.14 = kcal, and 73.2 W are produced by each L of O2 uptake
for 20% efficiency, kJ × 1.20 = kcal, and 69.7 W are produced by each L of O2 uptake
The OwnCal feature of Polar HRMs only estimates calories expended, based on averages derived from largesamples, and thus can vary widely by individual, as the manufacturer itself admits.
Q: I’ve heard that temperature really affects the accuracy of the SRM and PowerTap. True? A: (Andrew Coggan, Chris Cleeland, Jesse Bartholomew, and Andy Birko) A recent study found that both read
higher in colder air than warmer (8° C, or 36 F) as compared to the lab (70° F), but this was because theinvestigators tested them without re-zeroing. In other words, they deliberately disregarded the manufacturer’srecommendations for use, and the error should therefore be viewed as a worst-case scenario due to improperoperation. If you reset the zero at the same temperature at which you collect data, then accuracy will beunaffected.
The PowerTap autozeros when coasting (i.e., whenever there is zero torque applied), however, if there is an
offset of more than ±8 in-lbs, the unit will require the user to re-zero. This usually occurs due to a largetemperature change, so to obtain the most accurate data, you shouldn’t just look for non-zero watt values whilecoasting, you should look for non-zero torque values. This page from a software company shows that proper engineering can detect strain in the presence of thermal-induced stress.
Q: How do I calibrate my power meter?
A: (Andrew Coggan) Neither the Polar S-710 nor the PowerTap require calibration after initial set-up. Calibrationof the SRM via slope adjustment can be performed by the user, as described in the Owner’s Manual athttp://www.srm.de/index.php?la=3&lb=3&lang=ger (click on “Troubleshooting,” then “Calibration check”), anda more complete calibration procedure is now available un the U. S. as well.
Technically, the PowerTap cannot be user-calibrated, but its accuracy can be checked using a simple test that issimilar to the SRM calibration check. First, check that the transmission icon is on, and if not, give the rear wheela spin. Then, enter the torque mode by holding the “Select” button down for 2 seconds or longer (the “WATTS”designation will disappear from the top line.) Apply the rear brake sufficiently to lock up the rear wheel. Now,measure torque as follows: with the cranks exactly horizontal (right crank at 3 o’clock), hang a known weight ofat least 50 lbs from the right crank, or simply stand on it – hence the name ‘stomp test’! Measured torque = (weight in lbs) × (crank length in mm) × (1 in/25.4 mm) × (cog teeth/chainring teeth). For a 159 lb riderstanding on a 175 mm crank, with the chain on the 39 tooth ring and the 23 tooth cog, 159 lbs × 175 mm × 1in/25.4 mm × 23/39 = 646 in-lbs. Compare this to the displayed value by calculating % error as (measuredtorque - displayed torque)/measured torque.
Q: Can I race with a power meter?
A: Sure! The most obvious application is time trialing, where it is invaluable for pacing, particularly in the initial
stages of the race, and even for pursuit events on the track, as well as short (<10 minute), prologue-type eventson flat terrain. Although criteriums allow fewer situations where power data can be conveniently accessed
4/23/2010 FAQ for training with power
midweekclub.ca/powerFAQ.htm#Q17 12/20

during the race, it can be used in road races to judge effort when off the front, in a breakaway, or bridging up,and when seeking the “sweet spot” in a paceline or echelon. Even if not useful during the race, a power metercan be used as a “black box” (ride data recorder), allowing informa-tion to be analyzed afterward to quantify thedemands of the race, and training programs to be tailored accordingly. Still, some who train using a power meterchoose to race without it for psychological reasons, and ultimately, its use in competition is a matter of personalpreference, like an HRM.
Q: How does the PowerTap calculate cadence without a sensor?
A: (Andrew Coggan) This “virtual cadence” feature estimates crank rpm based on the time from one peak in
torque to the next as your legs pump up and down. Such peaks occur very frequently (e.g., every 333.3milliseconds at 90 rpm) and have to be identified “on the fly,” so any slight variation in either when pushed downthe hardest or when the computer thinks you pushed down the hardest will therefore have a significant effect. Depending on how/how fast you pedal, the cadence values can therefore be quite erratic, even though thepower measurements are still accurate.
Q: Can I use the PowerTap just as a computer, without the hub? A: (Andrew Coggan) An undocumented function of the original (grey case) PowerTap Standard, this is now
explained in the owner’s manual for the PowerTap Pro. Anyway, in the normal (not interval) mode, scroll tocurrent cadence (it should be all dashes if the cranks are not turning). Hold down the “select” (right-hand)button for about 3 seconds until it says “OFF” on the top line where Watts are normally displayed. Speed, heartrate, and distance will now be shown, but not cadence or Watts. Return to normal mode by reversing theprocess (you will have to cycle back to current cadence, since as soon as you let up on the right button duringthe above procedure, the computer jumps to average cadence).
You need to mount a magnet on the rear wheel and ensure it passes very close to the sensor (5 mm or so). According to a PowerTap, the receiver on the bike may be more “particular” about magnet strength and locationthan your average cycling computer, which may be why this function was left undocumented.
Q: The drive-side bearing cone in both my PowerTap Pro and Standard hubs wore out after less than 3,000
miles – it makes a crunching sound and does not turn very smoothly. Any suggestions? A: This is a clear deficiency in materials that should be corrected by the manufacturer. Until they do so, try using
item SH-3AO9803, a right cone for Shimano Dura-Ace rear freehub FH-7700, available from Loose Screws for$12.20 each. Grind or machine the narrow end of the cone down a few millimeters since it is too long, and filethe inboardmost ‘step’ off the aluminum spacer that comes with the PT hub, but once you do, it all works fine,and since there is a rubber lip seal on the cone, the hub will be double-sealed. There are other Shimano conesthat may fit better, but I don’t know which ones for sure, and this one is the best quality.
Note that the non-drive side bearings are sealed, and must be serviced by the manufacturer.
Q: What can I do to improve the waterproofness of my PowerTap hub? A: (Chris Cleeland and Lindsay Edwards) Get some tune-up grease, also known as dielectric grease (or heat sink
grease in the electronics world, although that tends to have thermal conductivity properties as well as beingdielectric) from the nearest auto parts store (or “auto spares” as they say in the U. K.) This is the stuff that’smade for the inside of spark plug wire boots to ensure that they can be removed, but won’t conduct electricity. Squeeze a liberal portion of this on to your finger, then smear it all over the leaf contacts both on the cradle andthe nubs on the back of the CPU. This will keep water and moisture out of the contacts, but maintain theconnection.
The other issue is water in the hub itself, which happens to me less often, perhaps 1/3 of the time I ride in rain(though I have yet to be caught in an all-out downpour). It also happens in heavy fog occasionally. A simpleovernight period where you take the cover off is enough to dry it out and get things working again. I’d suggestusing tune-up grease here, too. It’s a little thicker than Pedro’s syngrease, doesn’t break down in heat as much,and if it does, it won’t affect electrical connections. Here’s a link describing Permatex’s product and to a placeselling it online: http://www.permatex.com/products/prodidx.asp?automotive=yes&f_call=get_item&item_no=22058
4/23/2010 FAQ for training with power
midweekclub.ca/powerFAQ.htm#Q17 13/20
http://shop.store.yahoo.com/autoaccessconnect/digr.html Finally, apply some silicone sealant around all the joints of the receiver, paying special attention the point wherethe cable enters the body of the receiver.
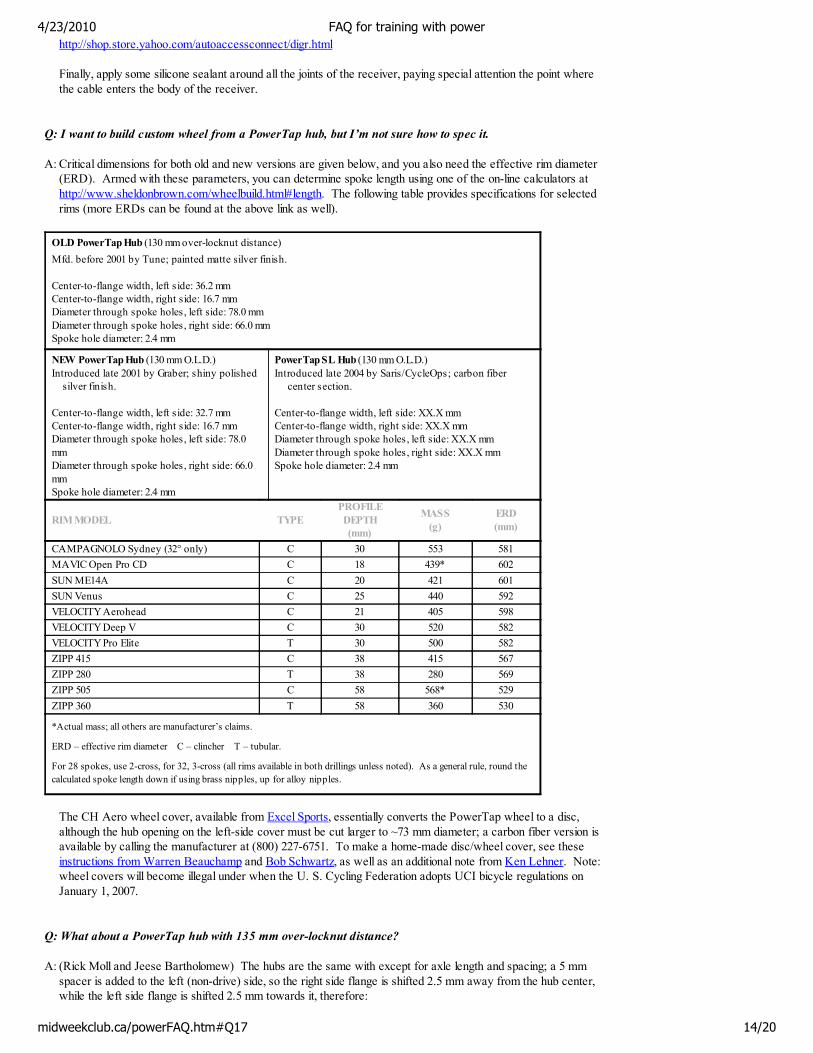
Q: I want to build custom wheel from a PowerTap hub, but I’m not sure how to spec it. A: Critical dimensions for both old and new versions are given below, and you also need the effective rim diameter
(ERD). Armed with these parameters, you can determine spoke length using one of the on-line calculators athttp://www.sheldonbrown.com/wheelbuild.html#length. The following table provides specifications for selectedrims (more ERDs can be found at the above link as well).
OLD PowerTap Hub (130 mm over-locknut distance)
Mfd. before 2001 by Tune; painted matte silver finish.
Center-to-flange width, left side: 36.2 mmCenter-to-flange width, right side: 16.7 mmDiameter through spoke holes, left side: 78.0 mmDiameter through spoke holes, right side: 66.0 mmSpoke hole diameter: 2.4 mm
NEW PowerTap Hub (130 mm O.L.D.)Introduced late 2001 by Graber; shiny polished
silver finish.
Center-to-flange width, left side: 32.7 mmCenter-to-flange width, right side: 16.7 mmDiameter through spoke holes, left side: 78.0mmDiameter through spoke holes, right side: 66.0mmSpoke hole diameter: 2.4 mm
PowerTap SL Hub (130 mm O.L.D.)Introduced late 2004 by Saris/CycleOps; carbon fiber
center section.
Center-to-flange width, left side: XX.X mmCenter-to-flange width, right side: XX.X mmDiameter through spoke holes, left side: XX.X mmDiameter through spoke holes, right side: XX.X mmSpoke hole diameter: 2.4 mm
RIM MODEL TYPEPROFILEDEPTH(mm)
MASS(g)
ERD(mm)
CAMPAGNOLO Sydney (32° only) C 30 553 581
MAVIC Open Pro CD C 18 439* 602
SUN ME14A C 20 421 601
SUN Venus C 25 440 592
VELOCITY Aerohead C 21 405 598
VELOCITY Deep V C 30 520 582
VELOCITY Pro Elite T 30 500 582
ZIPP 415 C 38 415 567
ZIPP 280 T 38 280 569
ZIPP 505 C 58 568* 529
ZIPP 360 T 58 360 530
*Actual mass; all others are manufacturer’s claims.
ERD – effective rim diameter C – clincher T – tubular.
For 28 spokes, use 2-cross, for 32, 3-cross (all rims available in both drillings unless noted). As a general rule, round the
calculated spoke length down if using brass nipples, up for alloy nipples.
The CH Aero wheel cover, available from Excel Sports, essentially converts the PowerTap wheel to a disc,although the hub opening on the left-side cover must be cut larger to ~73 mm diameter; a carbon fiber version isavailable by calling the manufacturer at (800) 227-6751. To make a home-made disc/wheel cover, see theseinstructions from Warren Beauchamp and Bob Schwartz, as well as an additional note from Ken Lehner. Note:wheel covers will become illegal under when the U. S. Cycling Federation adopts UCI bicycle regulations onJanuary 1, 2007.
Q: What about a PowerTap hub with 135 mm over-locknut distance?
A: (Rick Moll and Jeese Bartholomew) The hubs are the same with except for axle length and spacing; a 5 mmspacer is added to the left (non-drive) side, so the right side flange is shifted 2.5 mm away from the hub center,while the left side flange is shifted 2.5 mm towards it, therefore:
4/23/2010 FAQ for training with power
midweekclub.ca/powerFAQ.htm#Q17 14/20

Center-to-flange width, left side = 32.7 mm - 2.5 mm = 30.2 mmCenter-to-flange width, right side = 16.7 mm + 2.5 mm = 19.2 mm
Q: How can build up a Power Tap hub as a fixed-gear wheel? A: Check out this article: http://www.smartcyclinginc.com/helparticle.html
Q: How can I mount the PowerTap harness on my stem? A: (Chris Mayhew) You can do this by crossing the zip ties so that they exit one side of the mount but cross over
and enter the other side. A cleaner method, however, is to tightly wrap electrical tape around the stem and thelower part of the mount, behind the ‘ears.’ Be careful how much tape you use; too much will cause a poor fitbetween the harness and PT. With both methods it’s best to put a very small piece of pipe insulation under theharness to fill in the gaps.
An off-the-shelf mount can be purchased at http://www.cingcycling.com.
Q: My bike has a Campagnolo derailleur, but the PT has a Shimano 9-speed freehub. What to do? A: (Brian Smith and Eddie Monnier) Quoting Sheldon Brown, “For reasons that are not quite clear, 9-speed
hubs/cassettes seem to work pretty well with the opposite brand of 9-speed derailleur/shifter,” the operativewords being “pretty well,” so results may vary, but many report doing so without any problem (avoid using aCampagnolo chain on Shimano cogs, however). An excellent cassette to convert the PowerTap for use with Campy 10 is available from Wheels Manufacturing(see http://www.wheelsmfg.com/4.html), but the one from American Classic is not recommended (see“Important Notes” at http://www.amclassic.com/Cassettes_Conv.html – “The following wheels and hubs areincompatible: Shimano pre-built paired spoke wheelsets, and ALL Powertap hubs.”) It seems that the spacerson this model, and on the cassette from Miche as well, are fixed so that the smallest cog (e.g., the 11) just barelyseats onto the PowerTap freehub body, making it vulnerable to “spinning” on the freehub body. With theWheels cassette you will get a few spacers that are wafer thin, so you can fine tune how much the smallestsinks into the body. This gives a more positive fit so that you shouldn’t have any problems.
Q: Which of the two types of PowerTap pickups should I use?
A: (Jesse Bartholomew) All PowerTap hubs made by Tune (matte silver-grey hub body) and some CycleOpsPowerTap hubs are designed to be used with a receiver that mounts 7" from the hub for optimum signaltransmission; these have a serial number of 27383 or less. In a successful attempt to limit data drops, we“tuned” the hub and receiver, resulting in a new receiver that needs to be mounted closer (3-5") to the hub; thesehave a sticker indicating how to mount them on one side, a CycleOps brand sticker the other side, and serialnumber greater than 27383. Part of the tuning was to desensitize the receiver a bit, and because the new PowerTap SL hub transmitsthrough carbon “windows” in the hub shell, the signal is weaker, and the receiver won’t pick it up consistently, sowe’ve gone back to the original 7" style receiver, but we recommend mounting it no more than 3" from the hubto maximize consistent data transmission. I know that’s terribly confusing, but the short version is that the onlycombination that won’t work together is the SL with the 3-5", current receiver. So if you do upgrade to the SLyou’ll need to use the SL model receiver with whatever other hub you are using for training.
Q: I have a Mac G3 Powerbook without serial ports and want to run the Polar software with IR interface.
How can I do this?
A: (Bill Pence) Use the Keyspan High Speed Serial to USB adapter and the serial version of the IR receiver fromPolar. You need to be running Virtual PC 5.0 and Windows 2000. The Mac OS needs to be 9.2, as 9.1 doesnot seem to work too well with VPC, nor does OSX (OS 10). I’ve run the Polar PPP under VPC 3.0, whichworked fine, but the IR adapter didn’t work. I found that I needed to upgrade my device driver to Keyspan V1.9.
Finally, I needed to plug the Keyspan Serial Port adapter into a USB port on the back of my G3 – for some
4/23/2010 FAQ for training with power
midweekclub.ca/powerFAQ.htm#Q17 15/20

reason it was not happy plugging into the spare USB port on the keyboard. I have not been able to make theUSB IR interface work with this setup, but serial port works just fine the way I have it set up now with my S-710. After that it is a matter of setting all of the dialog boxes correctly. With the IR adapter plugged into Port 2 ofthe adapter, the Keyspan Control panel it will advise you of the devices attached. Click Advanced Settings formore detail. Pull down the menu in the dialog box to Port #2. It should read something like P#2USA28X02. This is specific to the Keyspan device, and identifies port number 2 (where you plugged the adapter). If funnythings have been happening, you may reset the port here. Mine is set to receive FIFO of 16 and a buffer of 64,both default values. Also, make sure interrupt endpoints is set. I do not know what effect it has, and am notanxious to find out. Leaving Keyspan and launching VPC, once Windows has booted up, look in the menu bar on the Mac side ofthe house (hold down the Apple key and the Mac menu bar appears) and pull down “Edit Windows 2000Settings’” which brings up the settings list. Click on COM 1. A dialog box will appear to the right of thewindow with various radio buttons. Click “Mac Serial Port.” P#2USA28X02 should appear below it; this isyour Keyspan Port with the IR adapter on it. Check “Non-Modem device” on the next line below, and theCOM 1 port is now mapped to the Keyspan port that the IR Adapter connects to. One more step. Launch the Polar Software (new versions are best). Pull down the “Options-Preferences”menu. A dialog box will appear labeled “Software Preference,” and click on the “Hardware” tab. In the top ofthe box is a section devoted to the Polar S-series HR monitor. Set the pull down menu to COM 1. Click the“Options” button. I have mine set to USB Autocheck and Keep HR in Connect Mode. I don’t think it mattersunless you check “Use Windows Internal IR” port, which would be very bad. Set the 710 in front of the IR receiver and click the connect button. It should connect and work just like runningon a Windows PC, and that should be all there is to it. I do not believe the USB IR adapter will work withVirtual PC. I tried. A lot. VPC is not happy sharing USB devices with the Mac OS.
Q: (Brian McLaughlin) Hold on there! I have been using OSX with VPC 6, using the USB Keyspan
converter model USA-19QW. It all works fine with PowerTap software and CyclingPeaks software. The
driver CD that I have is 1.2 for OS X, 1.9 for 8.6-9.x, and it works fine as long as I make sure it is
recognized in the set-up of VPC before I try to download data. I use COM 2. A: Thanks!
Q: When starting VPC 6 on my iBook (OSX), it takes forever – so much so I have never actually opened it.
My iBook has 128 MB – and I have a suspicion that VPC 6 needs 256 MB. Does anyone know? A: (Anne Grofvert, Chris Bartholomew, and Jeff Lawson) 192 MB of RAM is what Microsoft specs for 6.1, but to
run VPC you really need to allocate much more RAM than recommended. I have 756 MB and have allocatedalmost 400 MB to VPC to get it running smoothly. When you exit VPC be sure to “save all and quit” topreserve your settings, so that VPC it doesn’t take forever to load the next time.
The beauty of the new Panther operating system is that it allocates memory to the programs being used, so VPCdoes not affect the functioning of the machine when you are using other applications. VPC does not seem torun on a G4 either, again, due to lack of memory capacity. It just sits there and does not load.
Q: My Polar S-710 has been difficult to install. Any suggestions beyond what’s in the owner’s manual?
A: Wattage Forum member Robert Chung has devoted a page to this at his web site: http://tinyurl.com/ijav, andthere is a video at the Polar web site http://polarusa.com/consumer/powerkit/installvideo.asp (Tom Anhalt) The angle of the chain across the sensor and whether or not the sensor module is parallel to thechain do not matter; all that counts is to position the module so the chain is no farther than 30 mm, in all usablegear combinations, from an approximately 1” square area centered on the “middle” mark on the module. If thisrequirement is met, and if the cadence sensor is properly positioned (which depends on the particular magnet youuse), you’ll get consistent readings, otherwise, the chain vibration signal will be weak and the signal processorwill tend to “lock on” to signal noise, causing erroneous readings. Some comments on the Polar installation video:
4/23/2010 FAQ for training with power
midweekclub.ca/powerFAQ.htm#Q17 16/20
1. why mark the center of the chainstay? This is the first thing shown, but it’s not used for anything. Thelocation of the module on the chainstay is driven solely by the placement of the magnet on the crank, andthen placing the module so that the cadence sensor lines up.
2. the routing of the speed sensor wire just begs for it to get snagged and ripped out. There are much bettertechniques for routing and securing this wire to the derailleur that will minimize this threat.
3. it is a mistake to make the vertical spacing measurement 5-10 mm in the small-small combo. It’s thewrong end of the range from which to make this critical measurement, since the chain will be much fartheraway than 30 mm even in the small chainring-large cog combo. I run a pretty “normal” gear setup (53/39,12-25 cogs), and if I try to run the 39 x13 (which I don’t because of the cross-chaining), the chain actuallyrubs on the sensor.
4. there is no mention of making sure the chain passes over the sensor in all gear combinations, a significantomission.
Finally, to protect the sensor module, I first tried some mylar, but that didn’t last long. The best thing to do is tograb a couple of black zip ties and wrap them around the module right over the top of the magnetic frequencysensor (that’s where the chain will be pulled down). This way, the chain will rub on the “sacrificial” zip tiesinstead of the top of the module.
Q: I’ve had problems with the cadence magnet that came with my Polar power kit. It just doesn’t want to
stay in place on the crank arm.
A: (David Bilenkey and Tom Anhalt) The magnets supplied with the kit work poorly, if at all – don’t bother withthem. Instead, get a 1/2 or 3/8” diameter “rare earth” magnet, such as from Radio Shack, Lee Valley Tools, orNational Imports. These are small disks, 1/8” – 1/16” thick, and should cost less than $2. If your pedal spindles have any ferrouscontent (“stainless steel” may or may not), just drop one on the backside of the spindle. Align the magnet in thebest location to make the little cadence light blink. No tape required; it’s strong enough not to fall off, but notstrong enough to pull the chain over against the crank. To remove the magnet, remove the pedal and slide the magnet sideways to get a grip on it and peel it off. Ifyour pedals have titanium spindles, or non-ferrous stainless steel, simply place a piece of electrical tape acrossover the magnets so they won’t fall off during bumps. You might also try gluing the rare earth magnet to the center of one side of a ½” diameter ceramic magnet(making sure you match a south pole to north, or vice versa) and then glue this “stack” to the backside of yourpedal spindle. This should eliminate any problems with chain interference.
Q: As an aside, how does the Polar power module ‘know’ the free length of the chain? A: (Jean-Joseph Cote) Since cadence, wheel speed, and chain speed are measured, there’s enough information to
calculate the number of chainring and sprocket teeth, and from there, the diagonal length of the vibrating sectionof the chain can be obtained (this is in the patent). Polar chose not to display the gear numbers, presumably dueto limitations of the display size.
Q: Is it true that downloading drains the battery in the PowerTap Standard computer? A: It will if you leave it in the download cradle. Remove it after downloading, replace it in the handlebar mount, and
let it “fall asleep.” Then, remove it and do a “clr all.” It is now in its most efficient mode. When the batterystarts to get low, HR function seems be the first thing to go, becoming unreliable, with many “data drops.”
Q: I'm running XP Pro on a Pentium 4 CPU, and when trying to install the PowerTap Link software (vers.
1.02), I get the same crash.
In the “Quick Access” Screen, whenever I click on rider management, I get the following run-time error
Runtime Error
'-2147024769(8007007f)'
Method '~' of object '~' failed
4/23/2010 FAQ for training with power
midweekclub.ca/powerFAQ.htm#Q17 17/20

A: (Rick Sladkey) It sounds like your data access components did not get properly updated by the link installer.
You might try manually installing the latest Microsoft Data Access Components (MDAC) 2.8:http://www.microsoft.com/downloads/details.aspx?FamilyID=6c050fe3-c795-4b7d-b037-185d0506396c&DisplayLang=en
Q: I need a converter so I can download the PowerTap to a USB port, rather than a serial port for which it
was designed. A: Try item the adapter Keyspan High Speed USB-Serial Adapter USA-19HS (recommended by PowerTap;
formerly USA-19QW), at http://keyspan.com/products/usb/usa19hs/, item GUC 232A from iogear athttp://www.iogear.com/products/product.php?Item=GUC232A, or Belkin item USB-A/DB9M athttp://www.officedepot.com/shop/catalog/sku.asp?ID=913114&LEVEL=SK. There are alsohttp://sewelldirect.com/USBtoSerial.asp?kid=-691449310&match_type=search andhttp://www.tigerdirect.com/applications/searchtools/item-Details.asp?EdpNo=542934&sku=B131-5002
Q: Help! My PowerTap Standard stops downloading after only 250 records! A: (David Easter) First, some background: during a download, the firmware in the PowerTap CPU transmits data
in blocks of 256 records. Each record contains data from a single sample (once every 1.26 seconds or longer,depending on the recording interval). Each block is terminated with a calculated “checksum,” i.e., a consistencyvalue designed to detect any errors that might be introduced on the serial link between the PowerTap and thePC. As the PC receives each block of data, it calculates the check value from the received data and comparesit with the value transmitted by the PowerTap. If it matches, the download continues, if not, you get thedownload error. For reasons nobody seems to understand, the PowerTap sometimes generates bad check sequences. That’swhy the download goes to ~250 every time and quits. The data isn’t being corrupted on the serial line but thePC thinks it has, and bails out after the first block. I’ve had this problem most recently after fighting with whatturned out to be a bad receiver. Once I got a good one, did a “clr all,” went for a ride, and then got a “250”download error. Curiously, it got to 250 records, thought it had succeeded, but generated a file containing onlythe header record. The next day, I removed and reinserted the battery in the PowerTap CPU, and all has beenwell since. I’ve also seen variants of the problem with a CPU that stopped receiving power data and alsostarted showing screwy data while in magnet mode. One theory is that the CPU doesn’t do proper range checking on data coming from the receiver, and allowsnoisy data from interference, or a bad receiver, to corrupt the internal memory in such a way as to break thedownload protocol, however, data in the CPU still seems to be good. The trick is to get it out. A downloadprogram that simply ignores the check values might work in some cases, though I haven’t tried it, but in othercases, some of the data has obviously been corrupted and the CPU probably can’t generate the normaldownload stream anyway, regardless of what the PC would do with the check value. I have created a web site at http://www.david256.com/power/ptrescue/ to rescue data trapped by this problem.
Note: this recovery process works only with a (grey) PowerTap Standard CPU; the newer PowerTap ProCPU (yellow) is different, and this process won’t work with it.
Q: I’m having problems importing a PowerTap file that was e-mailed to me. I’m getting a message, “error
with .csv file.” A: (Brian McLaughlin, Craig Upton, & Robert Chung) The workaround is to have the sender compress the files.
Have the sender WinZip or StuffIt the file. These compression softwares will “protect” the file, so that whenthe receiver’s MS Outlook handles it, nothing is done to the file that is enclosed in its compression shell. Whenyou receive it, download the attachment, put it on your desktop, un-Zip or un-StuffIt. It should work fine. Thisalso happens with Entourage e-mail software, as well as Hotmail, which apparently uses some compression ofits own to alter the file. Comma separated value (.csv) files are actually plain text files where the fields are separated by commas. Forreasons unknown the PowerTap software requires not only that the values be separated by commas but alsothat the spacing be exact, which sort of defeats the philosophy of CSV. For odd historical reasons, e-mail programs were often allowed to treat text mail differently than other kinds ofdata streams. The foregoing CSV problem is akin to the CR/LF annoyances that used to occur when sending
4/23/2010 FAQ for training with power
midweekclub.ca/powerFAQ.htm#Q17 18/20

text mail to and from Unix systems. In some sense, the blame is equally shared: e-mail programs for modifyingfiles, and the PT software, for marrying the inefficiency of text files with the inflexibility of binary files.
Q: I forgot to make sure I had zeroed out the torque on my PowerTap before my last ride, and so all the
values for power are off. How do I now go back through the file and correct the error? A: (Rick Sladkey and Rick Moll) You need to subtract the unzeroed torque value recorded when you were
coasting from each value of measured torque, and then recalculate power from torque and speed. Find a sectionwhere you know you were coasting and actual torque was zero (i.e., when power and cadence were zero) andpick a representative torque value, then compute actual torque: (1) torqueactual = torquemeasured - torquecoasting, then re-compute power as
(2) poweractual (Watts) = 1746 × torqueactual (N-m) × speed (km/h)/wheel circumference (mm)
where wheel circumference is the same as in setup (about 2093 for a 700C × 23 mm tire). Chris Mayhew hasposted a spreadsheet at http://users.icubed.com/~mayhew/mayhew.xls to perform these calculations. Alternatively, equation 2 can be divided by (3) powermeasured = 1746 × torquemeasured × speed/wheel circumference
and both sides multiplied by powermeasured to give
(4) poweractual = powermeasured × (torqueactual / torquemeasured)
which, if used in a spreadsheet, must be protected against division by zero. Since torqueactual / torquemeasured is not a constant, neither is poweractual / powermeasured, however, equation
4 demonstrates that power is proportional to torque.
Q: What should smoothing percentage be set at?
A: (Andrew Coggan and Rick Sladkey) It depends on what you’re looking for. There are times when you mightwish to apply really gross smoothing, e.g., to better detect any overall downward trend in power during a verylong ride. On the other hand, there are times when you don’t want to smooth the data at all, such as when tryingto capture the details of a 500 meter race on the track. The same logic applies to data recording frequency . . .during very long rides it is probably sufficient to record data relatively infrequently, whereas on the track, even 1second intervals may not be frequent enough. Properly designed hardware and software should give the usermaximum flexibility with regards to these issues. To calculate the equivalent rolling average for a given smoothing level, multiply the duration of the ride or intervalin seconds by the selected smoothing percentage. For instance, 1% smoothing for a 1 hour ride would becalculated as 3600 seconds × 0.01 = 36 seconds, however, if the ride (or an interval within a ride) was 30minutes (0.5 hours) long, then smoothing to 1% would be equivalent only to an 18 second rolling average,whereas 2 hours 1% smoothed would be the equivalent of a 72 second average. It should be noted that the smoothing which the PowerTap Link software (versions 1.04 and lower) gives isnothing like a true rolling average, rather, it smoothes a curve by taking fewer points and then simply connectingthem with sinusoidal curves. This is so poor both mathematically and visually that 1% and 2% are the onlyuseful settings.
Q: My PowerTap keeps ‘cutting out’ – both power and heart rate will plummet, then come back up. This
shows up as a lot of zeroes in the downloaded file. I have checked the location and orientation of the
receiver on the chainstay, and both the hub batteries as well as the CPU batteries are fine. What next? A: This is commonly known as a case of the “data drops,” and you have taken the first steps to correct it, but if
they don’t work, perhaps the firmware in the PowerTap CPU needs upgrading. You can download the latestfrom http://velo-fit.com/articles/power%20tap_200.zip, or contact
Jesse Bartholomew, PowerTap Product [email protected]; 1-800-783-7257, ext. 159
4/23/2010 FAQ for training with power
midweekclub.ca/powerFAQ.htm#Q17 19/20

Q: How can I open a PowerTap database file in Microsoft Access? A: You need to know the password, which is “link.”
4/23/2010 FAQ for training with power
midweekclub.ca/powerFAQ.htm#Q17 20/20