
Families are changing - OECD.org - OECD · · 2016-03-29Doing Better for Families © OECD 2011 17...
37
Doing Better for Families © OECD 2011 17 Chapter 1 Families are changing Families have changed over the past thirty years. This chapter provides an overview of the changes in family formation, household structure, work-life balance, and child well-being. Fertility rates have been persistently low in many OECD countries leading to smaller families. With marriage rates down and divorce rates up, there are an increasing number of children growing up in sole-parent or reconstituted families. Sole-parent families are of particular concern due to the high incidence of poverty among such households. Poverty risks are highest in jobless families and lowest amongst dual-earner families. Important gains in female educational attainment and investment in more family-friendly policies have contributed to a rise in female and maternal employment, but long-standing differences in gender outcomes in the labour market still persist. The increased labour market participation of mothers has had only a limited effect on the relative child poverty rate as households without children have made even larger income gains. Child well-being indicators have moved in different directions: average family incomes have risen but child poverty rates are also up. More youngsters are now in employment or education than before, while evidence on health outcomes is mixed. Overall, are families doing better? Some undoubtedly are, but many others face serious constraints when trying to reconcile work and family aspirations.
Transcript of Families are changing - OECD.org - OECD · · 2016-03-29Doing Better for Families © OECD 2011 17...
Doing Better for Families
© OECD 2011
17
Chapter 1
Families are changing
Families have changed over the past thirty years. This chapter provides an overviewof the changes in family formation, household structure, work-life balance, and childwell-being. Fertility rates have been persistently low in many OECD countriesleading to smaller families. With marriage rates down and divorce rates up, thereare an increasing number of children growing up in sole-parent or reconstitutedfamilies. Sole-parent families are of particular concern due to the high incidence ofpoverty among such households.
Poverty risks are highest in jobless families and lowest amongst dual-earnerfamilies. Important gains in female educational attainment and investment in morefamily-friendly policies have contributed to a rise in female and maternalemployment, but long-standing differences in gender outcomes in the labour marketstill persist. The increased labour market participation of mothers has had only alimited effect on the relative child poverty rate as households without children havemade even larger income gains.
Child well-being indicators have moved in different directions: average familyincomes have risen but child poverty rates are also up. More youngsters are now inemployment or education than before, while evidence on health outcomes is mixed.
Overall, are families doing better? Some undoubtedly are, but many others faceserious constraints when trying to reconcile work and family aspirations.
1. FAMILIES ARE CHANGING
DOING BETTER FOR FAMILIES © OECD 201118
IntroductionFamilies are changing in many ways across the OECD and its enhanced-engagement
partners. Most countries have seen a decline in the fertility rate over the past three
decades. Today almost no OECD country has a total fertility rate above the population
replacement rate of two children per women. As a result the average household size has
also declined over this period. At the same time, there has been a sharp increase in the
proportion of women entering the labour force. The evidence on trends in child well-being
is mixed, and important challenges remain. There are still large gender gaps in
employment and earnings and one in eight children, on average across the OECD, still lives
in relative poverty.
Family formation patterns are also changing. Increasingly, both men and women want
to first establish themselves in the labour market before founding a family. Hence, the age
of mothers at first childbirth has risen and with it the probability of having fewer children
than previous generations. Many women remain childless. Birth rates have fallen and life
expectancy has increased, so there are fewer children and more grandparents than before.
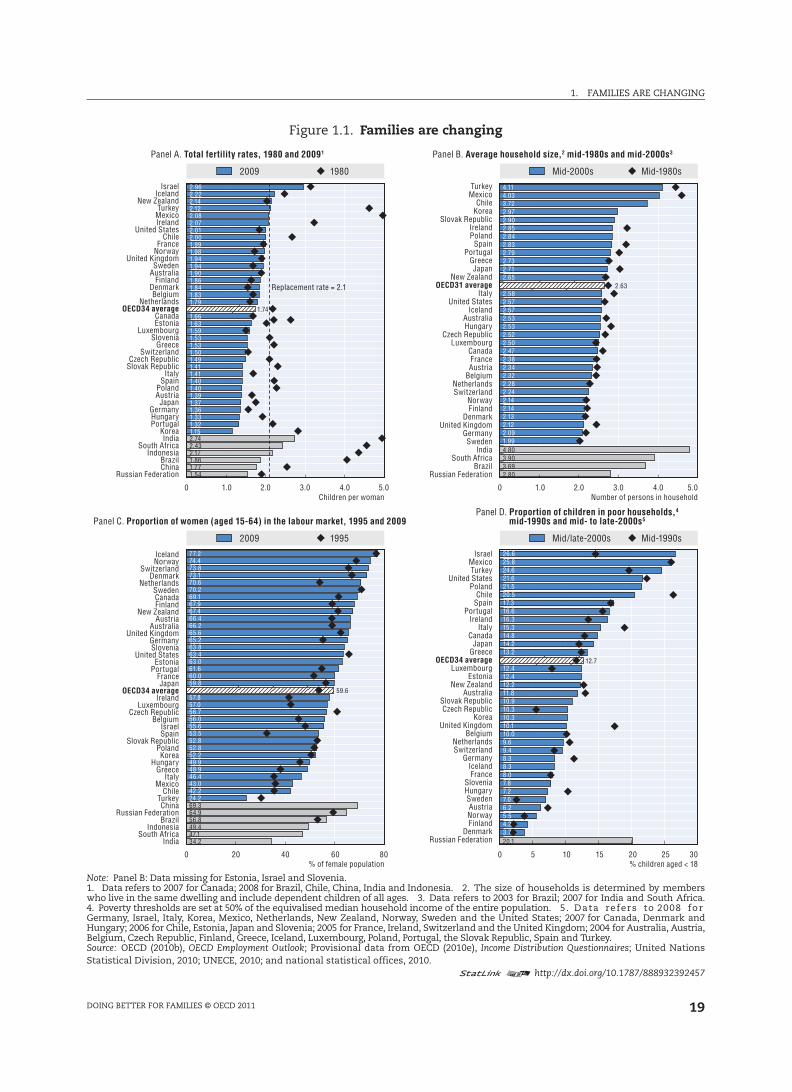
Figure 1.1, Panel A and Panel B illustrates how birth rates and average household sizes have
fallen in most OECD countries since the 1980s.1
Female educational attainment and female employment participation (Figure 1.1,
Panel C) have both risen over the last 30 years. Women have a better chance of fulfilling
their labour market aspirations and much needed additional labour supply has been
mobilised. And while increased maternal employment has contributed to material wealth
among families with children, comparable societal groups without children have also seen
similar gains. Poverty rates among households with children, based on a relative poverty
concept related to half of equivalised median household income, have increased slightly
across the OECD over the past 10 years (Figure 1.1, Panel D).
Issues in family policy, underlying policy objectives and evidence on good practices
will be discussed in subsequent chapters. This chapter outlines some of the key indicators
that illustrate modern family life and how these affect the well-being of children and
parents across the OECD countries and its enhanced engagement partners.2 The second
section provides an overview of the change in family formation over the past thirty years,
while the following section illustrates changes in household structure and changes in
parent-parent and parent-child relationships. The next section focuses on employment
outcomes for parents and what effect this may have on family poverty risks. Before
summarising the overall family outcomes, the final section considers child well-being
against three key dimensions of material, education and health outcomes.
Trends in fertility and family formationIn many OECD countries, policy makers are increasingly concerned about adults being
able to have as many children as they desire. Fertility behaviour can be constrained for
different reasons: the perceived inability to match work and care commitments because of
1. FAMILIES ARE CHANGING
DOING BETTER FOR FAMILIES © OECD 2011 19
Figure 1.1. Families are changing
Note: Panel B: Data missing for Estonia, Israel and Slovenia.1. Data refers to 2007 for Canada; 2008 for Brazil, Chile, China, India and Indonesia. 2. The size of households is determined by memberswho live in the same dwelling and include dependent children of all ages. 3. Data refers to 2003 for Brazil; 2007 for India and South Africa.4. Poverty thresholds are set at 50% of the equivalised median household income of the entire population. 5. Data refers to 2008 forGermany, Israel, Italy, Korea, Mexico, Netherlands, New Zealand, Norway, Sweden and the United States; 2007 for Canada, Denmark andHungary; 2006 for Chile, Estonia, Japan and Slovenia; 2005 for France, Ireland, Switzerland and the United Kingdom; 2004 for Australia, Austria,Belgium, Czech Republic, Finland, Greece, Iceland, Luxembourg, Poland, Portugal, the Slovak Republic, Spain and Turkey.Source: OECD (2010b), OECD Employment Outlook; Provisional data from OECD (2010e), Income Distribution Questionnaires; United NationsStatistical Division, 2010; UNECE, 2010; and national statistical offices, 2010.
1 2 http://dx.doi.org/10.1787/888932392457
0 1.0 2.0 3.0 4.0 5.0 0 1.0 2.0 3.0 4.0 5.0
0 20 40 60 80 0 5 10 15 20 25 30
1.74
2.63
59.6
12.7
1.992.092.122.132.142.142.242.282.322.342.382.472.502.522.532.532.572.572.58
2.652.712.732.792.832.842.852.902.973.724.034.11
2.803.693.904.80
20.13.74.25.56.27.07.27.88.08.38.39.49.610.010.110.310.310.911.812.212.412.4
13.214.214.815.316.316.617.320.521.521.624.625.826.6
34.247.149.456.864.969.324.242.243.046.448.949.952.252.852.853.555.656.056.757.057.8
59.860.061.663.063.463.865.265.666.266.467.467.969.170.270.673.173.874.477.2
1.541.771.862.172.432.741.151.321.331.361.371.391.401.401.411.411.491.501.531.531.591.631.66
1.791.831.841.861.901.941.941.981.992.002.012.072.082.122.142.222.96
Panel A. Total fertility rates, 1980 and 20091 Panel B. Average household size,2 mid-1980s and mid-2000s3
2009 1980 Mid-1980sMid-2000s
Russian FederationChinaBrazil
IndonesiaSouth Africa
IndiaKorea
PortugalHungaryGermany
JapanAustriaPoland
SpainItaly
Slovak RepublicCzech Republic
SwitzerlandGreece
SloveniaLuxembourg
EstoniaCanada
OECD34 average
OECD34 average
OECD31 average
OECD34 average
NetherlandsBelgium
DenmarkFinland
AustraliaSweden
United KingdomNorwayFrance
ChileUnited States
IrelandMexicoTurkey
New ZealandIceland
Israel
Children per woman Number of persons in household
Russian FederationBrazil
South AfricaIndia
SwedenGermany
United KingdomDenmark
FinlandNorway
SwitzerlandNetherlands
BelgiumAustriaFrance
CanadaLuxembourg
Czech RepublicHungaryAustralia
IcelandUnited States
Italy
New ZealandJapan
GreecePortugal
SpainPolandIreland
Slovak RepublicKoreaChile
MexicoTurkey
Panel C. Proportion of women (aged 15-64) in the labour market, 1995 and 2009Panel D. Proportion of children in poor households,4
mid-1990s and mid- to late-2000s5
2009 1995 Mid-1990sMid/late-2000s
% of female population % children aged < 18
IndiaSouth Africa
IndonesiaBrazil
Russian FederationChina
TurkeyChile
MexicoItaly
GreeceHungary
KoreaPoland
Slovak RepublicSpainIsrael
BelgiumCzech Republic
LuxembourgIreland
JapanFrance
PortugalEstonia
United StatesSloveniaGermany
United KingdomAustralia
AustriaNew Zealand
FinlandCanadaSweden
NetherlandsDenmark
SwitzerlandNorwayIceland
Russian FederationDenmark
FinlandNorwayAustria
SwedenHungarySlovenia
FranceIceland
GermanySwitzerlandNetherlands
BelgiumUnited Kingdom
KoreaCzech Republic
Slovak RepublicAustralia
New ZealandEstonia
Luxembourg
GreeceJapan
CanadaItaly
IrelandPortugal
SpainChile
PolandUnited States
TurkeyMexico
Israel
Replacement rate = 2.1
1. FAMILIES ARE CHANGING
DOING BETTER FOR FAMILIES © OECD 201120
inflexible labour markets and/or the lack of public supports, the financial costs of raising
children, and the difficulty for prospective parents in finding affordable housing to
establish a family of their own. This section illustrates the main drivers of trends in family
formation and how they vary between OECD countries. The restrictions to family
formation and related public policy issues are discussed in Chapter 3.
Fertility patterns
Demographic trends involve low and/or declining fertility rates and increasing life
expectancy in most OECD countries (OECD, 2010a, CO1.2). The resultant ageing populations
have led to a decline in the number of women of childbearing ages, and curtailed growth of
the potential labour force. In some countries this has already resulted in a sharp decline of
the working-age population, as seen in the Russian Federation (OECD, 2011a). The growing
number of retirees will lead to higher public (and private) spending on pensions and long-
term care supports for the retired population (OECD, 2010b and 2011b). Informal support
networks will come under increasing pressure as the declining number of children will
lead to a reduction of future informal carers for the elderly population.
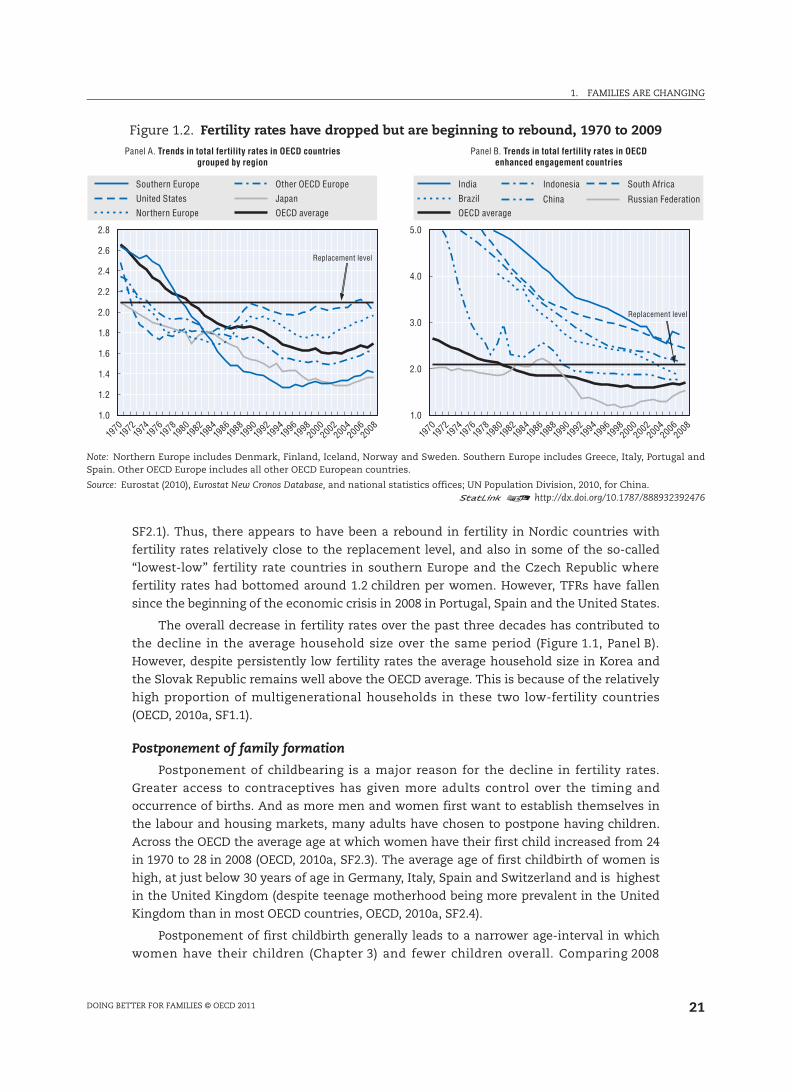
Total fertility rates (TFR) among the OECD countries have declined dramatically over
the past few decades, falling from an average of 2.7 children per woman in 1970 to just
over 1.7 in 2009 (Figure 1.2, Panel A). The average TFR across the OECD bottomed out at
1.6 children per woman in 2002 and has since edged up. Overall, the average TFR across the
OECD has been below replacement level since 1982.3 In 2009, the TFR was around the
replacement rate in Ireland, Mexico, Turkey and New Zealand, and it was above
replacement level in Iceland (2.2) and Israel (3.0). Historically, the fertility rates were
extremely high in all enhanced engagement countries, except for the Russian Federation,
with TFRs greater than 5.0 children per woman in the early 1970s. Since then there has
been a steady decrease in Brazil, India, Indonesia and South Africa, with the TFR dropping
below 3 children per women in all four countries in recent years. In China, where fertility
rates were also high, around 4.8 in the early 1970s, there was a large decrease in the
late 1970s, and, following the introduction of the one-child policy, the TFR fell
to 2.3 in 1979. Since then there has been a continuous drop for the past few decades and
the TFR in China currently stands below the replacement level at around at 1.8 children per
woman (Figure 1.2, Panel B).
The pace of decline in TFR varied widely between countries. In northern European
countries, the decline started early but has oscillated around 1.85 children per women
since the mid-1970s. By contrast, among southern European countries the decline has
been slower, starting in the mid-1970s, but reached an extremely low level of 1.3 in 1994
before slowly starting to edge up. Fertility rates in Japan and Korea (OECD, 2007a)
were in decline until 2005. In contrast fertility rates in the United States bottomed in
the mid-1970s, and have oscillated around two children per women for the past 20 years.
In the Russian Federation, the fertility rates were more stable than in OECD countries
in the 1970s, followed by a rise in the 1980s peaking at 2.2 children per woman in 1986.
This growth was followed by a sharp decline throughout the 1990s, reaching a low
of 1.2 in 1999.
Following the long period of decline, fertility rates began to rise from 2002. Since 2002
the TFR has increased by 0.2 children per woman in Australia, Belgium, Denmark, Greece,
Iceland, Italy, Norway, Poland and Spain; and by 0.3 children per women in the
Czech Republic, New Zealand, Sweden and the United Kingdom up to 2008 (OECD, 2010a,
1. FAMILIES ARE CHANGING
DOING BETTER FOR FAMILIES © OECD 2011 21
SF2.1). Thus, there appears to have been a rebound in fertility in Nordic countries with
fertility rates relatively close to the replacement level, and also in some of the so-called
“lowest-low” fertility rate countries in southern Europe and the Czech Republic where
fertility rates had bottomed around 1.2 children per women. However, TFRs have fallen
since the beginning of the economic crisis in 2008 in Portugal, Spain and the United States.
The overall decrease in fertility rates over the past three decades has contributed to
the decline in the average household size over the same period (Figure 1.1, Panel B).
However, despite persistently low fertility rates the average household size in Korea and
the Slovak Republic remains well above the OECD average. This is because of the relatively
high proportion of multigenerational households in these two low-fertility countries
(OECD, 2010a, SF1.1).
Postponement of family formation
Postponement of childbearing is a major reason for the decline in fertility rates.
Greater access to contraceptives has given more adults control over the timing and
occurrence of births. And as more men and women first want to establish themselves in
the labour and housing markets, many adults have chosen to postpone having children.
Across the OECD the average age at which women have their first child increased from 24
in 1970 to 28 in 2008 (OECD, 2010a, SF2.3). The average age of first childbirth of women is
high, at just below 30 years of age in Germany, Italy, Spain and Switzerland and is highest
in the United Kingdom (despite teenage motherhood being more prevalent in the United
Kingdom than in most OECD countries, OECD, 2010a, SF2.4).
Postponement of first childbirth generally leads to a narrower age-interval in which
women have their children (Chapter 3) and fewer children overall. Comparing 2008
Figure 1.2. Fertility rates have dropped but are beginning to rebound, 1970 to 2009
Note: Northern Europe includes Denmark, Finland, Iceland, Norway and Sweden. Southern Europe includes Greece, Italy, Portugal andSpain. Other OECD Europe includes all other OECD European countries.
Source: Eurostat (2010), Eurostat New Cronos Database, and national statistics offices; UN Population Division, 2010, for China.1 2 http://dx.doi.org/10.1787/888932392476
2.8
2.6
2.4
2.2
2.0
1.8
1.6
1.4
1.2
1.0
5.0
4.0
3.0
2.0
1.0
197
0 1
972 1
974 1
976 1
978 1
980 1
982 1
984 1
986 1
988 1
990 1
992 1
994 1
996 1
998 2
002 2
000 2
004 2
00620
08 1
970 1
972 1
974 1
976 1
978 1
980 1
982 1
984 1
986 1
988 1
990 1
992 1
994 1
996 1
998 2
002 2
000 2
004 2
00620
08
Northern Europe
United States Japan
Other OECD EuropeSouthern Europe
OECD average
Panel A. Trends in total fertility rates in OECD countriesgrouped by region
ChinaOECD average
Indonesia
Russian FederationBrazil
India South Africa
Panel B. Trends in total fertility rates in OECDenhanced engagement countries
Replacement level
Replacement level
1. FAMILIES ARE CHANGING
DOING BETTER FOR FAMILIES © OECD 201122
with 1980, the proportion of births of a first child has increased in most European
countries, while the share of births of a third or higher order has fallen over the same
period, except in Denmark, Estonia, Finland, Hungary, Luxembourg, Norway and Slovenia
(OECD, 2010a, SF2.1). As a result, the proportion of large families has fallen, while the
number of children growing up without siblings has risen.
Childlessness
In addition to those women who cannot conceive or those women who have decided
not to have any children, the upper limit to the childbearing years, set by the so-called
biological clock, makes it difficult for women who postpone having children to give birth at
later ages.
The proportion of women who remain childless has increased across the OECD (OECD,
2010a, SF2.5). A greater proportion of women born in the mid-1960s are childless compared
with women born in the mid-1950s in most OECD countries, with the exceptions of Mexico,
Norway, Portugal and the United States, where there was a decrease in childlessness of less
than 2 percentage points. Definitive childlessness is highest in Spain and the United
Kingdom, with over 20% of women born in 1965 without any children; it is lowest in the
Czech Republic, Hungary, Mexico, Portugal, and Slovenia where less than 10% of women
had no children.
Inevitably, the increase in the childlessness rate, along with the drop in the fertility
rate, has led to an increase in the proportion of women living in households without
children. At least 20% of women aged 25-49 live in households with no children in
European OECD countries (Figure 1.3). This is partly due to deferment of childbearing and
partly due to the increase in complete childlessness. The proportion of women living in
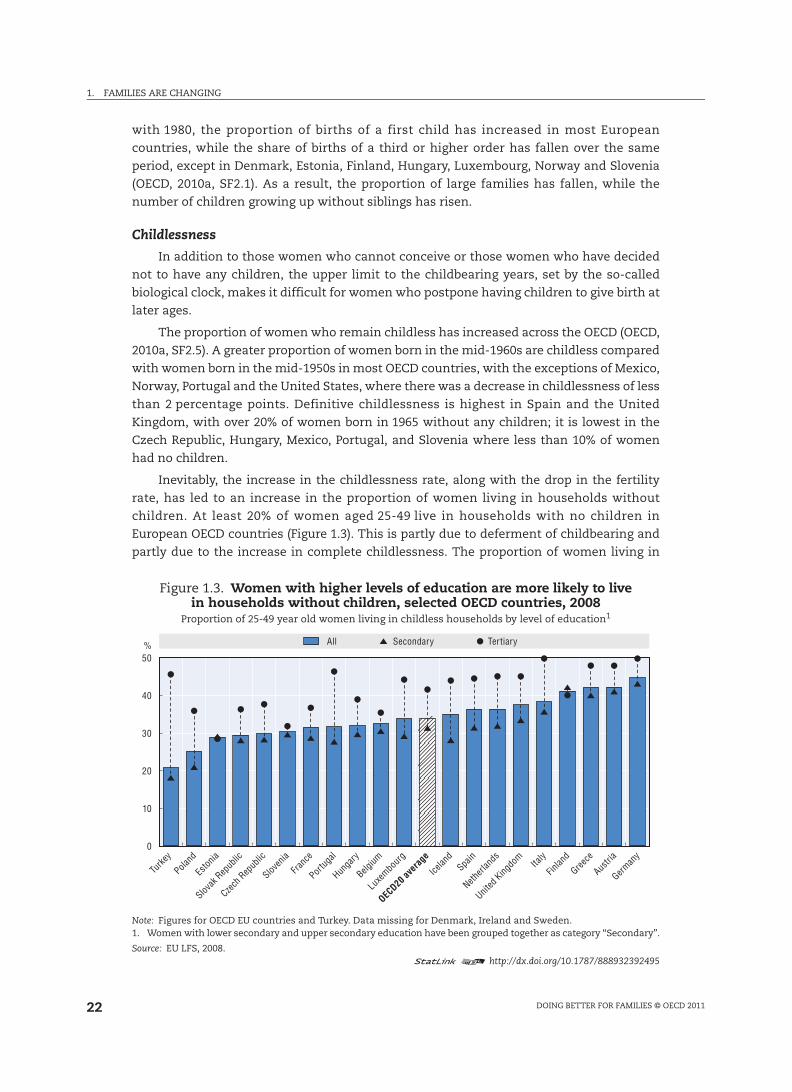
Figure 1.3. Women with higher levels of education are more likely to livein households without children, selected OECD countries, 2008
Proportion of 25-49 year old women living in childless households by level of education1
Note: Figures for OECD EU countries and Turkey. Data missing for Denmark, Ireland and Sweden.1. Women with lower secondary and upper secondary education have been grouped together as category “Secondary”.
Source: EU LFS, 2008.1 2 http://dx.doi.org/10.1787/888932392495
50
40
30
20
10
0
%
Turke
y
Poland
Eston
ia
Slovak
Rep
ublic
Czech
Rep
ublic
Sloven
ia
Franc
e
Portug
al
Hun
gary
Belg
ium
Luxe
mbourg
OEC
D20 ave
rage
Icela
ndSpa
in
Neth
erlan
ds
Unit
ed King
dom
Italy
Finl
and
Gree
ce
Aus
tria
Germ
any
All Secondary Tertiary
1. FAMILIES ARE CHANGING
DOING BETTER FOR FAMILIES © OECD 2011 23
childless households is particularly high in Austria, Finland, Germany and Greece, where
more than 40% of women aged 25-49 live in childless households. Conversely, it is low in
Estonia, Poland, the Slovak Republic and Turkey where less than 30% of women live in
childless households.
The household childlessness rate is strongly linked to the education level of women,
as women with tertiary education are more likely to be in a childless household than
women with secondary education in most OECD countries (Figure 1.3). This suggests that
the increase in childlessness is more due to the consequences of women deferring
childbirth or choosing not to have children, rather than being unable to conceive, as highly
educated women choose employment over childbirth. The difference also suggests there is
ongoing tension between employment and childbearing. The gap between women of
differing educational level is largest in countries with low proportion of women living in
childless households, such as Poland and Turkey. Another possible cause behind the
increased childlessness among highly educated women is their reluctance to take on a
partner who is less educated than themselves, especially in Japan and Korea (Chapter 3).
This leads to lower marriage and partnership rates among highly educated women and can
subsequently lead to lower fertility rates and childlessness.
Changes in household structure
Children in households
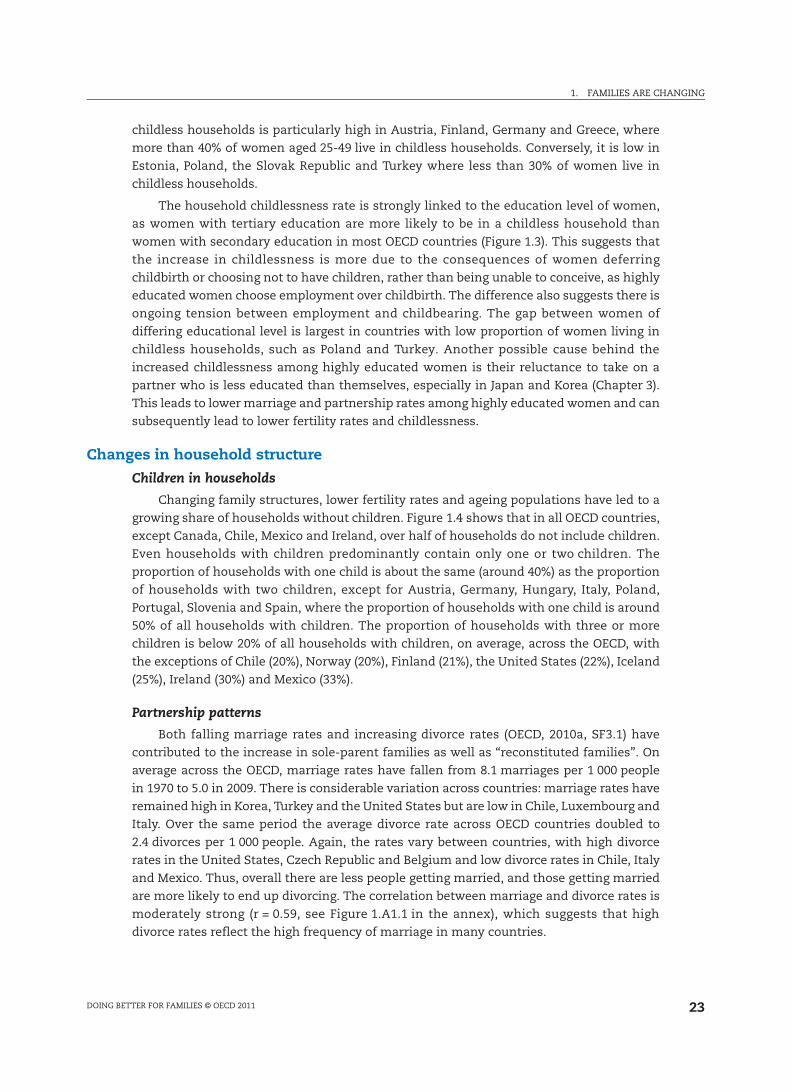
Changing family structures, lower fertility rates and ageing populations have led to a
growing share of households without children. Figure 1.4 shows that in all OECD countries,
except Canada, Chile, Mexico and Ireland, over half of households do not include children.
Even households with children predominantly contain only one or two children. The
proportion of households with one child is about the same (around 40%) as the proportion
of households with two children, except for Austria, Germany, Hungary, Italy, Poland,
Portugal, Slovenia and Spain, where the proportion of households with one child is around
50% of all households with children. The proportion of households with three or more
children is below 20% of all households with children, on average, across the OECD, with
the exceptions of Chile (20%), Norway (20%), Finland (21%), the United States (22%), Iceland
(25%), Ireland (30%) and Mexico (33%).
Partnership patterns
Both falling marriage rates and increasing divorce rates (OECD, 2010a, SF3.1) have
contributed to the increase in sole-parent families as well as “reconstituted families”. On
average across the OECD, marriage rates have fallen from 8.1 marriages per 1 000 people
in 1970 to 5.0 in 2009. There is considerable variation across countries: marriage rates have
remained high in Korea, Turkey and the United States but are low in Chile, Luxembourg and
Italy. Over the same period the average divorce rate across OECD countries doubled to
2.4 divorces per 1 000 people. Again, the rates vary between countries, with high divorce
rates in the United States, Czech Republic and Belgium and low divorce rates in Chile, Italy
and Mexico. Thus, overall there are less people getting married, and those getting married
are more likely to end up divorcing. The correlation between marriage and divorce rates is
moderately strong (r = 0.59, see Figure 1.A1.1 in the annex), which suggests that high
divorce rates reflect the high frequency of marriage in many countries.
1. FAMILIES ARE CHANGING
DOING BETTER FOR FAMILIES © OECD 201124
The decline in the marriage rate has been accompanied by an increase in the average
age at which first marriages occur (OECD, 2010a, SF3.1). This tendency to defer the age of
first marriage is most pronounced in Switzerland where the mean age at first marriage
increased by more than seven years from 1980 to 2008. In Denmark, Iceland, Norway and
Sweden, where cohabitation is becoming increasingly common, women are, on average,
over 30 years of age when they marry for the first time.
The decline in marriage rates is related to the emergence of more non-traditional
family forms, including relationships that involve partners keeping their own place of
residency, “weekend-relationships”, “living apart together” and civil partnerships.
Cohabitation is increasing, and because there are more people cohabiting before marriage,
people are older when they marry. However, the data show that marriage is still the
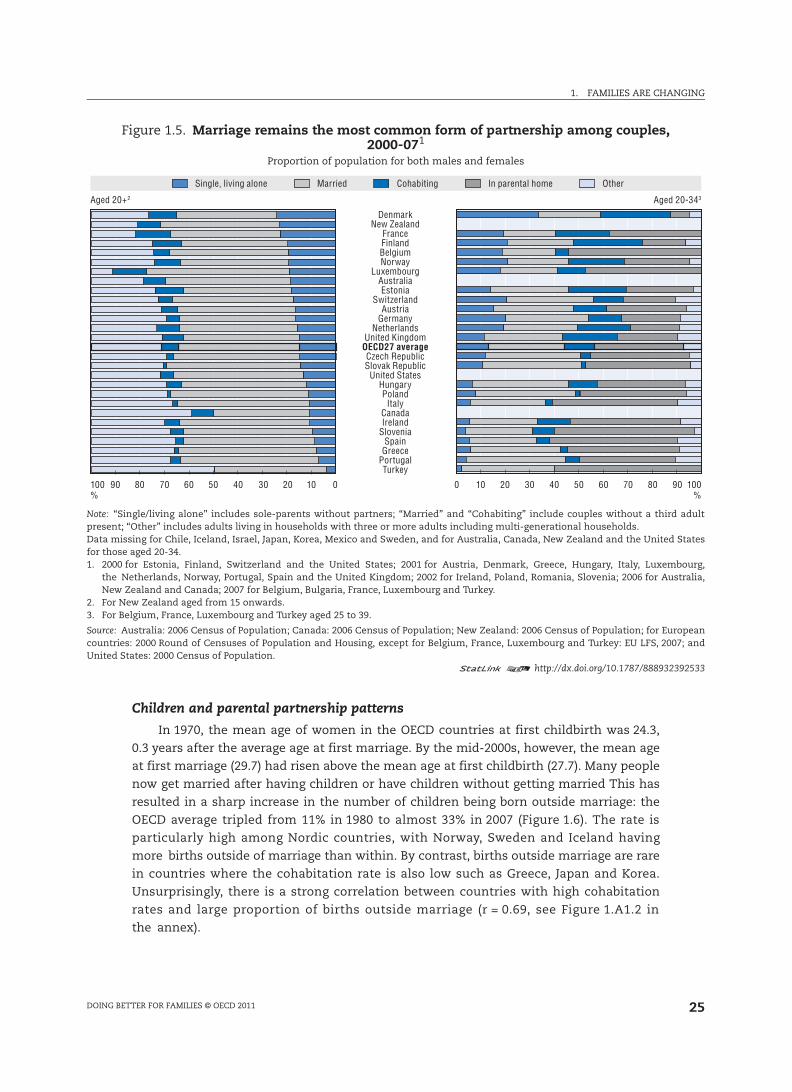
preferred option of partnership for most couples (Figure 1.5). Regardless of marital or
“cohabitational” status, the majority of people opt to partner with someone with similar
educational attainment (Box 1.1).
Overall, the partnership patterns are changing between generations. In almost all
countries across the OECD the younger generation (aged 20-34) is more likely to be
cohabiting than the previous generation at the same age. The younger generation is also
less likely to live alone in most of the countries. While cohabitation rates are high in
France, and the Nordic and Anglophone countries, they are very low in Greece, Italy, Poland
and the Slovak Republic, and negligible in Turkey.
Figure 1.4. Most households have no children, 20081
Proportion of households by number of children
Notes: For Australia and New Zealand, households with 1, 2 and 3+ children are grouped as households with1+ children.Data missing for Estonia, Israel, Japan, Turkey and Sweden.1. 2001 for Denmark and Norway; 2002 for Ireland; 2003 for Australia; 2005 for the US; 2006 for Canada, Chile and
New Zealand; 2007 for Switzerland.
Source: Australia: Family Characteristics, June 2003; Canada: 2006 Census; Chile: CASEN 2006; EU countries: EU LFS,2008, NOSOSCO; Ireland: 2002 Census; Korea: KLIPS 2007; Mexico: ENIGH 2007; New Zealand: 2006 Census; Norway:Population and Housing Census 2001; Switzerland: SHP 2008; and US Census Bureau, 2005.
1 2 http://dx.doi.org/10.1787/888932392514
100
90
80
70
60
50
40
30
20
10
0
%
Mex
ico
Can
ada C
hile
Irela
nd
Pola
nd
Slov
ak R
epub
lic
Icelan
d
Luxe
mbourg
New
Zeala
nd
Portug
al
Slov
enia
Spa
in
Hun
gary
OECD29 a
vera
ge
Cze
ch R
epub
licKor
ea
Belgium
Fran
ce Italy
Netherl
ands
Austra
lia
United
Kingdo
mAus
tria
United
States
Gree
ce
Nor
way
Finlan
d
German
y
Denmark
Switzerl
and
0 children 1 child 2 children 3+ children
1. FAMILIES ARE CHANGING
DOING BETTER FOR FAMILIES © OECD 2011 25
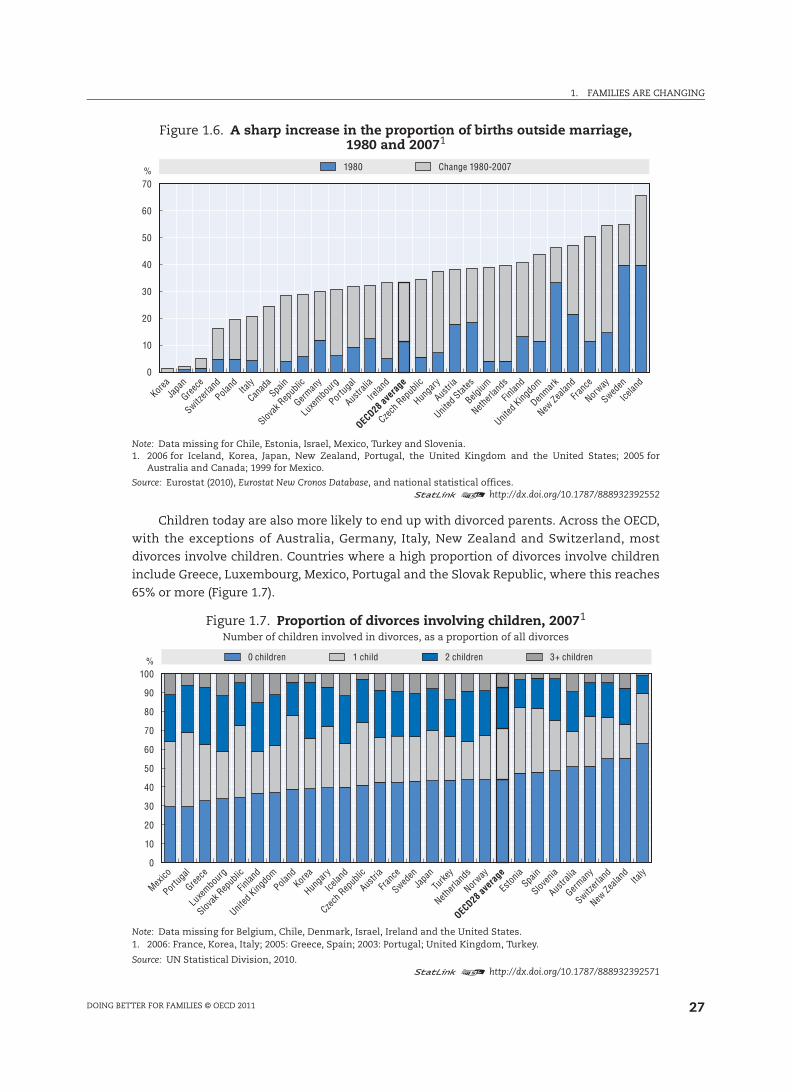
Children and parental partnership patterns
In 1970, the mean age of women in the OECD countries at first childbirth was 24.3,
0.3 years after the average age at first marriage. By the mid-2000s, however, the mean age
at first marriage (29.7) had risen above the mean age at first childbirth (27.7). Many people
now get married after having children or have children without getting married This has
resulted in a sharp increase in the number of children being born outside marriage: the
OECD average tripled from 11% in 1980 to almost 33% in 2007 (Figure 1.6). The rate is
particularly high among Nordic countries, with Norway, Sweden and Iceland having
more births outside of marriage than within. By contrast, births outside marriage are rare
in countries where the cohabitation rate is also low such as Greece, Japan and Korea.
Unsurprisingly, there is a strong correlation between countries with high cohabitation
rates and large proportion of births outside marriage (r = 0.69, see Figure 1.A1.2 in
the annex).
Figure 1.5. Marriage remains the most common form of partnership among couples,2000-071
Proportion of population for both males and females
Note: “Single/living alone” includes sole-parents without partners; “Married” and “Cohabiting” include couples without a third adultpresent; “Other” includes adults living in households with three or more adults including multi-generational households.Data missing for Chile, Iceland, Israel, Japan, Korea, Mexico and Sweden, and for Australia, Canada, New Zealand and the United Statesfor those aged 20-34.1. 2000 for Estonia, Finland, Switzerland and the United States; 2001 for Austria, Denmark, Greece, Hungary, Italy, Luxembourg,
the Netherlands, Norway, Portugal, Spain and the United Kingdom; 2002 for Ireland, Poland, Romania, Slovenia; 2006 for Australia,New Zealand and Canada; 2007 for Belgium, Bulgaria, France, Luxembourg and Turkey.
2. For New Zealand aged from 15 onwards.3. For Belgium, France, Luxembourg and Turkey aged 25 to 39.
Source: Australia: 2006 Census of Population; Canada: 2006 Census of Population; New Zealand: 2006 Census of Population; for Europeancountries: 2000 Round of Censuses of Population and Housing, except for Belgium, France, Luxembourg and Turkey: EU LFS, 2007; andUnited States: 2000 Census of Population.
1 2 http://dx.doi.org/10.1787/888932392533
%%100 90 01020304050607080 0 10 20 30 40 50 60 70 80 90 100
DenmarkNew Zealand
FranceFinlandBelgiumNorway
LuxembourgAustraliaEstonia
SwitzerlandAustria
GermanyNetherlands
United KingdomOECD27 averageCzech RepublicSlovak Republic
United StatesHungaryPoland
ItalyCanadaIreland
SloveniaSpain
GreecePortugalTurkey
Aged 20+2 Aged 20-343
Single, living alone Married Cohabiting In parental home Other
1. FAMILIES ARE CHANGING
DOING BETTER FOR FAMILIES © OECD 201126
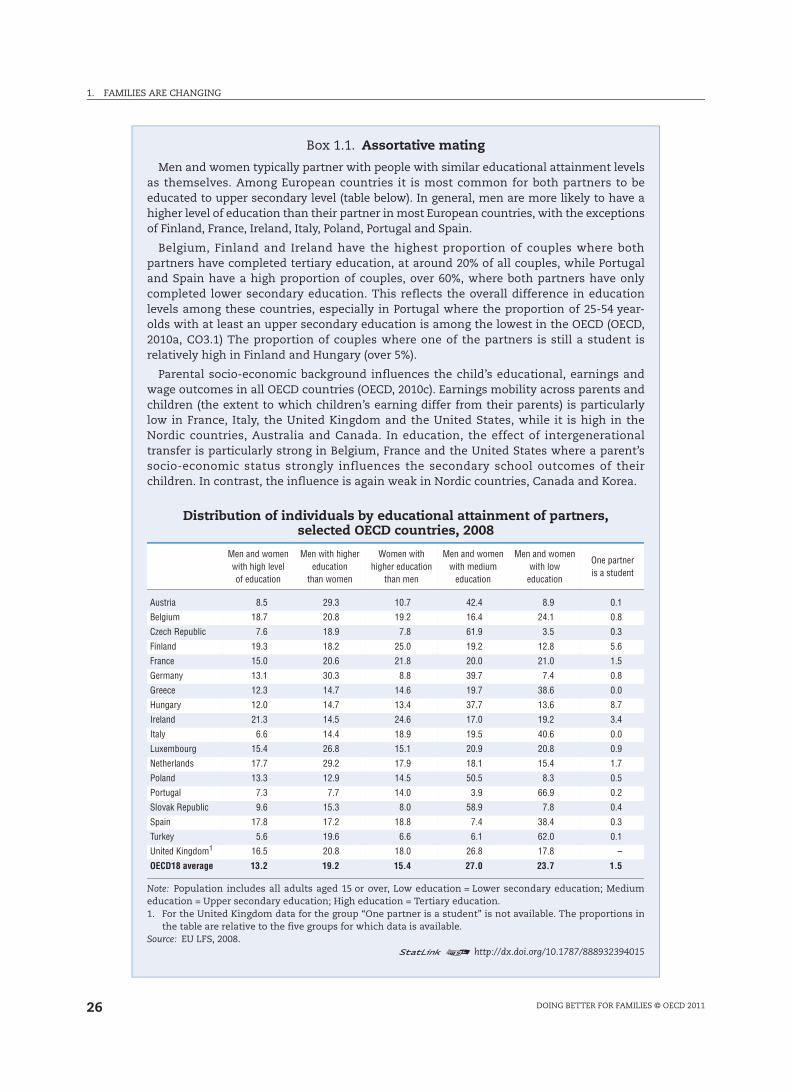
Box 1.1. Assortative mating
Men and women typically partner with people with similar educational attainment levelsas themselves. Among European countries it is most common for both partners to beeducated to upper secondary level (table below). In general, men are more likely to have ahigher level of education than their partner in most European countries, with the exceptionsof Finland, France, Ireland, Italy, Poland, Portugal and Spain.
Belgium, Finland and Ireland have the highest proportion of couples where bothpartners have completed tertiary education, at around 20% of all couples, while Portugaland Spain have a high proportion of couples, over 60%, where both partners have onlycompleted lower secondary education. This reflects the overall difference in educationlevels among these countries, especially in Portugal where the proportion of 25-54 year-olds with at least an upper secondary education is among the lowest in the OECD (OECD,2010a, CO3.1) The proportion of couples where one of the partners is still a student isrelatively high in Finland and Hungary (over 5%).
Parental socio-economic background influences the child’s educational, earnings andwage outcomes in all OECD countries (OECD, 2010c). Earnings mobility across parents andchildren (the extent to which children’s earning differ from their parents) is particularlylow in France, Italy, the United Kingdom and the United States, while it is high in theNordic countries, Australia and Canada. In education, the effect of intergenerationaltransfer is particularly strong in Belgium, France and the United States where a parent’ssocio-economic status strongly influences the secondary school outcomes of theirchildren. In contrast, the influence is again weak in Nordic countries, Canada and Korea.
Distribution of individuals by educational attainment of partners,selected OECD countries, 2008
Men and women with high levelof education
Men with higher education
than women
Women withhigher education
than men
Men and women with medium
education
Men and women with low
education
One partneris a student
Austria 8.5 29.3 10.7 42.4 8.9 0.1
Belgium 18.7 20.8 19.2 16.4 24.1 0.8
Czech Republic 7.6 18.9 7.8 61.9 3.5 0.3
Finland 19.3 18.2 25.0 19.2 12.8 5.6
France 15.0 20.6 21.8 20.0 21.0 1.5
Germany 13.1 30.3 8.8 39.7 7.4 0.8
Greece 12.3 14.7 14.6 19.7 38.6 0.0
Hungary 12.0 14.7 13.4 37.7 13.6 8.7
Ireland 21.3 14.5 24.6 17.0 19.2 3.4
Italy 6.6 14.4 18.9 19.5 40.6 0.0
Luxembourg 15.4 26.8 15.1 20.9 20.8 0.9
Netherlands 17.7 29.2 17.9 18.1 15.4 1.7
Poland 13.3 12.9 14.5 50.5 8.3 0.5
Portugal 7.3 7.7 14.0 3.9 66.9 0.2
Slovak Republic 9.6 15.3 8.0 58.9 7.8 0.4
Spain 17.8 17.2 18.8 7.4 38.4 0.3
Turkey 5.6 19.6 6.6 6.1 62.0 0.1
United Kingdom1 16.5 20.8 18.0 26.8 17.8 –
OECD18 average 13.2 19.2 15.4 27.0 23.7 1.5
Note: Population includes all adults aged 15 or over, Low education = Lower secondary education; Mediumeducation = Upper secondary education; High education = Tertiary education.1. For the United Kingdom data for the group “One partner is a student” is not available. The proportions in
the table are relative to the five groups for which data is available.Source: EU LFS, 2008.
1 2 http://dx.doi.org/10.1787/888932394015
1. FAMILIES ARE CHANGING
DOING BETTER FOR FAMILIES © OECD 2011 27
Children today are also more likely to end up with divorced parents. Across the OECD,
with the exceptions of Australia, Germany, Italy, New Zealand and Switzerland, most
divorces involve children. Countries where a high proportion of divorces involve children
include Greece, Luxembourg, Mexico, Portugal and the Slovak Republic, where this reaches
65% or more (Figure 1.7).
Figure 1.6. A sharp increase in the proportion of births outside marriage, 1980 and 20071
Note: Data missing for Chile, Estonia, Israel, Mexico, Turkey and Slovenia.1. 2006 for Iceland, Korea, Japan, New Zealand, Portugal, the United Kingdom and the United States; 2005 for
Australia and Canada; 1999 for Mexico.
Source: Eurostat (2010), Eurostat New Cronos Database, and national statistical offices.1 2 http://dx.doi.org/10.1787/888932392552
Figure 1.7. Proportion of divorces involving children, 20071
Number of children involved in divorces, as a proportion of all divorces
Note: Data missing for Belgium, Chile, Denmark, Israel, Ireland and the United States.1. 2006: France, Korea, Italy; 2005: Greece, Spain; 2003: Portugal; United Kingdom, Turkey.
Source: UN Statistical Division, 2010.1 2 http://dx.doi.org/10.1787/888932392571
70
60
50
40
30
20
10
0
%
Korea
Japa
n
Gree
ce
Switz
erlan
d
Pola
nd It
aly
Can
ada
Spa
in
Slov
ak R
epub
lic
Germ
any
Luxe
mbourg
Por
tugal
Aus
tralia
Irela
nd
OEC
D28 av
erag
e
Cze
ch R
epub
lic
Hun
gary
Aus
tria
Unit
ed Stat
es
Belg
ium
Neth
erlan
ds
Finl
and
Unit
ed King
dom
Den
mark
New
Zeala
nd
Fran
ce
Nor
way
Sweden
Icela
nd
1980 Change 1980-2007
100
90
80
70
60
50
40
30
20
10
0
%
Mex
ico
Sweden
Turke
y
Pola
nd
Slov
ak R
epub
lic
Icelan
d
Luxe
mbourg
New
Zeala
nd
Portug
al
Slov
enia
Spa
in
Hun
gary
Eston
ia
OECD28
aver
age
Cze
ch R
epub
licKore
aJa
pan
Fran
ce Italy
Netherl
ands
Austra
lia
United
Kingdo
mAus
tria
Gree
ce
Nor
way
Finlan
d
German
y
Switzerl
and
0 children 1 child 2 children 3+ children
1. FAMILIES ARE CHANGING
DOING BETTER FOR FAMILIES © OECD 201128
In all OECD countries the divorce rate decreases as more children are involved. In the
Nordic countries, where there is strong financial support available for children following
divorce or separation, and thus less financial constraint following divorce (OECD, 2010a,
PF1.5), there is a high proportion of divorces involving two or more children. For example,
more than a third of divorces in Finland and Iceland involve two or more children. The
proportion of divorces involving two or more children is also high in the Netherlands,
Luxembourg, Austria and Korea.
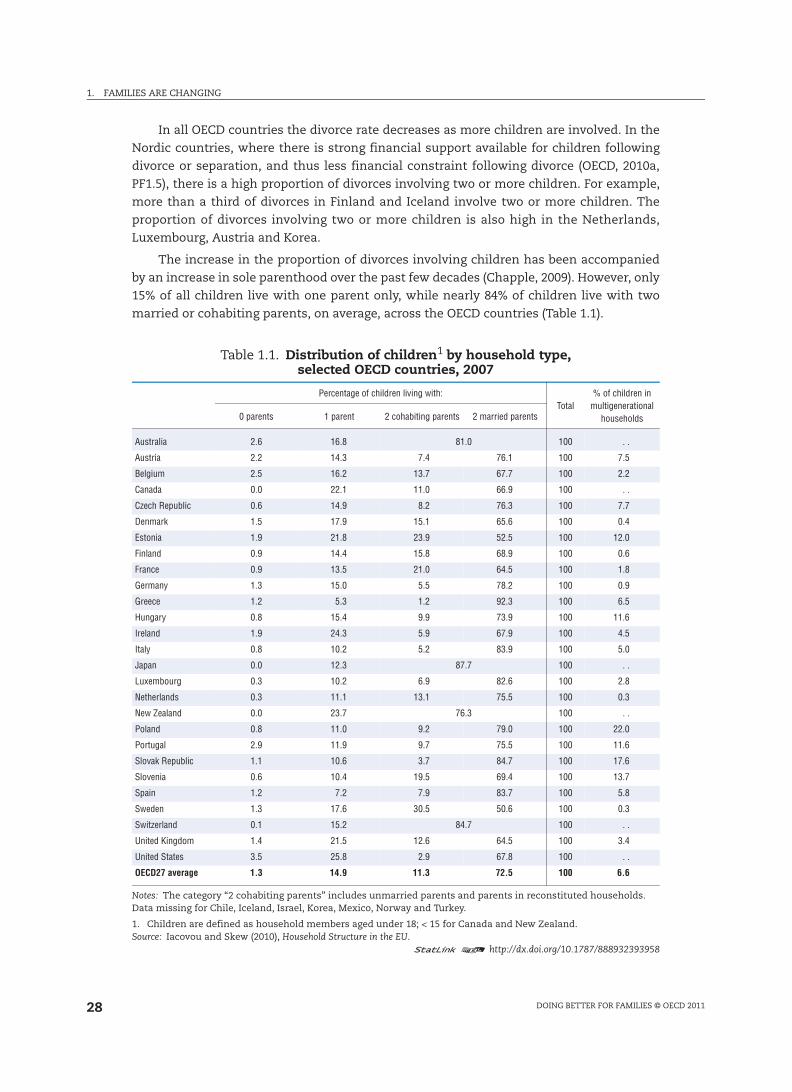
The increase in the proportion of divorces involving children has been accompanied
by an increase in sole parenthood over the past few decades (Chapple, 2009). However, only
15% of all children live with one parent only, while nearly 84% of children live with two
married or cohabiting parents, on average, across the OECD countries (Table 1.1).
Table 1.1. Distribution of children1 by household type,selected OECD countries, 2007
Percentage of children living with:Total
% of children in multigenerational
households0 parents 1 parent 2 cohabiting parents 2 married parents
Australia 2.6 16.8 81.0 100 . .
Austria 2.2 14.3 7.4 76.1 100 7.5
Belgium 2.5 16.2 13.7 67.7 100 2.2
Canada 0.0 22.1 11.0 66.9 100 . .
Czech Republic 0.6 14.9 8.2 76.3 100 7.7
Denmark 1.5 17.9 15.1 65.6 100 0.4
Estonia 1.9 21.8 23.9 52.5 100 12.0
Finland 0.9 14.4 15.8 68.9 100 0.6
France 0.9 13.5 21.0 64.5 100 1.8
Germany 1.3 15.0 5.5 78.2 100 0.9
Greece 1.2 5.3 1.2 92.3 100 6.5
Hungary 0.8 15.4 9.9 73.9 100 11.6
Ireland 1.9 24.3 5.9 67.9 100 4.5
Italy 0.8 10.2 5.2 83.9 100 5.0
Japan 0.0 12.3 87.7 100 . .
Luxembourg 0.3 10.2 6.9 82.6 100 2.8
Netherlands 0.3 11.1 13.1 75.5 100 0.3
New Zealand 0.0 23.7 76.3 100 . .
Poland 0.8 11.0 9.2 79.0 100 22.0
Portugal 2.9 11.9 9.7 75.5 100 11.6
Slovak Republic 1.1 10.6 3.7 84.7 100 17.6
Slovenia 0.6 10.4 19.5 69.4 100 13.7
Spain 1.2 7.2 7.9 83.7 100 5.8
Sweden 1.3 17.6 30.5 50.6 100 0.3
Switzerland 0.1 15.2 84.7 100 . .
United Kingdom 1.4 21.5 12.6 64.5 100 3.4
United States 3.5 25.8 2.9 67.8 100 . .
OECD27 average 1.3 14.9 11.3 72.5 100 6.6
Notes: The category “2 cohabiting parents” includes unmarried parents and parents in reconstituted households.Data missing for Chile, Iceland, Israel, Korea, Mexico, Norway and Turkey.
1. Children are defined as household members aged under 18; < 15 for Canada and New Zealand.Source: Iacovou and Skew (2010), Household Structure in the EU.
1 2 http://dx.doi.org/10.1787/888932393958
1. FAMILIES ARE CHANGING
DOING BETTER FOR FAMILIES © OECD 2011 29
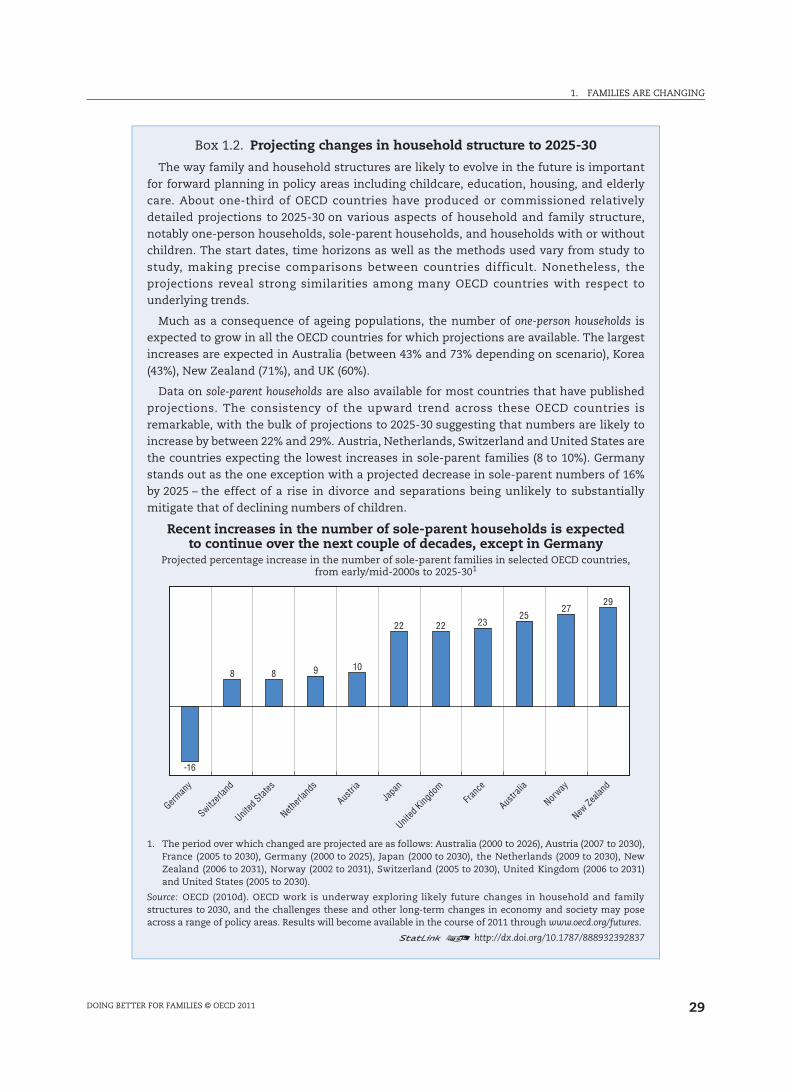
Box 1.2. Projecting changes in household structure to 2025-30
The way family and household structures are likely to evolve in the future is importantfor forward planning in policy areas including childcare, education, housing, and elderlycare. About one-third of OECD countries have produced or commissioned relativelydetailed projections to 2025-30 on various aspects of household and family structure,notably one-person households, sole-parent households, and households with or withoutchildren. The start dates, time horizons as well as the methods used vary from study tostudy, making precise comparisons between countries difficult. Nonetheless, theprojections reveal strong similarities among many OECD countries with respect tounderlying trends.
Much as a consequence of ageing populations, the number of one-person households isexpected to grow in all the OECD countries for which projections are available. The largestincreases are expected in Australia (between 43% and 73% depending on scenario), Korea(43%), New Zealand (71%), and UK (60%).
Data on sole-parent households are also available for most countries that have publishedprojections. The consistency of the upward trend across these OECD countries isremarkable, with the bulk of projections to 2025-30 suggesting that numbers are likely toincrease by between 22% and 29%. Austria, Netherlands, Switzerland and United States arethe countries expecting the lowest increases in sole-parent families (8 to 10%). Germanystands out as the one exception with a projected decrease in sole-parent numbers of 16%by 2025 – the effect of a rise in divorce and separations being unlikely to substantiallymitigate that of declining numbers of children.
Recent increases in the number of sole-parent households is expectedto continue over the next couple of decades, except in Germany
Projected percentage increase in the number of sole-parent families in selected OECD countries,from early/mid-2000s to 2025-301
1. The period over which changed are projected are as follows: Australia (2000 to 2026), Austria (2007 to 2030),France (2005 to 2030), Germany (2000 to 2025), Japan (2000 to 2030), the Netherlands (2009 to 2030), NewZealand (2006 to 2031), Norway (2002 to 2031), Switzerland (2005 to 2030), United Kingdom (2006 to 2031)and United States (2005 to 2030).
Source: OECD (2010d). OECD work is underway exploring likely future changes in household and familystructures to 2030, and the challenges these and other long-term changes in economy and society may poseacross a range of policy areas. Results will become available in the course of 2011 through www.oecd.org/futures.
1 2 http://dx.doi.org/10.1787/888932392837
-16
8 8 9 10
22 22 2325
2729
German
y
Switz
erlan
d
Unit
ed Stat
es
Neth
erlan
ds
Aus
tria
Japa
n
United
Kingdo
m
Fran
ce
Aus
tralia
Nor
way
New
Zeala
nd
1. FAMILIES ARE CHANGING
DOING BETTER FOR FAMILIES © OECD 201130
Children of divorced parents are more likely to live with just one parent than in
reconstituted families. On average across the OECD, almost 10% of children live in
reconstituted households, while nearly 15% live in sole-parent households (OECD, 2010a,
SF1.3). The proportion of reconstituted families is above-average in Belgium, Canada, the
Czech Republic, Estonia, France, the Nordic countries, the United Kingdom and the United
States. Reconstituted families are rare in Greece, Italy, Poland, Slovenia, Spain and Turkey
where less than 5% of children live in such households.
Around 1 in 15 children on average across the OECD live in a household with their
grandparent (Table 1.1), a consequence of an ageing population. In many countries, sole
parents live with their parents to pool resources and gain better access to childcare (see
Chapter 5). Multigenerational households are most common in Poland and the Slovak
Republic, where more than 15% of children live in multi-generational households, while
they are extremely rare in the Nordic countries.
Work life and family life
Changing patterns of female labour market participation
Increasing female participation in higher education (Box 1.3) has contributed
to changing female aspirations regarding labour market participation in many
OECD countries, with the biggest change in behaviour amongst married mothers (see
below). The timing of the resultant increase in female employment has varied across
countries. For example, the rise in female employment began in the early 1960s in
Australia, New Zealand, the Nordic countries, and the United States (OECD, 1999), whereas
the main gains in Ireland, the Netherlands and Spain were recorded over the past
two decades (Figure 1.8).
Box 1.2. Projecting changes in household structure to 2025-30 (cont.)
Sole-parent families are set to increase not only in absolute terms, but also as aproportion of all family households with children. Indeed, by 2025-30 their share isexpected to rise in all the OECD countries for which projections are available (OECD, 2010b).However, the effect is likely to be felt more in some countries than in others. For examplein Australia, Japan and New Zealand sole-parent families’ share of all family householdswith children could reach well over 30% (up from 28%, 22% and 31% respectively in themid-2000s). By contrast, in Austria, Germany and Switzerland shares are expected to rangebetween 17% and 19%, showing little change since the mid-2000s.
In the light of past and current fertility rates and increases in life expectancy, it comes asno surprise that almost all the OECD countries for which projections exist are expected toshow significant increases to 2025-2030 in the numbers of couples without children. Theseincreases range between 37% and 72% for Australia, Korea, New Zealand, Switzerland, andthe United States. Germany is projected to see the slowest increase (14%) while Japan couldin fact experience a decrease in the number of childless couples.
By contrast, most of these countries expect to see declines in the number of couples withchildren to 2025-30. The largest decreases are projected for Germany, Japan and Austria(between 15% and 27%), the lowest for Korea and the Netherlands. In contrast, the UnitedStates and Australia could see increases in the numbers of couples with children.
1. FAMILIES ARE CHANGING
DOING BETTER FOR FAMILIES © OECD 2011 31
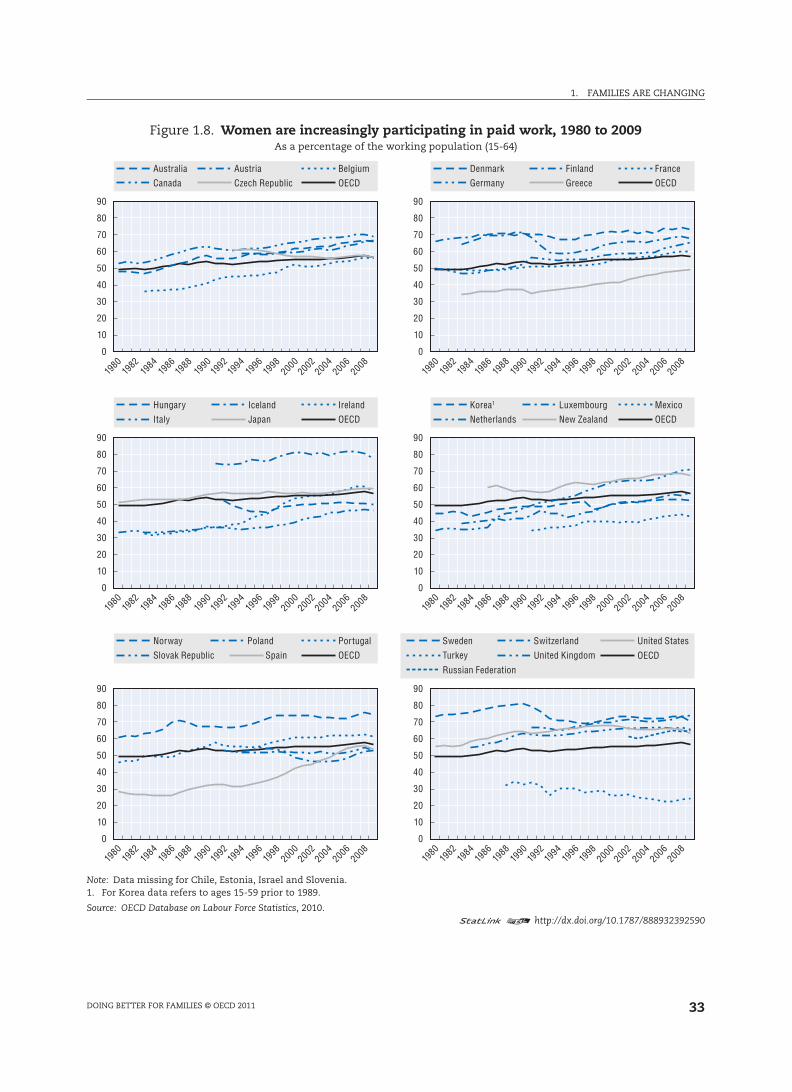
In the early 1980s, Belgium, Greece, Ireland, Italy, the Netherlands, Mexico, Spain and
Turkey had the lowest female labour market participation among the OECD with less than
40% of the female working population in employment (Figure 1.8). Amongst these
countries there has been a large increase in female employment in Belgium, Ireland, the
Netherlands and Spain with employment rates exceeding 50% in 2009. There were also
modest increases in Greece, Italy and Mexico with employment rates reaching above 40%.
However, in Turkey female employment dropped below 25% in 2009.
The Nordic countries historically had the highest female employment rates among the
OECD countries and are still among the highest despite drops in the 1990s in Finland,
Norway and Sweden. Iceland is the only OECD country with nearly 80% of the female
working-age population in employment in 2009.
In the past decade the female employment rate has remained fairly stable across most
of the OECD countries, with the exceptions of a noticeable decrease in the United States and
a large decrease in Turkey. But the rate dropped in almost every OECD country
from 2008 to 2009, reflecting the poor economic situation worldwide (OECD, 2010b). In
contrast to most of the OECD countries, there was a slight increase in the female
employment rate in the Russian Federation over the last decade, increasing from 56% in 1999
to 65% in 2009.
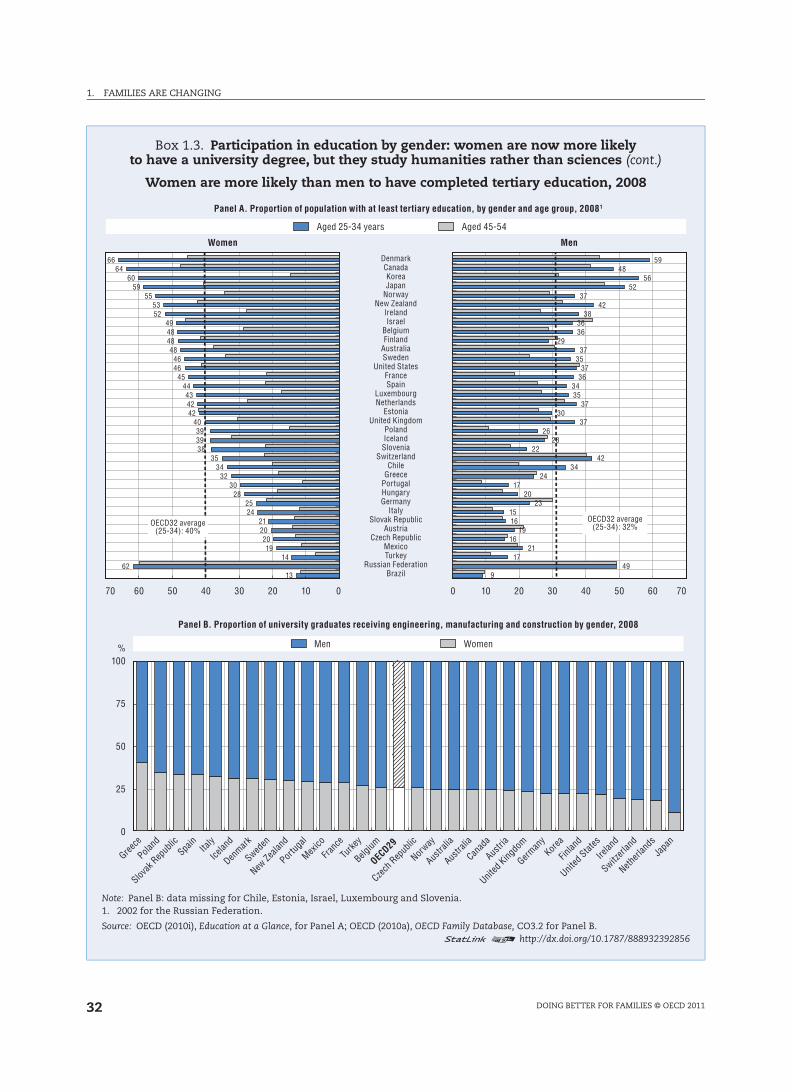
Box 1.3. Participation in education by gender: women are now more likelyto have a university degree, but they study humanities rather than sciences
The increase in female educational attainment levels has preceded changes in women’s labourmarket behaviour. The figure below shows that the proportion of younger women with completedtertiary education is higher than for older women in all countries, and the gains have been particularlylarge in Belgium, Denmark, France, Ireland, Luxembourg, Norway, Poland and Spain (more than 20percentage points) and most pronounced in Korea (over 40 percentage points). In fact, in the majorityof OECD countries, and in the Brazil and the Russian Federation, young women have higher levels ofeducational attainment than their male counterparts: on average across the OECD 40% of women in theage group 25-34 have completed tertiary education compared with 32% of the young men. As withwomen, young adult men aged 25-34 are more likely to have completed tertiary education comparedwith their peers in the age cohort 45-54. In some countries gains have been limited (e.g. Austria,Czech Republic, Finland, Germany, Israel, Mexico, the Russian Federation, the Slovak Republic and theUnited States), or the proportion of men with tertiary educational attainment decreased, as in Braziland Estonia.
Women may have overtaken young men in terms of average educational attainment levels, but men andwomen still engage in different fields of study. While a large proportion of females graduate with degreesin humanities (OECD, 2010a, CO3.2), there is relatively low female participation in science and engineering(Panel B). This gender gap in engineering, manufacturing and construction degrees is particularly large inIreland, Japan, Switzerland and the Netherlands where less than 20% of graduates are female. In Greece,which has the highest proportion of female participation in engineering degrees, less than 50% ofengineering graduates are female. Because older female workers have relatively low average educationlevels, and younger women in general study arts rather than sciences, differences in labour marketoutcomes (employment and earnings) for men and women persist (see below).
1. FAMILIES ARE CHANGING
DOING BETTER FOR FAMILIES © OECD 201132
Box 1.3. Participation in education by gender: women are now more likelyto have a university degree, but they study humanities rather than sciences (cont.)
Women are more likely than men to have completed tertiary education, 2008
Note: Panel B: data missing for Chile, Estonia, Israel, Luxembourg and Slovenia.1. 2002 for the Russian Federation.
Source: OECD (2010i), Education at a Glance, for Panel A; OECD (2010a), OECD Family Database, CO3.2 for Panel B.1 2 http://dx.doi.org/10.1787/888932392856
70 40 4050 5060 6030 3020 2010 10 700 0
100
75
50
25
0
%
Women Men
Aged 25-34 years Aged 45-54
OECD32 average(25-34): 40%
OECD32 average(25-34): 32%
Men Women
Panel B. Proportion of university graduates receiving engineering, manufacturing and construction by gender, 2008
Panel A. Proportion of population with at least tertiary education, by gender and age group, 20081
DenmarkCanadaKoreaJapan
NorwayNew Zealand
IrelandIsrael
BelgiumFinland
AustraliaSweden
United StatesFranceSpain
LuxembourgNetherlands
EstoniaUnited Kingdom
PolandIceland
SloveniaSwitzerland
ChileGreece
PortugalHungaryGermany
ItalySlovak Republic
AustriaCzech Republic
MexicoTurkey
Russian FederationBrazil
Greece
Poland
Slovak
Rep
ublic
Spain
Italy
Icelan
d
Denmark
Sweden
New Ze
aland
Portug
al
Mexico
Franc
e
Turke
y
Belgium
OECD29
Czech
Rep
ublic
Norway
Austra
lia
Austra
lia
Canad
a
Austri
a
United
Kingdo
m
German
yKor
ea
Finlan
d
United
States
Irelan
d
Switzerl
and
Netherl
ands
Japa
n
1362
1419
202021
2425
2830
3234
35383939
40424243
4445
4646
48484849
5253
5559
6064
66
949
1721
1619
1615
2320
1724
3442
2228
2637
3037
3534
3637
3537
293636
3842
3752
5648
59
1. FAMILIES ARE CHANGING
DOING BETTER FOR FAMILIES © OECD 2011 33
Figure 1.8. Women are increasingly participating in paid work, 1980 to 2009As a percentage of the working population (15-64)
Note: Data missing for Chile, Estonia, Israel and Slovenia.1. For Korea data refers to ages 15-59 prior to 1989.
Source: OECD Database on Labour Force Statistics, 2010.1 2 http://dx.doi.org/10.1787/888932392590
90
80
70
60
50
40
30
20
10
0
90
80
70
60
50
40
30
20
10
0
1980
1982
1984
1986
1988
1990
1996
1998
2000
2002
2004
2006
2008
1992
1994
1980
1982
1984
1986
1988
1990
1996
1998
2000
2002
2004
2006
2008
1992
1994
90
80
70
60
50
40
30
20
10
0
90
80
70
60
50
40
30
20
10
0
1980
1982
1984
1986
1988
1990
1996
1998
2000
2002
2004
2006
2008
1992
1994
1980
1982
1984
1986
1988
1990
1996
1998
2000
2002
2004
2006
2008
1992
1994
90
80
70
60
50
40
30
20
10
0
90
80
70
60
50
40
30
20
10
0
1980
1982
1984
1986
1988
1990
1996
1998
2000
2002
2004
2006
2008
1992
1994
1980
1982
1984
1986
1988
1990
1996
1998
2000
2002
2004
2006
2008
1992
1994
Australia BelgiumCzech RepublicAustria
Canada OECDDenmark France
GreeceFinland
Germany OECD
Hungary IrelandJapanIceland
Italy OECDKorea1 Mexico
New ZealandLuxembourg
Netherlands OECD
Norway PortugalSpain
PolandSlovak Republic OECD
SwitzerlandUnited Kingdom
SwedenTurkey
Russian Federation
United States
OECD
1. FAMILIES ARE CHANGING
DOING BETTER FOR FAMILIES © OECD 201134
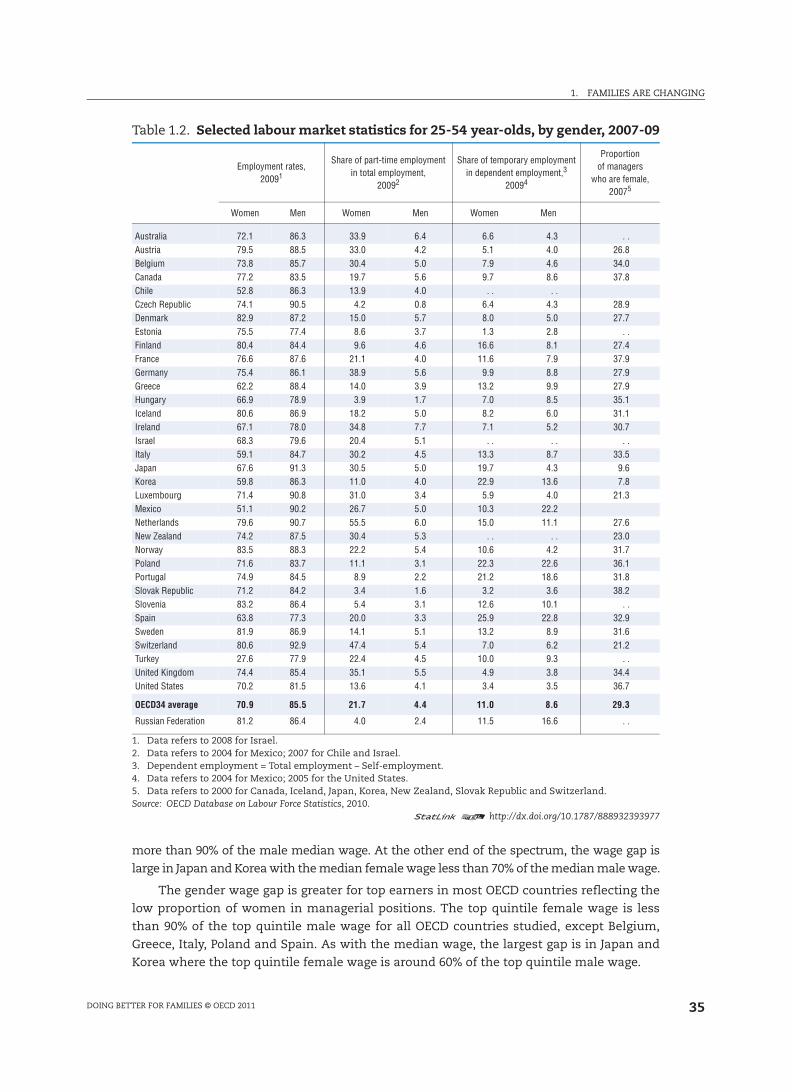
Gender differences in paid and unpaid work remain
Despite the improvement in female participation in the labour market, gender
inequalities persist. While over 70% of prime-aged women (25-54 year-olds) are employed
on average across the OECD, the figure is over 85% for men, resulting in a gender
employment gap of around 15 percentage points (Table 1.2). There are large cross-country
differences in the employment rate gender gap. The gap is below 5 percentage points in
Estonia, the Nordic countries and Slovenia. By contrast, the gender employment gap for
prime-age workers is over 30 percentage points in Chile and Mexico, and very high in
Turkey at over 50 percentage points.
There are also gender gaps in the intensity of employment participation. In all
OECD countries, a much larger share of female employment is part-time when compared
with male employment, with the OECD average for women at 21.7% compared with only
4.4% for men. The largest gaps in the share of part-time/full-time employment among men
and women are in Germany, the Netherlands, Switzerland and the United Kingdom where
over 35% of female employees work part-time. The gap is smallest in the Czech Republic,
Estonia, Finland, Hungary, Portugal, the Slovak Republic and Slovenia where less than 10%
of female employment is part-time. In contrast to the OECD countries the gender gap is low
in the Russian Federation where the average for women is almost on par with the average
for men (2.4%) at 4.0%, and is lower than the average for men in most OECD countries.
Women are also more likely than men to have a temporary rather than a permanent
employment contract (Table 1.2), particularly in Finland, Japan and Korea. In contrast,
women in Estonia, Hungary, Mexico and the Russian Federation, where a large proportion
work in the public sector, are more likely to have a permanent contract than their male
counterparts. In particular the proportion of employed men with temporary contracts is
very high in Mexico, Poland and Spain with over 20% of male employment being temporary.
The gender gap is also very large for managerial and supervisory jobs. Although the
number of reported jobs with management and supervisory responsibility varies from
country to country, women in Japan and Korea have the most difficulty getting through to
the top with less than 10% of management jobs occupied by women. Women have the best
career prospects in Canada, France, Hungary, Poland, Slovak Republic and the United
States, with over 35% of management jobs occupied by women.
Overall, despite the improvement of the labour market situation for women, significant
differences in gender employment outcomes remain across the OECD. To some extent this
reflects past education and labour market outcomes (older women have lower average levels
of education and are unlikely to have strong labour force attachment), but is also related to
women’s self-selection to employment in sectors with family-friendly workplace practices
(often in the public sector) or working under less favourable employment conditions
(e.g. temporary contracts). Together these factors contribute to persistent gender wage gaps.
The wage gap has reduced over time but in most OECD countries the median female wage was
still less than 90% of the median male wage in 2008 (see Figure 1.A1.3, Panel A in the annex).
Two notable exceptions are Hungary and Italy where the median female wage is almost the
same as the median male wage, which for Hungary is related to the recent increase in wages
in the public sector where a large proportion of women are employed. To some extent, the low
wage gap in Hungary and Italy is also due to selection of highly qualified women in the labour
market (both Hungary and Italy have low female employment rates, see above). In Belgium,
Greece, New Zealand and Norway, the wage gap is also small with the female median wage
1. FAMILIES ARE CHANGING
DOING BETTER FOR FAMILIES © OECD 2011 35
more than 90% of the male median wage. At the other end of the spectrum, the wage gap is
large in Japan and Korea with the median female wage less than 70% of the median male wage.
The gender wage gap is greater for top earners in most OECD countries reflecting the
low proportion of women in managerial positions. The top quintile female wage is less
than 90% of the top quintile male wage for all OECD countries studied, except Belgium,
Greece, Italy, Poland and Spain. As with the median wage, the largest gap is in Japan and
Korea where the top quintile female wage is around 60% of the top quintile male wage.
Table 1.2. Selected labour market statistics for 25-54 year-olds, by gender, 2007-09
Employment rates,20091
Share of part-time employmentin total employment,
20092
Share of temporary employmentin dependent employment,3
20094
Proportionof managers
who are female, 20075
Women Men Women Men Women Men
Australia 72.1 86.3 33.9 6.4 6.6 4.3 . .Austria 79.5 88.5 33.0 4.2 5.1 4.0 26.8Belgium 73.8 85.7 30.4 5.0 7.9 4.6 34.0Canada 77.2 83.5 19.7 5.6 9.7 8.6 37.8Chile 52.8 86.3 13.9 4.0 . . . .Czech Republic 74.1 90.5 4.2 0.8 6.4 4.3 28.9Denmark 82.9 87.2 15.0 5.7 8.0 5.0 27.7Estonia 75.5 77.4 8.6 3.7 1.3 2.8 . .Finland 80.4 84.4 9.6 4.6 16.6 8.1 27.4France 76.6 87.6 21.1 4.0 11.6 7.9 37.9Germany 75.4 86.1 38.9 5.6 9.9 8.8 27.9Greece 62.2 88.4 14.0 3.9 13.2 9.9 27.9Hungary 66.9 78.9 3.9 1.7 7.0 8.5 35.1Iceland 80.6 86.9 18.2 5.0 8.2 6.0 31.1Ireland 67.1 78.0 34.8 7.7 7.1 5.2 30.7Israel 68.3 79.6 20.4 5.1 . . . . . .Italy 59.1 84.7 30.2 4.5 13.3 8.7 33.5Japan 67.6 91.3 30.5 5.0 19.7 4.3 9.6Korea 59.8 86.3 11.0 4.0 22.9 13.6 7.8Luxembourg 71.4 90.8 31.0 3.4 5.9 4.0 21.3Mexico 51.1 90.2 26.7 5.0 10.3 22.2Netherlands 79.6 90.7 55.5 6.0 15.0 11.1 27.6New Zealand 74.2 87.5 30.4 5.3 . . . . 23.0Norway 83.5 88.3 22.2 5.4 10.6 4.2 31.7Poland 71.6 83.7 11.1 3.1 22.3 22.6 36.1Portugal 74.9 84.5 8.9 2.2 21.2 18.6 31.8Slovak Republic 71.2 84.2 3.4 1.6 3.2 3.6 38.2Slovenia 83.2 86.4 5.4 3.1 12.6 10.1 . .Spain 63.8 77.3 20.0 3.3 25.9 22.8 32.9Sweden 81.9 86.9 14.1 5.1 13.2 8.9 31.6Switzerland 80.6 92.9 47.4 5.4 7.0 6.2 21.2Turkey 27.6 77.9 22.4 4.5 10.0 9.3 . .United Kingdom 74.4 85.4 35.1 5.5 4.9 3.8 34.4United States 70.2 81.5 13.6 4.1 3.4 3.5 36.7
OECD34 average 70.9 85.5 21.7 4.4 11.0 8.6 29.3
Russian Federation 81.2 86.4 4.0 2.4 11.5 16.6 . .
1. Data refers to 2008 for Israel.2. Data refers to 2004 for Mexico; 2007 for Chile and Israel.3. Dependent employment = Total employment – Self-employment.4. Data refers to 2004 for Mexico; 2005 for the United States.5. Data refers to 2000 for Canada, Iceland, Japan, Korea, New Zealand, Slovak Republic and Switzerland.Source: OECD Database on Labour Force Statistics, 2010.
1 2 http://dx.doi.org/10.1787/888932393977
1. FAMILIES ARE CHANGING
DOING BETTER FOR FAMILIES © OECD 201136
These gender employment and wage gaps can also be related to the period of family
formation. Employment rates for men and women tend to be similar during their twenties,
but patterns diverge when adults become parents. Paternal employment behaviour is not
that different from men in general (although in some countries, e.g. Australia and the
United Kingdom, men often increase working hours after becoming fathers (OECD, 2010a,
LMF2.1 and LMF2.2) ), but in many countries female employment participation drops when
young children are present in households.
Employers are aware that mothers have to make work and family choices. In fact,
many employers expect women, regardless of their level of educational attainment to
withdraw (at least temporarily) from the labour force upon marriage and/or childbirth, and
are therefore, more likely to consider women less committed to their career than men. As
a result, employers are less likely to invest in female workers and their career prospects. To
some extent this is a vicious circle: as female workers have limited incentives to pursue a
career if they perceive the likelihood of moving upwards to be more limited than for men,
they are more likely to leave the labour force, thus reinforcing the stereotype. These
features apply to most OECD labour markets to some degree, but are particularly
pronounced in Asian OECD countries, where the choice between a career and motherhood
is a stark one. In Asian OECD countries, many women either have children or remain in
work: the constraints to labour force participation of women who do have children lends to
a considerable waste of human resources and can negatively affect child poverty (see
below), whereas the fact that many women choose not to have children will have
significant implications for the face of future societies.
Parents in work
The growth in the proportion of women in the labour force is strongly related to the
growing numbers of mothers re-entering the labour force or remaining in employment. On
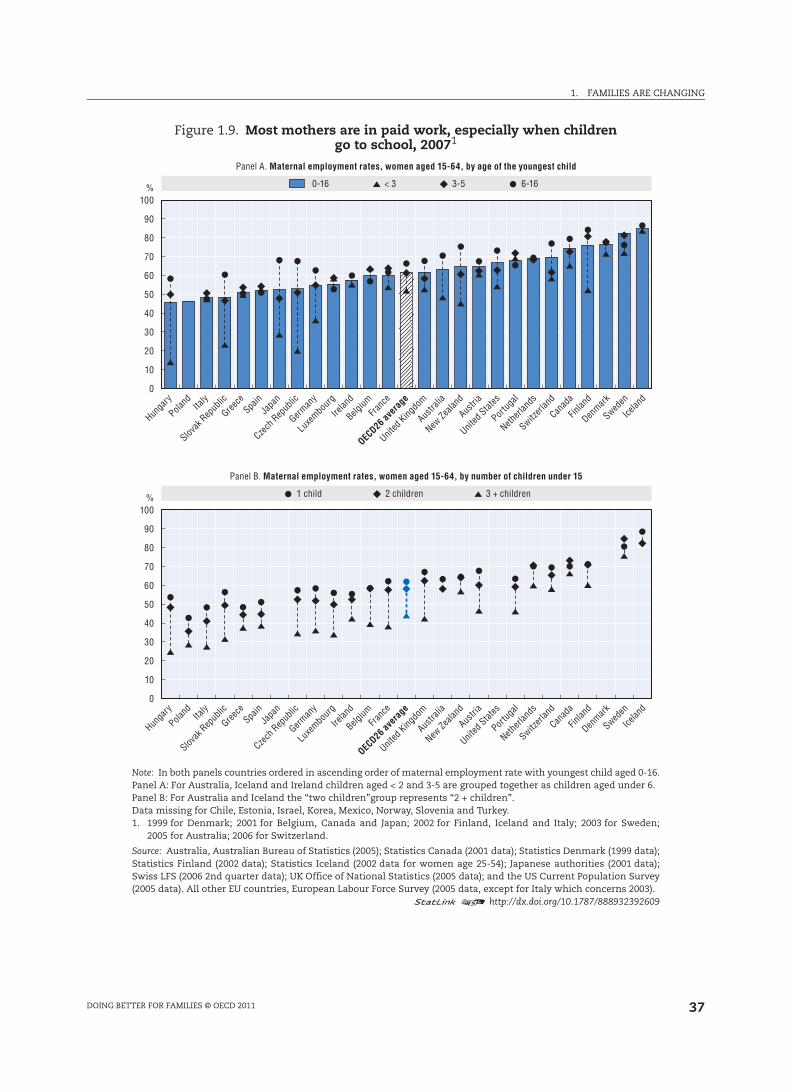
average across OECD countries in 2007, more than six out of ten mothers with dependent
children (aged 0-16) were in paid employment (Figure 1.9, Panel A). There is, however,
considerable cross-national variation. At below 50%, employment rates for mothers with
dependent children (0-16) were lowest in Hungary, Italy, Poland and the Slovak Republic. In
contrast, more than two out of three mothers were in paid employment in Canada, the
Netherlands, Switzerland and the United States, with maternal employment rates highest
in Nordic countries at around 75% or more.
Virtually all employed mothers take a short break from paid work just before birth and
during the first few months after a child’s birth. After this period, differences in national
parental leave and childcare support arrangements contribute to different labour force
behaviour of mothers (Chapter 4). Figure 1.9, Panel A shows that in many countries
maternal employment rates rebound when children are three to five years of age, and
maternal employment rates often increase further when children enter primary school
around the age of six. But the data also mask considerable cross-national differences in the
dynamics of employment relationships. For example, in Australia and New Zealand
mothers often reduce hours of work per week to care for young children and increase hours
when children go to primary school at age five, in contrast to the Netherlands and
Switzerland where part-time employment is a more permanent feature for mothers with
children throughout childhood (OECD, 2007b). The change in the prevalence and nature of
employment among mothers as their children grow older is discussed further in
Chapters 3 and 4.
1. FAMILIES ARE CHANGING
DOING BETTER FOR FAMILIES © OECD 2011 37
Figure 1.9. Most mothers are in paid work, especially when childrengo to school, 20071
Note: In both panels countries ordered in ascending order of maternal employment rate with youngest child aged 0-16.Panel A: For Australia, Iceland and Ireland children aged < 2 and 3-5 are grouped together as children aged under 6.Panel B: For Australia and Iceland the “two children”group represents “2 + children”.Data missing for Chile, Estonia, Israel, Korea, Mexico, Norway, Slovenia and Turkey.1. 1999 for Denmark; 2001 for Belgium, Canada and Japan; 2002 for Finland, Iceland and Italy; 2003 for Sweden;
2005 for Australia; 2006 for Switzerland.
Source: Australia, Australian Bureau of Statistics (2005); Statistics Canada (2001 data); Statistics Denmark (1999 data);Statistics Finland (2002 data); Statistics Iceland (2002 data for women age 25-54); Japanese authorities (2001 data);Swiss LFS (2006 2nd quarter data); UK Office of National Statistics (2005 data); and the US Current Population Survey(2005 data). All other EU countries, European Labour Force Survey (2005 data, except for Italy which concerns 2003).
1 2 http://dx.doi.org/10.1787/888932392609
100
90
80
70
60
50
40
30
20
10
0
%
100
90
80
70
60
50
40
30
20
10
0
%
Hun
gary
Poland
Italy
Slov
ak R
epub
lic
Gree
ceSpa
in
Japa
n
Czech
Rep
ublic
German
y
Luxe
mbourg
Irela
nd
Belg
iumFra
nce
OEC
D26 ave
rage
United
Kingdo
m
Austra
lia
New Ze
aland
Austri
a
United
States
Portug
al
Netherl
ands
Switzerl
and
Can
ada
Finlan
d
Denmark
Sweden
Icelan
d
0-16 3-5< 3 6-16
Panel A. Maternal employment rates, women aged 15-64, by age of the youngest child
Hun
gary
Poland
Italy
Slov
ak R
epub
lic
Gree
ceSpa
in
Japa
n
Czech
Rep
ublic
German
y
Luxe
mbourg
Irela
nd
Belg
iumFra
nce
OEC
D26 ave
rage
United
Kingdo
m
Austra
lia
New Ze
aland
Austri
a
United
States
Portug
al
Netherl
ands
Switzerl
and
Can
ada
Finlan
d
Denmark
Sweden
Icelan
d
2 children 3 + children1 child
Panel B. Maternal employment rates, women aged 15-64, by number of children under 15
1. FAMILIES ARE CHANGING
DOING BETTER FOR FAMILIES © OECD 201138
Employment rates tend to be lower for mothers with a greater number of dependent
children (Figure 1.9 Panel B). In 2007, on average almost 60% of mothers with one child
were in paid employment, while this was about 55% for mothers with two children. In
Greece, Hungary, Italy, Luxembourg, Poland, the Slovak Republic and Spain, less than half
of mothers with two or more children were in paid employment in 2007. Maternal
employment rates tail off even further in the presence of a third child, to below 30% in
Hungary, Italy and Poland.
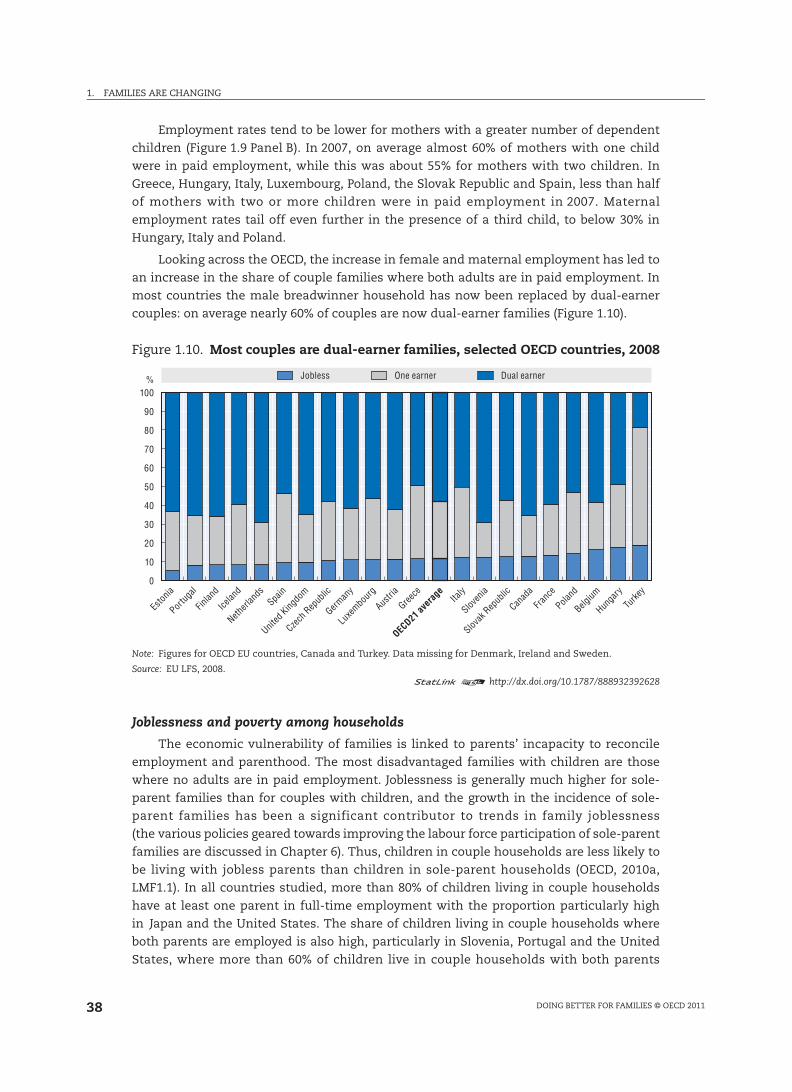
Looking across the OECD, the increase in female and maternal employment has led to
an increase in the share of couple families where both adults are in paid employment. In
most countries the male breadwinner household has now been replaced by dual-earner
couples: on average nearly 60% of couples are now dual-earner families (Figure 1.10).
Joblessness and poverty among households
The economic vulnerability of families is linked to parents’ incapacity to reconcile
employment and parenthood. The most disadvantaged families with children are those
where no adults are in paid employment. Joblessness is generally much higher for sole-
parent families than for couples with children, and the growth in the incidence of sole-
parent families has been a significant contributor to trends in family joblessness
(the various policies geared towards improving the labour force participation of sole-parent
families are discussed in Chapter 6). Thus, children in couple households are less likely to
be living with jobless parents than children in sole-parent households (OECD, 2010a,
LMF1.1). In all countries studied, more than 80% of children living in couple households
have at least one parent in full-time employment with the proportion particularly high
in Japan and the United States. The share of children living in couple households where
both parents are employed is also high, particularly in Slovenia, Portugal and the United
States, where more than 60% of children live in couple households with both parents
Figure 1.10. Most couples are dual-earner families, selected OECD countries, 2008
Note: Figures for OECD EU countries, Canada and Turkey. Data missing for Denmark, Ireland and Sweden.
Source: EU LFS, 2008.1 2 http://dx.doi.org/10.1787/888932392628
100
90
80
70
60
50
40
30
20
10
0
%
Eston
ia
Por
tugal
Finl
and
Icelan
d
Netherl
ands
Spain
Unit
ed King
dom
Cze
ch R
epub
lic
Germ
any
Luxe
mbourg
Aus
tria
Gree
ce
OECD21 a
vera
ge It
aly
Slov
enia
Slov
ak R
epub
lic
Can
ada
Fran
ce
Pola
nd
Belg
ium
Hunga
ry
Turke
y
Jobless One earner Dual earner
1. FAMILIES ARE CHANGING
DOING BETTER FOR FAMILIES © OECD 2011 39
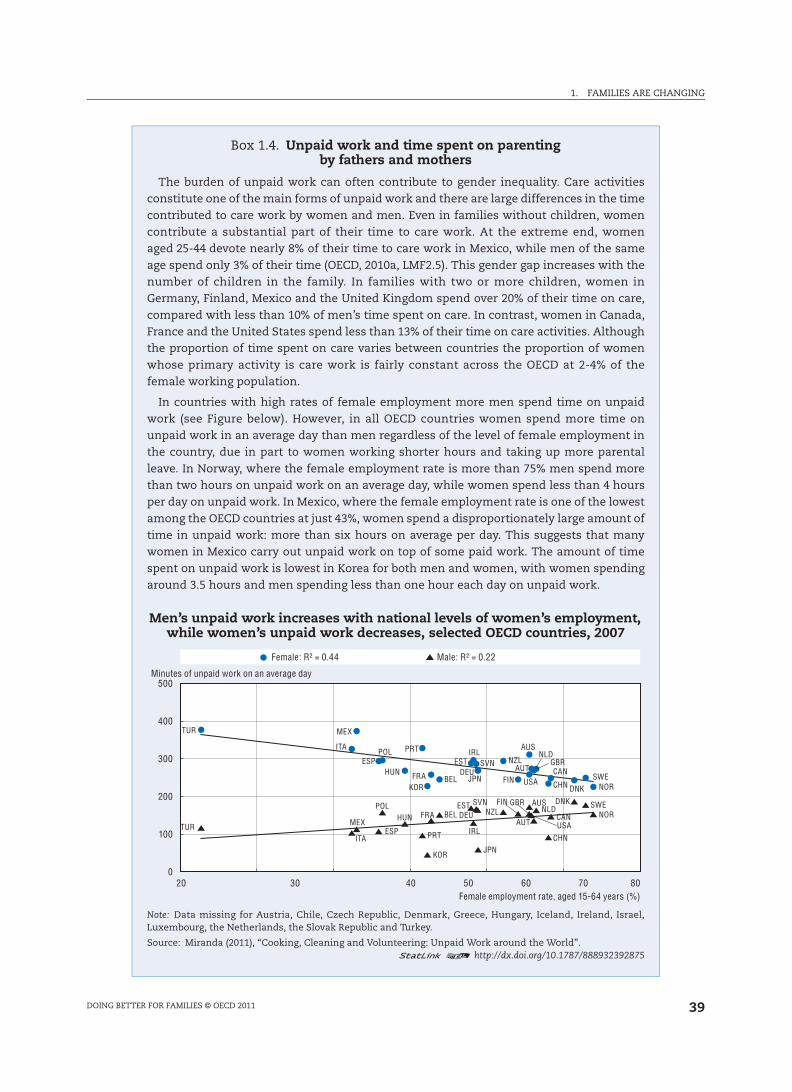
Box 1.4. Unpaid work and time spent on parentingby fathers and mothers
The burden of unpaid work can often contribute to gender inequality. Care activitiesconstitute one of the main forms of unpaid work and there are large differences in the timecontributed to care work by women and men. Even in families without children, womencontribute a substantial part of their time to care work. At the extreme end, womenaged 25-44 devote nearly 8% of their time to care work in Mexico, while men of the sameage spend only 3% of their time (OECD, 2010a, LMF2.5). This gender gap increases with thenumber of children in the family. In families with two or more children, women inGermany, Finland, Mexico and the United Kingdom spend over 20% of their time on care,compared with less than 10% of men’s time spent on care. In contrast, women in Canada,France and the United States spend less than 13% of their time on care activities. Althoughthe proportion of time spent on care varies between countries the proportion of womenwhose primary activity is care work is fairly constant across the OECD at 2-4% of thefemale working population.
In countries with high rates of female employment more men spend time on unpaidwork (see Figure below). However, in all OECD countries women spend more time onunpaid work in an average day than men regardless of the level of female employment inthe country, due in part to women working shorter hours and taking up more parentalleave. In Norway, where the female employment rate is more than 75% men spend morethan two hours on unpaid work on an average day, while women spend less than 4 hoursper day on unpaid work. In Mexico, where the female employment rate is one of the lowestamong the OECD countries at just 43%, women spend a disproportionately large amount oftime in unpaid work: more than six hours on average per day. This suggests that manywomen in Mexico carry out unpaid work on top of some paid work. The amount of timespent on unpaid work is lowest in Korea for both men and women, with women spendingaround 3.5 hours and men spending less than one hour each day on unpaid work.
Men’s unpaid work increases with national levels of women’s employment, while women’s unpaid work decreases, selected OECD countries, 2007
Note: Data missing for Austria, Chile, Czech Republic, Denmark, Greece, Hungary, Iceland, Ireland, Israel,Luxembourg, the Netherlands, the Slovak Republic and Turkey.
Source: Miranda (2011), “Cooking, Cleaning and Volunteering: Unpaid Work around the World”.1 2 http://dx.doi.org/10.1787/888932392875
500
400
300
200
100
020 5030 40 60 70 80
AUS
AUTBEL
CAN
CHN DNK
EST
FINFRA DEUHUN
IRLITA
JPNKOR
MEX
NLDNZL
NOR
POL PRT
SVNESP
SWE
TUR
GBR
USA
AUS
AUTBEL CAN
CHN
DNKEST FIN
FRA DEUHUN
IRLITA
JPNKOR
MEX
NLDNZL NORPOL
PRT
SVN
ESP
SWE
TUR
GBR
USA
Minutes of unpaid work on an average day
Female employment rate, aged 15-64 years (%)
Female: R² = 0.44 Male: R² = 0.22
1. FAMILIES ARE CHANGING
DOING BETTER FOR FAMILIES © OECD 201140
working full-time. Given that joblessness greatly increases the chances of a household
being poor, couple households can act as a protection for children against poverty as such
households are less likely to be jobless.
A significant minority of families in work are poor (as measured with respect to half
the median disposable household income). Sole-parent families with a working adult
generally have higher poverty rates than two-parent households where only one parent is
employed, with the exceptions of Denmark, Norway, Sweden and Portugal (Whiteford and
Adema, 2007). But joblessness is still the major poverty risk especially among sole-parent
families. In almost all countries, poverty rates among non-employed lone parents are at
least twice as high as among those with paid work (Table 1.3), while poverty rates among
couples with children where neither parent is employed are, on average, three times higher
than where one parent is employed, and more than ten times higher than where both
parents are employed.
It is a particular worry that in most OECD countries, poverty risks have shifted over the
past 20 years towards families with children (Förster and Mira d’Ercole, 2005). In many
countries, families with children are disproportionately likely to be poor; only in Belgium,
Denmark, Finland, Greece, Norway and Sweden do children face lower risks of poverty than
the national average. Israel and Mexico have the highest rate of child poverty in the OECD
with more than a quarter of children living in poor households. The poverty rate is also
high in Chile, Poland, Turkey and the United States at over 20% (Table 1.3).
Public benefits for families
With the current economic crisis, and the shift in poverty risks towards households
with children, it is important for countries to provide support for families, especially for
those with elevated poverty risks such as sole-parent and jobless households. Most
governments provide support to families in the form of cash benefits (Figure 1.11): cash
benefits make up more than 40% of public spending on families in all OECD countries
except France, Germany, Iceland, Japan, Korea, Mexico, the Netherlands, Spain, Sweden
and the United States. In Korea, where public social benefits are low overall, cash benefits
are extremely low making up less than 5% of all public spending on families. On the
contrary, tax breaks for families are low in most OECD countries. Tax breaks only constitute
a significant proportion of public family spending in Canada, Germany, Japan, Poland and
the United States where they account for over 30% of spending on families.
Box 1.4. Unpaid work and time spent on parentingby fathers and mothers (cont.)
In general, women spend at least twice as much time on care work (for children andadults) as a primary activity than men. The largest differences are recorded for Japan andTurkey where women spent on average 4 and 6 times more time on care work than men,respectively (OECD, 2010a, LMF2.5).
Gender inequality also persists in child-related leave policies (OECD, 2007b). Mothers areentitled to paid leave with employment protection in all OECD countries except the UnitedStates. Legal entitlements to paternity leave exist in around half of OECD countries withpayment rates at 100% of salary, but duration is considerably shorter. For example, inAustria, Greece, Ireland, Luxembourg, the Netherlands and Spain, paternity leave amountsto three days or less (Chapter 4 and OECD, 2010a, PF2.1 and PF 2.2).
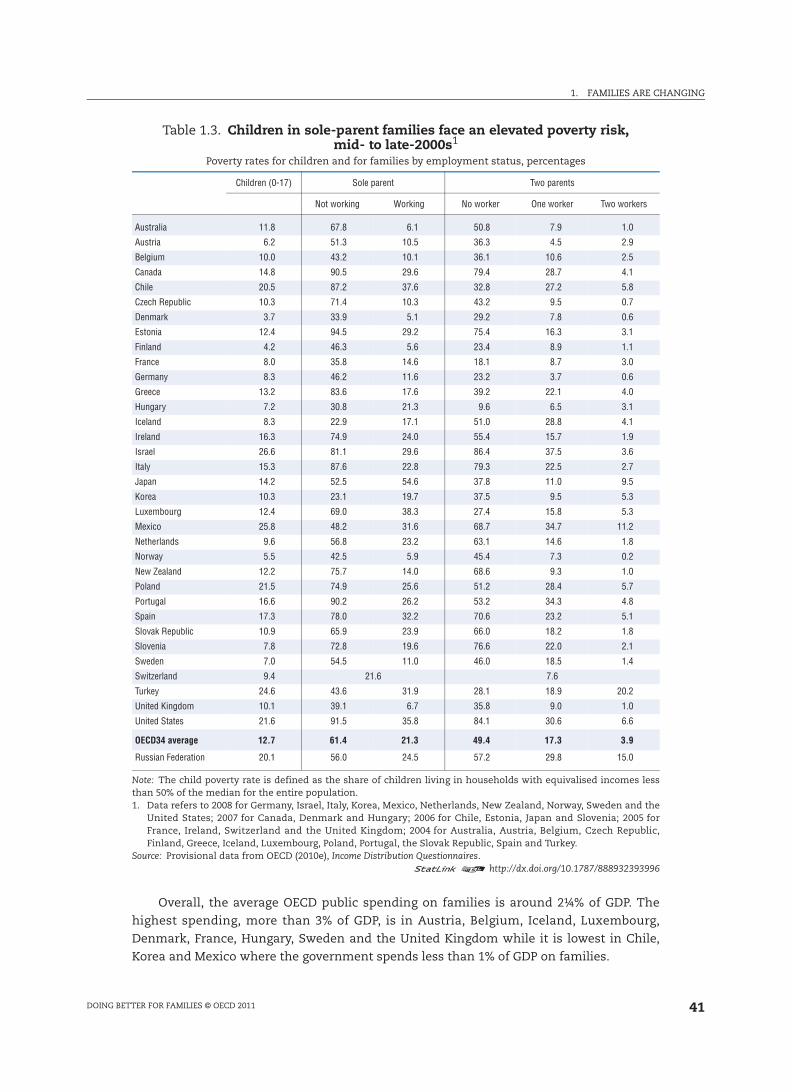
1. FAMILIES ARE CHANGING
DOING BETTER FOR FAMILIES © OECD 2011 41
Overall, the average OECD public spending on families is around 2¼% of GDP. The
highest spending, more than 3% of GDP, is in Austria, Belgium, Iceland, Luxembourg,
Denmark, France, Hungary, Sweden and the United Kingdom while it is lowest in Chile,
Korea and Mexico where the government spends less than 1% of GDP on families.
Table 1.3. Children in sole-parent families face an elevated poverty risk,mid- to late-2000s1
Poverty rates for children and for families by employment status, percentages
Children (0-17) Sole parent Two parents
Not working Working No worker One worker Two workers
Australia 11.8 67.8 6.1 50.8 7.9 1.0
Austria 6.2 51.3 10.5 36.3 4.5 2.9
Belgium 10.0 43.2 10.1 36.1 10.6 2.5
Canada 14.8 90.5 29.6 79.4 28.7 4.1
Chile 20.5 87.2 37.6 32.8 27.2 5.8
Czech Republic 10.3 71.4 10.3 43.2 9.5 0.7
Denmark 3.7 33.9 5.1 29.2 7.8 0.6
Estonia 12.4 94.5 29.2 75.4 16.3 3.1
Finland 4.2 46.3 5.6 23.4 8.9 1.1
France 8.0 35.8 14.6 18.1 8.7 3.0
Germany 8.3 46.2 11.6 23.2 3.7 0.6
Greece 13.2 83.6 17.6 39.2 22.1 4.0
Hungary 7.2 30.8 21.3 9.6 6.5 3.1
Iceland 8.3 22.9 17.1 51.0 28.8 4.1
Ireland 16.3 74.9 24.0 55.4 15.7 1.9
Israel 26.6 81.1 29.6 86.4 37.5 3.6
Italy 15.3 87.6 22.8 79.3 22.5 2.7
Japan 14.2 52.5 54.6 37.8 11.0 9.5
Korea 10.3 23.1 19.7 37.5 9.5 5.3
Luxembourg 12.4 69.0 38.3 27.4 15.8 5.3
Mexico 25.8 48.2 31.6 68.7 34.7 11.2
Netherlands 9.6 56.8 23.2 63.1 14.6 1.8
Norway 5.5 42.5 5.9 45.4 7.3 0.2
New Zealand 12.2 75.7 14.0 68.6 9.3 1.0
Poland 21.5 74.9 25.6 51.2 28.4 5.7
Portugal 16.6 90.2 26.2 53.2 34.3 4.8
Spain 17.3 78.0 32.2 70.6 23.2 5.1
Slovak Republic 10.9 65.9 23.9 66.0 18.2 1.8
Slovenia 7.8 72.8 19.6 76.6 22.0 2.1
Sweden 7.0 54.5 11.0 46.0 18.5 1.4
Switzerland 9.4 21.6 7.6
Turkey 24.6 43.6 31.9 28.1 18.9 20.2
United Kingdom 10.1 39.1 6.7 35.8 9.0 1.0
United States 21.6 91.5 35.8 84.1 30.6 6.6
OECD34 average 12.7 61.4 21.3 49.4 17.3 3.9
Russian Federation 20.1 56.0 24.5 57.2 29.8 15.0
Note: The child poverty rate is defined as the share of children living in households with equivalised incomes lessthan 50% of the median for the entire population.1. Data refers to 2008 for Germany, Israel, Italy, Korea, Mexico, Netherlands, New Zealand, Norway, Sweden and the
United States; 2007 for Canada, Denmark and Hungary; 2006 for Chile, Estonia, Japan and Slovenia; 2005 forFrance, Ireland, Switzerland and the United Kingdom; 2004 for Australia, Austria, Belgium, Czech Republic,Finland, Greece, Iceland, Luxembourg, Poland, Portugal, the Slovak Republic, Spain and Turkey.
Source: Provisional data from OECD (2010e), Income Distribution Questionnaires.1 2 http://dx.doi.org/10.1787/888932393996
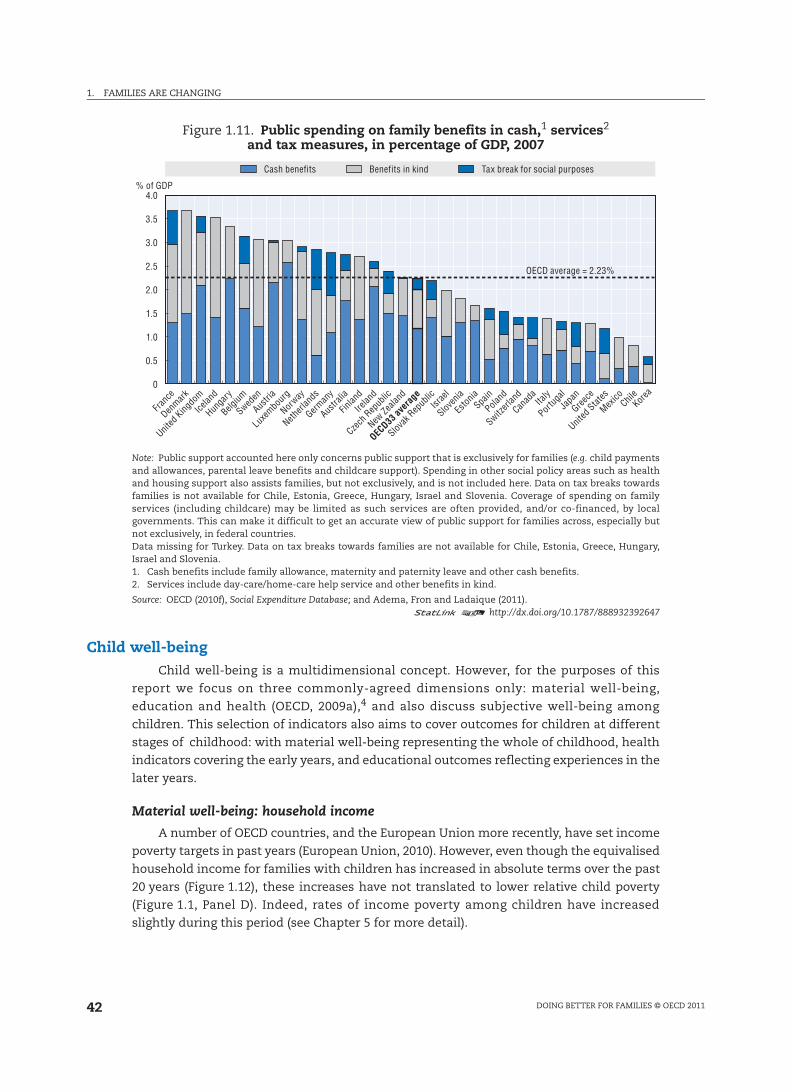
1. FAMILIES ARE CHANGING
DOING BETTER FOR FAMILIES © OECD 201142
Child well-beingChild well-being is a multidimensional concept. However, for the purposes of this
report we focus on three commonly-agreed dimensions only: material well-being,
education and health (OECD, 2009a),4 and also discuss subjective well-being among
children. This selection of indicators also aims to cover outcomes for children at different
stages of childhood: with material well-being representing the whole of childhood, health
indicators covering the early years, and educational outcomes reflecting experiences in the
later years.
Material well-being: household income
A number of OECD countries, and the European Union more recently, have set income
poverty targets in past years (European Union, 2010). However, even though the equivalised
household income for families with children has increased in absolute terms over the past
20 years (Figure 1.12), these increases have not translated to lower relative child poverty
(Figure 1.1, Panel D). Indeed, rates of income poverty among children have increased
slightly during this period (see Chapter 5 for more detail).
Figure 1.11. Public spending on family benefits in cash,1 services2
and tax measures, in percentage of GDP, 2007
Note: Public support accounted here only concerns public support that is exclusively for families (e.g. child paymentsand allowances, parental leave benefits and childcare support). Spending in other social policy areas such as healthand housing support also assists families, but not exclusively, and is not included here. Data on tax breaks towardsfamilies is not available for Chile, Estonia, Greece, Hungary, Israel and Slovenia. Coverage of spending on familyservices (including childcare) may be limited as such services are often provided, and/or co-financed, by localgovernments. This can make it difficult to get an accurate view of public support for families across, especially butnot exclusively, in federal countries.Data missing for Turkey. Data on tax breaks towards families are not available for Chile, Estonia, Greece, Hungary,Israel and Slovenia.1. Cash benefits include family allowance, maternity and paternity leave and other cash benefits.2. Services include day-care/home-care help service and other benefits in kind.
Source: OECD (2010f), Social Expenditure Database; and Adema, Fron and Ladaique (2011).1 2 http://dx.doi.org/10.1787/888932392647
4.0
3.5
3.0
2.5
2.0
1.5
1.0
0.5
0
% of GDP
Franc
e
Den
mark
Unit
ed King
dom
Icela
nd
Hun
gary
Belg
ium
Swed
en
Aus
tria
Luxe
mbourg
Nor
way
Neth
erlan
ds
German
y
Aus
tralia
Finl
and
Irela
nd
Cze
ch R
epub
lic
New
Zeala
nd
OEC
D33 ave
rage
Slov
ak R
epub
lic
Israe
l
Slov
enia
Esto
nia
Spa
in
Pola
nd
Switzerl
and
Canad
a
Portug
alIta
ly
Japa
n
United
States
Greece
Mex
ico K
orea
Chile
Cash benefits Benefits in kind Tax break for social purposes
OECD average = 2.23%
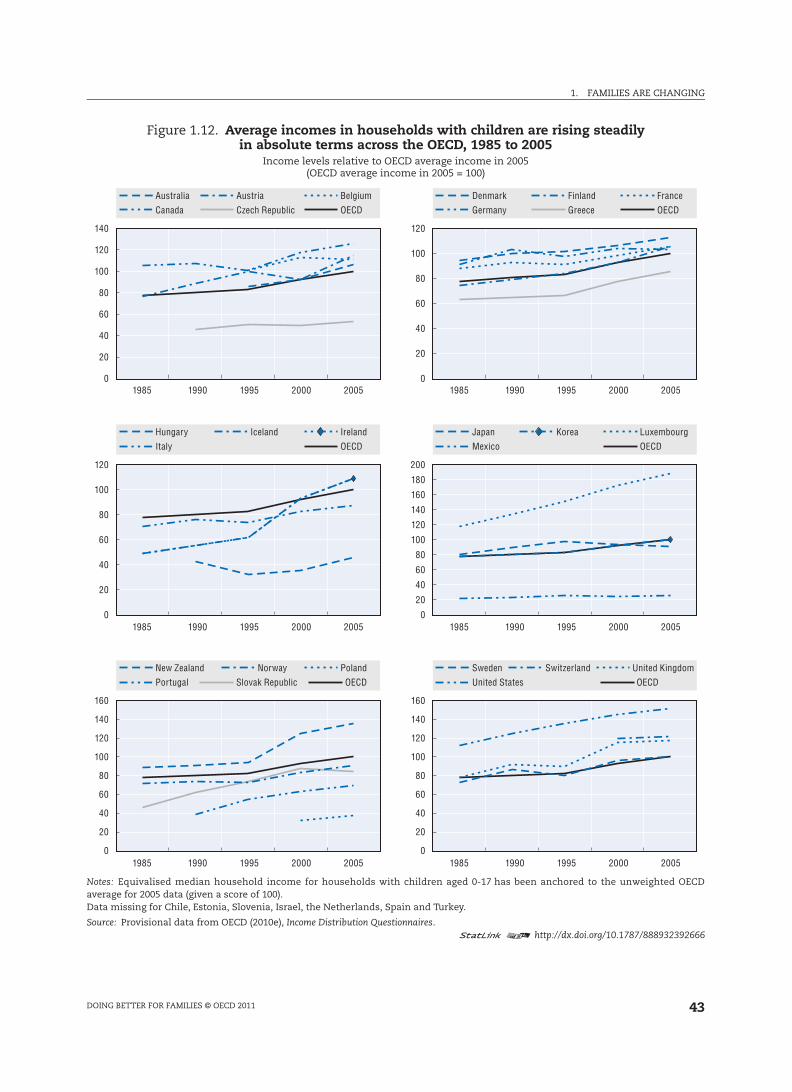
1. FAMILIES ARE CHANGING
DOING BETTER FOR FAMILIES © OECD 2011 43
Figure 1.12. Average incomes in households with children are rising steadilyin absolute terms across the OECD, 1985 to 2005
Income levels relative to OECD average income in 2005(OECD average income in 2005 = 100)
Notes: Equivalised median household income for households with children aged 0-17 has been anchored to the unweighted OECDaverage for 2005 data (given a score of 100).Data missing for Chile, Estonia, Slovenia, Israel, the Netherlands, Spain and Turkey.
Source: Provisional data from OECD (2010e), Income Distribution Questionnaires.1 2 http://dx.doi.org/10.1787/888932392666
140
120
100
80
60
40
20
0
120
100
80
60
40
20
0 1985 1990 1995 2000 2005
1985 1990 1995 2000 2005
1985 1990 1995 2000 2005
1985 1990 1995 2000 2005
1985 1990 1995 2000 2005
1985 1990 1995 2000 2005
120
100
80
60
40
20
0
200
180
160
140
120
100
80
60
20
40
0
160
140
120
100
80
60
40
20
0
160
140
120
100
80
60
40
20
0
Australia BelgiumCzech RepublicAustria
Canada OECDDenmark France
GreeceFinland
Germany OECD
Hungary IrelandIcelandItaly OECD
Japan LuxembourgKoreaMexico OECD
New Zealand PolandSlovak Republic
NorwayPortugal OECD
Sweden United KingdomSwitzerlandUnited States OECD
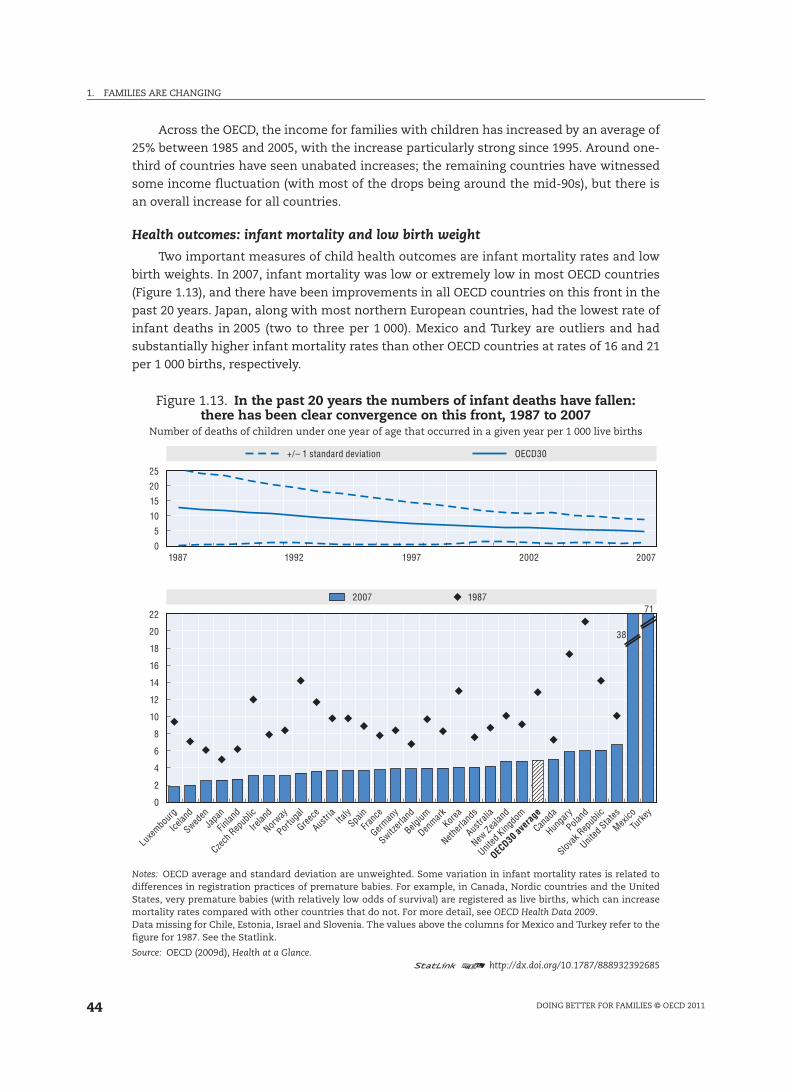
1. FAMILIES ARE CHANGING
DOING BETTER FOR FAMILIES © OECD 201144
Across the OECD, the income for families with children has increased by an average of
25% between 1985 and 2005, with the increase particularly strong since 1995. Around one-
third of countries have seen unabated increases; the remaining countries have witnessed
some income fluctuation (with most of the drops being around the mid-90s), but there is
an overall increase for all countries.
Health outcomes: infant mortality and low birth weight
Two important measures of child health outcomes are infant mortality rates and low
birth weights. In 2007, infant mortality was low or extremely low in most OECD countries
(Figure 1.13), and there have been improvements in all OECD countries on this front in the
past 20 years. Japan, along with most northern European countries, had the lowest rate of
infant deaths in 2005 (two to three per 1 000). Mexico and Turkey are outliers and had
substantially higher infant mortality rates than other OECD countries at rates of 16 and 21
per 1 000 births, respectively.
Figure 1.13. In the past 20 years the numbers of infant deaths have fallen:there has been clear convergence on this front, 1987 to 2007
Number of deaths of children under one year of age that occurred in a given year per 1 000 live births
Notes: OECD average and standard deviation are unweighted. Some variation in infant mortality rates is related todifferences in registration practices of premature babies. For example, in Canada, Nordic countries and the UnitedStates, very premature babies (with relatively low odds of survival) are registered as live births, which can increasemortality rates compared with other countries that do not. For more detail, see OECD Health Data 2009.Data missing for Chile, Estonia, Israel and Slovenia. The values above the columns for Mexico and Turkey refer to thefigure for 1987. See the Statlink.
Source: OECD (2009d), Health at a Glance.1 2 http://dx.doi.org/10.1787/888932392685
25
20
15
10
5
01987 1992 1997 2002 2007
22
18
20
16
14
12
10
8
6
4
2
0
38
71
+/– 1 standard deviation OECD30
2007 1987
Luxe
mbourg
Icela
nd
Sweden
Japa
n
Finl
and
Cze
ch R
epub
lic
Irela
nd
Nor
way
Por
tugal
Gree
ce
Aus
tria It
aly
Spa
in
Fran
ce
Germ
any
Switz
erlan
d
Belg
ium
Den
mark
Kore
a
Neth
erlan
ds
Aus
tralia
New
Zeala
nd
Unit
ed King
dom
OECD30 a
vera
ge
Can
ada
Hun
gary
Poland
Slov
ak R
epub
lic
Unit
ed Stat
es
Mex
ico
Turke
y
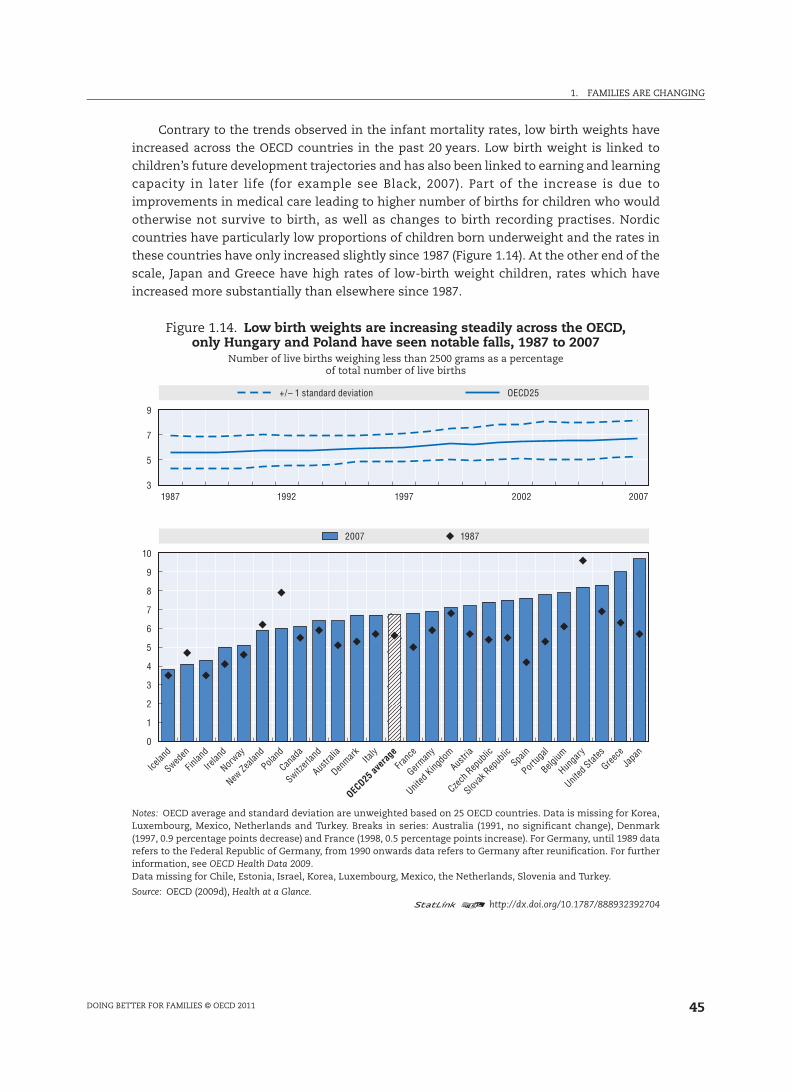
1. FAMILIES ARE CHANGING
DOING BETTER FOR FAMILIES © OECD 2011 45
Contrary to the trends observed in the infant mortality rates, low birth weights have
increased across the OECD countries in the past 20 years. Low birth weight is linked to
children’s future development trajectories and has also been linked to earning and learning
capacity in later life (for example see Black, 2007). Part of the increase is due to
improvements in medical care leading to higher number of births for children who would
otherwise not survive to birth, as well as changes to birth recording practises. Nordic
countries have particularly low proportions of children born underweight and the rates in
these countries have only increased slightly since 1987 (Figure 1.14). At the other end of the
scale, Japan and Greece have high rates of low-birth weight children, rates which have
increased more substantially than elsewhere since 1987.
Figure 1.14. Low birth weights are increasing steadily across the OECD,only Hungary and Poland have seen notable falls, 1987 to 2007
Number of live births weighing less than 2500 grams as a percentageof total number of live births
Notes: OECD average and standard deviation are unweighted based on 25 OECD countries. Data is missing for Korea,Luxembourg, Mexico, Netherlands and Turkey. Breaks in series: Australia (1991, no significant change), Denmark(1997, 0.9 percentage points decrease) and France (1998, 0.5 percentage points increase). For Germany, until 1989 datarefers to the Federal Republic of Germany, from 1990 onwards data refers to Germany after reunification. For furtherinformation, see OECD Health Data 2009.Data missing for Chile, Estonia, Israel, Korea, Luxembourg, Mexico, the Netherlands, Slovenia and Turkey.
Source: OECD (2009d), Health at a Glance.1 2 http://dx.doi.org/10.1787/888932392704
9
7
5
31987 1992 1997 2002 2007
10
9
8
7
6
5
4
3
2
1
0
+/– 1 standard deviation OECD25
2007 1987
Icela
nd
Sweden
Japa
n
Finl
and
Cze
ch R
epub
lic
Irela
nd
Nor
way
Por
tugal
Gree
ce
Aus
tria
Italy
Spa
in
Fran
ce
Germ
any
Switz
erlan
d
Belg
ium
Den
mark
Aus
tralia
New
Zeala
nd
Unit
ed King
dom
OECD25 a
vera
ge
Can
ada
Hun
gary
Poland
Slov
ak R
epub
lic
Unit
ed Stat
es
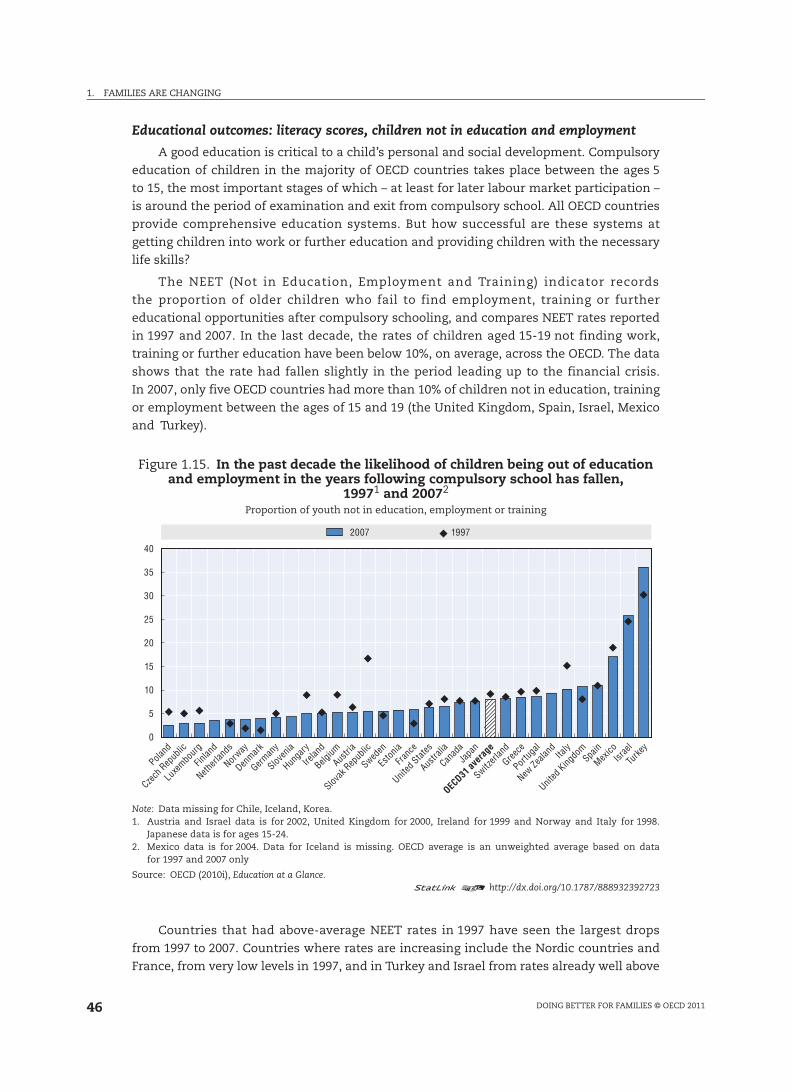
1. FAMILIES ARE CHANGING
DOING BETTER FOR FAMILIES © OECD 201146
Educational outcomes: literacy scores, children not in education and employment
A good education is critical to a child’s personal and social development. Compulsory
education of children in the majority of OECD countries takes place between the ages 5
to 15, the most important stages of which – at least for later labour market participation –
is around the period of examination and exit from compulsory school. All OECD countries
provide comprehensive education systems. But how successful are these systems at
getting children into work or further education and providing children with the necessary
life skills?
The NEET (Not in Education, Employment and Training) indicator records
the proportion of older children who fail to find employment, training or further
educational opportunities after compulsory schooling, and compares NEET rates reported
in 1997 and 2007. In the last decade, the rates of children aged 15-19 not finding work,
training or further education have been below 10%, on average, across the OECD. The data
shows that the rate had fallen slightly in the period leading up to the financial crisis.
In 2007, only five OECD countries had more than 10% of children not in education, training
or employment between the ages of 15 and 19 (the United Kingdom, Spain, Israel, Mexico
and Turkey).
Countries that had above-average NEET rates in 1997 have seen the largest drops
from 1997 to 2007. Countries where rates are increasing include the Nordic countries and
France, from very low levels in 1997, and in Turkey and Israel from rates already well above
Figure 1.15. In the past decade the likelihood of children being out of education and employment in the years following compulsory school has fallen,
19971 and 20072
Proportion of youth not in education, employment or training
Note: Data missing for Chile, Iceland, Korea.1. Austria and Israel data is for 2002, United Kingdom for 2000, Ireland for 1999 and Norway and Italy for 1998.
Japanese data is for ages 15-24.2. Mexico data is for 2004. Data for Iceland is missing. OECD average is an unweighted average based on data
for 1997 and 2007 only
Source: OECD (2010i), Education at a Glance.1 2 http://dx.doi.org/10.1787/888932392723
40
35
30
25
20
15
10
5
0
Poland
Czech
Rep
ublic
Netherl
ands
Nor
way
Luxe
mbourg
Finlan
d
Den
mark
German
y
Irela
nd
Belgium
Sloven
ia
Hunga
ry
Austri
a
Slovak
Rep
ublic
Franc
e
United
States
Sweden
Eston
ia
Austra
lia
Canad
a
Switzerl
and
Greece
Japa
n
OECD31
aver
age
Portug
al
New Ze
aland Ita
ly
United
Kingdo
mIsr
ael
Turke
ySpa
in
Mexico
2007 1997
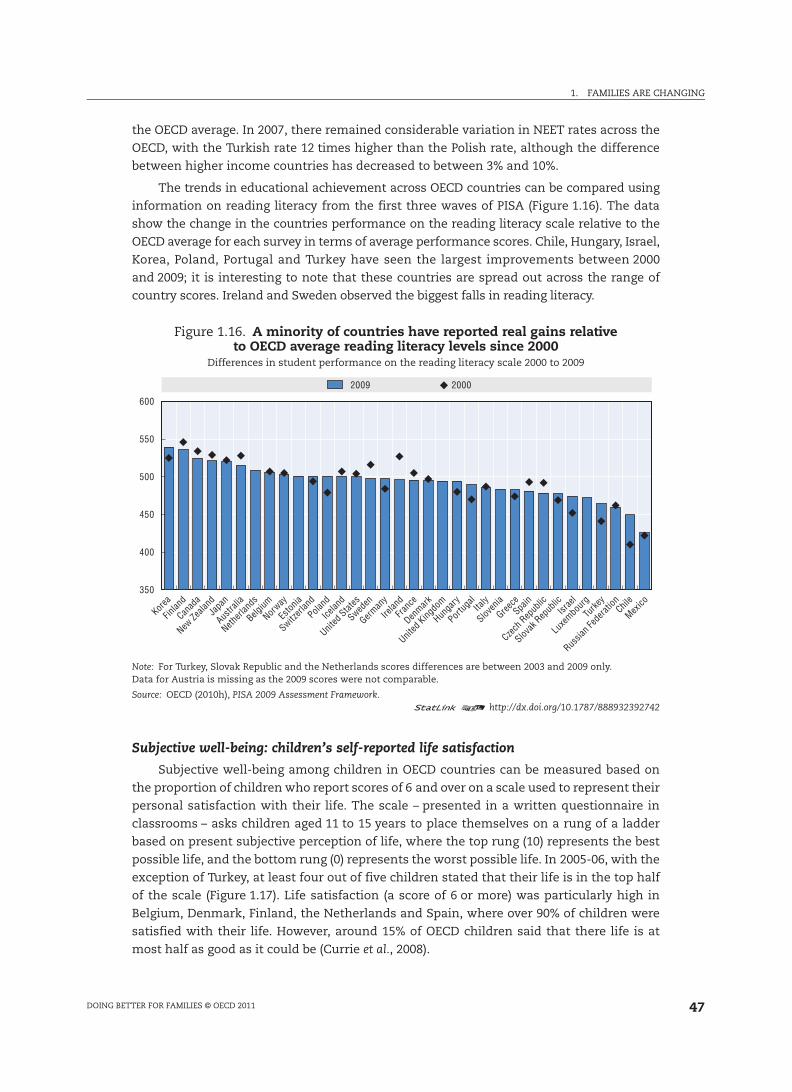
1. FAMILIES ARE CHANGING
DOING BETTER FOR FAMILIES © OECD 2011 47
the OECD average. In 2007, there remained considerable variation in NEET rates across the
OECD, with the Turkish rate 12 times higher than the Polish rate, although the difference
between higher income countries has decreased to between 3% and 10%.
The trends in educational achievement across OECD countries can be compared using
information on reading literacy from the first three waves of PISA (Figure 1.16). The data
show the change in the countries performance on the reading literacy scale relative to the
OECD average for each survey in terms of average performance scores. Chile, Hungary, Israel,
Korea, Poland, Portugal and Turkey have seen the largest improvements between 2000
and 2009; it is interesting to note that these countries are spread out across the range of
country scores. Ireland and Sweden observed the biggest falls in reading literacy.
Subjective well-being: children’s self-reported life satisfaction
Subjective well-being among children in OECD countries can be measured based on
the proportion of children who report scores of 6 and over on a scale used to represent their
personal satisfaction with their life. The scale – presented in a written questionnaire in
classrooms – asks children aged 11 to 15 years to place themselves on a rung of a ladder
based on present subjective perception of life, where the top rung (10) represents the best
possible life, and the bottom rung (0) represents the worst possible life. In 2005-06, with the
exception of Turkey, at least four out of five children stated that their life is in the top half
of the scale (Figure 1.17). Life satisfaction (a score of 6 or more) was particularly high in
Belgium, Denmark, Finland, the Netherlands and Spain, where over 90% of children were
satisfied with their life. However, around 15% of OECD children said that there life is at
most half as good as it could be (Currie et al., 2008).
Figure 1.16. A minority of countries have reported real gains relativeto OECD average reading literacy levels since 2000
Differences in student performance on the reading literacy scale 2000 to 2009
Note: For Turkey, Slovak Republic and the Netherlands scores differences are between 2003 and 2009 only.Data for Austria is missing as the 2009 scores were not comparable.
Source: OECD (2010h), PISA 2009 Assessment Framework.1 2 http://dx.doi.org/10.1787/888932392742
600
550
500
450
400
350
Korea
Finlan
dJa
pan
Aus
tralia
Can
ada
New Ze
aland
Neth
erlan
ds
Belgium
Switz
erlan
d
Poland
Norway
Eston
ia
Icelan
d
United
States
Irelan
d
Franc
e
Sweden
German
y
Denmark
United
Kingdo
m
Portug
alIta
ly
Hunga
ry
Sloven
ia
GreeceSpa
in
Czech
Rep
ublic
Luxe
mbourg
Turke
y
Slovak
Rep
ublic
Israe
lChil
e
Mexico
Russia
n Fed
eratio
n
2009 2000
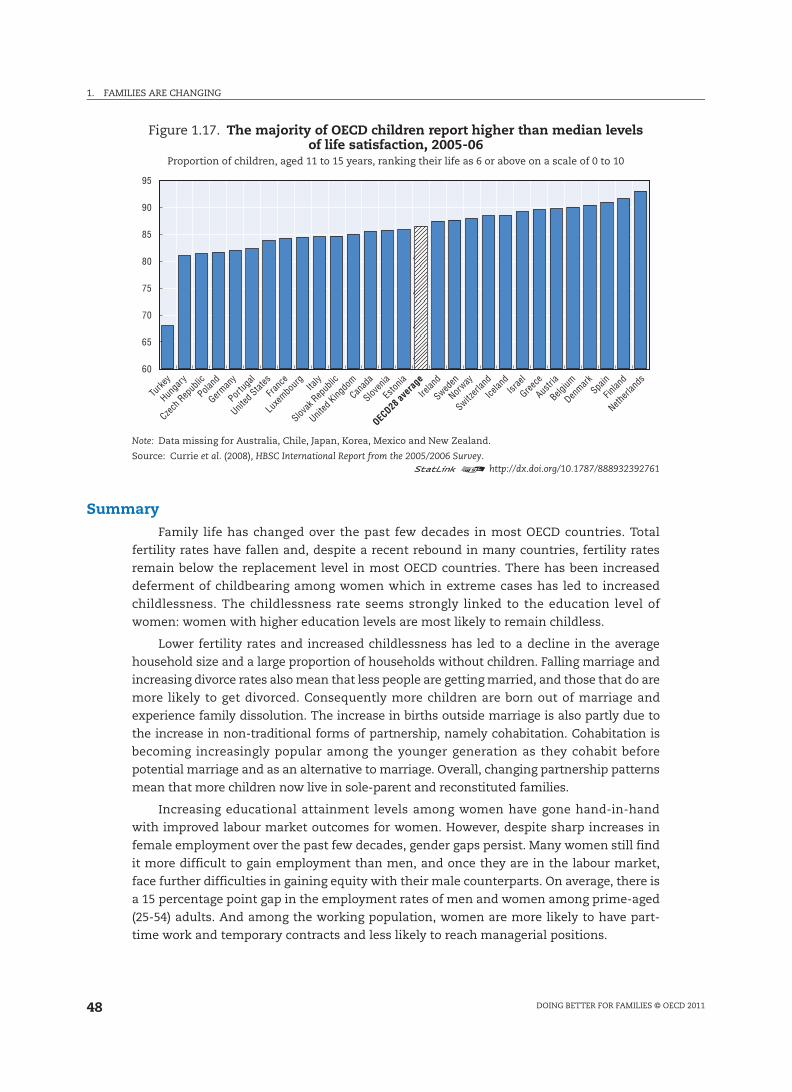
1. FAMILIES ARE CHANGING
DOING BETTER FOR FAMILIES © OECD 201148
SummaryFamily life has changed over the past few decades in most OECD countries. Total
fertility rates have fallen and, despite a recent rebound in many countries, fertility rates
remain below the replacement level in most OECD countries. There has been increased
deferment of childbearing among women which in extreme cases has led to increased
childlessness. The childlessness rate seems strongly linked to the education level of
women: women with higher education levels are most likely to remain childless.
Lower fertility rates and increased childlessness has led to a decline in the average
household size and a large proportion of households without children. Falling marriage and
increasing divorce rates also mean that less people are getting married, and those that do are
more likely to get divorced. Consequently more children are born out of marriage and
experience family dissolution. The increase in births outside marriage is also partly due to
the increase in non-traditional forms of partnership, namely cohabitation. Cohabitation is
becoming increasingly popular among the younger generation as they cohabit before
potential marriage and as an alternative to marriage. Overall, changing partnership patterns
mean that more children now live in sole-parent and reconstituted families.
Increasing educational attainment levels among women have gone hand-in-hand
with improved labour market outcomes for women. However, despite sharp increases in
female employment over the past few decades, gender gaps persist. Many women still find
it more difficult to gain employment than men, and once they are in the labour market,
face further difficulties in gaining equity with their male counterparts. On average, there is
a 15 percentage point gap in the employment rates of men and women among prime-aged
(25-54) adults. And among the working population, women are more likely to have part-
time work and temporary contracts and less likely to reach managerial positions.
Figure 1.17. The majority of OECD children report higher than median levelsof life satisfaction, 2005-06
Proportion of children, aged 11 to 15 years, ranking their life as 6 or above on a scale of 0 to 10
Note: Data missing for Australia, Chile, Japan, Korea, Mexico and New Zealand.
Source: Currie et al. (2008), HBSC International Report from the 2005/2006 Survey.1 2 http://dx.doi.org/10.1787/888932392761
95
90
85
80
75
70
65
60
Turke
y
Hunga
ry
German
y
Por
tugal
Cze
ch R
epub
lic
Poland
Unit
ed Stat
es
Franc
e
Slovak
Rep
ublic
United
Kingdo
m
Luxe
mbourg Ita
ly
Canad
a
Sloven
ia
Eston
ia
Irelan
d
Sweden
OECD28
aver
age
Norway
Switzerl
and
Icelan
dIsr
ael
Belgium
Denmark
Greece
Austri
a
Finlan
d
Netherl
ands
Spain
1. FAMILIES ARE CHANGING
DOING BETTER FOR FAMILIES © OECD 2011 49
Over a generation of children, indicators of three important dimensions of child well-
being have evolved in different directions. Average incomes have risen, but at the same time
child poverty rates have also increased as households without children have made more
financial gains than households with children. More youngsters are now in employment or
education than before. Health outcomes for children show evidence of improvement, decline
and stability/stagnation in equal measures. Thus, whilst improvements are being made in
some areas, it is clear that more could be done to improve child well-being.
Notes
1. In this chapter, the statistical data for Israel are supplied by and under the responsibility of therelevant Israeli authorities. The use of such data by the OECD is without prejudice to the status ofthe Golan Heights, East Jerusalem and Israeli settlements in the West Bank under the terms ofinternational law.
2. Families have changed more than available data can show, as certain features of family life werenot widespread enough to be reflected in data systems until recently. For example, statistics onnon-marital forms of partnerships, such as cohabitation, which are now being developed in manycountries, were simply not available in the 1980s. The development of formal childcare systemsstarted in the 1960s in Nordic countries, and comparable data for other OECD countries are onlyavailable from the mid-1990s onwards. Similarly, data on women in employment by the age oftheir youngest child are still not available for some OECD countries. In the absence of historicalinformation, some indicators presented in this chapter are based on cross-national comparisonsfor a recent year only.
3. The fertility “replacement level” is defined as the cohort fertility rate of 2.1 children per woman,which would ensure the replacement of the previous generation, and therefore populationstability, assuming no net migration and no change in mortality rates.
4. OECD (2009a) included three other dimensions: risk behaviours, quality of school life and housingand environment. These three dimensions have not been included here as indicators of the first twodimensions have recently been reviewed for changes over time and by gender (OECD, 2009d, 2009e),and housing and environment data are not available in long-term trends for sufficient countries.
References
Adema, W., P. Fron and M. Ladaique (2011), “The Real Cost of Welfare States and the Crisis”, OECDSocial, Employment and Migration Working Paper, OECD Publishing, Paris, forthcoming.
Black, S., P. Devereux and K. Salvanes (2007), “From the Cradle to the Labor Market? The Effect of BirthWeight on Adult Outcomes”, Quarterly Journal of Economics, MIT Press, Vol. 122, No. 1, pp. 409-439.
CASEN (2010), “The National Socio-economic Characterization Survey (CASEN) for Chile 2003and 2006”, www.mideplan.cl/casen/en/index.htmlMay 2010.
Chapple, S. (2009), “Child Well-being and Sole-parent Family Structure in the OECD: An Analysis”,OECD Social, Employment and Migration Working Papers, No. 82, OECD Publishing, Paris, www.oecd.org/els/workingpapers.
Currie, C., S. Gabhainn, E. Godeau, C. Roberts, R. Smith, D. Currie, W. Picket, M. Richter, A. Morganand V. Bernakow (2008), Inequalities in Young People’s Health: HBSC International Report fromthe 2005/2006 Survey, WHO Regional Office for Europe, Copenhagen.
ENIGH (2010), “National Survey of Household Incomes and Expenditures (ENIGH) for Mexico 2006and 2008”, www.inegi.org.mx/inegi/default.aspx?s=est&c=10656, May.
EQLS (2010), “European Quality of Life Survey (EQLS) for Turkey in 2007” (provided by EUROFOUND onrequest), June 2010.
European Union (2010), Europe 2020: A European Strategy for Smart, Sustainable and Inclusive Growth,European Union, Brussels, ec.europa.eu/eu2020/pdf/115346.pdf.
Eurostat (2006), “Demographic Statistics: Fertility, Eurostat Metadata in SDDS Format”, epp.eurostat.ec.europa.eu/cache/ITY_SDDS/EN/demo_fer_sm1.htm.
Eurostat (2010), Eurostat New Cronos Database, ESDS International, University of Manchester, Manchester.
1. FAMILIES ARE CHANGING
DOING BETTER FOR FAMILIES © OECD 201150
EU-LFS (2010), “European Union Labour Force Survey (EU LFS) for 2007 and 2008”, http://epp.eurostat.ec.europa.eu/portal/page/portal/microdata/lfs, September 2010.
EU-SILC (2010), “The European Survey on Income and Living Conditions (EU SILC) for 2007 and 2008”,epp.eurostat.ec.europa.eu/portal/page/portal/microdata/eu_silc, September 2010.
Förster, M. and M. Mira d’Ercole (2005), “Income Distribution and Poverty in OECD Countries in theSecond Half of the 1990s”, OECD Social, Employment and Migration Working Papers, No. 22, OECDPublishing, Paris.
HILDA (2010), “The Household Income and Living Dynamics (HILDA) for Australia 2007 and 2008”, June,www.melbourneinstitute.com/hilda.
Iacovou, M. and A. Skew (2010), “Household Structure in the EU”, ISER Working Paper, No. 2010-10,Institute of Social and Economic Research, Colchester.
KLIPS (2010), “Korean Labour and Income Panel Study (KLIPS) for Korea 2006 and 2007”, May,www.kli.re.kr/klips/en/about/introduce.
Miranda, V. (2011), “Cooking, Cleaning and Volunteering? Unpaid Work around the World”, OECD Social,Employment and Migration Working Papers, No. 116, OECD Publishing, Paris.
OECD (1999), OECD Historical Statistics 1960-1997, OECD Publishing, Paris.
OECD (2000), Knowledge and Skills for Life: First Results from PISA 2000, OECD Publishing, Paris.
OECD (2003), Learning for Tomorrow’s World: First Results from PISA 2003, OECD Publishing, Paris.
OECD (2007a), Facing the Future: Korea’s Family, Pension and Health Policy Challenges, OECD Publishing, Paris.
OECD (2007b), Babies and Bosses: Reconciling Work and Family Life: A Synthesis of Findings for OECD countries,OECD Publishing, Paris, www.oecd.org/els/social/family.
OECD (2009a), Doing Better for Children, OECD Publishing, Paris, www.oecd.org/els/social/childwellbeing.
OECD (2009b), OECD Factbook 2009: Economic, Environmental and Social Statistics, OECD Publishing, Paris.
OECD (2009c), Society at a Glance, 2009, OECD Publishing, Paris, www.oecd.org/els/social/indicators/SAG.
OECD (2009d), Health at a Glance, 2009, OECD Publishing, Paris, www.oecd.org/health/healthataglance.
OECD (2010a), OECD Family Database, OECD Publishing, Paris, http://www.oecd.org/els/social/family/database.
OECD (2010b), OECD Employment Outlook 2010, OECD Publishing, Paris, www.oecd.org/els/employment/outlook.
OECD (2010c), Going for Growth, OECD Publishing, Paris, www.oecd.org/economics/goingforgrowth.
OECD (2010d), Families 2030, OECD Publishing, Paris, www.oecd.org/futures.
OECD (2010e), Income Distribution Questionnaires, Data downloaded from OECD.stat, OECD Publishing,Paris.
OECD (2010f), OECD Social Expenditure Database, OECD Publishing, Paris, www.oecd.org/els/social/expenditure.
OECD (2010g), OECD Employment Database, OECD Publishing, Paris, www.oecd.org/employment/database.
OECD (2010h), PISA 2009 Assessment Framework – Key Competencies in Reading, Mathematics and Science,OECD Publishing, Paris.
OECD (2010i), Education at a Glance 2009, OECD Publishing, Paris, www.oecd.org/edu/eag2009.
OECD (2011a), Labour Market and Social Policy Reviews: the Russian Federation, OECD Publishing, Paris,forthcoming.
OECD (2011b), Pensions at a Glance 2011: Retirement-Income Systems in OECD and G20 countries, OECDPublishing, Paris.
PSID (2010), “Panel Study on Income Dynamics (PSID) for the United States 2004 and 2006”, June,psidonline.isr.umich.edu.
SHP (2010), “Swiss Household Panel (SHP) for Switzerland 2007”, June, www.swisspanel.ch/?lang=en.
SHS (2010), “Survey of Household Spending (SHS) for Canada 2004 and 2005”, June, www.statcan.gc.ca.
SLID (2010), “Survey of Labour and Income Dynamics (SLID) for Canada 2004 and 2005”, June,www.statcan.gc.ca.
United Nations (1989/1990), United Nations Convention on the Rights of the Child, www.unhcrc.ch.
Whiteford, P. and W. Adema (2007), “What Works Best in Reducing Child Poverty: A Benefit or WorkStrategy?”, OECD Social, Employment and Migration Working Papers, No. 51, OECD Publishing, Paris.
1. FAMILIES ARE CHANGING
DOING BETTER FOR FAMILIES © OECD 2011 51
ANNEX 1.A1
Background Information to Chapter 1
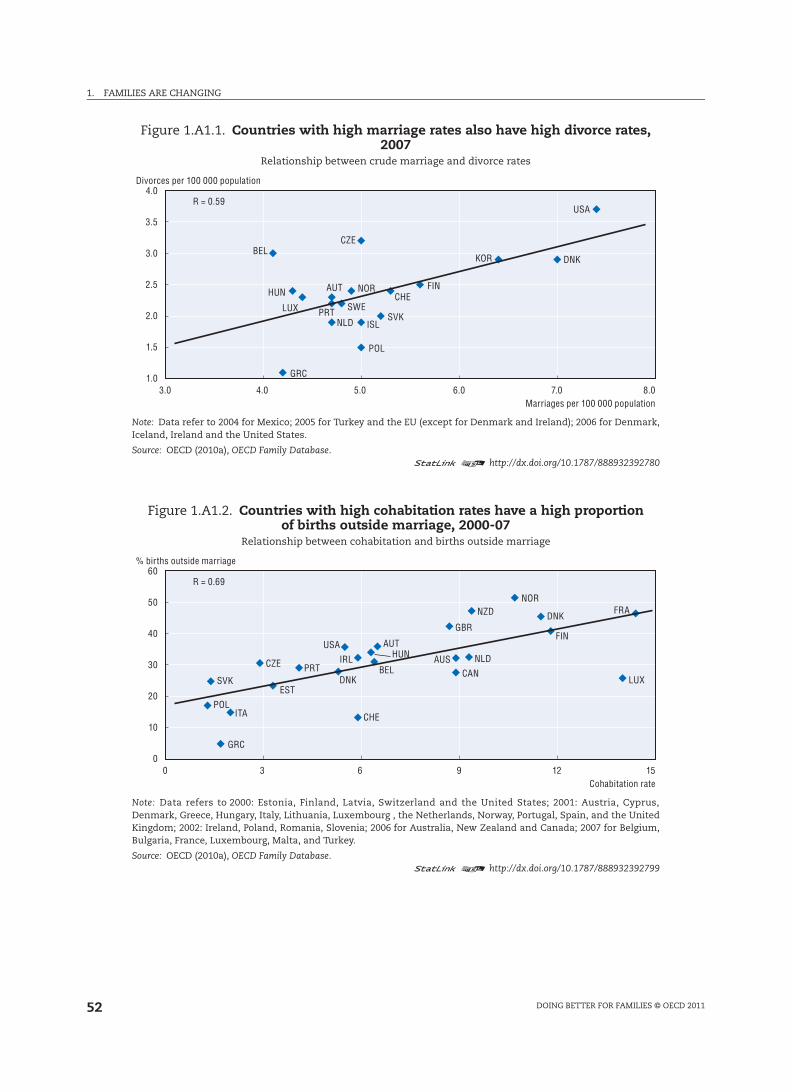
1. FAMILIES ARE CHANGING
DOING BETTER FOR FAMILIES © OECD 201152
Figure 1.A1.1. Countries with high marriage rates also have high divorce rates, 2007
Relationship between crude marriage and divorce rates
Note: Data refer to 2004 for Mexico; 2005 for Turkey and the EU (except for Denmark and Ireland); 2006 for Denmark,Iceland, Ireland and the United States.
Source: OECD (2010a), OECD Family Database.1 2 http://dx.doi.org/10.1787/888932392780
Figure 1.A1.2. Countries with high cohabitation rates have a high proportionof births outside marriage, 2000-07
Relationship between cohabitation and births outside marriage
Note: Data refers to 2000: Estonia, Finland, Latvia, Switzerland and the United States; 2001: Austria, Cyprus,Denmark, Greece, Hungary, Italy, Lithuania, Luxembourg , the Netherlands, Norway, Portugal, Spain, and the UnitedKingdom; 2002: Ireland, Poland, Romania, Slovenia; 2006 for Australia, New Zealand and Canada; 2007 for Belgium,Bulgaria, France, Luxembourg, Malta, and Turkey.
Source: OECD (2010a), OECD Family Database.1 2 http://dx.doi.org/10.1787/888932392799
4.0
3.5
3.0
2.5
2.0
1.5
1.03.0 4.0 5.0 6.0 7.0 8.0
R = 0.59
BEL
GRC
HUN
LUX
AUT
NLDPRT
NOR
CZE
ISL
POL
SVK
CHESWE
FIN
KOR DNK
USA
Marriages per 100 000 population
Divorces per 100 000 population
60
50
40
30
20
10
00 3 6 9 12 15
R = 0.69
EST
GRC
HUN
LUX
AUT
NLD
NZD
PRT
ITA
NOR
CZE IRL
CHE
AUS
GBR
POL
CANSVK
BEL
FIN
FRADNK
DNK
USA
Cohabitation rate
% births outside marriage
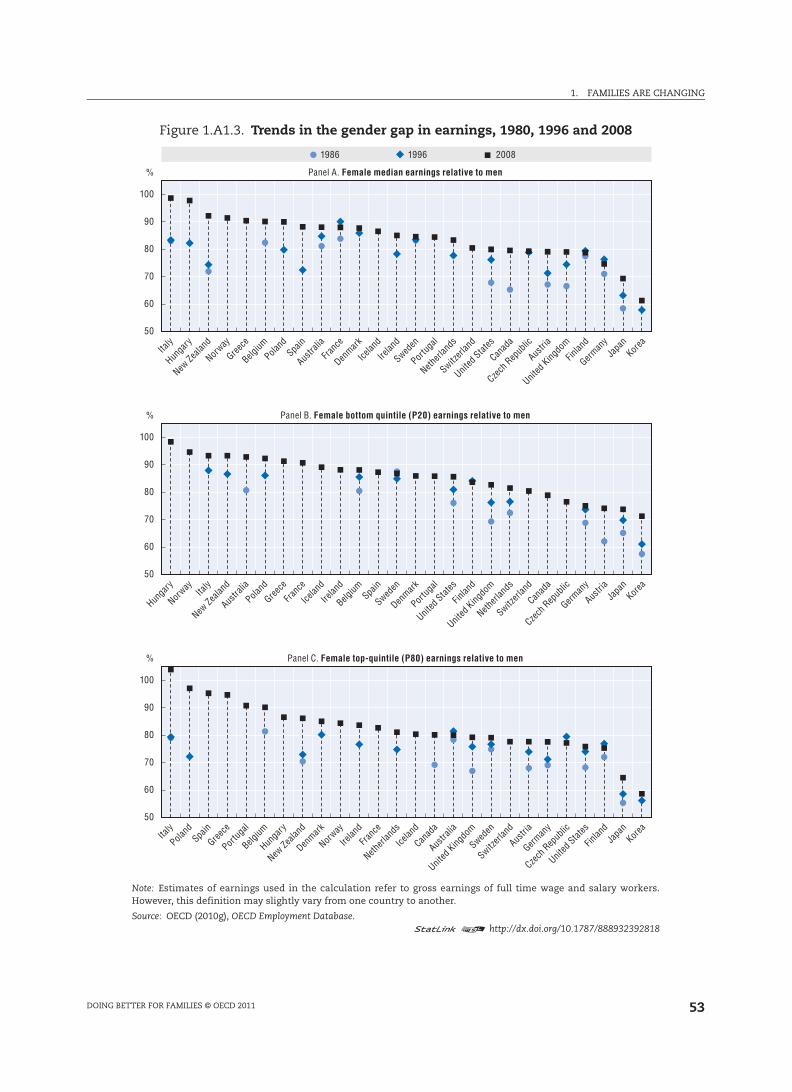
1. FAMILIES ARE CHANGING
DOING BETTER FOR FAMILIES © OECD 2011 53
Figure 1.A1.3. Trends in the gender gap in earnings, 1980, 1996 and 2008
Note: Estimates of earnings used in the calculation refer to gross earnings of full time wage and salary workers.However, this definition may slightly vary from one country to another.
Source: OECD (2010g), OECD Employment Database.1 2 http://dx.doi.org/10.1787/888932392818
100
90
80
70
60
50
%
100
90
80
70
60
50
%
100
90
80
70
60
50
%
Italy
Hun
gary
New
Zeala
nd
Nor
way
Gree
ce
Belg
ium
Pola
nd
Spa
in
Aus
tralia
Fran
ce
Den
mark
Icela
nd
Irela
nd
Swed
en
Portug
al
Neth
erlan
ds
Switz
erlan
d
Unit
ed Stat
es
Can
ada
Cze
ch R
epub
lic
Aus
tria
Unit
ed King
dom
Finl
and
Germ
any
Japa
n
Kor
ea
Panel A. Female median earnings relative to men
Hun
gary
Nor
way It
aly
New
Zeala
nd
Aus
tralia
Poland
Gree
ce
Fran
ce
Icela
nd
Irela
nd
Belg
ium S
pain
Swed
en
Den
mark
Por
tugal
Unit
ed Stat
es
Finl
and
Unit
ed King
dom
Neth
erlan
ds
Switz
erlan
d
Can
ada
Cze
ch R
epub
lic
Germ
any
Aus
tria
Japa
n
Kor
ea
Panel B. Female bottom quintile (P20) earnings relative to men
Italy
Pola
nd
Spa
in
Gree
ce
Por
tugal
Belg
ium
Hun
gary
New
Zeala
nd
Den
mark
Nor
way
Irela
nd
Fran
ce
Neth
erlan
ds
Icela
nd
Can
ada
Aus
tralia
Unit
ed King
dom
Swed
en
Switz
erlan
d
Aus
tria
Germ
any
Cze
ch R
epub
lic
Unit
ed Stat
es
Finl
and
Japa
n
Kor
ea
Panel C. Female top-quintile (P80) earnings relative to men
200819961986


![Economics] - OECD - A New Economy, The Changing Role of Innovation and Information Technology in Growth](https://static.fdocuments.net/doc/165x107/577d2fb41a28ab4e1eb26c12/economics-oecd-a-new-economy-the-changing-role-of-innovation-and-information.jpg)


