Fair Trade USA 2011 Almanac
61
2011 Almanac
-
Upload
comercio-justo-chile -
Category
Documents
-
view
214 -
download
0
description
Fair Trade USA (FTUSA) published its annual guide to statistics for the 2011 U.S. market of Fair Trade Certified (FTC) products. Since FTC was the recognition system for about 90% of all Fair Trade goods sold in the U.S. in 2011, its statistics tell important parts of the larger Fair Trade story.
Transcript of Fair Trade USA 2011 Almanac

2011 Almanac

Fair Trade USA 2011 Almanac2
Introduction & Highlights ......................................................................................................................................................................5
Producers
Producers: Total Number of Fair Trade Certified Producer Organizations by Product, 2011 ................................................................8
Producers: Total Number of Fair Trade Certified Producer Organizations by Country, 2011 ................................................................9
Producers: Co-op Link Highlight, 2011 ................................................................................................................................................ 10
ALL ProducTs
All Products: Premium Payments to Producer Organizations by Product, 1998–2011 ........................................................................ 14
All Products: Imports of Fair Trade Certified Products into the United States, 1998–2011 .................................................................... 15
coFFee
Coffee: Fair Trade Certified Producers that Export Green Coffee into the United States and World Market, 2011 .............................. 18
Coffee: Premium Payments Generated by Fair Trade Certified Coffee Imports, 1998–2011 ............................................................... 19
Coffee: Fair Trade Premium Payments to Producer Organizations, 1998–2011 .................................................................................. 20
Coffee: Imports of Fair Trade Certified Coffee into the United States, 1998–2011 ................................................................................ 21
Table of Contents

Fair Trade USA 2011 Almanac 3
Coffee: Imports of Fair Trade Certified Coffee into the United States, Organic versus Conventional, 1998–2011 ............................... 22
Coffee: Imports of Fair Trade Certified Coffee into the United States by Country of Origin, 2007–2011 .............................................. 23
Coffee: Percent of Fair Trade Certified Coffee Imported into the United States by Country of Origin, 2011 ....................................... 24
Coffee: Top Five Origins of Fair Trade Certified Coffee in the United States, 2011 .............................................................................. 25
TeA
Tea: Premium Payments to Fair Trade Certified Tea Producer Organizations, 2001–2011 ................................................................. 28
Tea: Imports of Fair Trade Certified Tea into the United States, 2001–2011 ......................................................................................... 29
Tea: Imports of Fair Trade Certified Tea into the United States by Country of Origin, 2007–2011 ...................................................... 30
Tea: Percent of Fair Trade Certified Tea Imported into the United States by Country of Origin, 2011 ................................................ 31
cocoA
Cocoa: Premium Payments Generated by Fair Trade Certified Cocoa in the United States, 2002–2011 .......................................... 34
Cocoa: Percent of Premium Payments to Fair Trade Certified Cocoa Producer Organizations by Country of Origin, 2011 .............. 35
Cocoa: Imports of Fair Trade Certified Cocoa into the United States, 2002–2011 .............................................................................. 36
Produce
Produce: Origins and Producer Organizations by Produce Type, 2011 .............................................................................................. 40
Produce: Premium Payments to Fair Trade Certified Produce Producer Organizations by Country of Origin, 2011 .......................... 41
Produce: Imports of Fair Trade Certified Produce into the United States by Produce Type, 2004–2011 ............................................. 42
Produce: Imports of Fair Trade Certified Produce into the United States by Produce Type, 2011 ....................................................... 43
sugAr
Sugar: Volumes and Premium Payments for Fair Trade Certified Sugar by Origin, 2005–2011 ......................................................... 46
Sugar: Imports of Fair Trade Certified Sugar into the United States by Country of Origin, 2007–2011 ............................................... 47
Sugar: Imports of Fair Trade Certified Sugar into the United States, 2005–2011 ................................................................................. 48
oTHer ProducTs
Grains: Imports of Fair Trade Certified Grains into the United States, 2005–2011 ............................................................................... 52
Grains: Imports of Fair Trade Certified Rice and Quinoa into the United States, 2005–2011 .............................................................. 53
Vanilla, Herbs & Spices: Imports of Fair Trade Certified Vanilla, Herbs and Spices into the United States, 2006–2011 ...................... 54
Vanilla, Herbs & Spices: Percent of Fair Trade Certified Herbs and Spices Imported into the United States, 2011 .............................. 55
Flowers: Imports of Fair Trade Certified Flowers into the United States, 2007–2011 ............................................................................ 56
Flowers: Imports of Fair Trade Certified Flowers into the United States by Country of Origin, 2007–2011 .......................................... 57
Wine: Imports of Fair Trade Certified Wine into the United States, 2008–2011 ................................................................................... 58
Honey: Imports of Fair Trade Certified Honey into the United States, 2008–2011 ............................................................................... 58
Nuts & Oilseeds: Imports of Fair Trade Certified Nuts and Oilseeds into the United States, 2009–2011 .............................................. 59
Sports Balls: Imports of Fair Trade Certified Sports Balls into the United States, 2009–2011 ................................................................ 60
Apparel & Linens: Imports of Fair Trade Certified Garments into the United States, 2010–2011 ......................................................... 61

Fair Trade USA 2011 Almanac 5
Every Purchase Matters
Fair Trade certification helps industry partners and consum-ers make every purchase matter, contributing to the long-term sustainability of farming communities around the world. In just 13 years, Fair Trade USA has established the Fair Trade Certified™ label as the leading mark of sustainability. Today, it assures consumers that the quality products they buy are improving lives and protecting the environment.
To further that trust and provide greater transparency, Fair Trade USA’s Certification department annually compiles and audits figures reported by its industry partners. As the leading third-party certifier of Fair Trade products, this report serves as a key indicator for the health and growth of Fair Trade in the united states. At the same time, we celebrate the many approaches within the Fair Trade movement and recognize other organizations who are participating in Fair Trade even though we cannot measure nor report their results.
Quality Products
In 2011, Fair Trade USA and its industry partners once again drove record imports to satisfy the continued growth in con-sumer demand for the more than 11,000 Fair Trade Certified products now available in virtually every major supermarket in America as well as thousands of restaurants, cafeterias and cafés.
Fair Trade USA certified a record 138 million pounds of Fair Trade Coffee, 52 percent of which was also certified organic. In total, coffee imports were up over 30% versus 2010. Addition-ally, the majority of food categories showed impressive growth in 2011, including: Cocoa (156%), Tea (21%), and Sugar (31%). After a steady 2% growth in 2010 over 2009, imports of Fair Trade Certified produce grew 40% in 2011.
Improving Lives
Fair Trade USA is proud to announce that this growth in vol-ume led to record community development premiums earned by farmers. For the first time ever, annual community develop-ment premiums topped the $20 million mark; at $22 million they were up over 50% versus 2010. Since 1998, Fair Trade USA and its partners have enabled Fair Trade farmers to earn more than $77 million in community development premiums, which have been used for community-elected development projects, covering areas like education, healthcare, environment, busi-ness management, quality improvement and productivity.
In addition to what farmers earned in both sales and commu-nity-development premiums, since 2006 Fair Trade USA and its partners have invested over $7.4 million in programs to strengthen small-scale farming communities in projects span-ning sugar, cocoa, produce, tea and coffee. Building on this deep history of development work, in 2011 Fair Trade USA took a new approach, called Co-op Link. Fair Trade USA surveyed farmers to better understand their most pressing needs, and in 2011 alone, raised $2 million for producer programs, and then worked with NGO’s and local service providers to execute these programs. In addition, we helped facilitate $3 million in affordable trade finance loans to cooperatives.
Protecting the Environment
Protecting the environment is good for both people and the planet. Therefore, strict environmental criteria are core to Fair Trade’s standards, including the elimination of harmful agro-chemicals and genetically-modified organisms, plus the development of environmental assessment plans to protect fragile ecosystems. In addition, although organic certification is not required by Fair Trade, over half of all Fair Trade Certi-fied imports are also certified organic.
Fair Trade Can and Must do More
While the 2011 results are inspiring, the reality is that Fair Trade represents only a fraction of the products available to U.S. consumers. We are proud of what we have accomplished – farmers, responsible companies, NGOs and conscious con-sumers – all working together. Yet the need is much greater. According to the World Bank, more than 2 billion people live on less than two dollars a day. Today’s Fair Trade model reaches only a small percentage of them. Fair Trade can and must do more.
As always, Fair Trade USA thanks you for your support.
The Mission of Fair Trade USA
Fair Trade USA enables sustainable development and com-munity empowerment by cultivating a more equitable global trade model that benefits farmers, workers, consumers, industry and the earth. This mission is achieved by certifying and promoting Fair Trade products. To learn more, visit www.FairTradeUSA.org.
Introduction & Highlights


Fair Trade USA 2011 Almanac 7
Producers8 Total Number of Fair Trade Certified Producer
Organizations by Product, 2011
9 Total Number of Fair Trade Certified Producer Organizations by Country, 2011
10 Co-op Link Highlight

Fair Trade USA 2011 Almanac8
Producers: Total Number of Fair Trade Certified Producer Organizations by ProductThere are 365 producer organizations that grow and sell Fair Trade Certified coffee globally, representing the largest product category with nearly one-third of all Fair Trade organizations. Produce (or Fresh Fruits and Vegetables products, including Bananas), Cocoa and Tea organizations follow suit with 192, 96 and 89 producer organizations, respectively.
Total Number of Fair Trade Certified Producer Organizations by Product, 2011
Producers that produce more than one product are included in each product category. Source: Fair Trade USA and FLO-CERT
Latin America
Asia
Afria
0
50
100
150
200
250
300
350
400
GoldSportsballsBeans & Grains
HoneyCottonWineFlowers & Plants
Vanilla, Herbs &
Spices
SugarDried Fruit &
Fruit Juices
Nuts &Oilseeds
TeaCocoaProduceCoffee
Fair Trade USA 2011 Almanac 9
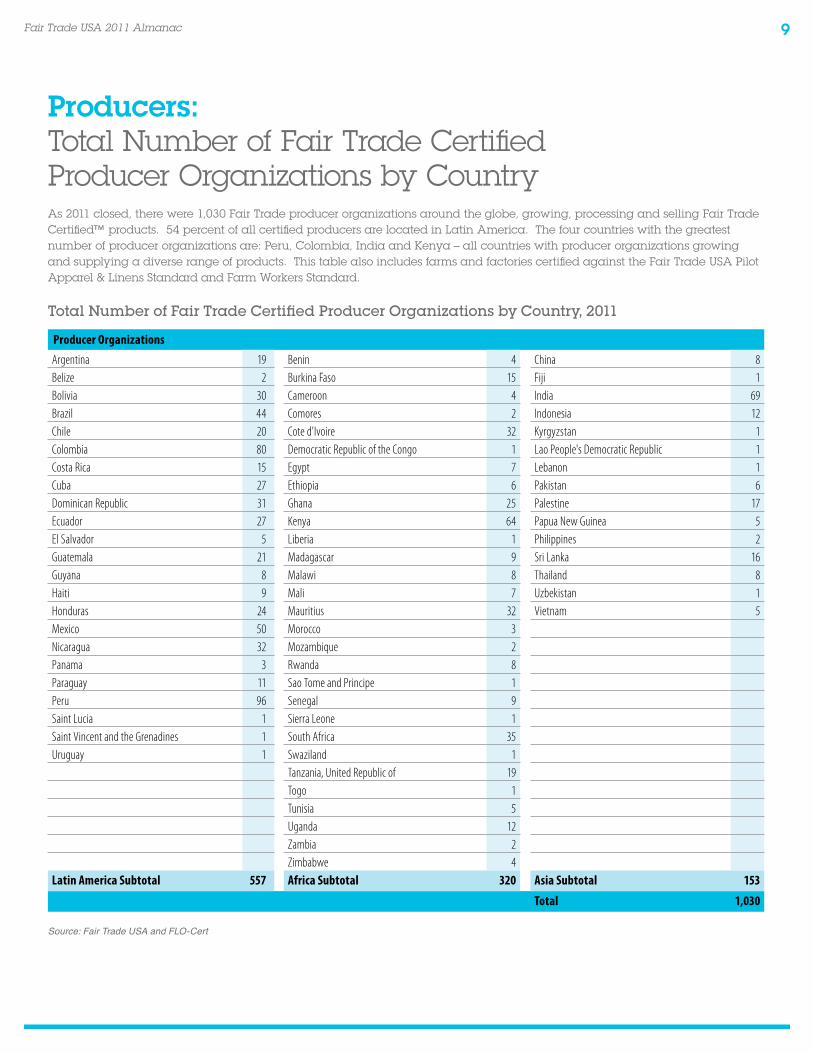
Producers:Total Number of Fair Trade Certified Producer Organizations by CountryAs 2011 closed, there were 1,030 Fair Trade producer organizations around the globe, growing, processing and selling Fair Trade Certified™ products. 54 percent of all certified producers are located in Latin America. The four countries with the greatest number of producer organizations are: Peru, Colombia, India and Kenya – all countries with producer organizations growing and supplying a diverse range of products. This table also includes farms and factories certified against the Fair Trade USA Pilot Apparel & Linens Standard and Farm Workers Standard.
Total Number of Fair Trade Certified Producer Organizations by Country, 2011
Producer OrganizationsArgentina 19 Benin 4 China 8Belize 2 Burkina Faso 15 Fiji 1Bolivia 30 Cameroon 4 India 69Brazil 44 Comores 2 Indonesia 12Chile 20 Cote d'Ivoire 32 Kyrgyzstan 1Colombia 80 Democratic Republic of the Congo 1 Lao People's Democratic Republic 1Costa Rica 15 Egypt 7 Lebanon 1Cuba 27 Ethiopia 6 Pakistan 6Dominican Republic 31 Ghana 25 Palestine 17Ecuador 27 Kenya 64 Papua New Guinea 5El Salvador 5 Liberia 1 Philippines 2Guatemala 21 Madagascar 9 Sri Lanka 16Guyana 8 Malawi 8 Thailand 8Haiti 9 Mali 7 Uzbekistan 1Honduras 24 Mauritius 32 Vietnam 5Mexico 50 Morocco 3Nicaragua 32 Mozambique 2Panama 3 Rwanda 8Paraguay 11 Sao Tome and Principe 1Peru 96 Senegal 9Saint Lucia 1 Sierra Leone 1Saint Vincent and the Grenadines 1 South Africa 35Uruguay 1 Swaziland 1
Tanzania, United Republic of 19Togo 1Tunisia 5Uganda 12Zambia 2Zimbabwe 4
Latin America Subtotal 557 Africa Subtotal 320 Asia Subtotal 153
Total 1,030
Source: Fair Trade USA and FLO-Cert

Fair Trade USA 2011 Almanac10
Producers:Co-op Link Highlight
Fair Trade USA seeks to alleviate poverty in farming communities in ways that are economically, socially and environmentally sustainable. We achieve this by empowering farmers and workers around the world with the business training and capital investment necessary to grow high-quality products that can compete in global markets.
Maximizing ImpactFair Trade USA seeks to alleviate poverty in farming communities in ways that are economically, socially and environmentally sustainable. We achieve this by empowering farmers and workers around the world with the business training and capital investment necessary to grow high-quality products that can compete in global markets
Community development plays a critical role in Fair Trade USA’s efforts to maximize the benefits of Fair Trade for producers, helping to build sustainable futures for farming com-munities around the world. Since 2006, Fair Trade USA has directly invested over $7.4 million, along with millions of dollars in additional funds from industry partners, individuals and NGOs into product quality, market access, business capacity, and biodiversity initiatives in Africa, Asia and Latin America.
Building on the success of these programs and from feedback from partners and producers, Fair Trade USA is evolving its approach to development by creating innovative new partnerships with global financial institutions, industry partners, NGOs, leading social entrepreneurs and in-country service providers. This reinvigorated effort is called ‘Co-op Link’ to recognize the unique role Fair Trade USA can play in linking organizations from all areas of the supply chain to maximize impact for producers and strengthen farming communities.
co-op Link focuses on:
• Increasingmarketopportunity
• Improvingaccesstocapital
• Expandedrangeoftraining
• Quality&productivityimprovementinitiatives

Fair Trade USA 2011 Almanac 11
Through Co-op Link, Fair Trade USA is already working with producers and global banking organizations to increase the amount of working capital available to cooperatives, having raised $5 million in 2011 alone. Highlights from Fair Trade USA’s current Co-op Link project portfolio:
PROJECT PRODUCT REGION PARTNER/FUNDER $$$ OVERVIEW
Mexico Coffee and Honey Livelihoods Project
Honey, Coffee Chiapas, Mexico W. K. Kellogg Foundation/ Progreso
$357,000 Promotes economic security and sustainable livelihoods for coffee farmers and beekeepers from the Highlands of Chiapas through Fair Trade certification, quality improvement, capacity building, market access, and access to capital.
Sustainable Sourcing Partnership Project
Coffee Brazil Fair Trade USA, USAID, Green Mountain Coffee
$400,000 Farmer members of 19 Fair Trade Certified producer organizations receive in-depth training on best practices for sustainable coffee production, Brazilian environmental law and Fair Trade criteria. Support for implementaiton of organizational environmental plans and market linkage to increase higher-value sales to new sustainability and quality-oriented customers.
Gayo Fair Trade Coffee Success Initiative
Coffee Indonesia Rabobank Foundation/Progreso
$250,000 Eight Fair Trade Certified cooperatives participating in an intensive capacity building program focusing on financial management, increasing access to capital, quality and business acumen workshops with US business partners.
Price Risk Management Workshops
Coffee Colombia, Guatemala, Mexico, Brazil, Peru , EAFCA
World Bank/ Avina Foundation/Twin and CLAC
$100,000 Over 250 producer organizations receive training to manage risks, such as devaluation of currencies, minimizing exposure, managing differentials, and understanding macro and micro economic concepts that drive prices and costs.
Haiti Farmer Market Infrastructure Program
Mangoes Central and North Haiti
Ansara Family Fund/Perforce Foundation/Mouvman Moun Mango and Perrry Exports
$75,000 Fair Trade Certified mango cooperatives and farmer members receiving core trainings to comply with Fair Trade standards and access value added markets with a main component focusing on building relationships with retail chains.
Intercambio Peru Coffee Peru Green Mountain Coffee Roasters, Sustainable Harvest
$25,000 Innovative workshop with 150 attendees to build durable relationships, provide trainings, sign contracts, and engage all supply chain stakeholders.
Vendor Financial Man-agement Program
Coffee Kenya Grassroots Business Fund/Fair Trade Organization of Kenya
$40,000 Provided critical financial management training to Fair Trade Certified coopera-tives in preparation for loans to update processing facilities with ecologically friendly equipment.
Global Coffee Quality Research Initiative
Coffee Asia, Africa, Latin America
GCQRI/ Fair Trade USA and 27 other partners
Pending GCQRI will carry out short, medium and long-term projects relating to quality and productivity in the face of climate change in small coffee farming com-munities around the world.
Loan Origination Coffee Indonesia, Costa Rica, Nicaragua, Honduras, Mexico
Root Capital, responsAbil-ity, Rabobank Foundation, Microvest, Islamic Trade Finance Corporation Inter-American Develop-ment Bank - Opportuni-ties for the Majority, Fair Trade USA
Loan Amounts-Confidential
Connects financers and social lenders to producer groups seeking short-term post-harvest export capital and long-term investment capital for infrastructure improvements, such as coffee replanting, etc.
Fair Trade Organic Tea Project
Tea Indonesia PT. SHGW Bio Tea Indonesia/ SHGW Foun-dation (SHGW -Stichting Het Groene Woud)
$180,000 250 households of tea farmers in the Kota and Solok Districts in Western Sumatra receive technical assistance related to Fair Trade and organic certifica-tions, support in developing direct market linkage and strengthening supply chains through production.
Café Femenino- Rwanda
Coffee Rwanda OPTCO/Café Femenino N/A Supports Hinga Kawa women’s association to become the first ever women’s only coffee to be sold under the Café Femenino banner in the US.
Fair Trade Conventional Sugar Recruitment and Certification Project
Sugar Mexico Viva Trust $25,000 Supports small farmers to build a strong organization, pursue Fair Trade certification, and link them to market opportunities for conventional refined Fair Trade Certified sugar in the US market.
Strengthening Organic Sugar Cooperatives
Sugar Paraguay Viva Trust $25,000 Project to assist in improvements in organic production methods of small scale cane growers that are members of the cooperatives, to improve productivity and therefore farmer income, over time.


Fair Trade USA 2011 Almanac 13
ALL ProducTs14 Premium Payments to Producer Organizations
by Product, 1998–2011
15 Imports of Fair Trade Certified Products into the United States, 1998–2011

Fair Trade USA 2011 Almanac14
All Products:Premium Payments to Producer Organizations by ProductThe Fair Trade standards require that cooperative members or workers collectively decide how to invest premium money earned. In 2011, Fair Trade USA’s business partners enabled producer organizations to invest close to $22 million in community develop-ment projects. Communities are able to improve their lives through projects in areas such as education (building of schools, access to scholarships), healthcare (building clinics, providing access to medical exams), and clean drinking water. Communi-ties also use these funds on projects which strengthen the environment, improve the quality of their products, and let them invest back in their businesses. Coffee accounted for close to $17 million in premiums in 2011, a $6.4 million growth compared to 2010. Cocoa also increased significantly in 2011, with premiums tripling from 2010 to over $1 million.
Premium Payments to Producer Organizations by Product, 1998–2011
Year Coffee Tea Cocoa Produce1 Sugar Grains2 Vanilla, Herbs & Spices3
Flowers Wine Honey Nuts & Oilseeds4
Apprarel & Linens5
Total
1998 $3,803 $3,803
1999 $102,612 $102,612
2000 $212,477 $212,477
2001 $333,465 $10,757 $344,222
2002 $487,379 $30,415 $956 $518,750
2003 $961,951 $43,792 $12,171 $1,017,914
2004 $1,648,720 $62,346 $38,291 $312,156 $2,061,513
2005 $2,229,266 $177,407 $130,233 $312,442 $8,383 $781 $2,858,513
2006 $3,238,722 $244,800 $199,164 $171,956 $124,704 $5,851 $52,760 $4,037,956
2007 $4,941,530 $428,435 $132,748 $244,234 $289,683 $6,449 $39,998 $8,125 $6,091,203
2008 $8,777,297 $473,954 $261,752 $637,610 $303,891 $5,085 $11,819 $302,835 $34,128 $18,125 $10,826,497
2009 $10,837,304 $454,534 $178,871 $1,268,332 $392,763 $29,445 $40,941 $295,352 $202,789 $17,055 $16,961 $13,734,349
2010 $10,525,148 $542,821 $298,875 $1,271,414 $640,041 $51,022 $126,750 $317,698 $68,586 $62,537 $10,616 $3,731 $13,919,239
2011 $16,957,504 $657,944 $1,012,760 $1,786,353 $821,930 $37,805 $107,990 $391,147 $40,154 $30,264 $6,132 $11,586 $21,861,570
Total $61,257,177 $3,127,205 $2,265,822 $6,004,498 $2,581,396 $136,439 $380,258 $1,315,157 $345,657 $127,981 $33,709 $15,318 $77,590,617
1 Premium payments for produce 2004-2005 represent the premiums paid on bananas only. 22005-2008grainsfiguresrepresentriceonly.2009-2011figuresincludericeandquinoa.32006-2008vanilla/spicesfiguresrepresentvanillaonly.2009-2011figuresincludevanillaandotherherbs&spices. 4 2009-2011nuts&oilseedsfiguresincludesheabutter,brazilnuts,oliveoilandolives.5 TotalpremiumpaymentforApparel&Linensincludespremiumspaidtofactoriesandcottonproducers.Source: Fair Trade USA

Fair Trade USA 2011 Almanac 15
All Products:Imports of Fair Trade Certified Products into the United States2011 marks a period of significant growth for Fair Trade Certified products imported into the U.S. market. Eight of eleven product categories displayed growth, with six categories growing by over 20 percent. The standout categories were Coffee, Tea, Cocoa, Sugar, Produce, and Apparel & Linens. Herbs & Spices and Flowers demonstrated some growth as well. Coffee, Fair Trade’s flagship product, experienced a 32 percent increase of 33 million pounds imported, totaling 138 million pounds imported in 2011. Cocoa nearly tripled in 2011 to 11.2 million pounds imported compared to 2010.
Imports of Fair Trade Certified Products into the United States, 1998–2011
Year1 Coffee Tea Cocoa3 Produce4 Sugar Grains5 Vanilla, Herbs & Spices6
Flowers7 Wine8 Honey Apparel & Linens9
1998 76,059
1999 2,052,242
2000 4,249,534
2001 6,669,308 65,261
2002 9,747,571 86,706 14,050
2003 19,239,017 95,669 178,888
2004 32,974,400 180,310 727,576 8,814,171
2005 44,585,323 517,500 1,036,696 7,384,202 271,680 73,824
2006 64,774,431 629,985 1,814,391 6,176,907 3,581,563 390,848 197,145
2007 66,339,389 1,134,993 1,951,400 8,030,482 8,657,427 436,456 149,460 650,832
2008 87,772,966 1,372,261 3,847,759 25,492,767 8,696,172 317,652 44,165 9,835,028 257,959 266,385
20092 108,373,041 1,372,157 2,629,411 50,272,722 11,307,547 1,275,805 149,344 9,539,859 1,450,717 250,662
2010 105,251,476 1,720,794 4,392,674 51,055,320 18,146,124 1,437,005 293,739 10,489,991 530,446 919,130 14,961
2011 138,569,409 2,081,874 11,255,319 71,515,439 23,755,215 1,067,679 298,671 10,510,006 300,637 333,600 54,023
Total 690,674,166 9,257,510 27,848,165 228,742,010 74,415,728 4,999,268 1,132,524 41,025,716 2,539,759 1,769,778 68,984
Growth 2009-10
32% 21% 156% 40% 31% -26% 2% 0% -43% -64% 261%
1Firstyeardataforeachproductcategorymaynotbetwelvemonths,dependingonlaunchdate.Seeproductsectionforfurtherdetails. 2 In2009,FairTradeUSAbegancertifyingsportsballs,oliveoil,olives,brazilnuts,andsheabutter.Seeproductsectionforadditionalvolumedetails.32004-2011figuresrepresentanestimateofthevolumeofcocoabeansnecessarytoproducetheFairTradecertifiedcocoathatwasimportedbyU.S.businesspartners.2002-2003volumesrepresentthetotalvolumesoffinishedcocoaproductsimported.
4 Varietyofproducecertified.Seeproductsectionforfurtherdetails.5 2005-2008grainsfiguresrepresentriceonly.2009-2011figuresincludericeandquinoa.62006-2008figuresrepresentvanillaonly.2009-2011figuresincludevanillaandotherherbs&spices.7Unitmeasureforflowersisstems. 8 Unit measure for wine is 750 mL bottles. It was previously reported in liters.9 Unit measure for apparel is number of garments.Source: Fair Trade USA


Fair Trade USA 2011 Almanac 17
coFFee18 Fair Trade Certified Producers that Export
Green Coffee into the United States and World Market, 2011
19 Premium Payments Generated by Fair Trade Certified Coffee Imports, 1998–2011
20 Fair Trade Premium Payments to Producer Organizations, 1998–2011
21 Imports of Fair Trade Certified Coffee into the United States, 1998–2011
22 Imports of Fair Trade Certified Coffee into the United States, Organic versus Conventional, 1998–2011
23 Imports of Fair Trade Certified Coffee into the United States by Country of Origin, 2007–2011
24 Percent of Fair Trade Certified Coffee Imported into the United States by Country of Origin, 2011
25 Top Five Origins of Fair Trade Certified Coffee in the United States, 2011

Fair Trade USA 2011 Almanac18
coffee: Fair Trade Certified Producers that Export Green Coffee into the United States and World Market Overall, the number of producer organizations from which Fair Trade USA’s importers sourced continued to remain relatively stable from 2010 to 2011. With an increase in certified imports last year, supply expanded primarily out of existing buyer-seller relationships.
When compared to the total certified producers by country, the U.S. market is sourcing from almost all Fair Trade producer organizations in countries like Costa Rica, Ethiopia and Indonesia. The newest member to the list of U.S. sourced producer organizations is the Democratic Republic of the Congo.
Fair Trade Certified Producers that Export Green Coffee into the United States and World Market, 2011
Producer Organizations U.S. 2008 U.S. 2009 U.S. 20101 U.S. 2011 World 2011Latin America
Bolivia 15 16 15 11 24Brazil 10 10 10 8 24Colombia 14 20 26 26 46Costa Rica 3 6 6 8 8Dominican Republic 1 1 1 1 2Ecuador 1 1 1 1 2El Salvador 3 3 1 1 4Guatemala 14 12 10 10 15Haiti 1 2 0 0 6Honduras 7 12 12 11 24Mexico 25 27 25 22 38Nicaragua 11 15 18 15 26Peru 31 35 46 43 67
Latin America Subtotal 136 160 171 157 286Africa
Congo, Democratic Republic of the 0 0 0 1 1Ethiopia 3 3 3 3 4Kenya 1 2 1 1 11Rwanda 3 3 4 3 6Tanzania, United Republic of 1 2 2 2 8Uganda 1 1 1 1 6Other Africa2 0 0 0 0 12
Africa Subtotal 9 11 11 11 48Asia
East Timor 1 1 1 0 0India 0 0 0 1 11Indonesia 4 7 9 9 12Laos 0 0 0 0 1Papua New Guinea 2 3 1 1 3Thailand 0 1 0 0 1Vietnam 0 0 0 0 3
Asia Subtotal 7 12 11 11 31TOTALS 152 183 193 179 365
1The2010totalsforProducerOrganizationswereadjustedtoaccountforfindingsduringaudit.2OtherAfricaincludestheCameroon,Coted’IvoireandMalawi.TheU.S.markethasnotsourcedFairTradeCertifiedcoffeefromthesecountries.Source: Fair Trade USA and FLO-CERT

Fair Trade USA 2011 Almanac 19
coffee: Premium Payments Generated by Fair Trade Certified Coffee Imports
Since 1998, $61 million in Fair Trade premiums have been paid to coffee producers. In 2011, almost $17 million in Fair Trade coffee premiums were paid to the producer organiza-tions, a new record for Fair Trade premium returns in one year. These premiums are used for community, education, environment, quality and productivity projects. As of April 1st, 2011, the Fair Trade premium for green coffee increased from $0.10 per pound of green coffee to $0.20 per pound, with five cents earmarked for productivity and quality improve-ments at the producer level. The Fair Trade minimum price also increased from $1.25 per pound of green, washed, Arabica coffee to $1.40 per pound of the same type.
Premium Payments Generated by Fair Trade Certified Coffee Imports, 1998-2011
Year Pounds Certified Cumulative Coffee Premiums Annual Coffee Premiums Annual Growth %
1998 76,059 $3,803 $3,803 N/A
1999 2,052,242 $106,415 $102,612 2598%
2000 4,249,534 $318,892 $212,477 107%
2001 6,669,308 $652,357 $333,465 57%
2002 9,747,571 $1,139,736 $487,379 46%
2003 19,239,017 $2,101,687 $961,951 97%
2004 32,974,400 $3,750,407 $1,648,720 71%
2005 44,585,323 $5,979,673 $2,229,266 35%
2006 64,774,431 $9,218,394 $3,238,722 45%
2007 1 66,339,389 $14,159,924 $4,941,530 53%
2008 87,772,966 $22,937,221 $8,777,297 78%
2009 108,373,041 $33,774,525 $10,837,304 23%
2010 2 105,251,476 $44,299,672 $10,525,148 -3%
2011 3 138,569,409 $61,257,176 $16,957,504 61%
1OnJune1st,2007theFairTradePremiumincreasedfrom$0.05perpoundofgreencoffeeto$0.10perpound.2The2010CertifiedPoundsandPremiumDollarswereadjustedtoaccountforfindingsduringtheaudit.3OnApril1st,2011,theFairTradePremiumincreasedfrom$0.10perpoundofgreencoffeeto$0.20,with$0.05earmarkedforproductivityand qualityimprovement.
Source: Fair Trade USA

Fair Trade USA 2011 Almanac20
coffee: Fair Trade Premium Payments to Producer Organizations Fair Trade Premium Payments to Producer Organizations, 1998-2011
Source: Fair Trade USA
$
$10
$20
$30
$40
$50
$60
$70
20112010200920082007200620052004200320022001200019991998
Annual Coffee Premiums
Cumulative Coffee Premiums
Prem
ium D
ollar
s (in
Milli
ons)

Fair Trade USA 2011 Almanac 21
coffee: Imports of Fair Trade Certified Coffee into the United StatesTo date, over 690 million pounds of Fair Trade Certified coffee have been imported into the United States. Imports of organic Fair Trade Certified coffee increased 14 percent in 2011, bringing the percentage of organic imports to 52 percent of the overall total volume. Total imports in 2011 increased 32 percent when compared to 2010, due to increased demand from U.S. buyers for Fair Trade Certified coffee.
Imports of Fair Trade Certified Coffee into the United States, 1998-2011
TOTAL FAIR TRADE CERTIFIED IMPORTS ORGANIC FAIR TRADE CERTIFIED IMPORTS
Year Pounds Certified 1 Growth Growth Rate Pounds Organic Growth Growth Rate Percent Organic
1998 76,059 N/A N/A 76,059 N/A N/A 100%
1999 2,052,242 1,976,183 2598% 1,696,072 1,620,013 2130% 83%
2000 4,249,534 2,197,292 107% 3,370,211 1,674,139 99% 79%
2001 6,669,308 2,419,774 57% 5,224,435 1,854,224 55% 78%
2002 9,747,571 3,078,263 46% 7,939,812 2,715,377 52% 81%
2003 19,239,017 9,491,446 97% 16,050,873 8,111,061 102% 83%
2004 32,974,400 13,735,383 71% 22,349,395 6,298,522 39% 68%
2005 44,585,323 11,610,923 35% 25,967,653 3,618,258 16% 58%
2006 64,774,431 20,189,108 45% 50,398,223 24,430,570 94% 78%
2007 66,339,389 1,564,958 2% 43,954,107 -6,444,116 -13% 66%
2008 87,772,966 21,433,577 32% 51,971,672 8,017,565 18% 59%
2009 108,373,041 20,600,075 23% 51,711,363 -260,309 -1% 48%
2010 2 105,251,476 -3,121,565 -3% 63,097,543 11,386,180 22% 60%
2011 138,569,409 33,317,933 32% 72,078,673 8,981,130 14% 52%
Total 690,674,166 415,886,091 60%
1Certifiedimportsreferstocoffeepurchasesmadedirectlyfromcooperativesandexportersatoriginandpurchasesmadefromforeigntradersorprocessors.2The2010volumefigureswereadjustedtoaccountforfindingsduringtheaudit.Source: Fair Trade USA
Fair Trade USA 2011 Almanac22
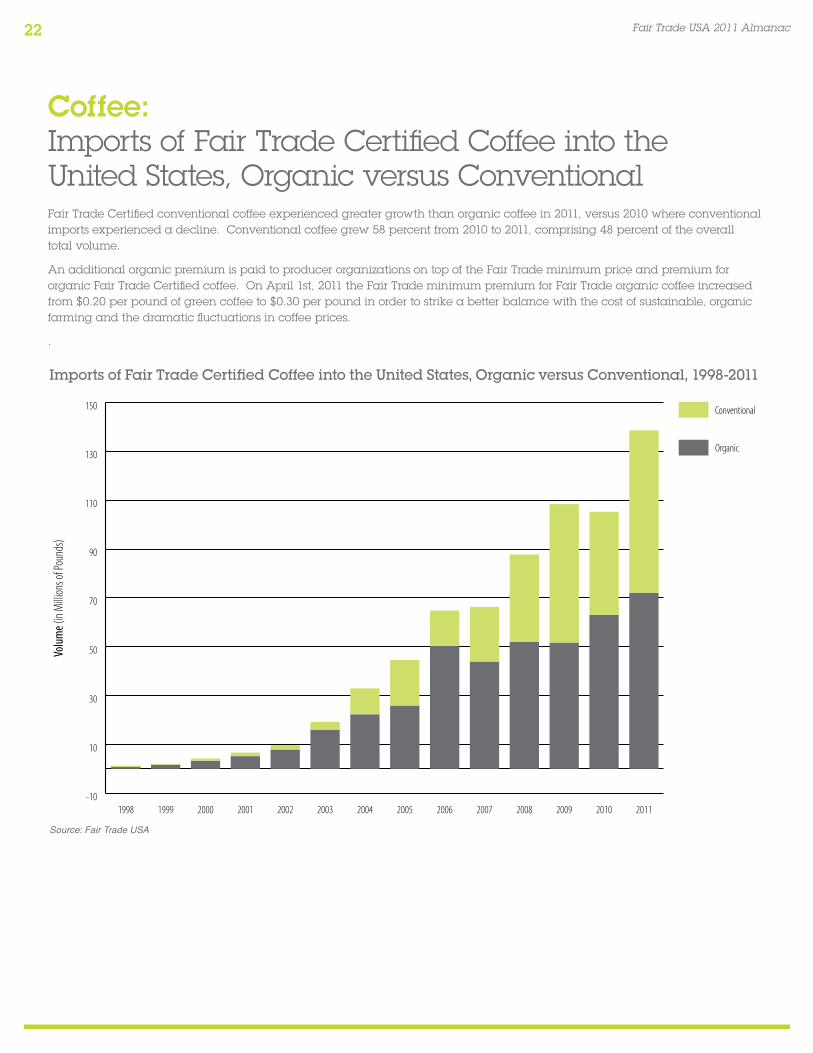
coffee: Imports of Fair Trade Certified Coffee into the United States, Organic versus Conventional Fair Trade Certified conventional coffee experienced greater growth than organic coffee in 2011, versus 2010 where conventional imports experienced a decline. Conventional coffee grew 58 percent from 2010 to 2011, comprising 48 percent of the overall total volume.
An additional organic premium is paid to producer organizations on top of the Fair Trade minimum price and premium for organic Fair Trade Certified coffee. On April 1st, 2011 the Fair Trade minimum premium for Fair Trade organic coffee increased from $0.20 per pound of green coffee to $0.30 per pound in order to strike a better balance with the cost of sustainable, organic farming and the dramatic fluctuations in coffee prices.
.
Imports of Fair Trade Certified Coffee into the United States, Organic versus Conventional, 1998-2011
Source: Fair Trade USA
-10
10
30
50
70
90
110
130
150
20112010200920082007200620052004200320022001200019991998
Organic
Conventional
Volum
e (in
Milli
ons o
f Pou
nds)

Fair Trade USA 2011 Almanac 23
coffee: Imports of Fair Trade Certified Coffee into the United States by Country of OriginIn 2011, approximately 138 million pounds of Fair Trade Certified coffee were imported into the United States from 22 different countries. Latin America accounted for 87 percent, or about 120 million pounds, with significant growth in imports from Brazil, El Salvador, Guatemala, and Honduras. In Africa, there was an overall increase of nine percent, with significant increases in Kenya and Uganda, as well as, the addition of a new origin, the Democratic Republic of Congo. U.S. imports from Asia, unfortunately, experienced a 12 percent decline due to the loss of East Timor as an available origin, but 2011 also saw the re-emergence of India as a source for Fair Trade Certified coffee.
Imports of Fair Trade Certified Coffee into the United States by Country of Origin in Pounds, 2007-2011
Country 2007 - 2011 2007 2008 2009 2010 1 2011 Growth 2011 vs. 2010 %
Growth 2011 vs. 2010 #
Latin AmericaBolivia 8,843,484 1,766,116 2,041,686 2,247,902 1,419,101 1,368,679 -4% -50,422Brazil 34,252,950 6,485,484 8,033,484 6,072,629 4,633,695 9,027,659 95% 4,393,964Colombia 52,984,981 3,340,403 9,089,912 10,594,680 12,688,214 17,271,773 36% 4,583,559Costa Rica 40,054,062 4,539,963 6,132,402 11,117,149 8,308,694 9,955,854 20% 1,647,159Dominican Republic 1,028,287 79,366 213,509 364,045 169,269 202,099 19% 32,830Ecuador 1,104,205 117,892 294,291 326,894 199,385 165,742 -17% -33,643El Salvador 2,334,191 281,387 484,361 324,013 236,479 1,007,951 326% 771,472Guatemala 29,838,272 2,902,323 6,927,812 7,845,530 3,945,563 8,217,045 108% 4,271,482Haiti 123,430 38,000 79,298 6,132 - - 0% 0Honduras 27,544,170 630,456 1,095,249 4,516,123 6,282,702 15,019,641 139% 8,736,939Mexico 42,416,591 7,716,151 8,797,759 9,849,807 6,844,276 9,208,598 35% 2,364,322Nicaragua 56,142,831 6,245,298 8,402,732 11,730,646 15,547,461 14,216,694 -9% -1,330,767Peru 126,605,629 18,673,333 22,105,130 26,692,128 24,970,591 34,164,447 37% 9,193,857
Latin America Subtotal 423,273,083 52,816,171 73,697,623 91,687,678 85,245,430 119,826,180 41% 34,580,750Africa
Congo - - - - - 42,240 100% 42,240Ethiopia 16,586,587 2,236,323 3,321,030 2,981,758 4,000,853 4,046,623 1% 45,771Kenya 624,457 136,311 62,741 252,652 45,768 126,985 177% 81,217Rwanda 2,074,051 39,683 333,389 332,852 709,451 658,677 -7% -50,775Tanzania 5,456,497 447,833 1,604,240 1,898,412 632,308 873,703 38% 241,395Uganda 965,312 39,682 38,029 443,676 160,540 283,386 77% 122,846
Africa Subtotal 25,706,904 2,899,832 5,359,429 5,909,350 5,548,920 6,031,614 9% 482,694Asia
East Timor 2 10,567,536 1,529,474 1,070,738 3,219,770 4,469,767 277,788 -94% -4,191,979India 141,488 119,048 - - - 22,440 100% 22,440Indonesia 44,218,141 8,736,601 7,207,077 6,460,641 9,716,849 12,096,972 24% 2,380,123Papua New Guinea 1,803,905 198,414 438,098 791,858 126,063 249,471 98% 123,408Thailand 158,901 39,849 - 119,052 - - 0% 0
Asia Subtotal 56,889,971 10,623,387 8,715,913 10,591,321 14,312,679 12,646,671 -12% -1,666,008
Total 3 505,869,958 66,339,389 87,772,966 108,373,041 105,251,476 138,569,409 32% 33,317,933
1The2010volumesforcoffeewereadjustedtoaccountforfindingsduringtheaudit.2TheonlyproducerorganizationinEastTimorceasedsellingFairTradeCertifiedcoffeeinDecember2010.Thevolumein2011isrepresentativeofremainingshipments
delivered in Q1 2011 from the 2010 contracts. 3The2009,2010,2011totalvolumesincludeblendedcoffeefrommultipleorigins(184,692,144,447,and64,944lbsrespectively).Source: Fair Trade USA

Fair Trade USA 2011 Almanac24
coffee: Percent of Fair Trade Certified Coffee Imported into the United States by Country of OriginNoteworthy for 2011 is the stronger presence of Honduras as the third largest country of origin for Fair Trade Certified coffee, with 11 percent of the U.S. imports, and Brazil, with seven percent. Both of these countries historically have not been large suppliers to the Fair Trade market within the U.S. but have seen growth in recent years.
Percent of Fair Trade Certified Coffee Imported into the United States by Country of Origin, 2011
Source: Fair Trade USA
Other Asian Originsless than 1%
Other Asian Origins
Indonesia
Other African Origins
Ethiopia
Other Latin American Origins
Guatemala
Brazil
Mexico
Costa Rica
Nicaragua
Honduras
Colombia
Peru
Peru25%
Colombia12%
Honduras11%Nicaragua
10%
Costa Rica7%
Mexico7%
Brazil7%
Guatemala6%
Other Latin American Origins2%
Ethiopia3%
Other African Origins1%
Indonesia9%

Fair Trade USA 2011 Almanac 25
coffee: Top Five Origins of Fair Trade Certified Coffee in the United States
The “Top 5” origins continue to represent an increasing major-ity of total U.S. imports. Four out of five of the top five origins of Fair Trade Certified™ coffee imported into the United States are in Latin America. New to the top five is Honduras with over 15 million pounds in 2011 and an increase of 139 percent from 2010. Indonesia held strong as the only non-Latin Ameri-can country in the top five with almost 12 million pounds, a 24 percent increase over last year, despite challenges in the market and difficulties in production.
Top Five Origins of Fair Trade Certified Coffee in the United States by Volume in Pounds, 2011
Country 2007 - 2011 2007 2008 2009 20101 2011
Peru 126,605,629 18,673,333 22,105,130 26,692,128 24,970,591 34,164,447
Colombia 52,984,981 3,340,403 9,089,912 10,594,680 12,688,214 17,271,773
Honduras 27,544,170 630,456 1,095,249 4,516,123 6,282,702 15,019,641
Nicaragua 56,142,831 6,245,298 8,402,732 11,730,646 15,547,461 14,216,694
Indonesia 44,218,140 8,736,601 7,207,077 6,460,641 9,716,849 12,096,972
Subtotal 307,495,750 37,626,090 47,900,100 59,994,218 69,205,816 92,769,526
All Origins Total 2 506,096,890 66,339,389 87,772,966 108,373,041 105,107,029 138,504,465
Top 5 as % of Total 61% 57% 55% 55% 66% 67%
1Thetotalvolumesin2010wereadjustedtoaccountforfindingsduringtheaudit.22010and2011AllOriginsTotalsdonotincludeblendedcoffeefrommultipleorigins(144,447,and64,944lbsrespectively).Source: Fair Trade USA


Fair Trade USA 2011 Almanac 27
TeA28 Premium Payments to Fair Trade Certified Tea
Producer Organizations, 2001-2011
29 Imports of Fair Trade Certified Tea into the United States, 2001-2011
30 Imports of Fair Trade Certified Tea into the United States by Country of Origin, 2007–2011
31 Percent of Fair Trade Certified Tea Imported into the United States by Country of Origin, 2011

Fair Trade USA 2011 Almanac28
Tea: Premium Payments to Fair Trade Certified Tea Producer Organizations
Sales of Fair Trade Certified tea to the United States since 2001 have generated over $3 million in premiums, reaching producer organizations in eleven different countries this year, funding programs that create better access to health care and education, support women, and protect the environment. The impact of Fair Trade Certified tea continues to grow, year after year, and expand its reach across Africa and Asia.
Premium Payments to Fair Trade Certified Tea Producer Organizations, 2001-2011
Year Pounds Certified
Producer Organizations1
Origins Premium2
< 2001 65,261 - - $10,757
2002 86,706 16 4 $30,415
2003 95,669 16 4 $43,792
2004 180,310 18 3 $62,346
2005 517,500 29 6 $177,407
2006 629,985 23 7 $244,800
2007 1,134,993 47 9 $428,435
2008 1,372,261 41 9 $473,954
2009 1,372,157 42 8 $454,534
20103 1,720,794 46 9 $542,821
20114 2,081,874 37 11 $657,944
Total 9,257,510 $3,127,205
1Dataonthenumberofproducerorganizationsisnotavailablepriorto2002.2FairTradePremiumsarefixedinU.S.Dollars,EurosorSouthAfricanRands,dependentontheteatype&quality.The2011conversionrateisahistoricalaveragefromthetimeperiod.Teapremiumsaredispersedbyeachgarden’srespectivejointbodyofworkersandmanagementororganizationofsmallproducers.
32010totalvolumeandpremiumfiguresforteaareadjustedtoaccountforfindingsduringaudit.4For2011,individualteaestatesinIndiaandSriLankathatarepartofmulti-estategroupsarenowconsolidatedunderlargerproducerorganizations.Source:FairTradeUSA,www.Oanda.com

Fair Trade USA 2011 Almanac 29
Tea: Imports of Fair Trade Certified Tea into the United StatesReaching imports of over two million pounds for the first time in Fair Trade USA’s history, imports of Fair Trade Certified tea into the U.S. continued the considerable growth trend from 2010 into 2011. Over 9.2 million pounds of Fair Trade Certified tea have
traded through the United States to date, the great majority of which is also certified organic.
Imports of Fair Trade Certified Tea into the United States, 2001-2011
TOTAL FAIR TRADE CERTIFIED IMPORTS ORGANIC FAIR TRADE CERTIFIED IMPORTS
Year1 Pounds Certified Growth Rate Pounds Organic2 Growth Rate Percent Organic
< 2001 65,261 n/a n/a n/a n/a
2002 86,706 33% n/a n/a n/a
2003 95,669 10% 84,189 n/a 88%
2004 180,310 88% 180,142 114% 100%
2005 517,500 187% 452,618 151% 87%
2006 629,985 22% 594,564 31% 94%
2007 1,134,993 80% 826,342 39% 73%
2008 1,372,261 21% 1,168,504 41% 85%
2009 1,372,157 0% 1,063,900 -9% 78%
20103 1,720,794 25% 1,252,008 15% 73%
2011 2,081,874 21% 1,512,005 21% 73%
Total 9,257,510 7,134,272 77%
12001teafigureincludesteacertifiedinthesecondhalfof2000.2VolumeofcertifiedorganicFairTradeTeaisnotavailablepriorto2003.Priorto2007,organicstatuswasnotanelementoftheFairTradeUSAauditandshouldbe
considered an estimate.32010totalvolumeforteahasbeenadjustedtoaccountforfindingsduringaudit.
Source: Fair Trade USA
Fair Trade USA 2011 Almanac30
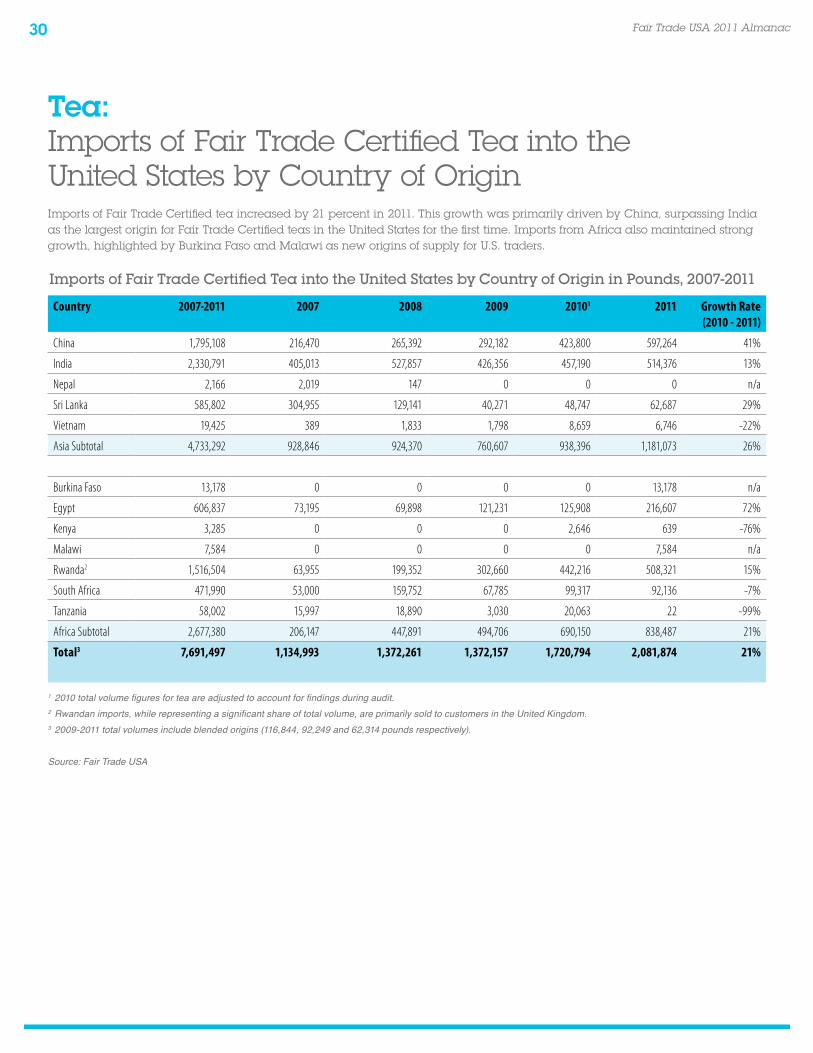
Tea: Imports of Fair Trade Certified Tea into the United States by Country of OriginImports of Fair Trade Certified tea increased by 21 percent in 2011. This growth was primarily driven by China, surpassing India as the largest origin for Fair Trade Certified teas in the United States for the first time. Imports from Africa also maintained strong growth, highlighted by Burkina Faso and Malawi as new origins of supply for U.S. traders.
Imports of Fair Trade Certified Tea into the United States by Country of Origin in Pounds, 2007-2011
Country 2007-2011 2007 2008 2009 20101 2011 Growth Rate (2010 - 2011)
China 1,795,108 216,470 265,392 292,182 423,800 597,264 41%
India 2,330,791 405,013 527,857 426,356 457,190 514,376 13%
Nepal 2,166 2,019 147 0 0 0 n/a
Sri Lanka 585,802 304,955 129,141 40,271 48,747 62,687 29%
Vietnam 19,425 389 1,833 1,798 8,659 6,746 -22%
Asia Subtotal 4,733,292 928,846 924,370 760,607 938,396 1,181,073 26%
Burkina Faso 13,178 0 0 0 0 13,178 n/a
Egypt 606,837 73,195 69,898 121,231 125,908 216,607 72%
Kenya 3,285 0 0 0 2,646 639 -76%
Malawi 7,584 0 0 0 0 7,584 n/a
Rwanda2 1,516,504 63,955 199,352 302,660 442,216 508,321 15%
South Africa 471,990 53,000 159,752 67,785 99,317 92,136 -7%
Tanzania 58,002 15,997 18,890 3,030 20,063 22 -99%
Africa Subtotal 2,677,380 206,147 447,891 494,706 690,150 838,487 21%
Total3 7,691,497 1,134,993 1,372,261 1,372,157 1,720,794 2,081,874 21%
12010totalvolumefiguresforteaareadjustedtoaccountforfindingsduringaudit.2Rwandanimports,whilerepresentingasignificantshareoftotalvolume,areprimarilysoldtocustomersintheUnitedKingdom.32009-2011totalvolumesincludeblendedorigins(116,844,92,249and62,314poundsrespectively).
Source: Fair Trade USA

Fair Trade USA 2011 Almanac 31
Tea: Percent of Fair Trade Certified Tea Imported into the United States by Country of OriginImports of Fair Trade Certified tea from China, Rwanda and India, together representing over three quarters of U.S. imports, con-tinue to significantly outweigh imports from all other origins.
Percent of Fair Trade Certified Tea Imported into the United States by Country of Origin, 2011
“Other Origins” includes origins representing less than 1% of total imports and blended teasSource: Fair Trade USA
Other Origins1
4%
Other Origins1
Sri Lanka
South Africa
Egypt
Rwanda
India
China
China29%
South Africa5%
India25%
Egypt10%
Sri Lanka3%
Rwanda24%


Fair Trade USA 2011 Almanac 33
cocoA34 Premium Payments Generated by Fair Trade
Certified Cocoa in the United States, 2002–2011
35 Percent of Premium Payments to Fair Trade Certified Cocoa Producer Organizations by Country of Origin, 2011
36 Imports of Fair Trade Certified Cocoa into the United States, 2002–2011
Fair Trade USA 2011 Almanac34
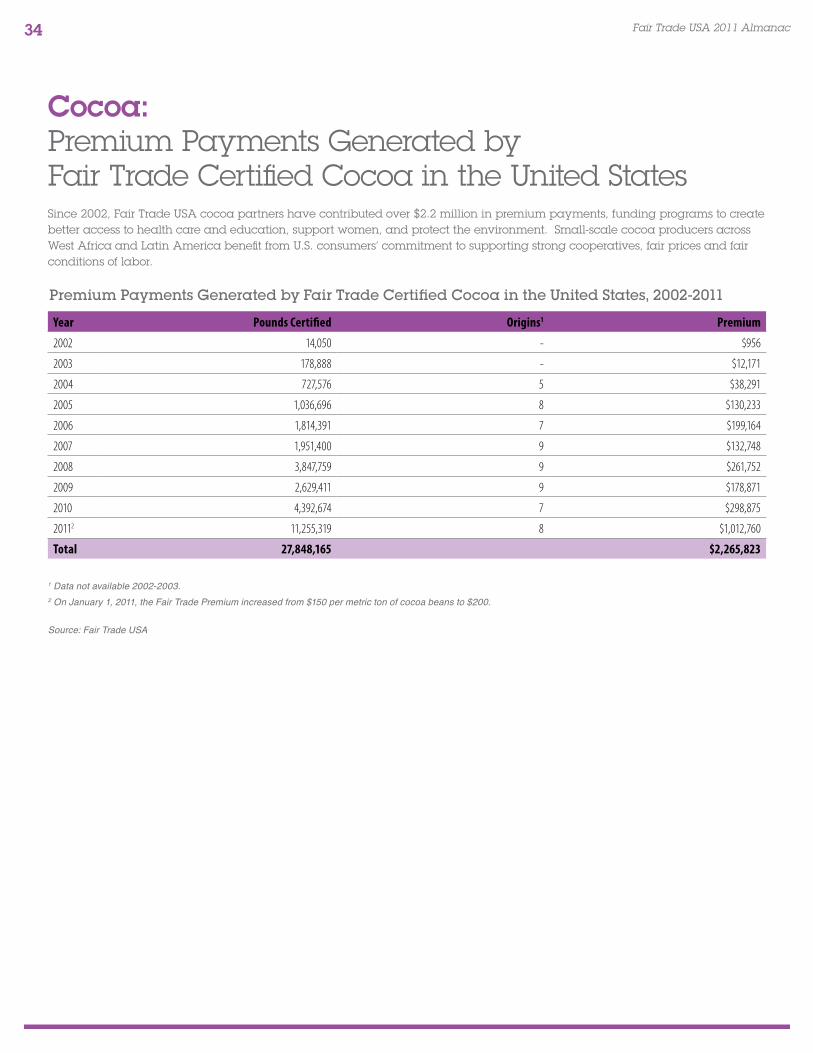
cocoa: Premium Payments Generated by Fair Trade Certified Cocoa in the United StatesSince 2002, Fair Trade USA cocoa partners have contributed over $2.2 million in premium payments, funding programs to create better access to health care and education, support women, and protect the environment. Small-scale cocoa producers across West Africa and Latin America benefit from U.S. consumers’ commitment to supporting strong cooperatives, fair prices and fair conditions of labor.
Premium Payments Generated by Fair Trade Certified Cocoa in the United States, 2002-2011
Year Pounds Certified Origins1 Premium
2002 14,050 - $956
2003 178,888 - $12,171
2004 727,576 5 $38,291
2005 1,036,696 8 $130,233
2006 1,814,391 7 $199,164
2007 1,951,400 9 $132,748
2008 3,847,759 9 $261,752
2009 2,629,411 9 $178,871
2010 4,392,674 7 $298,875
20112 11,255,319 8 $1,012,760
Total 27,848,165 $2,265,823
1Datanotavailable2002-2003.2OnJanuary1,2011,theFairTradePremiumincreasedfrom$150permetrictonofcocoabeansto$200.
Source: Fair Trade USA
Fair Trade USA 2011 Almanac 35
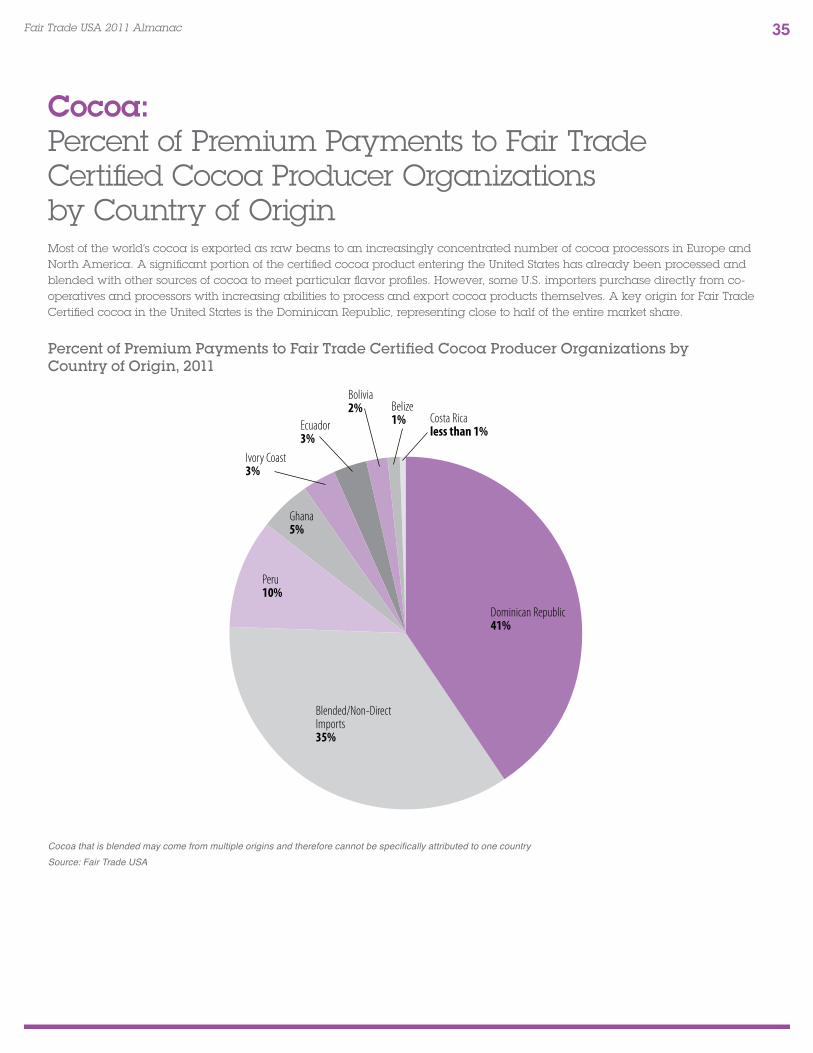
cocoa: Percent of Premium Payments to Fair Trade Certified Cocoa Producer Organizations by Country of OriginMost of the world’s cocoa is exported as raw beans to an increasingly concentrated number of cocoa processors in Europe and North America. A significant portion of the certified cocoa product entering the United States has already been processed and blended with other sources of cocoa to meet particular flavor profiles. However, some U.S. importers purchase directly from co-operatives and processors with increasing abilities to process and export cocoa products themselves. A key origin for Fair Trade Certified cocoa in the United States is the Dominican Republic, representing close to half of the entire market share.
Percent of Premium Payments to Fair Trade Certified Cocoa Producer Organizations by Country of Origin, 2011
CocoathatisblendedmaycomefrommultipleoriginsandthereforecannotbespecificallyattributedtoonecountrySource: Fair Trade USA
Belize1% Costa Rica
less than 1%
Costa Rica
Belize
Bolivia
Ecuador
Ivory Coast
Ghana
Peru
Blended/Non-Direct Imports
Dominican Republic
Dominican Republic41%
Ghana5%
Blended/Non-Direct Imports35%
Peru10%
Ecuador3%
Ivory Coast3%
Bolivia2%
Fair Trade USA 2011 Almanac36
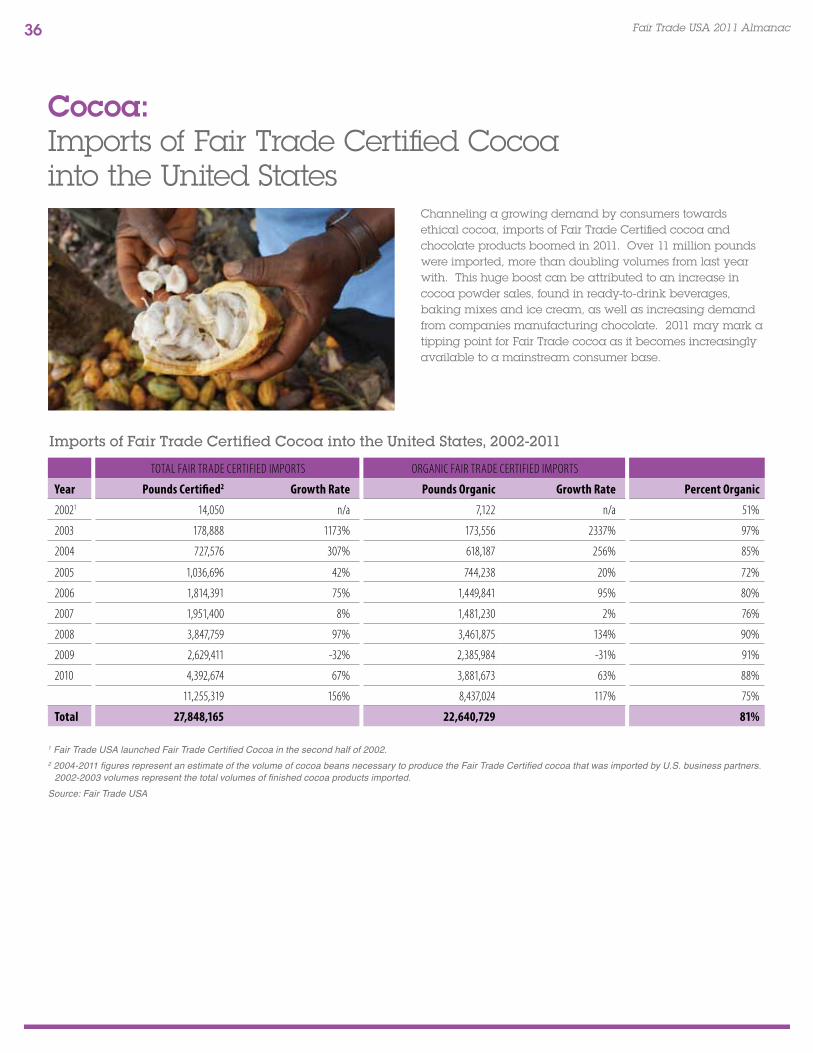
cocoa: Imports of Fair Trade Certified Cocoa into the United States
Channeling a growing demand by consumers towards ethical cocoa, imports of Fair Trade Certified cocoa and chocolate products boomed in 2011. Over 11 million pounds were imported, more than doubling volumes from last year with. This huge boost can be attributed to an increase in cocoa powder sales, found in ready-to-drink beverages, baking mixes and ice cream, as well as increasing demand from companies manufacturing chocolate. 2011 may mark a tipping point for Fair Trade cocoa as it becomes increasingly available to a mainstream consumer base.
Imports of Fair Trade Certified Cocoa into the United States, 2002-2011
TOTAL FAIR TRADE CERTIFIED IMPORTS ORGANIC FAIR TRADE CERTIFIED IMPORTS
Year Pounds Certified2 Growth Rate Pounds Organic Growth Rate Percent Organic
20021 14,050 n/a 7,122 n/a 51%
2003 178,888 1173% 173,556 2337% 97%
2004 727,576 307% 618,187 256% 85%
2005 1,036,696 42% 744,238 20% 72%
2006 1,814,391 75% 1,449,841 95% 80%
2007 1,951,400 8% 1,481,230 2% 76%
2008 3,847,759 97% 3,461,875 134% 90%
2009 2,629,411 -32% 2,385,984 -31% 91%
2010 4,392,674 67% 3,881,673 63% 88%
11,255,319 156% 8,437,024 117% 75%
Total 27,848,165 22,640,729 81%
1FairTradeUSAlaunchedFairTradeCertifiedCocoainthesecondhalfof2002. 22004-2011figuresrepresentanestimateofthevolumeofcocoabeansnecessarytoproducetheFairTradeCertifiedcocoathatwasimportedbyU.S.businesspartners.2002-2003volumesrepresentthetotalvolumesoffinishedcocoaproductsimported.
Source: Fair Trade USA

Fair Trade USA 2011 Almanac 37


Fair Trade USA 2011 Almanac 39
Produce40 Origins and Producer Organizations by
Produce Type, 2011
41 Premium Payments to Fair Trade Certified Produce Producer Organizations by Country of Origin, 2011
42 Imports of Fair Trade Certified Produce into the United States by Produce Type, 2004–2011
43 Imports of Fair Trade Certified Produce into the United States by Produce Type, 2011

Fair Trade USA 2011 Almanac40
Produce: Origins and Producer Organizations by Produce Type
2011 showed growth across nearly every country and fresh produce product. Notably, 2011 marked the first time that Fair Trade Certified™ bell peppers, cucumbers and bananas from Mexico were imported into the United States. These imports generated nearly $40,000 in premium funds for Mexican growers and farm workers during the 2011 harvest.
Origins and Producer Organizations by Produce Type in Pounds, 2011
Colombia Costa Rica Dominican Republic
Ecuador Haiti Mexico Peru South Africa
Producer Organizations
Banana 26,028,360 - 57,588 17,507,040 - 271,738 14,896,320 - 40
Citrus - - - - - - - 760,727 1
Cucumber - - - - - 368,952 - - 1
Mango - - - - 433,010 - 11,182 - 2
Pineapple - 10,613,252 - - - - - - 2
Bell Pepper - - - - - 567,270 - - 1
Total 26,028,360 10,613,252 57,588 17,507,040 433,010 1,207,960 14,907,502 760,727 47
Source: Fair Trade USA
Fair Trade USA 2011 Almanac 41
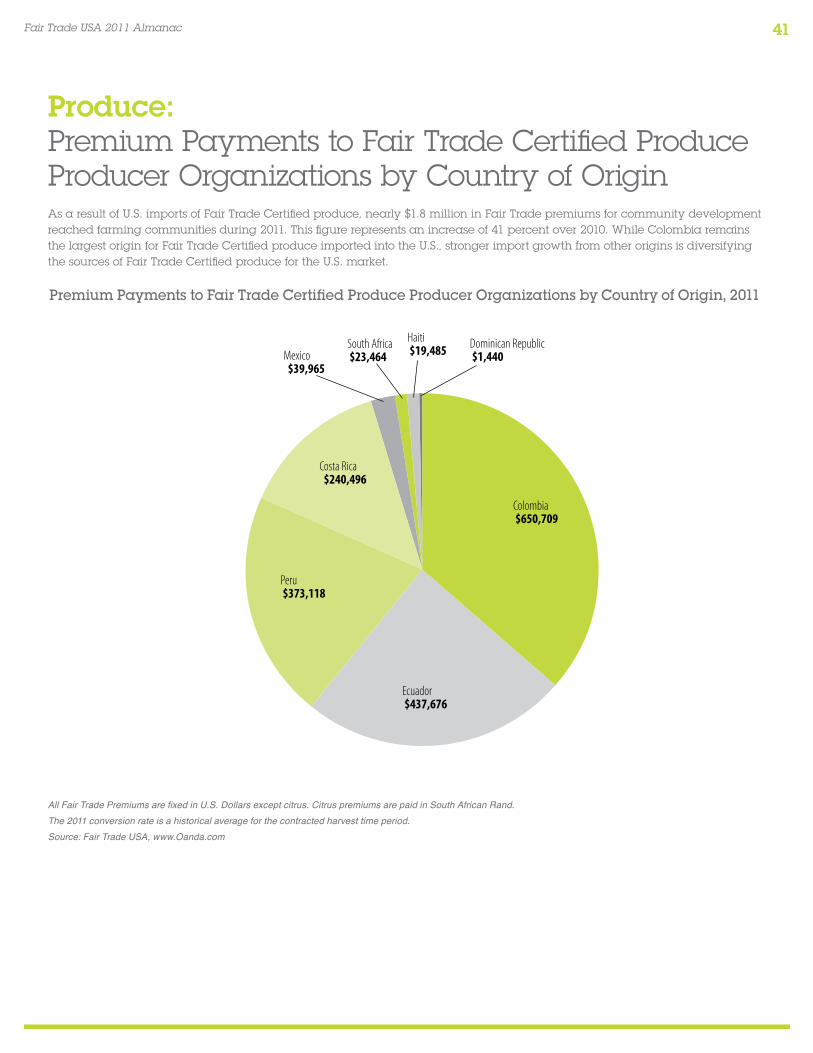
Produce: Premium Payments to Fair Trade Certified Produce Producer Organizations by Country of OriginAs a result of U.S. imports of Fair Trade Certified produce, nearly $1.8 million in Fair Trade premiums for community development reached farming communities during 2011. This figure represents an increase of 41 percent over 2010. While Colombia remains the largest origin for Fair Trade Certified produce imported into the U.S., stronger import growth from other origins is diversifying the sources of Fair Trade Certified produce for the U.S. market.
Premium Payments to Fair Trade Certified Produce Producer Organizations by Country of Origin, 2011
AllFairTradePremiumsarefixedinU.S.Dollarsexceptcitrus.CitruspremiumsarepaidinSouthAfricanRand.The 2011 conversion rate is a historical average for the contracted harvest time period.Source:FairTradeUSA,www.Oanda.com
Dominican Republic $1,440
Dominican Republic
Haiti
South Africa
Mexico
Costa Rica
Peru
Ecuador
Columbia
Colombia $650,709
South Africa $23,464
Ecuador $437,676
Peru $373,118
Mexico $39,965
Costa Rica $240,496
Haiti $19,485

Fair Trade USA 2011 Almanac42
Produce: Imports of Fair Trade Certified Produce into the United States by Produce Type
The Fair Trade Certified produce category continued to grow in 2011, with an impressive 40 percent increase over 2010. The re-emergence of Fair Trade pineapples seen in 2010 con-tinued into 2011’s harvest, and growth was also demonstrated in nearly every other produce product.
Imports of Fair Trade Certified Produce into the United States by Produce Type in Pounds, 2004-2011
2004–2010 2007 2008 2009 2010 2011 Growth Rate (2010-2011)
Avocado 759,829 - 56,000 554,550 149,279 - -100%
Banana 171,015,610 7,228,000 24,894,400 49,270,680 41,915,160 58,761,046 40%
Citrus1 2,056,893 780,207 464,607 143,715 281,790 760,727 170%
Cucumber 368,952 - - - - 368,952 100%
Grape 9,180 - - - - - n/a
Mango 1,980,594 22,275 77,760 303,777 421,648 444,192 5%
Pineapple 13,340,743 - - - 8,287,443 10,613,252 28%
Bell Pepper 567,270 - - - - 567,270 100%
Total 189,730,119 8,030,482 25,492,767 50,272,722 51,055,320 71,515,439 40%
1Citrusfiguresfor2007,2010&2011includeclementinesandnaveloranges.Thefiguresfor2008and2009representnavelorangesonly.Source: Fair Trade USA

Fair Trade USA 2011 Almanac 43
Produce: Imports of Fair Trade Certified Produce into the United States by Produce TypeOne of the most notable trends within the produce category during 2011 was continued growth in organic imports. Across all products, imports of organic products as a percentage of total products were 59 percent, versus 51 percent in 2010. The total quantity of organic products imported also grew by 64 percent.
Imports of Fair Trade Certified Produce into the United States by Produce Type, 2011
Source: Fair Trade USA
0 10 20 30 40 50 60
Banana
Pineapple
Cucumber
Bell Pepper
Mango
Citrus
Organic
Conventional
Volume (in Millions of Pounds)

Fair Trade USA 2011 Almanac 45
sugAr46 Volumes and Premium Payments for Fair Trade
Certified Sugar by Origin, 2005–2011
47 Imports of Fair Trade Certified Sugar into the United States by Country of Origin, 2007–2011
48 Imports of Fair Trade Certified Sugar into the United States, 2005–2011

Fair Trade USA 2011 Almanac46
sugar: Volumes and Premium Payments for Fair Trade Certified Sugar by Origin
Consumers in the United States continue to deliver tremendous impact to sugar cane growing families and communities across Latin America, Africa and Asia with over $2.5 million in premiums paid since 2005. While Paraguay represents the largest origin of Fair Trade Certified sugar each year, it is especially exciting to note imports from Belize and Mauritius for the first time in 2011.
Volumes and Premium Payments for Fair Trade Certified Sugar by Origin, 2005-2011
Country 2005–2011 2007 2008 2009 2010 2011 Growth Rate (2010 - 2011)
Belize 1,563,749 0 0 0 0 1,563,749 100%
Costa Rica 3,872,885 1,525,351 85,800 644,850 343,922 954,614 178%
Malawi 7,536,551 1,147,804 1,191,849 1,289,855 1,688,837 1,539,563 -9%
Mauritius 361,554 0 0 0 0 361,554 100%
Paraguay 60,957,745 5,984,272 7,415,494 9,371,663 16,091,330 19,310,734 20%
The Philippines 119,035 0 0 0 22,035 25,000 13%
Total Pounds1 74,415,728 8,657,427 8,696,172 11,307,547 18,146,124 23,755,215 31%
Total Premium $2,581,396 $289,683 $303,891 $392,763 $640,041 $821,930 28%
1The2008-2009totalvolumesincludeblendedorigins(3,029and1,179poundsrespectively).Source: Fair Trade USA

Fair Trade USA 2011 Almanac 47
sugar: Imports of Fair Trade Certified Sugar into the United States by Country of Origin The demand for Fair Trade, organic sugar - primarily supplied by Paraguayan sugar cane growers - steadily grows year after year. Concurrently, there was more conventional sugar imported this year than ever before, coming from sources in Belize, Costa Rica, Malawi and Mauritius.
Imports of Fair Trade Certified Sugar into the United States by Country of Origin, 2007-2011
Source: Fair Trade USA
Paraguay
Belize
Malawi
0
5
10
15
20
25
20112010200920082007
Costa Rica
Mauritius
The Philippines
Volum
e (in
Milli
ons o
f Pou
nds)
Fair Trade USA 2011 Almanac48
sugar: Imports of Fair Trade Certified Sugar into the United States
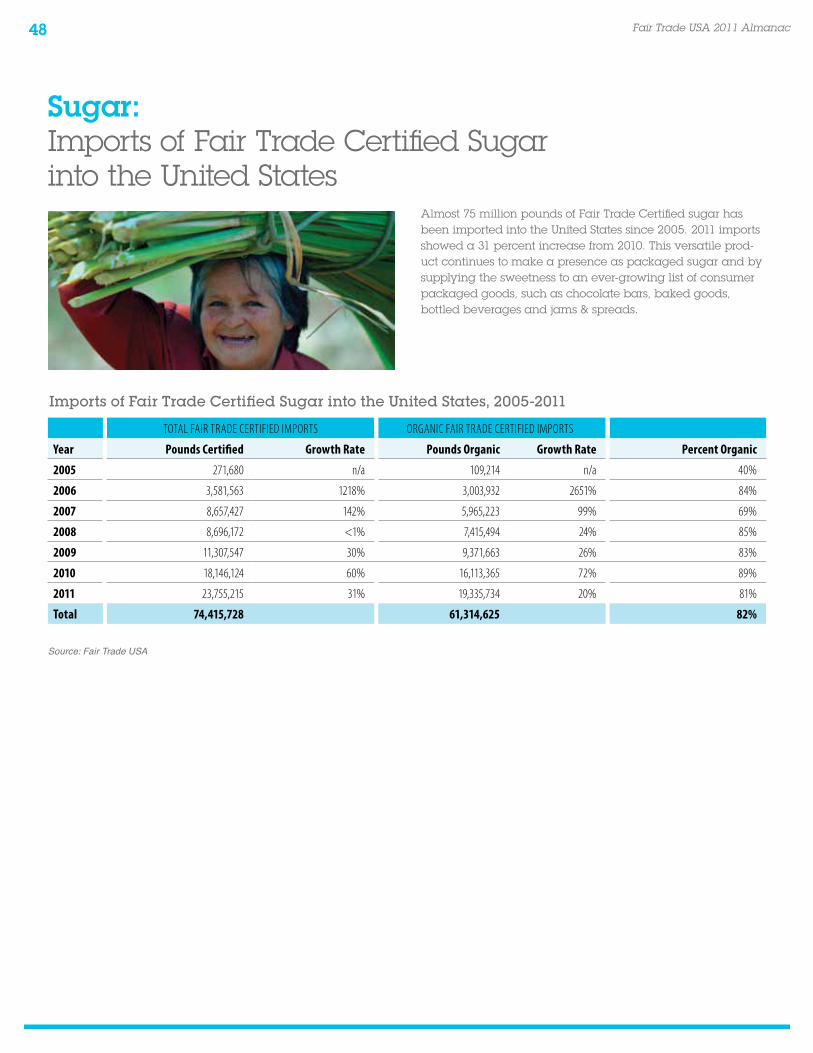
Almost 75 million pounds of Fair Trade Certified sugar has been imported into the United States since 2005. 2011 imports showed a 31 percent increase from 2010. This versatile prod-uct continues to make a presence as packaged sugar and by supplying the sweetness to an ever-growing list of consumer packaged goods, such as chocolate bars, baked goods, bottled beverages and jams & spreads.
Imports of Fair Trade Certified Sugar into the United States, 2005-2011
TOTAL FAIR TRADE CERTIFIED IMPORTS ORGANIC FAIR TRADE CERTIFIED IMPORTS
Year Pounds Certified Growth Rate Pounds Organic Growth Rate Percent Organic
2005 271,680 n/a 109,214 n/a 40%
2006 3,581,563 1218% 3,003,932 2651% 84%
2007 8,657,427 142% 5,965,223 99% 69%
2008 8,696,172 <1% 7,415,494 24% 85%
2009 11,307,547 30% 9,371,663 26% 83%
2010 18,146,124 60% 16,113,365 72% 89%
2011 23,755,215 31% 19,335,734 20% 81%
Total 74,415,728 61,314,625 82%
Source: Fair Trade USA

Fair Trade USA 2011 Almanac 49


Fair Trade USA 2011 Almanac 51
oTHer ProducTs52 GRAINS: Imports of Fair Trade Certified Grains into
the United States, 2005–2011
53 GRAINS: Imports of Fair Trade Certified Rice and Quinoa into the United States, 2005–2011
54 VANILLA, HERBS & SPICES: Imports of Fair Trade Certified Vanilla, Herbs and Spices into the United States, 2006–2011
55 VANILLA, HERBS & SPICES: Percent of Fair Trade Certified Herbs and Spices Imported into the United States, 2011
56 FLOWERS: Imports of Fair Trade Certified Flowers into the United States, 2007–2011
57 FLOWERS: Imports of Fair Trade Certified Flowers into the United States by Country of Origin, 2007–2011
58 WINE: Imports of Fair Trade Certified Wine into the United States, 2008–2011
58 HONEY: Imports of Fair Trade Certified Honey into the United States, 2008–2011
59 NUTS & OILSEEDS: Imports of Fair Trade Certified Nuts and Oilseeds into the United States, 2009–2011
60 SPORTS BALLS: Imports of Fair Trade Certified Sports Balls into the United States, 2009–2011
61 APPAREL & LINENS: Imports of Fair Trade Certified Garments into the United States, 2010–2011

Fair Trade USA 2011 Almanac52
other Products: Imports of Fair Trade Certified Grains into the United States Since 2005, sales of Fair Trade grain products in the United States delivered over $136,000 in impact dollars to a small base of committed supply partners, reaching rice farmers across South and Southeast Asia and quinoa farmers high in the Andes of South America.
Grains: Imports of Fair Trade Certified Grains into the United States, 2005-2011
Year Pounds Certified Growth Rate Pounds Organic
Percent Organic
Producer Organiza-
tions1
Premium2 Origins
Rice
2005 73,824 n/a 10,800 15% 2 $781 India, Thailand
2006 390,848 429% 333,872 85% 2 $5,851 India, Thailand
2007 436,456 12% 315,996 72% 2 $6,449 India, Thailand
2008 317,652 -27% 40,260 13% 5 $5,085 India, Thailand
2009 971,454 206% 34,480 4% 2 $17,711 India, Thailand
2010 157,455 -84% 94,512 60% 2 $1,688 Thailand
2011 122,628 -22% 71,500 58% 1 $1,368 Thailand
SubTotal 2,470,317 901,420 36% $38,933
Quinoa
2009 304,351 n/a 304,351 100% 2 $11,734 Bolivia
2010 1,279,549 320% 1,279,549 100% 2 $49,334 Bolivia
2011 945,051 -26% 945,051 100% 3 $36,437 Bolivia
SubTotal 2,528,951 2,528,951 100% $97,506
Total 4,999,268 3,430,371 69% $136,439
1Until2008,thedataforricereflectsthenumberofexportersanddoesnotreflectthemultipleproducersexportingthroughthesegroups.2FairTradericepremiumsarefixedinThaiBaht.The2011conversionrateisahistoricalaverageforthetimeperiod.Source:FairTradeUSA,www.Oanda.com

Fair Trade USA 2011 Almanac 53
other Products: Grains: Imports of Fair Trade Certified Rice and Quinoa into the United States Imports of Fair Trade Certified quinoa continued to represent the majority of Fair Trade grains in 2011. In the past two years, growing consumer demand has led to the import of over two million pounds of Fair Trade quinoa into the United States.
Grains: Imports of Fair Trade Certified Rice and Quinoa into the United States, 2005-2011
Source: Fair Trade USA
0
500
1,000
1,500
2011201020092008200720062005
Rice
Quinoa
Volum
e (in
Thou
sand
s of P
ound
s)
Fair Trade USA 2011 Almanac54
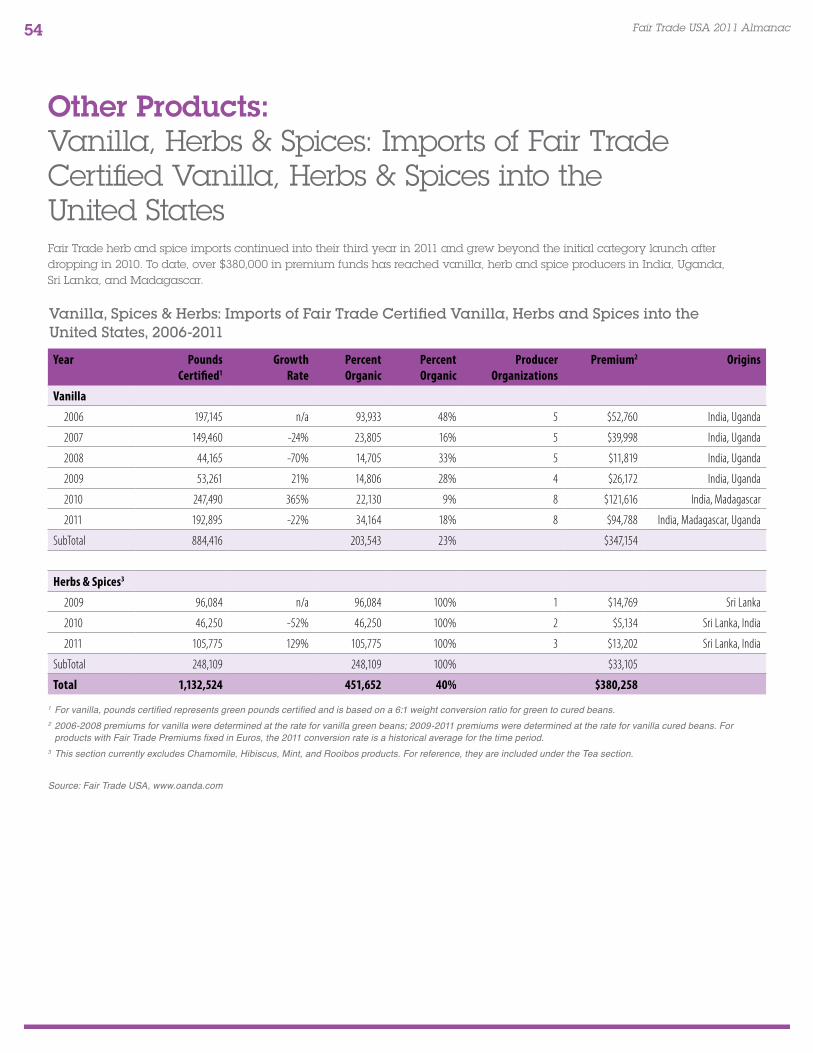
other Products: Vanilla, Herbs & Spices: Imports of Fair Trade Certified Vanilla, Herbs & Spices into the United States Fair Trade herb and spice imports continued into their third year in 2011 and grew beyond the initial category launch after dropping in 2010. To date, over $380,000 in premium funds has reached vanilla, herb and spice producers in India, Uganda, Sri Lanka, and Madagascar.
Vanilla, Spices & Herbs: Imports of Fair Trade Certified Vanilla, Herbs and Spices into the United States, 2006-2011
Year Pounds Certified1
Growth Rate
Percent Organic
Percent Organic
Producer Organizations
Premium2 Origins
Vanilla
2006 197,145 n/a 93,933 48% 5 $52,760 India, Uganda
2007 149,460 -24% 23,805 16% 5 $39,998 India, Uganda
2008 44,165 -70% 14,705 33% 5 $11,819 India, Uganda
2009 53,261 21% 14,806 28% 4 $26,172 India, Uganda
2010 247,490 365% 22,130 9% 8 $121,616 India, Madagascar
2011 192,895 -22% 34,164 18% 8 $94,788 India, Madagascar, Uganda
SubTotal 884,416 203,543 23% $347,154
Herbs & Spices3
2009 96,084 n/a 96,084 100% 1 $14,769 Sri Lanka
2010 46,250 -52% 46,250 100% 2 $5,134 Sri Lanka, India
2011 105,775 129% 105,775 100% 3 $13,202 Sri Lanka, India
SubTotal 248,109 248,109 100% $33,105
Total 1,132,524 451,652 40% $380,258
1Forvanilla,poundscertifiedrepresentsgreenpoundscertifiedandisbasedona6:1weightconversionratioforgreentocuredbeans.22006-2008premiumsforvanillaweredeterminedattherateforvanillagreenbeans;2009-2011premiumsweredeterminedattherateforvanillacuredbeans.ForproductswithFairTradePremiumsfixedinEuros,the2011conversionrateisahistoricalaverageforthetimeperiod.
3ThissectioncurrentlyexcludesChamomile,Hibiscus,Mint,andRooibosproducts.Forreference,theyareincludedundertheTeasection.
Source:FairTradeUSA,www.oanda.com

Fair Trade USA 2011 Almanac 55
other Products: Vanilla, Spices & Herbs: Percent of Fair Trade Certified Herbs & Spices Imported into the United States Organic cinnamon and ginger represented half of total imports in 2011, a huge increase from their combined market share of only four percent in 2010. Black pepper and turmeric also both doubled from their respective import volumes from last year. This category should continue to grow as new partners with increasingly diverse herb and spice product offerings join Fair Trade.
Vanilla, Spices & Herbs: Percent of Fair Trade Certified Herbs and Spices Imported into the United States, 2011
Source: Fair Trade USA
Cloves1%
Cloves
Mace
Tulsi
Nutmeg
Turmeric
Black Pepper
Ginger
Cinnamon
Cinnamon32%
Nutmeg7%
Black Pepper21%
Turmeric12%
Tulsi5%
Mace2%
Ginger22%

Fair Trade USA 2011 Almanac56
other Products: Flowers: Imports of Fair Trade Certified Flowers into the United States
Flower exports to the United States have remained fairly con-sistent since 2008, totaling over 41 millions stems imported to date. This category quickly took off after its launch at the end of 2007, and consumers so far have delivered over $1.3 million in premium payments to floral farm workers for investment into their communities and futures.
Flowers: Imports of Fair Trade Certified Flowers into the United States, 2007-2011
Year Stems Certified Growth Rate Producer Organizations Premium Origins
20071 650,832 n/a 10 $8,125 Ecuador, Colombia, Kenya
2008 9,835,028 1411% 21 $302,835 Ecuador, Colombia, Kenya
2009 9,539,859 -3% 16 $295,352 Ecuador, Colombia, Kenya
20102 10,489,991 10% 12 $317,698 Ecuador, Kenya
2011 10,510,006 0% 12 $391,147 Ecuador, Kenya
Total 41,025,716 $1,315,157
1Representsapartialyear;FairTradeUSAlaunchedFairTradeCertifiedFlowersinthesecondhalfof2007.22010StemsCertifiedadjustedtoaccountforfindingsduringaudit.Source: Fair Trade USA

Fair Trade USA 2011 Almanac 57
other Products: Imports of Fair Trade Certified Flowers into the United States by Country of Origin Representing almost three quarters of total imports in 2011, Ecuador is the leading supplier of Fair Trade Certified flowers to the U.S. market. For flowers, the Fair Trade premium is a percentage of the sale price. In general, Ecuadorian farmers receive a higher premium per stem than Kenyan farmers because of their higher quality flowers. Producer organizations in both countries received a combined amount of close to $400,000 in premium funds in 2011.
Flowers: Imports of Fair Trade Certified Flowers into the United States by Country of Origin, 2007-2011
Source: Fair Trade USA
0
2
4
6
8
10
12
20112010200920082007
Kenya
Colombia
Ecuador
Volum
e (in
Milli
ons o
f Stem
s)

Fair Trade USA 2011 Almanac58
other Products: Wine: Imports of Fair Trade Certified Wine into the United States
New and old committed business partners spanning the wine industry, offering Fair Trade varietals in the United States, con-tinue to deliver impact, totaling almost $350,000 in premiums paid since 2008, to wine grape producers and their communi-ties across South Africa, Argentina and Chile.
Wine: Imports of Fair Trade Certified Wine into the United States, 2008-2011
Year Bottles Certified1 Growth Rate Percent Organic2 Producer Organizations Premium3 Origins
2008 257,959 n/a 15% 4 $34,128 South Africa, Argentina
2009 1,450,717 462% 14% 7 $202,789 South Africa, Argentina, Chile
2010 530,446 -63% 38% 10 $68,586 South Africa, Argentina, Chile
2011 300,637 -43% 11% 5 $40,154 South Africa, Argentina, Chile
Total 2,539,760 $345,657
1Basedon750mlbottles.2 In2011,69,408bottlesofwinewerenotdesignatedasorganicorconventionalandwerethusnotincludedinthePercentOrganicdataset.3FairTradepremiumforwinevariesbywinegrape.Thepremiumis50Eurosper700litersofredwineand50Eurosper630litersofwhitewine.ThetablereflectspremiumpaymentsconvertedtoU.S.Dollars.The2011exchangerateisahistoricalaverageforthetimeperiod.
Source:FairTradeUSA,www.oanda.com
New Products: Honey: Imports of Fair Trade Certified Honey into the United StatesCommitted U.S. business partners spanning the food and body care industries offer a variety of products and continue to deliver impact, totaling almost $128,000 in Fair Trade premiums since 2008, to beekeepers and their communities across Brazil and Mexico.
Honey: Imports of Fair Trade Certified Honey into the United States, 2008-2011
Year Pounds Certified Growth Rate Percent Organic Producer Organizations Premium Origins
2008 266,385 n/a 100% 4 $18,125 Mexico
2009 250,662 -6% 100% 3 $17,055 Mexico
2010 919,130 267% 100% 6 $62,537 Brazil, Mexico
2011 333,600 -64% 100% 3 $30,264 Brazil, Mexico
Total 1,769,778 $127,981Source: Fair Trade USA
Fair Trade USA 2011 Almanac 59
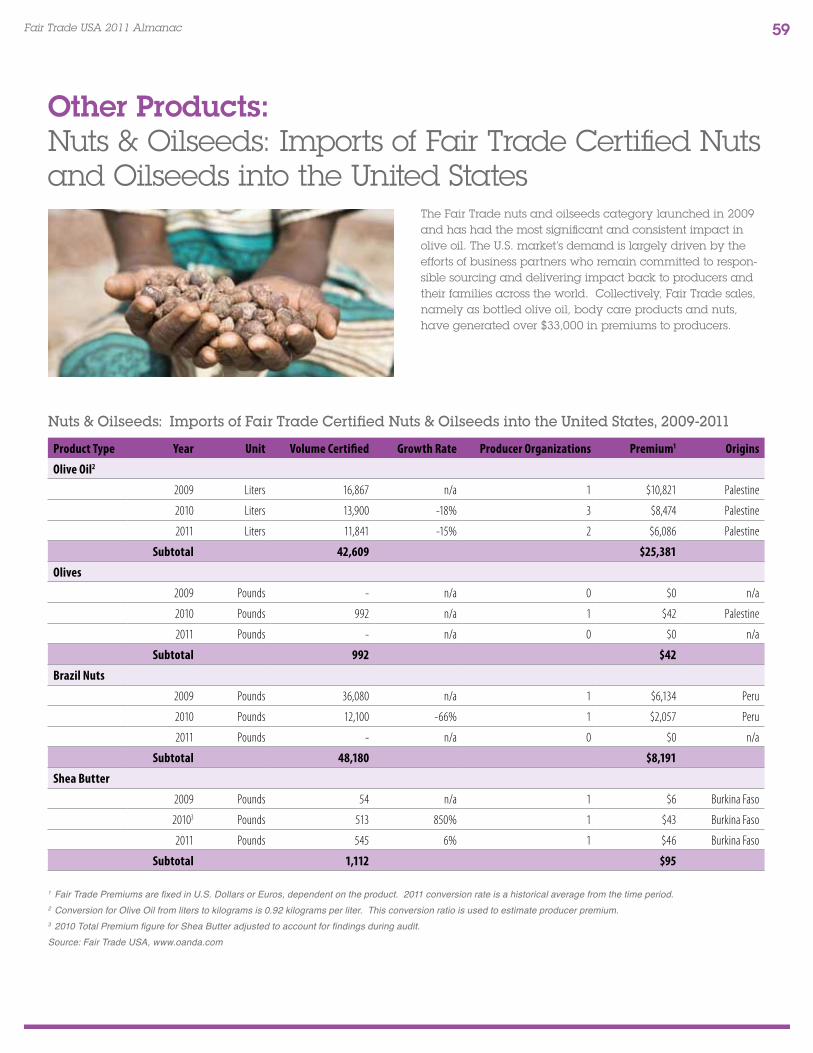
other Products: Nuts & Oilseeds: Imports of Fair Trade Certified Nuts and Oilseeds into the United States
The Fair Trade nuts and oilseeds category launched in 2009 and has had the most significant and consistent impact in olive oil. The U.S. market’s demand is largely driven by the efforts of business partners who remain committed to respon-sible sourcing and delivering impact back to producers and their families across the world. Collectively, Fair Trade sales, namely as bottled olive oil, body care products and nuts, have generated over $33,000 in premiums to producers.
Nuts & Oilseeds: Imports of Fair Trade Certified Nuts & Oilseeds into the United States, 2009-2011
Product Type Year Unit Volume Certified Growth Rate Producer Organizations Premium1 Origins
Olive Oil2
2009 Liters 16,867 n/a 1 $10,821 Palestine
2010 Liters 13,900 -18% 3 $8,474 Palestine
2011 Liters 11,841 -15% 2 $6,086 Palestine
Subtotal 42,609 $25,381
Olives
2009 Pounds - n/a 0 $0 n/a
2010 Pounds 992 n/a 1 $42 Palestine
2011 Pounds - n/a 0 $0 n/a
Subtotal 992 $42
Brazil Nuts
2009 Pounds 36,080 n/a 1 $6,134 Peru
2010 Pounds 12,100 -66% 1 $2,057 Peru
2011 Pounds - n/a 0 $0 n/a
Subtotal 48,180 $8,191
Shea Butter
2009 Pounds 54 n/a 1 $6 Burkina Faso
20103 Pounds 513 850% 1 $43 Burkina Faso
2011 Pounds 545 6% 1 $46 Burkina Faso
Subtotal 1,112 $95
1FairTradePremiumsarefixedinU.S.DollarsorEuros,dependentontheproduct.2011conversionrateisahistoricalaveragefromthetimeperiod.2ConversionforOliveOilfromliterstokilogramsis0.92kilogramsperliter.Thisconversionratioisusedtoestimateproducerpremium.32010TotalPremiumfigureforSheaButteradjustedtoaccountforfindingsduringaudit.Source:FairTradeUSA,www.oanda.com
Fair Trade USA 2011 Almanac60
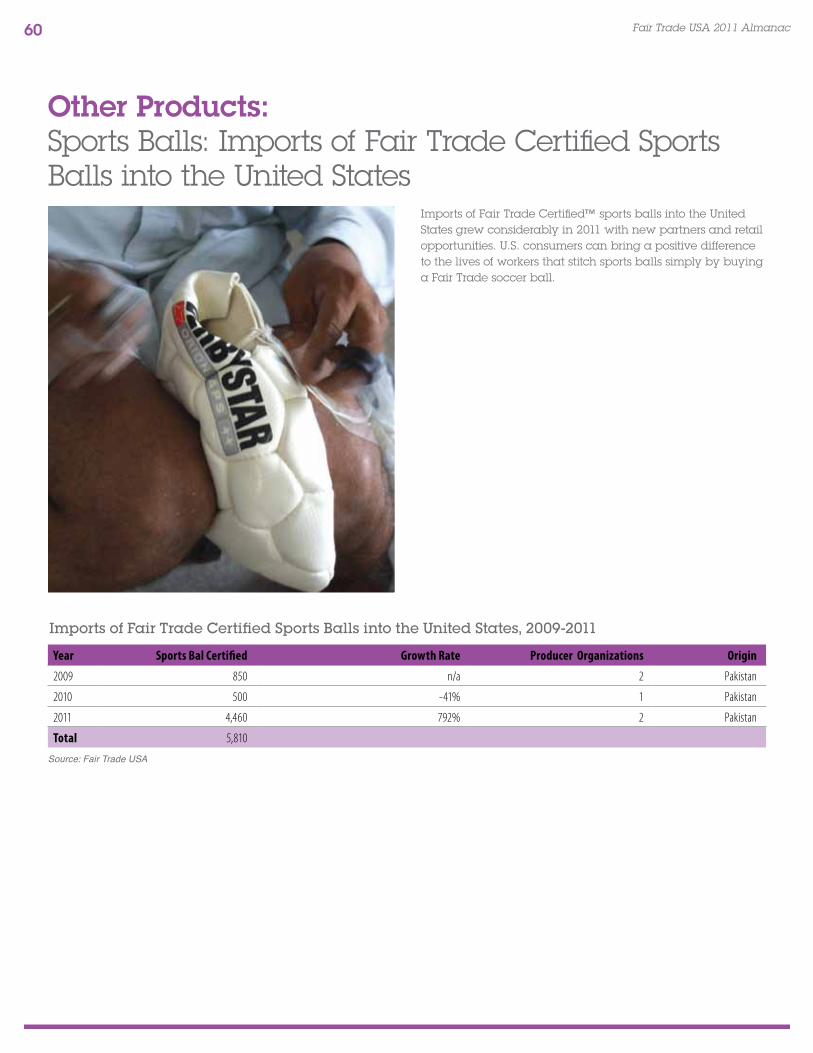
other Products: Sports Balls: Imports of Fair Trade Certified Sports Balls into the United States
Imports of Fair Trade Certified™ sports balls into the United States grew considerably in 2011 with new partners and retail opportunities. U.S. consumers can bring a positive difference to the lives of workers that stitch sports balls simply by buying a Fair Trade soccer ball.
Imports of Fair Trade Certified Sports Balls into the United States, 2009-2011
Year Sports Bal Certified Growth Rate Producer Organizations Origin
2009 850 n/a 2 Pakistan
2010 500 -41% 1 Pakistan
2011 4,460 792% 2 Pakistan
Total 5,810
Source: Fair Trade USA
Fair Trade USA 2011 Almanac 61
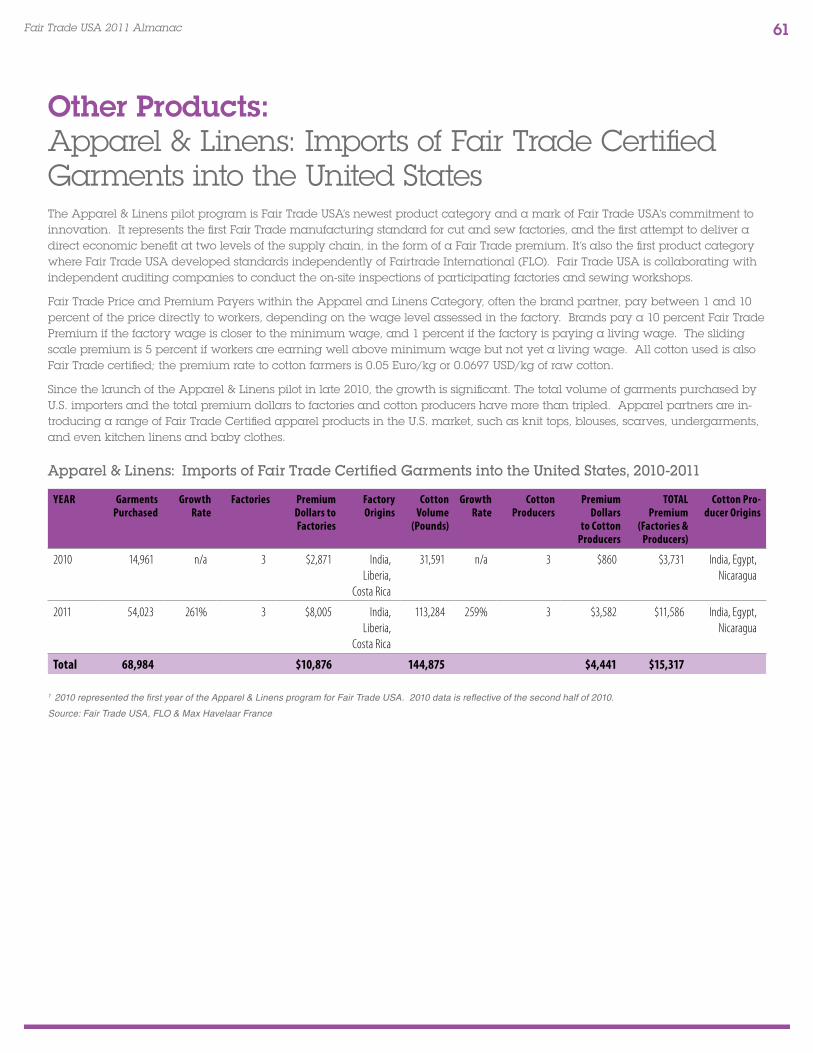
other Products: Apparel & Linens: Imports of Fair Trade Certified Garments into the United StatesThe Apparel & Linens pilot program is Fair Trade USA’s newest product category and a mark of Fair Trade USA’s commitment to innovation. It represents the first Fair Trade manufacturing standard for cut and sew factories, and the first attempt to deliver a direct economic benefit at two levels of the supply chain, in the form of a Fair Trade premium. It’s also the first product category where Fair Trade USA developed standards independently of Fairtrade International (FLO). Fair Trade USA is collaborating with independent auditing companies to conduct the on-site inspections of participating factories and sewing workshops.
Fair Trade Price and Premium Payers within the Apparel and Linens Category, often the brand partner, pay between 1 and 10 percent of the price directly to workers, depending on the wage level assessed in the factory. Brands pay a 10 percent Fair Trade Premium if the factory wage is closer to the minimum wage, and 1 percent if the factory is paying a living wage. The sliding scale premium is 5 percent if workers are earning well above minimum wage but not yet a living wage. All cotton used is also Fair Trade certified; the premium rate to cotton farmers is 0.05 Euro/kg or 0.0697 USD/kg of raw cotton.
Since the launch of the Apparel & Linens pilot in late 2010, the growth is significant. The total volume of garments purchased by U.S. importers and the total premium dollars to factories and cotton producers have more than tripled. Apparel partners are in-troducing a range of Fair Trade Certified apparel products in the U.S. market, such as knit tops, blouses, scarves, undergarments, and even kitchen linens and baby clothes.
Apparel & Linens: Imports of Fair Trade Certified Garments into the United States, 2010-2011
YEAR Garments Purchased
Growth Rate
Factories Premium Dollars to Factories
Factory Origins
Cotton Volume
(Pounds)
Growth Rate
Cotton Producers
Premium Dollars
to Cotton Producers
TOTAL Premium
(Factories & Producers)
Cotton Pro-ducer Origins
2010 14,961 n/a 3 $2,871 India, Liberia,
Costa Rica
31,591 n/a 3 $860 $3,731 India, Egypt, Nicaragua
2011 54,023 261% 3 $8,005 India, Liberia,
Costa Rica
113,284 259% 3 $3,582 $11,586 India, Egypt, Nicaragua
Total 68,984 $10,876 144,875 $4,441 $15,317
12010representedthefirstyearoftheApparel&LinensprogramforFairTradeUSA.2010dataisreflectiveofthesecondhalfof2010.Source:FairTradeUSA,FLO&MaxHavelaarFrance