
FAILURE ANALYSIS OF ADVANCED COMPOSITES …etd.lib.metu.edu.tr/upload/12616306/index.pdf · FAILURE...
90
FAILURE ANALYSIS OF ADVANCED COMPOSITES UNDER IMPACT BY COHESIVE ZONE METHOD A THESIS SUBMITTED TO THE GRADUATE SCHOOL OF NATURAL AND APPLIED SCIENCES OF MIDDLE EAST TECHNICAL UNIVERSITY BY OĞUZ DOĞAN IN PARTIAL FULFILLMENT OF THE REQUIREMENTS FOR THE DEGREE OF MASTER OF SCIENCE IN MECHANICAL ENGINEERING SEPTEMBER 2013
-
Upload
trinhtuyen -
Category
Documents
-
view
226 -
download
3
Transcript of FAILURE ANALYSIS OF ADVANCED COMPOSITES …etd.lib.metu.edu.tr/upload/12616306/index.pdf · FAILURE...
i
FAILURE ANALYSIS OF ADVANCED COMPOSITES UNDER IMPACT BY COHESIVE ZONE METHOD
A THESIS SUBMITTED TO THE GRADUATE SCHOOL OF NATURAL AND APPLIED SCIENCES
OF MIDDLE EAST TECHNICAL UNIVERSITY
BY
OĞUZ DOĞAN
IN PARTIAL FULFILLMENT OF THE REQUIREMENTS FOR
THE DEGREE OF MASTER OF SCIENCE IN
MECHANICAL ENGINEERING
SEPTEMBER 2013

ii

iii
Approval of the thesis:
FAILURE ANALYSIS OF ADVANCED COMPOSITES UNDER IMPACT BY COHESIVE ZONE METHOD
submitted by OĞUZ DOĞAN in partial fulfillment of the requirements for the degree of Master of Science in Mechanical Engineering Department, Middle East Technical University by, Prof. Dr. Canan Özgen Dean, Graduate School of Natural and Applied Sciences Prof. Dr. Süha Oral Head of Department, Mechanical Engineering Prof. Dr. K. Levend Parnas Supervisor, Mechanical Engineering Dept., METU Examining Committee Members: Prof. Dr. Haluk Darendeliler Department of Mechanical Engineering, METU Prof. Dr. K. Levend Parnas Department of Mechanical Engineering, METU Prof. Dr. Suat Kadıoğlu Department of Mechanical Engineering, METU Prof. Dr. Altan Kayran Department of Aerospace Engineering, METU Caner Taş, M. Sc. ASELSAN
Date: 04/09/2013

iv
I hereby declare that all information in this document has been obtained and presented in accordance with academic rules and ethical conduct. I also declare that, as required by these rules and conduct, I have fully cited and referenced all material and results that are not original to this work.
Name, Last name : Oğuz DOĞAN Signature :

v
ABSTRACT
FAILURE ANALYSIS OF ADVANCED COMPOSITES UNDER IMPACT BY COHESIVE ZONE METHOD
Doğan, Oğuz
M. Sc., Department of Mechanical Engineering Supervisor: Prof. Dr. K. Levend Parnas
September 2013, 76 pages
The main objective of this study is to investigate the delamination damage of laminated composites subjected to low velocity impact. Three-dimensional finite element analyses are conducted to determine delamination area, shape and location. The impact analysis is performed by using the explicit finite element method which uses the central difference rule to integrate the equations of motion through the time. The composite structures are modeled using eight-node solid elements. The critical interfaces between layers is represented by special interface elements based on Cohesive Zone Method (CZM). A combined approach considering damage initiation and damage growth phases in a single model is utilized in this method. The linear elastic and linear softening behavior is applied for these interface elements. A stress based failure criterion and damage mechanics approach are used to simulate initiation and propagation of delamination, respectively. The analyses are divided into two main sections involving the validation of computational model and parametric studies. The eight-node brick element is verified without delamination damage. Then, the model with delamination damage is validated by experimental results from literature. The verified model is adapted for the curved laminates and a parametric study is conducted in order to determine the effect of curvature on the delamination damage. Additionally, the effect of element size on delamination damage is discussed. Keywords: Delamination, Cohesive Zone Method, Impact, Laminated Composites

vi
ÖZ
DÜŞÜK HIZLI DARBE ALTINDAKİ İLERİ KOMPOZİTLERİN YAPIŞKAN ALAN YÖNTEMİ İLE YETMEZLİK ANALİZİ
Doğan, Oğuz
Yüksek Lisans, Makina Mühendisliği Bölümü Tez Yöneticisi: Prof. Dr. K. Levend Parnas
Eylül 2013, 76 sayfa
Bu çalışmada, düşük hızlı darbeye maruz kalan tabakalı kompozit yapıların tabaka ayrılması (delaminasyon) hasarı incelenmiştir. Delaminasyon alanı, şekli ve konumunu elde edebilmek amacı ile üç-boyutlu sonlu eleman analizleri gerçekleştirilmiştir. Darbe analizi, hareket denklemlerini merkezi fark yöntemi ile zamana göre integral alma ilkesini kullanan açık sonlu eleman yöntemi ile gerçekleştirilmiştir. Kompozit yapılar sekiz düğümlü katı elemanlar kullanılarak modellenmiştir. Tabakalar arasındaki kritik arayüzler Yapışkan Alan Yöntemi (YAY) ile modellenmiştir. Hasarın başlangıcını ve ilerleyişini tek bir model içinde göz önüne alan bu tümleşik yaklaşım bu çalışmada kullanılmıştır. Doğrusal elastik ve doğrusal yumuşama davranışı bu arayüz elemanlarına uygulanmıştır. Hasar başlangıcı için gerilme tabanlı yetmezlik (failure) ölçütü, hasar ilerleyişi için ise hasar mekaniği yaklaşımı kullanılmıştır. Yapılan analizler doğrulama çalışmaları ve parametrik çalışmalar olmak üzere iki ana kısma ayrılmıştır. Sekiz düğümlü katı eleman, tabaka ayrılması hasarı göz önüne alınmadan doğrulanmıştır. Sonlu eleman modeli ise tabaka ayrılması hasarı göz önüne alınarak literatürdeki deneysel çalışmalar ile doğrulanmıştır. Doğrulanan model eğri yüzeyli kompozit yapılara uygulanmış ve kavisin tabaka ayrılması hasarına olan etkisi parametrik çalışmalar ile belirlenmiştir. Ayrıca eleman boyutunun tabaka ayrılması hasarına olan etkisi de tartışılmıştır. Anahtar kelimeler: Tabaka ayrılması, Yapışkan Alan Yöntemi, Darbe, Tabakalı Kompozitler

vii
To my Family …

viii
ACKNOWLEDGEMENTS I would like to express my sincere gratitude to my supervisor Prof. Dr. Levend Parnas for his guidance, encouragements, patience and help. I would also like to thank Prof Dr. Haluk Darendeliler, Prof Dr. Suat Kadıoğlu, Prof. Dr. Altan Kayran and Caner Taş for being in my jury and expressing their very useful comments and suggestions. I am thankful to my company ASELSAN Inc. for letting and supporting my thesis. I would like to express my greatest thanks to my family for their care, support and patience throughout my studies. I also wish to present my special thanks to Burak Gözlüklü, Cem Genç, Fatma Serap Aykan, Enver Sun and Mert Atasoy. Their experience and insights enlightened me throughout this work. Also, I would like to thank TUBİTAK for providing financial support during the study.
ix
TABLE OF CONTENTS ABSTRACT ........................................................................................................................... v ÖZ.......................................................................................................................................... vi ACKNOWLEDGEMENTS ................................................................................................ viii TABLE OF CONTENTS ...................................................................................................... ix LIST OF TABLES ................................................................................................................ xi LIST OF FIGURES .............................................................................................................. xii NOMENCLATURE ............................................................................................................ xiv CHAPTERS 1. INTRODUCTION .............................................................................................................. 1 1.1 Review ...................................................................................................................... 1 1.2 Motivation ................................................................................................................ 5 1.3 Objective ................................................................................................................... 6 1.4 Content...................................................................................................................... 6 2. IMPACT THEORY ............................................................................................................ 9 2.1 Impact Phenomenon ................................................................................................. 9 2.2 Hertz’s Contact Theory ............................................................................................ 9 2.3 Analysis of Impact .................................................................................................. 13 3. DELAMINATION ANALYSIS ...................................................................................... 15 3.1 Composite Failures ................................................................................................. 15 3.2 Failure Theories ...................................................................................................... 17 3.2.1 Tsai-Hill Criterion ............................................................................................. 17 3.2.2 Tsai-Wu Criterion ............................................................................................. 17 3.2.3 Hashin Failure Criterion .................................................................................... 18 3.3 Delamination Analysis ........................................................................................... 19 3.3.1 Delamination Initiation Analysis ......................................................................... 19 3.3.2 Delamination Propagation Analysis and Approaches ....................................... 20 3.4 Measurement of Interfacial Fracture Toughness .................................................... 23 3.4.1 Mode I ............................................................................................................... 23 3.4.2 Mode II .............................................................................................................. 27 3.4.3 Mode III ............................................................................................................ 29 3.4.4 Mixed Mode ...................................................................................................... 29
x
4. COHESIVE ZONE MODEL ........................................................................................... 33 4.1 Constitutive Law for Pure Mode Cohesive Zone Model ........................................ 37 4.2 Constitutive Law for Mixed-Mode Cohesive Zone Model ..................................... 41 4.3 Cohesive Zone Method in ABAQUS/Explicit ........................................................ 45 5. SIMULATION OF IMPACT INDUCED DELAMINATION ........................................ 47 5.1 Impact without Delamination ................................................................................. 47 5.2 Impact Induced Delamination ................................................................................. 49 5.3 Parametric Study on Curved Laminated Composites ............................................. 53 5.3.1 Impact without Cohesive Elements ................................................................... 54 5.3.2 Impact with Cohesive Elements ........................................................................ 56 5.4 Effect of Element Size on Delamination ................................................................ 61 6. CONCLUSIONS AND FURTHER STUDIES ................................................................ 65 REFERENCES ..................................................................................................................... 69
xi
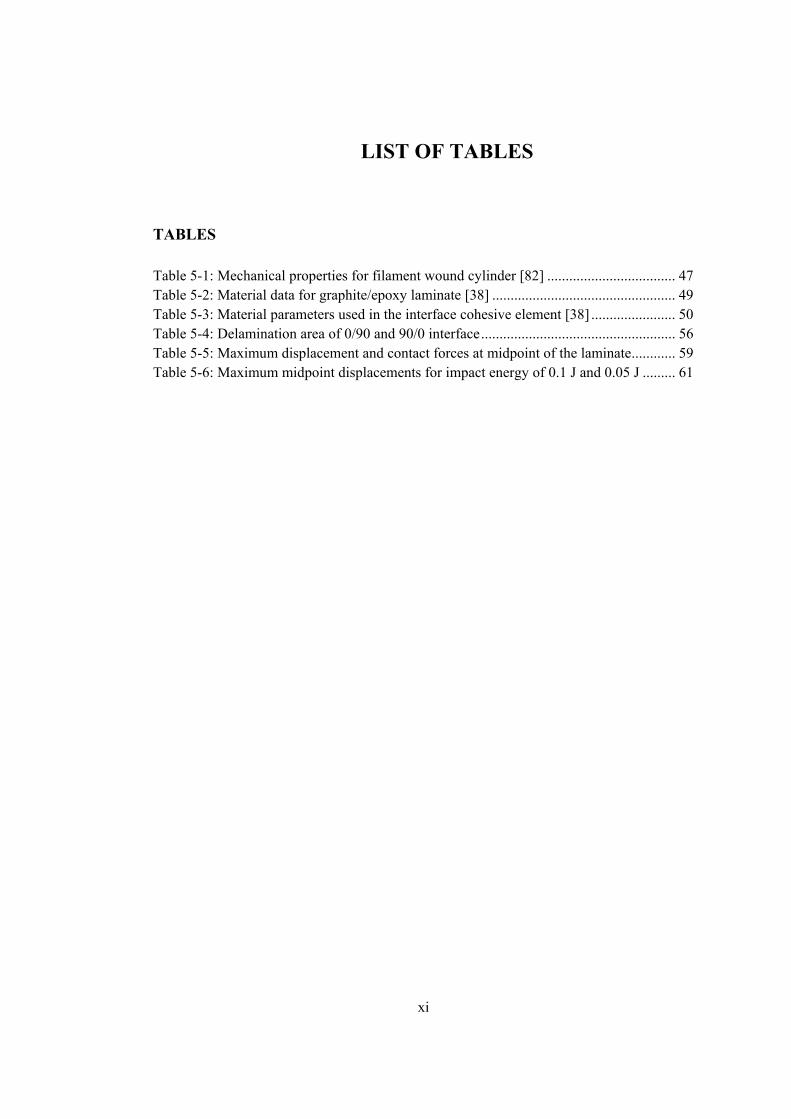
LIST OF TABLES TABLES Table 5-1: Mechanical properties for filament wound cylinder [82] ................................... 47 Table 5-2: Material data for graphite/epoxy laminate [38] .................................................. 49 Table 5-3: Material parameters used in the interface cohesive element [38] ....................... 50 Table 5-4: Delamination area of 0/90 and 90/0 interface ..................................................... 56 Table 5-5: Maximum displacement and contact forces at midpoint of the laminate ............ 59 Table 5-6: Maximum midpoint displacements for impact energy of 0.1 J and 0.05 J ......... 61
xii
LIST OF FIGURES FIGURES Figure 2-1: Contact of a spherical impactor on half-space ................................................... 11 Figure 2-2: Contact of a spherical impactor on a cylindrical composite shell ..................... 11 Figure 2-3: Contact of a spherical impactor on a spherical composite shell ........................ 12 Figure 3-1: Fiber breakage due to tensile loading ................................................................ 15 Figure 3-2: Fiber kinking...................................................................................................... 15 Figure 3-3: Matrix cracking.................................................................................................. 16 Figure 3-4: Matrix cracking and delamination ..................................................................... 16 Figure 3-5: Delamination and its types ................................................................................ 17 Figure 3-6: Delamination initiation criteria [22] .................................................................. 20 Figure 3-7: Virtual crack closure model .............................................................................. 21 Figure 3-8: Fracture modes .................................................................................................. 23 Figure 3-9: DCB test specimen ............................................................................................ 24 Figure 3-10: Fiber bridging mechanism observed in the DCB tests [61] ............................. 24 Figure 3-11: R-curve effect on a DCB test of a [0]24 CFRP laminate [1]. ........................... 25 Figure 3-12: Variation of GIc with in-plane fiber orientation angle, θ of θ/-θ interface
between UD layers [62] ...................................................................................... 25 Figure 3-13: Deflection of single arm of DCB specimen ..................................................... 26 Figure 3-14: The ENF specimen .......................................................................................... 27 Figure 3-15: End-Loaded Split (ELS) specimen .................................................................. 28 Figure 3-16: Four-point End- Notched Flexure (4ENF) specimen ...................................... 28 Figure 3-17: Mode III edge crack torsion (ECT) specimen ................................................. 29 Figure 3-18: MMB test specimen ......................................................................................... 30 Figure 3-19: Gc vs. GII/GT [71] ............................................................................................. 31 Figure 3-20: Mixed-mode fracture toughness [73] ............................................................... 32 Figure 4-1: Implementation of cohesive elements between neighboring layers .................. 33 Figure 4-2: An interface model ............................................................................................ 33 Figure 4-3: Schematic representation of bilinear traction-separation curve ......................... 34 Figure 4-4: Various traction-separation laws [73] ................................................................ 34 Figure 4-5: Normalized normal tractions vs. normalized relative opening displacement. ... 36 Figure 4-6: Normalized shear tractions vs. normalized relative tangential displacement .... 36 Figure 4-7: Flat surfaced notch in 2D deformation field ...................................................... 37 Figure 4-8: Cohesive zone ahead of delamination front for Mode I .................................... 39 Figure 4-9: Cohesive zone ahead of delamination front for Modes II and III ...................... 40 Figure 4-10: Displacements in an interface element ............................................................ 41 Figure 4-11: Mixed-mode constitutive relations [80] ........................................................... 42
xiii
Figure 5-1: Finite element model for filament wound cylinder subjected to impact ........... 48 Figure 5-2: Comparison of contact force history of cylinder subjected to impact ............... 49 Figure 5-3: FE model of [03/903]s graphite/epoxy laminate ................................................. 50 Figure 5-4: Comparison of delamination patterns at the top interface ................................. 51 Figure 5-5: Comparison of delamination pattern of the bottom interface ............................ 52 Figure 5-6: Comparison of delamination patterns of the bottom interface .......................... 53 Figure 5-7: Schematic representation of curved laminate .................................................... 54 Figure 5-8: Midpoint displacements of curved plates without cohesive elements ............... 55 Figure 5-9: Contact forces without cohesive elements ......................................................... 55 Figure 5-10: Contact forces vs. midpoint displacement without cohesive elements ............ 56 Figure 5-11: Variation of delamination area with radius of curvature ................................. 57 Figure 5-12: Delamination at top (0/90) interface (R = 100 mm) ........................................ 57 Figure 5-13: Delamination at bottom (90/0) interface (R = 100 mm) .................................. 58 Figure 5-14: Cross-section view (R = 100 mm) ................................................................... 58 Figure 5-15: Contact force history with cohesive elements ................................................. 59 Figure 5-16: Midpoint displacement of the curved plates with cohesive elements .............. 60 Figure 5-17: Maximum midpoint deflections vs. radius of the laminate ............................. 60 Figure 5-18: Effect of element size on delamination pattern ............................................... 64

xiv
NOMENCLATURE Interface element properties
strain energy release rate (N/mm) critical strain energy release rate (N/mm)
interface element stiffness prior to damage initiation (N/mm3) interfacial traction (MPa) , , interfacial strength (MPa) interface element relative displacement (mm) interface element relative displacement at damage onset (mm) interface element relative displacement at final failure (mm)
d linear damage variable φ relative displacement ratio (δ / δI) α power law exponent η BK criterion exponent Laminate material properties
, , Young’s moduli (MPa) , , shear moduli (MPa) , , Poisson’s ratios,
(subscripts 1, 2 and 3 denote the principal material axes) Laminate geometric properties a initial crack length(mm)
laminate half thickness (mm) laminate width (mm) mixed mode ratio
1
CHAPTER 1
INTRODUCTION 1.1 Review
Advanced composite materials are used in various industrial applications as primary structures due to attractive properties such as high specific strength, high specific stiffness, toughness, mechanical damping, chemical, corrosion resistance. Aerospace and military industries have tremendous interest in composites to overcome challenging environmental problems and meet superior system requirements. Hence, composite materials are regarded as a substitution for conventional materials. Despite of their virtues, complexity of their structure constitutes an obstacle to understand failure modes and limits. Material limits should be determined accurately in order to utilize material effectively and at the same time guarantee the safety of the parts. Consequently, ability to model the damage in a composite structure is important in order to meet challenging demands. The most widely used type of composites for structural applications is the laminated composites. They are manufactured by stacking a number of layers with specific fiber orientation and impregnating them with an appropriate matrix system. It is known that common failure modes of laminated composite structures are fiber tension/compression failure, matrix tension/compression failure, interlaminar failures, and fiber-matrix debonding. Interface failures are known as separation along the interfaces of successive layers which is generally called as delamination. Among all these, delamination is the most dangerous and insidious common failure type that can be observed in composite materials. Common sources of this failure are material and structural discontinuities such as free edge effects, ply drop-offs, stiffener terminations, skin-stiffener flange interfaces, bonded/bolted joints, holes; local disturbances during manufacturing and in service such as drilling, impact of foreign objects; variations in temperature and moisture and internal failure mechanisms such as matrix cracking which gives rise to considerable interlaminar stresses [1], [2]. Most of the time, delamination cannot be detected by naked eye but, mechanical behavior of the structure is significantly changed with delamination for example by degrading its stiffness. The structure can survive on after series of loadings and maintain its integrity. However, delamination is propagated and reaches a critical value with compressive loading and the structures become more susceptible to buckling. Therefore, delamination is one of the most dangerous and destructive failure modes [3].
2
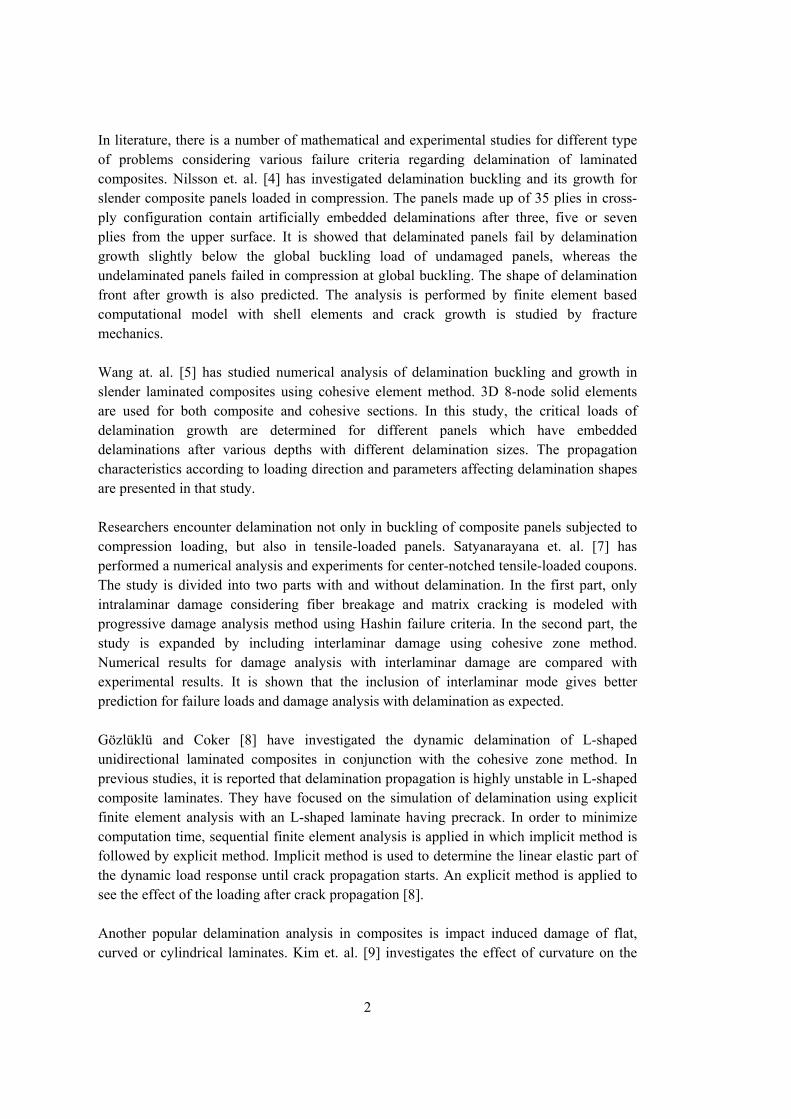
In literature, there is a number of mathematical and experimental studies for different type of problems considering various failure criteria regarding delamination of laminated composites. Nilsson et. al. [4] has investigated delamination buckling and its growth for slender composite panels loaded in compression. The panels made up of 35 plies in cross-ply configuration contain artificially embedded delaminations after three, five or seven plies from the upper surface. It is showed that delaminated panels fail by delamination growth slightly below the global buckling load of undamaged panels, whereas the undelaminated panels failed in compression at global buckling. The shape of delamination front after growth is also predicted. The analysis is performed by finite element based computational model with shell elements and crack growth is studied by fracture mechanics. Wang at. al. [5] has studied numerical analysis of delamination buckling and growth in slender laminated composites using cohesive element method. 3D 8-node solid elements are used for both composite and cohesive sections. In this study, the critical loads of delamination growth are determined for different panels which have embedded delaminations after various depths with different delamination sizes. The propagation characteristics according to loading direction and parameters affecting delamination shapes are presented in that study. Researchers encounter delamination not only in buckling of composite panels subjected to compression loading, but also in tensile-loaded panels. Satyanarayana et. al. [7] has performed a numerical analysis and experiments for center-notched tensile-loaded coupons. The study is divided into two parts with and without delamination. In the first part, only intralaminar damage considering fiber breakage and matrix cracking is modeled with progressive damage analysis method using Hashin failure criteria. In the second part, the study is expanded by including interlaminar damage using cohesive zone method. Numerical results for damage analysis with interlaminar damage are compared with experimental results. It is shown that the inclusion of interlaminar mode gives better prediction for failure loads and damage analysis with delamination as expected. Gözlüklü and Coker [8] have investigated the dynamic delamination of L-shaped unidirectional laminated composites in conjunction with the cohesive zone method. In previous studies, it is reported that delamination propagation is highly unstable in L-shaped composite laminates. They have focused on the simulation of delamination using explicit finite element analysis with an L-shaped laminate having precrack. In order to minimize computation time, sequential finite element analysis is applied in which implicit method is followed by explicit method. Implicit method is used to determine the linear elastic part of the dynamic load response until crack propagation starts. An explicit method is applied to see the effect of the loading after crack propagation [8]. Another popular delamination analysis in composites is impact induced damage of flat, curved or cylindrical laminates. Kim et. al. [9] investigates the effect of curvature on the
3
dynamic response and impact-induced damage in composite structures with different stacking sequences. The delamination of curved laminates and plates are predicted using a stress based failure criteria. It is reported that the delamination region in cylindrical panels are larger than those of plates subjected to the same impact conditions. Her and Liang [10] perform similar analysis on cylindrical and spherical composite shells. The effect of shell curvature is investigated under different boundary conditions with different impactor velocities. In addition, they use a stress based failure criteria suggested by Choi and Chang for assessing delamination. Similarly, Changliang et. al. [11] focused on the delamination prediction of filament wound vessels with a metal liner considering internally pressurized and empty cases under low velocity impact using a stress based failure criterion, which is proposed by Chang and Chang [12]. They put forward the fact that the impact damage of internally pressurized filament wound vessels with a metal liner is more susceptible to induce delamination under low velocity impact. Chakraborty [13] investigates multiple impacts on flat composite laminates by cylindrical impactor using the same procedure. Effect of time interval between successive impacts on the plate is investigated in this study. It is stated that the individual delaminations grows into one big delamination by coalescing when the interval between successive impacts is shortened. Zhang et. al. [14] has studied low velocity impact in composite laminated plates to predict the initiation and the propagation of delamination. In that study, the matrix cracking is also predicted at specified locations based on observation on the experiments. The surface based cohesive zone model is implemented in finite element model by means of a user-defined subroutine. The cohesive zone model combines the initiation and the propagation of delamination using stress-based criterion and damage mechanics, respectively. The stress-based initiation criterion is nothing but the quadratic interaction failure criteria. The power law is used in the context of damage mechanics which indirectly uses fracture mechanics. The test specimen is in the configuration of 0 /90 . One of the important observations in their experiments is that the delamination is developed only between layers of different orientation. Delaminations occur only at the lower interface between middle and lower sublaminates in the shape of peanut. Therefore, the middle and lower sublaminates are bonded together using the damage model as a contact behavior at the interface. In addition to that, the matrix cracking is also observed at lower sublaminates extending in the direction of the fibers due to bending effect. The surface-based cohesive zone is applied at lower sublaminate where it is experimentally observed. The half model is prepared for plate and impactor since there is a geometrical and material symmetry. It is important to note that the matrix cracking cannot be simulated in quarter finite element model maintaining material symmetry. The impactor and plate is modeled using eight-node linear elements, which is included in their commercial finite element program ABAQUS, with reduced integration and hourglass control (C3D8R). Three different impact velocities are used in numerical simulations. The results are compared with experimental data under the basis of maximum length and width of delamination and the reasonable agreement is said to be obtained.
4
Shi et. al. [15] has modeled the impact damage of composite laminates under low velocity impact and has investigated the damage experimentally and numerically. In the model, each lamina is represented by two 8-node linear brick elements and interface cohesive elements are inserted between neighboring plies to simulate delamination. A contact algorithm is used to simulate contact between the impactor and the laminate. Besides, contact between layers is defined using appropriate contact properties with various friction coefficients. The delamination onset is estimated by quadratic interaction criterion whereas cohesive zone method is applied for the propagation of delamination with Benzeggagh–Kenane (BK) criterion [71] to define the mixed-mode behavior of the interface. Secondly, the intra-laminar failure is predicted using Hashin failure criterion for the initiation of the damage. Moreover, the damage mechanics based on strain failure criterion is used to predict the damage propagation in tensile and compressive failure modes both for fiber and matrix by gradually degrading the material properties. The carbon fiber and epoxy resin is used for composite specimens with stacking sequence of 0/90 . The finite element model for the plate is constructed by using two eight-node brick elements (C3D8) through thickness direction for each ply. X-ray radiographs and predicted delamination areas for different impact energies are compared and it is showed that the overall damage areas are in agreement with experimental data. One of the popular subjects regarding the delamination of composite structures is impact damage of composite helmets. In literature, the concept of Head Injury Criterion (HIC) is introduced for the judgment of the protective performance of the helmets. Kostopoulos et. al. [16] states that a well-designed helmet must be able to absorb as much energy as possible and diffuse it to the whole helmet in order to provide a better protection against impacts. They mainly focus on the impact performance of motorcycle safety helmets consisting of a composite shell and a polystyrene liner. Using a finite element simulation, the effect of different materials combinations for the composite shell is investigated. The delamination is simulated using the stress based delamination condition provided by Hallquist [17], [18]. It is shown that delamination absorbs 7.7, and 12% of the total impact energy of 150J for glass-, carbon- and Kevlar-fiber shells; respectively. The Kevlar-fiber configuration experiences more extensive matrix cracking and delamination due to relatively lower shear strength and stiffness values. As a result of damage analysis with delamination failure, it is stated that the Kevlar-fiber configuration provides lower HIC values compared to carbon- and glass-fiber configurations. Similarly, Pinnoji and Mahajan [19] numerically investigate the performance of composite helmets under impact. They conduct a study which includes both in-plane damage using Hashin failure criteria and delamination using cohesive zone method instead of stress based method. They establish the effectiveness of the finite element model by comparing experimental results from literature. High velocity impact is another subject about the delamination of composite structures. Oka et. al. [20] focus on the high velocity impact damage on CFRP laminates considering foreign object damage in blades of a turbo fan engine. The surface and internal damages in

5
CFRP laminate is observed by using optical microscopy together with radiography. Additionally, finite element analysis is carried out to simulate the damage. The laminates are tested with projectile having velocity of 200 or 400 m/s. Oka et. al. [20] uses cohesive elements to express the delamination and use the maximum stress fracture criteria to simulate the intralaminar failure. Simulated front and back surface damages and simulated delamination areas are in good agreement with experimental results. A considerable attention has been paid to a relatively new approach called the Peridynamic Method, which can be used in structural analyses involving fracture [21]. This method is developed to overcome the limitations of finite element method in calculating the partial differential equations around discontinuities, cracks or any other singularities. The peridynamic theory utilizes integral equations, while the finite element methods are based on differential equations. Therefore, it is said that the peridynamic methods does not have limitations in evaluating displacement at discontinuities and at singularities. The model is constructed by particles which are in interaction with each other by means of central forces or bonds. The damage of the material is based on the amount of stretching of the bonds. When the stretching reaches and exceeds the critical stretch value, the bonds are broken so that the irreversible damage is introduced. It is mentioned that this method is successfully used in failure analysis of composite laminates [21]. Askari et. al. [21] has investigated the mechanical behavior of the composite laminates through two different problems: the large-notch tension tests and the low velocity impact tests. It is said that the damage predictions agree well with experimental results. The selected studies are introduced with the aim of expressing the diversity of the delamination related subjects in structural applications. The brief information about the distinguishing features of the studies is also given in this part. The mentioned studies remain limited to divide the damage analysis approaches of composite structures into subgroups since there are extensive amount of work on this topic. However, it can be broadly classified into three groups of approaches as failure criteria approach, fracture mechanics approach and cohesive zone approach. Since it combines the initiation and propagation of crack within one model, Cohesive Zone Method is found popular among these approaches where the structure is initially undamaged. 1.2 Motivation
Delamination is frequently observed in composite structures in various forms. Mishandling, accidents in service, storage, maintenance or manufacturing such as tool drops, foreign object damage and hailstone strikes are the main sources of delamination. It is well known that the low velocity impact can easily lead to delamination in composite structures and it is insidiously developed with the structure [10], [22-27]. Moreover it is often regarded as a precursor to catastrophic failure [28]. Furthermore, according to a survey by IATA concerning problems of aircrafts almost 60% of all damages detected in composite structures are because of impact [29]. Therefore, the knowledge of delamination phenomena and the modeling of delamination always deserve significant attention by
6
researchers due to its importance in engineering applications and also its challenging characteristics. The motivation behind this study is to perform finite element modeling of delamination failure providing visualization of delamination from initiation to propagation by using Cohesive Zone Method. The advantage of Cohesive Zone Method over other widely used methods is to be discussed in Chapter 3. Using this method the approximate behavior of delamination is represented by interface elements modeled between laminas which are constructed by solid elements. 1.3 Objective
The main objective of this study is to investigate the delamination analysis of a laminated composite under low velocity impact by modeling layers and interfaces using 3D solid stress elements and solid cohesive elements, respectively. The finite element model is to be validated with studies already conducted numerically and experimentally. After validation works, the effect of curvature on delamination is investigated for curved laminates by using cohesive zone method to simulate the behavior of the interface. Then, the effect of mesh size on delamination area is investigated in curved laminate. 1.4 Content
The thesis is organized in six chapters. In Chapter 1, delamination is defined and explained with various numerical and experimental studies on different delamination related subjects. Also, methods used in those researches are briefly explained. Chapter 2 is devoted to the impact theory. Numerical methods are also introduced in order to calculate the contact forces developed under low velocity impact. The comparison between numerical methods is presented at the end of that chapter. Chapter 3 includes brief information on the type of failure in advanced composites and general failure criteria. This chapter mainly focuses on methodologies for the analysis of delamination failure. In addition to failure types and methodologies, the interfacial fracture toughness in pure modes and mixed modes are also discussed since those parameters are used in delamination analysis. Moreover, the related tests for determination of fracture toughness in pure and mixed mode are explained in that chapter. The Cohesive Zone Method is discussed in Chapter 4 in detail. The constitutive laws for pure and mixed mode Cohesive Zone Method are presented within the framework of damage mechanics. In Chapter 5, the finite element model without cohesive zone is firstly constructed with solid elements. These results are validated with previous studies in terms of contact force history. Secondly, the Cohesive Zone Method is applied on a specific problem found in literature which is about delamination analysis of a composite plate under impact. After obtaining similar results compared to that study, a new parametric study is conducted in

7
which the effects of curvature and mesh size on delamination is investigated for curved laminates. Chapter 6 is dedicated for the interpretation of computational results and comparison of these results with literature. Future works are also presented at the end of that chapter.

8

9
CHAPTER 2
IMPACT THEORY 2.1 Impact Phenomenon
Impact is a transient loading when two or more bodies collide which occurs in a short period of time. A pressure develops between colliding bodies in a small contact area. This pressure results in local deformation in each body during contact period. The local deformation varies according to relative velocities, material properties of the bodies and boundary conditions [30]. The impact response of materials is categorized according to their velocities such as low, intermediate, high/ballistic and hyper velocity impacts. Low Velocity Impact (LVI) is generally experienced at velocities below 10 m/s due to tool drop or foreign object damages. Motion of the whole structure is observed during LVI. High velocity impact typically ranges from 50 m/s to 1000 m/s due to gun fire or certain explosion in which the damage is localized because the structure does not have enough time to respond and the impact response is almost independent of boundary conditions since impact event finalizes before stress waves develops throughout the structure. In hyper velocity impact, the projectile velocity is approximately 2-5 km/s which are studied in space applications [31]. 2.2 Hertz’s Contact Theory
In order to understand the damage of a composite structure subjected to impact, the contact force applied by the impactor is an important parameter. In general, impact between two bodies occurs in very short period of time that is measured in some milliseconds. Hence, efforts on evaluating the contact force history rather than only contact force is vital for progressive damage analysis. Contact between two isotropic solids was first studied by Hertz. The equation is known as Hertz Contact Law which relates motion of the target and the impactor to contact force as,
/ (2.1) where is the contact force, is the contact stiffness and α is the depth of indentation. Indentation is defined at a time, , as the motion of impactor relative to target as
(2.2)
10
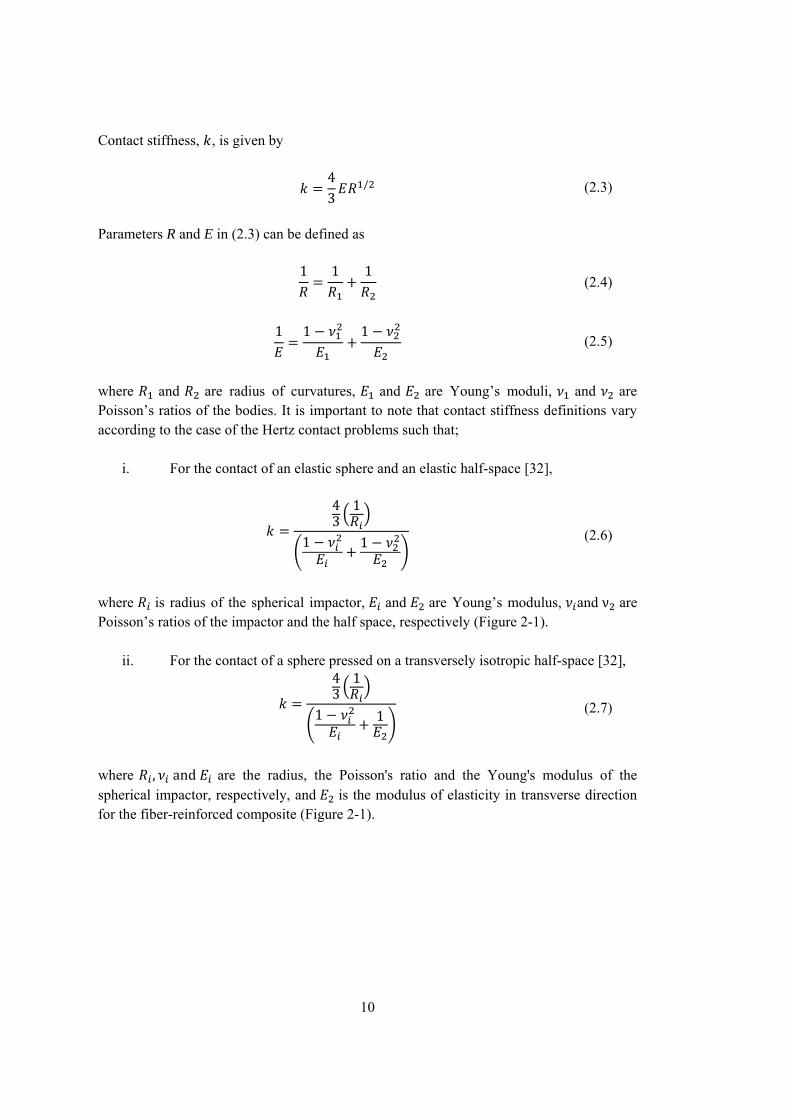
Contact stiffness, , is given by
43
/ (2.3)
Parameters R and E in (2.3) can be defined as
1 1 1 (2.4)
1 1 1
(2.5)
where and are radius of curvatures, and are Young’s moduli, and are Poisson’s ratios of the bodies. It is important to note that contact stiffness definitions vary according to the case of the Hertz contact problems such that;
i. For the contact of an elastic sphere and an elastic half-space [32],
43
1
1 1 (2.6)
where is radius of the spherical impactor, and are Young’s modulus, and ν are Poisson’s ratios of the impactor and the half space, respectively (Figure 2-1).
ii. For the contact of a sphere pressed on a transversely isotropic half-space [32], 43
1
1 1 (2.7)
where , and are the radius, the Poisson's ratio and the Young's modulus of the spherical impactor, respectively, and is the modulus of elasticity in transverse direction for the fiber-reinforced composite (Figure 2-1).

11
Figure 2-1: Contact of a spherical impactor on half-space
iii. For the contact of a sphere pressed on a cylindrical composite shell [10], [33],
43
1 12
1 1 (2.8)
where , , and are the radius, the Poisson's ratio, the Young's modulus of the spherical impactor and the radius of the cylindrical composite shell, respectively. is the modulus of elasticity in transverse direction for the fiber-reinforced composite (Figure 2-2).
Figure 2-2: Contact of a spherical impactor on a cylindrical composite shell
12
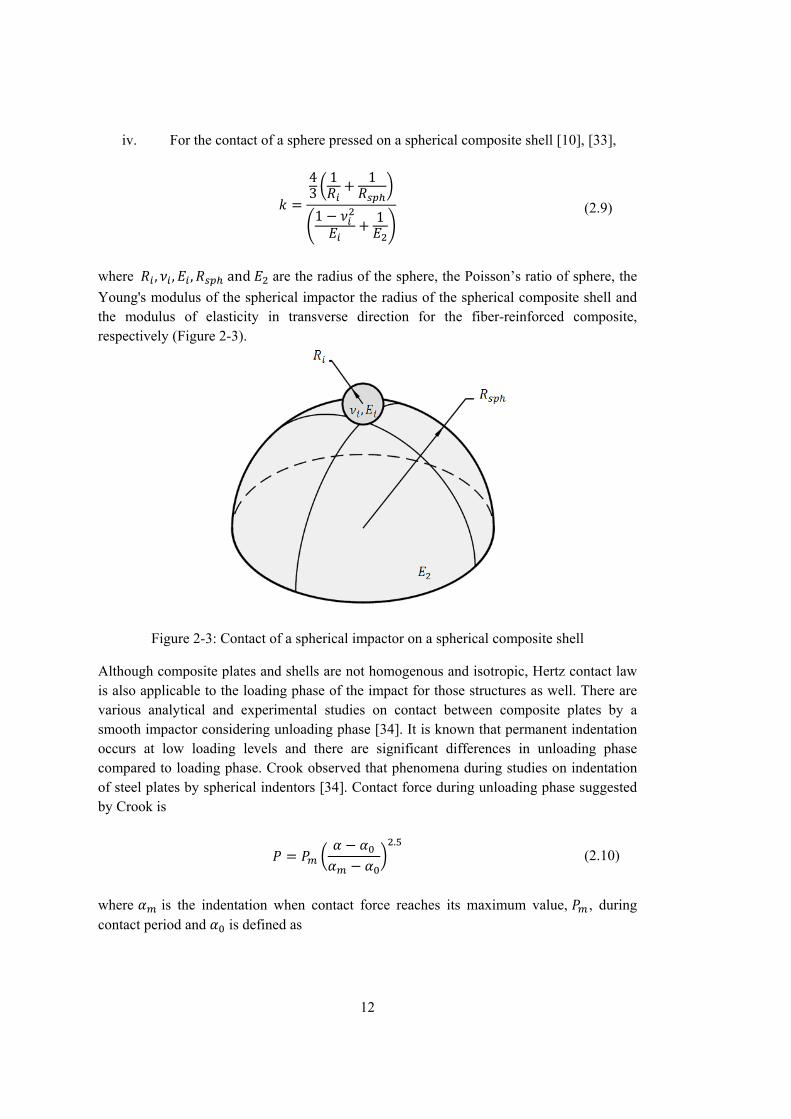
iv. For the contact of a sphere pressed on a spherical composite shell [10], [33],
43
1 1
1 1 (2.9)
where , , , and are the radius of the sphere, the Poisson’s ratio of sphere, the Young's modulus of the spherical impactor the radius of the spherical composite shell and the modulus of elasticity in transverse direction for the fiber-reinforced composite, respectively (Figure 2-3).
Figure 2-3: Contact of a spherical impactor on a spherical composite shell
Although composite plates and shells are not homogenous and isotropic, Hertz contact law is also applicable to the loading phase of the impact for those structures as well. There are various analytical and experimental studies on contact between composite plates by a smooth impactor considering unloading phase [34]. It is known that permanent indentation occurs at low loading levels and there are significant differences in unloading phase compared to loading phase. Crook observed that phenomena during studies on indentation of steel plates by spherical indentors [34]. Contact force during unloading phase suggested by Crook is
. (2.10)
where is the indentation when contact force reaches its maximum value, , during contact period and is defined as
13
0
(2.11)
1/
(2.12)
is the critical indentation which is determined by experiments.
2.3 Analysis of Impact
The characteristics of the composite structures under impact can be investigated by experimental or numerical methods. The large number of configuration can be generated during design stage by changing the orientation of plies and their stacking sequence. Consequently, these vast number of alternatives need to be tested. However, numerical methods are generally preferable on experimental studies because manufacturing and experimental costs are relatively high for composite materials. The finite element method is the most popular and commonly used computational tool. The solution of finite element methods can be classed as implicit and explicit for structures under time varying loads such as impact. It is known that MARC, ANSYS, NASTRAN, ABAQUS can solve impact problems. In this study, ABAQUS is used as computational tool which provides both implicit (ABAQUS/standard) and explicit (ABAQUS/explicit) solutions for impact problems. The implicit method incrementally solves the equations by using Newton-Raphson iterative method. The explicit method solves the equation of motion in the dynamic problems by using central difference integration rule. It is known that the implicit method has numerical difficulties in converging. It requires many iterations to satisfy the contact conditions. The inversion of the global stiffness matrix is also required which is a computationally expensive operation in implicit method. Additionally, the convergence is generally not guaranteed for three dimensional problems. However, the explicit method is inexpensive since only the inversion of diagonal mass matrix is required. It can be easily diagonalized so that its inversion is trivial. The iterations are not also needed to solve the equation of motion in explicit procedure. Nevertheless, the explicit method requires relatively small time increments comparing to implicit procedure [89]. For convergence, the time increment should be selected less than the time require for stress wave to cross the smallest element. Although it takes thousands of increment to solve the problem, the explicit method is more robust and efficient for dynamic problems including contact [89]. Therefore, ABAQUS/explicit is to be used in this study with the default explicit settings and contact algorithm. The contact stiffness can be calculated according to the impact configuration by using Eqns. (2.6)-(2.9) and it can be incorporated into FEM solver.

14
15
CHAPTER 3
DELAMINATION ANALYSIS 3.1 Composite Failures
Laminated composites exhibit complex damage patterns which are generally difficult to detect and quite different compared to isotropic materials. Types of damage in laminated composites can be classified into two groups: intra-laminar and inter-laminar failures [15]. Intra-laminar failure modes are fiber tensile damage, fiber compression damage, matrix tensile damage, matrix compression damage and fiber matrix debonding. Inter-laminar failure occurs between adjacent plies and is also called as delamination. Although these failure mechanisms can occur individually, a combination of them can also be observed [35].
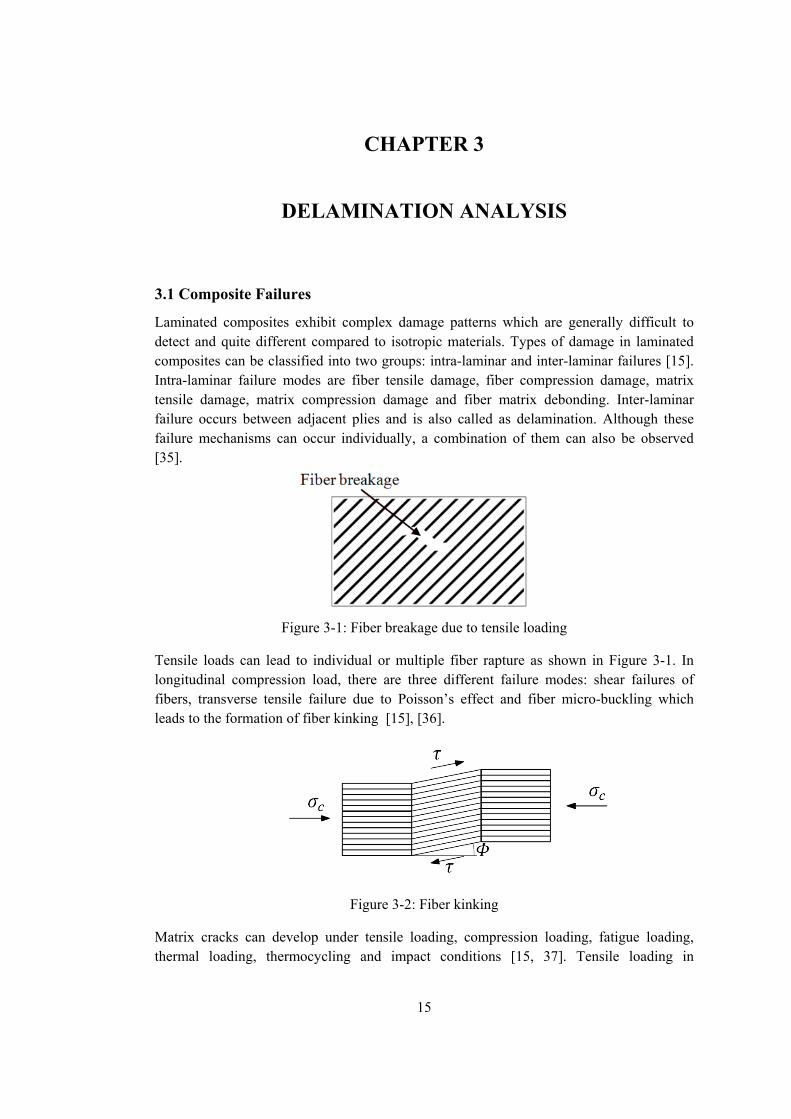
Figure 3-1: Fiber breakage due to tensile loading
Tensile loads can lead to individual or multiple fiber rapture as shown in Figure 3-1. In longitudinal compression load, there are three different failure modes: shear failures of fibers, transverse tensile failure due to Poisson’s effect and fiber micro-buckling which leads to the formation of fiber kinking [15], [36].
Figure 3-2: Fiber kinking
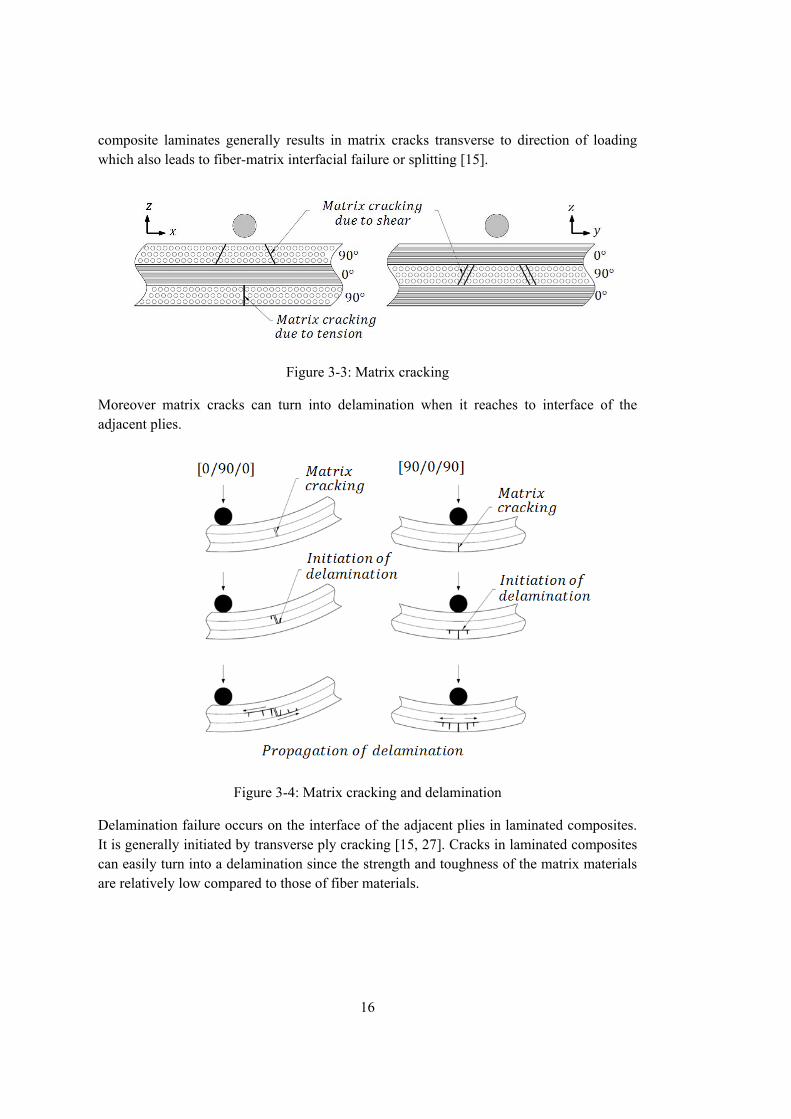
Matrix cracks can develop under tensile loading, compression loading, fatigue loading, thermal loading, thermocycling and impact conditions [15, 37]. Tensile loading in
16
composite laminates generally results in matrix cracks transverse to direction of loading which also leads to fiber-matrix interfacial failure or splitting [15].
Figure 3-3: Matrix cracking
Moreover matrix cracks can turn into delamination when it reaches to interface of the adjacent plies.
Figure 3-4: Matrix cracking and delamination
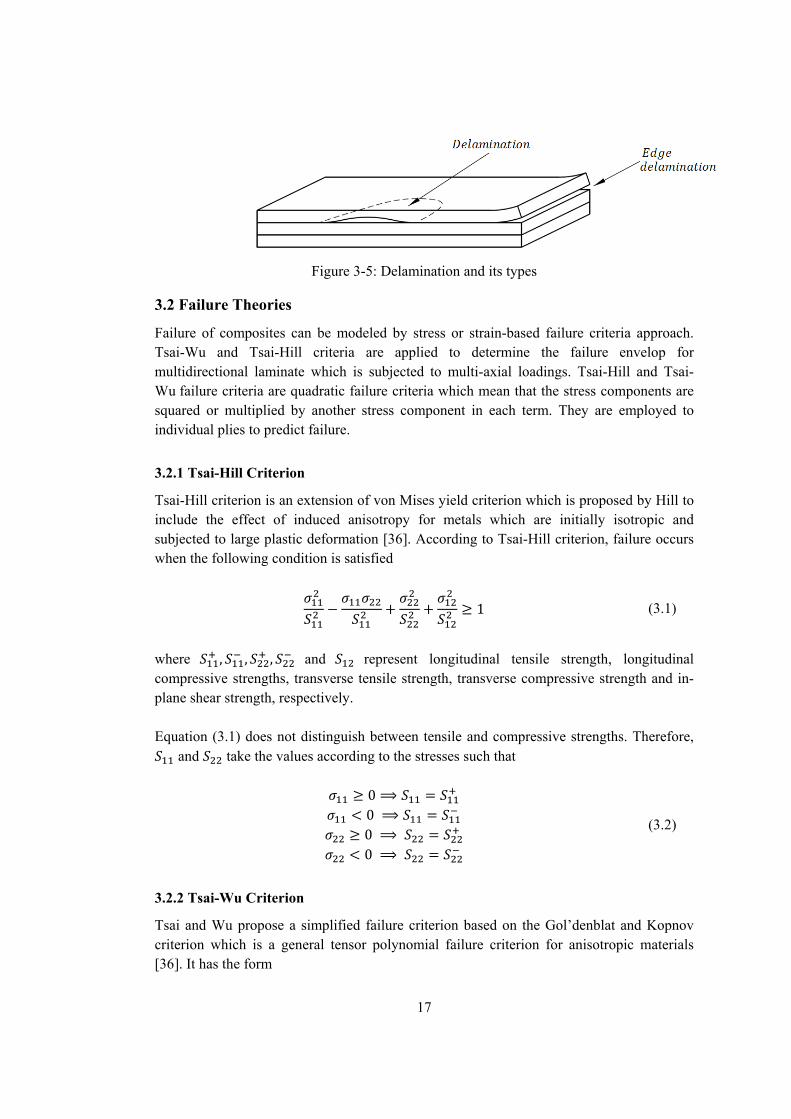
Delamination failure occurs on the interface of the adjacent plies in laminated composites. It is generally initiated by transverse ply cracking [15, 27]. Cracks in laminated composites can easily turn into a delamination since the strength and toughness of the matrix materials are relatively low compared to those of fiber materials.
17
Figure 3-5: Delamination and its types
3.2 Failure Theories
Failure of composites can be modeled by stress or strain-based failure criteria approach. Tsai-Wu and Tsai-Hill criteria are applied to determine the failure envelop for multidirectional laminate which is subjected to multi-axial loadings. Tsai-Hill and Tsai-Wu failure criteria are quadratic failure criteria which mean that the stress components are squared or multiplied by another stress component in each term. They are employed to individual plies to predict failure.
3.2.1 Tsai-Hill Criterion
Tsai-Hill criterion is an extension of von Mises yield criterion which is proposed by Hill to include the effect of induced anisotropy for metals which are initially isotropic and subjected to large plastic deformation [36]. According to Tsai-Hill criterion, failure occurs when the following condition is satisfied
1 (3.1)
where , , , and represent longitudinal tensile strength, longitudinal compressive strengths, transverse tensile strength, transverse compressive strength and in-plane shear strength, respectively. Equation (3.1) does not distinguish between tensile and compressive strengths. Therefore,
and take the values according to the stresses such that
0 0 0 0
(3.2)
3.2.2 Tsai-Wu Criterion
Tsai and Wu propose a simplified failure criterion based on the Gol’denblat and Kopnov criterion which is a general tensor polynomial failure criterion for anisotropic materials [36]. It has the form

18
2 1 (3.3) where , , and are defined as
1 1
1 1
1
1
(3.4)
and can be defined in two different ways such that
i. Under equal biaxial tensile loading
12
1 (3.5)
ii. Tsai and Hahn propose an approximation [36]
12
(3.6)
3.2.3 Hashin Failure Criterion
Although the Tsai-Hill and Tsai-Wu criteria cannot distinguish between fiber or matrix failure [15], Hashin failure criterion is widely used to model intra-laminar failure modes such as fiber damage in tension and compression and matrix tensile and compressive failure for a unidirectional composite.
i. Tensile fiber failure,
σS
σ σS
1 (3.7)
ii. Compressive fiber failure,
σS
σ σS
1 (3.8)

19
iii. Tensile matrix failure for σ σ 0,
σ σS
σ σ σS
σ σS
1 (3.9)
iv. Compressive matrix failure for σ σ 0,
2
1σ σ
4σ σ σ σ σ
1 (3.10)
Hashin failure criterion is the most suitable criterion since individual in-plane failure modes can be evaluated separately. However, fiber failure does not always occur in low velocity impact problems [38]. It is mentioned that the fiber failure is not experienced for impact energy lower than 8 J in specific experiments conducted in [38] which is to be used in comparison of our finite element model. Therefore, it is assumed that intralaminar damage does not develop in current analysis which only deals with low velocity impact. 3.3 Delamination Analysis
Delamination process is generally divided into two phases such as initiation and propagation. In this section, the approaches to initiation and propagation stages of delamination are discussed. 3.3.1 Delamination Initiation Analysis
Delamination initiation analysis is generally based on strength of material methods [1], [22], [39], [40]. The onset of delamination is predicted by some criteria (Figure 3-6) which compare the interfacial tractions with interfacial strengths. According to the maximum stress criterion, delamination initiation occurs when an interlaminar traction exceeds its respective interfacial strength. The maximum stress criterion does not take into account the interaction of the traction components. However, the quadratic interaction, which is most widely used in mixed-mode initiation problems, takes into account the interaction of the traction components. Camanho et al. [22] also proposes a criterion for delamination initiation and it is stated that the values predicted by the new criterion are very close to the quadratic interaction criterion.

20
Figure 3-6: Delamination initiation criteria [22]
3.3.2 Delamination Propagation Analysis and Approaches
The delamination propagation analysis differs from initiation analysis with the method used. Fracture mechanics (FM) and damage mechanics (DM) are the most widely used approaches utilized in the delamination propagation analysis. In the fracture mechanics (FM) approach, the strain energy release rate is compared with the fracture toughness of material and it determines the state of delamination such as no growth, stable growth or unstable growth [41]. The fracture toughness of the interface depends on the materials and the orientations of the neighboring plies so it is considered as a material property [42]. There are different FM approaches to calculate the strain energy release rate namely: the finite crack extension method, the virtual crack extension method, J-integral method, an equivalent domain integral method and the virtual crack closure method [43] in which the calculation procedures are slightly different. The virtual crack closure technique (VCCT) [1, 43-51] is widely used for the prediction of delamination growth in composite materials by evaluating the energy release rates. It is first proposed by Rybicki and Kanninen based on Irwin’s crack closure integral [43,44]. VCCT is based on Irwin’s crack closure integral [87]. The Irwin’s first assumption states that energy ∆E released when a crack extends a small amount by ∆a from a to a ∆a is equal to the work required to close the crack from a ∆a to a (Figure 3-7) [1, 43].
21
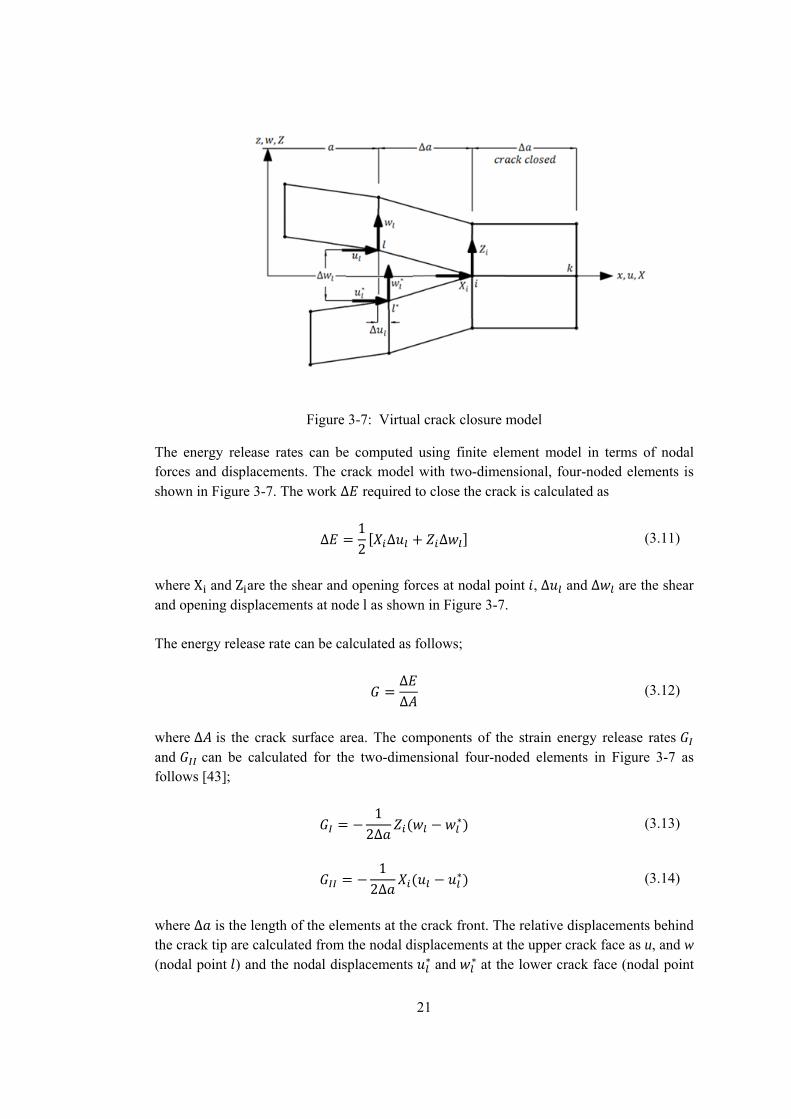
Figure 3-7: Virtual crack closure model
The energy release rates can be computed using finite element model in terms of nodal forces and displacements. The crack model with two-dimensional, four-noded elements is shown in Figure 3-7. The work ∆ required to close the crack is calculated as
∆12
∆ ∆ (3.11)
where X and Z are the shear and opening forces at nodal point , ∆ and ∆ are the shear and opening displacements at node l as shown in Figure 3-7. The energy release rate can be calculated as follows;
∆∆
(3.12)
where ∆ is the crack surface area. The components of the strain energy release rates and can be calculated for the two-dimensional four-noded elements in Figure 3-7 as follows [43];
12∆
(3.13)
1
2∆ (3.14)
where ∆ is the length of the elements at the crack front. The relative displacements behind the crack tip are calculated from the nodal displacements at the upper crack face as u, and w (nodal point ) and the nodal displacements and at the lower crack face (nodal point

22
), respectively [43]. Note that the crack surface ∆ created is calculated as ∆ ∆ x 1, where it is assumed that the model is of unit thickness.
For VCCT, it is stated [1] that when fine meshes are used and the dimensions of the elements are equal at the crack tip, the energy release rates can be easily computed. König et. al. [52] uses VCCT to predict delamination growth in plates using three-dimensional layered element with eight nodes. The plates have delamination of 10-mm diameter and they are also subjected to tension and compression. It is mentioned in [1] that delamination growth predictions are in good agreement with the experimental results. Although the use of three-dimensional elements eliminates the dependence of the results on the shear deformation assumptions, this finite element models generally require intensive computing [1]. VCCT is applied in various engineering problems for fracture of composite structures such as compression after impact [35]. The studies on fracture of composite structures with different element types using VCCT are summarized by Krueger [43] and can be referred for further information. Although VCCT is extensively used to predict delamination propagation, it has drawbacks limiting its use. First of all, there exist numerical instabilities due to oscillatory character around the singular crack tip stress field and it is also quite mesh dependent method [53]. It is recommended to select crack tip element size between 1/2 and 1/4 of the ply thickness [54,55]. Moreover, crack propagates in a self-similar form which is not the case in many problems. One of the restrictions of using VCCT is that it does not predict delamination initiation. Hence, initial delamination must be defined if VCCT is to be applied. However, it is known that the exact location of delamination front is quite difficult to estimate [1]. Considering these limitations, VCCT is often prevented from being applied in many important delamination problems such as delamination due to impact. In damage mechanics (DM) approach, delamination propagation can be numerically simulated using the cohesive crack model which deals with a cohesive zone developed near the crack front [22]. Cohesive zone method, which is to be discussed in detailed in Chapter 4, basically relates tractions to separations at the interface where a crack exists. Damage propagation is related to the fracture mechanics such that when the area under the traction/separation curve is equal to the fracture toughness of the interface [22]. If the traction exceeds peak value of that curve, the delamination arises. After the delamination is initiated in the interface, the damage starts to accumulate related to the loading. The fracture toughness gradually decreases as damage accumulates due to irreversibility of the process [56]. Finally, when the interface is totally damaged, the traction is reduced to zero and then new crack surface is formed [22].
23
The origin of the cohesive zone method is based on Dugdale’s study in which the yielding of steel sheets containing internal and edge slits are investigated [1], [22]. Dugdale [57] introduces the thin plastic zone generated in front of the notch. Barenblatt [58] investigates the equilibrium in solids containing cracks by introducing molecular cohesive forces acting in the vicinity of the crack tip. A model similar to Barenblatt’s model is proposed by Hillerborg [59] which is applied to the analysis of concrete cracking with the concept of tensile strength. In Hillerborg’s model, the existing crack is able to grow. Furthermore, it allows the initiation of new cracks. 3.4 Measurement of Interfacial Fracture Toughness
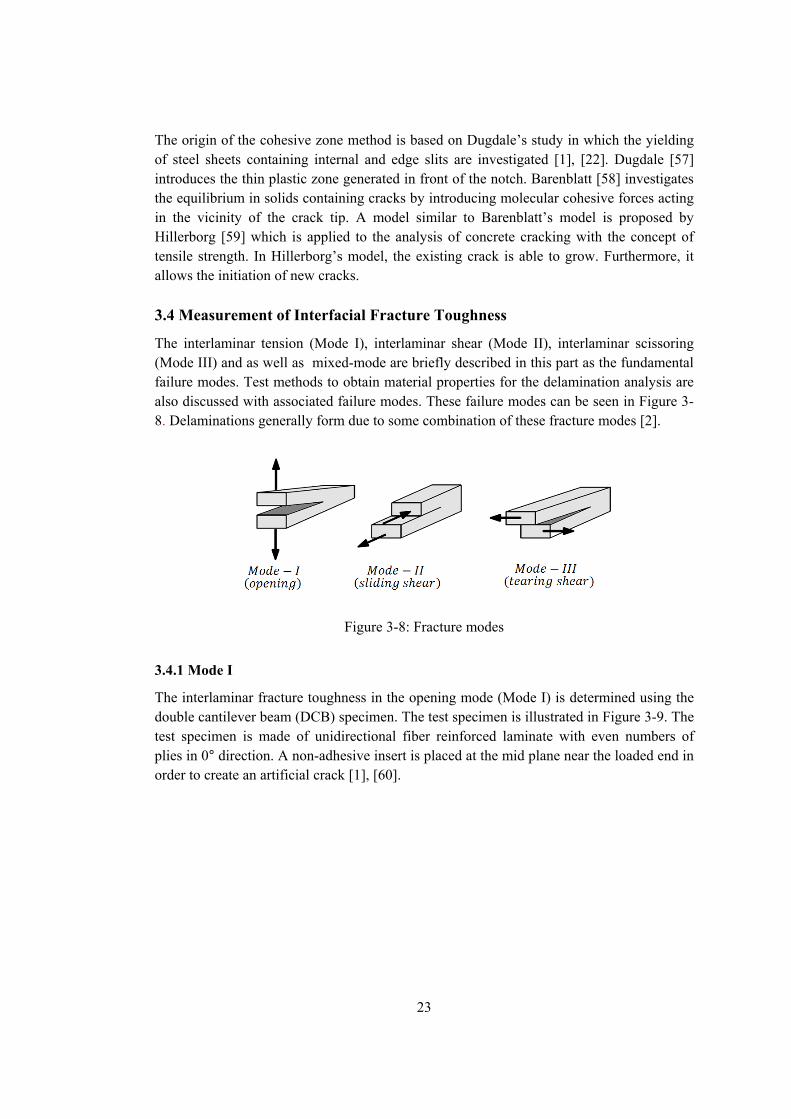
The interlaminar tension (Mode I), interlaminar shear (Mode II), interlaminar scissoring (Mode III) and as well as mixed-mode are briefly described in this part as the fundamental failure modes. Test methods to obtain material properties for the delamination analysis are also discussed with associated failure modes. These failure modes can be seen in Figure 3-8. Delaminations generally form due to some combination of these fracture modes [2].
Figure 3-8: Fracture modes
3.4.1 Mode I
The interlaminar fracture toughness in the opening mode (Mode I) is determined using the double cantilever beam (DCB) specimen. The test specimen is illustrated in Figure 3-9. The test specimen is made of unidirectional fiber reinforced laminate with even numbers of plies in 0° direction. A non-adhesive insert is placed at the mid plane near the loaded end in order to create an artificial crack [1], [60].

24
Figure 3-9: DCB test specimen
The details of test specimen and procedure can be found in [60]. One of the major problems in the DCB test is the fiber bridging (Figure 3-10).
Figure 3-10: Fiber bridging mechanism observed in the DCB tests [61]
O’Brien states that this phenomenon is an artifact of unidirectional DCB specimen which does not occur in structural composite laminates. Fiber bridging directly affects the R-curve as shown in Figure 3-11 so that it may not show the real material properties.

25
Figure 3-11: R-curve effect on a DCB test of a [0]24 CFRP laminate [1].
The test procedure is limited to use unidirectional (0º) fiber reinforced laminate. However, it is expected to have delamination at interfaces of neighboring layers with different orientations. Therefore, it is crucial to investigate the interlaminar fracture toughness of neighboring layers with different orientations other than 0° plies.
Figure 3-12: Variation of GIc with in-plane fiber orientation angle, θ of θ/-θ interface between UD layers [62]
26
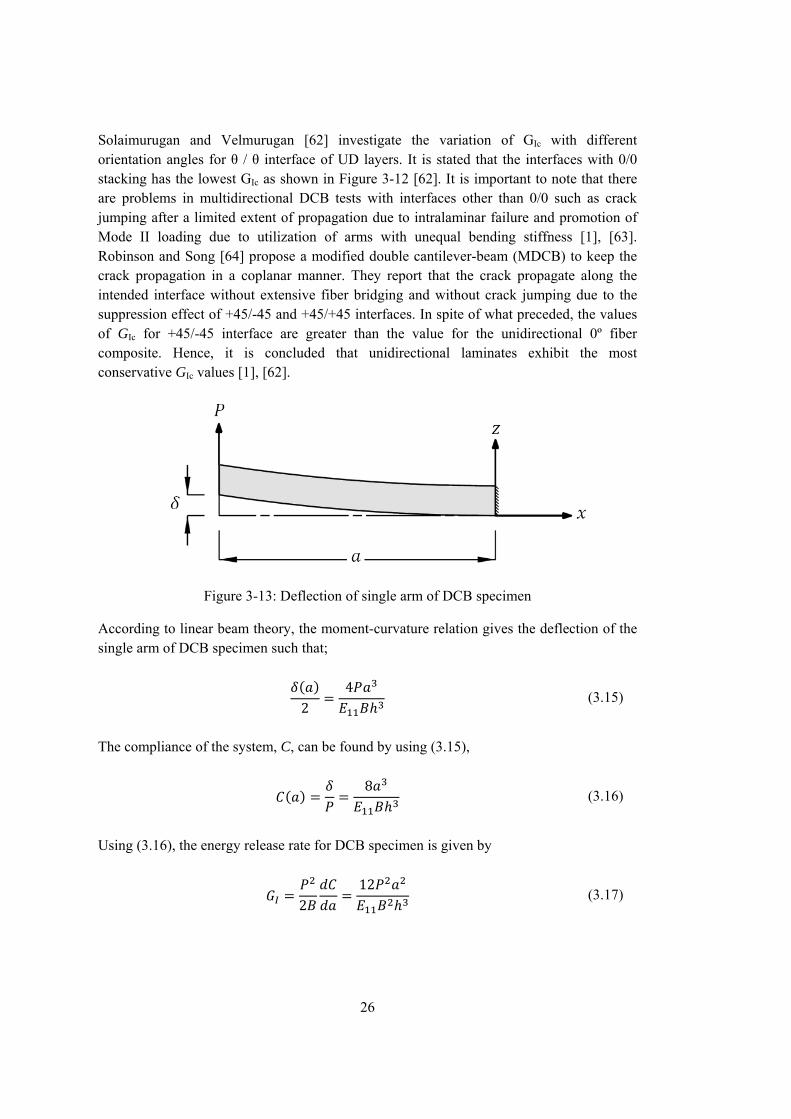
Solaimurugan and Velmurugan [62] investigate the variation of GIc with different orientation angles for θ / θ interface of UD layers. It is stated that the interfaces with 0/0 stacking has the lowest GIc as shown in Figure 3-12 [62]. It is important to note that there are problems in multidirectional DCB tests with interfaces other than 0/0 such as crack jumping after a limited extent of propagation due to intralaminar failure and promotion of Mode II loading due to utilization of arms with unequal bending stiffness [1], [63]. Robinson and Song [64] propose a modified double cantilever-beam (MDCB) to keep the crack propagation in a coplanar manner. They report that the crack propagate along the intended interface without extensive fiber bridging and without crack jumping due to the suppression effect of +45/-45 and +45/+45 interfaces. In spite of what preceded, the values of GIc for +45/-45 interface are greater than the value for the unidirectional 0º fiber composite. Hence, it is concluded that unidirectional laminates exhibit the most conservative GIc values [1], [62].
Figure 3-13: Deflection of single arm of DCB specimen
According to linear beam theory, the moment-curvature relation gives the deflection of the single arm of DCB specimen such that;
24
(3.15)
The compliance of the system, C, can be found by using (3.15),
8 (3.16)
Using (3.16), the energy release rate for DCB specimen is given by
212
(3.17)
27
The critical energy release rate, is provided when applied load is equal to the critical load ,
12 (3.18)
3.4.2 Mode II
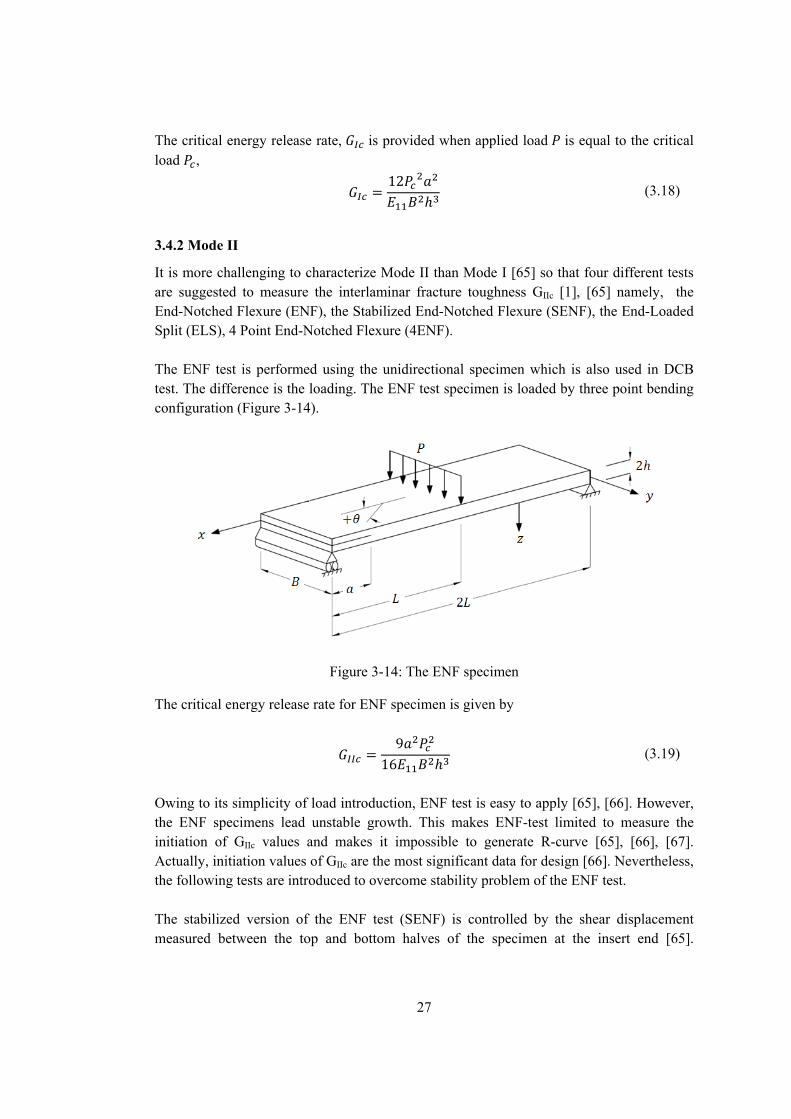
It is more challenging to characterize Mode II than Mode I [65] so that four different tests are suggested to measure the interlaminar fracture toughness GIIc [1], [65] namely, the End-Notched Flexure (ENF), the Stabilized End-Notched Flexure (SENF), the End-Loaded Split (ELS), 4 Point End-Notched Flexure (4ENF). The ENF test is performed using the unidirectional specimen which is also used in DCB test. The difference is the loading. The ENF test specimen is loaded by three point bending configuration (Figure 3-14).
Figure 3-14: The ENF specimen
The critical energy release rate for ENF specimen is given by
916
(3.19)
Owing to its simplicity of load introduction, ENF test is easy to apply [65], [66]. However, the ENF specimens lead unstable growth. This makes ENF-test limited to measure the initiation of GIIc values and makes it impossible to generate R-curve [65], [66], [67]. Actually, initiation values of GIIc are the most significant data for design [66]. Nevertheless, the following tests are introduced to overcome stability problem of the ENF test. The stabilized version of the ENF test (SENF) is controlled by the shear displacement measured between the top and bottom halves of the specimen at the insert end [65].
28
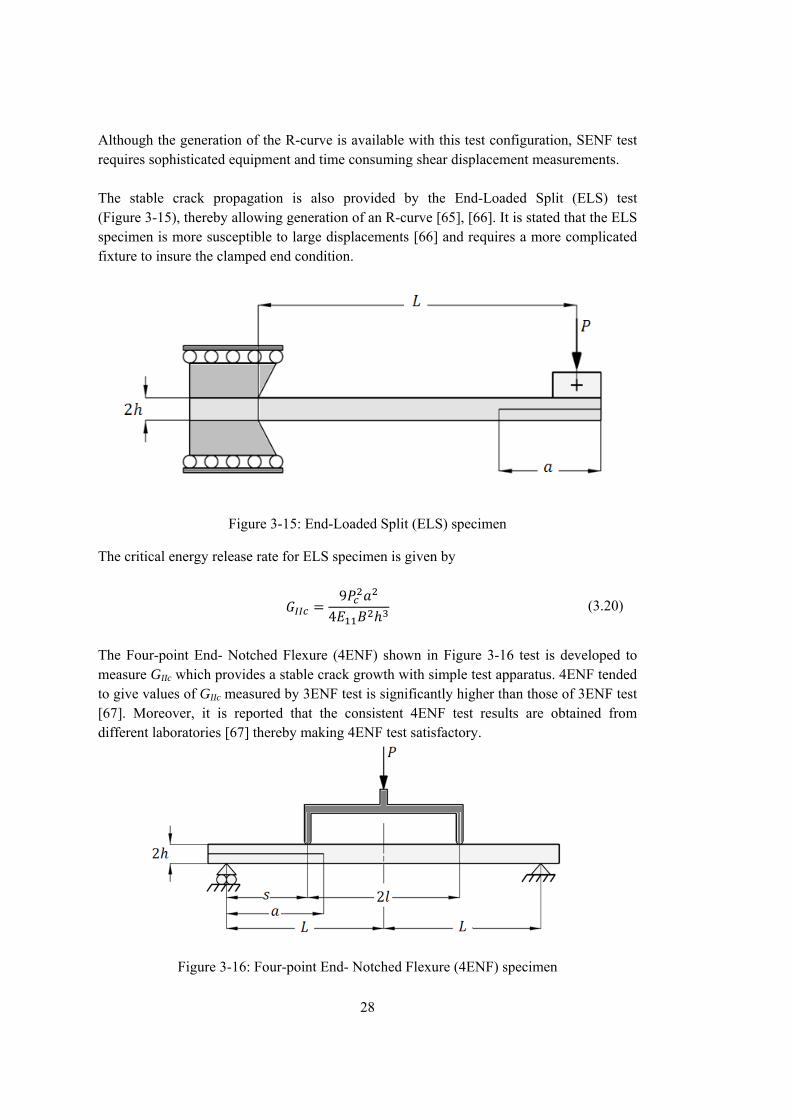
Although the generation of the R-curve is available with this test configuration, SENF test requires sophisticated equipment and time consuming shear displacement measurements. The stable crack propagation is also provided by the End-Loaded Split (ELS) test (Figure 3-15), thereby allowing generation of an R-curve [65], [66]. It is stated that the ELS specimen is more susceptible to large displacements [66] and requires a more complicated fixture to insure the clamped end condition.
Figure 3-15: End-Loaded Split (ELS) specimen
The critical energy release rate for ELS specimen is given by
94
(3.20)
The Four-point End- Notched Flexure (4ENF) shown in Figure 3-16 test is developed to measure GIIc which provides a stable crack growth with simple test apparatus. 4ENF tended to give values of GIIc measured by 3ENF test is significantly higher than those of 3ENF test [67]. Moreover, it is reported that the consistent 4ENF test results are obtained from different laboratories [67] thereby making 4ENF test satisfactory.
Figure 3-16: Four-point End- Notched Flexure (4ENF) specimen
29
The critical energy release rate for 4ENF specimen is given by
916
(3.21)
3.4.3 Mode III
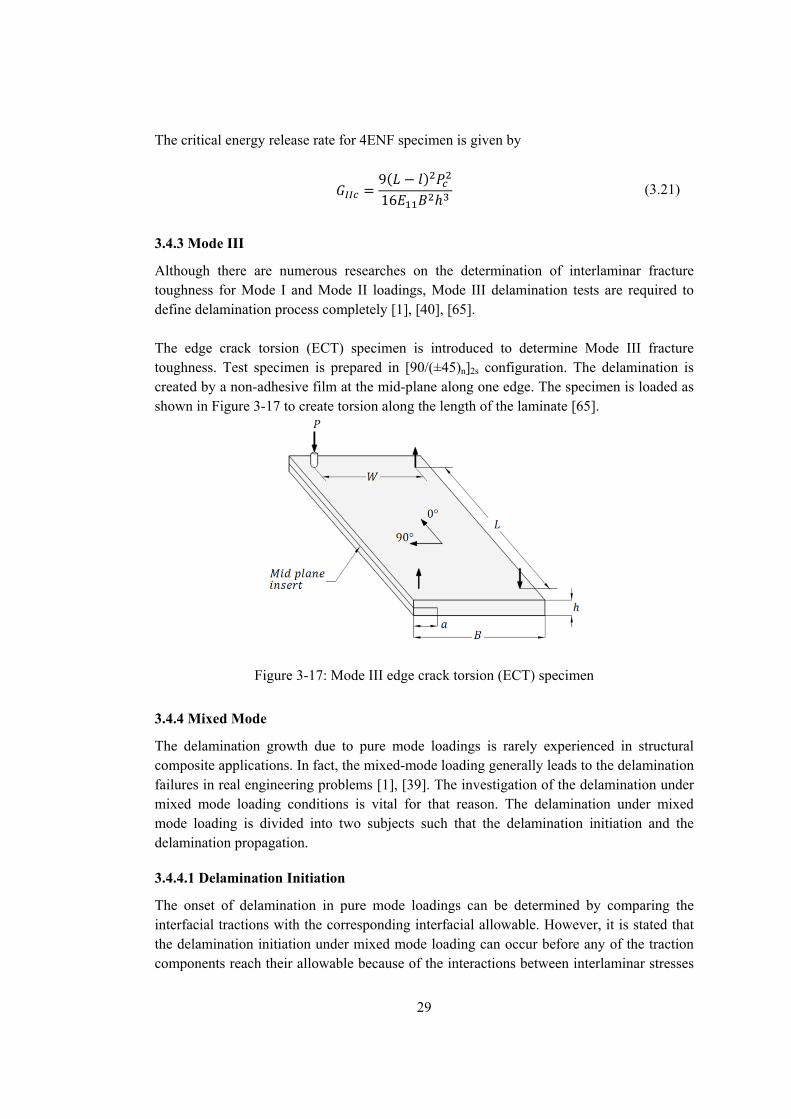
Although there are numerous researches on the determination of interlaminar fracture toughness for Mode I and Mode II loadings, Mode III delamination tests are required to define delamination process completely [1], [40], [65]. The edge crack torsion (ECT) specimen is introduced to determine Mode III fracture toughness. Test specimen is prepared in [90/(±45)n]2s configuration. The delamination is created by a non-adhesive film at the mid-plane along one edge. The specimen is loaded as shown in Figure 3-17 to create torsion along the length of the laminate [65].
Figure 3-17: Mode III edge crack torsion (ECT) specimen
3.4.4 Mixed Mode
The delamination growth due to pure mode loadings is rarely experienced in structural composite applications. In fact, the mixed-mode loading generally leads to the delamination failures in real engineering problems [1], [39]. The investigation of the delamination under mixed mode loading conditions is vital for that reason. The delamination under mixed mode loading is divided into two subjects such that the delamination initiation and the delamination propagation.
3.4.4.1 Delamination Initiation
The onset of delamination in pure mode loadings can be determined by comparing the interfacial tractions with the corresponding interfacial allowable. However, it is stated that the delamination initiation under mixed mode loading can occur before any of the traction components reach their allowable because of the interactions between interlaminar stresses
30
[39], [68]. Hence, the quadratic failure criterion is proposed to predict the delamination initiation while the maximum stress criterion provides poor results [1], [68]. The quadratic failure criteria accounts for the effect of interaction of traction components in the onset of delamination which is written as follows [68];
1 (3.22)
where , and are the interfacial tractions; , and are the interfacial strengths. Mc-Cauley operator in (3.22) is defined as;
0, 0, 0 (3.23)
As a result, the delamination initiation is not affected by the compressive normal tractions.
3.4.4.2 Delamination Propagation
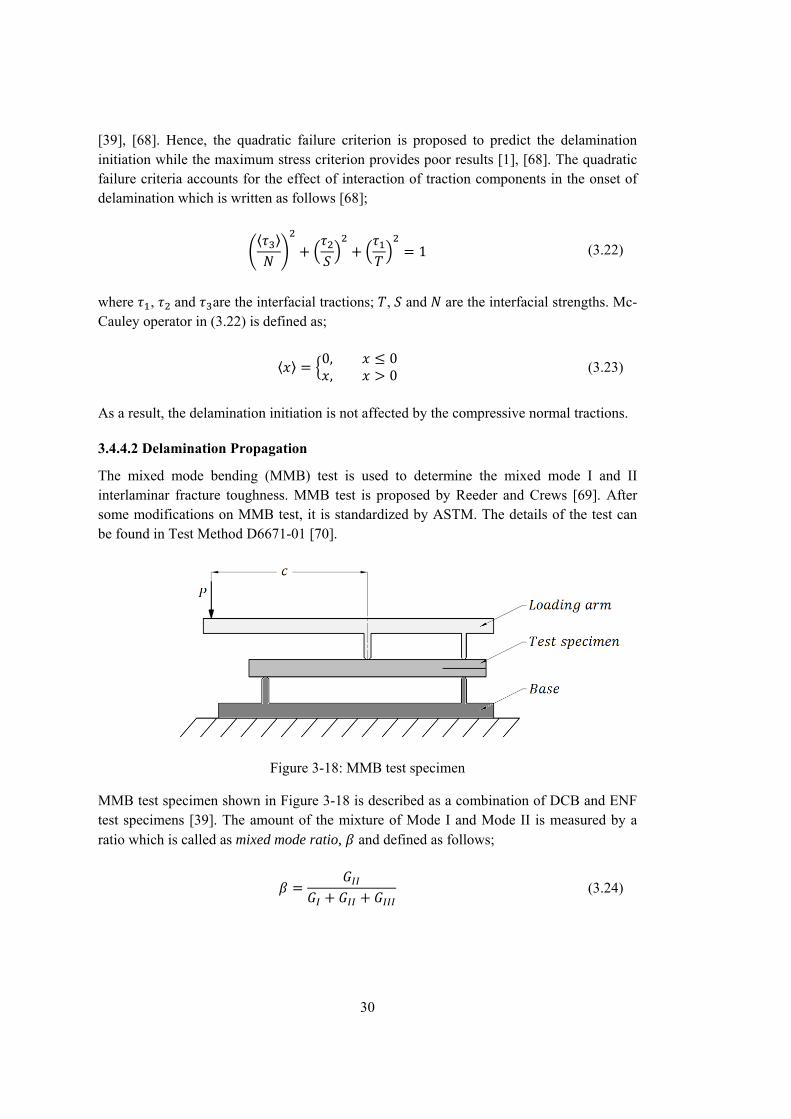
The mixed mode bending (MMB) test is used to determine the mixed mode I and II interlaminar fracture toughness. MMB test is proposed by Reeder and Crews [69]. After some modifications on MMB test, it is standardized by ASTM. The details of the test can be found in Test Method D6671-01 [70].
Figure 3-18: MMB test specimen
MMB test specimen shown in Figure 3-18 is described as a combination of DCB and ENF test specimens [39]. The amount of the mixture of Mode I and Mode II is measured by a ratio which is called as mixed mode ratio, and defined as follows;
(3.24)
31
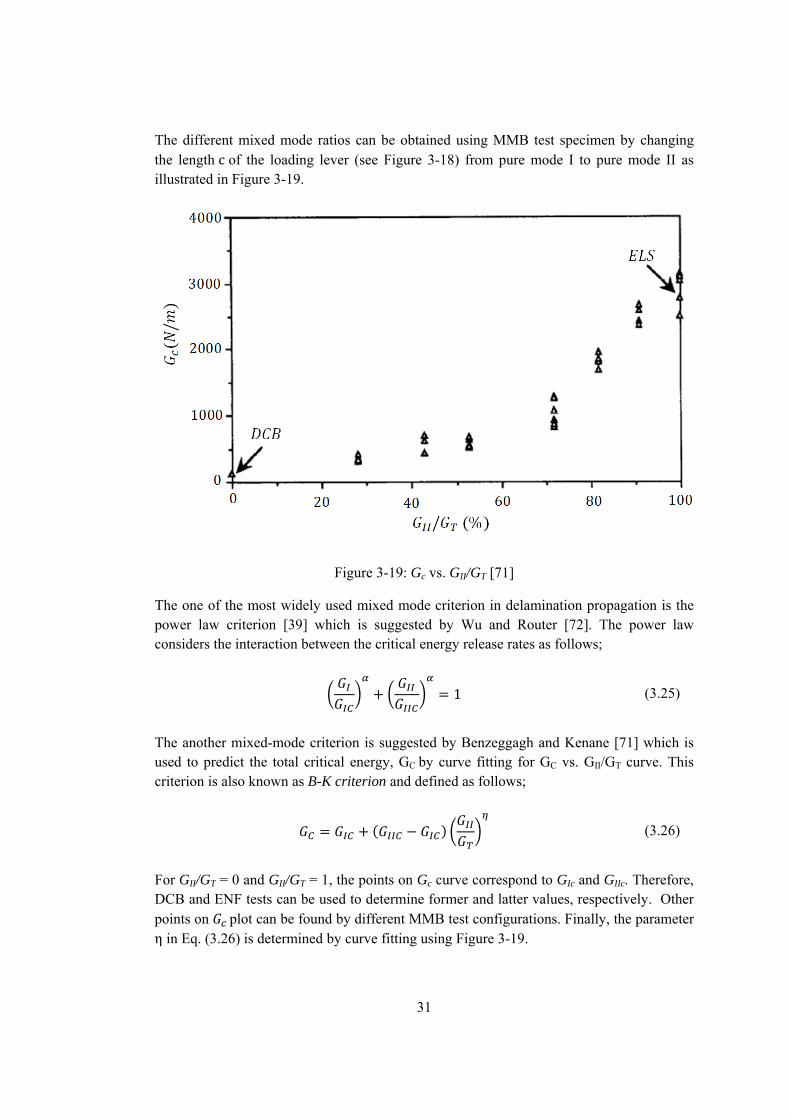
The different mixed mode ratios can be obtained using MMB test specimen by changing the length c of the loading lever (see Figure 3-18) from pure mode I to pure mode II as illustrated in Figure 3-19.
Figure 3-19: Gc vs. GII/GT [71]
The one of the most widely used mixed mode criterion in delamination propagation is the power law criterion [39] which is suggested by Wu and Router [72]. The power law considers the interaction between the critical energy release rates as follows;
1 (3.25)
The another mixed-mode criterion is suggested by Benzeggagh and Kenane [71] which is used to predict the total critical energy, GC by curve fitting for GC vs. GII/GT curve. This criterion is also known as B-K criterion and defined as follows;
(3.26)
For GII/GT = 0 and GII/GT = 1, the points on Gc curve correspond to GIc and GIIc. Therefore, DCB and ENF tests can be used to determine former and latter values, respectively. Other points on plot can be found by different MMB test configurations. Finally, the parameter η in Eq. (3.26) is determined by curve fitting using Figure 3-19.
32
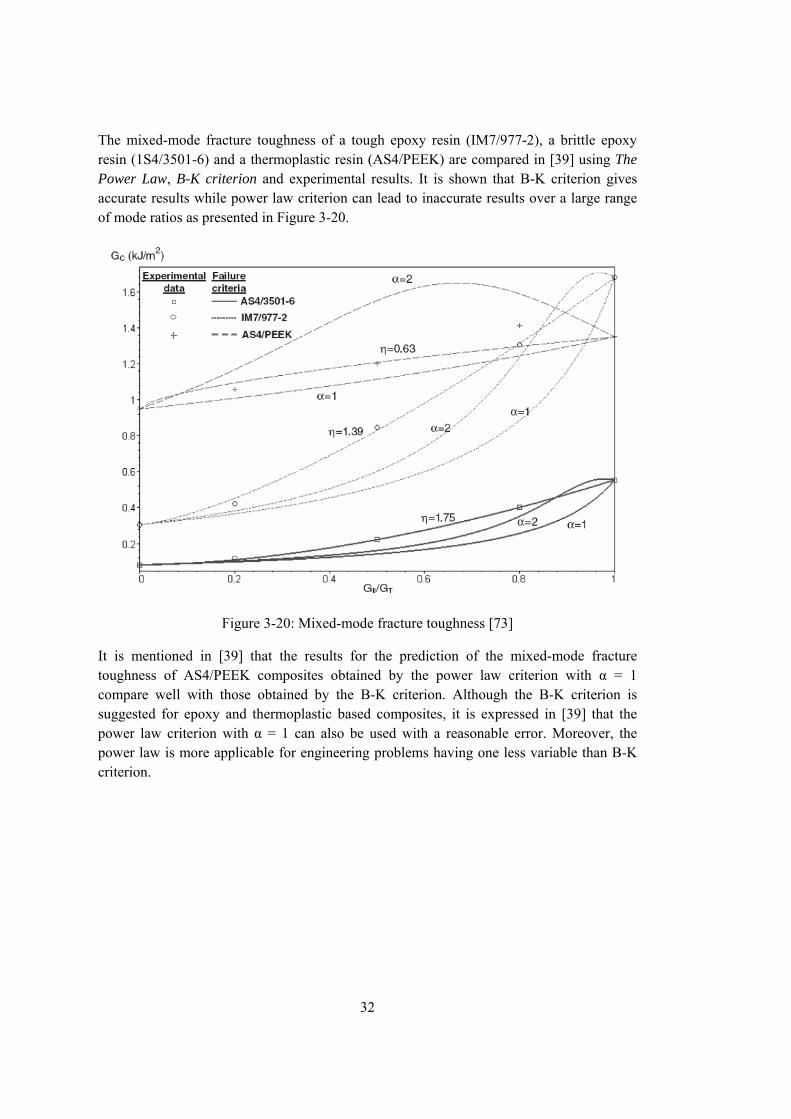
The mixed-mode fracture toughness of a tough epoxy resin (IM7/977-2), a brittle epoxy resin (1S4/3501-6) and a thermoplastic resin (AS4/PEEK) are compared in [39] using The Power Law, B-K criterion and experimental results. It is shown that B-K criterion gives accurate results while power law criterion can lead to inaccurate results over a large range of mode ratios as presented in Figure 3-20.
Figure 3-20: Mixed-mode fracture toughness [73]
It is mentioned in [39] that the results for the prediction of the mixed-mode fracture toughness of AS4/PEEK composites obtained by the power law criterion with α = 1 compare well with those obtained by the B-K criterion. Although the B-K criterion is suggested for epoxy and thermoplastic based composites, it is expressed in [39] that the power law criterion with α = 1 can also be used with a reasonable error. Moreover, the power law is more applicable for engineering problems having one less variable than B-K criterion.
33
CHAPTER 4
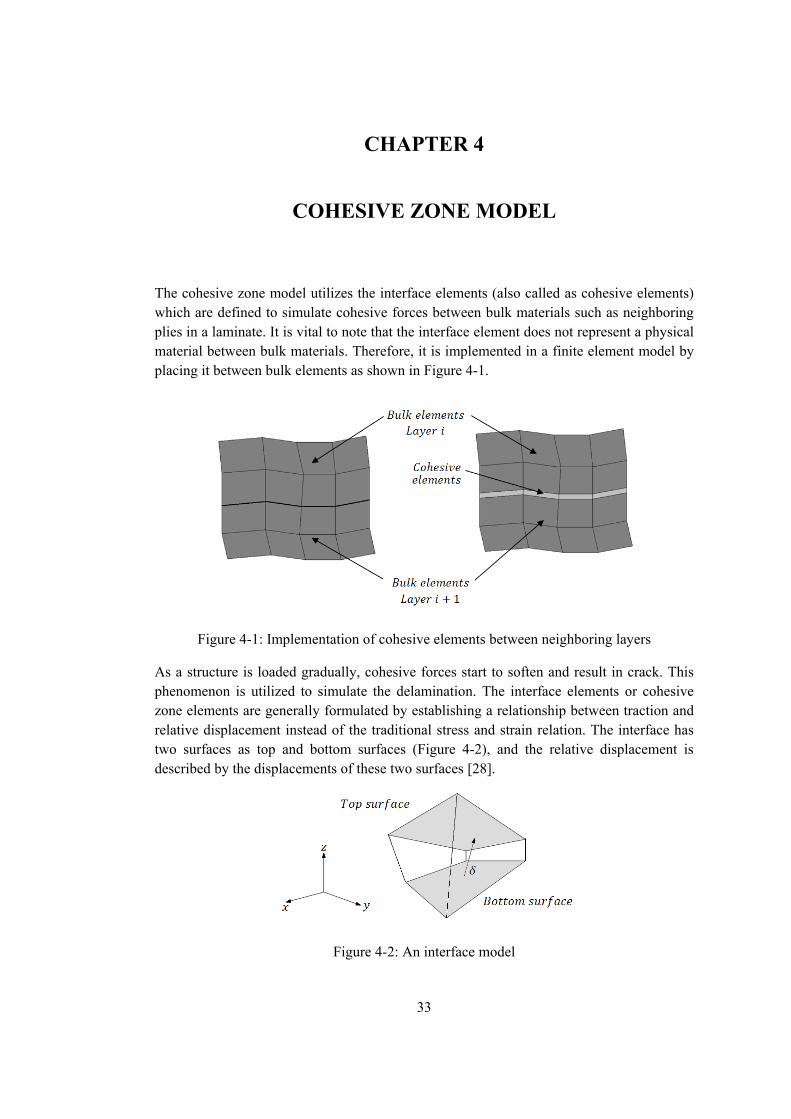
COHESIVE ZONE MODEL The cohesive zone model utilizes the interface elements (also called as cohesive elements) which are defined to simulate cohesive forces between bulk materials such as neighboring plies in a laminate. It is vital to note that the interface element does not represent a physical material between bulk materials. Therefore, it is implemented in a finite element model by placing it between bulk elements as shown in Figure 4-1.
Figure 4-1: Implementation of cohesive elements between neighboring layers
As a structure is loaded gradually, cohesive forces start to soften and result in crack. This phenomenon is utilized to simulate the delamination. The interface elements or cohesive zone elements are generally formulated by establishing a relationship between traction and relative displacement instead of the traditional stress and strain relation. The interface has two surfaces as top and bottom surfaces (Figure 4-2), and the relative displacement is described by the displacements of these two surfaces [28].
Figure 4-2: An interface model
34
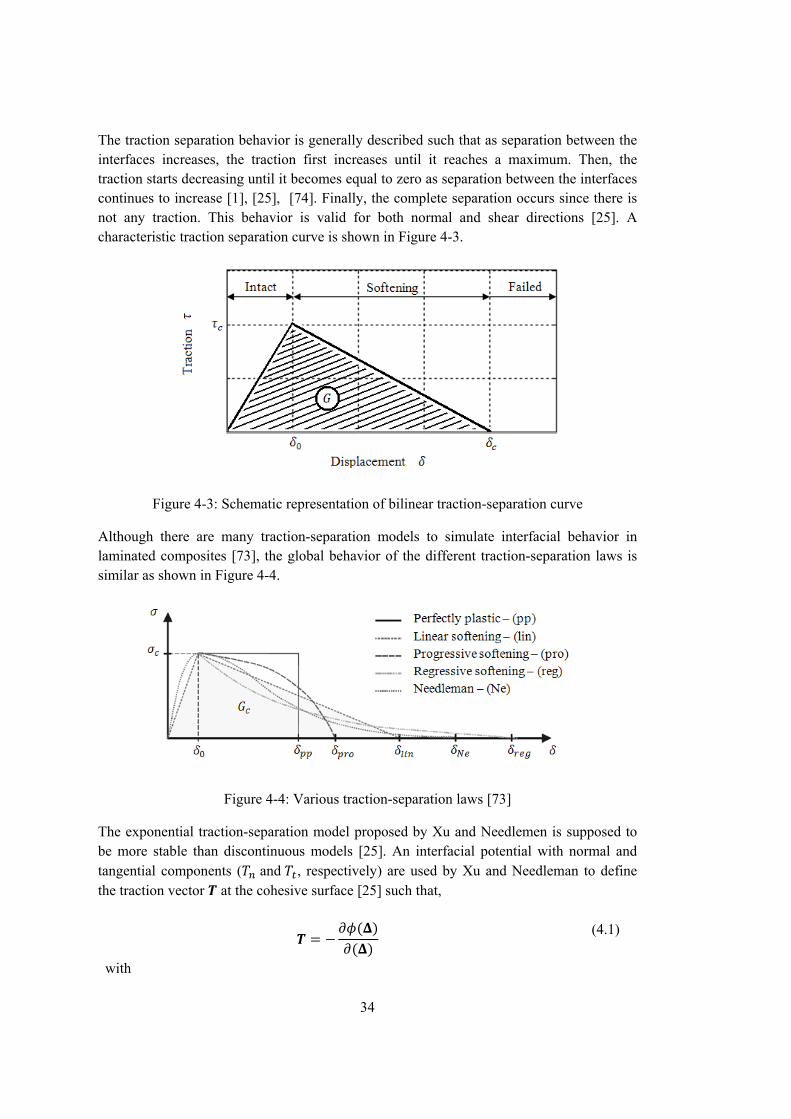
The traction separation behavior is generally described such that as separation between the interfaces increases, the traction first increases until it reaches a maximum. Then, the traction starts decreasing until it becomes equal to zero as separation between the interfaces continues to increase [1], [25], [74]. Finally, the complete separation occurs since there is not any traction. This behavior is valid for both normal and shear directions [25]. A characteristic traction separation curve is shown in Figure 4-3.
Figure 4-3: Schematic representation of bilinear traction-separation curve
Although there are many traction-separation models to simulate interfacial behavior in laminated composites [73], the global behavior of the different traction-separation laws is similar as shown in Figure 4-4.
Figure 4-4: Various traction-separation laws [73]
The exponential traction-separation model proposed by Xu and Needlemen is supposed to be more stable than discontinuous models [25]. An interfacial potential with normal and tangential components ( and , respectively) are used by Xu and Needleman to define the traction vector at the cohesive surface [25] such that,
with
(4.1)

35
Δ , Δ The potential is written as;
Δ , Δ e 1∆ 1
1 1∆ ∆
(4.2)
where and are the characteristic separations such that:
and
/√2
and are the maximum values of normal and shear tractions, respectively. The normal and shear tractions can be derived using (4.1) and (4.2) as follows [25];
Δ ∆ 11
1∆ ∆
(4.3)
2∆
1∆ ∆
(4.4)
The parameter in (4.2) is the ratio of area under the normal traction-separation curve to the area under shear-traction curve and it is taken as one and r is equal to zero [25]. The uncoupled tractions are found by assuming for 1, 0 and ∆ , ∆ 0 and
∆ 0, ∆ [25]. Finally, the relation for and can be obtained by using the relations of and as follows;
(4.5)
/2 (4.6) Inserting (4.5) and (4.6) into (4.3) and (4.4), respectively, normalized force-normalized separations can be obtained as follows:
∆ ∆ (4.7)
22
∆ ∆
(4.8)

36
The normalized normal traction is plotted with respect to the normalized relative opening displacement as shown in Figure 4-5.
Figure 4-5: Normalized normal tractions vs. normalized relative opening displacement.
The normalized shear traction is plotted with respect to the normalized relative tangential displacement as shown in Figure 4-6.
Figure 4-6: Normalized shear tractions vs. normalized relative tangential displacement
In our study, the linear elastic-linear softening behavior is implemented for the delamination analysis since this model is widely used in such analyses [1] and shows good agreement between experimental and numerical results [75].

37
4.1 Constitutive Law for Pure Mode Cohesive Zone Model
The work done by normal and shear stresses can be related to corresponding critical energy release rates [1]. The cohesive zone formulation is identical to Griffith’s theory of fracture [1], [74]. If J-integral on the boundary Γ proposed by Rice [76] is considered,
·∂∂x
(4.9)
where the traction vector is which is defined according to the outward normal along Γ, is the displacement vector, is an element of arc length along Γ and is the strain energy density [76].
Figure 4-7: Flat surfaced notch in 2D deformation field
In (4.9), Γ is defined as any curve surrounding the notch tip where the integral is evaluated in the counterclockwise direction starting from the lower flat notch surface and continuing along the path Γ to the upper flat surface as shown in Figure 4-7. Assuming Γ represents the contour of the cohesive zone shown in Figure 4-8, (4.9) is written as [1],
J σ δδ
(4.10)
Considering dy = 0 in the path Γ by neglecting the thickness of the interface, (4.10) can be written as follows;
J σ δδ
σ δ δ σ δ δ (4.11)

38
where δ is the relative displacement at the tip of the crack. It is possible to express the J-integral as the rate of decrease in potential energy in the following equation and it is also equivalent to the energy release rate [74],
J∂Π∂
(4.12)
where Π is the potential energy of the system, is the crack length. (4.11) and (4.12) can be equated as
σ δ δ (4.13)
When the relative displacement reaches a maximum, the value of the energy release rate is equal to the critical energy relate, Gc. Therefore, (4.13) becomes:
σ δ δ (4.14)
Considering (4.14), it is to say that the area under the traction-separation curve equals to the critical energy release rate, Gc. The bilinear softening behaviors for respective pure mode loadings (Mode I, Mode II and Mode III) are given in Figure 4-8 and Figure 4-9 [39]. The relative displacement of onset of damage and traction of onset of damage are shown with subscript “o”. At the point of complete separation, the relative displacements are represented with subscript “c”. In the elastic range as represented in Figure 4-8 and Figure 4-9 by point 1, the bottom and top faces of the interface is hold by establishing a high stiffness to avoid big separations. It is also called as penalty stiffness and designated by [39]. At point 2 in Figure 4-8 and Figure 4-9, the interfacial normal and shear tractions reaches their corresponding interfacial tensile or shear strengths. At point 2, the onset displacements can be found by
δ (4.15)
δ (4.16)
δ (4.17)
where N is the tensile strength, S and T are the shear strength of the interface. The final relative displacements at complete separation δ , δ and δ are also defined by the

39
traction-separation curve [39]. As shown in (4.14), the fracture toughness for each pure mode is equal to the area under the respective traction-separation curve and evaluated by the following expressions:
I τ δ (4.18)
II τ δ (4.19)
III τ δ (4.20)
The final relative displacements at complete separation are obtained as follows when the bilinear relationship is established;
δ2 I (4.21)
δ2 II (4.22)
δ2 III (4.23)
Figure 4-8: Cohesive zone ahead of delamination front for Mode I

40
Figure 4-9: Cohesive zone ahead of delamination front for Modes II and III
As a result, the penalty stiffness, the interfacial strength and the energy release rate for each mode are necessary to completely define the bilinear constitutive relation [74]. The complete separation occurs at point 5 in Figure 4-8 and Figure 4-9. Therefore, the interface cannot transfer any load since the penalty stiffness becomes zero. Although the load carrying capability of the interface vanishes after the complete separation, the interpenetration of the separated surfaces must be avoided by re-applying the penalty stiffness where the contact is detected [39], [74]. It is crucial to note that the negative displacement corresponds to interpenetration of separated surfaces in Mode I whereas the negative displacement in Mode II or Mode III indicates the direction of deformation. Hence, the negative relative displacement in Mode I is controlled by Mc Cauley bracket by using notation.
| |
if 1
if 2,3 (4.24)
The irreversible constitutive law under single mode delamination instanced in Figure 4-8 and Figure 4-9 can be expressed as follows [77].
1
0
if δ or 1 and δ 0 if δ δ δ and 1 or δ 0 if δ δ and 1 or δ 0
(4.25)
where δ denotes the maximum value which is attained by δ within the time range of interest and is the damage variable which indicates no damage when it is equal to 0 and fully damaged when it is 1. The linear damage variable can be expressed as,
41
δ δ δδ δ δ
, 0,1 (4.26)
The irreversibility is taken into account by defining the maximum value of mixed-mode relative displacement over time such that,
δ max δ | 0, (4.27)
4.2 Constitutive Law for Mixed-Mode Cohesive Zone Model
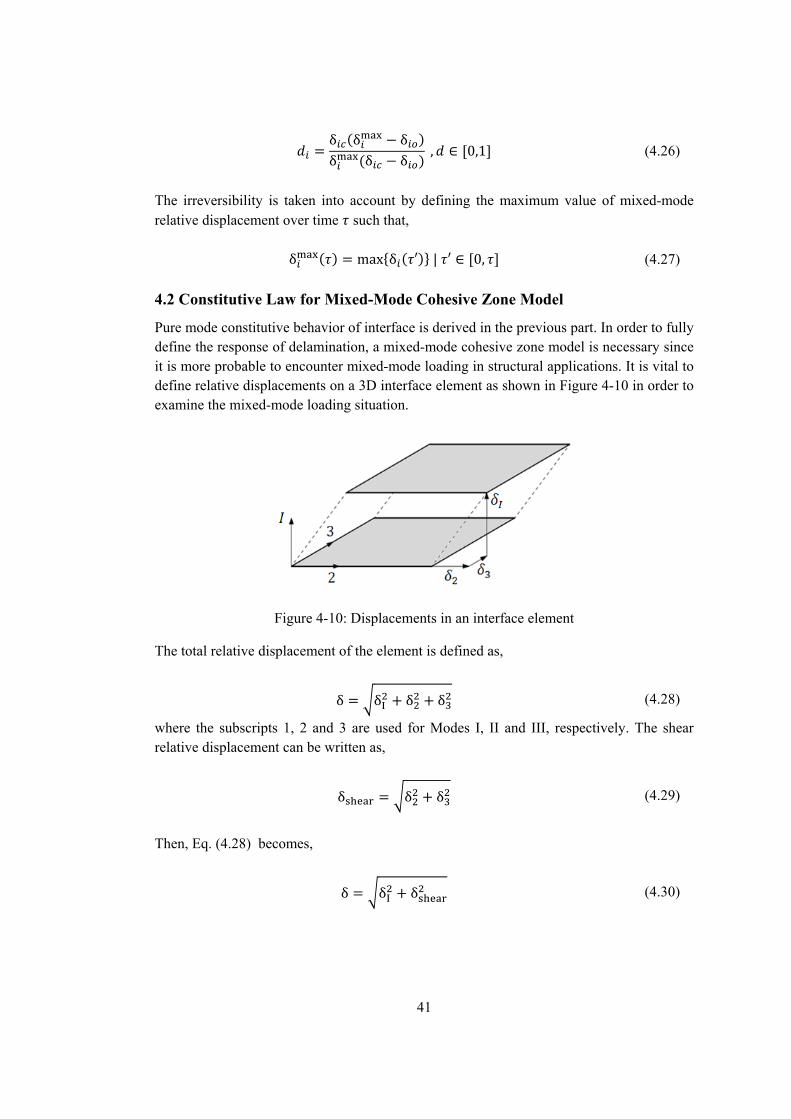
Pure mode constitutive behavior of interface is derived in the previous part. In order to fully define the response of delamination, a mixed-mode cohesive zone model is necessary since it is more probable to encounter mixed-mode loading in structural applications. It is vital to define relative displacements on a 3D interface element as shown in Figure 4-10 in order to examine the mixed-mode loading situation.
Figure 4-10: Displacements in an interface element
The total relative displacement of the element is defined as,
δ δI δ δ (4.28)
where the subscripts 1, 2 and 3 are used for Modes I, II and III, respectively. The shear relative displacement can be written as,
δ δ δ (4.29)
Then, Eq. (4.28) becomes,
δ δI δ (4.30)

42
The participation of the different modes is expressed by φ as;
φδ
δI (4.31)
The mixed mode cohesive zone formulation is established in terms of fracture toughness as such in pure mode. The test methods for determination of Modes I and II fracture toughnesses are reviewed in detailed in Chapter 3. However, the test method for Mode III still needs further development. It is mentioned that the determination of shear modulus requires clarification [39]. Moreover, there is no mixed mode test method including Mode III. Therefore, the delamination growth is generally studied using only Mode I and Mode II. The energy release rate with shear loading is used in this study following Li’s work [78], [79] in a way similar to [39] such that . In Figure 4-11, it is shown that the mixed-mode constitutive relation is projected on corresponding pure mode planes [80]. The superscript M is used for the projected mixed-mode extremes (i.e.; , , , , , , , ) and it can be seen that all of them are lower than the pure mode equivalents. As a result, in mixed-mode loading conditions, the damage propagation can initiate even before one of the limit tractions for pure mode loading is satisfied [28].
Figure 4-11: Mixed-mode constitutive relations [80]
43
As can be seen in Figure 4-11, the relative displacement of onset of damage δ is defined by a mixed-mode initiation criterion (3.22) and the final relative displacement, δ , is defined by a mixed-mode propagation criterion either (3.25) or (3.26). Using Figure 4-11, the mixed-mode onset relative displacement is derived as follows,
(4.32)
Inserting Eqn. (4.32) into Eqn. (3.22), the following expression is obtained,
1 (4.33)
By eliminating and from Eq. (4.33), then inserting Eq. (4.31), Eq. (4.33) can be re-written as,
1 φφ
1 φ1 (4.34)
Solving for , the mixed-mode onset relative displacement is found as follows
δδI
MδIIM 1 φ
δIIM φδI
M
δIIM
if 0 if 0
(4.35)
In mixed-mode loading situation, the energy absorbed up to the complete delamination can be expressed in terms of the relative displacement since the tractions are the function of the relative displacements. The absorbed energies for each mode in mixed mode loading can be expressed as,
IδI δI
2 (4.36)
IIδII δII
2 (4.37)

44
Introducing (4.36) and (4.37) in the expression of the B-K criterion given in Eq. (3.26) the expression for can be obtained as,
δ2
δ I II Iφ
1 φ
δII
if 0 if 0
(4.38)
By inserting (4.36) and (4.37) in the expression of the power law criterion given in (3.25), the critical displacement for the mixed mode can be expressed as,
δ2 1 φ
δ1 φ
/
δII
if 0 if 0
(4.39)
The constitutive equation for the mixed-mode loading is defined similar to Eq. (4.25) considering penetration in the following expression in which the penalty parameter, the linear damage variable, the mixed-mode relative displacements corresponding to damage initiation and total decohesion are defined as , , and , respectively.
τ D δ (4.40)
is defined as,
D
δ
δ 1 δ Iδδ
δ δδδ
if δ δ if δ δ δ if δ δ
(4.41)
where δ is Kronecker’s Delta ( , 1, 2, 3) and the linear damage variable is defined as
δ δ δδ δ δ
, 0,1 (4.42)
The type of failure is rarely in pure mode in structural applications. Commonly, they are encountered in material characterization test for pure modes (see Chapter 3). Mode of failure is generally mixed type in engineering applications such as the composite laminate subjected to impact or buckling due to compression. Therefore, the mixed mode formulation should be used in the current analysis since delamination due to impact is investigated in this study. The critical displacement can be evaluated by either Power Law

45
(See Eqn. (3.25)) or Benzeggagh and Kenane (B-K) Criterion (see Eqn. (3.26)). It is known that B-K criterion exhibits more accurate results since it is created by curve fitting from test data for various mode ratios [39]. Nevertheless, having one less variable makes Power Law more applicable for engineering problems than B-K criterion where exponent of B-K criterion is not available for analysis. As a result of that, Power Law is used in mixed mode formulation in analysis. 4.3 Cohesive Zone Method in ABAQUS/Explicit
The constitutive behavior discussed in previous sections (Section 4.1 and 4.2) are also utilized by ABAQUS software. In this section, the important parameters and settings such as defining cohesive material, meshing technique, element type, and stable time increment are explained. Cohesive elements are the native element of ABAQUS for cohesive zone applications. Although there are many different cohesive elements are available in the software, the eight-node three-dimensional cohesive element (COH3D8) is used in this study. The geometry of the interface is created by deformable 3D solid model. The interface should be meshed by using either sweep or bottom-up technique. Otherwise, the software does not allow assigning “cohesive element” as element type. Additionally, cohesive element should be selected from explicit element library since explicit solution scheme is to be used for our case. The maximum degradation is set to 0.99 to maintain some residual stiffness since excessive deformation may lead to numerical problems in convergence. In order to assign the material properties to the interface element, the cohesive material should be defined with the following required parameters: density, elastic behavior, damage type for traction-separation law. The elastic behavior type is selected as traction and quadratic nominal stress criterion is chosen for damage type for traction separation law. For the damage propagation, energy based method is chosen with linear softening and Power Law or B-K model can be selected for mixed mode behavior. These settings are sufficient to utilize the mixed mode behavior of the cohesive zone method discussed in Section 4.1 and 4.2 in the software. The stable time increment is an important parameter in explicit analysis. It is defined as the required time for a stress wave to pass through the thickness of the interface element [81]. The computation time of the analysis is generally determined by the interface elements since their stable time increments are very low compared to other elements in that model. However, the time increment can be controlled by changing the stiffness and the density of the interface material. In order to increase the time increment, the density can be artificially increased, or the stiffness can be decreased in an artificial manner which is also known as “mass scaling” [81]. Although none of these regulations are used in our study, it is crucial to note that they may affect the result of the analysis.

46
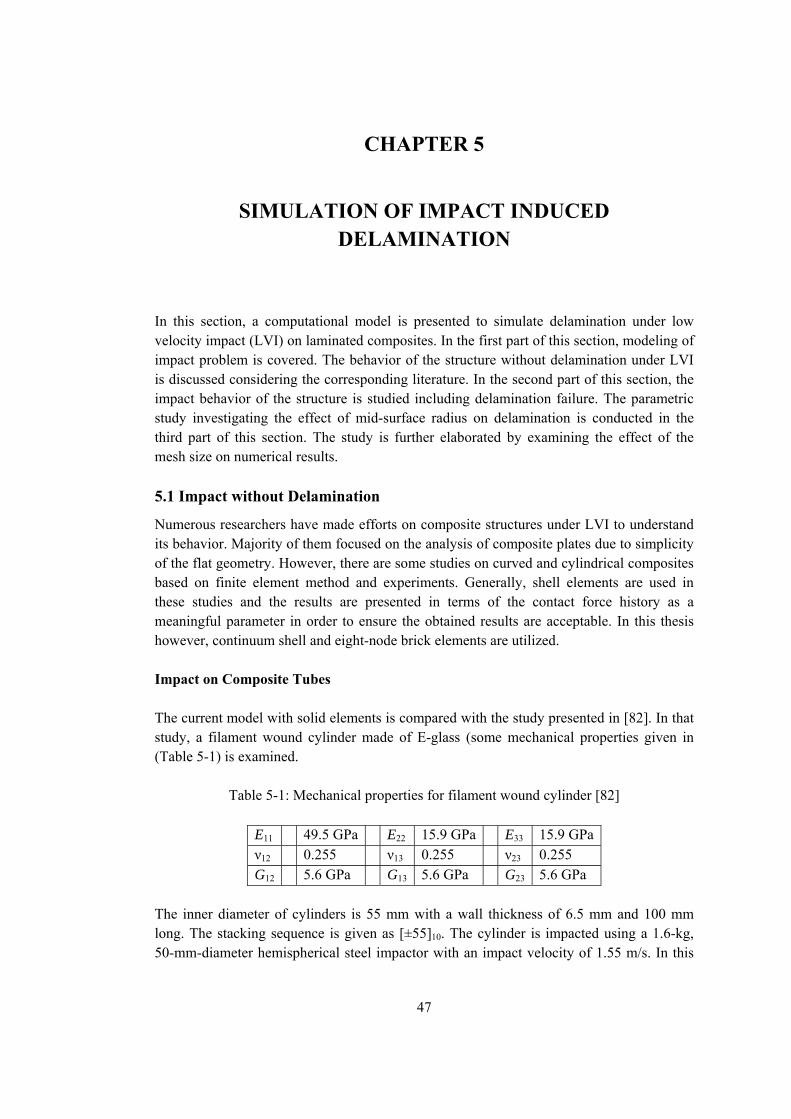
47
CHAPTER 5
SIMULATION OF IMPACT INDUCED DELAMINATION
In this section, a computational model is presented to simulate delamination under low velocity impact (LVI) on laminated composites. In the first part of this section, modeling of impact problem is covered. The behavior of the structure without delamination under LVI is discussed considering the corresponding literature. In the second part of this section, the impact behavior of the structure is studied including delamination failure. The parametric study investigating the effect of mid-surface radius on delamination is conducted in the third part of this section. The study is further elaborated by examining the effect of the mesh size on numerical results. 5.1 Impact without Delamination
Numerous researchers have made efforts on composite structures under LVI to understand its behavior. Majority of them focused on the analysis of composite plates due to simplicity of the flat geometry. However, there are some studies on curved and cylindrical composites based on finite element method and experiments. Generally, shell elements are used in these studies and the results are presented in terms of the contact force history as a meaningful parameter in order to ensure the obtained results are acceptable. In this thesis however, continuum shell and eight-node brick elements are utilized. Impact on Composite Tubes The current model with solid elements is compared with the study presented in [82]. In that study, a filament wound cylinder made of E-glass (some mechanical properties given in (Table 5-1) is examined.
Table 5-1: Mechanical properties for filament wound cylinder [82]
E11 49.5 GPa E22 15.9 GPa E33 15.9 GPa ν12 0.255 ν13 0.255 ν23 0.255 G12 5.6 GPa G13 5.6 GPa G23 5.6 GPa
The inner diameter of cylinders is 55 mm with a wall thickness of 6.5 mm and 100 mm long. The stacking sequence is given as [±55]10. The cylinder is impacted using a 1.6-kg, 50-mm-diameter hemispherical steel impactor with an impact velocity of 1.55 m/s. In this

48
study, the cylinder is assumed to be supported by a rigid cradle as in [82] and the finite element model is shown in Figure 5-1.
Figure 5-1: Finite element model for filament wound cylinder subjected to impact
The contact force history obtained in this study and those presented in [82] are shown in Figure 5-2. It is shown that solid and continuum shell element results of this study are closer to test results of [82] and they have a better comparison compared with explicit simulation results of [82]. Although the model constructed by using shell elements requires less time than the one with solid elements, solid elements are to be required for simulating delamination later.

49
Figure 5-2: Comparison of contact force history of cylinder subjected to impact
5.2 Impact Induced Delamination
In order to model delamination induced by impact, a cohesive zone method (CZM) is used in this thesis. The results of this model are validated by comparing them with those of [38]. In that study, the cohesive zone approach is utilized for the damage prediction of laminated plates subjected to low velocity impact. They use Hou criterion [88] for damage initiation and the power law with exponent α=1 for damage propagation. They validate their results with experimental data. The graphite/epoxy laminate used in that study is 65x87.5 mm in size, and it has a stacking sequence of [03/903]s. The hemispherical impactor is 2.3 kg and its diameter is 12.5 mm. The corresponding laminate and interface material properties used in that study are given in Table 5-2 and 5.3, respectively.
Table 5-2: Material data for graphite/epoxy laminate [38]
E11 E11 93.7 GPa E22 7.45 GPa E33 7.45 GPa ν12 ν12 0.261 ν13 0.261 ν23 0.261 G12 G12 3.97 GPa G13 3.97 GPa G23 3.97 GPa

50
Table 5-3: Material parameters used in the interface cohesive element [38]
Mode I Mode II Mode III Penalty stiffness (K1, K2, K3) (GPa/mm) 120 43 43
Interlaminar strength (N, S, T) (MPa) 30 80 80 Interlaminar fracture toughness (GI, GII, GIII) (J/m2) 520 970 970
The constructed finite element model is represented in Figure 5-3. The quarter of the laminate is modeled because of the material and geometrical symmetry. Another important feature of the model is that (0)3 and (90)3 sublaminates are clustered and modeled as solid elements (C3D8R) as shown in Figure 5-3.
Figure 5-3: FE model of [03/903]s graphite/epoxy laminate
The interface elements are built by solid elements specialized for cohesive application (COH3D8) and placed between 0/90 and 90/0 interfaces. The interface thickness is taken to be 0.02 mm. Although there is no information about the element type and material of the impactor in [38], it is modeled here by rigid elements (R3D4). According to the experimental observations [38], matrix cracks develop in 0° layers in along 0° direction. They use vertical cohesive elements on the symmetry plane parallel to 0° direction in 0° sublaminates in order to simulate the matrix cracks. In our study, the above parameters and mentioned methodology given in [38] are directly used. There is an exception in terms of the damage initiation criteria. The quadratic nominal stress criterion (QNSC) given in Eq. (3.22) is used in the current study as opposed to the Hou criterion used in [38].
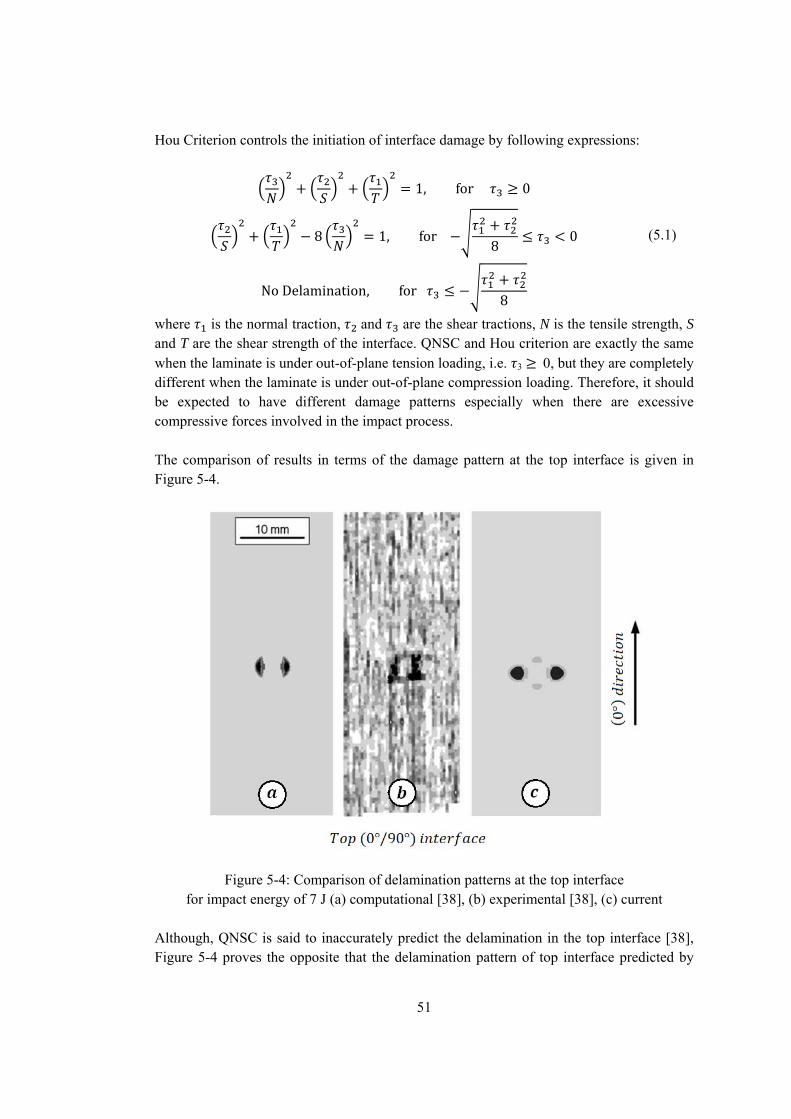
51
Hou Criterion controls the initiation of interface damage by following expressions:
1, for 0
8 1, for 8
0
No Delamination, for8
(5.1)
where is the normal traction, and are the shear tractions, N is the tensile strength, S and T are the shear strength of the interface. QNSC and Hou criterion are exactly the same when the laminate is under out-of-plane tension loading, i.e. 3 0, but they are completely different when the laminate is under out-of-plane compression loading. Therefore, it should be expected to have different damage patterns especially when there are excessive compressive forces involved in the impact process. The comparison of results in terms of the damage pattern at the top interface is given in Figure 5-4.
Figure 5-4: Comparison of delamination patterns at the top interface for impact energy of 7 J (a) computational [38], (b) experimental [38], (c) current
Although, QNSC is said to inaccurately predict the delamination in the top interface [38], Figure 5-4 proves the opposite that the delamination pattern of top interface predicted by
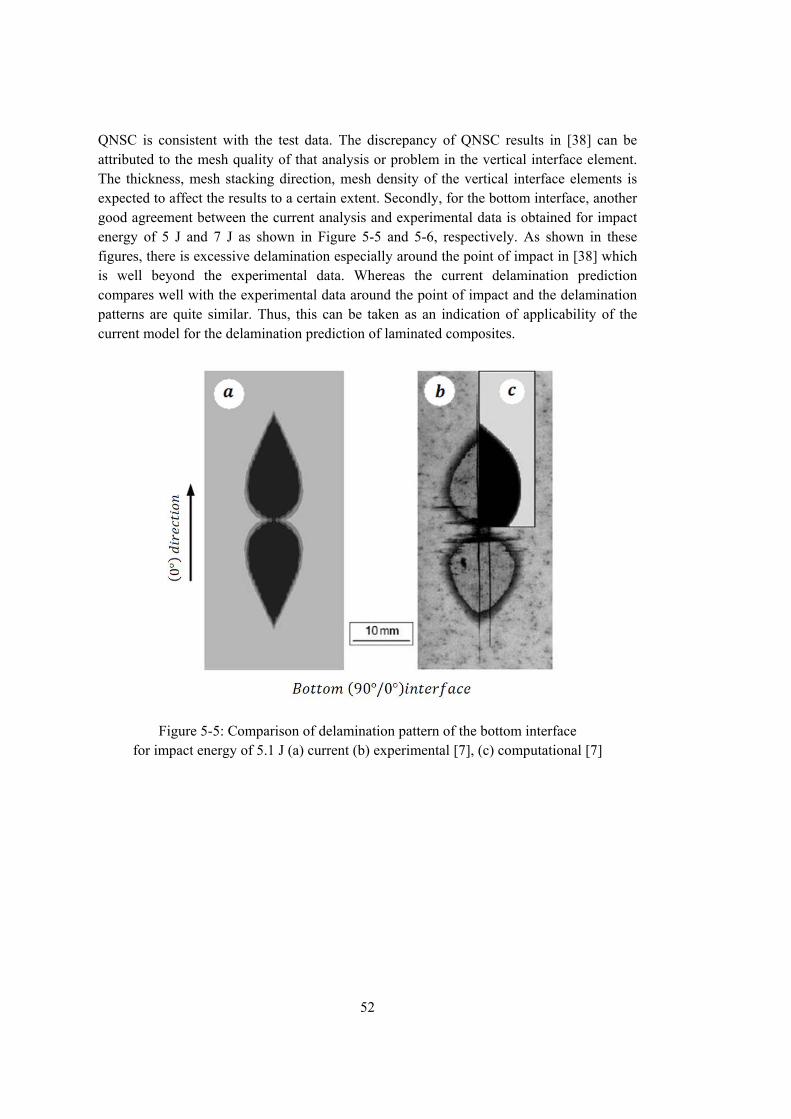
52
QNSC is consistent with the test data. The discrepancy of QNSC results in [38] can be attributed to the mesh quality of that analysis or problem in the vertical interface element. The thickness, mesh stacking direction, mesh density of the vertical interface elements is expected to affect the results to a certain extent. Secondly, for the bottom interface, another good agreement between the current analysis and experimental data is obtained for impact energy of 5 J and 7 J as shown in Figure 5-5 and 5-6, respectively. As shown in these figures, there is excessive delamination especially around the point of impact in [38] which is well beyond the experimental data. Whereas the current delamination prediction compares well with the experimental data around the point of impact and the delamination patterns are quite similar. Thus, this can be taken as an indication of applicability of the current model for the delamination prediction of laminated composites.
Figure 5-5: Comparison of delamination pattern of the bottom interface for impact energy of 5.1 J (a) current (b) experimental [7], (c) computational [7]

53
Figure 5-6: Comparison of delamination patterns of the bottom interface for impact energy of 7 J (a) computational [7], (b) experimental [7], (c) current
5.3 Parametric Study on Curved Laminated Composites
In this part, the effect of the curvature on the dynamic behavior of the curved composite laminate is investigated with different radii changing from 100 to 180 mm Figure 5-7. Moreover, this study also focuses on the behavior of the laminates with and without delamination. Therefore, the impact analysis are firstly performed without applying cohesive elements and then these results are compared with the ones in which the cohesive elements are used. The material and laminate properties are taken from [38] since an experimental study having this configuration is not found in literature. The stacking sequence is also similar as [03/903]s. The geometry of the laminates is presented in Figure 5-7. The parametric study is based on the variation of the radius of curvature of the laminate mid-surface while other dimensions are kept constant. The arc length and the width of the laminate are 80 mm each while its thickness is 2 mm for the given stacking sequence.

54
Figure 5-7: Schematic representation of curved laminate
The curved laminates are impacted by a 2.3 kg impactor which has a hemispherical indenter of 12.5 mm in diameter. The simply supported boundary conditions are applied to the curved laminate. The sublaminates of curved laminate are modeled using the eight-node linear brick elements (C3D8) and interfaces are modeled using the eight-node three-dimensional cohesive elements (COH3D8).
5.3.1 Impact without Cohesive Elements
In this part, the analysis is carried out without implementing cohesive elements between layers of dissimilar orientations assuming that there will not be no delamination during the impact. The reason for this model is to obtain mechanical characteristics of laminates irrespective of cohesive elements. Figure 5-8 shows the midpoint displacements of the curved laminate for radius varying from 100 to 180 mm. It is expected that the laminate having smaller radius should deflect less than others because of the increasing stiffness with decreasing radius. Hence, the laminates with larger radius can deflect more than the laminates with smaller radius, or in other words, the former absorbs more energy in the form of strain energy. Similarly, the contact force should be higher for laminates having smaller radius as shown in Figure 5-9.
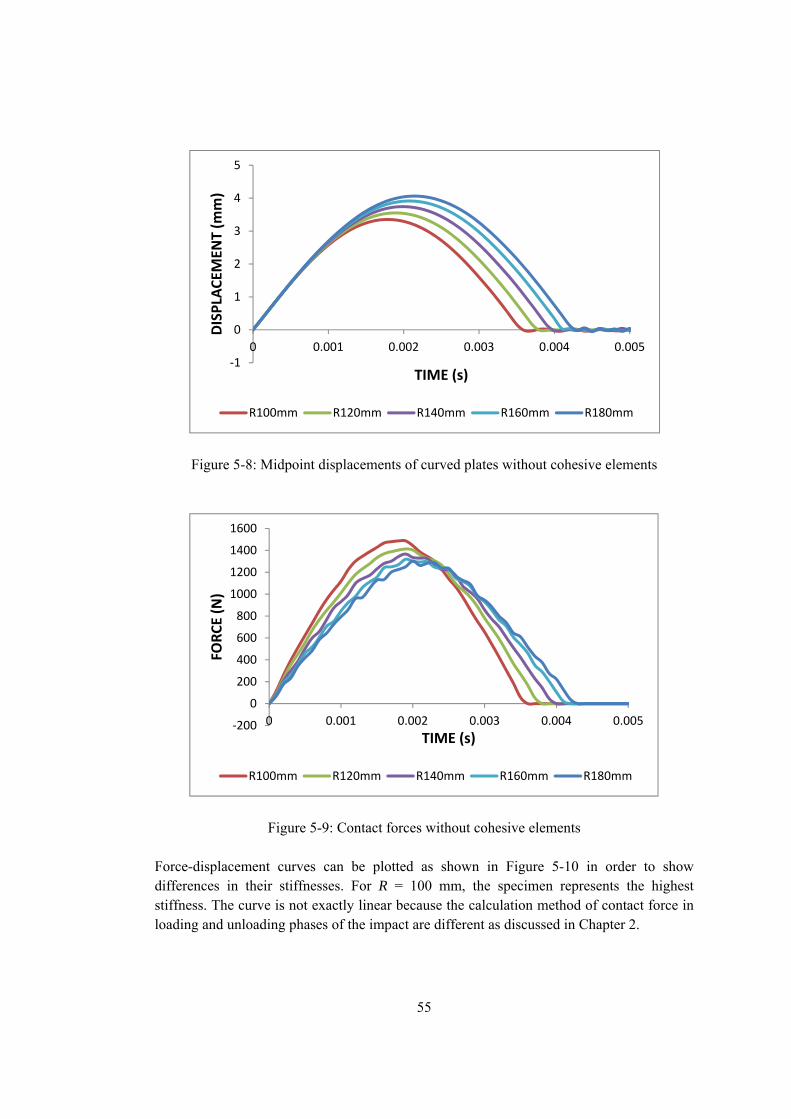
55
Figure 5-8: Midpoint displacements of curved plates without cohesive elements
Figure 5-9: Contact forces without cohesive elements Force-displacement curves can be plotted as shown in Figure 5-10 in order to show differences in their stiffnesses. For R = 100 mm, the specimen represents the highest stiffness. The curve is not exactly linear because the calculation method of contact force in loading and unloading phases of the impact are different as discussed in Chapter 2.
‐1
0
1
2
3
4
5
0 0.001 0.002 0.003 0.004 0.005
DISPLACE
MEN
T (m
m)
TIME (s)
R100mm R120mm R140mm R160mm R180mm
‐200
0
200
400
600
800
1000
1200
1400
1600
0 0.001 0.002 0.003 0.004 0.005
FORC
E (N)
TIME (s)
R100mm R120mm R140mm R160mm R180mm

56
Figure 5-10: Contact forces vs. midpoint displacement without cohesive elements
5.3.2 Impact with Cohesive Elements
The next analyses are carried out with implementing cohesive elements between layers of dissimilar orientations assuming that this time there will be delamination during impact. In this part, the kinetic energy of the impactor is not only absorbed in the form of the strain energy as well as in the form of delamination. Hence it is expected to have significantly different results. The prediction of delamination area is given in Table 5-4. In the top interface (0/90 interface), no significant delamination is obtained. However, in the bottom interface (90/0 interface) a considerable amount of delamination is observed to occur. The size of the delamination area is getting smaller as the laminate radius getting larger (Figure 5-11). This result is reasonable since the laminate with R = 100 mm is not able to absorb the impact energy as much as other laminates. Therefore, the available energy is transferred to the interface which results in more delamination. On the other hand, the laminate with largest radius gets less damage since it can deflect more due to its lower stiffness.
Table 5-4: Delamination area of 0/90 and 90/0 interface
Delamination area (mm2) R (mm) 0/90 interface 90/0 interface
100 6 456 120 6 352 140 8 308 160 8 264 180 8 240
0
200
400
600
800
1000
1200
1400
1600
0 1 2 3 4 5
FORC
E (N)
DISPLACEMENT (s)
R100mm R120mm R140mm R160mm R180mm
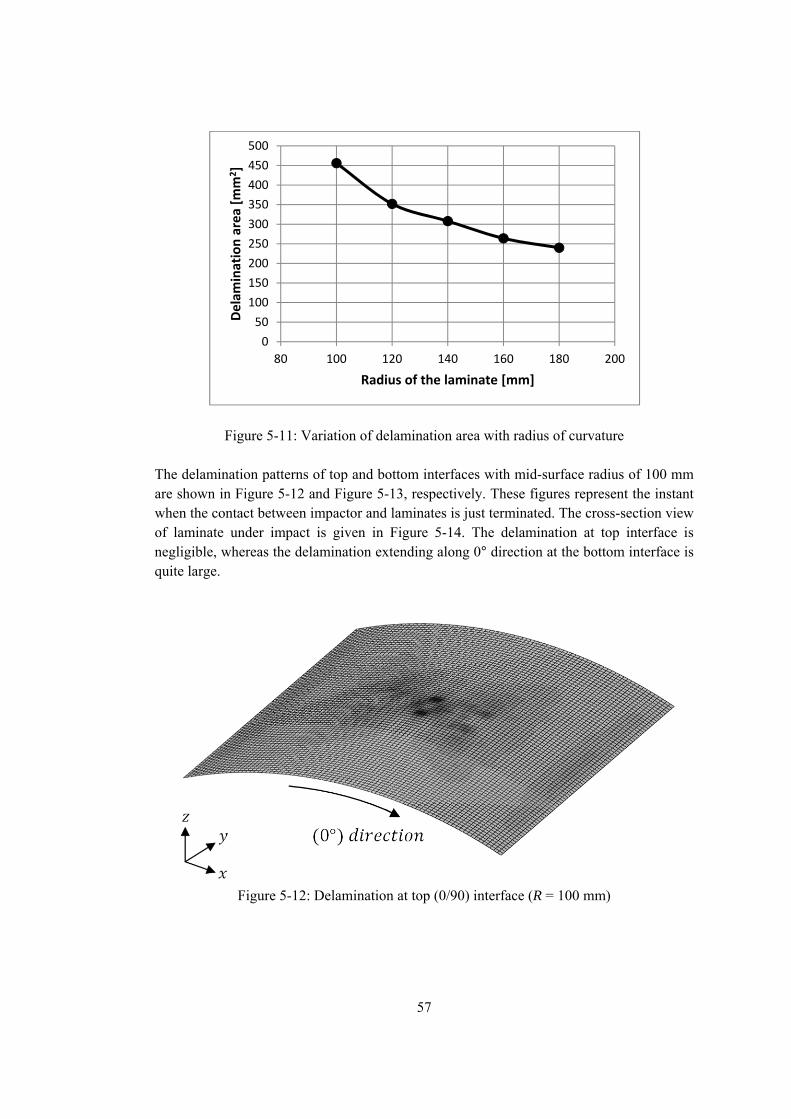
57
Figure 5-11: Variation of delamination area with radius of curvature The delamination patterns of top and bottom interfaces with mid-surface radius of 100 mm are shown in Figure 5-12 and Figure 5-13, respectively. These figures represent the instant when the contact between impactor and laminates is just terminated. The cross-section view of laminate under impact is given in Figure 5-14. The delamination at top interface is negligible, whereas the delamination extending along 0° direction at the bottom interface is quite large.
Figure 5-12: Delamination at top (0/90) interface (R = 100 mm)
0
50
100
150
200
250
300
350
400
450
500
80 100 120 140 160 180 200
Delam
ination area
[mm
2 ]
Radius of the laminate [mm]
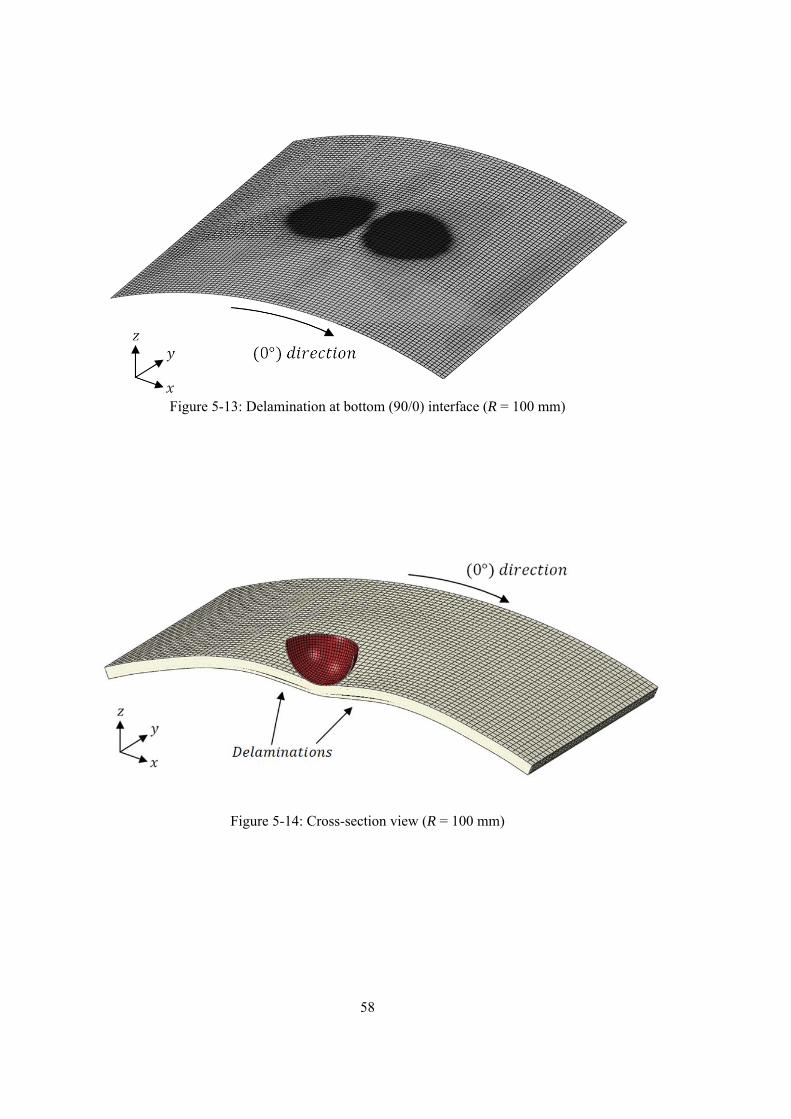
58
Figure 5-13: Delamination at bottom (90/0) interface (R = 100 mm)
Figure 5-14: Cross-section view (R = 100 mm)
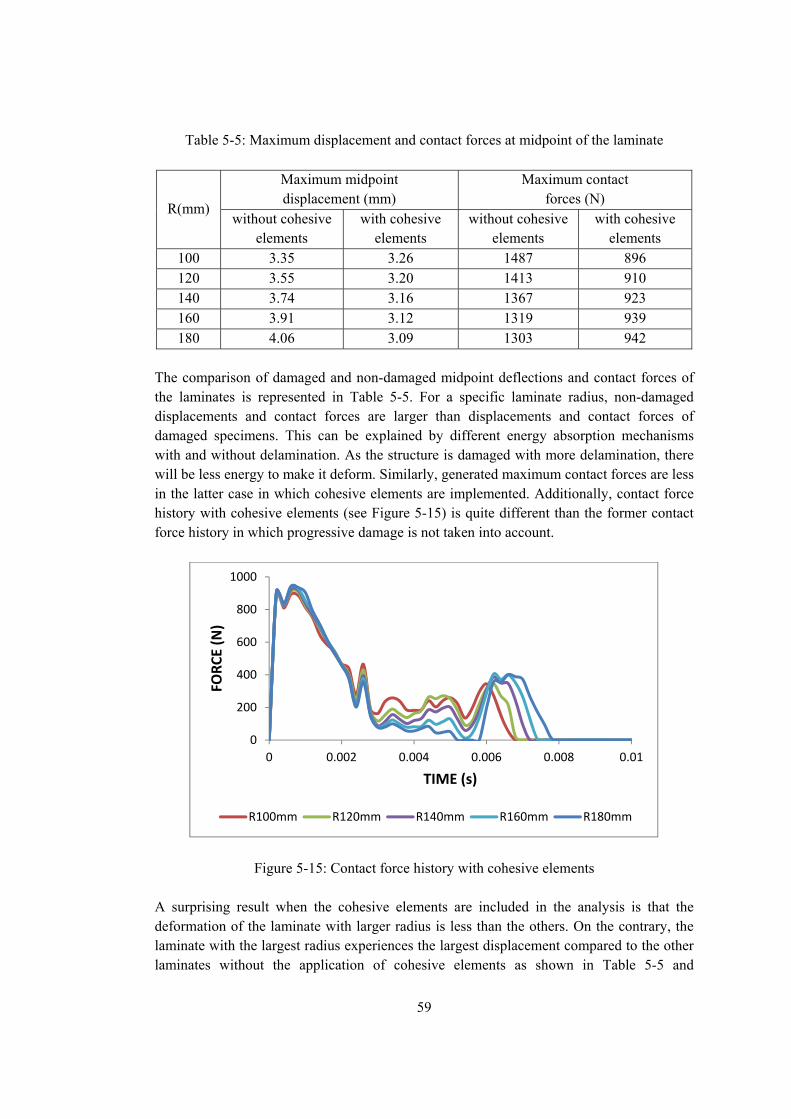
59
Table 5-5: Maximum displacement and contact forces at midpoint of the laminate
R(mm)
Maximum midpoint displacement (mm)
Maximum contact forces (N)
without cohesive elements
with cohesive elements
without cohesive elements
with cohesive elements
100 3.35 3.26 1487 896 120 3.55 3.20 1413 910 140 3.74 3.16 1367 923 160 3.91 3.12 1319 939 180 4.06 3.09 1303 942
The comparison of damaged and non-damaged midpoint deflections and contact forces of the laminates is represented in Table 5-5. For a specific laminate radius, non-damaged displacements and contact forces are larger than displacements and contact forces of damaged specimens. This can be explained by different energy absorption mechanisms with and without delamination. As the structure is damaged with more delamination, there will be less energy to make it deform. Similarly, generated maximum contact forces are less in the latter case in which cohesive elements are implemented. Additionally, contact force history with cohesive elements (see Figure 5-15) is quite different than the former contact force history in which progressive damage is not taken into account.
Figure 5-15: Contact force history with cohesive elements A surprising result when the cohesive elements are included in the analysis is that the deformation of the laminate with larger radius is less than the others. On the contrary, the laminate with the largest radius experiences the largest displacement compared to the other laminates without the application of cohesive elements as shown in Table 5-5 and
0
200
400
600
800
1000
0 0.002 0.004 0.006 0.008 0.01
FORC
E (N)
TIME (s)
R100mm R120mm R140mm R160mm R180mm

60
Figure 5-16. Although the midpoint displacements of the laminates are decreased with laminate radius, it is questionable that the laminate with the largest radius experiences the least midpoint displacement. This result cannot be intuitively predicted. The trend of maximum midpoint displacements significantly changes by incorporating cohesive elements into FEM as shown in Figure 5-17.
Figure 5-16: Midpoint displacement of the curved plates with cohesive elements
Figure 5-17: Maximum midpoint deflections vs. radius of the laminate
‐1
0
1
2
3
4
5
0 0.002 0.004 0.006 0.008 0.01
DISPLACE
MEN
T (m
m)
TIME (s)
R100mm R120mm R140mm R160mm R180mm
2
2.5
3
3.5
4
4.5
80 100 120 140 160 180 200
Maxim
um m
idpo
int de
flection [m
m]
Radius of the laminate [mm]
With Delamination Without Delamination
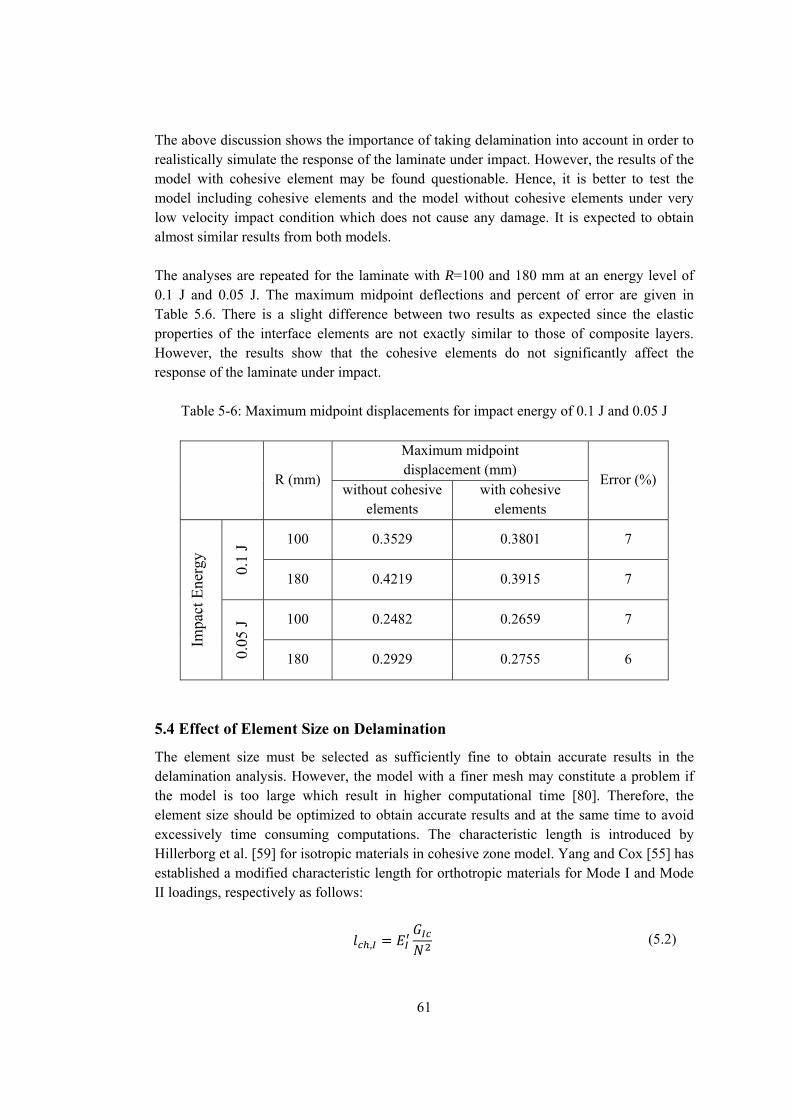
61
The above discussion shows the importance of taking delamination into account in order to realistically simulate the response of the laminate under impact. However, the results of the model with cohesive element may be found questionable. Hence, it is better to test the model including cohesive elements and the model without cohesive elements under very low velocity impact condition which does not cause any damage. It is expected to obtain almost similar results from both models. The analyses are repeated for the laminate with R=100 and 180 mm at an energy level of 0.1 J and 0.05 J. The maximum midpoint deflections and percent of error are given in Table 5.6. There is a slight difference between two results as expected since the elastic properties of the interface elements are not exactly similar to those of composite layers. However, the results show that the cohesive elements do not significantly affect the response of the laminate under impact.
Table 5-6: Maximum midpoint displacements for impact energy of 0.1 J and 0.05 J
R (mm)
Maximum midpoint displacement (mm)
Error (%) without cohesive
elements with cohesive
elements
Impa
ct E
nerg
y
0.1
J 100 0.3529 0.3801 7
180 0.4219 0.3915 7
0.05
J 100 0.2482 0.2659 7
180 0.2929 0.2755 6
5.4 Effect of Element Size on Delamination
The element size must be selected as sufficiently fine to obtain accurate results in the delamination analysis. However, the model with a finer mesh may constitute a problem if the model is too large which result in higher computational time [80]. Therefore, the element size should be optimized to obtain accurate results and at the same time to avoid excessively time consuming computations. The characteristic length is introduced by Hillerborg et al. [59] for isotropic materials in cohesive zone model. Yang and Cox [55] has established a modified characteristic length for orthotropic materials for Mode I and Mode II loadings, respectively as follows:
, (5.2)

62
, (5.3)
where I and II are equivalent elastic moduli which are calculated as
12
/ 22
(5.4)
1
/2 / /2 (5.5)
where
1/ / 1/ (5.6) 1/ / 1/
1/ / 1/ The element size in the cohesive zone is defined by the following relation
(5.7)
where represents the number of elements in that characteristic length. Inaccurate results may be obtained when there are an insufficient number of elements in the characteristic length. However, the optimum number of elements in a cohesive zone is not well defined [84]. The number of elements in the characteristic cohesive length varies between 2 and 10 elements for different studies [84]. In this study (see Sections 5.2 and 5.3), the analysis is performed by selecting an average number of 5 for required elements in the characteristic cohesive length. Thus, according to the material properties given in Table 5-2 and Table 5-3, the mesh sizes are calculated as 1.24 and 1.15 mm for Mode-I and Mode-II loading, respectively, by using Eq. (5.2), (5.3) and (5.7). From these results, the cohesive zones are meshed by elements with the average length of 1 mm. The analysis in Section 5.3 is repeated for R = 100 mm with different element sizes. It is found that results diverge if the finer meshes are used as shown in Figure 5-18. As mentioned above, the element length is selected as 1 mm. As can be seen from Figure 5-18, the top interface delamination almost vanishes for 1.33 mm whereas a distinguishable amount of delaminated area exists in the results of the model having element length of 1 mm. The delamination area looks like the shape of peanut. For 0.8 mm, the top interface delamination area is still quite small compared to the bottom interface delamination area. The top interface delamination area increases as the element sizes are
63
getting smaller to the point that it becomes comparable with the bottom interface delamination area. It is shown that there is a sudden increase in the size of top interface delamination area after 0.66 mm. This situation is shown in Figure 5-18. From Figure 5-18 it can be observed that there is an abrupt change in top interface delamination area for 0.5 mm. It can be said that these unexpected and probably inaccurate results are obtained as moving away from optimum element length. The effect of element size can be discussed for the bottom interface damage pattern as well. Similarly, there is no significant change in the corresponding delamination area as shown in Figure 5-18 for all element lengths except 0.5 mm.

64
Element length, (mm)
Top interface (0/90) Bottom interface (90/0)
1.33
1
0.8
0.66
0.5
Figure 5-18: Effect of element size on delamination pattern

65
CHAPTER 6
CONCLUSIONS AND FURTHER STUDIES In this study, finite element analysis of laminated composites under low velocity impact is studied for delamination failure. A three-dimensional finite element model is successfully constructed including contact algorithm, failure criterion for initiation and propagation of delamination. Hertz Contact law is implemented to simulate contact between impactor and the laminated composite. The delamination initiation is determined by using the stress based quadratic failure criteria, whereas the delamination propagation is computed by Power Law criteria. The damage of interface is simulated by specialized interface elements using cohesive zone method which is a unified method based on damage mechanics and also utilizing the fracture mechanics indirectly. The laminated composite is modeled using eight-node brick elements. Similarly, the eight-node brick elements are also used to model the interface which is between layers having dissimilar ply orientations. The layers having similar ply orientation are clustered in accordance with the previous studies to expedite the analysis. As mentioned in Chapter 5, the contact force history is one of the significant data which are often compared with previous and present works in order to validate the model before using the solid elements with cohesive zone method. Therefore, the analysis on impact of a composite tube is performed with solid elements without applying cohesive zone method in the first part. In other words, the delamination is not monitored in this part. The performance of solid elements is compared with shell element and the experimental and numeric results of previous study. Although the contact force history does not exactly follow neither previous numerical analysis nor the experiment, the result is acceptable in terms of peak contact force and duration of impact. It is thought that this small discrepancy is due to the element type used in the analysis and mesh density of the model. In the second part of analysis, a laminate having an orientation of [03/906/03] is analyzed and the results are compared with previous experimental data. The damage initiation criterion used in current study is different from previous study. However, the delamination pattern especially around the point of impact compares well with experimental data where the previous numerical analysis provides incorrect results around that point. This analysis constitutes the core of the thesis and plays crucial role in following discussions. The obtained result is also a good indication about the applicability of this finite element model. The third part of the analysis is regarding to parametric study on effect of curvature in delamination. The material used and the configuration is the same with the analysis performed for validation of finite element model in Section 5.2 since there is no

66
experimental setup for the parametric study. The study can be divided in two parts. Firstly, the cohesive elements are not included in the analysis. The global behavior of laminates is determined in terms of mid-point displacement of the laminate and contact force. The laminate with larger radius experiences less displacement. Moreover, the contact forces are becomes smaller as reducing the curvature due to the ability of absorbing energy of the impact elastically. It is clear that these results are obtained as expected. Secondly, cohesive elements are introduced between layers having dissimilar ply orientation. The laminate with larger curvature absorbs more the impact energy by means of strain energy compared to the laminate with smaller curvature so that the former experiences less delamination than latter. Although this result is predictable, the change in midpoint displacement characteristics is what is surprising for this work. From the comparison of all results, the laminate with the larger radius experiences larger displacement compared to the other laminates where the cohesive elements are not implemented. The larger displacement is unexpectedly experienced by the laminate having smaller radius where the cohesive elements are included in the analysis. The last part of the analysis covers the effect of global element length on delamination characteristic. The number of elements suggested to be in the characteristic cohesive zone is not well established in literature. Generally, the number of elements existing in the characteristic cohesive length is selected as Ne=5 so that it makes the element length approximately 1 mm. The analysis in Section 5.3 is repeated for curved laminate (R = 100) in order to show the effect of mesh density on delamination. That effect is investigated by applying different the element lengths between 1.33 mm and 0.5 mm which is to indirectly say that the number of elements in the characteristic cohesive length is in between Ne=4 to Ne=10. The top and bottom interface delamination patterns are compared and results are relatively similar for le=1.33 and 1 mm. The dependency of the finite element model on mesh is not significant until the element length is set to be le=0.8 mm. As the element lengths are getting smaller than that, the top interface delamination area becomes comparable with the bottom interface. Another important result to be noticed is that the bottom interface delamination does not change much until the element length is set as le=0.66 mm. With an element length of le=0.5 mm, the results lose their consistency. From the outcome of that investigation it is possible to conclude that the cohesive zone method may has a mesh sensitivity which is negatively affected from the excessive mesh size refinement. However, this mesh dependency problem is not observed in Section 5.2 in which the composite laminate is planar. Therefore, it is also possible that there may be a geometrical dependence. The findings suggest that this method should be carefully used. To discover the effects of mesh and geometry on delamination, the more elaborate study should be conducted by comparing the numerical results with experimental data. The numerical simulation is performed on a computer with 2.67 GHz Intel® Xeon® CPU w3520 12 GB RAM. The analysis performed in Section 5.4 is the most time consuming one with approximately 630000 increments. The stable time increment for this analysis is approximately set to 1e seconds and the analysis takes almost 50 hours to by using four
67
processors in parallel. The number of elements, nodes and variables in this analysis is 51502, 59381 and 178146, respectively. In this thesis, the verification of cohesive zone method, the effects of curvature and mesh size are studied and discussed in detailed. However, more research in delamination analysis with the cohesive zone method is still necessary before obtaining a definitive answer to applicability of the method for prediction of delamination in laminated composites. In our future research we intend to concentrate on building a complete model which takes into account fiber and matrix related damages. Although fiber or matrix failures are not observed in our case, they can be experienced in more severe loading conditions. These damages can be implemented by using a user defined subroutine VUMAT which is used to define the mechanical behavior of the material. The ply clustering as a simplification is applied throughout the study in order to decrease the number of elements used yielding significant speed up in calculations. This method basically unites the layer with the same stacking orientation, whereas the interface elements are placed between the neighboring layers with different orientations. It is shown that the this approach is applicable to the delamination analysis and gives compatible results with experimental results provided by [38] as discussed in Section 5.2. However, in our future research we intend to extend our knowledge on the applicability of clustering approach. The model can be constructed such that the cohesive elements can be introduced between each layer. Hence, the effect of ply clustering on delamination pattern can be investigated. It is known that the fracture toughness differs with fiber orientation [62], [85], [86]. Therefore, properties of every interface including interfaces between layers with same fiber orientation, i.e. θ°/θ° interfaces, have to be well defined in order to obtain accurate results. θ°/θ° interfaces does not exist in clustered models since the layers with same orientation are united. It is expected that if the same properties are used in every interface, there will be slight discrepancy with the results of clustered model. This discrepancy is expected due to the energy absorption potential of the θ°/θ° interfaces. Actually, the delamination area of the transition interfaces between layers having dissimilar fiber orientation must be decrease since θ°/θ° interfaces are able to share the damage. Furthermore, the new delaminations can be even developed between θ°/θ° interfaces. The computation time is one of the important issues in comparison between the detailed model and the clustered model. If there is not a significant change in delamination results, the detailed model may not be favorable considering the computational expense of an excessively large model. Moreover, the computation time may constitute a limitation when a large structural model is to be analyzed. In conclusion, further research will be needed to clarify the effect of clustering on delamination results by establishing the detailed model solution. The second simplification which is used throughout this study is to perform the analysis by using quarter model due to geometrical and material symmetry of the laminate in order to speed up the analysis. Although the quarter model is validated with previous experimental results, further research is necessary to investigate the performance of the full model. The

68
computation time is expected to be much more than the quarter model since number of elements increases by 4. Therefore, there is a need for a judgment on whether the full model worth to analyze or not considering the computation time and accuracy of the results. In our future research we also intend to concentrate on building a complete model which takes into account fiber and matrix related damages.
69
REFERENCES [1] Camanho PP, Davila CG, Ambur DR. Numerical Simulation of Delamination
Growth in Composite Materials, NASA/TP-2001-211041 2001. [2] O’Brien TK. Fracture Mechanics of Composite Delamination. Volume 21 of ASM
Handbook. 2001. [3] Johnson HE, Louca LA, Mouring SE, Calvano CN. Damage Modeling of Large
and Small Scale Composite Panels Subjected to a Low Velocity Impact. 2006:1-3. [4] Nilsson KF, Asp LE, Alpman JE, Nystedt L. Delamination Buckling and Growth
for Delaminations at Different Depths in a Slender Composite Panel. International Journal of Solids and Structures. 2001; 38:3039-3071.
[5] Wang RG, Zhang L, Zhang J, Liu WB, He XD. Numerical Analysis of
Delamination Buckling and Growth in Slender Laminated Composite Using Cohesive Element Method. Computational Materials Science. 2010; 50:20–31.
[6] Reeder JR, Song K, Chunchu PB, Ambur DR. American Institute of Aeronautics
and Astronautics. 2002. [7] Satyanarayana A, Bogert PB, Chunchu PB. The Effect of Delamination on Damage
Path and Failure Load Prediction for Notched Composite Laminates. 48th AIAA Structures, Structural Dynamics, and Materials Conference, Hawaii. 2007.
[8] Gözlüklü B, Coker D. Modeling of the Dynamic Delamination of L-Shaped
Unidirectional Laminated Composites. Composite Structures. 2012; 94:1430–1442. [9] Kim SJ, Goo NS, Kim TW. The Effect of Curvature on the Dynamic Response and
Impact-Induced Damage in Composite Laminates. Composites Science and Technology. 1997; 51:763-773.
[10] Her SC, Liang YC. The Finite Element Analysis of Composite Laminates and Shell
Structures Subjected to Low Velocity Impact. Composite Structures. 2004; 66:277–285.
[11] Changliang Z, Mingfa R, Wei Z, Haoran C. Delamination Prediction of Composite
Filament Wound Vessel with Metal Liner under Low Velocity Impact. Composite Structures. 2006; 75:387–392.

70
[12] Chang FK, Chang KY. A progressive damage model for laminated composites containing stress concentrations. J Compos Mater 1987;21:835–55.
[13] Chakraborty D. Delamination Of Laminated Fiber Reinforced Plastic Composites
Under Multiple Cylindrical Impact. Materials and Design. 2007; 28:1142–1153. [14] Zhang Y, Zhu P, Lai X. Finite Element Analysis of Low-Velocity Impact Damage
in Composite Laminated Plates. Materials and Design. 2006; 27: 513–519. [15] Shi Y, Swait T, Soutis C. Modelling Damage Evolution in Composite Laminates
Subjected to Low Velocity Impact. Composite Structures. 2012; 94:2902–2913. [16] Kostopoulos V, Markopoulos YP, Giannopoulos G, Vlachos DE. Finite Element
Analysis of Impact Damage Response of Composite Motorcycle Safety Helmets. Composites: Part B. 2007; 33:99-107.
[17] Hallquist JO. LS-DYNA 940 Users Manual. Livermore: LSTC, 1998. [18] Hallquist JO. Stillman DW, Lin TL. LS DYNA 3D, Nonlinear dynamic analysis of
structures in three dimensions. Livermore: LSTC, 1992. [19] Pinnoji PK, Mahajan P. Analysis of impact-induced damage and delamination in
the composite shell of a helmet. Materials and Design. 2010; 31: 3716–3723. [20] Oka E, Ogi K, Yoshimura A, Okabe T. High-Velocity Impact Damage Progress in
CFRP Laminates. 18th International Conference on Composite Materials. 2011. [21] Askari E, Xu J, Silling S. Peridynamic Analysis of Damage and Failure in
Composites. 44th AIAA Aerospace Sciences Meeting and Exhibit. AIAA 2006-88. [22] Albert Turon A, Camanho PP, Costa J, Dávila CG. An Interface Damage Model for
the Simulation of Delamination Under Variable-Mode Ratio in Composite Materials. NASA/TM-2004-213277.
[23] Borg R, Nilsson L, Simonsson K. Simulation of Low Velocity Impact on Fiber
Laminates Using a Cohesive Zone Based Delamination Model. Composites Science and Technology. 2004; 64: 279–288.
[24] Hou JP, Petrinic N, Ruiz C. A Delamination Criterion for Laminated Composites
under Low-Velocity Impact. Composites Science and Technology. 2001; 61: 2069–2074.
71
[25] Kregting R. Cohesive zone models towards a robust implementation of irreversible behaviour. 2005.
[26] Krishnamurthy KS, Mahajan P, Mittal RK. A Parametric Study of The Impact
Response and Damage of Laminated Cylindrical Composite Shells. Composites Science and Technology. 2001; 61: 1655–1669.
[27] Moura MFSF, Gonçalves JPM. Modelling the Interaction between Matrix Cracking
and Delamination in Carbon–Epoxy Laminates under Low Velocity Impact. Composites Science and Technology. 2004; 64: 1021–1027.
[28] Pinho ST, Iannucci L, Robinson P. Formulation And Implementation of
Decohesion Elements in an Explicit Finite Element Code. Composites: Part A. 2006; 37: 778–789.
[29] Miller AG, Lovell DT, Seferis JC. The Evolution of an Aerospace Material:
Influence of Design, Manufacturing and In-Service Performance. Composite Structures. 1994; 27:193–206.
[30] Stronge WJ. Impact Mechanics. Cambridge University Press, 2000. [31] Vaidya UK. Impact Response of Laminated and Sandwich Composites. Impact
Engineering of Composite Structures. 2011:97-193. [32] Yang Sh, Sun Ct. Indentation Law for Composite Laminates.1981. [33] Chandrashekhara K, Schroeder T. Nonlinear Impact Analysis of Laminated
Cylindrical and Doubly Curved Shells. J Compos Mater 1995; 29:2160–79. [34] Abrate S. Impact on Composite Structures. 1998. [35] Donadon MV, Almeida SFM, Arbelo MA, Faria AR. A Three-Dimensional Ply
Failure Model for Composite Structures. International Journal of Aerospace Engineering. 2009, Article ID 486063.
[36] Gdoutos EE, Pilakoutas K, Rodopoulos CA. Failure Analysis of Industrial
Composite Materials. 2000. [37] Nairn JA. Matrix Microcracking in Composites. Polymer Matrix Composites,
Chapter 13. 2000.
72
[38] Aymerich F, Dore F, Priolo P. Prediction of Impact-Induced Delamination in Cross-Ply Composite Laminates Using Cohesive Interface Elements. Composites Science and Technology. 2008;68: 2383–2390.
[39] Camanho PP. Dávila CG. Mixed-Mode Decohesion Finite Elements for the
Simulation of Delamination in Composite Materials. NASA/TM-2002-211737. 2002.
[40] Gözlüklü B. Delamination Analysis by Using Cohesive Interface Elements in
Laminated Composites. 2009. [41] Elisa P. Virtual Crack Closure Technique and Finite Element Method for Predicting
the Delamination Growth Initiation in Composite Structures. Advances in Composite Materials - Analysis of Natural and Man-Made Materials.2011:463-480.
[42] Krüger R, König M. Investigation of Delamination Growth between Plies of
Dissimilar Orientations. ISD-Report 96/5, November 1996. [43] Krueger R. Virtual Crack Closure Technique: History, Approach, and Applications.
Appl. Mech. Rev. 2004; 57 (2): 109–143. [44] Jimenez MA, Miravete A. Application of the Finite-Element Method to Predict the
Onset of Delamination Growth. Journal of Composite Materials. 2004; 38: 1309-1335.
[45] Li HCH, Dharmawan F, Herszberg I, John S. Fracture Behaviour of Composite
Maritime T-Joints. Composite Structures. 2006; 75: 339–350. [46] Liu PF, Hou SJ, Chu JK, Hu XY, Zhou CL, Liu YL, Zheng JY, Zhao A, Yan L.
Finite Element Analysis of Postbuckling and Delamination of Composite Laminates Using Virtual Crack Closure Technique. Composite Structures 2011; 93: 1549–1560.
[47] Roeck GD, Wahab MMA. Strain Energy Release Rate Formulae for 3d Finite
Element. Engineering Fracture Mechanics Vol. 50, No. 4, Pp. 569-580, 1995. [48] Tawk I, Navarro P, Ferrero JF, Barrau JJ, Abdullah E. Composite Delamination
Modelling Using a Multi-Layered Solid Element. Composites Science and Technology. 2010; 70: 207–214.
[49] Wang JT, Raju IS, Sleight DW. Composite Skin-Stiffener Debond Analyses Using
Fracture Mechanics Approach with Shell Elements. Composites Engineering, Vol. 5, No. 3, pp. 277-296, 1995.

73
[50] Xie D, Biggers SB. Progressive Crack Growth Analysis Using Interface Element Based on the Virtual Crack Closure Technique. Finite Elements in Analysis and Design. 2006; 42: 977 – 984.
[51] Yang C, Chadegani A, Tomblin JS. Strain Energy Release Rate Determination of
Prescribed Cracks in Adhesively-Bonded Single-Lap Composite Joints with Thick Bondlines. Composites: Part B. 2008; 39: 863–873.
[52] König M, Krueger R, Rinderknecht S. Numerical Simulation of Delamination
Buckling and Growth. ICCM 10-Canada. 1995. [53] Dattaguru B, Venkatesha KS, Ramamurthy TS, Buchholz FG. Finite Element
Estimates of Strain Energy Release Rate Components at the Tip of an Interface Crack under Mode-I Loading. Engineering Fracture Mechanics. 1994; 49: 451–463.
[54] Raju IS, Crews JH, Aminpour MA. Convergence of Strain Energy Release Rate
Components for Edge-Delaminated Composite Laminates. Engineering Fracture Mechanics.1988; 30(3): 383-396.
[55] Yang Q, Cox B. Cohesive models for damage evolution in laminated composites.
International Journal of Fracture. 2005; 133:107–137. [56] Goyal VK, Johnson ER, Davila CG, Jaunky NJ. Irreversible Constitutive Law for
Modeling the Delamination Process Using Interface Elements. American Institute Of Aeronautics and Astronautics Paper 2002-1576.
[57] Dugdale DS. Yielding of Steel Sheets Containing Slits. Journal of Mechanics and
Physics of Solids, 1960; 8:100-104. [58] Barenblatt GI. Mathematical Theory of Equilibrium Cracks in Brittle Failure.
Advances in Applied Mechanics 1962;7. [59] Hillerborg, A, Modeer M, Petersson PE. Analysis of Crack Formation and Crack
Growth in Concrete By Means Of Fracture Mechanics and Finite Elements. Cement and Concrete Research. 1976;6: 773-782.
[60] ASTM Standard D5528-01. Standard Test Method for Mode I Interlaminar Fracture
Toughness of Unidirectional Fiber – Reinforced Polymer Matrix Composites. ASTM International, West Conshohocken PA; 2007.
[61] Tamuzs V, Tarasovs S, Vilks U. Progressive Delamination and Fiber Bridging
Modeling in Double Cantilever Beam Composite Specimens. Engineering Fracture Mechanics. 2001; 68: 513-525.
74
[62] Solaimurugan S, Velmurugan R. Influence of In-plane Fibre Orientation on Mode I Interlaminar Fracture Toughness of Stitched Glass/Polyester Composites. Composites Science and Technology. 2008; 68: 1742–1752.
[63] Choi NS, Kinloch AJ, Williams JG. Delamination Fracture of Multidirectional
Carbon-Fiber/Epoxy Composites under Mode I, Mode II and Mixed-Mode I/II Loading. Journal of Composite Materials.1999; 33: 73-100.
[64] Robinson P, Song DQ. A Modified DCB Specimen for Mode I Testing of
Multidirectional Laminates. Journal of Composite Materials. 1992; 26: 15-54. [65] O’Brien TK. Interlaminar Fracture Toughness: The Long and Winding Road to
Standardization. Composites Part B. 1998; 29B: 57-62. [66] Morais AB. Novel Cohesive Beam Model for The End-Notched Flexure (ENF)
Specimen. Engineering Fracture Mechanics. 2011; 78: 3017–3029. [67] Brunner AJ, Blackman BRK, Davies P. A Status Report on Delamination
Resistance Testing of Polymer-Matrix Composites.2008; 75(9): 2779-2794. [68] Cui W, Wisnom MR, Jones M. A Comparison of Failure Criteria to Predict
Delamination of Unidirectional Glass/Epoxy Specimens Waisted Through the Thickness. Composites. 1992; 23(3):158-66.
[69] Reeder JR, Crews JR. Mixed-Mode Bending Method for Delamination Testing.
AIAA Journal. 1990; 28:1270—1276. [70] Test Method D6671-01. Standard Test Method for Mixed Mode I Mode II
Interlaminar Fracture Toughness of Unidirectional Fiber Reinforced Polymer Matrix Composites. American Society for Testing and Materials, West Conshohocken, PA, USA. 2002.
[71] Benzeggagh ML, Kenane M. Measurement of Mixed-Mode Delamination Fracture
Toughness of Unidirectional Glass/Epoxy Composites with Mixed-Mode Bending Apparatus. Composites Science and Technology. 1996; 56:439-449.
[72] Wu Em, Router Rc. Crack Extension In Fiberglass Reinforced Plastics. University
Of Illinois. T. & AM Report No: 275. 1965. [73] Camanho PP, Davila CG, Moura MF. Numerical Simulation of Mixed-Mode
Progressive Delamination in Composite Materials. Journal of Composite Materials. 2003 37: 1415-1438.
75
[74] Cerioni A. Simulation of Delamination in Composite Materials under Static and Fatigue Loading By Cohesive Zone Models. 2009.
[75] Moura MFSF, Gonçalves JPM, Marques AT, Castro PMST. Prediction of
Compressive Strength of Carbon-Epoxy Laminatescontaining Delamination by Using a Mixed-Mode Damage Model. Composite Structures. 2000; 50: 151-157.
[76] Rice JR. A Path Independent Integral and the Approximate Analysis of Strain
Concentration by Notches and Cracks. Journal of Applied Mechanics, 1968; 35: 379-386.
[77] Alfano G, Crisfield MA. Finite Element Interface Models for the Delamination
Analysis of Laminated Composites: Mechanical and Computational Issues. International Journal for Numerical Methods in Engineering. 2001; 50:1701-1736.
[78] Li J, Sen JK. Analysis of Frame-to-Skin Joint Pull-Off Tests and Prediction of the
Delamination Failure. 42nd AIAA/ASME/ASCE/AHS/ASC Structures, Structural Dynamics and Materials Conference. 2000.
[79] Li J. Three-Dimensional Effects in the Prediction of Flange Delamination in
Composite Skin-Stringer Pull-Off Specimens. 15th Conference of the American Society for Composites. 2000: 983-90.
[80] Harper PW, Hallett SR. Cohesive zone length in numerical simulations of
composite delamination. Engineering Fracture Mechanics. 2008; 75: 4774–4792. [81] SIMULIA, ABAQUS 6.10-1. ABAQUS Analysis User's Manual. [82] Tarfaoui M, Gning PB, Hamitouche L. Dynamic Response and Damage Modeling
of Glass/Epoxy Tubular Structures: Numerical Investigation. Composites: Part A. 2008; 39: 1–12.
[83] Liu H. Ply Clusterıng Effect on Composite Laminates under Low-Velocity Impact
Using FEA. Cranfıeld University. 2012 [84] Turon A, Davila CG, Camanho PP, Costa J. An Engineering Solution for solving
Mesh Size Effects in the Simulation of Delamination with Cohesive Zone Models. 2005.
[85] Kim BW, Mayer AH. Influence of Fiber Direction and Mixed-Mode Ratio on
Delamination Fracture Toughness of Carbon/Epoxy Laminates. Composites Science and Technology. 2003; 63: 695–713.

76
[86] Solaimurugan S, Velmurugan R. Influence of Fibre Orientation and Stacking Sequence on Petalling of Glass/Polyester Composite Cylindrical Shells under Axial Compression. International Journal of Solids and Structures. 2007; 44: 6999–7020.
[87] Irwin GR. Fracture I, Handbuch der Physik VI, Flügge (ed), Springer Verlag,
Berlin, Germany, 1958: 558–590. [88] Hou JP, Petrinic N, Ruiz C. A Delamination Criterion for Laminated Composites
under Low-Velocity Impact. Compos Sci Technol. 2001;61:2069–74. [89] Harewood FJ, McHugh PE. Comparison of the Implicit and Explicit Finite Element
Methods Using Crystal Plasticity. Computational Materials Science. 2007; 39: 481–494.


![Advanced Composites - MEAN] Laboratory](https://static.fdocuments.net/doc/165x107/61bd0f4161276e740b0eefd9/advanced-composites-mean-laboratory.jpg)

