FACT SHEET 2017-2018 - mvnu. · PDF fileFACT SHEET 2017-2018. MVNU Average ACT Score: 2016:...
12
FACT SHEET 2017-2018
-
Upload
phungtuyen -
Category
Documents
-
view
214 -
download
0
Transcript of FACT SHEET 2017-2018 - mvnu. · PDF fileFACT SHEET 2017-2018. MVNU Average ACT Score: 2016:...

FACT SHEET 2017-2018

MVNU Average ACT Score: 2016: 23.0 2017: 22.5 National Average: 21.0New Students:
Traditional FF TR PS/GU RE-AD
Non-Traditional FR-SR GRAD
531 190Total = 721
2017 MVNU Retention Rate: 79%
Full-time Part-time Total FTEUndergraduates F M F MFirst-time in college (trad.) 207 123 0 0 330 335.9First-time in college (GPS) 12 1 67 28 108 51.8All other degree-seeking 649 395 89 52 1,185 1,120.5Total degree-seeking 868 519 156 80 1,623 1,508.2All non-degree seeking 31 21 105 48 205 168.9Total undergraduates 899 540 261 128 1,828 1,677.1Total graduates 129 88 128 49 394 366.2Total all students 1,028 628 389 177 2,222 2,043.3
Total Enrollment by Degree Status:
20172016 2017 Trad. Non-Trad. Total
Classif. Total Total F M F M F MFR 419 388 215 125 32 16 247 141SO 351 345 168 121 40 16 208 228JR 398 406 161 119 90 36 251 155SR 553 484 165 101 153 65 318 166PS 107 202 133 69 133 68GU/SC 3 3 3 3Grad 414 394 257 137 257 137Subtotal 842 535 575 270 1,417 805
Total 2,245 2,222 1,377 845 2,222
Total Enrollment by Classification:
Fall 2017 Enrollment
330
82108
166
9
26
Historical Headcount:
Non-Traditional Students:Site Location Undergraduate Graduate TotalColumbus-New Albany 34 85 119Mansfield 82 12 94Mount Vernon (downtown) 1 1Mount Vernon (main) 29 93 122Newark 59 9 68Online 247 192 439Video-conferencing 2 2Total 451 394 845
Year Trad. Non-Trad. Grad. Total2015 1,246 542 343 2,1312017 1.316 515 414 2,2452017 1,377 451 394 2,222
Ethnicity FTIC Trad. Non-Trad. Grad. TotalAmerican Indian/Alaskan 1 2 2Asian 3 11 6 17Black/African American 4 28 22 39 89Hawaiian/Pacific Islander 2 2 1 3Hispanic 9 38 5 8 51Nonresident alien 5 5 10Two or more races 8 43 6 2 51Unknown 21 73 35 14 122White 282 1,175 383 319 1,877Total 330 1,377 451 394 2,222
Total Enrollment by Ethnicity:

Most Frequent Denominations:
Nazarene by State and County:
Denomination 2016Total
2017Total
2017Trad. Non-Trad.
Nazarene 524 23% 520 23% 420 100Non-denomination 249 11% 260 12% 187 73Christian 211 9% 200 9% 68 132Baptist 188 8% 189 9% 130 59Catholic 113 5% 111 5% 44 67United Methodist 74 3% 72 3% 37 35Church of Christ 60 3% 62 3% 45 17Total 1,419 62% 1,414 64% 931 483
Student Status Nazarene Ohio Knox CountyFTIC (first-time) 102 5% 300 14% 61 3%Traditional 420 19% 1,250 56% 248 11%Non-Traditional 30 1% 437 20% 40 2%Graduate 70 3% 347 16% 83 4%Total 520 23% 2,034 92% 371 17%
Fall 2017 Enrollment
Geographic Distribution:
MVNU has been ranked:
4th Best Merit Scholarship College by Money Magazine#2 Best College for the Money in Ohio by College Factual (2018)Best Christian College in Ohio by CollegeandSeminary.com26th Best Value Small College by BestValueSchools.com
Traditional Non-Traditional Graduate TotalAge F M F M F M<18 115 74 189
18-19 376 203 3 58220-21 288 197 13 2 3 50322-24 57 47 32 15 35 17 20325-29 4 12 56 21 52 32 17730-34 1 1 51 20 45 25 14335-39 1 52 30 26 23 13240-49 80 32 72 26 21050-64 1 31 13 23 14 82>64 1 0 1
UnknownTotal 842 535 318 133 257 137 2,222
Age and Gender:
State of Residence 2016 2017Ohio 2,062 92% 2,034 92%West Virginia 34 2% 37 2%Michigan 20 1% 17 1%Pennsylvania 18 1% 18 1%Kentucky 16 1% 12 1%New York 10 <1% 10 <1%Other U.S. 64 3% 71 3%Foreign Countries* 21 1% 23 1%Total* 2,245 100% 2,222 100%
* Includes 32 states & 19 foreign countries/US territories (Argentina, Brazil, China, Colombia, Denmark, El Salvador, Germany, Ghana, Great Britain, Honduras, India, Indonesia, Ivory Coast, Kenya, Mexico, New Zealand, Portugal, Spain, and Zambia).

TUITION/FINANCIAL AID
Tuition Room Board 77%
12%
10%
STUDENT LIFE
Government: 2015-16 2016-17Loans $14,036,127 $13,129,766Scholarship/Grant 3,863,626 2,869,370Employment 146,099 159,212MVNU:Scholarship/Grant $18,307,242 $20,442,967Employment 1,201,896 758,090Other:Scholarship/Grant $675,040 $807,533Private Loan 1,414,024 1,571,472Total $39,464,054 $39,738,410
Tuition/Financial Aid and Student Life
Full-Time: 2016-17 2017-18Tuition (Traditional) $26,700 $27,840Room/Apartment 4,218 4,388Board 3,332 3,466Technology Fee 250 250Per Credit Hour 742 773
Honor Societies by Type and Beginning Date:National: Alpha Chi Ohio Delta 1978Nazarene: Phi Delta Lambda 1976Departmental: Delta Mu Delta (Business) 1976
Sigma Tau Delta (English) 2005Psi Chi (Psychology) 2010Sigma Theta Tau (Nursing) 2013
2016-17 Financial Aid:1,673 undergraduates (92%) received $36,758,922 in aid, including work-study, averaging $21,864 per undergraduate. 248 graduate students (60%) received $2,758,305 in aid, averaging $11,122 per graduate student.
Resident Student Participation: 2015-16 2016-17Female Intramurals 125 37% 275 46%Male Intramurals 275 63% 325 54%
Student Life Contacts: 2016-17Individual Counseling Contacts* 1,395Training Sessions and Seminars 458Student Health Visits 917*Includes professional/clerical staff.
Student Body and Class Presidents:Madison Coburn, Student Government Association PresidentCameron Deardorff, Senior Class PresidentBrynn Vayda, Junior Class PresidentNathan Parker, Sophomore Class PresidentTo be determined, Freshman Class President
On-Campus Residents: 2016 2017# Residents (% of Traditional Undergraduates) 1,024 78% 988 72%Residence Hall Capacity (% Full) 1,116 92% 1,116 88%
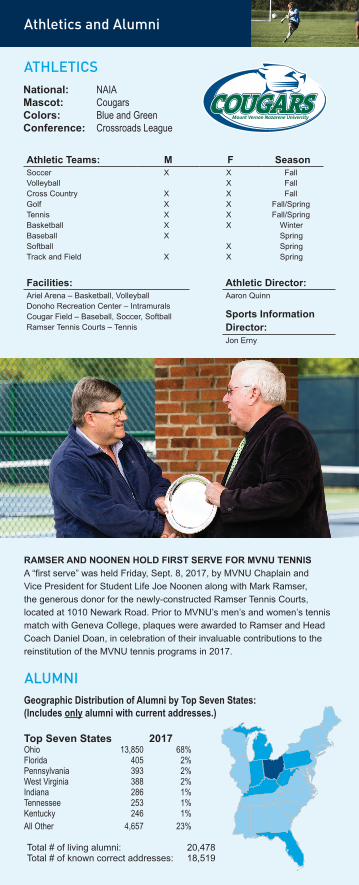
National: NAIAMascot: CougarsColors: Blue and GreenConference: Crossroads League
Geographic Distribution of Alumni by Top Seven States:(Includes only alumni with current addresses.)
Top Seven States 2017Ohio 13,850 68%Florida 405 2%Pennsylvania 393 2%West Virginia 388 2%Indiana 286 1%Tennessee 253 1%Kentucky 246 1%All Other 4,657 23%
Total # of living alumni: 20,478Total # of known correct addresses: 18,519
ATHLETICS
RAMSER AND NOONEN HOLD FIRST SERVE FOR MVNU TENNISA “first serve” was held Friday, Sept. 8, 2017, by MVNU Chaplain and Vice President for Student Life Joe Noonen along with Mark Ramser, the generous donor for the newly-constructed Ramser Tennis Courts, located at 1010 Newark Road. Prior to MVNU’s men’s and women’s tennis match with Geneva College, plaques were awarded to Ramser and Head Coach Daniel Doan, in celebration of their invaluable contributions to the reinstitution of the MVNU tennis programs in 2017.
ALUMNI
Athletics and Alumni
Athletic Teams: M F SeasonSoccer X X FallVolleyball X FallCross Country X X FallGolf X X Fall/SpringTennis X X Fall/SpringBasketball X X WinterBaseball X SpringSoftball X SpringTrack and Field X X Spring
Facilities:Ariel Arena – Basketball, VolleyballDonoho Recreation Center – IntramuralsCougar Field – Baseball, Soccer, SoftballRamser Tennis Courts – Tennis
Athletic Director:Aaron Quinn
Sports Information Director:Jon Erny

*Includes faculty with F-T contracts that include some administration or coaching .
Academic Majors 2016
Fall 2016 Enrolled Majors, Teaching Faculty, & Graduates
SchoolFirstMajor Instructional Faculty Graduates
Contract Status
Department/Program Total F-T P-T/Adj Total FTE Doc. Bac. Assoc. Grad.
Arts and Humanities 220 15 27 42 23.53 13 50Art and Design 63 3 5 8 3.98 0 19Communication 51 4 4 8 4.56 3 12English & Modern Lang. 33 3 11 14 5.83 4 10History & Political Sci. 39 2 2 4 3.06 3 7Music 34 3 5 8 6.10 3 2Business 639 7 34 41 22.09 20 125 10 81Accounting 38 5Business 128 7 1 8 5.96 4 17 2Business Admin. (GPS) 245 0 22 22 7.24 5 103 8Graduate Business 228 0 11 11 8.89 11 81Education & Prof. Studies 550 20 60 80 27.13 16 108 43Early Childhood Ed. 110 8 16 24 9.78 6 1Intervention Specialist 27 3Middle Childhood Ed. 12 2Exercise Studies 28 7Phys./Health Education 5 5 8 12 2.49 0 1Sports Management 19 1Family & Consumer Sci. 4 1 0 1 .83 1 4Social Work 54 3 4 7 3.74 1 7Social Work (deg. comp.) 128 1 10 11 2.79 2 72Intervention Spec. (MAEd) 53 21Prof. Ed. License (MAEd) 22 2 22 24 7.50 6 22Workshops/certificates 88Natural & Social Sciences 336 16 23 39 21.29 21 55Biology 117 5 3 8 5.26 7 19Chemistry/Phy. Sci. 14 3 1 4 3.42 3 3Computer Science 45 1 3 4 1.78 2 9Criminal Justice 33 0 3 3 .74 7Engineering 47 2 1 3 2.32 2Mathematics 16 2 5 7 3.96 2 6Psychology 50 3 5 8 3.27 4 9Public Safety Administration 14 0 2 2 .42 4 9Sociology 2Nursing & Health Sciences 212 6 8 14 8.58 3 47Commun. Sci. & Disorders 15 0 2 2 .67 0Nursing 140 5 1 6 5.62 0 34Nursing (deg. comp.) 57 1 5 6 1.35 3 13Theology & Philosophy 135 7 15 21 9.23 12 18 11Christian Ministry 102 3 5 8 3.16 4 13Religion & Philosophy 11 4 6 10 5.62 5 5Practical Theology (MMin) 22 0 3 3 .54 3 11Other 153 0 13 13 9.19 3 1General Studies 17 0 5 5 .42 1 1Miscellaneous 0 8 8 4.77 2Undeclared 24Postsecondary 107Guests/Sr. Citizens 5Subtotal 403 11 135Total 2,245 71 180 251 117.1 88 549

For 2017-18 all adult, degree-completion, and graduate programs were re-located into the School of Graduate and Professional Studies.
Academic Majors 2017
Fall 2017 Enrolled Majors, Teaching Faculty, & Graduates
SchoolFirstMajor Instructional Faculty Graduates
Contract Status
Program Total F-T P-T/Adj Total FTE Doc. Bac, Assoc. Grad.
Arts and Humanities 213 14 33 47 23.97 15 36 2 0Art and Design 60 3 4 7 3.92 0 9Communication & Journal. 46 1 9 10 4.96 3 12English & Modern Lang. 41 5 10 15 6.21 4 3History & Political Sci. 39 2 3 5 3.33 4 8Music 27 3 7 10 5.55 4 4 2Jetter School Prof. Stud. 376 12 34 46 20.15 10 85 0 0Accounting 35 5Business 109 4 6 10 6.28 3 25Early Childhood Ed. 70 6 12 18 8.46 5 13Exercise Studies 28 4Family & Consumer Sci. 5Intervention Specialist. 33 8Middle Childhood Ed. 18 2Sports Management 34 0 12 12 2.69 0 6Social Work 49 2 4 6 2.72 2 17Natural & Social Sciences 296 20 18 38 26.86 23 56 0 0Biology 123 5 3 8 6.37 6 20Chem., Phys., & Earth Sci. 13 3 2 5 4.09 4 4Computer Science 30 2 2 2.00 1 10Criminal Justice 24 9Engineering 49 4 2 6 3.98 4Mathematics 16 3 3 6 4.71 2 6Psychology 41 3 8 11 5.29 6 7Science .42Nursing & Health Sciences 171 6 5 11 7.253 23 0 0Commun. Sci. & Disorders 23 1 3 4 1.28 1Nursing 148 5 2 7 5.97 3 23Theology & Philosophy 101 5 11 16 8.72 10 33 0 0Christian Ministry 92 2 5 7 3.23 4 25Religion & Philosophy 9 3 6 9 5.48 6 8GPS Undergraduate Prog. 448 2 43 45 16.19 9 167 9 0Business 199 1 16 17 5.01 5 91 7Computer Science 4Early Childhood Ed. 58 6 6 1.38 1 7General Studies 43 5 5 2.44 2 2Nursing 38 3 3 .92 23Social Work 106 1 13 14 5.45 1 46GPS Graduate Program 394 1 35 35 13.92 18 142Graduate Business 199 0 9 9 8.25 9 109Graduate Education 175 1 26 27 5.54 9 28Graduate Religion 20 .125 5Other 223 1 11 12 5.98 2 2General Studies 2Guests/Senior Citizens 3Interdisciplinary 5 5 2.14 1Miscellaneous 1 6 7 3.84 1Post-secondary 202Undeclared 18Subtotal 400 13 142Total 2,222 61 190 251 123.3 91 555
Faculty and Staff
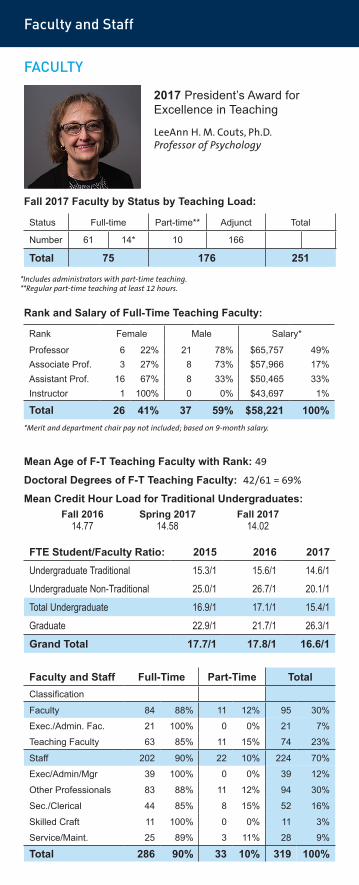
FACULTY
Rank Female Male Salary*
Professor 6 22% 21 78% $65,757 49%Associate Prof. 3 27% 8 73% $57,966 17%Assistant Prof. 16 67% 8 33% $50,465 33%Instructor 1 100% 0 0% $43,697 1%
Total 26 41% 37 59% $58,221 100%
Fall 2017 Faculty by Status by Teaching Load:
2017 President’s Award forExcellence in Teaching
LeeAnnH.M.Couts,Ph.D.Professor of Psychology
Rank and Salary of Full-Time Teaching Faculty:
Mean Age of F-T Teaching Faculty with Rank: 49
Doctoral Degrees of F-T Teaching Faculty: 42/61 = 69%
Mean Credit Hour Load for Traditional Undergraduates: Fall 2016 Spring 2017 Fall 2017 14.77 14.58 14.02
*Includes administrators with part-time teaching.**Regular part-time teaching at least 12 hours.
*Merit and department chair pay not included; based on 9-month salary.
Status Full-time Part-time** Adjunct Total
Number 61 14* 10 166
Total 75 176 251
FTE Student/Faculty Ratio: 2015 2016 2017Undergraduate Traditional 15.3/1 15.6/1 14.6/1Undergraduate Non-Traditional 25.0/1 26.7/1 20.1/1Total Undergraduate 16.9/1 17.1/1 15.4/1Graduate 22.9/1 21.7/1 26.3/1Grand Total 17.7/1 17.8/1 16.6/1
Faculty and Staff Full-Time Part-Time TotalClassification
Faculty 84 88% 11 12% 95 30%
Exec./Admin. Fac. 21 100% 0 0% 21 7%
Teaching Faculty 63 85% 11 15% 74 23%
Staff 202 90% 22 10% 224 70%
Exec/Admin/Mgr 39 100% 0 0% 39 12%
Other Professionals 83 88% 11 12% 94 30%
Sec./Clerical 44 85% 8 15% 52 16%
Skilled Craft 11 100% 0 0% 11 3%
Service/Maint. 25 89% 3 11% 28 9%
Total 286 90% 33 10% 319 100%

Fac/Staff and Academic Affairs
STAFF
ACADEMIC AFFAIRS
2017 Faculty Member of the Year
RandieL.Timpe,Ph.D.Assistant to the President for Effectiveness and Planning
Director of Institutional Research and Accountability
2017 Staff Member of the Year
M.ScottTarrh,M.S.S.Assistant University Registrar
Accreditation:The Higher Learning Commission (2018-19)230 S. LaSalle, Suite 7-500, Chicago, IL 60604800-621-7440 hlcommission.org
Courses Offered by Class Level: 2017-180000 1000 2000 3000 4000 5000 6000 Total
11 342 272 358 199 12 114 1,3081% 26% 21% 27% 15% 1% 9% 100%
Degrees Awarded: 2015-16 2016-17Associate 11 2% 13 2%Bachelor 402 73% 400 72%Master of Arts in Education 43 8% 28 5%Master of Business Administration 67 12% 101 18%Master of Ministry 11 2% 5 1%Master of Science in Management 14 3% 8 1%Total (from 7/1 to 6/30) 548 100% 555 100%
Total Number of Classes Taught 2016-17: 1,252
Library/ERC Holdings: 2015-16 2016-17Volumes 165,069 160,658Microforms 8 23Periodicals [Titles] [215] [926]Non-print 4,337 4,356Electronic Books 2,514 2,514Total* 172,143 164,351
* OhioLINK provides access to 46+ million library items, 25+ million journal articles, 59,000+ theses and dissertations, 140,000+ e-books, and 100+ databases.

ANNUAL OPERATING BUDGET
Operating Budget and Institutional Advancement
East Central Region Church Giving:District as of: 5/31/2016 5/31/2017Eastern Kentucky $ 82,316 $ 86,457East Ohio 113,851 138,603North Central Ohio 291,088 234,449Northwestern Ohio 276,189 274,472South Central Ohio 311,282 285,472Southwestern Ohio 280,412 276,970West Virginia North 97,403 101,778West Virginia South 128,093 118,076Total $1,580,634 $1,516,277
Revenue2016-17 Budget
2017-19 Budget
Traditional tuition and fees $31,536,600 $35,340,334GPS tuition and fees 8,472,000 7,619,478Traditional financial aid -18,022,200 -21,478,109GPS financial aid -45,000 -50,000Net Revenue $21,941,400 $21,431,703Church revenue 1,500,000 1,515,000Gifts, grants, miscellaneous 694,737 826,774Auxiliaries 7,846,400 118,076Investment return 125,000 125,000Non-mandatory transfers -150,000Total revenue $32,107,537 $32,227,937
INSTITUTIONAL ADVANCEMENT
* Includes endowment funds held by MVNU’s endowment managers and quasi-endowment funds held by MVNU.
*Does not include depreciation expense of $2,400,000.
Endowment Funds 2017Endowment Funds as of: 5/31/16 5/31/17Restricted:
Scholarship/Student Loans $12,214,800 $13,435,939 Maintenance/Energy $210,331 $227,297 Other $1,444,475 $1,558,705
Quasi/Unrestricted:Scholarships $724,498 $929,947 Maintenance/Energy $773,382 $830,076 Other $2,484,295 $2,682,258
$17,851,781 $19,664,222
ExpendituresSalaries, wages, and benefits $19,567,196 $20,187,196Service 3,441,639 3,266,066Supplies 1,352,758 1,318,044Meetings, transportation, and meals 2,804,270 2,757,099Occupancy and office expense 2,359,172 2,471,483Furn., equip., rental, maintenance 524,102 477,329Miscellaneous 265,675 225,675Reserve 200,000 200,000Mandatory transfers (int. & prin. exp.) 893,750 659,990Capital expenditures 565,838 565,055Pending budget cutsTotal* $31,984,400 $32,137,937Surplus (deficit) 23,137 100,000
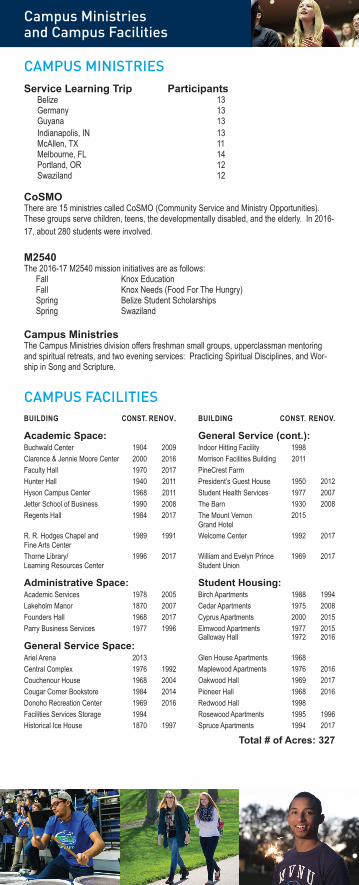
CAMPUS MINISTRIES
CAMPUS FACILITIES
CoSMOThere are 15 ministries called CoSMO (Community Service and Ministry Opportunities). These groups serve children, teens, the developmentally disabled, and the elderly. In 2016-17, about 280 students were involved.
M2540The 2016-17 M2540 mission initiatives are as follows: Fall Knox Education Fall Knox Needs (Food For The Hungry) Spring Belize Student Scholarships Spring Swaziland
Campus MinistriesThe Campus Ministries division offers freshman small groups, upperclassman mentoring and spiritual retreats, and two evening services: Practicing Spiritual Disciplines, and Wor-ship in Song and Scripture.
Service Learning Trip Participants Belize 13 Germany 13 Guyana 13 Indianapolis, IN 13 McAllen, TX 11 Melbourne, FL 14 Portland, OR 12 Swaziland 12
Campus Ministries and Campus Facilities
BUILDING CONST. RENOV. BUILDING CONST. RENOV.
Academic Space: General Service (cont.):Buchwald Center 1904 2009 Indoor Hitting Facility 1998Clarence & Jennie Moore Center 2000 2016 Morrison Facilities Building 2011Faculty Hall 1970 2017 PineCrest FarmHunter Hall 1940 2011 President’s Guest House 1950 2012Hyson Campus Center 1968 2011 Student Health Services 1977 2007Jetter School of Business 1990 2008 The Barn 1930 2008Regents Hall 1984 2017 The Mount Vernon
Grand Hotel2015
R. R. Hodges Chapel and Fine Arts Center
1989 1991 Welcome Center 1992 2017
Thorne Library/ Learning Resources Center
1996 2017 William and Evelyn Prince Student Union
1969 2017
Administrative Space: Student Housing:Academic Services 1978 2005 Birch Apartments 1988 1994Lakeholm Manor 1870 2007 Cedar Apartments 1975 2008Founders Hall 1968 2017 Cyprus Apartments 2000 2015Parry Business Services 1977 1996 Elmwood Apartments 1977 2015
General Service Space:Galloway Hall 1972 2016
Ariel Arena 2013 Glen House Apartments 1968Central Complex 1976 1992 Maplewood Apartments 1976 2016Couchenour House 1968 2004 Oakwood Hall 1969 2017Cougar Corner Bookstore 1984 2014 Pioneer Hall 1968 2016Donoho Recreation Center 1969 2016 Redwood Hall 1998Facilities Services Storage 1994 Rosewood Apartments 1995 1996Historical Ice House 1870 1997 Spruce Apartments 1994 2017
Total # of Acres: 327
Prepared byInstitutional Effectiveness Office
Randie L. Timpe,Assistant to the President for Effectiveness and Planning
Director of Institutional Research and Accountability(ext. 4122)
800 Martinsburg RoadMount Vernon, OH 43050
Tel. 740-392-6868Fax 740-397-2769
mvnu.edu
SENIOR LEADERSHIP TEAM
Henry W. Spaulding II, Ph.D.President and Chief Executive Officer
B. Barnett CochranVice President for Academic Affairs and Chief Academic Officer
Robert P. HamillVice President for Finance and Chief Financial Officer
Joseph D. NoonenVice President for Student Life and University Chaplain
James W. SmithVice President for Enrollment Management and Marketing