Fact sheet #11: Total and urban population -...
2
1 UNCTAD Handbook of Statistics 2017 - Population Fact sheet #11: Total and urban population Population (Millions) 10 100 Share of urban population (Percentage) 90 to 100 70 to less than 90 50 to less than 70 30 to less than 50 0 to less than 30 Note: Annual exponential rate of growth of the population (see UNCTAD Handbook of Statistics 2017, annex 6.3). The population estimates and projections reported in this chapter represent the "de facto" population as of the 1st of July of a given year (United Nations, 2017b). The figures for the years 2015–2050 are based on the medium variant projection. This assumes that the average fertility rate of the world will decline from 2.5 births per woman in 2010–2015 to 2.2 in 2045– 2050. Future population growth is highly dependent on the path that future fertility will take. Relatively small changes in the frequency of childbearing, when projected over several decades, can generate large differences in total population (ibid.). Urban population is defined as the "de facto" population living in areas classified as urban according to the criteria used by each country or territory (United Nations, 2017c). Concepts and definitions Population growth rate decreasing over time The world population growth rate has been declining since the end of the 1960s. In 1969, the world population increased by 2.1 per cent compared to the year before. Until 1979, the annual growth rate then fell to 1.8 per cent and remained at that level for the next nine years. After a further strong fall during the early 1990s, the rate reached 1.3 per cent at the turn of the millennium. Today it amounts to 1.1 per cent. It is projected to decrease further, down to 0.5 per cent by 2050. Unequal distribution across countries In 2016, the world population was 7.5 billion, with 58 per cent of people inhabiting only 10 economies. Three of the four most populated economies in the world were located in Asia: China, India and Indonesia. Jointly, they accounted for 40 per cent of the world total. 0.0 0.5 1.0 1.5 2.0 2.5 1950 1960 1970 1980 1990 2000 2010 2020 2030 2040 2050 Projection Map 1 World population, 2016 Figure 1 Annual growth rate of world population (Percentage) For references, see UNCTAD Handbook of Statistics 2017, annex 6.4.
Transcript of Fact sheet #11: Total and urban population -...

1 UNCTAD Handbook of Statistics 2017 - Population
Fact sheet #11: Total and urban population
Population(Millions)
10
100
Share of urban population(Percentage)
90 to 100
70 to less than 90
50 to less than 70
30 to less than 50
0 to less than 30
Note: Annual exponential rate of growth of the population (see UNCTAD Handbook of Statistics 2017, annex 6.3).
The population estimates and projections reported in this chapter represent the "de facto" population as of the 1st of July of a given year (United Nations, 2017b).
The figures for the years 2015–2050 are based on the medium variant projection. This assumes that the average fertility rate of the world will decline from 2.5 births per woman in 2010–2015 to 2.2 in 2045–2050. Future population growth is highly dependent on the path that future fertility will take. Relatively small changes in the frequency of childbearing, when projected over several decades, can generate large differences in total population (ibid.).
Urban population is defined as the "de facto" population living in areas classified as urban according to the criteria used by each country or territory (United Nations, 2017c).
Concepts and definitions
Population growth rate decreasing over time
The world population growth rate has been declining since the end of the 1960s. In 1969, the world population increased by 2.1 per cent compared to the year before. Until 1979, the annual growth rate then fell to 1.8 per cent and remained at that level for the next nine years. After a further strong fall during the early 1990s, the rate reached 1.3 per cent at the turn of the millennium. Today it amounts to 1.1 per cent. It is projected to decrease further, down to 0.5 per cent by 2050.
Unequal distribution across countries
In 2016, the world population was 7.5 billion, with 58 per cent of people inhabiting only 10 economies. Three of the four most populated economies in the world were located in Asia: China, India and Indonesia. Jointly, they accounted for 40 per cent of the world total.
0 . 0
0 . 5
1 . 0
1 . 5
2 . 0
2 . 5
1 9 5 0 1 9 6 0 1 9 7 0 1 9 8 0 1 9 9 0 2 0 0 0 2 0 1 0 2 0 2 0 2 0 3 0 2 0 4 0 2 0 5 0
P r o j e c t i o n
Map 1 World population, 2016
Figure 1 Annual growth rate of world population(Percentage)
For references, see UNCTAD Handbook of Statistics 2017, annex 6.4.
UNCTAD Handbook of Statistics 2017 - Population 1
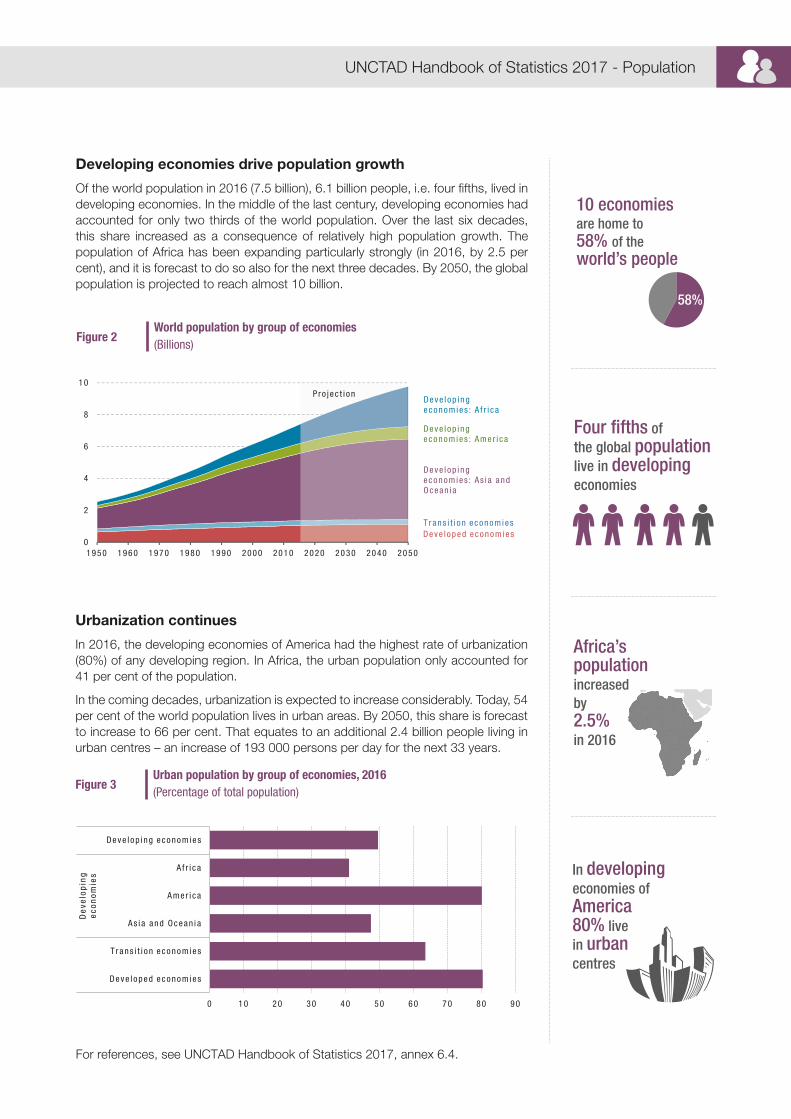
Developing economies drive population growth
Of the world population in 2016 (7.5 billion), 6.1 billion people, i.e. four fifths, lived in developing economies. In the middle of the last century, developing economies had accounted for only two thirds of the world population. Over the last six decades, this share increased as a consequence of relatively high population growth. The population of Africa has been expanding particularly strongly (in 2016, by 2.5 per cent), and it is forecast to do so also for the next three decades. By 2050, the global population is projected to reach almost 10 billion.
Urbanization continues
In 2016, the developing economies of America had the highest rate of urbanization (80%) of any developing region. In Africa, the urban population only accounted for 41 per cent of the population.
In the coming decades, urbanization is expected to increase considerably. Today, 54 per cent of the world population lives in urban areas. By 2050, this share is forecast to increase to 66 per cent. That equates to an additional 2.4 billion people living in urban centres – an increase of 193 000 persons per day for the next 33 years.
0
2
4
6
8
1 0
1 9 5 0 1 9 6 0 1 9 7 0 1 9 8 0 1 9 9 0 2 0 0 0 2 0 1 0 2 0 2 0 2 0 3 0 2 0 4 0 2 0 5 0
De v e l o p i n g e c o n o m i es : A f r i c a
T r a n s i t i o n e c o n o m i esDe v e l o p e d e c o n o m i es
De v e l o p i n g e c o n o m i es : A s i a a n d O c e a n i a
De v e l o p i n g e c o n o m i es : A m e r i ca
P r o j e c t i o n
0 1 0 2 0 3 0 4 0 5 0 6 0 7 0 8 0 9 0
De v e l o p i n g e c o n o m i e s
A f r i c a
A m e r i ca
A s i a a n d O c e a n i a
T r a n s i t i o n e c o n o m i es
De v e l o p e d e c o n o m i es
Dev
elop
ing
econ
omie
s
10 economiesare home to 58% of the world’s people
58%
Four �fths ofthe global population live in developing economies
Africa’spopulation increasedby2.5%in 2016
In developingeconomies of America80% livein urbancentres
Figure 2 World population by group of economies(Billions)
Figure 3 Urban population by group of economies, 2016(Percentage of total population)
For references, see UNCTAD Handbook of Statistics 2017, annex 6.4.