f the en - University College Dublin
252
State of the Nation’s Children Ireland 2010
Transcript of f the en - University College Dublin

State of the
Nation’s Children
Ireland 2010


State of the Nation’s ChildrenIreland 2010
DECEMBER 2010
OFFICE OF THE MINISTER FOR CHILDREN AND YOUTH AFFAIRS

Copyright © Minister for Health and Children, 2010
Office of the Minister for Children and Youth Affairs
Department of Health and Children
Hawkins House
Hawkins Street
Dublin 2
Tel: +353 (0)1 635 4000
Fax: +353 (0)1 674 3223
E-mail: [email protected]
Web: www.omcya.ie
Published by Government Publications, Dublin
ISBN 978-1-4064-2321-1
All rights reserved. No part of this publication may be
reproduced, stored in a retrieval system, or transmitted,
in any form or by any means, electronic, mechanical,
photocopying, recording or otherwise, without the prior
permission in writing of the copyright holder.
For rights of translation or reproduction, applications should be
made to the Head of Communications, Office of the Minister for Children
and Youth Affairs, Hawkins House, Hawkins Street, Dublin 2, Ireland.

iii
Minister’s Foreword
As Minister for Children and Youth Affairs, it is my great pleasure to launch the State of the Nation’s Children: Ireland 2010. This report is the third in a biennial series prepared by the Office of the Minister for Children and Youth Affairs (OMCYA) in association with the Central Statistics Office and the Health Promotion Research Centre at the National University of Ireland, Galway. It fulfils a commitment in the National Children’s Strategy to publish key indicators of child well-being on a regular basis.
As with earlier reports in this series, the State of the Nation’s Children: Ireland 2010 presents the most current and most reliable administrative, survey and Census data on the socio-demographic and child well-being indicators that were selected to be part of the National Set of Child Well-Being Indicators back in 2005.
The biennial publication of these reports continues to stimulate impressive improvements in data on child well-being. For the State of the Nation’s Children: Ireland 2010, new indicators have been developed to close previously identified data gaps and more sophisticated data analyses have been carried out to enable a greater focus on the more vulnerable groups of children in Ireland, including Traveller children, immigrant children and children with a disability and/or chronic illness.
The 2010 edition of this report continues to point to some gaps in the coverage and timeliness of data on child well-being. It is hoped that these can be addressed in the context of the emerging National Data and Research Strategy on Children’s Lives, which is being prepared by my Office for publication in 2011.
Barry Andrews, tdMinister for Children and Youth Affairs
December 2010


ContentsMinister’s Foreword iii
Authors viii
Acknowledgements viii
List of Tables ix
List of Figures xvi
Acronyms used xviii
INTRODUCTION Outline of report 2New developments 3Key findings 4
PART 1: SOCIO-DEMOGRAPHICSChild population 10Child mortality 14Family structure 19Parental education level 22Traveller children 26Foreign national children 28Children with a disability 32Separated children seeking asylum 34
PART 2: CHILDREN’S RELATIONSHIPSRelationship with mothers 36Relationship with fathers 40Talking to parents 44Parental involvement in schooling 46Eating a main meal together 48Friendships 50Pets and animals 54Bullying 57

PART 3: CHILDREN’S OUTCOMESEDUCATION OUTCOMES
Enrolment in early childhood care and education 64Parental satisfaction with early childhood care
and education 66Quality of early childhood care and education 68School attendance 70Transfer to second-level education 73Achievement in reading 75Achievement in mathematics 78Achievement in science 81
HEALTH OUTCOMES
Birth weight 86Breastfeeding 89Health conditions and hospitalisation 93Accidents, injuries and hospitalisation 96Nutritional outcomes 100Intellectual disability 101Physical and sensory disability 105Child welfare and protection: Initial assessment 109Child welfare and protection: Confirmed abuse 112
SOCIAL, EMOTIONAL AND BEHAVIOURAL OUTCOMES
Participation in decision-making 116Reading as a leisure activity 120Smoking cigarettes 122Alcohol use 126Cannabis use 130Sexual health and behaviour 134Self-esteem 137Self-reported happiness 140Youth suicide 143Physical activity 145Eating habits 149

PART 4: FORMAL AND INFORMAL SUPPORTSPublic expenditure on education 154At risk of poverty 158Consistent poverty 160Availability of housing for families with children 162Community characteristics 165Environment and places 169Garda Juvenile Diversion Programme referrals 174Antenatal care 179Childhood immunisation 182Accessibility of basic health services 189Children and young people in care 191Mental health referrals 195
APPENDICESAppendix 1: Main data sources, definitions
and relevant technical notes 200Appendix 2: NUTS Classifications 219
INDEX 221

viii
AuthorsThe main authors of this State of the Nation’s Children: Ireland 2010 report are:
Anne-Marie Brooks, Office of the Minister for Children and Youth Affairs; ■
Sinéad Hanafin, Office of the Minister for Children and Youth Affairs; ■
Helen Cahill, Central Statistics Office; ■
Saoirse Nic Gabhainn, Health Promotion Research Centre, ■
National University of Ireland, Galway;Michal Molcho, Health Promotion Research Centre, ■
National University of Ireland, Galway.
AcknowledgeMentsWe would like to thank all the people and organisations who provided data for this 2010 report, especially: Antoinette Daly, Health Research Board (National Psychiatric In-Patient Reporting System); Declan Smyth, Central Statistics Office (Census of the Population); Eithne Tiernan, Central Statistics Office (Childcare Module, Quarterly National Household Survey); Marian McCann and Pamela Lafferty, Central Statistics Office (European Union – Survey on Income and Living Conditions); Maria Crowley and Kieran O’Shea, Central Statistics Office (Vital Statistics); Sarah Craig, Health Research Board (National Intellectual Disability Database and National Physical and Sensory Disability Database); David Millar, Education Research Centre (National Educational Welfare Board Database); Patricia Heavey, National Nutrition Surveillance Centre (European Childhood Obesity Surveillance Initiative); Rachel Perkins and Gerry Shiel, Education Research Centre (Programme for International Student Assessment); Nicola Tickner, Tom Healy and Gillian Golden, Department of Education and Skills (Education Statistics); Gráinne Cosgrove, Department of Health and Children (Hospital In-Patient Enquiry System); Jason Sibley and Anna Lloyd, National Treatment Purchase Fund (Patient Treatment Register); John Nolan and Joseph Murphy, Health Service Executive (Childcare Interim Dataset); Colette Kelly and Amanda Fitzgerald, Health Promotion Research Centre, National University of Ireland, Galway (Health Behaviour of School-aged Children (HBSC) Survey); Maresa Duignan, Office of the Minister for Children and Youth Affairs (ECCE database); Aisling Mulligan and Sheelagh Bonham, Economic and Social Research Institute (National Perinatal Reporting System); and Sarah Gee, Health Protection Surveillance Centre (Immunisation Uptake Statistics).
We are also very grateful to all the people who provided feedback on individual indicators and the children, families and others who provide the data included in this report.

ix
list oF tABlesTable 1: Number of children under 18, by age and gender (2009) 10Table 2: Number of children and percentage of population under 18, by gender
(selected years 1981-2009) 11Table 3: Percentage of population under 18 in EU-27, by country
(selected years 1988-2008) 12Table 4: Number and rate (per 10,000) of deaths of children, by age (2005-2009) 14Table 5: Death rates (per 10,000) of children, by gender (2005-2009) 15Table 6: Number of deaths of children, by age and main cause of death (2009) 15Table 7: Infant mortality rate (per 1,000 live births) in EU-27, by country
(selected years 1988-2008) 17Table 8: Rate (per 10,000) of deaths of children across selected countries in EU-27,
by age and gender (2007) 18Table 9: Number and percentage of children under 18 living in a lone-parent household,
by population groups (2006) 19Table 10: Number and percentage of children under 18 living in a lone-parent household,
by age and gender (2006) 20Table 11: Number and percentage of children under 18 living in a lone-parent household,
by county (2006) 20Table 12: Percentage of children under 18, by population groups and educational
attainment of mother (2006) 22Table 13: Percentage of children under 18, by age and educational attainment of mother
(2006) 23Table 14: Number of children under 18, by county and educational attainment of mother
(2006) 23Table 15: Number of Traveller children, by age and gender (2006) 26Table 16: Number and percentage of Traveller children, by county (2006) 27Table 17: Number of foreign national children, by age and gender (2006) 28Table 18: Number and percentage of foreign national children, by county (2006) 30Table 19: Number and percentage of foreign national children, by nationality (2006) 31Table 20: Number of children with a disability, by age and gender (2006) 32Table 21: Number and percentage of children with a disability, by county (2006) 33Table 22: Number and percentage of separated children seeking asylum, by age and
gender (2006-2008) 34Table 23: Percentage of children who report that they find it easy to talk to their mother
when something is really bothering them, by population groups (2006) 36Table 24: Percentage of children who report that they find it easy to talk to their mother
when something is really bothering them, by age, gender and social class (1998, 2002 and 2006) 37

x
Table 25: Percentage of children who report that they find it easy to talk to their mother when something is really bothering them, by NUTS Region (2006) 38
Table 26: Percentage of children who report that they find it easy to talk to their father when something is really bothering them, by population groups (2006) 40
Table 27: Percentage of children who report that they find it easy to talk to their father when something is really bothering them, by age, gender and social class (1998, 2002 and 2006) 41
Table 28: Percentage of children who report that they find it easy to talk to their father when something is really bothering them, by NUTS Region (2006) 42
Table 29: Percentage of children aged 15 who report that their parents spend time just talking with them several times a week, by population groups (2009) 44
Table 30: Percentage of children aged 15 who report that their parents spend time just talking with them several times a week, by gender and social class (2000, 2006 and 2009) 45
Table 31: Percentage of children aged 15 who report that their parents discuss with them how well they are doing at school several times a week, by population groups (2009) 46
Table 32: Percentage of children aged 15 who report that their parents discuss with them how well they are doing at school several times a week, by gender and social class (2000, 2006 and 2009) 47
Table 33: Percentage of children aged 15 who report that their parents eat a main meal with them around a table several times a week, by population groups (2009) 48
Table 34: Percentage of children aged 15 who report that their parents eat a main meal with them around a table several times a week, by gender and social class (2000, 2006 and 2009) 49
Table 35: Percentage of children who report to have 3 or more friends of the same gender, by population groups (2006) 50
Table 36: Percentage of children who report to have 3 or more friends of the same gender, by age, gender and social class (2002 and 2006) 51
Table 37: Percentage of children who report to have 3 or more friends of the same gender, by NUTS Region (2006) 52
Table 38: Percentage of children who report having a pet of their own or a pet in their family, by population groups (2006) 54
Table 39: Percentage of children who report having a pet of their own or a pet in their family, by age, gender and social class (2006) 55
Table 40: Percentage of children who report having a pet of their own or a pet in their family, by NUTS Region (2006) 56
Table 41: Percentage of children who report having been bullied at school (in the past couple of months), by population groups (2006) 57

xi
Table 42: Percentage of children who report having been bullied at school (in the past couple of months), by age, gender and social class (1998, 2002 and 2006) 58
Table 43: Percentage of children who report having been bullied at school (in the past couple of months), by NUTS Region (2006) 59
Table 44: Percentage of children under 13 years of age who avail of non-parental childcare, by school-going status and household structure (2007) 64
Table 45: Percentage of children under 13 years of age who avail of non-parental childcare, by school-going status and NUTS Region (2007) 65
Table 46: Percentage of households with children under 13 who report they have ‘access to high-quality, affordable childcare in the community’, by household structure (2007) 66
Table 47: Percentage of households with children under 13 who report they have ‘access to high-quality, affordable childcare in the community’, by NUTS Region and location (2007) 67
Table 48: Percentage of Early Childhood Care and Education (ECCE) services under contract to deliver the Free Pre-School Year Scheme that meet basic and higher capitation criteria, by City and County Childcare Committees (2010) 68
Table 49: Percentage of children who are absent from school for 20 days or more in the school year, by school-going status (2003/04 – 2007/08) 70
Table 50: Average percentage of children per school who are absent from school for 20 days or more in the school year, by selected school characteristics (2007/08) 71
Table 51: Average percentage of children per school who are absent from school for 20 days or more in the school year, by school type and county (2007/08) 72
Table 52: Number and percentage of children leaving national schools, by destination (2005/06 – 2009/10) 74
Table 53: Mean score for children aged 15 based on the OECD-PISA Reading Literacy Scale, by population groups (2009) 75
Table 54: Mean score for children aged 15 based on the OECD-PISA Reading Literacy Scale, by gender and social class (2003, 2006 and 2009) 76
Table 55: Mean score for children aged 15 based on the OECD-PISA Mathematics Literacy Scale, by population groups (2009) 78
Table 56: Mean score for children aged 15 based on the OECD-PISA Mathematics Literacy Scale, by gender and social class (2003, 2006 and 2009) 79
Table 57: Mean score for children aged 15 based on the OECD-PISA Combined Scientific Literacy Scale, by population groups (2009) 81
Table 58: Mean score for children aged 15 based on the OECD-PISA Combined Scientific Literacy Scale, by gender and social class (2003, 2006 and 2009) 82

xii
Table 59: Percentage of babies born weighing less than 2,500 grams (live and still births), by gender (2004-2008) 86
Table 60: Number and percentage of babies born weighing less than 2,500 grams (live and still births), by mothers’ county of residence (2008) 88
Table 61: Percentage of infants who are breastfed (exclusive or combined) on discharge from hospital, by mothers’ age (2004-2008) 90
Table 62: Percentage of infants who are breastfed (exclusive or combined) on discharge from hospital, by mothers’ county of residence (2008) 92
Table 63: Number and percentage of hospital discharges among children, by age, gender and principal diagnosis (2005-2009) 94
Table 64: Number and percentage of hospital discharges among children, by county of residence (2009) 95
Table 65: Number and percentage of hospital discharges among children with a diagnosis of external causes of injury or poisoning, by age, gender and cause (2005-2009) 97
Table 66: Number and percentage of hospital discharges among children with a diagnosis of external causes of injury or poisoning, by county of residence (2009) 99
Table 67: Percentage of children aged 7 in BMI categories of normal, overweight and obese, by gender (2008) 100
Table 68: Number, percentage and rate (per 10,000) of children under 18 years registered as having an intellectual disability, by age, gender and severity of disability (2005-2009) 102
Table 69: Number and percentage of children under 18 years registered as having an intellectual disability, by HSE Region and Local Health Office Area (2009) 103
Table 70: Number, percentage and rate (per 10,000) of children under 18 years registered as having a physical and/or sensory disability, by age, gender and type of disability (2005-2009) 106
Table 71: Number and percentage of children under 18 years registered as having a physical and/or sensory disability, by HSE Region and Local Health Office Area (2009) 107
Table 72: Number and percentage of child welfare and protection reports that went to initial assessment, by type of concern (2006-2008) 109
Table 73: Number and percentage of child welfare and protection reports that went to initial assessment, by type of concern, HSE Region and Local Health Office Area (2008) 110
Table 74: Number and percentage of confirmed child abuse cases, by type of abuse (2006-2008) 112
Table 75: Number and percentage of confirmed child abuse cases, by type of abuse, HSE Region and Local Health Office Area (2008) 113
Table 76: Percentage of children who report that students at their school participate in making the school rules, by population groups (2006) 116

xiii
Table 77: Percentage of children who report that students at their school participate in making the school rules, by age, gender and social class (1998, 2002 and 2006) 117
Table 78: Percentage of children who report that students at their school participate in making the school rules, by NUTS Region (2006) 118
Table 79: Percentage of children aged 15 who report that reading is one of their favourite hobbies, by population groups (2009) 120
Table 80: Percentage of children aged 15 who report that reading is one of their favourite hobbies, by gender and social class (2000, 2006 and 2009) 121
Table 81: Percentage of children who report smoking cigarettes every day, by population groups (2006) 122
Table 82: Percentage of children who report smoking cigarettes every day, by age, gender and social class (1998, 2002 and 2006) 123
Table 83: Percentage of children who report smoking cigarettes every day, by NUTS Region (2006) 124
Table 84: Percentage of children who report to have been drunk at least once in the last 30 days, by population groups (2006) 126
Table 85: Percentage of children who report to have been drunk at least once in the last 30 days, by age, gender and social class (2006) 127
Table 86: Percentage of children who report to have been drunk at least once in the last 30 days, by NUTS Region (2006) 128
Table 87: Percentage of children who report to have taken cannabis at least once in their lifetime, by population groups (2006) 130
Table 88: Percentage of children who report to have taken cannabis at least once in their lifetime, by age, gender and social class (2002 and 2006) 131
Table 89: Percentage of children who report to have taken cannabis at least once in their lifetime, by NUTS Region (2006) 132
Table 90: Number and rate (per 100,000) of births, by mothers’ age (2005-2009) 134Table 91: Number and percentage of births to mothers aged 10-17, by county (2009) 136Table 92: Percentage of children who report feeling happy with the way they are,
by population groups (2006) 137Table 93: Percentage of children who report feeling happy with the way they are,
by age, gender and social class (2006) 138Table 94: Percentage of children who report feeling happy with the way they are,
by NUTS Region (2006) 139Table 95: Percentage of children who report being happy with their lives at present,
by population groups (2006) 140Table 96: Percentage of children who report being happy with their lives at present,
by age, gender and social class (1998, 2002 and 2006) 141Table 97: Percentage of children who report being happy with their lives at present,
by NUTS Region (2006) 142

xiv
Table 98: Number and rate (per 100,000) of suicides, by age and gender (2005-2009) 143Table 99: Suicides as a percentage of total deaths of children aged 10-17, by gender
(2005-2009) 144Table 100: Percentage of children who report being physically active for at least
60 minutes per day on more than 4 days per week, by population groups (2006) 145Table 101: Percentage of children who report being physically active for at least
60 minutes per day on more than 4 days per week, by age, gender and social class (2002 and 2006) 146
Table 102: Percentage of children who report being physically active for at least 60 minutes per day on more than 4 days per week, by NUTS Region (2006) 147
Table 103: Percentage of children who report to eat breakfast on 5 or more days per week, by population groups (2006) 149
Table 104: Percentage of children who report to eat breakfast on 5 or more days per week, by age, gender and social class (2002 and 2006) 150
Table 105: Percentage of children who report to eat breakfast on 5 or more days per week, by NUTS Region (2006) 151
Table 106: Public expenditure on education as % of GDP in EU-27 (2004-2006) 156Table 107: Real non-capital public expenditure on education, by educational level
(1999-2008) 157Table 108: Percentage of persons at risk of poverty (2005-2009) 158Table 109: Percentage of persons experiencing consistent poverty (2005-2009) 160Table 110: Number and percentage of households with children identified as being
in need of social housing, by number of children (selected years 1996-2008) 163Table 111: Number and percentage of households with children identified as being
in need of social housing, by household structure and county (2008) 164Table 112: Percentage of children who report feeling safe in area where they live,
by population groups (2006) 165Table 113: Percentage of children who report feeling safe in area where they live,
by age, gender and social class (2002 and 2006) 166Table 114: Percentage of children who report feeling safe in area where they live,
by NUTS Region (2006) 167Table 115: Percentage of children who report that there are good places in their area
to spend their free time, by population groups (2006) 170Table 116: Percentage of children who report that there are good places in their area
to spend their free time, by age, gender and social class (2002 and 2006) 171Table 117: Percentage of children who report that there are good places in their area
to spend their free time, by NUTS Region (2006) 172Table 118: Number, percentage and rate (per 10,000) of children aged 10-17
referred/referrals to the Garda Juvenile Diversion Programme, by age, gender and outcome (2005-2009) 175

xv
Table 119: Number and percentage of children aged 10-17 referred/referrals to the Garda Juvenile Diversion Programme, by Region and Division (2009) 177
Table 120: Percentage of mothers attending for antenatal care in the first trimester of pregnancy, by mothers’ age (2004-2008) 179
Table 121: Immunisation uptake rates, by age and vaccine type (2005-2009) 183Table 122: Immunisation uptake rates at 12 months, by HSE Region and Local Health
Office Area (2009) 184Table 123: Immunisation uptake rates at 24 months, by HSE Region and Local Health
Office Area (2009) 186Table 124: Immunisation uptake rates among children of relevant age, by vaccine type
and EU-27 (2009) 188Table 125: Number of children on hospital waiting lists (surgical and medical),
by hospital and waiting time (2010) 190Table 126: Number and percentage of children in the care of the HSE, by age, gender,
type of placement and length of stay (2006-2008) 192Table 127: Number and percentage of children in the care of the HSE, by HSE Region
and Local Health Office Area (2008) 193Table 128: Number, percentage and rate (per 100,000) of admissions to psychiatric
hospitals among children, by age, gender and diagnosis (2004-2008) 196Table 129: Number and percentage of admissions to psychiatric hospitals among
children, by county (2008) 197
xvi
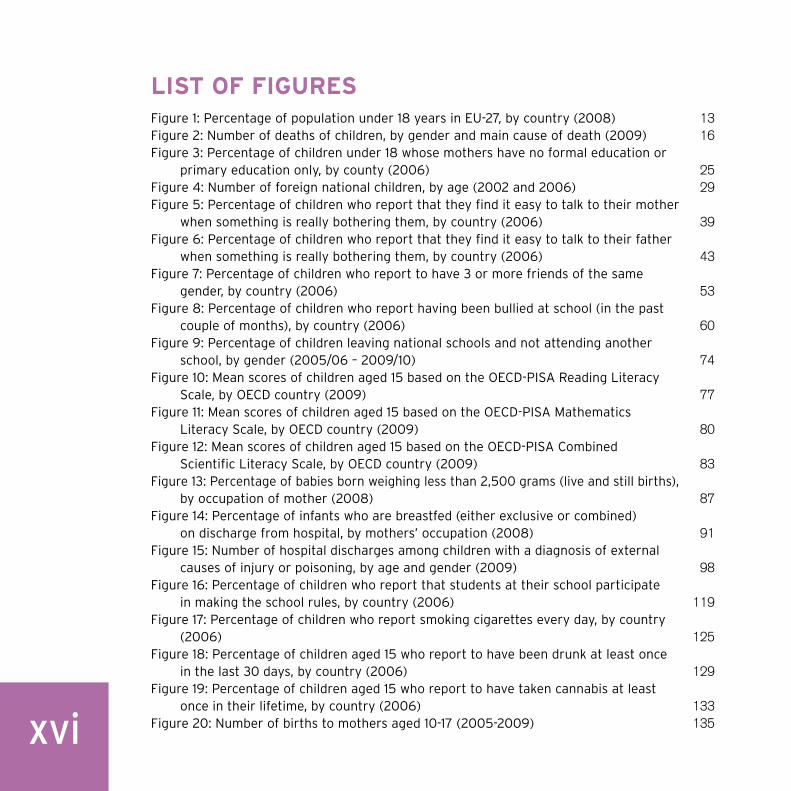
list oF FiguresFigure 1: Percentage of population under 18 years in EU-27, by country (2008) 13Figure 2: Number of deaths of children, by gender and main cause of death (2009) 16Figure 3: Percentage of children under 18 whose mothers have no formal education or
primary education only, by county (2006) 25Figure 4: Number of foreign national children, by age (2002 and 2006) 29Figure 5: Percentage of children who report that they find it easy to talk to their mother
when something is really bothering them, by country (2006) 39Figure 6: Percentage of children who report that they find it easy to talk to their father
when something is really bothering them, by country (2006) 43Figure 7: Percentage of children who report to have 3 or more friends of the same
gender, by country (2006) 53Figure 8: Percentage of children who report having been bullied at school (in the past
couple of months), by country (2006) 60Figure 9: Percentage of children leaving national schools and not attending another
school, by gender (2005/06 – 2009/10) 74Figure 10: Mean scores of children aged 15 based on the OECD-PISA Reading Literacy
Scale, by OECD country (2009) 77Figure 11: Mean scores of children aged 15 based on the OECD-PISA Mathematics
Literacy Scale, by OECD country (2009) 80Figure 12: Mean scores of children aged 15 based on the OECD-PISA Combined
Scientific Literacy Scale, by OECD country (2009) 83Figure 13: Percentage of babies born weighing less than 2,500 grams (live and still births),
by occupation of mother (2008) 87Figure 14: Percentage of infants who are breastfed (either exclusive or combined)
on discharge from hospital, by mothers’ occupation (2008) 91Figure 15: Number of hospital discharges among children with a diagnosis of external
causes of injury or poisoning, by age and gender (2009) 98Figure 16: Percentage of children who report that students at their school participate
in making the school rules, by country (2006) 119Figure 17: Percentage of children who report smoking cigarettes every day, by country
(2006) 125Figure 18: Percentage of children aged 15 who report to have been drunk at least once
in the last 30 days, by country (2006) 129Figure 19: Percentage of children aged 15 who report to have taken cannabis at least
once in their lifetime, by country (2006) 133Figure 20: Number of births to mothers aged 10-17 (2005-2009) 135

xvii
Figure 21: Percentage of children who report being physically active for at least 60 minutes per day on more than 4 days per week, by country (2006) 148
Figure 22: Percentage of children who report to eat breakfast on 5 or more days per week, by country (2006) 152
Figure 23: Public expenditure on education in Ireland and in EU-27 (1998-2007) 155Figure 24: Percentage of children under 18 at risk of poverty by EU-27 (2008) and
percentage of children under 18 at risk of poverty by NUTS Region (2009) 159Figure 25: Percentage of persons experiencing consistent poverty by household
structure (2009) and percentage of children experiencing consistent poverty by NUTS Region (2009) 161
Figure 26: Percentage of children who report feeling safe in the area where they live, by country (2006) 168
Figure 27: Percentage of children who report that there are good places in their area to spend their free time, by country (2006) 173
Figure 28: Percentage referrals to the Garda Juvenile Diversion Programme, by type of offence (2009) 176
Figure 29: Percentage of mothers attending for antenatal care in the first trimester of pregnancy, by mothers’ occupation (2008) 180
Figure 30: Percentage of mothers attending for antenatal care in the first trimester of pregnancy, by mothers’ county of residence (2008) 181

xviii
AcronyMs usedBCG Bacillus Calmette-Guerin vaccineBMI Body Mass IndexCPI Consumer Price IndexCSO Central Statistics OfficeD3 Diphtheria and Tetanus vaccineDEIS Delivering Equality of Opportunity in SchoolsDTaP3 Diphtheria, Tetanus and Pertussis vaccineERC Education Research CentreESPAD European School Survey Project on Alcohol and Other DrugsESRI Economic and Social Research InstituteEU European UnionEU-25 average Average result for 25 EU Member StatesEU-27 average Average result for 27 EU Member StatesEurostat Statistical Office of the European CommunitiesEU-SILC EU Survey on Income and Living ConditionsGCSE General Certificate of Secondary EducationGDP Gross Domestic ProductGNP Gross National ProductGNI Gross National IncomeGRO General Register’s OfficeHBSC Health Behaviour in School-aged Children SurveyHFA-DB European Health for All DatabaseHiB3 Haemophilus Influenzae Type B vaccineHIPE Hospital In-Patient Enquiry SystemHPSC Health Protection Surveillance CentreHRB Health Research BoardHSE Health Service ExecutiveICD-9-CM Clinical modification of the 9th Revision of the International Classification
of DiseasesICD-10 World Health Organization’s International Classification of Diseases categoryICD-10-AM Australian modification of ICD-10LAAHN Local Authority Assessment of Housing NeedMenC3 Meningococcal Type C disease vaccineMMR Measles, Mumps and Rubella vaccineNCVA National Council for Vocational AwardsNESF National Economic and Social ForumNEWB National Educational Welfare Board

xix
NHS National Health ServiceNIDD National Intellectual Disability DatabaseNPIRS National Psychiatric In-Patient Reporting SystemNPRS National Perinatal Reporting SystemNPSDD National Physical and Sensory Disability DatabaseNTPF National Treatment Purchase FundNUIG National University of Ireland, GalwayNUTS Nomenclature of Territorial Units for StatisticsOECD Organization for Economic Co-operation and DevelopmentOMCYA Office of the Minister for Children and Youth AffairsPHN Public Health NursePolio3 Poliomyelitis vaccinePISA Programme for International Student Assessment SurveyPPSN Personal Public Service NumberPTR Patient Treatment RegisterP3 Pertussis vaccineQNHS Quarterly National Household SurveyT3 Tetanus vaccineUNESCO United Nations Educational, Scientific and Cultural OrganizationWHO World Health Organization


INTRODUCTION

2
This is Ireland’s third biennial State of the Nation’s Children report. These reports, which provide the most up-to-date data on all indicators in the National Set of Child Well-Being Indicators, aim to:
chart the well-being of children in Ireland; ■
track changes over time; ■
benchmark progress in Ireland relative to other countries; ■
highlight policy issues arising. ■
outline oF report
This State of the Nation’s Children report is presented in four sections, as follows:
part 1: socio-demographics: ■ This section provides information on the child population, child mortality, family structure, parental education level, Traveller children, foreign national children, children with a disability and separated children seeking asylum. Data are largely drawn from Vital Statistics, the Census of Population and Population Estimates.
part 2: children’s relationships: ■ This section provides information on children’s relationships with their parents and peers, including, for example, levels of reported bullying and children’s friendships. Data are drawn from the Health Behaviour of School-aged Children (HBSC) surveys and the Programme for International Student Assessment (PISA) surveys.
part 3: children’s outcomes: ■ This section provides information on children’s health outcomes, educational outcomes, and social, emotional and behavioural outcomes, including, for example, daily smoking, alcohol and drug use, births to teenage girls, health conditions and hospitalisation, educational attainment and self-reported happiness. Data are drawn from the Health Behaviour of School-aged Children (HBSC) surveys, the Programme for International Student Assessment (PISA) surveys, the National Intellectual Disability Database, the National Physical and Sensory Disability Database, and the National Perinatal Reporting System, among others.
part 4: Formal and informal supports: ■ This section provides information on a range of supports, both formal and informal, including school, housing, antenatal care, immunisation and economic. Data are drawn from the European Union Survey of Income and Living Conditions (EU-SILC), Health Behaviour of School-aged

3
INTRODUCTION
INT
RO
DU
CT
IONChildren (HBSC) surveys, National Perinatal Reporting System, Vital Statistics,
the Triennial Assessment of Housing Needs and the Programme for International Student Assessment (PISA) surveys, among others.
new developMents
This State of the Nation’s Children: Ireland 2010 represents a significant advance on earlier reports in this series. In this report, new indicators have been introduced, existing indicators have been strengthened through more sophisticated disaggregation and analytical techniques, and critical data gaps have been closed. While it has not been possible to update all indicators in this report, previously published data from the 2006 and 2008 reports have been maximised in such a way that tells us something new about child well-being in Ireland.
new indicatorsThis report includes a number of new indicators that fill previously identified data gaps around the areas of disability; accidents, injuries and hospitalisation; quality of early childhood care and education; and nutritional outcomes (see below). Due to data issues, existing indicators on youth homelessness and screening for growth and development have been excluded from this report.
INDICATOR MEASURE DATA SOURCE
Children with a disability
The number of children with a disability. Census of the Population
Accidents, injuries and hospitalisation
The number of hospital discharges among children with a diagnosis of external causes of injury or poisoning.
Hospital In-Patient Enquiry System
Quality of early childhood care and education
The percentage of households with children under 13 years of age who report they have ‘access to high-quality, affordable childcare in the community’.
Childcare Module of the Quarterly National Household Survey
The percentage of Early Childhood Care and Education (ECCE) services under contract to deliver the Free Pre-School Year Scheme that meet basic and higher capitation criteria.
ECCE Database
Nutritional outcomes The percentage of children aged 7 in the BMI categories of normal, overweight and obese.
WHO European Childhood Obesity Surveillance Initiative

4
STATE OF THE NATION’S CHILDREN — IRELAND 2010
new disaggregationIn earlier reports, indicators were disaggregated according to age, gender, social class and geographic location. Due to data availability issues, further disaggregation across vulnerable groups of children was not possible. Since the publication of the last report (2008), significant efforts have been made to address this. The Office of the Minister for Children and Youth Affairs (OMCYA) liaised with, and welcomes the cooperation of, a number of data providers who have worked to identify vulnerable groups of children in their data sets. In this report, a particular focus is given to Traveller children, immigrant children and children with a disability and/or chronic illness.
statistical significanceIn earlier reports, differences across age, gender, social class and geographic location were simply described. As part of an ongoing effort to improve these reports and again with the cooperation of data providers, the State of the Nation’s Children: Ireland 2010 includes significance testing to assess if these differences are statistically significant.
key Findings
Ireland continues to have the highest proportion of children in the European Union ■
(Population Estimates, Central Statistics Office, 2009).
The majority of child deaths occur in the period of infancy (less than one year of ■
age) (Vital Statistics, Central Statistics Office, 2009).
Approximately one in 6 children in Ireland live in a lone-parent household (Census ■
of the Population, Central Statistics Office, 2006).
Nearly one-third of foreign national children live in families where their mother ■
has a third-level qualification (Census of the Population, Central Statistics Office, 2006).
Almost half of the total Traveller population of Ireland are under 18 years of age ■
(Census of the Population, Central Statistics Office, 2006).
Foreign national children account for approximately 6% of the total child population ■
of Ireland (Census of the Population, Central Statistics Office, 2006).
Almost two-thirds of children with a disability are boys (Census of the Population, ■
Central Statistics Office, 2006).

5
INTRODUCTION
INT
RO
DU
CT
IONThe number of separated children seeking asylum has decreased (Child Care ■
Interim Data Set, Health Service Executive, 2008).
Older children find it more difficult to talk to their mothers when something is really ■
bothering them (HBSC Survey, Health Promotion Research Centre, 2006).
The percentage of children who report that they find it easy to talk to their fathers ■
when something is really bothering them has increased from approximately 48% in 1998 to 60% in 2006 (HBSC Survey, Health Promotion Research Centre, 2006).
Significantly more girls than boys report that their parents spend time just talking ■
with them (PISA Survey, Education Research Centre, 2009).
There has been a significant decrease in the percentage of 15-year-old children who ■
report that their parents discuss with them how well they are doing at school (PISA Survey, Education Research Centre, 2009).
There has been a significant decrease in the percentage of 15-year-old children who ■
report that their parents eat a main meal with them around a table (PISA Survey, Education Research Centre, 2009).
Almost 9 out of 10 children have 3 or more friends of the same gender (HBSC ■
Survey, Health Promotion Research Centre, 2006).
The percentage of children who report to have a pet of their own or a pet in the ■
family is significantly lower among Traveller children and among immigrant children (HBSC Survey, Health Promotion Research Centre, 2006).
Immigrant children and children with a disability and/or chronic illness are more ■
likely to report to have been bullied at school (HBSC Survey, Health Promotion Research Centre, 2006).
Almost one in 3 children under 13 years of age avail of non-parental childcare ■
(Childcare Module, Quarterly National Household Survey, Central Statistics Office, 2007).
Households in the Mid-West region are most likely to report that they have access ■
to high-quality, affordable childcare in the community (Childcare Module, Quarterly National Household Survey, Central Statistics Office, 2007).
82% of Early Childhood Care and Education (ECCE) services under contract to ■
deliver the Free Pre-School Year Scheme meet basic capitation criteria and 11% meet higher capitation criteria (ECCE Database, 2010).

6
STATE OF THE NATION’S CHILDREN — IRELAND 2010
One in every 8 primary school children and one in every 6 post-primary school ■
children miss 20 days or more in the school year (National Educational Welfare Board, 2007/08).
The majority of children leaving national schools are known to have either ■
progressed to another form of schooling or have emigrated with their families (Education Statistics, Department of Education and Skills, 2009/10).
There has been a significant decline in reading literacy scores among 15-year-olds ■
in Ireland (PISA Survey, Education Research Centre, 2009).
Mathematics literacy scores of 15-year-olds in Ireland are significantly below the ■
OECD average (PISA Survey, Education Research Centre, 2009).
Science literacy scores of 15-year-olds in Ireland are significantly above the OECD ■
average (PISA Survey, Education Research Centre, 2009).
The percentage of low birth weight babies has remained relatively stable over the ■
last 5 years (National Perinatal Reporting System, Economic and Social Research Institute, 2008).
Breastfeeding initiation rates have continued to increase (National Perinatal ■
Reporting System, Economic and Social Research Institute, 2008).
More than half of the total hospital discharges among children were children under ■
5 years of age (Hospital In-Patient Enquiry, Department of Health and Children, 2009).
The numbers of hospital discharges among children with a diagnosis of ‘transport ■
accidents’, ‘intentional self-harm’ and ‘accidental poisoning’ continue to fall (Hospital In-Patient Enquiry, Department of Health and Children, 2009).
Almost one-quarter of 7-year-old children are either overweight or obese (WHO ■
European Childhood Obesity Surveillance Initiative, National Nutrition Surveillance Centre, 2008).
Approximately 6 in 10 children registered as having an intellectual disability are ■
boys (National Intellectual Disability Database, Health Research Board, 2009).
Approximately one in 4 children on the National Physical and Sensory Disability ■
Database are registered as having multiple disabilities (National Physical and Sensory Disability Database, Health Research Board, 2009).

7
INTRODUCTION
INT
RO
DU
CT
IONThe number of child welfare and protection reports that went to initial assessment ■
increased by 2,844 over the period 2006-2008 (Child Care Interim Data Set, Health Service Executive, 2008).
The number of cases of confirmed child abuse has increased (Child Care Interim ■
Data Set, Health Service Executive, 2008).
The percentage of children who report that students at their school participate in ■
making the school rules has decreased from approximately 33% in 1998 to 23% in 2006 (HBSC Survey, Health Promotion Research Centre, 2006).
Approximately one-third of 15-year-old children report that reading is one of their ■
favourite hobbies (PISA Survey, Education Research Centre, 2009).
Daily cigarette smoking is significantly higher among Traveller children (HBSC ■
Survey, Health Promotion Research Centre, 2006).
Immigrant children are less likely to report to have been drunk at least once in the ■
last 30 days (HBSC Survey, Health Promotion Research Centre, 2006).
Lifetime cannabis use is significantly higher among boys and Traveller children ■
(HBSC Survey, Health Promotion Research Centre, 2006).
In 2009, 564 babies were born to teenage girls (Vital Statistics, Central Statistics ■
Office, 2009).
Approximately 4 in 10 girls aged 15-17 report feeling happy with the way they are ■
(HBSC Survey, Health Promotion Research Centre, 2006).
Self-reported happiness levels are significantly lower among Traveller children, ■
immigrant children and children with a disability and/or chronic illness (HBSC Survey, Health Promotion Research Centre, 2006).
In 2009, 21 young children took their own lives (Vital Statistics, Central Statistics ■
Office, 2009).
Children in Ireland have the highest levels of physical activity among 41 OECD ■
countries (HBSC Survey, Health Promotion Research Centre, 2006).
Boys and younger children are more likely to eat breakfast on 5 or more days per ■
week (HBSC Survey, Health Promotion Research Centre, 2006).
Since 2002, Ireland’s expenditure on education has increased (Department of ■
Education and Skills, 2007).

8
STATE OF THE NATION’S CHILDREN — IRELAND 2010
Children in the Midlands region are three times more likely to be at risk of poverty ■
than children in the Dublin region (EU-SILC, Central Statistics Office, 2009).
The percentage of children in the South-East region experiencing consistent ■
poverty is approximately twice as high as the national average (EU-SILC, Central Statistics Office, 2009).
The number of households with children in need of social housing has increased ■
by 24% since 2005 (Triennial Assessment of Housing Needs, Department of the Environment, Heritage and Local Government, 2008).
Traveller children and children with a disability and/or chronic illness are less likely ■
to report feeling safe in the area where they live (HBSC Survey, Health Promotion Research Centre, 2006).
Traveller children and immigrant children are more likely to report having good ■
places in their area to spend their free time (HBSC Survey, Health Promotion Research Centre, 2006).
There has been a substantial decrease in the number of children referred to the ■
Garda Juvenile Diversion Programme (An Garda Síochána, 2009).
Early antenatal care is lowest among younger mothers (National Perinatal ■
Reporting System, Economic and Social Research Institute, 2008).
In 2009, Roscommon had the highest uptake of the recommended doses of all ■
vaccines among children at 12 and 24 months (Immunisation Uptake Statistics, Health Protection Surveillance Centre, 2009).
In April 2010, 2,591 children were known to be on a hospital waiting list (Patient ■
Treatment Register, National Treatment Purchase Fund, 2010).
Almost 9 out of 10 children in the care of the Health Service Executive (HSE) live ■
in foster family homes (Child Care Interim Data Set, Health Service Executive, 2008).
There has been an increase in the number of children admitted to psychiatric ■
hospitals (National Psychiatric In-Patient Reporting System, Health Research Board, 2008).

PART 1: SOCIO-DEMOGRAPHICS

10
STATE OF THE NATION’S CHILDREN – IRELAND 2010
child populAtion
ireland continues to have the highest proportion of children in the european union.
Measure
the number of children under 18.
key findingsIn 2009, there were 1,107,034 children aged under 18 living in Ireland. This ■
accounted for almost one-quarter (24.8%) of the total population of Ireland.
differences by age, gender and over time567,303 of children under 18 were boys and 539,731 were girls ( ■ see Table 1).
Table 1: Number of children under 18, by age and gender (2009)
Boys Girls Total Cumulative Total
Total population (under 18) 567,303 539,731 1,107,034
Total population (all ages) 2,217,664 2,241,641 4,459,305
Age
Under 1 37,758 35,731 73,489 73,489
1 37,040 35,154 72,194 145,683
2 34,800 33,724 68,524 214,207
3 33,116 31,333 64,449 278,656
4 32,569 30,413 62,982 341,638
5 32,332 30,610 62,942 404,580
6 31,927 30,552 62,479 467,059
7 31,519 30,042 61,561 528,620
8 30,967 29,996 60,963 589,583
9 30,814 29,274 60,088 649,671
10 30,678 29,037 59,715 709,386
11 30,423 29,074 59,497 768,883
12 29,529 28,078 57,607 826,490
continued

11
CHILD POPULATION
PA
RT
1: S
OC
IO-D
EM
OG
RA
PH
ICSTable 1 (continued)
Age Boys Girls Total Cumulative Total
13 28,732 27,504 56,236 882,726
14 28,320 26,706 55,026 937,752
15 28,033 26,860 54,893 992,645
16 29,137 27,168 56,305 1,048,950
17 29,609 28,475 58,084 1,107,034
Source: Population Estimates, CSO
The percentage of children under 18 has decreased over the past 26 years, from ■
36.2% in 1981 to 24.8% in 2009 (see Table 2).
The number of children under 18 has also decreased over this time period, falling ■
from 1,246,443 in 1981 to 1,013,031 in 2002, but has risen since then to stand at 1,107,034 in 2009.
Table 2: Number of children and percentage of population under 18, by gender (selected years 1981-2009)
Year Boys % of all men
Girls % of all women
Total % of all ages
1981 638,768 36.9 607,675 35.5 1,246,443 36.2
1986 630,985 35.7 599,165 33.8 1,230,150 34.7
1991 587,655 33.5 557,738 31.5 1,145,393 32.5
1996 550,389 30.6 521,583 28.6 1,071,972 29.6
2002 519,483 26.7 493,548 25.0 1,013,031 25.9
2006 530,973 25.0 505,061 23.8 1,036,034 24.4
2007 541,503 24.9 515,444 23.8 1,056,947 24.4
2008 556,017 25.2 529,241 23.9 1,085,258 24.5
2009 567,303 25.6 539,731 24.1 1,107,034 24.8
Source: Census of the Population and Population Estimates, CSO

12
STATE OF THE NATION’S CHILDREN – IRELAND 2010
differences by geographic locationIn 2008, Ireland had the highest proportion of children under 18 in the European ■
Union (see Table 3 and Figure 1).
Table 3: Percentage of population under 18 in EU-27, by country (selected years 1988-2008)
1988 1998 2008
EU-27 21.6 20.3 19.2
Country
Austria 21.2 20.0 19.0
Belgium 21.4 20.9 20.6
Bulgaria 20.9 18.6 16.9
Cyprus 28.8 25.5 21.7
Czech Republic 21.6 19.5 17.9
Denmark 21.2 22.1 22.2
Estonia 23.9 21.3 18.8
Finland 22.5 21.4 20.7
France 23.4 22.9 22.3
Germany 19.4 18.5 17.0
Greece 20.4 18.0 17.4
Hungary 21.6 19.9 18.7
Ireland 28.4 25.6 24.5
Italy 17.7 17.2 17.0
Latvia 23.6 20.8 18.0
Lithuania 25.3 23.2 20.0
Luxembourg 22.1 22.2 21.7
Malta 25.9 23.0 20.3
Netherlands 22.0 22.2 21.6
Poland 26.3 22.7 19.6
Portugal 21.1 19.3 18.6
Romania 24.0 21.8 18.9
Slovakia 26.1 22.9 20.0
Slovenia 21.4 18.8 17.2
Spain 19.7 17.8 17.6
Sweden 22.1 21.7 21.0
United Kingdom 23.1 22.3 21.4
Source: Eurostat

13
CHILD POPULATION
PA
RT
1: S
OC
IO-D
EM
OG
RA
PH
ICSFigure 1: percentage of population under 18 years in eu-27, by country (2008)
0 5 10 15 20 25 30
Bulgaria
% of population
Germany
Italy
Slovenia
Greece
Spain
Czech Republic
Latvia
Portugal
Hungary
Estonia
Romania
Austria
EU-27
Poland
Slovakia
Lithuania
Malta
Belgium
Finland
Sweden
United Kingdom
Netherlands
Cyprus
Luxembourg
Denmark
France
Ireland 24.5
22.3
22.2
21.7
21.7
21.6
21.4
21.0
20.7
20.6
20.3
20.0
20.0
19.6
19.2
19.0
18.9
18.8
18.7
18.6
18.0
17.9
17.6
17.4
17.2
17.0
17.0
16.9
Source: Eurostat

14
STATE OF THE NATION’S CHILDREN – IRELAND 2010
child MortAlity
the majority of child deaths occur in the period of infancy (less than one year of age).
Measure
the number of deaths of children under 18.
key findingsIn 2009, there were 419 deaths of children under 18. ■
differences by age, gender and over timeThe majority of child deaths occur in the period of infancy (less than 1 year) ( ■ see Table 4). Infant deaths accounted for 240 of the total of 419 of deaths of children in 2009. This represented a death rate of 32.7 per 10,000 children aged under 1 year, compared to an overall rate of 3.8 per 10,000 children under 18. Apart from the period of infancy, the next highest death rates occurred in the age groups 15-17 and 1-4.
Table 4: Number and rate (per 10,000) of deaths of children, by age (2005-2009)
2005 2006 2007 2008 2009
No. Rate No. Rate No. Rate No. Rate No. Rate
Total 417 4.1 421 4.1 413 3.9 463 4.3 419 3.8
Age
Under 1 236 38.7 255 41.8 230 35.1 290 40.3 240 32.7
1-4 52 2.2 38 1.6 54 2.2 44 1.7 66 2.5
5-9 26 0.9 32 1.1 17 0.6 28 0.9 22 0.7
10-14 38 1.4 35 1.3 50 1.8 46 1.6 33 1.1
15-17 65 3.8 61 3.6 62 3.6 55 3.2 58 3.4
Source: Vital Statistics, CSO
The death rates were consistently higher for boys than for girls ( ■ see Table 5). In 2009, the death rate for boys was 4.4 per 10,000 compared to the death rate for girls of 3.2 per 10,000.

15
CHILD MORTALITY
PA
RT
1: S
OC
IO-D
EM
OG
RA
PH
ICSThere has been a decrease in infant mortality rates over the past 5 years. In 2005, ■
this rate was 38.7 per 10,000; by 2009, it was 32.7 per 10,000. The death rate of children under 18 has fallen over time, from 4.1 deaths per 10,000 in 2005 to 3.8 deaths per 10,000 in 2009.
Table 5: Death rates (per 10,000) of children, by gender (2005-2009)
2005 2006 2007 2008 2009
Total 4.1 4.1 3.9 4.3 3.8
Gender
Boys 4.2 4.8 4.4 5.1 4.4Girls 4.0 3.3 3.4 3.4 3.2
Source: Vital Statistics, CSO
differences by cause of deathThe largest single cause of child deaths was deaths attributable to congenital ■
malformations (see Table 6). This was followed by ‘certain conditions in the perinatal period’ and ‘injury and poisoning’.
Table 6: Number of deaths of children, by age and main cause of death (2009)
Under 1 1-4 5-9 10-14 15-17 All children
No. No. No. No. No. No.
Total 240 66 22 33 58 419
Main cause
Malignant neoplasms 2 11 6 2 1 22
Certain conditions in the perinatal period
96 1 0 1 0 98
Congenital malformations 104 12 4 3 3 126
Sudden Infant Death Syndrome 22 0 0 0 0 22
Injury and poisoning 1 18 4 21 41 85
Other 15 24 8 6 13 66
Source: Vital Statistics, CSO
More boys than girls died in each category according to cause of death ( ■ see Figure 2). This was particularly notable in the category ‘injury and poisoning’, where more than twice as many deaths were recorded for boys than for girls (59 compared with 26).

16
STATE OF THE NATION’S CHILDREN – IRELAND 2010
Figure 2: number of deaths of children, by gender and main cause of death (2009)
Source: Vital Statistics, CSO
differences by geographic locationIn 2008, Romania had the highest infant mortality rate (11 per 1,000) and ■
Luxembourg had the lowest infant mortality rate (1.8 per 1,000) (see Table 7). The infant mortality rate in Ireland was 3.1 per 1,000.
0 10 20 30 40 50 60 70
Other
poisoningInjury and
Death Syndrome
Sudden Infant
malformationsCongenital
the perinatal periodCertain conditions in
neoplasms
No. of deaths
Cau
se o
f d
eath
Malignant
Girls
8
14
37
61
61
65
1012
2659
29
37
Boys

17
CHILD MORTALITY
PA
RT
1: S
OC
IO-D
EM
OG
RA
PH
ICSTable 7: Infant mortality rate (per 1,000 live births) in EU-27, by country (selected years 1988-2008)*
1988 1998 2008
EU-27 11.1 6.5 n/a
Country
Austria 8.1 4.9 3.7
Belgium 9.0 5.2 3.4
Bulgaria 13.6 14.4 8.6
Cyprus 13.0 7.0 5.3
Czech Republic 11.0 5.2 2.8
Denmark 7.6 4.7 4.0
Estonia 12.5 9.4 5.0
Finland 6.1 4.2 2.6
France n/a 4.8 3.8
Germany 7.6 4.7 3.5
Greece 11.0 6.7 3.5
Hungary 15.8 9.7 5.6
Ireland 8.9 5.9 3.1
Italy 9.3 5.5 3.7
Latvia 11.0 15.0 6.7
Lithuania 11.6 9.3 4.9
Luxembourg 8.7 5.0 1.8
Malta 8.0 5.1 9.9
Netherlands 6.8 5.2 3.8
Poland 19.9 9.5 5.6
Portugal 13.1 6.0 3.3
Romania 25.4 20.5 11.0
Slovakia 13.3 8.7 5.9
Slovenia 10.0 5.2 2.1
Spain 8.0 4.9 3.5
Sweden 5.8 3.5 2.5
United Kingdom 9.0 5.7 4.7
n/a = not available * 2007 data used for Ireland for 2008.Source: Eurostat

18
STATE OF THE NATION’S CHILDREN – IRELAND 2010
In general, the mortality rate per 10,000 children across the EU-27 is higher for ■
boys than for girls (see Table 8).
Mortality rates are also substantially higher in the 0-4 year age group than for any ■
other age group. The data show that in 2007 Romania had the highest mortality rate for boys in the 0-4 age group (32 per 10,000) and Sweden had the lowest mortality rate (6.7 per 10,000).
Table 8: Rate (per 10,000) of deaths of children across selected countries in EU-27, by age and gender (2007)
0-4 years 5-9 years 10-14 years 15-19 years
Boys Girls Boys Girls Boys Girls Boys Girls
EU-27 12.3 10.0 1.2 1.0 1.5 1.2 5.2 2.2
Country
Austria 9.2 7.5 1.0 0.6 1.2 0.9 6.5 2.4Belgium 11.6 8.5 1.0 0.8 1.5 1.2 5.2 2.4Bulgaria 26.3 21.9 2.7 2.2 2.8 2.5 7.4 3.4Cyprus 8.4 9.0 2.7 2.3 1.5 2.7 5.2 2.5Czech Republic 10.5 7.3 1.1 0.9 1.7 1.0 5.4 2.3Denmark 10.8 8.1 0.9 0.7 1.2 0.9 4.9 2.2Estonia 15.3 12.9 2.2 1.4 2.5 2.4 8.0 2.2Finland 8.1 6.2 0.9 1.1 1.3 1.2 6.5 2.8France 10.7 8.1 0.9 0.9 1.2 0.9 4.7 1.9Germany 10.1 8.1 1.1 0.7 1.1 0.9 4.1 1.8Greece 9.6 8.0 1.4 1.0 1.3 0.9 6.1 1.8Hungary 14.9 13.4 1.3 1.3 2.2 1.6 5.5 2.2
Ireland 9.6 8.2 1.0 0.6 1.6 1.6 6.5 3.0
Italy 8.9 7.8 1.1 0.8 1.4 1.0 5.0 2.1Latvia 22.3 22.6 3.5 1.9 3.6 2.6 9.7 3.7Lithuania 15.5 14.8 2.8 2.0 3.6 2.8 12.6 3.5Luxembourg 9.0 4.5 0.0 0.7 0.0 3.4 4.2 2.9Malta 9.9 16.6 0.9 0.9 2.2 1.6 4.8 0.7Netherlands 10.5 7.7 0.9 0.9 1.1 1.2 3.4 1.7Poland 16.5 13.5 1.5 1.1 2.2 1.5 7.1 2.5Portugal 8.3 7.7 1.4 0.9 1.5 1.7 5.2 2.0Romania 32.0 25.2 3.4 2.5 3.6 2.3 7.5 3.8Slovakia 16.9 14.1 2.1 2.2 2.1 1.4 5.7 2.4Slovenia 7.9 8.1 0.9 1.4 1.0 1.9 5.5 2.9Spain 10.2 8.9 1.2 1.0 1.6 1.1 5.0 1.8Sweden 6.7 6.4 0.8 0.9 1.0 0.6 4.4 2.1United Kingdom 13.3 10.7 1.1 0.8 1.2 1.1 3.9 1.9
Source: Eurostat

19
FAMILY STRUCTURE
PA
RT
1: S
OC
IO-D
EM
OG
RA
PH
ICSFAMily structure
Approximately one in 6 children in ireland live in a lone-parent household.
Measure
the number of children under 18 living in a lone-parent household.
key findingsIn 2006, 17.8% (183,744) of children under 18 years of age lived in a lone-parent ■
household.
differences by population groups24.7% (2,698) of Traveller children, 18.5% (11,631) of foreign national children and ■
23.1% (9,694) of children with a disability lived in a lone-parent household (see Table 9).
Table 9: Number and percentage of children under 18 living in a lone-parent household, by population groups (2006)
No. % of all children
All children 183,744 17.8
Population groups
Traveller children 2,698 24.7
Foreign national children 11,631 18.5
Children with a disability 9,694 23.1
Source: Census of the Population, CSO
differences by age and genderAlmost one in 5 (18.5%) of children aged 15-17 lived in a lone-parent household ■
(see Table 10).
The percentage of boys and girls living in a lone-parent household was broadly ■
similar.

20
STATE OF THE NATION’S CHILDREN – IRELAND 2010
Table 10: Number and percentage of children under 18 living in a lone-parent household, by age and gender (2006)
Boys Girls Total
No. % of all boys No. % of all girls No. % of all children
All children 94,120 17.8 89,624 17.8 183,744 17.8
Age
0-4 25,902 16.8 24,750 16.8 50,652 16.8
5-9 26,884 18.2 25,526 18.2 52,410 18.2
10-14 25,177 17.9 23,773 17.8 48,950 17.9
15-17 16,157 18.4 15,575 18.6 31,732 18.5
Source: Census of the Population, CSO
differences by geographic locationDublin had the highest proportion of children living in a lone-parent household ■
(see Table 11).
Table 11: Number and percentage of children under 18 living in a lone-parent household, by county (2006)
No. % within county % within State
State 183,744 17.8 100.0
County
Carlow 2,248 17.7 1.2
Cavan 1,988 11.6 1.1
Clare 3,933 13.8 2.1
Cork 18,639 16.1 10.1
Donegal 6,858 17.1 3.7
Dublin 61,903 23.9 33.7
Galway 7,909 14.4 4.3
Kerry 5,076 15.5 2.8
Kildare 7,830 15.5 4.3
Kilkenny 3,077 13.6 1.7
Laois 2,453 13.6 1.3
Leitrim 810 11.4 0.4
Limerick 8,188 19.0 4.5
continued

21
FAMILY STRUCTURE
PA
RT
1: S
OC
IO-D
EM
OG
RA
PH
ICSTable 11 (continued)
County No. % within county % within State
Longford 1,664 18.6 0.9
Louth 5,915 20.3 3.2
Mayo 3,902 12.6 2.1
Meath 5,403 12.1 2.9
Monaghan 1,885 13.1 1.0
Offaly 2,892 15.2 1.6
Roscommon 1,679 11.6 0.9
Sligo 2,157 14.9 1.2
Tipperary 6,263 16.5 3.4
Waterford 5,378 20.1 2.9
Westmeath 3,477 16.7 1.9
Wexford 6,332 18.2 3.4
Wicklow 5,885 18.2 3.2
Source: Census of the Population, CSO

22
STATE OF THE NATION’S CHILDREN – IRELAND 2010
pArentAl educAtion level
nearly one-third of foreign national children live in families where their mother has a third-level qualification.
Measure
the percentage of children under 18 whose mothers have attained (a) primary, (b) lower secondary, (c) upper secondary or (d) third-level education.
key findingsIn 2006, 30.6% of children lived in families where the mother had a third-level ■
degree or higher educational attainment; 52.8% of children lived in families where the highest level of educational attainment by mothers was a lower secondary or upper secondary education, while just 6.3% of children lived in families where the mother had either no formal education or primary education only.
differences by population groupsApproximately 6 out of every 10 Traveller children (58.9%) lived in families where ■
the mother had either no formal education or primary education only, while 30.7% of foreign national children lived in families where the mother had a third-level degree or higher educational attainment (see Table 12).
Table 12: Percentage of children under 18, by population groups and educational attainment of mother (2006)
Highest level of education attained All children Traveller children
Foreign national children
Children with a disability
Primary (including no formal education) 6.3 58.9 5.3 9.3
Lower secondary 20.8 11.4 14.9 24.6
Upper secondary 32.0 2.2 25.2 29.3
Third-level (Degree or higher) 30.6 0.9 30.7 26.8
Not stated/not available 10.3 26.7 23.9 10.0
Source: Census of the Population, CSO

23
PARENTAL EDUCATION LEVEL
PA
RT
1: S
OC
IO-D
EM
OG
RA
PH
ICSdifferences by age
The percentage of children living in families where the mother had a third-level ■
degree or higher educational attainment varied from 38.7% for households with children aged 0-4 to 22.8% for households with children aged 15-17 (see Table 13).
Table 13: Percentage of children under 18, by age and educational attainment of mother (2006)
Highest level of education attained 0-4 5-9 10-14 15-17 All children
Primary (including no formal education) 3.7 5.0 7.6 10.9 6.3
Lower secondary 14.6 20.1 24.5 27.2 20.8
Upper secondary 31.0 33.4 32.7 30.3 32.0
Third-level (Degree or higher) 38.7 31.2 26.0 22.8 30.6
Not stated/not available 12.1 10.3 9.2 8.8 10.3
Source: Census of the Population, CSO
differences by geographic locationDonegal had the highest proportion of children living in families where the mother had ■
either no formal education or primary education only (see Table 14 and Figure 3).
Table 14: Number of children under 18, by county and educational attainment of mother (2006)
Primary (including no formal
education)
Lower secondary
Upper secondary
Third-level (Degree or
higher)
Not stated/ not available
Total
State 63,463 209,775 322,356 308,501 103,769 1,007,864
County
Carlow 785 2,739 3,899 3,414 1,496 12,333
Cavan 999 3,711 5,679 4,873 1,508 16,770
Clare 1,271 4,925 9,558 9,356 2,733 27,843
Cork 5,151 23,002 38,083 37,445 9,961 113,642
Donegal 4,038 10,438 11,082 10,644 3,317 39,519
Dublin 18,723 51,513 70,289 77,319 33,608 251,452
Galway 2,847 8,727 17,814 18,793 5,617 53,798
Kerry 1,748 6,825 10,511 9,970 3,071 32,125
Kildare 2,462 9,362 16,534 16,022 4,962 49,342
continued

24
STATE OF THE NATION’S CHILDREN – IRELAND 2010
Table 14 (continued)
County Primary (including no formal
education)
Lower secondary
Upper secondary
Third-level (Degree or
higher)
Not stated/ not available
Total
Kilkenny 1,071 4,487 7,759 7,190 1,603 22,110
Laois 1,027 3,653 6,419 4,776 1,825 17,700
Leitrim 318 1,383 2,592 2,223 486 7,002
Limerick 3,273 9,235 13,227 12,522 3,889 42,146
Longford 743 1,693 2,999 2,299 1,025 8,759
Louth 2,447 6,997 7,990 7,917 3,242 28,593
Mayo 1,816 5,937 11,693 8,596 2,369 30,411
Meath 1,979 8,964 15,024 14,079 3,828 43,874
Monaghan 813 3,549 4,616 3,985 1,178 14,141
Offaly 1,393 4,407 6,351 4,655 1,777 18,583
Roscommon 626 2,642 5,602 4,359 1,068 14,297
Sligo 723 2,465 4,781 5,007 1,234 14,210
Tipperary 2,156 8,150 13,232 10,185 3,404 37,127
Waterford 1,506 5,711 8,480 7,684 2,657 26,038
Westmeath 1,355 4,271 6,646 5,743 2,312 20,327
Wexford 2,498 8,692 11,683 8,606 2,545 34,024
Wicklow 1,695 6,297 9,813 10,839 3,054 31,698
Source: Census of the Population, CSO

25
PARENTAL EDUCATION LEVEL
PA
RT
1: S
OC
IO-D
EM
OG
RA
PH
ICSFigure 3: percentage of children under 18 whose mothers have no formal education or
primary education only, by county (2006)
0 2 4 6 8 10 12
Roscommon
Meath
Cork
Leitrim
Clare
Kilkenny
Kildare
Sligo
Galway
Wicklow
Kerry
Monaghan
Waterford
Laois
Tipperary
Cavan
Mayo
State
Carlow
Westmeath
Wexford
Dublin
Offaly
Limerick
Longford
Louth
Donegal 10.2
8.6
8.5
7.8
7.5
7.4
7.3
6.7
6.3
6.4
6.0
6.0
5.8
5.8
5.7
5.8
5.4
5.3
5.3
5.1
5.0
4.8
4.6
4.5
4.5
4.5
4.4
% of mothers
Source: Census of the Population, CSO

26
STATE OF THE NATION’S CHILDREN – IRELAND 2010
trAveller children
Almost half of the total traveller population of ireland are under 18 years of age.
Measure
the number of traveller children.
key findingsIn 2006, there were 10,929 Traveller children in Ireland. This accounted for 1.1% of ■
the total child population of Ireland.
differences by age and genderThe number of Traveller boys (5,543) and girls (5,386) was broadly similar ( ■ see Table 15).
Table 15: Number of Traveller children, by age and gender (2006)
Boys Girls Total
Total (Traveller children) 5,543 5,386 10,929
Total (Traveller population) 11,028 11,407 22,435
Age
0-4 1,697 1,615 3,312
5-9 1,551 1,478 3,029
10-14 1,504 1,456 2,960
15-17 791 837 1,628
Source: Census of the Population, CSO

27
TRAVELLER CHILDREN
PA
RT
1: S
OC
IO-D
EM
OG
RA
PH
ICSdifferences by geographic location
Longford had the highest proportion of Traveller children ( ■ see Table 16).
Table 16: Number and percentage of Traveller children, by county (2006)
No. of Traveller children
No. of children
Traveller children as % of all children
State 10,929 1,036,034 1.1
County
Carlow 119 12,668 0.9
Cavan 93 17,127 0.5
Clare 351 28,565 1.2
Cork 628 116,241 0.5
Donegal 171 40,288 0.4
Dublin 2,532 261,101 1.0
Galway 1,572 55,306 2.8
Kerry 285 33,036 0.9
Kildare 234 50,337 0.5
Kilkenny 200 22,882 0.9
Laois 248 18,013 1.4
Leitrim 99 7,133 1.4
Limerick 631 43,507 1.5
Longford 283 8,930 3.2
Louth 177 29,233 0.6
Mayo 504 30,969 1.6
Meath 354 44,621 0.8
Monaghan 86 14,455 0.6
Offaly 330 19,169 1.7
Roscommon 156 14,503 1.1
Sligo 180 14,610 1.2
Tipperary 462 37,931 1.2
Waterford 205 27,009 0.8
Westmeath 299 21,124 1.4
Wexford 507 34,851 1.5
Wicklow 223 32,425 0.7
Source: Census of the Population, CSO

28
STATE OF THE NATION’S CHILDREN – IRELAND 2010
Foreign nAtionAl children
Foreign national children account for approximately 6% of the total child population of ireland.
Measure
the number of foreign national children.
key findingsIn 2006, there were 62,800 foreign national children in Ireland. This accounted for ■
6.1% of the total child population of Ireland.
differences by age, gender and over timeThe number of foreign national boys (31,835) and girls (30,965) was broadly similar ■
(see Table 17).
Table 17: Number of foreign national children, by age and gender (2006)
Boys Girls Total
Total 31,835 30,965 62,800
Age
0-4 6,726 6,570 13,296
5-9 10,341 9,831 20,172
10-14 9,607 9,425 19,032
15-17 5,161 5,139 10,300
Source: Census of the Population, CSO

29
FOREIGN NATIONAL CHILDREN
PA
RT
1: S
OC
IO-D
EM
OG
RA
PH
ICSThe number of foreign national children increased by 57.6%, from 39,838 in 2002 ■
to 62,800 in 2006 (see Figure 4).
Figure 4: number of foreign national children, by age (2002 and 2006)
0-4 5-9 10-14 15-17 Total
Age
8,2
97
13,2
96
12,8
79
20,17
2
12,7
12
19,0
32
5,9
50 10
,30
0
39,8
38
62
,80
0
No.
of
child
ren
2006
2002
0
10,000
20,000
30,000
40,000
50,000
60,000
70,000
Source: Census of the Population, CSO

30
STATE OF THE NATION’S CHILDREN – IRELAND 2010
differences by geographic locationLeitrim had the highest proportion of foreign national children ( ■ see Table 18).
Table 18: Number and percentage of foreign national children, by county (2006)
No. of foreign national children
No. of children
Foreign national children as % of all children
State 62,800 1,036,034 6.1
County
Carlow 752 12,668 5.9
Cavan 1,096 17,127 6.4
Clare 1,858 28,565 6.5
Cork 6,284 116,241 5.4
Donegal 2,195 40,288 5.4
Dublin 17,751 261,101 6.8
Galway 3,763 55,306 6.8
Kerry 2,390 33,036 7.2
Kildare 3,028 50,337 6.0
Kilkenny 996 22,882 4.4
Laois 1,043 18,013 5.8
Leitrim 571 7,133 8.0
Limerick 1,996 43,507 4.6
Longford 638 8,930 7.1
Louth 1,786 29,233 6.1
Mayo 2,083 30,969 6.7
Meath 2,521 44,621 5.6
Monaghan 961 14,455 6.6
Offaly 935 19,169 4.9
Roscommon 1,077 14,503 7.4
Sligo 797 14,610 5.5
Tipperary 2,065 37,931 5.4
Waterford 1,476 27,009 5.5
Westmeath 1,360 21,124 6.4
Wexford 1,744 34,851 5.0
Wicklow 1,634 32,425 5.0
Source: Census of the Population, CSO
31
FOREIGN NATIONAL CHILDREN
PA
RT
1: S
OC
IO-D
EM
OG
RA
PH
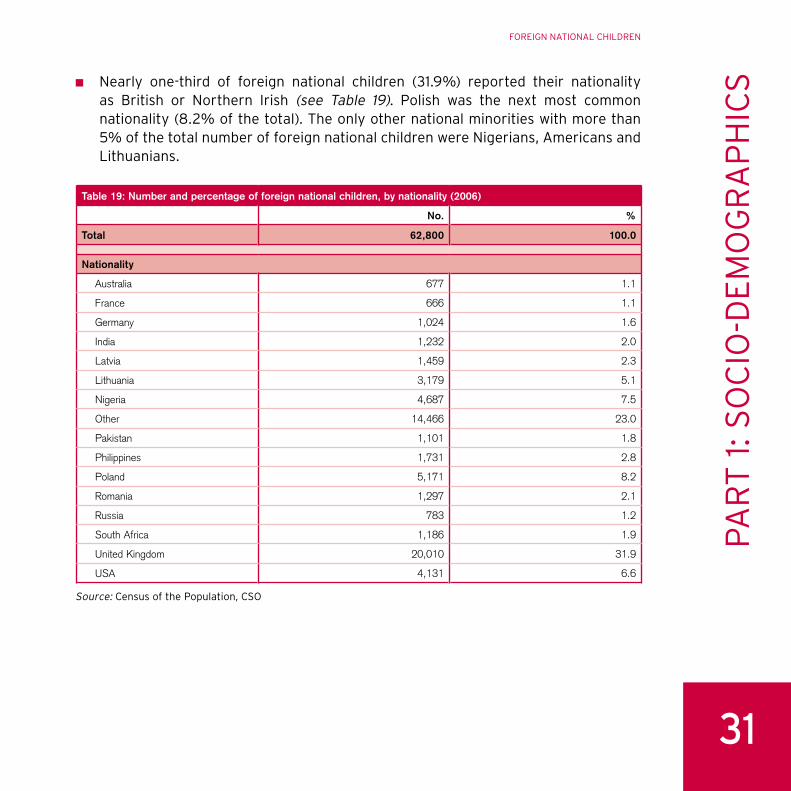
ICSNearly one-third of foreign national children (31.9%) reported their nationality ■
as British or Northern Irish (see Table 19). Polish was the next most common nationality (8.2% of the total). The only other national minorities with more than 5% of the total number of foreign national children were Nigerians, Americans and Lithuanians.
Table 19: Number and percentage of foreign national children, by nationality (2006)
No. %
Total 62,800 100.0
Nationality
Australia 677 1.1
France 666 1.1
Germany 1,024 1.6
India 1,232 2.0
Latvia 1,459 2.3
Lithuania 3,179 5.1
Nigeria 4,687 7.5
Other 14,466 23.0
Pakistan 1,101 1.8
Philippines 1,731 2.8
Poland 5,171 8.2
Romania 1,297 2.1
Russia 783 1.2
South Africa 1,186 1.9
United Kingdom 20,010 31.9
USA 4,131 6.6
Source: Census of the Population, CSO

32
STATE OF THE NATION’S CHILDREN – IRELAND 2010
children with A disABility
Almost two-thirds of children with a disability are boys.
Measure
the number of children with a disability.
key findingsIn 2006, there were 42,021 children with a disability in Ireland. This accounted for ■
4.1% of the total child population of Ireland.
differences by age and genderAlmost two-thirds (63%) of children with a disability were boys ( ■ see Table 20).
Table 20: Number of children with a disability, by age and gender (2006)
Boys Girls Total
Total 26,474 15,547 42,021
Age
0-4 3,122 2,176 5,298
5-9 7,741 4,248 11,989
10-14 10,320 5,649 15,969
15-17 5,291 3,474 8,765
Source: Census of the Population, CSO

33
CHILDREN WITH A DISABILITY
PA
RT
1: S
OC
IO-D
EM
OG
RA
PH
ICSdifferences by geographic location
Wicklow had the highest proportion of children with a disability ( ■ see Table 21).
Table 21: Number and percentage of children with a disability, by county (2006)
No. of children with a disability
No. of children Children with a disability as % of all children
State 42,021 1,036,034 4.1
County
Carlow 552 12,668 4.4
Cavan 561 17,127 3.3
Clare 1,179 28,565 4.1
Cork 4,605 116,241 4.0
Donegal 1,622 40,288 4.0
Dublin 11,309 261,101 4.3
Galway 1,919 55,306 3.5
Kerry 1,359 33,036 4.1
Kildare 2,123 50,337 4.2
Kilkenny 923 22,882 4.0
Laois 770 18,013 4.3
Leitrim 243 7,133 3.4
Limerick 1,902 43,507 4.4
Longford 342 8,930 3.8
Louth 1,068 29,233 3.7
Mayo 1,024 30,969 3.3
Meath 1,718 44,621 3.9
Monaghan 484 14,455 3.3
Offaly 678 19,169 3.5
Roscommon 463 14,503 3.2
Sligo 641 14,610 4.4
Tipperary 1,682 37,931 4.4
Waterford 973 27,009 3.6
Westmeath 859 21,124 4.1
Wexford 1,503 34,851 4.3
Wicklow 1,519 32,425 4.7
Source: Census of the Population, CSO

34
STATE OF THE NATION’S CHILDREN – IRELAND 2010
sepArAted children seeking AsyluM
the number of separated children seeking asylum has decreased.
Measure
the number of separated children seeking asylum.
key findingsIn 2008, there were 354 separated children seeking asylum. ■
differences by age, gender and over timeAlmost half (47.2%) of the separated children seeking asylum were aged ■
15-17 years and more than half (52.0%) were boys (see Table 22).
Over the period 2006-2008, the number of separated children seeking asylum has ■
fallen substantially.
Table 22: Number and percentage of separated children seeking asylum, by age and gender (2006-2008)
2006 2007 2008
No. No. No. %
Total 564 362 354 100.0
Age
0-4 35 23 20 5.6
5-9 131 78 63 17.8
10-14 143 86 104 29.4
15-17 255 175 167 47.2
Gender
Boys 274 169 184 52.0
Girls 290 193 170 48.0
Source: Child Care Interim Data Set, HSE

PART 2: CHILDREN’S RELATIONSHIPScoveringrelationships with parentsandrelationships with peers

relAtionship with Mothers
older children find it more difficult to talk to their mothers when something is really bothering them.
Measure
the percentage of children aged 9-17 who report that they find it easy to talk to their mother when something is really bothering them.
key findingsIn 2006, 78.0% of children aged 9-17 reported that they find it easy to talk to their ■
mother when something is really bothering them.
differences by population groupsWhen compared to other children, Traveller children were less likely to report that ■
they find it easy to talk to their mother when something is really bothering them (see Table 23). This difference was statistically significant.
There were no significant differences between immigrant and non-immigrant ■
children, and between children with and without a disability and/or chronic illness.
Table 23: Percentage of children who report that they find it easy to talk to their mother when something is really bothering them, by population groups (2006)
%
All children 78.0
Traveller status
Traveller children 70.6
All other children 78.0
Immigrant status
Immigrant children 78.6
All other children 77.9
Disability and/or Chronic Illness status
Children with a disability and/or chronic illness 76.8
All other children 78.2
Source: HBSC Survey, Health Promotion Research Centre
36

differences by age, gender, social class and over timeStatistically significant differences were also observed across age, with a lower ■
percentage of older children reporting that they find it easy to talk to their mother when something is really bothering them (see Table 24).
The percentage of children in each social class category and the percentage ■
of boys and girls who report that they find it easy to talk to their mother when something is really bothering them was broadly similar, with no statistical significant differences.
Table 24: Percentage of children who report that they find it easy to talk to their mother when something is really bothering them, by age, gender and social class (1998, 2002 and 2006)
1998 2002 2006
Total (%) Total (%) Boys (%) Girls (%) Total (%)
All children 74.0 77.6 77.5 78.4 78.0
Age
9 – – 87.5 87.5 87.5
10-11 81.2 86.7 88.0 88.7 88.4
12-14 76.4 79.6 79.8 82.2 81.0
15-17 65.0 71.1 72.1 69.4 70.8
Social class
SC 1-2 71.6 76.2 78.6 77.7 78.2
SC 3-4 75.0 78.5 78.3 79.3 78.8
SC 5-6 75.6 80.1 78.6 79.4 79.0
Source: HBSC Survey, Health Promotion Research Centre
37
RELATIONSHIP WITH MOTHERS
PA
RT
2: C
HIL
DR
EN
’S R
EL
AT
ION
SH
IPS

38
STATE OF THE NATION’S CHILDREN – IRELAND 2010
differences by geographic locationChildren in the South-East region were more likely to report that they find it easy ■
to talk to their mother when something is really bothering them (79.2%), while children in the Mid-West region were least likely to report this (75.3%) (see Table 25). These differences were not statistically significant.
Table 25: Percentage of children who report that they find it easy to talk to their mother when something is really bothering them, by NUTS Region (2006)
%
All children 78.0
NUTS Region
Border 78.1
Dublin 78.7
Midlands 77.9
Mid-East 77.7
Mid-West 75.3
South-East 79.2
South-West 78.6
West 76.6
Source: HBSC Survey, Health Promotion Research Centre
international comparisonsFrom the 2006 HBSC Survey, using the ages of 11, 13 and 15 only to draw international ■
comparisons, 79.5% of children from Ireland reported that they found it easy to talk to their mother when something was really bothering them (see Figure 5). This was significantly lower than the HBSC average of 81.5%.
Among all 40 countries and regions that used this HBSC item, the lowest ■
percentage for this indicator was found among Belgian (French) children (68.0%) and the highest among Slovenian children (90.1%). Overall, children from Ireland ranked 26th.

39
RELATIONSHIP WITH MOTHERS
PA
RT
2: C
HIL
DR
EN
’S R
EL
AT
ION
SH
IPSFigure 5: percentage of children who report that they find it easy to talk to their mother
when something is really bothering them, by country (2006)
0 10 20 30 40 50 60 70 80 90 100
Belgium (French)
USA
France
Luxembourg
Malta
Czech Republic
Portugal
Canada
Lithuania
Scotland
Switzerland
Italy
Latvia
Norway
Ireland
England
Denmark
Belgium (Flemish)
Russia
Turkey
Wales
Germany
HBSC Average
Austria
Spain
Finland
Greece
Croatia
Sweden
Estonia
Bulgaria
Iceland
Slovakia
Macedonia
Poland
Romania
Hungary
Netherlands
Israel
Ukraine
Slovenia 90.1
88.7
88.7
88.4
87.2
86.6
85.8
85.7
85.5
85.1
85.1
84.9
84.6
84.6
84.3
84.3
83.6
83.1
81.5
81.0
80.9
80.9
80.8
80.7
80.0
79.6
79.5
79.4
79.2
78.7
78.3
78.2
78.2
77.2
76.9
76.8
76.3
74.8
72.4
68.7
68.0
% of children
Source: HBSC Survey, Health Promotion Research Centre

40
STATE OF THE NATION’S CHILDREN – IRELAND 2010
relAtionship with FAthers
the percentage of children who report that they find it easy to talk to their fathers when something is really bothering them has increased from approximately 48% in 1998 to 60% in 2006.
Measure
the percentage of children aged 9-17 who report that they find it easy to talk to their father when something is really bothering them.
key findingsIn 2006, 59.8% of children aged 9-17 reported that they found it easy to talk to ■
their father when something was really bothering them.
differences by population groupsWhen compared to other children, there were no significant differences in the ■
percentages of Traveller children, immigrant children and children with a disability and/or chronic illness who reported that they find it easy to talk to their father when something is really bothering them (see Table 26).
Table 26: Percentage of children who report that they find it easy to talk to their father when something is really bothering them, by population groups (2006)
%
All children 59.8
Traveller status
Traveller children 55.9
All other children 59.7
Immigrant status
Immigrant children 61.4
All other children 59.7
Disability and/or Chronic Illness status
Children with a disability and/or chronic illness 58.8
All other children 59.9
Source: HBSC Survey, Health Promotion Research Centre

41
RELATIONSHIP WITH FATHERS
PA
RT
2: C
HIL
DR
EN
’S R
EL
AT
ION
SH
IPSdifferences by age, gender, social class and over time
Statistically significant differences across age and gender were observed, with a ■
higher percentage of younger children and a lower percentage of girls reporting that they find it easy to talk to their father when something is really bothering them (see Table 27).
The percentage of children in each social class category who reported that they ■
find it easy to talk to their father when something is really bothering them was broadly similar, with no statistical significant differences.
Table 27: Percentage of children who report that they find it easy to talk to their father when something is really bothering them, by age, gender and social class (1998, 2002 and 2006)
1998 2002 2006
Total (%) Total (%) Boys (%) Girls (%) Total (%)
All children 48.1 56.2 67.1 52.1 59.8
Age
9 – – 79.3 77.5 78.4
10-11 60.2 71.3 80.0 66.1 72.2
12-14 50.0 57.8 72.0 54.7 63.7
15-17 36.7 47.5 58.5 42.9 51.1
Social class
SC 1-2 44.1 56.1 68.0 54.4 61.4
SC 3-4 49.2 56.8 68.4 51.6 60.1
SC 5-6 47.9 56.4 66.3 52.8 59.3
Source: HBSC Survey, Health Promotion Research Centre
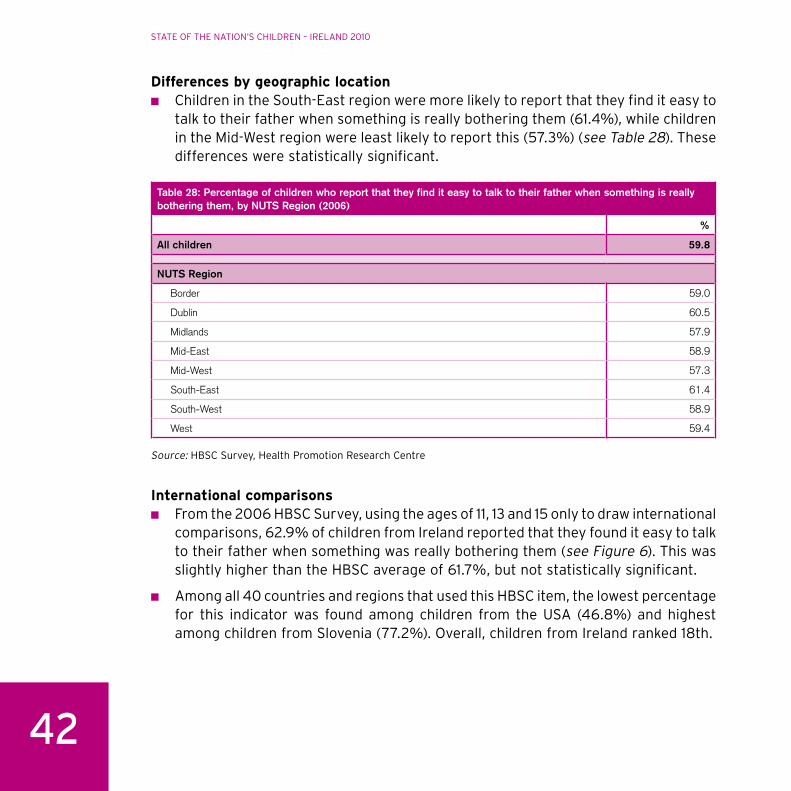
42
STATE OF THE NATION’S CHILDREN – IRELAND 2010
differences by geographic locationChildren in the South-East region were more likely to report that they find it easy to ■
talk to their father when something is really bothering them (61.4%), while children in the Mid-West region were least likely to report this (57.3%) (see Table 28). These differences were statistically significant.
Table 28: Percentage of children who report that they find it easy to talk to their father when something is really bothering them, by NUTS Region (2006)
%
All children 59.8
NUTS Region
Border 59.0
Dublin 60.5
Midlands 57.9
Mid-East 58.9
Mid-West 57.3
South-East 61.4
South-West 58.9
West 59.4
Source: HBSC Survey, Health Promotion Research Centre
international comparisonsFrom the 2006 HBSC Survey, using the ages of 11, 13 and 15 only to draw international ■
comparisons, 62.9% of children from Ireland reported that they found it easy to talk to their father when something was really bothering them (see Figure 6). This was slightly higher than the HBSC average of 61.7%, but not statistically significant.
Among all 40 countries and regions that used this HBSC item, the lowest percentage ■
for this indicator was found among children from the USA (46.8%) and highest among children from Slovenia (77.2%). Overall, children from Ireland ranked 18th.

43
RELATIONSHIP WITH FATHERS
PA
RT
2: C
HIL
DR
EN
’S R
EL
AT
ION
SH
IPSFigure 6: percentage of children who report that they find it easy to talk to their father when
something is really bothering them, by country (2006)
0 10 20 30 40 50 60 70 80 90
USA
Malta
France
Belgium (French)
Turkey
Lithuania
Luxembourg
Scotland
Czech Republic
Portugal
Italy
Latvia
Russia
Canada
Switzerland
Germany
England
Belgium (Flemish)
Denmark
Estonia
Wales
Greece
HBSC Average
Ireland
Spain
Bulgaria
Norway
Austria
Croatia
Finland
Poland
Slovakia
Ukraine
Romania
Hungary
Sweden
Iceland
Israel
Macedonia
Netherlands
Slovenia 77.2
75.5
74.2
74.1
71.7
70.3
70.2
68.9
66.9
66.8
66.1
64.6
64.1
64.1
64.0
63.9
63.2
62.9
61.7
61.2
60.9
60.4
60.3
60.0
59.8
59.4
58.8
58.7
57.1
56.7
56.6
56.2
54.9
53.1
52.7
52.6
51.6
49.2
47.6
46.8
49.1
% of children
Source: HBSC Survey, Health Promotion Research Centre

44
STATE OF THE NATION’S CHILDREN – IRELAND 2010
tAlking to pArents
significantly more girls than boys report that their parents spend time just talking with them.
Measure
the percentage of children aged 15 who report that their parents spend time just talking with them several times a week.
key findingsIn 2009, 59.8% of children aged 15 reported that their parents spend time just ■
talking with them several times a week.
differences by population groupsThe percentages of Traveller children and immigrant children who reported that ■
their parents spend time just talking with them several times a week did not differ significantly from the corresponding percentages of non-Traveller and non-immigrant children (see Table 29).
Table 29: Percentage of children aged 15 who report that their parents spend time just talking with them several times a week, by population groups (2009)
%
All children 59.8
Traveller status
Traveller children 49.0
All other children 60.0
Immigrant status
Immigrant children 51.9
All other children 60.4
Source: PISA Survey, Education Research Centre

45
TALKING TO PARENTS
PA
RT
2: C
HIL
DR
EN
’S R
EL
AT
ION
SH
IPSdifferences by gender, social class and over time
The percentage of girls (70.8%) who reported that their parents spend time ■
just talking with them several times a week was significantly higher than the corresponding percentage of boys (48.9%) (see Table 30).
Children from the highest social class category (63.0%) were significantly more ■
likely to report that their parents spend time just talking with them several times a week when compared to children from the lowest social class category (57.1%).
In 2009, the percentage of children (59.8%) who reported that their parents spend ■
time just talking with them several times a week was significantly lower than the corresponding percentage in 2006 (64.7%) and 2000 (61.6%).
Table 30: Percentage of children aged 15 who report that their parents spend time just talking with them several times a week, by gender and social class (2000, 2006 and 2009)
2000 2006 2009
All children 61.6 64.7 59.8
Gender
Boys 52.8 55.6 48.9
Girls 70.3 73.4 70.8
Social class
High SES 62.3 66.6 63.0
Medium SES 61.9 64.6 60.2
Low SES 60.4 63.0 57.1
Source: PISA Survey, Education Research Centre

46
STATE OF THE NATION’S CHILDREN – IRELAND 2010
pArentAl involveMent in schooling
there has been a significant decrease in the percentage of 15-year-old children who report that their parents discuss with them how well they are doing at school.
Measure
the percentage of children aged 15 who report that their parents discuss with them how well they are doing at school several times a week.
key findingsIn 2009, 42.8% of children aged 15 reported that their parents discuss with them ■
how well they are doing at school several times a week.
differences by population groupsWhen compared to other children, immigrant children were less likely to report that ■
their parents discuss with them how well they are doing at school several times a week (see Table 31). This difference was statistically significant.
There was no significant difference between Traveller children and non-Traveller ■
children.
Table 31: Percentage of children aged 15 who report that their parents discuss with them how well they are doing at school several times a week, by population groups (2009)
%
All children 42.8
Traveller status
Traveller children 54.6
All other children 42.6
Immigrant status
Immigrant children 30.4
All other children 42.8
Source: PISA Survey, Education Research Centre

47
PARENTAL INVOLVEMENT IN SCHOOLING
PA
RT
2: C
HIL
DR
EN
’S R
EL
AT
ION
SH
IPSdifferences by gender, social class and over time
The percentage of girls (46.3%) who reported that their parents discuss with them ■
how well they are doing at school several times a week was significantly higher than the corresponding percentage of boys (39.4%) (see Table 32).
Children in the lowest social class category (37.9%) were significantly less likely ■
to report that their parents discuss with them how well they are doing at school several times a week when compared to children in the highest and medium social class categories (46.6% and 43.6% respectively).
In 2009, the percentage of children (42.8%) who reported that their parents discuss ■
with them how well they are doing at school several times a week was significantly lower than the corresponding percentages in 2006 (48.0%) and 2000 (47.9%).
Table 32: Percentage of children aged 15 who report that their parents discuss with them how well they are doing at school several times a week, by gender and social class (2000, 2006 and 2009)
2000 2006 2009
All children 47.9 48.0 42.8
Gender
Boys 45.7 44.1 39.4
Girls 50.0 51.6 46.3
Social class
High SES 51.3 50.0 46.6
Medium SES 46.7 50.0 43.6
Low SES 45.1 43.5 37.9
Source: PISA Survey, Education Research Centre

48
STATE OF THE NATION’S CHILDREN – IRELAND 2010
eAting A MAin MeAl together
there has been a significant decrease in the percentage of 15-year-old children who report that their parents eat a main meal with them around a table.
Measure
the percentage of children aged 15 who report that their parents eat a main meal with them around a table several times a week.
key findingsIn 2009, 72.4% of children aged 15 reported that their parents eat a main meal ■
with them around a table several times a week.
differences by population groupThe percentages of Traveller children and immigrant children who reported ■
that their parents eat a main meal with them around a table several times a week did not differ significantly from the corresponding percentages of non-Traveller and non-immigrant children (see Table 33).
Table 33: Percentage of children aged 15 who report that their parents eat a main meal with them around a table several times a week, by population groups (2009)
%
All children 72.4
Traveller status
Traveller children 61.8
All other children 72.6
Immigrant status
Immigrant children 68.8
All other children 73.2
Source: PISA Survey, Education Research Centre

49
EATING A MAIN MEAL TOGETHER
PA
RT
2: C
HIL
DR
EN
’S R
EL
AT
ION
SH
IPSdifferences by gender, social class and over time
The percentage of girls (74.6%) who reported that their parents eat a main meal ■
with them around a table several times a week did not differ significantly from the corresponding percentage of boys (70.1%) (see Table 34).
Children in the lowest social class category (66.9%) were significantly less likely to ■
report that their parents eat a main meal with them around a table several times a week when compared to children in the highest and medium social class categories (77.1% and 73.6% respectively).
In 2009, the percentage of children (72.4%) who reported that their parents eat a ■
main meal with them around a table several times a week was significantly lower than the corresponding percentage in 2000 (77.1%).
Table 34: Percentage of children aged 15 who report that their parents eat a main meal with them around a table several times a week, by gender and social class (2000, 2006 and 2009)
2000 2006 2009
All children 77.1 74.5 72.4
Gender
Boys 77.6 73.7 70.1
Girls 76.5 75.3 74.6
Social class
High SES 78.5 78.2 77.1
Medium SES 78.6 75.2 73.6
Low SES 73.5 70.7 66.9
Source: PISA Survey, Education Research Centre

50
STATE OF THE NATION’S CHILDREN – IRELAND 2010
Friendships
Almost 9 out of 10 children have 3 or more friends of the same gender.
Measure
the percentage of children aged 9-17 who report to have 3 or more friends of the same gender.
key findingsIn 2006, 89.5% of children aged 9-17 reported that they had 3 or more friends of ■
the same gender.
differences by population groupsWhen compared to other children, Traveller children and immigrant children were ■
less likely to report having 3 or more friends of the same gender (see Table 35). These differences were statistically significant.
There were no significant differences between children with and children without a ■
disability and/or chronic illness.
Table 35: Percentage of children who report to have 3 or more friends of the same gender, by population groups (2006)
%
All children 89.5
Traveller status
Traveller children 83.4
All other children 89.6
Immigrant status
Immigrant children 82.9
All other children 89.7
Disability and/or Chronic Illness status
Children with a disability and/or chronic illness 88.6
All other children 89.6
Source: HBSC Survey, Health Promotion Research Centre

51
FRIENDSHIPS
PA
RT
2: C
HIL
DR
EN
’S R
EL
AT
ION
SH
IPSdifferences by age, gender, social class and over time
The percentage of children who reported having 3 or more friends of the same ■
gender was broadly similar across age, gender and social class categories, with no statistically significant differences (see Table 36).
Table 36: Percentage of children who report to have 3 or more friends of the same gender, by age, gender and social class (2002 and 2006)
2002 2006
Total (%) Boys (%) Girls (%) Total (%)
All children 85.3 88.8 90.1 89.5
Age
9 – 94.3 94.1 94.2
10-11 85.1 88.4 90.2 89.5
12-14 85.7 89.9 90.9 90.3
15-17 85.7 88.1 89.6 88.8
Social class
SC 1-2 86.8 88.5 90.8 89.6
SC 3-4 86.2 89.8 90.4 90.1
SC 5-6 84.5 90.3 90.7 90.4
Source: HBSC Survey, Health Promotion Research Centre
differences by geographic locationChildren in the Mid-West region were more likely to report having 3 or more ■
friends of the same gender (92.1%), while children in the West region were least likely to report this (87.4%) (see Table 37). These differences were not statistically significant.

52
STATE OF THE NATION’S CHILDREN – IRELAND 2010
Table 37: Percentage of children who report to have 3 or more friends of the same gender, by NUTS Region (2006)
%
All children 89.5
NUTS Region
Border 90.9
Dublin 87.9
Midlands 88.5
Mid-East 90.6
Mid-West 92.1
South-East 90.3
South-West 90.2
West 87.4
Source: HBSC Survey, Health Promotion Research Centre
international comparisonsFrom the 2006 HBSC Survey, using the ages of 11, 13 and 15 only to draw international ■
comparisons, 86.4% of children from Ireland reported having 3 or more friends of the same gender (see Figure 7). This was significantly higher than the HBSC average of 79.0%.
Among all 41 countries and regions that used this HBSC item, the lowest percentage ■
for this indicator was found among Greek children (54.8%) and the highest among children from Hungary (89.1%). Overall, children from Ireland ranked 7th.

53
FRIENDSHIPS
PA
RT
2: C
HIL
DR
EN
’S R
EL
AT
ION
SH
IPSFigure 7: percentage of children who report to have 3 or more friends of the same gender,
by country (2006)
0 10 20 30 40 50 60 70 80 90 100
Greece
Malta
Poland
Russia
Greenland
Ukraine
Slovenia
Italy
Estonia
Macedonia
Luxembourg
Latvia
Bulgaria
Slovakia
Belgium (French)
Portugal
France
Turkey
Spain
HBSC Average
Romania
Finland
Belgium (Flemish)
Lithuania
Switzerland
Israel
Germany
Croatia
USA
Canada
Wales
Czech Republic
Denmark
Iceland
Austria
Ireland
Netherlands
Scotland
Sweden
England
Norway
Hungary 89.1
89.0
87.9
87.5
87.2
86.5
86.4
86.1
85.9
85.4
84.5
84.2
83.7
83.3
82.6
82.6
82.1
81.9
80.6
79.7
79.3
79.2
79.0
79.0
78.4
78.2
78.1
76.9
76.7
75.3
74.6
74.6
73.5
73.5
73.0
71.4
71.0
69.3
63.7
62.1
60.6
54.8
% of children
Source: HBSC Survey, Health Promotion Research Centre

54
STATE OF THE NATION’S CHILDREN – IRELAND 2010
pets And AniMAls
the percentage of children who report to have a pet of their own or a pet in their family is significantly lower among traveller children and immigrant children.
Measure
the percentage of children aged 9-17 who report having a pet of their own or a pet in their family.
key findingsIn 2006, 73.8% of children aged 9-17 reported having a pet of their own or a pet ■
in their family.
differences by population groupsWhen compared to other children, Traveller children and immigrant children were ■
less likely to report having a pet of their own or a pet in their family (see Table 38). These differences were statistically significant.
There were no significant differences between children with and children without a ■
disability and/or chronic illness.
Table 38: Percentage of children who report having a pet of their own or a pet in their family, by population groups (2006)
%
All children 73.8
Traveller status
Traveller children 67.4
All other children 74.1
Immigrant status
Immigrant children 58.2
All other children 74.6
Disability and/or Chronic Illness status
Children with a disability and/or chronic illness 73.6
All other children 73.8
Source: HBSC Survey, Health Promotion Research Centre

55
PETS AND ANIMALS
PA
RT
2: C
HIL
DR
EN
’S R
EL
AT
ION
SH
IPSdifferences by age, gender and social class
Statistically significant differences were also observed across gender and social ■
class categories, with a lower percentage of boys and a lower percentage of children in the lowest social class category reporting to have a pet of their own or a pet in their family (see Table 39).
The percentage of children in each age category who reported having a pet of ■
their own or a pet in their family was broadly similar, with no statistical significant differences.
Table 39: Percentage of children who report having a pet of their own or a pet in their family, by age, gender and social class (2006)
Boys (%) Girls (%) Total (%)
All children 72.4 75.2 73.8
Age
9 71.1 72.9 72.0
10-11 71.6 77.3 75.0
12-14 73.6 75.2 74.4
15-17 71.6 74.3 72.9
Social class
SC 1-2 74.4 78.7 76.4
SC 3-4 71.9 73.7 72.8
SC 5-6 72.9 74.8 73.9
Source: HBSC Survey, Health Promotion Research Centre

56
STATE OF THE NATION’S CHILDREN – IRELAND 2010
differences by geographic locationChildren in the Mid-West region were more likely to report having a pet of their own ■
or a pet in the family (80.2%), while children in the Dublin region were least likely to report this (62.8%) (see Table 40). These differences were statistically significant.
Table 40: Percentage of children who report having a pet of their own or a pet in their family, by NUTS Region (2006)
%
All children 73.8
NUTS Region
Border 71.3
Dublin 62.8
Midlands 78.2
Mid-East 76.8
Mid-West 80.2
South-East 79.9
South-West 76.6
West 75.8
Source: HBSC Survey, Health Promotion Research Centre

57
BULLYING
PA
RT
2: C
HIL
DR
EN
’S R
EL
AT
ION
SH
IPSBullying
immigrant children and children with a disability and/or chronic illness are more likely to report having been bullied at school.
Measure
the percentage of children aged 9-17 who report having been bullied at school.
key findingsIn 2006, 24.5% of children aged 9-17 reported that they were bullied at school at ■
least once in the past couple of months.
differences by population groupsWhen compared to other children, immigrant children and children with a disability ■
and/or chronic illness were more likely to report that they were bullied at school (see Table 41). These differences were statistically significant.
There were no significant differences between Traveller and non-Traveller children. ■
Table 41: Percentage of children who report having been bullied at school (in the past couple of months), by population groups (2006)
%
All children 24.5
Traveller status
Traveller children 28.8
All other children 24.3
Immigrant status
Immigrant children 29.5
All other children 24.2
Disability and/or Chronic Illness status
Children with a disability and/or chronic illness 29.9
All other children 23.1
Source: HBSC Survey, Health Promotion Research Centre

58
STATE OF THE NATION’S CHILDREN – IRELAND 2010
differences by age, gender, social class and over timeStatistically significant differences were also observed across age and gender, with ■
a higher percentage of younger children and a higher percentage of boys reporting that they were bullied at school (see Table 42).
The percentage of children in each social class category who reported being bullied ■
at school was broadly similar, with no statistical significant differences.
Table 42: Percentage of children who report having been bullied at school (in the past couple of months), by age, gender and social class (1998, 2002 and 2006)
1998 2002 2006
Total (%) Total (%) Boys (%) Girls (%) Total (%)
All children 24.6 23.3 25.6 23.4 24.5
Age
9 – – 38.4 38.1 38.3
10-11 31.2 28.3 27.9 30.2 29.3
12-14 25.2 25.8 28.2 23.9 26.2
15-17 18.8 18.2 22.1 19.5 20.8
Social class
SC 1-2 21.8 23.0 26.5 23.5 25.0
SC 3-4 25.4 22.9 24.9 22.9 23.9
SC 5-6 24.3 23.1 26.0 23.3 24.6
Source: HBSC Survey, Health Promotion Research Centre
differences by geographic locationChildren in the South-East and Mid-East regions were more likely to report being ■
bullied at school (26.9%), while children in the Midlands were least likely to report this (22.9%) (see Table 43). These differences were statistically significant.

59
BULLYING
PA
RT
2: C
HIL
DR
EN
’S R
EL
AT
ION
SH
IPSTable 43: Percentage of children who report having been bullied at school (in the past couple of months),
by NUTS Region (2006)
%
All children 24.5
NUTS Region
Border 23.8
Dublin 23.7
Midlands 22.9
Mid-East 26.9
Mid-West 23.2
South-East 26.9
South-West 23.2
West 24.0
Source: HBSC Survey, Health Promotion Research Centre
international comparisonsFrom the 2006 HBSC Survey, using the ages of 11, 13 and 15 only to draw international ■
comparisons, 25.9% of children from Ireland reported that they had been bullied at school at least once in the past couple of months (see Figure 8). This was significantly lower than the HBSC average of 32.0%.
Among all 39 countries and regions that used this HBSC item, the lowest ■
percentage for this indicator was found among children from Spain (13.6%) and the highest among children from Lithuania (56.3%). Overall, children from Ireland ranked 26th.

60
STATE OF THE NATION’S CHILDREN – IRELAND 2010
Figure 8: percentage of children who report having been bullied at school (in the past couple of months), by country (2006)
Source: HBSC Survey, Health Promotion Research Centre
0 10 20 30 40 50 60
Spain
Sweden
Czech Republic
Malta
Croatia
Iceland
Italy
Belgium (Flemish)
Denmark
Finland
Slovenia
Hungary
Macedonia
Ireland
Poland
Norway
Scotland
Netherlands
England
USA
Wales
HBSC Average
France
Germany
Russia
Canada
Bulgaria
Luxembourg
Switzerland
Austria
Portugal
Romania
Estonia
Belgium (French)
Latvia
Ukraine
Greenland
Greece
Turkey
Lithuania 56.3
55.5
51.5
50.8
50.1
48.3
47.8
45.4
44.4
41.6
40.8
37.8
36.9
35.7
35.1
34.9
34.3
34.2
32.0
30.9
29.5
28.5
26.8
26.5
26.4
26.1
25.9
25.8
25.2
24.8
24.6
24.6
23.7
22.3
20.0
20.0
16.2
14.6
13.6
19.9
% of children

PART 3: CHILDREN’S OUTCOMEScoveringeducationhealthsocial, emotional and behavioural outcomes


educAtion outcoMes

64
enrolMent in eArly childhood cAre And educAtion
Almost one in 3 children under 13 years of age avails of non-parental childcare.
Measure
the percentage of children under 13 years of age who avail of non-parental childcare.
key findingsIn 2007, 30% of children under 13 years of age availed of non-parental childcare. ■
differences by age and household structurePre-school children (42%) were more likely to avail of non-parental childcare when ■
compared to primary school children (22%) (see Table 44).
Pre-school children in two-parent households (44%) were more likely to avail of ■
some form of non-parental childcare when compared with pre-school children in one-parent households (33%).
Table 44: Percentage of children under 13 years of age who avail of non-parental childcare, by school-going status and household structure (2007)
Pre-school children
Primary school children
All children under 13 years
Total 42 22 30
Household structure
One-parent households 33 25 28
Two-parent households 44 21 30
Source: Childcare Module, Quarterly National Household Survey, CSO
STATE OF THE NATION’S CHILDREN – IRELAND 2010

65
ENROLMENT IN EARLY CHILDHOOD CARE AND EDUCATION
PA
RT
3: C
HIL
DR
EN
’S O
UT
CO
ME
Sdifferences by geographic locationThe highest proportion of children under 13 years of age availing of non-parental ■
childcare was in the South-East region (34%) (see Table 45).
Table 45: Percentage of children under 13 years of age who avail of non-parental childcare, by school-going status and NUTS Region (2007)
Pre-school children
Primary school children
All children under 13 years
Total 42 22 30
NUTS Region
Border 38 20 27
Dublin 41 21 29
Midlands 44 18 28
Mid-East 43 24 31
Mid-West 41 27 32
South-East 44 28 34
South-West 41 21 28
West 43 18 28
Source: Childcare Module, Quarterly National Household Survey, CSO

66
STATE OF THE NATION’S CHILDREN – IRELAND 2010
pArentAl sAtisFAction with eArly childhood cAre And educAtion
households in the Mid-west region are most likely to report that they have access to high-quality, affordable childcare in the community.
Measure
the percentage of households with children under 13 years of age who report they have ‘access to high-quality, affordable childcare in the community’.
key findingsIn 2007, 29% of households with children under 13 reported that they have access ■
to high-quality, affordable childcare in the community.
differences by household structure23% of one-parent households reported to have access to high-quality, affordable ■
childcare in the community, compared to 30% of two-parent households (see Table 46).
Table 46: Percentage of households with children under 13 who report they have ‘access to high-quality, affordable childcare in the community’, by household structure (2007)
%
All households 29
Household structure
One-parent households 23
Two-parent households 30
Source: Childcare Module, Quarterly National Household Survey, CSO

67
PARENTAL SATISFACTION WITH EARLY CHILDHOOD CARE AND EDUCATION
PA
RT
3: C
HIL
DR
EN
’S O
UT
CO
ME
Sdifferences by geographic location45% of households in the Mid-West region reported that they have access to ■
high-quality, affordable childcare in the community, compared to 21% of households in the Dublin region (see Table 47).
Households in rural areas were more likely to report having access to high-quality, ■
affordable childcare in the community when compared to households in urban areas (34% and 25% respectively).
Table 47: Percentage of households with children under 13 who report they have ‘access to high-quality, affordable childcare in the community’, by NUTS Region and location (2007)
%
All households 29
NUTS Region
Border 31
Dublin 21
Midlands 32
Mid-East 23
Mid-West 45
South-East 30
South-West 29
West 38
Location
Rural 34
Urban 25
Source: Childcare Module, Quarterly National Household Survey, CSO

68
STATE OF THE NATION’S CHILDREN – IRELAND 2010
QuAlity oF eArly childhood cAre And educAtion
82% of ecce services under contract to deliver the Free pre-school year scheme meet basic capitation criteria and 11% meet higher capitation criteria.
Measure
the percentage of early childhood care and education (ecce) services under contract to deliver the Free pre-school year scheme that meet basic and higher capitation criteria.
key findingsIn June 2010, a total of 3,787 ECCE services were under contract to deliver the Free ■
Pre-School Year Scheme. 82.0% met the basic capitation criteria and 11.0% met the higher capitation criteria.
differences by geographic locationClare had the lowest proportion of ECCE services that met the basic capitation ■
criteria (see Table 48).
Table 48: Percentage of Early Childhood Care and Education (ECCE) services under contract to deliver the Free Pre-School Year Scheme that meet basic and higher capitation criteria, by City and County Childcare Committees (2010)
Total ECCE services
Meeting basic capitation criteria
Meeting higher capitation criteria
No. No. % No. %
State 3,787 3,105 82.0 415 11.0
City and County Childcare Committee
Carlow 42 33 78.6 4 9.5
Cavan 55 43 78.2 7 12.7
Clare 130 91 70.0 2 1.5
Cork City 83 77 92.8 17 20.5
Cork County 292 272 93.2 56 19.2
continued

69
QUALITY OF EARLY CHILDHOOD CARE AND EDUCATION
PA
RT
3: C
HIL
DR
EN
’S O
UT
CO
ME
STable 48 (continued)
City and County Childcare Committee
Total ECCE services
Meeting basic capitation criteria
Meeting higher capitation criteria
No. No. % No. %
Donegal 119 100 84.0 8 6.7
Dublin City 289 242 83.7 40 13.8
Dun Laoghaire/Rathdown 161 128 79.5 30 18.6
Fingal 277 200 72.2 28 10.1
Galway 242 195 80.6 19 7.9
Kerry 123 103 83.7 19 15.5
Kildare 206 161 78.2 22 10.7
Kilkenny 92 71 77.2 5 5.4
Laois 72 57 79.2 9 12.5
Leitrim 36 28 77.8 2 5.6
Limerick City 44 40 90.9 3 6.8
Limerick County 116 99 85.3 16 13.8
Longford 34 25 73.5 6 17.7
Louth 107 83 77.6 1 0.9
Mayo 108 102 94.4 6 5.6
Meath 183 143 78.1 15 8.2
Monaghan 55 49 89.1 7 12.7
Offaly 58 44 75.9 3 5.2
Roscommon 53 46 86.8 1 1.9
Sligo 60 43 71.7 5 8.3
South Dublin 190 157 82.6 15 7.9
Tipperary NR 70 65 92.9 10 14.3
Tipperary SR 68 53 77.9 9 13.2
Waterford City 38 37 97.4 3 7.9
Waterford County 47 44 93.6 2 4.3
Westmeath 81 68 84.0 17 21.0
Wexford 124 102 82.3 12 9.7
Wicklow 132 104 78.8 16 12.1
Source: ECCE Database, OMCYA

70
STATE OF THE NATION’S CHILDREN – IRELAND 2010
school AttendAnce
one in every 8 primary school children and one in every 6 post-primary school children miss 20 days or more in the school year.
Measure
the percentage of children who are absent from school for 20 days or more in the school year.
key findingsIn the 2007/08 school year, 12.0% of primary school children and 16.9% of post- ■
primary school children were absent from school for 20 days or more (see Table 49).
differences over age and timeOver the period 2003/04 to 2007/08, the percentage of children who were absent ■
from school for 20 days or more ranged between 11%-12% for primary school children and 16-18% for post-primary school children.
Table 49: Percentage of children who are absent from school for 20 days or more in the school year, by school-going status (2003/04 – 2007/08)
2003/04 2004/05 2005/06 2006/07 2007/08
Primary school children 11.7 11.1 11.5 10.9 12.0
Post-primary school children 17.2 17.2 16.0 17.8 16.9
Source: National Educational Welfare Board
differences by location and school typeFor primary schools, the average percentage of children missing 20 days or more was ■
almost twice as high for schools in urban areas (15.1%) when compared to schools in rural areas (8.4%) (see Table 50). There was also a clear relationship between 20-day absences and levels of disadvantage. Using the Delivering Equality of Opportunity in Schools (DEIS) categories and participation in the School Support Programme (SSP), the average percentage of children missing 20 days or more tended to be higher in SSP schools when compared to non-SSP schools (although 20-day absences were still higher in non-SSP urban schools than in SSP rural schools).

71
SCHOOL ATTENDANCE
PA
RT
3: C
HIL
DR
EN
’S O
UT
CO
ME
SFor post-primary schools, the average percentage of children missing 20 days or ■
more was higher in Community/Comprehensive and Vocational schools. This was almost twice as high in DEIS schools (26.5%) when compared to non-DEIS schools (14.8%).
Table 50: Average percentage of children per school who are absent from school for 20 days or more in the school year, by selected school characteristics (2007/08)
%
PRIMARY SCHOOL
School location
Rural 8.4
Urban 15.1
DEIS
Rural, not in School Support Programme 8.0
Rural, in School Support Programme 10.3
Urban, not in School Support Programme 11.5
Urban, in School Support Programme Band 2 19.1
Urban, in School Support Programme Band 1 25.8
POST-PRIMARY SCHOOL
Type of school
Secondary 14.1
Community/Comprehensive 23.3
Vocational 23.0
DEIS
DEIS 26.5
Non-DEIS 14.8
Source: National Educational Welfare Board
differences by geographic locationFor primary schools, the average percentage of children missing 20 days or more ■
was lowest in Monaghan (8.1%) and highest in Offaly (16.6%), while for post-primary schools the average percentage of children missing 20 days or more was lowest in Waterford (10.6%) and highest in Laois (23.6%) (see Table 51).

72
STATE OF THE NATION’S CHILDREN – IRELAND 2010
Table 51: Average percentage of children per school who are absent from school for 20 days or more in the school year, by school type and county (2007/08)
Primary school Post-primary school
Total 12.1 19.2
County
Carlow 12.5 14.1
Cavan 10.8 23.5
Clare 9.4 12.8
Cork 9.6 14.9
Donegal 9.8 20.7
Dublin 14.8 19.6
Galway 12.1 18.2
Kerry 12.2 19.2
Kildare 11.8 15.3
Kilkenny 9.1 13.4
Laois 10.9 23.6
Leitrim 9.6 21.3
Limerick 12.9 14.6
Longford 13.1 21.9
Louth 12.9 16.8
Mayo 11.1 20.1
Meath 9.7 13.2
Monaghan 8.1 20.7
Offaly 16.6 20.7
Roscommon 10.0 18.9
Sligo 13.0 13.5
Tipperary NR 9.7 16.7
Tipperary SR 11.3 11.9
Waterford 12.1 10.6
Westmeath 11.7 16.2
Wexford 13.2 19.1
Wicklow 11.6 17.8
Source: National Educational Welfare Board

73
TRANSFER TO SECOND-LEVEL EDUCATION
PA
RT
3: C
HIL
DR
EN
’S O
UT
CO
ME
StrAnsFer to second-level educAtion
the majority of children (98.5%) leaving national schools are known to have either progressed to another form of schooling or to have emigrated with their families.
Measure
the percentage of children leaving national schools, by destination.
key findingsIn the 2009/10 school year, 94.3% of children leaving national schools are known ■
to have progressed to another form of schooling (either at first or second level) and 4.2% of children are known to have emigrated with their families (see Table 52). Less than half of 1% of children leaving national schools were known not to have progressed to another school, while the destination of a further 1.2% of these children is unknown.
differences by gender and over timeOf the 278 children leaving national schools and not attending another school, ■
55.8% were boys and 44.2% were girls (see Figure 9).
Over the 2005/06 – 2009/10 school years, approximately 95% of children leaving ■
national schools are known to have progressed to another form of schooling (either at first or second level) and an increasing percentage of children are known to have emigrated with their families.

74
STATE OF THE NATION’S CHILDREN – IRELAND 2010
Table 52: Number and percentage of children leaving national schools, by destination (2005/06 – 2009/10)
2005/06 2006/07 2007/08 2008/09 2009/10
No. No. No. No. No. %
Total number of children 76,187 75,991 77,226 80,444 83,488 100.0
Destination
Attending another school within the State
73,331 72,566 73,420 75,823 78,703 94.3
Emigrating 2,050 2,260 2,657 3,280 3,474 4.2
Not attending another school 263 256 280 334 278 0.3
Unknown 543 909 869 1,007 1,033 1.2
Source: Education Statistics, Department of Education and Skills
Figure 9: percentage of children leaving national schools and not attending another school, by gender (2005/06 – 2009/10)
0 25 50 75 100
2005/06
2006/07
2007/08
2008/09
2009/10
% of children
Boys Girls
Source: Education Statistics, Department of Education and Skills
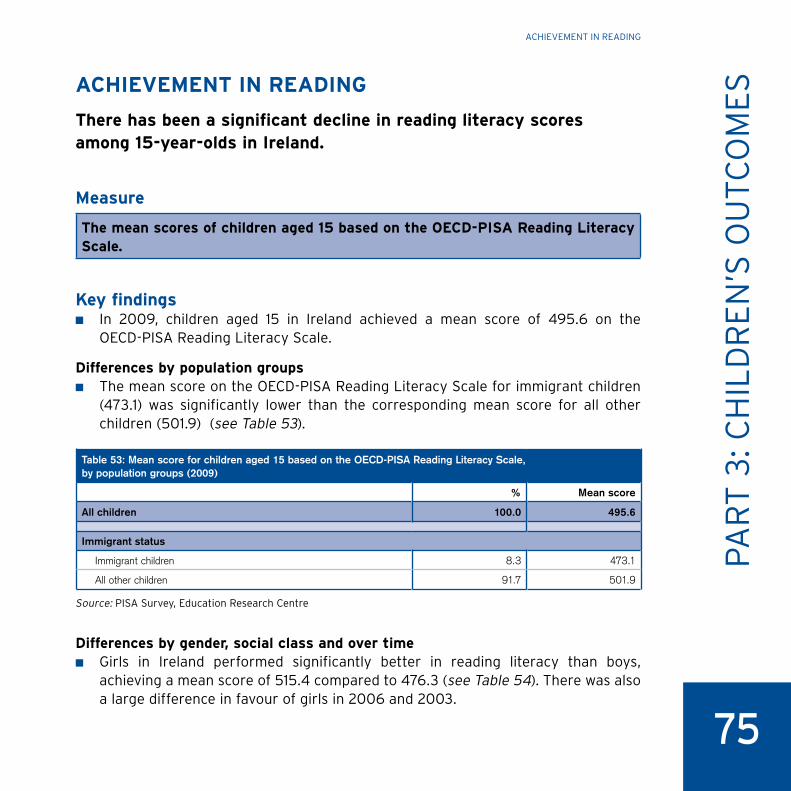
75
ACHIEVEMENT IN READING
PA
RT
3: C
HIL
DR
EN
’S O
UT
CO
ME
SAchieveMent in reAding
there has been a significant decline in reading literacy scores among 15-year-olds in ireland.
Measure
the mean scores of children aged 15 based on the oecd-pisA reading literacy scale.
key findingsIn 2009, children aged 15 in Ireland achieved a mean score of 495.6 on the ■
OECD-PISA Reading Literacy Scale.
differences by population groupsThe mean score on the OECD-PISA Reading Literacy Scale for immigrant children ■
(473.1) was significantly lower than the corresponding mean score for all other children (501.9) (see Table 53).
Table 53: Mean score for children aged 15 based on the OECD-PISA Reading Literacy Scale, by population groups (2009)
% Mean score
All children 100.0 495.6
Immigrant status
Immigrant children 8.3 473.1
All other children 91.7 501.9
Source: PISA Survey, Education Research Centre
differences by gender, social class and over timeGirls in Ireland performed significantly better in reading literacy than boys, ■
achieving a mean score of 515.4 compared to 476.3 (see Table 54). There was also a large difference in favour of girls in 2006 and 2003.

76
STATE OF THE NATION’S CHILDREN – IRELAND 2010
Reading achievement was related to social class across all three PISA cycles ■
considered here. In 2009, the mean score of children from the highest social class category (535.5) was significantly higher than the mean score of children in the lowest social class category (459.5).
The mean reading score for students in Ireland in 2009 (495.6) was significantly ■
lower than the Irish mean score in 2000 (526.7), which was the last time reading was a major assessment domain in PISA, and was also lower than in 2003 (515.5) and 2006 (517.3).
Table 54: Mean score for children aged 15 based on the OECD-PISA Reading Literacy Scale, by gender and social class (2003, 2006 and 2009)
2003 2006 2009
All children 515.5 517.3 495.6
Gender
Boys 501.1 500.2 476.3
Girls 530.1 534.0 515.4
Social class
High SES 547.8 551.2 535.5
Medium SES 521.6 522.4 497.9
Low SES 484.3 490.2 459.5
Source: PISA Survey, Education Research Centre
international comparisonsIn 2009, Ireland’s mean score of 495.6 on the OECD-PISA Reading Literacy ■
Scale was not significantly different from the OECD mean score of 493.4 (see Figure 10).
Mexico was the lowest-scoring OECD country on this indicator, while Korea achieved ■
the highest mean score.
Ireland ranked 17th (true rank: 12th – 22nd) in reading literacy among the 34 ■
participating OECD countries. Ireland’s mean score was not significantly different from those of 13 other OECD countries, including Norway, Poland, USA, Germany, France and United Kingdom.

77
ACHIEVEMENT IN READING
PA
RT
3: C
HIL
DR
EN
’S O
UT
CO
ME
SFigure 10: Mean scores of children aged 15 based on the oecd-pisA reading literacy scale, by oecd country (2009)
470.3
472.2
474.0
477.4
478.2
481.0
482.8
483.1
486.1
489.3
493.4
494.2
494.2
494.9
495.6
495.6
497.3
497.4
499.8
500.3
500.5
500.5
501.0
503.2
505.9
508.4
514.9
519.9
520.9
524.2
535.9
539.3
Austria
Luxembourg
Israel
Slovak Republic
Czech Republic
Spain
Greece
Slovenia
Italy
Portugal
OECD Average
Hungary
United Kingdom
Denmark
France
Ireland
Germany
Sweden
United States
Iceland
Poland
Switzerland
Estonia*
Norway
Belgium
Netherlands
Australia
Japan
New Zealand
Canada
Finland
Korea
425.3
449.4
464.2
0.0 100.0 200.0 300.0 400.0 500.0 600.0
Mexico
Chile
Turkey
Mean score
* PISA 2009 data for Estonia (an accession candidate country) are included in the OECD average estimates.
Source: PISA Survey, Education Research Centre

78
STATE OF THE NATION’S CHILDREN – IRELAND 2010
AchieveMent in MAtheMAtics
Mathematics literacy scores of 15-year-olds in ireland are significantly below the oecd average.
Measure
the mean scores of children aged 15 based on the oecd-pisA Mathematics literacy scale.
key findingsIn 2009, children aged 15 in Ireland achieved a mean score of 487.1 on the ■
OECD-PISA Mathematics Literacy Scale.
differences by population groupsThe mean score on the OECD-PISA Mathematics Literacy Scale for immigrant ■
children (471.7) was significantly lower than the corresponding mean score for all other children (491.7) (see Table 55).
Table 55: Mean score for children aged 15 based on the OECD-PISA Mathematics Literacy Scale, by population groups (2009)
% Mean score
All children 100.0 487.1
Immigrant status
Immigrant children 8.3 471.7
All other children 91.7 491.7
Source: PISA Survey, Education Research Centre
differences by gender, social class and over timeBoys in Ireland achieved a higher mean score on the OECD-PISA Mathematics ■
Literacy Scale than girls (490.9 compared to 483.3), although the difference was not significant (see Table 56). In both 2006 and 2003, boys significantly outscored girls.

79
ACHIEVEMENT IN MATHEMATICS
PA
RT
3: C
HIL
DR
EN
’S O
UT
CO
ME
SThe mean mathematics score of children from the highest social class category ■
(523.4) was significantly higher than the mean of children from the medium or lowest social class categories (490.1 and 452.3 respectively). Mathematics achievement was similarly related to social class in 2006 and 2003.
The mean mathematics score for students in Ireland in 2009 (487.1) was significantly ■
lower than the Irish mean score in 2003 (502.8), the last time mathematics was a major assessment domain in PISA.
Table 56: Mean score for children aged 15 based on the OECD-PISA Mathematics Literacy Scale, by gender and social class (2003, 2006 and 2009)
2003 2006 2009
All children 502.8 501.5 487.1
Gender
Boys 510.2 507.3 490.9
Girls 495.4 495.8 483.3
Social class
High SES 535.7 532.8 523.4
Medium SES 506.1 505.0 490.1
Low SES 473.5 476.0 452.3
Source: PISA Survey, Education Research Centre
international comparisonsIn 2009, Ireland’s mean score of 487.1 on the OECD-PISA Mathematics Literacy ■
Scale was significantly below the OECD mean score of 495.7 (see Figure 11).
Mexico was the lowest-scoring OECD country on this indicator, while Korea achieved ■
the highest mean score.
Ireland ranked 26th (true rank: 22nd – 29th) in mathematical literacy among all ■
34 participating OECD countries. Ireland’s mean score was not significantly different from the mean scores of 10 other OECD countries, including Sweden, Czech Republic, United Kingdom and USA.

80
STATE OF THE NATION’S CHILDREN – IRELAND 2010
Figure 11: Mean scores of children aged 15 based on the oecd-pisA Mathematics literacy scale, by oecd country (2009)
445.5
446.9
466.1
482.9
483.5
486.9
487.1
487.4
489.1
490.2
492.4
492.8
494.2
494.8
495.7
495.9
496.7
496.8
498.0
501.5
503.3
506.7
512.1
512.8
514.3
515.3
519.3
525.8
526.8
529.0
534.0
540.5
546.2
Turkey
Israel
Greece
Italy
Spain
Portugal
Ireland
United States
Luxembourg
Hungary
United Kingdom
Czech Republic
Sweden
Poland
OECD Average
Austria
Slovak Republic
France
Norway
Slovenia
Denmark
Iceland
Estonia*
Germany
Australia
Belgium
New Zealand
Netherlands
Canada
Japan
Switzerland
Finland
Korea
418.5
421.1
0.0 100.0 200.0 300.0 400.0 500.0 600.0
Mexico
Chile
Mean score
* PISA 2009 data for Estonia (an accession candidate country) are included in the OECD average estimates.
Source: PISA Survey, Education Research Centre

81
ACHIEVEMENT IN SCIENCE
PA
RT
3: C
HIL
DR
EN
’S O
UT
CO
ME
SAchieveMent in science
science literacy scores of 15-year-olds in ireland are significantly above the oecd average.
Measure
the mean scores of children aged 15 based on the oecd-pisA combined scientific literacy scale.
key findingsIn 2009, children aged 15 in Ireland achieved a mean score of 508.0 on the ■
OECD-PISA Combined Scientific Literacy Scale.
differences by population groupsThe mean score on the OECD-PISA Combined Scientific Literacy Scale for immigrant ■
children (492.3) was significantly lower than the corresponding mean score for all other children (513.1) (see Table 57).
Table 57: Mean score for children aged 15 based on the OECD-PISA Combined Scientific Literacy Scale, by population groups (2009)
% Mean score
All children 100.0 508.0
Immigrant status
Immigrant children 8.3 492.3
All other children 91.7 513.1
Source: PISA Survey, Education Research Centre
differences by gender, social class and over timeGirls in Ireland achieved a higher mean score on the OECD-PISA Combined Scientific ■
Literacy Scale than boys (509.4 and 506.6 respectively), although this difference was not significant (see Table 58). Similarly in 2006 and 2003, the mean scores of boys and girls did not differ significantly from each other.

82
STATE OF THE NATION’S CHILDREN – IRELAND 2010
As with reading and mathematics in 2009, children from the highest social class ■
category achieved a significantly higher mean score in science (545.7) than children in the medium or lowest social class categories (512.8 and 471.0 respectively). A similar pattern was observed in 2006 and 2003.
The mean science score for students in Ireland in 2009 (508.0) was almost ■
identical to the Irish mean score in 2006 (508.3), the last time science was a major assessment domain in PISA.
Table 58: Mean score for children aged 15 based on the OECD-PISA Combined Scientific Literacy Scale, by gender and social class (2003, 2006 and 2009)
2003 2006 2009
All children 505.4 508.3 508.0
Gender
Boys 506.4 508.1 506.6
Girls 504.4 508.5 509.4
Social class
High SES 542.5 542.3 545.7
Medium SES 509.6 512.8 512.8
Low SES 470.8 480.7 471.0
Source: PISA Survey, Education Research Centre
international comparisonsIn 2009, Ireland’s mean score of 508.0 on the OECD-PISA Combined Scientific Literacy ■
Scale was significantly above the OECD mean score of 500.8 (see Figure 12).
Mexico was the lowest-scoring OECD country on this indicator, while Finland ■
achieved the highest mean score.
Ireland ranked 14th (true rank: 11th – 17th) in scientific literacy among all 34 ■
participating OECD countries. Ireland’s mean score was not significantly different from the mean scores of 8 other OECD countries, including the United Kingdom, USA, Czech Republic, Hungary and Norway.
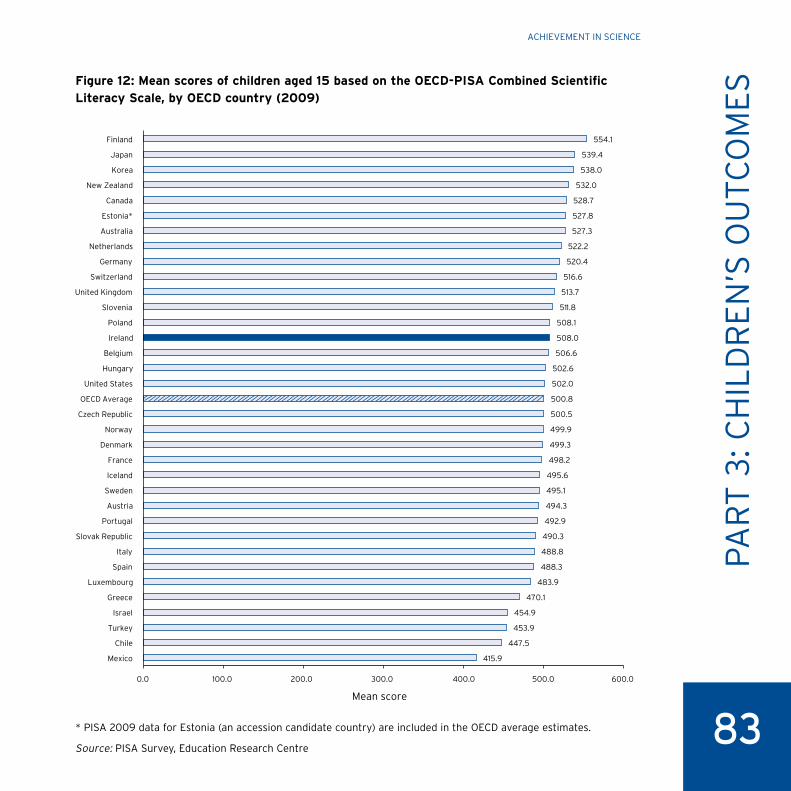
83
ACHIEVEMENT IN SCIENCE
PA
RT
3: C
HIL
DR
EN
’S O
UT
CO
ME
SFigure 12: Mean scores of children aged 15 based on the oecd-pisA combined scientific literacy scale, by oecd country (2009)
453.9
454.9
470.1
483.9
488.3
488.8
490.3
492.9
494.3
495.1
495.6
498.2
499.3
499.9
500.5
500.8
502.0
502.6
506.6
508.0
508.1
511.8
513.7
516.6
520.4
522.2
527.3
527.8
528.7
532.0
538.0
539.4
554.1
Turkey
Israel
Greece
Luxembourg
Spain
Italy
Slovak Republic
Portugal
Austria
Sweden
Iceland
France
Denmark
Norway
Czech Republic
OECD Average
United States
Hungary
Belgium
Ireland
Poland
Slovenia
United Kingdom
Switzerland
Germany
Netherlands
Australia
Estonia*
Canada
New Zealand
Korea
Japan
Finland
415.9
447.5
0.0 100.0 200.0 300.0 400.0 500.0 600.0
Mexico
Chile
Mean score
* PISA 2009 data for Estonia (an accession candidate country) are included in the OECD average estimates.
Source: PISA Survey, Education Research Centre

STATE OF THE NATION’S CHILDREN – IRELAND 2010

heAlth outcoMes

86
STATE OF THE NATION’S CHILDREN – IRELAND 2010
Birth weight
the percentage of low birth weight babies has remained relatively stable over the last 5 years.
Measure
the percentage of babies born weighing less than 2,500 grams (live and still births).
key findingsIn 2008, 5.6% of all babies born were in the low birth weight category (less than ■
2,500 grams).
differences by gender, social class and over timeGirls were more likely than boys to be born in the low birth weight category (6.0% ■
and 5.2% respectively) (see Table 59).
There were also marked social class differences ( ■ see Figure 13). The percentage of babies born in the low birth weight category were higher among mothers who reported to be ‘unemployed’ (9.0%) compared to mothers in ‘higher professional’ groups (4.1%).
Over the period 2004-2008, the percentage of babies born in the low birth weight ■
category has been relatively stable.
Table 59: Percentage of babies born weighing less than 2,500 grams (live and still births), by gender (2004-2008)
2004 2005 2006 2007 2008
Low birth weight (%)
Low birth weight (%)
Low birth weight (%)
Low birth weight (%)
Low birth weight (%)
Healthy birth weight (%)
High birth weight (%)
Total 5.3 5.3 5.3 5.6 5.6 78.2 16.2
Gender
Boys 5.1 4.9 5.0 5.1 5.2 75.2 19.5
Girls 5.5 5.8 5.6 6.0 6.0 81.3 12.6
Source: National Perinatal Reporting System, ESRI

87
BIRTH WEIGHT
PA
RT
3: C
HIL
DR
EN
’S O
UT
CO
ME
SFigure 13: percentage of babies born weighing less than 2,500 grams (live and still births), by occupation of mother (2008)*
% of babies
9.0
6.6
6.2
5.8
5.6
5.4
5.2
5.1
4.4
4.2
4.1
0 2 4 6 8 10
Higher Professional
Skilled Manual Workers
Salaried Employees
Intermediate Non-manual Workers
Lower Professional
Employers and Managers
State
Other Non-manual Workers
Home Duties
Semi-skilled Manual Workers
Unemployed
Occ
up
atio
n o
f m
oth
er
* Categories where percentages are based on less than 100 births (i.e. ‘unskilled manual workers’, ‘other agricultural occupations and fishermen’, ‘farmers and farm managers’) and ‘not stated’ and ‘not classifiable’ categories have been omitted from this Figure.
Source: National Perinatal Reporting System, ESRI
differences by geographic locationWaterford had the highest proportion of babies born in the low birth weight ■
category (see Table 60).

88
STATE OF THE NATION’S CHILDREN – IRELAND 2010
Table 60: Number and percentage of babies born weighing less than 2,500 grams (live and still births), by mothers’ county of residence (2008)*
No. Low birth weight births as % of all births
Total 4,251 5.6
County
Carlow 67 6.2
Cavan 58 4.6
Clare 111 6.0
Cork 485 5.8
Donegal 101 4.5
Dublin City 885 5.9
Dublin County 294 5.2
Galway 234 5.6
Kerry 102 4.9
Kildare 212 5.3
Kilkenny 80 5.7
Laois 89 6.5
Leitrim 27 5.2
Limerick 193 6.0
Longford 43 5.9
Louth 114 5.7
Mayo 84 4.4
Meath 200 5.5
Monaghan 48 5.5
Offaly 68 5.5
Roscommon 52 5.7
Sligo 34 3.5
Tipperary NR 67 6.7
Tipperary SR 78 5.3
Waterford 142 7.1
Westmeath 79 5.2
Wexford 151 6.0
Wicklow 146 5.8
* Categories where percentages are based on less than 100 births (i.e. 7 births with ‘other’ place of residence for mother) have been omitted from this Table.
Source: National Perinatal Reporting System, ESRI

89
BREASTFEEDING
PA
RT
3: C
HIL
DR
EN
’S O
UT
CO
ME
SBreAstFeeding
Breastfeeding initiation rates have continued to increase.
Measure
the percentage of infants who are (a) exclusively breastfed and (b) who are partially breastfed on discharge from hospital.
key findingsIn 2008, 50.9% of infants were breastfed on discharge from hospital. This includes ■
44.3% who were exclusively breastfed and a further 6.6% who were fed using a combination of bottle and breastfeeding.
differences by age, social class and over timeThe percentage of infants who were breastfed (either exclusive or combined) is ■
higher among older mothers (see Table 61). 26.9% of mothers aged 15-19 breastfed their infants compared to 57.7% of mothers aged 45 or more.
There were also marked social class differences ( ■ see Figure 14). The percentage of infants who were breastfed (either exclusive or combined) was higher among mothers in ‘higher’ and ‘lower professional’ groups (69.1% and 67.2% respectively) compared to mothers who reported to be ‘unemployed’ (35.3%).
Over the period 2004-2008, the percentage of infants who were breastfed (either ■
exclusive or combined) on discharge from hospital has risen consistently.
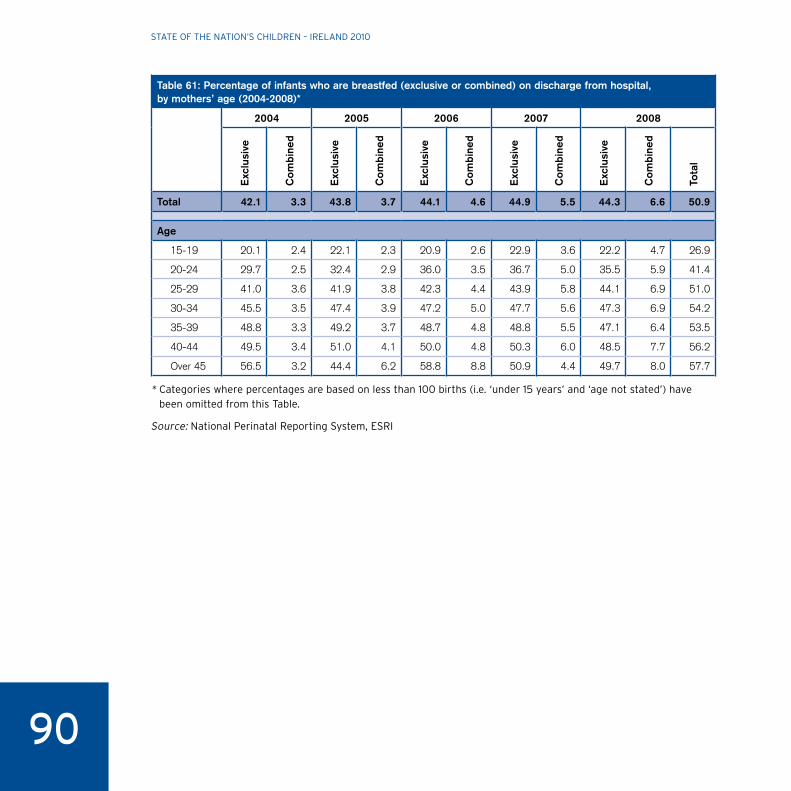
90
STATE OF THE NATION’S CHILDREN – IRELAND 2010
Table 61: Percentage of infants who are breastfed (exclusive or combined) on discharge from hospital, by mothers’ age (2004-2008)*
2004 2005 2006 2007 2008
Exc
lusi
ve
Co
mb
ined
Exc
lusi
ve
Co
mb
ined
Exc
lusi
ve
Co
mb
ined
Exc
lusi
ve
Co
mb
ined
Exc
lusi
ve
Co
mb
ined
Tota
l
Total 42.1 3.3 43.8 3.7 44.1 4.6 44.9 5.5 44.3 6.6 50.9
Age
15-19 20.1 2.4 22.1 2.3 20.9 2.6 22.9 3.6 22.2 4.7 26.9
20-24 29.7 2.5 32.4 2.9 36.0 3.5 36.7 5.0 35.5 5.9 41.4
25-29 41.0 3.6 41.9 3.8 42.3 4.4 43.9 5.8 44.1 6.9 51.0
30-34 45.5 3.5 47.4 3.9 47.2 5.0 47.7 5.6 47.3 6.9 54.2
35-39 48.8 3.3 49.2 3.7 48.7 4.8 48.8 5.5 47.1 6.4 53.5
40-44 49.5 3.4 51.0 4.1 50.0 4.8 50.3 6.0 48.5 7.7 56.2
Over 45 56.5 3.2 44.4 6.2 58.8 8.8 50.9 4.4 49.7 8.0 57.7
* Categories where percentages are based on less than 100 births (i.e. ‘under 15 years’ and ‘age not stated’) have been omitted from this Table.
Source: National Perinatal Reporting System, ESRI

91
BREASTFEEDING
PA
RT
3: C
HIL
DR
EN
’S O
UT
CO
ME
SFigure 14: percentage of infants who are breastfed (either exclusive or combined) on discharge from hospital, by mothers’ occupation (2008)*
% of infants
69.1
67.2
61.1
57.7
50.9
48.8
48.6
46.3
45.1
43.6
35.3
0 10 20 30 40 50 60 70 80
Unemployed
Home Duties
Intermediate Non-manual Workers
Other Non-manual Workers
Salaried Employees
Semi-skilled Manual Workers
State
Employers and Managers
Skilled Manual Workers
Lower Professional
Higher Professional
Occ
up
atio
n o
f m
oth
er
* Categories where percentages are based on less than 100 births (i.e. ‘unskilled manual workers’, ‘other agricultural occupations and fishermen’, ‘farmers and farm managers’) and ‘not stated’ and ‘not classifiable’ categories have been omitted from this Figure.
Source: National Perinatal Reporting System, ESRI
differences by geographic locationDublin County had the highest proportion of infants who were breastfed (either ■
exclusive or combined) on discharge from hospital (see Table 62).

92
STATE OF THE NATION’S CHILDREN – IRELAND 2010
Table 62: Percentage of infants who are breastfed (exclusive or combined) on discharge from hospital, by mothers’ county of residence (2008)*
Exclusive Combined Total
% % %
Total 44.3 6.6 50.9
County
Carlow 48.4 1.5 49.9
Cavan 45.3 3.4 48.7
Clare 20.3 3.7 24.0
Cork 41.2 10.8 52.0
Donegal 30.2 7.9 38.1
Dublin City 50.7 6.5 57.2
Dublin County 55.7 7.0 62.7
Galway 33.2 21.6 54.8
Kerry 43.2 7.3 50.5
Kildare 49.9 4.8 54.7
Kilkenny 53.5 0.6 54.1
Laois 50.4 3.2 53.6
Leitrim 46.2 8.5 54.7
Limerick 19.0 1.7 20.7
Longford 46.6 3.4 50.0
Louth 42.3 6.1 48.4
Mayo 48.3 4.2 52.5
Meath 49.4 5.5 54.9
Monaghan 41.9 4.2 46.1
Offaly 44.8 2.0 46.8
Roscommon 46.3 5.9 52.2
Sligo 35.4 9.6 45.0
Tipperary NR 26.2 1.4 27.6
Tipperary SR 45.7 0.4 46.1
Waterford 48.4 2.6 51.0
Westmeath 50.3 3.4 53.7
Wexford 39.1 4.8 43.9
Wicklow 51.0 5.8 56.8
* Categories where percentages are based on less than 100 births (i.e. ‘other’ and ‘not stated’) have been omitted from this Table.
Source: National Perinatal Reporting System, ESRI

93
HEALTH CONDITIONS AND HOSPITALISATION
PA
RT
3: C
HIL
DR
EN
’S O
UT
CO
ME
SheAlth conditions And hospitAlisAtion
More than half of the total hospital discharges among children were children under 5 years of age.
Measure
the number of hospital discharges among children.
key findingsIn 2009, there was a total of 145,749 hospital discharges among children. ■
differences by age, gender, principal diagnosis and over timeMore than half of the total hospital discharges were among infants and children ■
aged 1-4 years old (22.5% and 29.6% respectively) and more than half of the total hospital discharges were among boys (55.4%) (see Table 63).
The most common reported principal diagnosis recorded was ‘diseases of the ■
respiratory system’ (13.0%), followed by ‘injury, poisoning and certain other consequences of external causes’ (9.7%).
Over the period 2005-2009, the total number of hospital discharges and the most ■
common reported principal diagnosis have remained relatively stable.

94
STATE OF THE NATION’S CHILDREN – IRELAND 2010
Table 63: Number and percentage of hospital discharges among children, by age, gender and principal diagnosis (2005-2009)
2005 2006 2007 2008 2009
No. No. No. No. No. %
Total 142,245 146,187 145,051 145,649 145,749 100.0
Age
Under 1 30,283 31,687 31,614 33,478 32,863 22.5
1-4 42,154 43,662 42,659 42,258 43,206 29.6
5-9 28,079 28,717 28,210 28,184 28,657 19.7
10-14 23,564 23,396 22,865 23,551 22,538 15.5
15-17 18,165 18,725 19,703 18,178 18,485 12.7
Gender
Boys 78,503 82,239 80,925 81,462 80,752 55.4
Girls 63,742 63,948 64,126 64,187 64,997 44.6
Principal diagnosis (Top 10)
Diseases of the respiratory system 21,931 22,167 19,897 18,608 18,969 13.0
Injury, poisoning and certain other consequences of external causes
15,256 14,905 15,105 14,221 14,159 9.7
Diseases of the digestive system 12,493 12,791 12,815 13,127 13,144 9.0
Certain infectious and parasitic diseases 11,764 13,485 13,187 12,357 11,858 8.1
Certain conditions originating in the perinatal period
8,688 9,295 9,261 9,503 9,818 6.7
Congenital malformations, deformations and chromosomal abnormalities
8,004 8,251 8,682 9,094 9,142 6.3
Diseases of the genitourinary system 7,401 7,280 7,615 7,716 7,910 5.4
Neoplasms 6,402 6,319 6,046 6,157 5,827 4.0
Diseases of the ear and mastoid process 5,551 5,475 4,723 5,044 4,865 3.3
Diseases of the skin and subcutaneous tissue
4,051 3,821 4,095 4,141 4,002 2.7
All other conditions and reasons for admission
40,704 42,398 43,625 45,681 46,055 31.6
Source: Hospital In-Patient Enquiry, Department of Health and Children
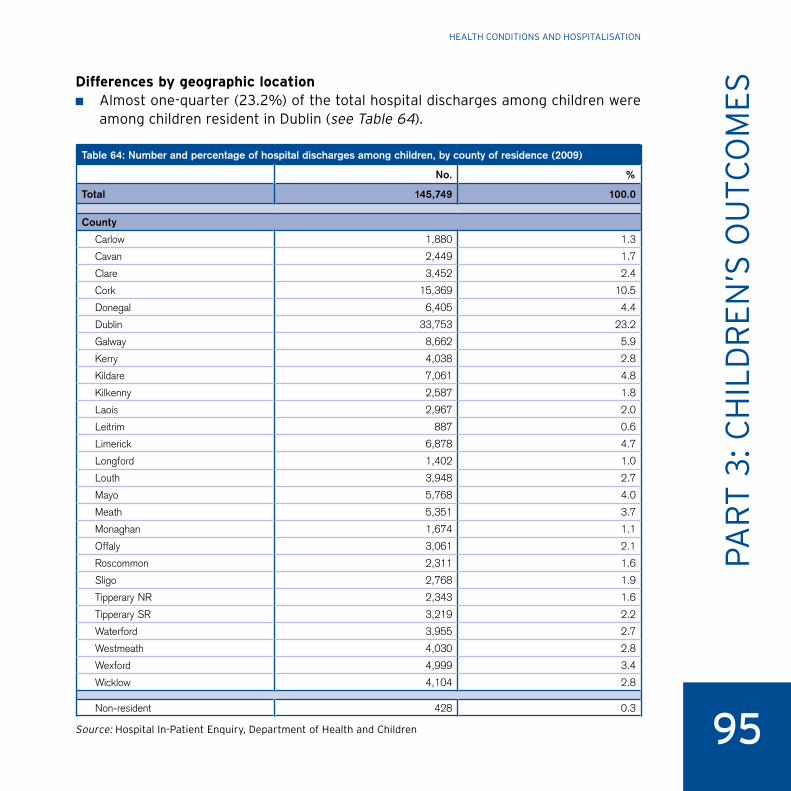
95
HEALTH CONDITIONS AND HOSPITALISATION
PA
RT
3: C
HIL
DR
EN
’S O
UT
CO
ME
Sdifferences by geographic locationAlmost one-quarter (23.2%) of the total hospital discharges among children were ■
among children resident in Dublin (see Table 64).
Table 64: Number and percentage of hospital discharges among children, by county of residence (2009)
No. %
Total 145,749 100.0
County
Carlow 1,880 1.3
Cavan 2,449 1.7
Clare 3,452 2.4
Cork 15,369 10.5
Donegal 6,405 4.4
Dublin 33,753 23.2
Galway 8,662 5.9
Kerry 4,038 2.8
Kildare 7,061 4.8
Kilkenny 2,587 1.8
Laois 2,967 2.0
Leitrim 887 0.6
Limerick 6,878 4.7
Longford 1,402 1.0
Louth 3,948 2.7
Mayo 5,768 4.0
Meath 5,351 3.7
Monaghan 1,674 1.1
Offaly 3,061 2.1
Roscommon 2,311 1.6
Sligo 2,768 1.9
Tipperary NR 2,343 1.6
Tipperary SR 3,219 2.2
Waterford 3,955 2.7
Westmeath 4,030 2.8
Wexford 4,999 3.4
Wicklow 4,104 2.8
Non-resident 428 0.3
Source: Hospital In-Patient Enquiry, Department of Health and Children

96
STATE OF THE NATION’S CHILDREN – IRELAND 2010
Accidents, inJuries And hospitAlisAtion
the number of hospital discharges among children with a diagnosis of ‘transport accidents’, ‘intentional self-harm’ and ‘accidental poisoning’ continues to decrease.
Measure
the number of hospital discharges among children with a diagnosis of external causes of injury or poisoning.
key findingsIn 2009, there was a total of 14,159 hospital discharges among children with a ■
diagnosis of ‘external causes of injury or poisoning’.
differences by age, gender, principal diagnosis and over timeAlmost one-third (30.8%) of the hospital discharges with a diagnosis of ‘external ■
causes of injury or poisoning’ were among children aged 1-4 and 62.2% of these hospital discharges were among boys (see Figure 15).
Over the period 2005-2009, the total number of hospital discharges among ■
children with a diagnosis of ‘external causes of injury or poisoning’ has fallen consistently (see Table 65). More specifically, the number of hospital discharges among children with a diagnosis of ‘transport accidents’, ‘intentional self-harm’ and ‘accidental poisoning’ has fallen over this period.

97
ACCIDENTS, INJURIES AND HOSPITALISATION
PA
RT
3: C
HIL
DR
EN
’S O
UT
CO
ME
STable 65: Number and percentage of hospital discharges among children with a diagnosis of external causes of injury or poisoning, by age, gender and cause (2005-2009)
2005 2006 2007 2008 2009
No. No. No. No. No. %
Total 15,256 14,905 15,105 14,221 14,159 100.0
Age
Under 1 786 830 895 971 972 6.9
1-4 4,217 4,322 4,236 4,069 4,367 30.8
5-9 3,578 3,571 3,629 3,294 3,380 23.9
10-14 3,676 3,335 3,458 3,347 3,001 21.2
15-17 2,999 2,847 2,887 2,540 2,439 17.2
Gender
Boys 9,418 9,271 9,474 8,931 8,803 62.2
Girls 5,838 5,634 5,631 5,290 5,356 37.8
Principal diagnosis
Accidental falls 6,107 6,067 5,973 5,664 5,884 41.6
Accidents caused by objects* 2,318 2,456 2,538 2,243 2,141 15.1
Transport accidents 1,944 1,770 1,758 1,606 1,476 10.4
Accident, not otherwise specified 381 441 527 549 605 4.3
Drowning, submersion, other accidental threats to breathing and foreign bodies
377 544 571 540 539 3.8
Accidental poisoning 503 427 454 427 340 2.4
Intentional self-harm 401 385 352 359 321 2.3
Assault 300 318 317 345 295 2.1
Contact with heat or hot substances 243 302 289 256 272 1.9
Event of undetermined intent 114 103 105 100 87 0.6
Exposure to smoke, fire and flames 64 113 74 51 55 0.4
Other external causes of injury 1,466 1,769 2,033 2,014 2,079 14.7
External cause not reported** 1,038 210 114 67 65 0.5
* ‘Accidents caused by objects’ include striking against or being struck accidentally by objects or persons; caught accidentally in or between objects; accidents caused by machinery; and accidents caused by cutting/piercing objects.
** ‘External cause not reported’ refers to discharges with a principal diagnosis of ‘Injury, poisoning and certain other consequences of external causes’, and for which an external cause of injury or poisoning was not recorded. The inclusion of this category ensures that the total reported corresponds with the data reported for ‘Injury, poisoning and certain other consequences of external causes’ in Table 63.
Source: Hospital In-Patient Enquiry, Department of Health and Children

98
STATE OF THE NATION’S CHILDREN – IRELAND 2010
Figure 15: number of hospital discharges among children with a diagnosis of external causes of injury or poisoning, by age and gender (2009)
< 1 year 1-4 years 5-9 years 10-14 years Total15-17 years
Age
529
44
3
2,5
46
1,82
1
2,0
06
1,37
4
1,99
0
1,011
1,732
707
8,8
03
5,3
56
No.
of
ho
spit
al d
isch
arg
esBoys
Girls
0
1000
2000
3000
4000
5000
6000
7000
8000
9000
10000
Source: Hospital In-Patient Enquiry, Department of Health and Children
differences by geographic locationOver one in 4 (25.8%) of the total hospital discharges among children with a ■
diagnosis of external causes of injury or poisoning were among children resident in Dublin (see Table 66).

99
ACCIDENTS, INJURIES AND HOSPITALISATION
PA
RT
3: C
HIL
DR
EN
’S O
UT
CO
ME
STable 66: Number and percentage of hospital discharges among children with a diagnosis of external causes of injury or poisoning, by county of residence (2009)
No. %
Total 14,159 100.0
County
Carlow 189 1.3
Cavan 275 1.9
Clare 314 2.2
Cork 1,467 10.4
Donegal 529 3.7
Dublin 3,649 25.8
Galway 864 6.1
Kerry 435 3.1
Kildare 700 4.9
Kilkenny 268 1.9
Laois 213 1.5
Leitrim 66 0.5
Limerick 552 3.9
Longford 139 1.0
Louth 422 3.0
Mayo 401 2.8
Meath 577 4.1
Monaghan 149 1.1
Offaly 247 1.7
Roscommon 184 1.3
Sligo 212 1.5
Tipperary NR 177 1.3
Tipperary SR 306 2.2
Waterford 389 2.7
Westmeath 342 2.4
Wexford 528 3.7
Wicklow 473 3.3
Non-resident 92 0.6
Source: Hospital In-Patient Enquiry, Department of Health and Children

100
STATE OF THE NATION’S CHILDREN – IRELAND 2010
nutritionAl outcoMes
Almost one-quarter of 7-year-old children are either overweight or obese.
Measure
the percentage of children aged 7 in the Body Mass index (BMi) categories of normal, overweight and obese.
key findingsIn 2008, 77% of children aged 7 were classified in the ‘normal’ weight category ■
according to the International Obesity Taskforce Standards. The remaining 23% of children were classified as either ‘overweight’ or ‘obese’ (16% and 7% respectively).
differences by genderBoys (82%) were more likely than girls (73%) to be categorised in the ‘normal’ ■
weight category (see Table 67). 18% of boys were categorised as either ‘overweight’ or ‘obese’ (13% and 5% respectively), while 27% of girls were categorised as either ‘overweight’ or ‘obese’ (19% and 8% respectively).
Table 67: Percentage of children aged 7 in the BMI categories of normal, overweight and obese, by gender (2008)
Normal Overweight Obese
% % %
Total 77 16 7
Gender
Boys 82 13 5
Girls 73 19 8
Source: WHO European Childhood Obesity Surveillance Initiative, National Nutrition Surveillance Centre
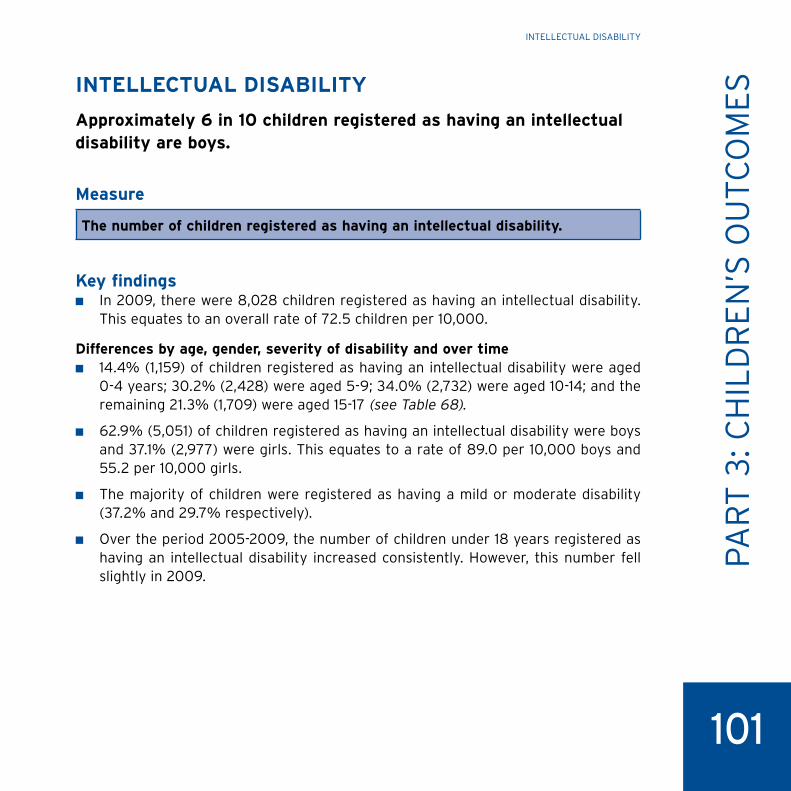
101
INTELLECTUAL DISABILITY
PA
RT
3: C
HIL
DR
EN
’S O
UT
CO
ME
SintellectuAl disABility
Approximately 6 in 10 children registered as having an intellectual disability are boys.
Measure
the number of children registered as having an intellectual disability.
key findingsIn 2009, there were 8,028 children registered as having an intellectual disability. ■
This equates to an overall rate of 72.5 children per 10,000.
differences by age, gender, severity of disability and over time14.4% (1,159) of children registered as having an intellectual disability were aged ■
0-4 years; 30.2% (2,428) were aged 5-9; 34.0% (2,732) were aged 10-14; and the remaining 21.3% (1,709) were aged 15-17 (see Table 68).
62.9% (5,051) of children registered as having an intellectual disability were boys ■
and 37.1% (2,977) were girls. This equates to a rate of 89.0 per 10,000 boys and 55.2 per 10,000 girls.
The majority of children were registered as having a mild or moderate disability ■
(37.2% and 29.7% respectively).
Over the period 2005-2009, the number of children under 18 years registered as ■
having an intellectual disability increased consistently. However, this number fell slightly in 2009.

102
STATE OF THE NATION’S CHILDREN – IRELAND 2010
Table 68: Number, percentage and rate (per 10,000) of children under 18 years registered as having an intellectual disability, by age, gender and severity of disability (2005-2009)
2005 2006 2007 2008 2009
No. No. No. No. No. %Rate per
10,000
Total 7,385 7,658 7,802 8,095 8,028 100.0 72.5
Age
0-4 1,127 1,085 1,071 1,272 1,159 14.4 33.9
5-9 2,049 2,357 2,468 2,470 2,428 30.2 78.8
10-14 2,400 2,400 2,519 2,636 2,732 34.0 94.8
15-17 1,809 1,816 1,744 1,717 1,709 21.3 101.0
Gender
Boys 4,523 4,858 4,898 5,077 5,051 62.9 89.0
Girls 2,862 2,800 2,904 3,018 2,977 37.1 55.2
Severity of disability
Mild 3,013 2,912 2,870 3,001 2,983 37.2 26.9
Moderate 2,098 2,113 2,134 2,323 2,386 29.7 21.6
Severe 778 775 740 782 785 9.8 7.1
Profound 151 150 147 153 175 2.2 1.6
Not verified 1,345 1,708 1,911 1,836 1,699 21.1 15.3
Source: National Intellectual Disability Database, Health Research Board
differences by geographic location19.2% (1,538) of children registered as having an intellectual disability resided in Dublin ■
North East, 27.4% (2,199) resided in Dublin Mid-Leinster, 29.9% (2,399) resided in the South and the remaining 23.6% (1,891) resided in the West (see Table 69).

103
INTELLECTUAL DISABILITY
PA
RT
3: C
HIL
DR
EN
’S O
UT
CO
ME
STable 69: Number and percentage of children under 18 years registered as having an intellectual disability, by HSE Region and Local Health Office (LHO) Area (2009)
No. %
Total 8,028 100.0
HSE Dublin North East 1,538 19.2
Cavan/Monaghan 163 2.0
Dublin North 404 5.0
Dublin North Central 169 2.1
Dublin North West 247 3.1
Louth 303 3.8
Meath 252 3.1
HSE Dublin Mid-Leinster 2,199 27.4
Dublin South 275 3.4
Dublin South City 90 1.1
Dublin South East 81 1.0
Dublin South West 236 2.9
Dublin West 408 5.1
Kildare/West Wicklow 405 5.0
Laois/Offaly 221 2.8
Longford/Westmeath 228 2.8
Wicklow 255 3.2
HSE South 2,399 29.9
Carlow/Kilkenny 366 4.6
Kerry 293 3.6
North Cork 218 2.7
North Lee 405 5.0
South Lee 111 1.4
Tipperary SR 298 3.7
Waterford 282 3.5
West Cork 139 1.7
Wexford 287 3.6
continued

104
STATE OF THE NATION’S CHILDREN – IRELAND 2010
Table 69 (continued)
No. %
HSE West 1,891 23.6
Clare 117 1.5
Donegal 316 3.9
Galway 503 6.3
Limerick 216 2.7
Mayo 246 3.1
Roscommon 168 2.1
Sligo/Leitrim/West Cavan 208 2.6
Tipperary NR 117 1.5
Outside Ireland <5 0.0
Source: National Intellectual Disability Database, Health Research Board
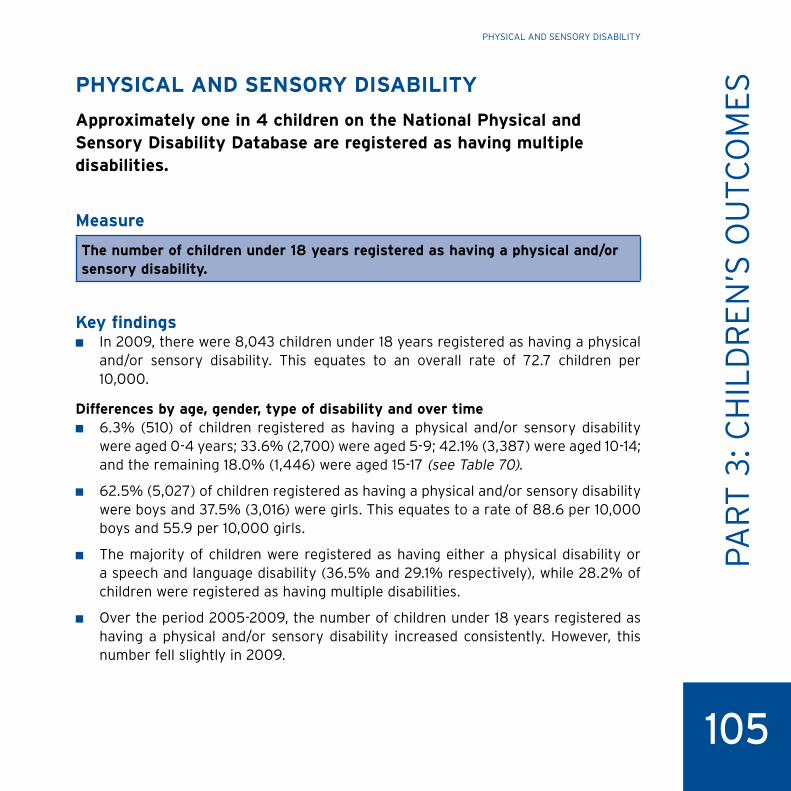
105
PHYSICAL AND SENSORY DISABILITY
PA
RT
3: C
HIL
DR
EN
’S O
UT
CO
ME
SphysicAl And sensory disABility
Approximately one in 4 children on the national physical and sensory disability database are registered as having multiple disabilities.
Measure
the number of children under 18 years registered as having a physical and/or sensory disability.
key findingsIn 2009, there were 8,043 children under 18 years registered as having a physical ■
and/or sensory disability. This equates to an overall rate of 72.7 children per 10,000.
differences by age, gender, type of disability and over time6.3% (510) of children registered as having a physical and/or sensory disability ■
were aged 0-4 years; 33.6% (2,700) were aged 5-9; 42.1% (3,387) were aged 10-14; and the remaining 18.0% (1,446) were aged 15-17 (see Table 70).
62.5% (5,027) of children registered as having a physical and/or sensory disability ■
were boys and 37.5% (3,016) were girls. This equates to a rate of 88.6 per 10,000 boys and 55.9 per 10,000 girls.
The majority of children were registered as having either a physical disability or ■
a speech and language disability (36.5% and 29.1% respectively), while 28.2% of children were registered as having multiple disabilities.
Over the period 2005-2009, the number of children under 18 years registered as ■
having a physical and/or sensory disability increased consistently. However, this number fell slightly in 2009.

106
STATE OF THE NATION’S CHILDREN – IRELAND 2010
Table 70: Number, percentage and rate (per 10,000) of children under 18 years registered as having a physical and/or sensory disability, by age, gender and type of disability (2005-2009)
2005 2006 2007 2008 2009
No. No. No. No. No. %Rate per
10,000
Total 7,039 7,807 8,373 8,546 8,043 100.0 72.7
Age
0-4 754 712 697 640 510 6.3 14.9
5-9 2,808 2,987 3,081 2,994 2,700 33.6 87.7
10-14 2,435 2,841 3,189 3,466 3,387 42.1 117.6
15-17 1,042 1,267 1,406 1,446 1,446 18.0 85.4
Gender
Boys 4,343 4,840 5,213 5,348 5,027 62.5 88.6
Girls 2,696 2,967 3,160 3,198 3,016 37.5 55.9
Type of disability
Physical 5,485 5,704 5,463 3,235 2,939 36.5 26.5
Hearing loss/deafness 450 447 425 328 287 3.6 2.6
Visual 228 245 233 213 211 2.6 1.9
Speech and language 300 533 1,121 2,538 2,339 29.1 21.1
Multiple disabilities 575 877 1,130 2,231 2,266 28.2 20.5
Refused <5 <5 <5 <5 <5 0.0 0.0
Source: National Physical and Sensory Disability Database, Health Research Board
differences by geographic location9.5% (768) of children registered as having a physical and/or sensory disability ■
resided in Dublin North East, 30.1% (2,418) resided in Dublin Mid-Leinster, 30.0% (2,412) resided in the South and the remaining 30.4% (2,445) resided in the West (see Table 71).

107
PHYSICAL AND SENSORY DISABILITY
PA
RT
3: C
HIL
DR
EN
’S O
UT
CO
ME
STable 71: Number and percentage of children under 18 years registered as having a physical and/or sensory disability, by HSE Region and Local Health Office (LHO) Area (2009)
No. %
Total 8,043 100.0
HSE Dublin North East 768 9.5
Cavan/Monaghan 145 1.8
Dublin North 117 1.5
Dublin North Central 53 0.7
Dublin North West 98 1.2
Louth 183 2.3
Meath 172 2.1
HSE Dublin Mid-Leinster 2,418 30.1
Dublin South 135 1.7
Dublin South City 148 1.8
Dublin South East 109 1.4
Dublin South West 253 3.1
Dublin West 512 6.4
Kildare/West Wicklow 370 4.6
Laois/Offaly 229 2.8
Longford/Westmeath 397 4.9
Wicklow 265 3.3
HSE South 2,412 30.0
Carlow/Kilkenny 361 4.5
Kerry 251 3.1
North Cork 170 2.1
North Lee 464 5.8
South Lee 525 6.5
Tipperary SR 194 2.4
Waterford 179 2.2
West Cork 126 1.6
Wexford 142 1.8
continued

108
STATE OF THE NATION’S CHILDREN – IRELAND 2010
Table 71 (continued)
No. %
HSE West 2,445 30.4
Clare 160 2.0
Donegal 218 2.7
Galway 626 7.8
Limerick 234 2.9
Mayo 675 8.4
Roscommon 260 3.2
Sligo/Leitrim/West Cavan 125 1.6
Tipperary NR 147 1.8
Source: National Physical and Sensory Disability Database, Health Research Board

109
CHILD WELFARE AND PROTECTION: INITIAL ASSESSMENT
PA
RT
3: C
HIL
DR
EN
’S O
UT
CO
ME
Schild welFAre And protection: initiAl AssessMent
the number of child welfare and protection reports that went to initial assessment increased by 2,844 over the period 2006-2008.
Measure
the number of child welfare and protection reports that went to initial assessment.
key findingsIn 2008, there were 15,364 child welfare and protection reports that went to initial ■
assessment.
differences by type of concern and over timeAlmost half (48.9%) of the child welfare and protection reports that went to initial ■
assessment were for welfare concerns (see Table 72).
Over the period 2006-2008, the number of child welfare and protection reports ■
that went to initial assessment has increased.
Table 72: Number and percentage of child welfare and protection reports that went to initial assessment, by type of concern (2006-2008)
2006 2007* 2008
No. No. No. %
Total 12,520 15,074 15,364 100.0
Type of concern
Welfare 6,221 7,690 7,518 48.9
Physical abuse 1,291 1,529 1,704 11.1
Sexual abuse 1,495 1,715 1,657 10.8
Emotional abuse 1,100 1,233 1,270 8.3
Neglect 2,413 2,907 3,215 20.9
* excludes Waterford Local Health Office returns.
Source: Child Care Interim Data Set, HSE

110
STATE OF THE NATION’S CHILDREN – IRELAND 2010
differences by geographic locationThe highest number and percentage of cases that went to initial ■
assessment for child welfare and protection concerns was in the Longford/ Westmeath Local Health Office (LHO) Area in the HSE Dublin Mid-Leinster Region (see Table 73).
Table 73: Number and percentage of child welfare and protection reports that went to initial assessment, by type of concern, HSE Region and Local Health Office (LHO) Area (2008)
Welfare Physical abuse
Sexual abuse
Emotional abuse
Neglect Total
No. No. No. No. No. No. %
Total 7,518 1,704 1,657 1,270 3,215 15,364 100.0
HSE Dublin North East 1,353 409 458 227 881 3,328 21.7
Cavan/Monaghan 94 29 54 25 116 318 2.1
Dublin North 379 82 135 28 135 759 4.9
Dublin North Central 214 43 67 28 142 494 3.2
Dublin North West 389 102 90 26 170 777 5.1
Louth 259 106 95 90 274 824 5.4
Meath 18 47 17 30 44 156 1.0
HSE Dublin Mid-Leinster 2,710 750 624 475 1,238 5,797 37.7
Dublin South 82 28 35 5 35 185 1.2
Dublin South City 155 42 83 5 134 419 2.7
Dublin South East 231 49 75 21 68 444 2.9
Dublin South West 466 90 111 21 172 860 5.6
Dublin West 232 147 79 24 205 687 4.5
Kildare/West Wicklow 259 67 58 22 57 463 3.0
Laois/Offaly 586 135 74 90 161 1,046 6.8
Longford/Westmeath 540 148 69 273 344 1,374 8.9
Wicklow 159 44 40 14 62 319 2.1
continued

111
CHILD WELFARE AND PROTECTION: INITIAL ASSESSMENT
PA
RT
3: C
HIL
DR
EN
’S O
UT
CO
ME
STable 73 (continued)
Welfare Physical abuse
Sexual abuse
Emotional abuse
Neglect Total
No. No. No. No. No. No. %
HSE South 1,624 288 327 274 568 3,081 20.1
Carlow/Kilkenny 126 40 30 16 62 274 1.8
Kerry 198 25 37 30 64 354 2.3
North Cork 154 13 23 20 60 270 1.8
North Lee 82 15 12 7 17 133 0.9
South Lee 21 12 0 4 15 52 0.3
Tipperary SR 445 34 41 33 164 717 4.7
Waterford 81 51 52 29 24 237 1.5
West Cork 124 15 26 27 47 239 1.6
Wexford 393 83 106 108 115 805 5.2
HSE West 1,831 257 248 294 528 3,158 20.6
Clare 301 38 53 20 105 517 3.4
Donegal 26 6 6 4 5 47 0.3
Galway 0 35 15 61 87 198 1.3
Limerick 633 66 79 25 76 879 5.7
Mayo 73 28 35 19 80 235 1.5
Roscommon 162 20 21 113 107 423 2.8
Sligo/Leitrim/West Cavan 49 18 4 8 9 88 0.6
Tipperary NR 587 46 35 44 59 771 5.0
Source: Child Care Interim Data Set, HSE

112
STATE OF THE NATION’S CHILDREN – IRELAND 2010
child welFAre And protection: conFirMed ABuse
the number of cases of confirmed child abuse has increased by 367 cases over the period 2006-2008.
Measure
the number of confirmed child abuse cases.
key findingsIn 2008, there were 2,164 confirmed cases of abuse. ■
differences by type of abuse and over timeThe majority of confirmed child abuse cases were for cases of neglect (44.6%), ■
followed by cases of physical abuse (22.0%) (see Table 74).
Over the period 2006-2008, the number of confirmed child abuse cases has ■
increased.
Table 74: Number and percentage of confirmed child abuse cases, by type of abuse (2006-2008)
2006 2007* 2008
No. No. No. %
Total 1,797 1,978 2,164 100.0
Type of abuse
Physical abuse 352 389 476 22.0
Sexual abuse 275 293 289 13.4
Emotional abuse 375 432 434 20.1
Neglect 795 864 965 44.6
* excludes Waterford Local Health Office returns.
Source: Child Care Interim Data Set, HSE

113
CHILD WELFARE AND PROTECTION: CONFIRMED ABUSE
PA
RT
3: C
HIL
DR
EN
’S O
UT
CO
ME
Sdifferences by geographic locationThe highest number and percentage of confirmed child abuse cases was in ■
the Longford/Westmeath Local Health Office (LHO) Area in the HSE Dublin Mid-Leinster Region (see Table 75).
Table 75: Number and percentage of confirmed child abuse cases, by type of abuse, HSE Region and Local Health Office (LHO) Area (2008)
Physical abuse
Sexual abuse
Emotional abuse
Neglect Total
No. No. No. No. No. %
Total 476 289 434 965 2,164 100.0
HSE Dublin North East 107 54 40 186 387 17.9
Cavan/Monaghan 0 0 0 0 0 0.0
Dublin North 47 26 16 95 184 8.5
Dublin North Central 19 8 10 14 51 2.4
Dublin North West 29 15 5 41 90 4.2
Louth 2 1 2 16 21 1.0
Meath 10 4 7 20 41 1.9
HSE Dublin Mid-Leinster 284 124 252 505 1,165 53.8
Dublin South 1 3 0 0 4 0.2
Dublin South Central 36 16 5 38 95 4.4
Dublin South East 2 2 0 3 7 0.3
Dublin South West 65 38 24 94 221 10.2
Dublin West 67 19 2 84 172 7.9
Kildare/West Wicklow 37 28 50 92 207 9.6
Laois/Offaly 15 5 4 22 46 2.1
Longford/Westmeath 57 8 165 166 396 18.3
Wicklow 4 5 2 6 17 0.8
continued

114
STATE OF THE NATION’S CHILDREN – IRELAND 2010
Table 75 (continued)
Physical abuse
Sexual abuse
Emotional abuse
Neglect Total
No. No. No. No. No. %
HSE South 35 68 29 90 222 10.3
Carlow/Kilkenny 5 8 1 7 21 1.0
Kerry 1 6 3 6 16 0.7
North Cork 1 0 0 2 3 0.1
North Lee 8 4 10 5 27 1.2
South Lee 1 0 0 0 1 0.0
Tipperary SR 3 3 3 35 44 2.0
Waterford 4 9 3 7 23 1.1
West Cork 1 8 3 9 21 1.0
Wexford 11 30 6 19 66 3.0
HSE West 50 43 113 184 390 18.0
Clare 2 3 1 15 21 1.0
Donegal 0 1 0 1 2 0.1
Galway 16 6 37 28 87 4.0
Limerick 7 8 4 27 46 2.1
Mayo 11 14 1 24 50 2.3
Roscommon 8 7 54 61 130 6.0
Sligo/Leitrim/West Cavan 0 1 7 4 12 0.6
Tipperary NR 6 3 9 24 42 1.9
Source: Child Care Interim Data Set, HSE

sociAl, eMotionAl And BehAviourAl outcoMes

116
STATE OF THE NATION’S CHILDREN – IRELAND 2010
pArticipAtion in decision-MAking
the percentage of children who report that students at their school participate in making the school rules has decreased from approximately 33% in 1998 to 23% in 2006.
Measure
the percentage of children aged 9-17 who report that students at their school participate in making the school rules.
key findingsIn 2006, 22.5% of children aged 9-17 reported that students at their school ■
participate in making the school rules.
differences by population groupsWhen compared to other children, Traveller children and children with a disability ■
and/or chronic illness were more likely to report that students in their school participate in making the school rules (see Table 76). These differences were statistically significant. There were no significant differences between immigrant and non-immigrant children. ■
Table 76: Percentage of children who report that students at their school participate in making the school rules, by population groups (2006)
%
All children 22.5
Traveller status
Traveller children 32.5
All other children 22.1
Immigrant status
Immigrant children 22.7
All other children 22.5
Disability and/or Chronic Illness status
Children with a disability and/or chronic illness 24.6
All other children 21.8
Source: HBSC Survey, Health Promotion Research Centre

117
PARTICIPATION IN DECISION-MAKING
PA
RT
3: C
HIL
DR
EN
’S O
UT
CO
ME
Sdifferences by age, gender, social class and over timeStatistically significant differences were also observed across age and social class ■
categories, with a higher percentage of younger children and a higher percentage of children in the lowest social class category reporting that students in their school participate in making the school rules (see Table 77).
There were no significant differences between boys and girls. ■
Table 77: Percentage of children who report that students at their school participate in making the school rules, by age, gender and social class (1998, 2002 and 2006)
1998 2002 2006
Total (%) Total (%) Boys (%) Girls (%) Total (%)
All children 32.5 23.5 21.9 23.1 22.5
Age
9 – – 42.3 43.6 42.9
10-11 39.5 36.0 33.2 42.5 38.7
12-14 34.2 25.6 24.6 23.6 24.1
15-17 24.7 14.6 15.9 14.0 15.0
Social class
SC 1-2 28.8 21.5 19.2 20.0 19.6
SC 3-4 33.6 23.5 21.8 22.8 22.3
SC 5-6 34.2 26.8 22.7 25.4 24.1
Source: HBSC Survey, Health Promotion Research Centre

118
STATE OF THE NATION’S CHILDREN – IRELAND 2010
differences by geographic locationChildren in the Dublin region were more likely to report that students at their ■
school participate in making the school rules (28.1%), while children in the Mid-West region were least likely to report this (17.2%) (see Table 78). These differences were statistically significant.
Table 78: Percentage of children who report that students at their school participate in making the school rules, by NUTS Region (2006)
%
All children 22.5
NUTS Region
Border 21.5
Dublin 28.1
Midlands 21.3
Mid-East 19.4
Mid-West 17.2
South-East 20.0
South-West 24.1
West 19.4
Source: HBSC Survey, Health Promotion Research Centre
international comparisonsFrom the 2006 HBSC Survey, using the ages of 11, 13, and 15 only to draw ■
international comparisons, 24.9% of children from Ireland reported that students in their school participate in making the school rules (see Figure 16). This was significantly lower than the HBSC average of 33.8%.
Among the 7 countries and regions that used this HBSC item, the lowest percentage ■
for this indicator was found among children from Ireland (24.9%) and the highest among children from Macedonia (50.3%).

119
PARTICIPATION IN DECISION-MAKING
PA
RT
3: C
HIL
DR
EN
’S O
UT
CO
ME
SFigure 16: percentage of children who report that students at their school participate in making the school rules, by country (2006)
% of children
0 10 20 30 40 50 60
Ireland
Belgium (Flemish)
Romania
Italy
Canada
HBSC Average
United Kingdom
Macedonia 50.3
38.1
33.8
31.3
28.8
28.0
27.6
24.9
Source: HBSC Survey, Health Promotion Research Centre

120
STATE OF THE NATION’S CHILDREN – IRELAND 2010
reAding As A leisure Activity
Approximately one-third of 15-year-old children report that reading is one of their favourite hobbies.
Measure
the percentage of children aged 15 who report that reading is one of their favourite hobbies.
key findingsIn 2009, 31.7% of children aged 15 reported that reading was one of their favourite ■
hobbies.
differences by population groupsWhen compared to other children, Traveller children were less likely to report that ■
reading was one of their favourite hobbies (see Table 79). This difference was statistically significant.
There was no significant difference between immigrant and non-immigrant ■
children.
Table 79: Percentage of children aged 15 who report that reading is one of their favourite hobbies, by population groups (2009)
%
All children 31.7
Traveller status
Traveller children 19.9
All other children 32.0
Immigrant status
Immigrant children 43.7
All other children 31.1
Source: PISA Survey, Education Research Centre

121
READING AS A LEISURE ACTIVITY
PA
RT
3: C
HIL
DR
EN
’S O
UT
CO
ME
Sdifferences by gender, social class and over timeThe percentage of girls (40.2%) who reported that reading was one of their ■
favourite hobbies was significantly higher than the corresponding percentage of boys (23.4%) (see Table 80).
Children in the lowest social class category (25.3%) were significantly less likely to ■
report that reading was one of their favourite hobbies when compared to children in the highest and medium social class categories (39.2% and 31.7% respectively).
In 2009, the percentage of children (31.7%) who reported that reading was one of ■
their favourite hobbies was significantly lower than the corresponding percentages in 2006 (42.6%) and 2000 (35.7%).
Table 80: Percentage of children aged 15 who report that reading is one of their favourite hobbies, by gender and social class (2000, 2006 and 2009)
2000 2006 2009
All children 35.7 42.6 31.7
Gender
Boys 22.9 32.7 23.4
Girls 48.2 52.0 40.2
Social class
High SES 40.7 50.0 39.2
Medium SES 35.0 41.8 31.7
Low SES 30.8 36.5 25.3
Source: PISA Survey, Education Research Centre

122
STATE OF THE NATION’S CHILDREN – IRELAND 2010
sMoking cigArettes
daily cigarette smoking is significantly higher among traveller children.
Measure
the percentage of children aged 9-17 who report smoking cigarettes every day.
key findingsIn 2006, 8.5% of children aged 9-17 reported smoking cigarettes every day. ■
differences by population groupsWhen compared to other children, Traveller children were more likely to report that ■
they smoked cigarettes every day (see Table 81). This difference was statistically significant.
There were no significant differences between immigrant and non-immigrant children ■
or between children with and children without a disability and/or chronic illness.
Table 81: Percentage of children who report smoking cigarettes every day, by population groups (2006)
%
All children 8.5
Traveller status
Traveller children 16.0
All other children 8.5
Immigrant status
Immigrant children 9.5
All other children 8.5
Disability and/or Chronic Illness status
Children with a disability and/or chronic illness 9.0
All other children 8.4
Source: HBSC Survey, Health Promotion Research Centre

123
SMOKING CIGARETTES
PA
RT
3: C
HIL
DR
EN
’S O
UT
CO
ME
Sdifferences by age, gender, social class and over timeStatistically significant differences were also observed across age and social class ■
categories, with a higher percentage of older children and a higher percentage of children in the lowest social class category reporting to smoke cigarettes every day (see Table 82).
There were no significant differences between boys and girls. ■
Table 82: Percentage of children who report smoking cigarettes every day, by age, gender and social class (1998, 2002 and 2006)
1998 2002 2006
Total (%) Total (%) Boys (%) Girls (%) Total (%)
All children 9.7 10.0 8.3 8.8 8.5
Age
9 – – 0.3 0.1 0.2
10-11 0.5 0.4 1.1 0.3 0.6
12-14 7.3 5.7 4.6 4.7 4.6
15-17 19.7 19.7 14.4 17.0 15.6
Social class
SC 1-2 8.2 7.2 5.9 7.2 6.5
SC 3-4 9.4 9.5 7.7 9.3 8.5
SC 5-6 9.7 10.4 7.9 8.3 8.1
Source: HBSC Survey, Health Promotion Research Centre
differences by geographic locationChildren in the Midlands region were more likely to report smoking cigarettes every ■
day (14.3%), while children in the South-West were least likely to report this (6.3%) (see Table 83). These differences were statistically significant.

124
STATE OF THE NATION’S CHILDREN – IRELAND 2010
Table 83: Percentage of children who report smoking cigarettes every day, by NUTS Region (2006)
%
All children 8.5
NUTS Region
Border 6.8
Dublin 9.8
Midlands 14.3
Mid-East 9.2
Mid-West 7.8
South-East 8.5
South-West 6.3
West 9.1
Source: HBSC Survey, Health Promotion Research Centre
international comparisonsFrom the 2006 HBSC Survey, using the ages of 11, 13 and 15 only to draw international ■
comparisons, 6.5% of children from Ireland reported smoking cigarettes every day (see Figure 17). This was significantly higher than the HBSC average of 5.8%.
Among all 40 countries and regions that used this HBSC item, the lowest ■
percentage for this indicator was found among children from Sweden (2.2%) and the highest among children from Greenland (14.2%). Overall, children from Ireland ranked 17th.

125
SMOKING CIGARETTES
PA
RT
3: C
HIL
DR
EN
’S O
UT
CO
ME
SFigure 17: percentage of children who report smoking cigarettes every day, by country (2006)
2.2
2.6
2.6
3.0
3.1
3.1
3.5
3.7
3.7
3.9
4.5
4.5
4.8
4.8
5.2
5.2
5.3
5.3
5.3
5.4
5.5
5.7
5.8
6.3
6.5
6.7
6.7
6.7
6.8
7.1
7.3
7.3
7.4
7.4
7.5
7.7
8.6
8.8
10.7
10.9
14.2
0 2 4 6 8 10 12 14 16
Sweden
Iceland
USA
Canada
Israel
Norway
Portugal
Denmark
Macedonia
Switzerland
Spain
Slovenia
Belgium (French)
Romania
Belgium (Flemish)
England
France
Greece
Slovakia
Netherlands
Malta
Italy
HBSC Average
Poland
Ireland
Germany
Finland
Wales
Luxembourg
Scotland
Czech Republic
Lithuania
Croatia
Hungary
Austria
Estonia
Latvia
Ukraine
Russia
Bulgaria
Greenland
% of children
Source: HBSC Survey, Health Promotion Research Centre

126
STATE OF THE NATION’S CHILDREN – IRELAND 2010
Alcohol use
immigrant children are less likely to report to have been drunk at least once in the last 30 days.
Measure
the percentage of children aged 10-17 who report to have been drunk at least once in the last 30 days.
key findingsIn 2006, 20.4% of children aged 10-17 reported that they had been drunk at least ■
once in the last 30 days.
differences by population groupsWhen compared to other children, Traveller children were more likely and immigrant ■
children less likely to report being drunk at least once in the last 30 days (see Table 84). These differences were statistically significant.
There were no significant differences between children with and children without a ■
disability and/or chronic illness.
Table 84: Percentage of children who report to have been drunk at least once in the last 30 days, by population groups (2006)
%
All children 20.4
Traveller status
Traveller children 27.9
All other children 20.5
Immigrant status
Immigrant children 14.8
All other children 20.7
Disability and/or Chronic Illness status
Children with a disability and/or chronic illness 20.2
All other children 20.4
Source: HBSC Survey, Health Promotion Research Centre
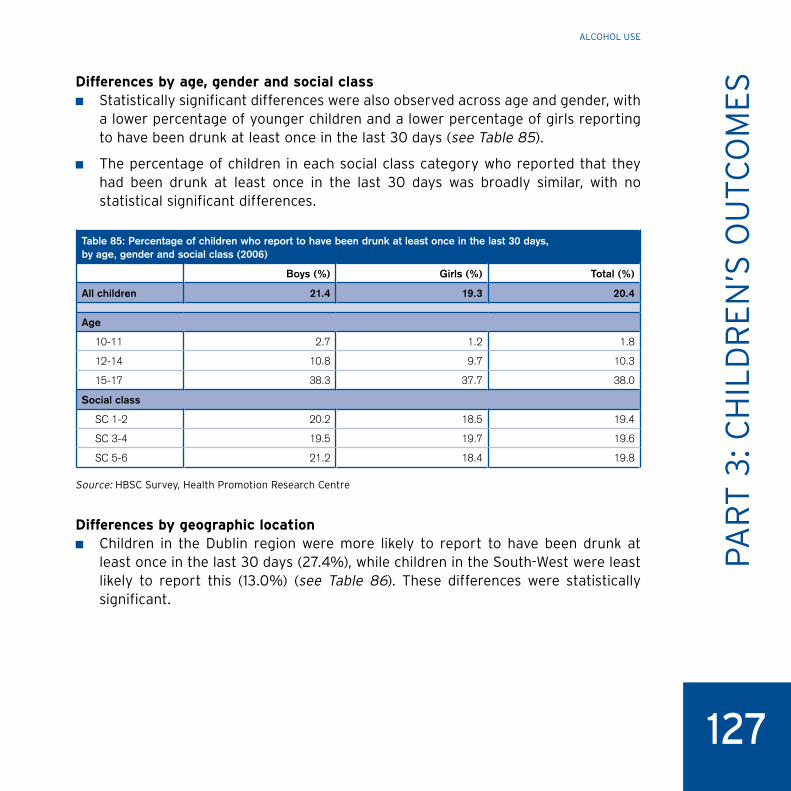
127
ALCOHOL USE
PA
RT
3: C
HIL
DR
EN
’S O
UT
CO
ME
Sdifferences by age, gender and social classStatistically significant differences were also observed across age and gender, with ■
a lower percentage of younger children and a lower percentage of girls reporting to have been drunk at least once in the last 30 days (see Table 85).
The percentage of children in each social class category who reported that they ■
had been drunk at least once in the last 30 days was broadly similar, with no statistical significant differences.
Table 85: Percentage of children who report to have been drunk at least once in the last 30 days, by age, gender and social class (2006)
Boys (%) Girls (%) Total (%)
All children 21.4 19.3 20.4
Age
10-11 2.7 1.2 1.8
12-14 10.8 9.7 10.3
15-17 38.3 37.7 38.0
Social class
SC 1-2 20.2 18.5 19.4
SC 3-4 19.5 19.7 19.6
SC 5-6 21.2 18.4 19.8
Source: HBSC Survey, Health Promotion Research Centre
differences by geographic locationChildren in the Dublin region were more likely to report to have been drunk at ■
least once in the last 30 days (27.4%), while children in the South-West were least likely to report this (13.0%) (see Table 86). These differences were statistically significant.

128
STATE OF THE NATION’S CHILDREN – IRELAND 2010
Table 86: Percentage of children who report to have been drunk at least once in the last 30 days, by NUTS Region (2006)
%
All children 20.4
NUTS Region
Border 17.8
Dublin 27.4
Midlands 26.2
Mid-East 19.3
Mid-West 18.0
South-East 22.0
South-West 13.0
West 19.3
Source: HBSC Survey, Health Promotion Research Centre
international comparisonsFrom the 2006 HBSC Survey, using only those in the 15-year-old age group to draw ■
international comparisons, 29.0% of children from Ireland reported that they had been drunk at least once in the last 30 days (see Figure 18). This was significantly higher than the HBSC average of 21.7%.
Among the 9 countries and regions that used this HBSC item, the lowest percentage ■
for this indicator was found among children from Poland (15.7%) and the highest among children from Austria (30.6%). Overall, children from Ireland ranked 2nd.

129
ALCOHOL USE
PA
RT
3: C
HIL
DR
EN
’S O
UT
CO
ME
SFigure 18: percentage of children aged 15 who report to have been drunk at least once in the last 30 days, by country (2006)
% of children
0 5 10 15 20
30.6
29.0
27.1
24.7
23.1
21.7
17.7
16.9
16.6
15.7
25 30 35
Poland
France
Luxembourg
Switzerland
HBSC Average
Malta
Iceland
USA
Ireland
Austria
Source: HBSC Survey, Health Promotion Research Centre

130
STATE OF THE NATION’S CHILDREN – IRELAND 2010
cAnnABis use
lifetime cannabis use is significantly higher among boys and traveller children.
Measure
the percentage of children aged 10-17 who report to have taken cannabis at least once in their lifetime.
key findingsIn 2006, 15.7% of children aged 10-17 reported that they had taken cannabis at ■
least once in their lifetime.
differences by population groupsWhen compared to other children, Traveller children were more likely to report ■
that they had taken cannabis at least once in their lifetime (see Table 87). This difference was statistically significant.
There were no significant differences between immigrant and non-immigrant children ■
or between children with and children without a disability and/or chronic illness.
Table 87: Percentage of children who report to have taken cannabis at least once in their lifetime, by population groups (2006)
%
All children 15.7
Traveller status
Traveller children 20.7
All other children 15.8
Immigrant status
Immigrant children 15.5
All other children 15.7
Disability and/or Chronic Illness status
Children with a disability and/or chronic illness 16.2
All other children 15.6
Source: HBSC Survey, Health Promotion Research Centre

131
CANNABIS USE
PA
RT
3: C
HIL
DR
EN
’S O
UT
CO
ME
Sdifferences by age, gender, social class and over timeStatistically significant differences were also observed across age and gender, with ■
a lower percentage of younger children and a lower percentage of girls reporting to have taken cannabis at least once in their lifetime (see Table 88).
The percentage of children in each social class category who reported to have ■
taken cannabis at least once in their lifetime was broadly similar, with no statistical significant differences.
Table 88: Percentage of children who report to have taken cannabis at least once in their lifetime, by age, gender and social class (2002 and 2006)
2002 2006
Total (%) Boys (%) Girls (%) Total (%)
All children 12.1 18.1 13.2 15.7
Age
10-11 0.8 1.5 0.1 0.7
12-14 5.2 10.1 6.4 8.3
15-17 25.9 31.3 26.4 29.0
Social class
SC 1-2 11.3 16.6 12.1 14.5
SC 3-4 12.2 16.8 13.6 15.2
SC 5-6 13.4 17.5 13.1 15.2
Source: HBSC Survey, Health Promotion Research Centre
differences by geographic locationChildren in the Dublin region were more likely to report to have taken cannabis at ■
least once in their lifetime (20.3%), while children in the South-West were least likely to report this (11.9%) (see Table 89). These differences were statistically significant.

132
STATE OF THE NATION’S CHILDREN – IRELAND 2010
Table 89: Percentage of children who report to have taken cannabis at least once in their lifetime, by NUTS Region (2006)
%
All children 15.7
NUTS Region
Border 12.9
Dublin 20.3
Midlands 19.5
Mid-East 16.7
Mid-West 16.1
South-East 15.9
South-West 11.9
West 13.5
Source: HBSC Survey, Health Promotion Research Centre
international comparisonsFrom the 2006 HBSC Survey, using only those in the 15-year-old age group to draw ■
international comparisons, 23.5% of children from Ireland reported having ever used cannabis in their lifetime (see Figure 19). This was significantly higher than the HBSC average of 18.0%.
Among all 39 countries and regions that used this HBSC item, the lowest percentage ■
for this indicator was found among children from Romania (3.5%) and the highest among children from Canada (34.5%). Overall, children from Ireland ranked 12th.

133
CANNABIS USE
PA
RT
3: C
HIL
DR
EN
’S O
UT
CO
ME
SFigure 19: percentage of children aged 15 who report to have taken cannabis at least once in their lifetime, by country (2006)
15.0
15.0
14.0
13.0
12.5
12.0
10.0
9.5
7.5
4.5
4.5
4.0
3.5
3.5
0 5 10 15 20 25 30 35 40
Romania
Macedonia
Greece
Israel
Sweden
Finland
Portugal
Iceland
Hungary
Malta
Austria
Croatia
Lithuania
Russia
Germany
Ukraine
Denmark
Slovakia
Slovenia
HBSC Average
Poland
Bulgaria
Greenland
Belgium (Flemish)
Italy
Latvia
Luxembourg
Belgium (French)
Ireland
Netherlands
Czech Republic
England
Estonia
France
Scotland
Spain
USA
Wales
Switzerland
Canada
% of children
34.5
32.0
31.0
31.0
31.0
28.0
27.0
25.0
24.5
24.5
24.0
23.5
23.5
23.0
22.0
21.0
21.0
19.5
19.0
18.5
18.0
17.5
17.5
16.5
16.0
16.0
Source: HBSC Survey, Health Promotion Research Centre

134
STATE OF THE NATION’S CHILDREN – IRELAND 2010
seXuAl heAlth And BehAviour
in 2009, 564 babies were born to teenage girls.
Measure
the number of births to mothers aged 10-17.
key findingsIn 2009, there were 564 births to mothers aged 10-17 ( ■ see Table 90).
Table 90: Number and rate (per 100,000) of births, by mothers’ age (2005-2009)
2005 2006 2007 2008 2009
No. Rate No. Rate No. Rate No. Rate No. Rate
Total (all ages)
61,372 5,659 65,425 5,882 71,389 6,245 75,065 6,461 74,278 6,398
Age
15-17* 612 724 564 674 624 736 610 724 564 684
18-24 9,547 4,189 10,169 4,459 10,800 4,724 11,108 4,971 10,392 4,938
25+ 51,127 6,622 54,660 6,827 59,946 7,224 63,323 7,413 63,289 7,291
Not stated 86 – 32 – 19 – 24 – 33 –
* The number of births to mothers aged 15-17 includes a small number to mothers aged 10-14 years. There were 5 babies born to mothers in the 10-14 age group in 2009.
Source: Vital Statistics and Census Population Estimates, CSO

135
SEXUAL HEALTH AND BEHAVIOUR
PA
RT
3: C
HIL
DR
EN
’S O
UT
CO
ME
Sdifferences over timeOver the period 2005-2009, the number of births to mothers aged 10-17 has ■
decreased, from 612 in 2005 to 564 in 2009 (see Figure 20).
Figure 20: number of births to mothers aged 10-17 (2005-2009)
564
610624
564
612
20092008200720062005
No.
of
bir
ths
0
100
200
300
400
500
600
700
Year
Source: Vital Statistics and Census Population Estimates, CSO

136
STATE OF THE NATION’S CHILDREN – IRELAND 2010
differences by geographic locationLouth had the highest proportion of births to mothers aged 10-17 ( ■ see Table 91).
Table 91: Number and percentage of births to mothers aged 10-17, by county (2009)
No. of births to 10-17 year-olds
No. of births to all ages
Births to 10-17 year-olds as % of all births
State 564 74,278 0.8
County
Carlow 12 976 1.2
Clare 12 1,889 0.6
Cork 39 8,477 0.5
Donegal 27 2,284 1.2
Dublin 195 20,607 0.9
Galway 18 3,974 0.5
Kildare 29 3,942 0.7
Kilkenny 12 1,392 0.9
Laois 16 1,368 1.2
Limerick 29 3,121 0.9
Louth 27 1,858 1.5
Mayo 11 1,854 0.6
Meath 19 3,474 0.5
Monaghan 4 790 0.5
Offaly 5 1,229 0.4
Sligo 6 944 0.6
Tipperary 16 2,552 0.6
Waterford 12 1,878 0.6
Westmeath 11 1,390 0.8
Wexford 23 2,385 1.0
Wicklow 12 2,435 0.5
Other counties 29 5,459 0.5
Source: Vital Statistics, CSO

137
SELF-ESTEEM
PA
RT
3: C
HIL
DR
EN
’S O
UT
CO
ME
SselF-esteeM
Approximately 4 in 10 girls aged 15-17 report feeling happy with the way they are.
Measure
the percentage of children aged 9-17 who report feeling happy with the way they are.
key findingsIn 2006, 58.2% of children aged 9-17 reported feeling happy with the way they ■
are.
differences by population groupsWhen compared to other children, immigrant children and children with a disability ■
and/or chronic illness were less likely to report feeling happy with the way they are (see Table 92). These differences were statistically significant.
There were no significant differences between Traveller and non-Traveller children. ■
Table 92: Percentage of children who report feeling happy with the way they are, by population groups (2006)
%
All children 58.2
Traveller status
Traveller children 56.6
All other children 58.1
Immigrant status
Immigrant children 53.7
All other children 58.4
Disability and/or Chronic Illness status
Children with a disability and/or chronic illness 54.2
All other children 59.1
Source: HBSC Survey, Health Promotion Research Centre

138
STATE OF THE NATION’S CHILDREN – IRELAND 2010
differences by age, gender and social classStatistically significant differences were also observed across age and gender, with ■
a lower percentage of older children and a lower percentage of girls reporting to feel happy with the way they are (see Table 93).
The percentage of children in each social class category who reported feeling ■
happy with the way they are was broadly similar, with no statistical significant differences.
Table 93: Percentage of children who report feeling happy with the way they are, by age, gender and social class (2006)
Boys (%) Girls (%) Total (%)
All children 62.9 53.1 58.2
Age
9 77.8 78.8 78.3
10-11 74.6 74.5 74.6
12-14 65.3 56.4 61.1
15-17 57.4 40.2 49.3
Social class
SC 1-2 63.1 51.8 57.2
SC 3-4 63.2 53.1 58.2
SC 5-6 63.6 55.2 59.2
Source: HBSC Survey, Health Promotion Research Centre
differences by geographic locationChildren in the South-West region were more likely to report feeling happy with the ■
way they are (61.3%), while children in the Mid-West were least likely to report this (54.0%) (see Table 94). These differences were statistically significant.

139
SELF-ESTEEM
PA
RT
3: C
HIL
DR
EN
’S O
UT
CO
ME
STable 94: Percentage of children who report feeling happy with the way they are, by NUTS Region (2006)
%
All children 58.2
NUTS Region
Border 60.0
Dublin 58.0
Midlands 57.1
Mid-East 58.0
Mid-West 54.0
South-East 58.3
South-West 61.3
West 55.4
Source: HBSC Survey, Health Promotion Research Centre

140
STATE OF THE NATION’S CHILDREN – IRELAND 2010
selF-reported hAppiness
self-reported happiness levels are significantly lower among traveller children, immigrant children and children with a disability and/or chronic illness.
Measure
the percentage of children aged 9-17 who report being happy with their lives at present.
key findingsIn 2006, 90.8% of children aged 9-17 reported being happy with their lives at present. ■
differences by population groupsThe percentages of Traveller children, immigrant children and children with ■
a disability and/or chronic illness who reported being happy with their lives at present were significantly lower than the corresponding percentages of non-Traveller children, non-immigrant children and children without a disability and/or chronic illness (see Table 95).
Table 95: Percentage of children who report being happy with their lives at present, by population groups (2006)
%
All children 90.8
Traveller status
Traveller children 86.1
All other children 90.9
Immigrant status
Immigrant children 87.3
All other children 91.0
Disability and/or Chronic Illness status
Children with a disability and/or chronic illness 87.6
All other children 91.6
Source: HBSC Survey, Health Promotion Research Centre

141
SELF-REPORTED HAPPINESS
PA
RT
3: C
HIL
DR
EN
’S O
UT
CO
ME
Sdifferences by age, gender, social class and over timeStatistically significant differences were also observed across age and gender, with ■
a lower percentage of older children and a lower percentage of girls reporting to be happy with their lives at present (see Table 96).
The percentage of children in each social class category who reported being ■
happy with their lives at present was broadly similar, with no statistical significant differences.
Table 96: Percentage of children who report being happy with their lives at present, by age, gender and social class (1998, 2002 and 2006)
1998 2002 2006
Total (%) Total (%) Boys (%) Girls (%) Total (%)
All children 88.6 89.5 92.4 89.1 90.8
Age
9 – – 95.0 96.0 95.5
10-11 93.3 94.8 95.0 95.6 95.4
12-14 89.6 90.1 92.6 90.4 91.5
15-17 84.0 86.5 91.7 85.0 88.5
Social class
SC 1-2 87.3 91.4 94.2 89.2 91.8
SC 3-4 89.3 90.1 93.0 89.7 91.4
SC 5-6 89.8 89.9 91.4 90.7 91.0
Source: HBSC Survey, Health Promotion Research Centre

142
STATE OF THE NATION’S CHILDREN – IRELAND 2010
differences by geographic locationChildren in the South-East region were more likely to report being happy with their ■
lives at present (92.2%), while children in the Midlands were least likely to report this (87.4%) (see Table 97). These differences were statistically significant.
Table 97: Percentage of children who report being happy with their lives at present, by NUTS Region (2006)
%
All children 90.8
NUTS Region
Border 91.9
Dublin 90.2
Midlands 87.4
Mid-East 90.6
Mid-West 91.5
South-East 92.2
South-West 91.2
West 89.7
Source: HBSC Survey, Health Promotion Research Centre

143
YOUTH SUICIDE
PA
RT
3: C
HIL
DR
EN
’S O
UT
CO
ME
Syouth suicide
in 2009, 21 young children took their own lives.
Measure
the number of suicides of children aged 10-17.
key findingsIn 2009, there were 21 suicides of children aged 10-17. ■
differences by gender and over timeThe number and rate (per 100,000) of suicides was higher among boys ( ■ see Table 98).
Over the period 2005-2009, the rate of suicides of boys has risen slightly, from 14 ■
per 100,000 in 2005 to 15 per 100,000 in 2009. Over the same period, the rate of suicides of girls aged 15-17 has doubled, from 5 per 100,000 in 2005 to 10 per 100,000 in 2009.
Table 98: Number and rate (per 100,000) of suicides, by age and gender (2005-2009)
Year
15-17 years 18-24 years All ages
Boys Girls Men Women Total
No. Rate No. Rate No. Rate No. Rate No. Rate
2005 12 14 4 5 72 31 17 7 481 12
2006 14 16 4 5 77 33 14 6 460 11
2007 11 12 5 6 72 31 11 5 458 11
2008 16 18 8 10 63 28 13 6 424 10
2009 13 15 8 10 60 29 13 6 527 12
Source: Vital Statistics, CSO

144
STATE OF THE NATION’S CHILDREN – IRELAND 2010
Overall, suicide accounted for 23.1% of all deaths of children aged 10-17 ■
(see Table 99).
Table 99: Suicides as a percentage of total deaths of children aged 10-17, by gender (2005-2009)
2005 2006 2007 2008 2009
Total 15.5 17.7 14.3 23.8 23.1
Gender
Boys 17.9 23.2 14.5 21.9 21.7
Girls 11.1 10.0 13.9 28.6 25.8
Source: Vital Statistics, CSO

145
PHYSICAL ACTIVITY
PA
RT
3: C
HIL
DR
EN
’S O
UT
CO
ME
SphysicAl Activity
children in ireland have the highest levels of physical activity among 41 oecd countries.
Measure
the percentage of children aged 9-17 who report being physically active for at least 60 minutes per day on more than 4 days per week.
key findingsIn 2006, 54.8% of children aged 9-17 reported being physically active for at least ■
60 minutes per day for more than 4 days per week.
differences by population groupsWhen compared to other children, immigrant children were less likely to report ■
being physically active for at least 60 minutes per day on more than 4 days per week (see Table 100). This difference was statistically significant.
There were no significant differences between Traveller and non-Traveller children ■
or between children with and children without a disability and/or chronic illness.
Table 100: Percentage of children who report being physically active for at least 60 minutes per day on more than 4 days per week, by population groups (2006)
%
All children 54.8
Traveller status
Traveller children 56.5
All other children 54.6
Immigrant status
Immigrant children 50.1
All other children 55.1
Disability and/or Chronic Illness status
Children with a disability and/or chronic illness 54.9
All other children 54.7
Source: HBSC Survey, Health Promotion Research Centre

146
STATE OF THE NATION’S CHILDREN – IRELAND 2010
differences by age, gender, social class and over timeStatistically significant differences were also observed across age and gender, with ■
a lower percentage of older children and a lower percentage of girls reporting being physically active for at least 60 minutes per day on more than 4 days per week (see Table 101).
The percentage of children in each social class category who reported being ■
physically active for at least 60 minutes per day on more than 4 days per week was broadly similar, with no statistical significant differences.
Table 101: Percentage of children who report being physically active for at least 60 minutes per day on more than 4 days per week, by age, gender and social class (2002 and 2006)
2002 2006
Total (%) Boys (%) Girls (%) Total (%)
All children 47.4 63.4 45.9 54.8
Age
9 – 80.6 78.4 79.5
10-11 59.8 80.8 71.0 75.1
12-14 51.1 69.6 52.6 61.5
15-17 37.7 51.6 26.8 39.9
Social class
SC 1-2 48.6 63.7 46.1 55.2
SC 3-4 48.0 64.1 44.1 54.3
SC 5-6 46.1 63.7 47.6 55.3
Source: HBSC Survey, Health Promotion Research Centre
differences by geographic locationChildren in the Mid-East region were more likely to report being physically active ■
for at least 60 minutes per day on more than 4 days per week (58.4%), while children in the Border region were least likely to report this (50.4%) (see Table 102). These differences were statistically significant.

147
PHYSICAL ACTIVITY
PA
RT
3: C
HIL
DR
EN
’S O
UT
CO
ME
STable 102: Percentage of children who report being physically active for at least 60 minutes per day on more than 4 days per week, by NUTS Region (2006)
%
All children 54.8
NUTS Region
Border 50.4
Dublin 56.1
Midlands 53.5
Mid-East 58.4
Mid-West 52.6
South-East 58.0
South-West 53.9
West 50.7
Source: HBSC Survey, Health Promotion Research Centre
international comparisonsFrom the 2006 HBSC Survey, using the ages of 11, 13 and 15 only to draw international ■
comparisons, 59.2% of children from Ireland reported being physically active for at least 60 minutes per day on more than 4 days per week (see Figure 21). This was significantly higher than the HBSC average of 42.6%.
Among all 41 countries and regions that used this HBSC item, the lowest percentage ■
for this indicator was found among children from Russia (28.6%) and the highest among children from Ireland (59.2%). Overall, children from Ireland ranked 1st.

148
STATE OF THE NATION’S CHILDREN – IRELAND 2010
Figure 21: percentage of children who report being physically active for at least 60 minutes per day on more than 4 days per week, by country (2006)
Source: HBSC Survey, Health Promotion Research Centre
29.5
28.8
28.6
0 10 20 30 40 50 60
Russia
Israel
Portugal
Romania
France
Greece
Malta
Italy
Switzerland
Belgium (Flemish)
Luxembourg
Turkey
Spain
Estonia
Slovenia
Hungary
Germany
Lithuania
Poland
HBSC Average
Norway
Sweden
Macedonia
Greenland
Austria
Ukraine
Czech Republic
Bulgaria
England
Belgium (French)
Latvia
Scotland
Wales
Croatia
Iceland
Netherlands
Denmark
USA
Finland
Canada
Slovakia
Ireland 59.2
% of children
58.3
54.6
54.2
53.5
52.4
51.0
49.1
48.9
47.8
46.3
45.7
47.6
45.6
45.1
45.0
44.8
44.7
44.0
43.9
42.9
42.9
42.6
41.3
41.1
40.3
40.0
39.7
39.5
38.2
37.9
37.4
36.6
35.6
35.3
35.2
35.1
33.4
31.4

149
EATING HABITS
PA
RT
3: C
HIL
DR
EN
’S O
UT
CO
ME
SeAting hABits
Boys and younger children are more likely to eat breakfast on 5 or more days per week.
Measure
the percentage of children aged 9-17 who report eating breakfast on 5 or more days per week.
key findingsIn 2006, 76.0% of children aged 9-17 reported eating breakfast on 5 or more days ■
per week.
differences by population groupsThe percentages of Traveller children, immigrant children and children with a ■
disability and/or chronic illness who reported eating breakfast on 5 or more days per week were significantly lower than the corresponding percentages of non-Traveller children, non-immigrant children and children without a disability and/or chronic illness (see Table 103).
Table 103: Percentage of children who report to eat breakfast on 5 or more days per week, by population groups (2006)
%
All children 76.0
Traveller status
Traveller children 64.7
All other children 77.3
Immigrant status
Immigrant children 71.7
All other children 77.4
Disability and/or Chronic Illness status
Children with a disability and/or chronic illness 74.8
All other children 77.7
Source: HBSC Survey, Health Promotion Research Centre

150
STATE OF THE NATION’S CHILDREN – IRELAND 2010
differences by age, gender, social class and over timeStatistically significant differences were also observed across age, gender and ■
social class categories, with a higher percentage of boys, younger children and children in the higher social class category reporting to eat breakfast on 5 days or more per week (see Table 104).
Table 104: Percentage of children who report to eat breakfast on 5 or more days per week, by age, gender and social class (2002 and 2006)
2002 2006
Total (%) Boys (%) Girls (%) Total (%)
All children 77.3 79.1 72.9 76.0
Age
9 – 85.6 88.3 87.0
10-11 87.4 83.4 83.0 83.2
12-14 78.9 81.8 75.2 78.6
15-17 70.9 75.2 66.3 71.0
Social class
SC 1-2 81.5 83.2 78.4 80.9
SC 3-4 75.3 79.7 71.1 75.7
SC 5-6 77.7 77.6 71.7 74.5
Source: HBSC Survey, Health Promotion Research Centre
differences by geographic locationChildren in the West region were more likely to report eating breakfast on 5 or ■
more days per week (78.8%), while children in the Midlands were least likely to report this (70.1%) (see Table 105). These differences were statistically significant.

151
EATING HABITS
PA
RT
3: C
HIL
DR
EN
’S O
UT
CO
ME
STable 105: Percentage of children who report to eat breakfast on 5 or more days per week, by NUTS Region (2006)
%
All children 76.0
NUTS Region
Border 77.7
Dublin 73.5
Midlands 70.1
Mid-East 74.6
Mid-West 77.5
South-East 76.0
South-West 77.2
West 78.8
Source: HBSC Survey, Health Promotion Research Centre
international comparisonsFrom the 2006 HBSC Survey, using the ages of 11, 13 and 15 only to draw international ■
comparisons, 78.2% of children from Ireland reported eating breakfast on 5 or more days per week (see Figure 22). This was significantly higher than the HBSC average of 72.2%.
Among all 39 countries and regions that used this HBSC item, the lowest percentage ■
for this indicator was found among Greek children (51.5%) and the highest among children from Portugal (87.8%). Overall, children from Ireland ranked 10th.

152
STATE OF THE NATION’S CHILDREN – IRELAND 2010
Figure 22: percentage of children who report to eat breakfast on 5 or more days per week, by country (2006)
0 10 20 30 40 50 60 70 80 90 100
Greece
Malta
Israel
Slovenia
Romania
Czech Republic
Hungary
USA
Slovakia
Switzerland
Greenland
Luxembourg
Wales
Russia
Scotland
Germany
Turkey
Croatia
HBSC Average
Lithuania
Canada
Belgium (French)
England
Poland
Macedonia
Bulgaria
Latvia
Estonia
France
Ukraine
Ireland
Finland
Iceland
Spain
Norway
Belgium (Flemish)
Denmark
Sweden
Netherlands
Portugal 87.8
% of children
86.3
84.9
83.4
81.5
80.9
80.3
80.2
78.7
78.2
76.3
76.3
76.3
76.2
75.5
74.4
74.1
74.0
73.5
72.9
72.6
72.2
72.1
71.7
71.2
71.0
70.6
68.6
68.3
67.0
63.9
61.2
60.6
60.2
57.8
56.0
53.5
53.4
53.3
51.5
Source: HBSC Survey, Health Promotion Research Centre

153
PART 3: CHILDREN’S OUTCOMES
PA
RT
3: C
HIL
DR
EN
’S O
UT
CO
ME
S
PART 4: FORMAL AND INFORMAL SUPPORTS

154
STATE OF THE NATION’S CHILDREN – IRELAND 2010
puBlic eXpenditure on educAtion
since 2002, ireland’s expenditure on education has increased.
Measure
public expenditure on education
key findingsIn 2007, public expenditure on education in Ireland represented 5.7% of Gross ■
National Income (GNI), higher than the EU-27 average of 5% of Gross Domestic Product (GDP).
differences over timePublic expenditure on education in Ireland decreased from 4.8% of GDP in 1998 to ■
4.3% of GDP in 2002, before rising to 4.9% in 2007 (see Figure 23).

155
PUBLIC EXPENDITURE ON EDUCATION
PA
RT
4: F
OR
MA
L A
ND
IN
FOR
MA
L S
UP
PO
RT
SFigure 23: public expenditure on education in ireland and in eu-27 (1998-2007)
0%
1%
2%
3%
4%
5%
6%
1998 1999 2000 2001 2002 2003 2004 2005 2006 2007
EU-27 % of GDP Ireland % of GDP
Year
Ireland % of GNI
Source: Department of Education and Skills; Eurostat
differences by geographic locationIn 2006, expenditure on education in Ireland as a percentage of GDP was 4.7%, ■
just below the EU average of 5% (see Table 106). However, when expressed as a percentage of GNI, the figure for Ireland rises to 5.4%.
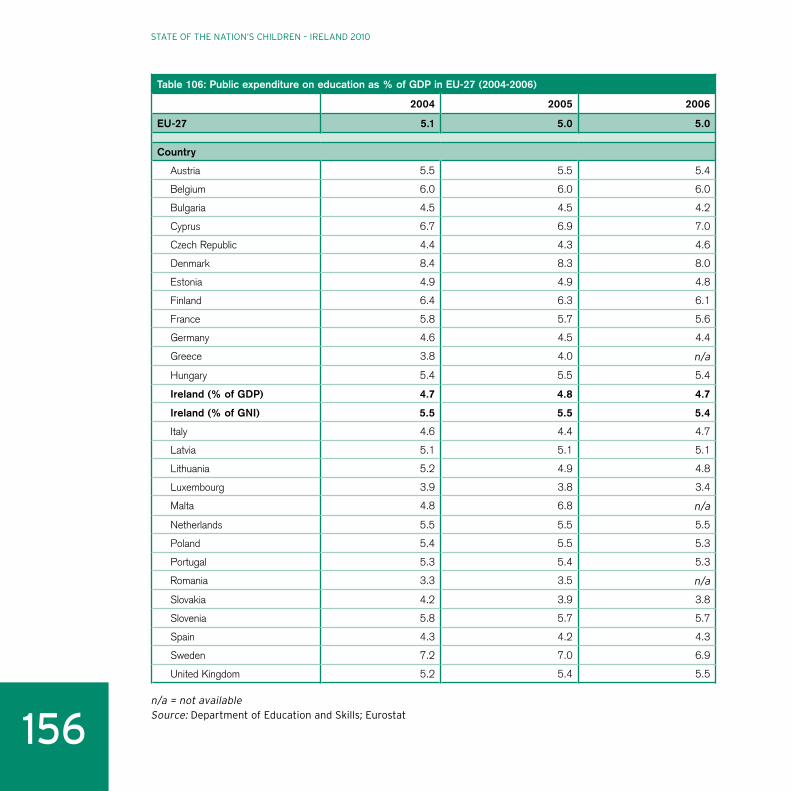
156
STATE OF THE NATION’S CHILDREN – IRELAND 2010
Table 106: Public expenditure on education as % of GDP in EU-27 (2004-2006)
2004 2005 2006
EU-27 5.1 5.0 5.0
Country
Austria 5.5 5.5 5.4
Belgium 6.0 6.0 6.0
Bulgaria 4.5 4.5 4.2
Cyprus 6.7 6.9 7.0
Czech Republic 4.4 4.3 4.6
Denmark 8.4 8.3 8.0
Estonia 4.9 4.9 4.8
Finland 6.4 6.3 6.1
France 5.8 5.7 5.6
Germany 4.6 4.5 4.4
Greece 3.8 4.0 n/a
Hungary 5.4 5.5 5.4
Ireland (% of GDP) 4.7 4.8 4.7
Ireland (% of GNI) 5.5 5.5 5.4
Italy 4.6 4.4 4.7
Latvia 5.1 5.1 5.1
Lithuania 5.2 4.9 4.8
Luxembourg 3.9 3.8 3.4
Malta 4.8 6.8 n/a
Netherlands 5.5 5.5 5.5
Poland 5.4 5.5 5.3
Portugal 5.3 5.4 5.3
Romania 3.3 3.5 n/a
Slovakia 4.2 3.9 3.8
Slovenia 5.8 5.7 5.7
Spain 4.3 4.2 4.3
Sweden 7.2 7.0 6.9
United Kingdom 5.2 5.4 5.5
n/a = not availableSource: Department of Education and Skills; Eurostat

157
PUBLIC EXPENDITURE ON EDUCATION
PA
RT
4: F
OR
MA
L A
ND
IN
FOR
MA
L S
UP
PO
RT
SReal non-capital public expenditure per student in Ireland increased by 58.3% ■
for first-level and by 55.7% for second-level over the period 1999-2008, when measured in constant 2008 prices (see Table 107). The corresponding increase in expenditure on third-level over the same period was 2.5 % in constant prices.
Table 107: Real non-capital public expenditure on education, by educational level (1999-2008)
Year
Expenditure per pupil at 2008 prices (€) Educational level
€m (at 2008 prices)
First Second1 Third2 Total non-capital expenditure
1999 4,136 6,069 11,288 5,473
2000 4,449 6,372 10,964 5,698
2001 4,613 6,985 11,412 6,020
2002 5,064 7,453 11,456 6,425
2003 5,532 8,000 11,257 6,847
2004 5,944 8,070 10,909 7,051
2005 6,060 8,397 11,316 7,274
2006 6,293 8,803 11,848 7,640
2007 6,442 9,268 11,673 7,967
2008 6,546 9,447 11,567 8,211
1 Includes Further Education sector (i.e. Post-Leaving Certificate courses).
2 Based on full-time equivalents.
Source: Department of Education and Skills

158
STATE OF THE NATION’S CHILDREN – IRELAND 2010
At risk oF poverty
children in the Midlands region are three times more likely to be at risk of poverty than children in the dublin region.
Measure
the percentage of children living in households with an equivalised household disposable income below the 60% median.
key findingsIn 2009, 18.6% of children under 18 were considered to be at risk of poverty ( ■ see Table 108).
Children under 18 had a higher risk of being poor than the population as a whole ■
(18.6% compared to 14.1%).
Table 108: Percentage of persons at risk of poverty (2005-2009)
2005 2006 2007 2008 2009
Children under 18 23.1 22.3 19.9 18.0 18.6
All persons 18.5 17.0 16.5 14.4 14.1
Source: EU-SILC, CSO
differences over timeThe percentage of children under 18 considered to be at risk of poverty fell from ■
23.1% in 2005 to 18.6% in 2009.
differences by geographic locationThe percentage of children under 18 considered to be at risk of poverty was lowest in ■
the Dublin region (10.8%) and highest in the Midlands region (31.0%) (see Figure 24).
international comparisonsIn 2008, 18.3% of children under 18 were at risk of poverty in Ireland. This was ■
lower than the EU-27 average of 20.3% (see Figure 24).

159
AT RISK OF POVERTY
PA
RT
4: F
OR
MA
L A
ND
IN
FOR
MA
L S
UP
PO
RT
SFigure 24: percentage of children under 18 at risk of poverty by eu-27 (2008) and percentage of children under 18 at risk of poverty by nuts region (2009)
% o
f ch
ildre
n a
t ri
sk o
f p
over
ty
9.1
11.6
12.0 12
.9
12.9
13.2 13.6 14
.9
15.2 16
.7
17.1
17.2
17.4 18
.3 19.7
19.8
19.9
20
.3
22
.4
22
.8
22
.8
23
.0 24
.0
24
.4
24
.6
24
.7 25
.5
32
.9
10.8
16.1 16.6
20
.2
20
.5
23
.8 25
.7
31.0
0
5
10
15
20
25
30
35
Den
mar
k
Slo
ven
ia
Fin
lan
d
Net
her
lan
ds
Sw
eden
Cze
ch R
epu
blic
Cyp
rus
Au
stri
a
Ger
man
y
Slo
vaki
a
Est
on
ia
Bel
giu
m
Fran
ce
Irel
and
Hu
ng
ary
Lu
xem
bo
urg
Mal
ta
EU
-27
Po
lan
d
Lit
hu
ania
Po
rtu
gal
Gre
ece
Un
ited
Kin
gd
om
Sp
ain
Lat
via
Ital
y
Bu
lgar
ia
Ro
man
ia
Du
blin
Bo
rder
Mid
-Eas
t
So
uth
-Wes
t
Wes
t
So
uth
-Eas
t
Mid
-Wes
t
Mid
lan
ds
EU-27 (2008) NUTS Region (2009)
% o
f ch
ildre
n a
t ri
sk o
f p
ove
rty
0
5
10
15
20
25
30
35
Source: Eurostat

160
STATE OF THE NATION’S CHILDREN – IRELAND 2010
consistent poverty
the percentage of children in the south-east region experiencing consistent poverty is approximately twice as high as the national average.
Measure
the percentage of children living in households with an equivalised household disposable income below the 60% median who experienced at least two forms of enforced deprivation.
key findingsIn 2009, 8.7% of children under 18 experienced consistent poverty ( ■ see Table 109).
Children under 18 were more likely to experience consistent poverty than the ■
population as a whole (8.7% compared to 5.5%).
Table 109: Percentage of persons experiencing consistent poverty (2005-2009)
2005 2006 2007 2008 2009
Children under 18 10.7 11.0 7.4 6.3 8.7
All persons 7.0 6.9 5.1 4.2 5.5
Source: EU-SILC, CSO
differences by household structure and over timeThe percentage of children under 18 experiencing consistent poverty fell from ■
11.0% in 2006 to 6.3% in 2008. This percentage increased significantly to 8.7% in 2009 (see Table 109).
The consistent poverty rate of persons living in households comprising a single ■
adult with children was 16.6% (see Figure 25). This was substantially higher than the consistent poverty rate in households with 2 adults and 1-3 children (5.4%) and other households with children under 18 years (6.3%).

161
CONSISTENT POVERTY
PA
RT
4: F
OR
MA
L A
ND
IN
FOR
MA
L S
UP
PO
RT
Sdifferences by geographic locationThe percentage of children under 18 experiencing consistent poverty was lowest ■
in the Mid-East region (4.1%) and highest in the South-East region (18.5%) (see Figure 25).
Figure 25: percentage of persons experiencing consistent poverty by household structure (2009) and percentage of children experiencing consistent poverty by nuts region (2009)
2.1
3.3
4.4
Household structure (2009) NUTS Region (2009)
5.4
6.3
16.6
4.1
5.8
6.46.9
9.9 9.9
13.9
18.5
0
2
0
4
6
8
10
12
14
16
18
20
2
4
6
8
10
12
14
16
18
20
2 a
du
lts
no
ch
ildre
n
3+
ad
ult
sn
o c
hild
ren
1 ad
ult
no
ch
ildre
n
2 a
du
lts
wit
h 1
-3 c
hild
ren
Oth
er h
ou
seh
old
sw
ith
ch
ildre
n
1 ad
ult
wit
h c
hild
ren
Mid
-Eas
t
So
uth
-Wes
t
Du
blin
Bo
rder
Mid
-Wes
t
Wes
t
Mid
lan
ds
So
uth
-Eas
t
% o
f p
erso
ns
in c
on
sist
ent
pov
erty
% o
f ch
ildre
n in
co
nsi
sten
t p
over
ty
Source: EU-SILC, CSO

162
STATE OF THE NATION’S CHILDREN – IRELAND 2010
AvAilABility oF housing For FAMilies with children
the number of households with children in need of social housing has increased by 24% since 2005.
Measure
the number of households with children identified as being in need of social housing.
key findingsIn 2008, there were 27,704 households with children identified as being in need of ■
social housing.
differences by household structure and over time55.5% (15,369) of households with children identified as being in need of social ■
housing were households with one child; 27.0% (7,479) were households with 2 children; 10.5% (2,924) were households with 3 children; and the remaining 7.0% (1,932) of households included 4 or more children (see Table 110).
The number of households with children identified as being in need of social ■
housing has increased by 24% since 2005.

163
AVAILABILITY OF HOUSING FOR FAMILIES WITH CHILDREN
PA
RT
4: F
OR
MA
L A
ND
IN
FOR
MA
L S
UP
PO
RT
STable 110: Number and percentage of households with children identified as being in need of social housing, by number of children (selected years 1996-2008)
1996 1999 2002 2005 2008
No. No. No. No. No. %
Total 17,773 25,185 29,484 22,335 27,704 100.0
No. of children
1 10,816 14,734 17,523 13,703 15,369 55.5
2 4,112 6,117 7,250 5,385 7,479 27.0
3 1,559 2,402 2,685 1,991 2,924 10.5
4 690 1,036 1,126 772 1,210 4.4
5 or more 596 896 900 484 722 2.6
Source: Triennial Assessment of Housing Needs, Department of the Environment, Heritage and Local Government
differences by household structure and geographic location29.4% (8,135) of households with children identified as being in need of social ■
housing were in Dublin (see Table 111).
72.4% (20,059) of households with children identified as being in need of social ■
housing were one-parent households and the remaining 27.6% (7,645) were two-parent households.

164
STATE OF THE NATION’S CHILDREN – IRELAND 2010
Table 111: Number and percentage of households with children identified as being in need of social housing, by household structure and county (2008)
Single with child/children
Couple with child/children
All households with child/children
No. No. No. %
Total 20,059 7,645 27,704 100.0
County
Carlow 299 167 466 1.7
Cavan 184 98 282 1.0
Clare 428 280 708 2.6
Cork 1,867 818 2,685 9.7
Donegal 917 217 1,134 4.1
Dublin 6,132 2,003 8,135 29.4
Galway 1,079 481 1,560 5.6
Kerry 663 248 911 3.3
Kildare 1,196 443 1,639 5.9
Kilkenny 299 123 422 1.5
Laois 180 90 270 1.0
Leitrim 71 54 125 0.5
Limerick 865 291 1,156 4.2
Longford 137 115 252 0.9
Louth 591 353 944 3.4
Mayo 453 182 635 2.3
Meath 612 239 851 3.1
Monaghan 189 101 290 1.0
Offaly 404 185 589 2.1
Roscommon 189 77 266 1.0
Sligo 160 72 232 0.8
Tipperary NR 216 109 325 1.2
Tipperary SR 306 96 402 1.5
Waterford 558 143 701 2.5
Westmeath 302 102 404 1.5
Wexford 853 296 1,149 4.1
Wicklow 909 262 1,171 4.2
Source: Triennial Assessment of Housing Needs, Department of the Environment, Heritage and Local Government

165
COMMUNITY CHARACTERISTICS
PA
RT
4: F
OR
MA
L A
ND
IN
FOR
MA
L S
UP
PO
RT
ScoMMunity chArActeristics
traveller children and children with a disability and/or chronic illness are less likely to report feeling safe in the area where they live.
Measure
the percentage of children aged 9-17 who report feeling safe in the area where they live.
key findingsIn 2006, 90.4% of children aged 9-17 reported feeling safe in the area where they ■
live.
differences by population groupsWhen compared to other children, Traveller children and children with a disability ■
and/or chronic illness were less likely to report feeling safe in the area where they live (see Table 112). These differences were statistically significant.
There were no significant differences between immigrant and non-immigrant children. ■
Table 112: Percentage of children who report feeling safe in area where they live, by population groups (2006)
%
All children 90.4
Traveller status
Traveller children 77.5
All other children 90.7
Immigrant status
Immigrant children 89.8
All other children 90.4
Disability and/or Chronic Illness status
Children with a disability and/or chronic illness 87.1
All other children 91.2
Source: HBSC Survey, Health Promotion Research Centre

166
STATE OF THE NATION’S CHILDREN – IRELAND 2010
differences by age, gender, social class and over timeThe percentage of children who reported feeling safe in the area where they ■
live was broadly similar across age and gender, with no statistically significant differences (see Table 113).
Statistically significant differences were observed across social class, with a lower ■
percentage of children from the lowest social category reporting to feel safe in the area where they live.
Table 113: Percentage of children who report feeling safe in area where they live, by age, gender and social class (2002 and 2006)
2002 2006
Total (%) Boys (%) Girls (%) Total (%)
All children 87.4 90.4 90.4 90.4
Age
9 – 90.5 89.8 90.2
10-11 87.4 90.0 89.8 89.9
12-14 87.6 90.6 90.8 90.7
15-17 87.1 90.7 90.6 90.7
Social class
SC 1-2 91.1 93.7 94.0 93.9
SC 3-4 87.7 90.8 90.2 90.5
SC 5-6 86.0 88.8 88.2 88.5
Source: HBSC Survey, Health Promotion Research Centre
differences by geographic locationChildren in the Border and West regions were more likely to report feeling safe ■
where they live (94.2%), while children in the Dublin region were least likely to report this (83.0%) (see Table 114). These differences were statistically significant.
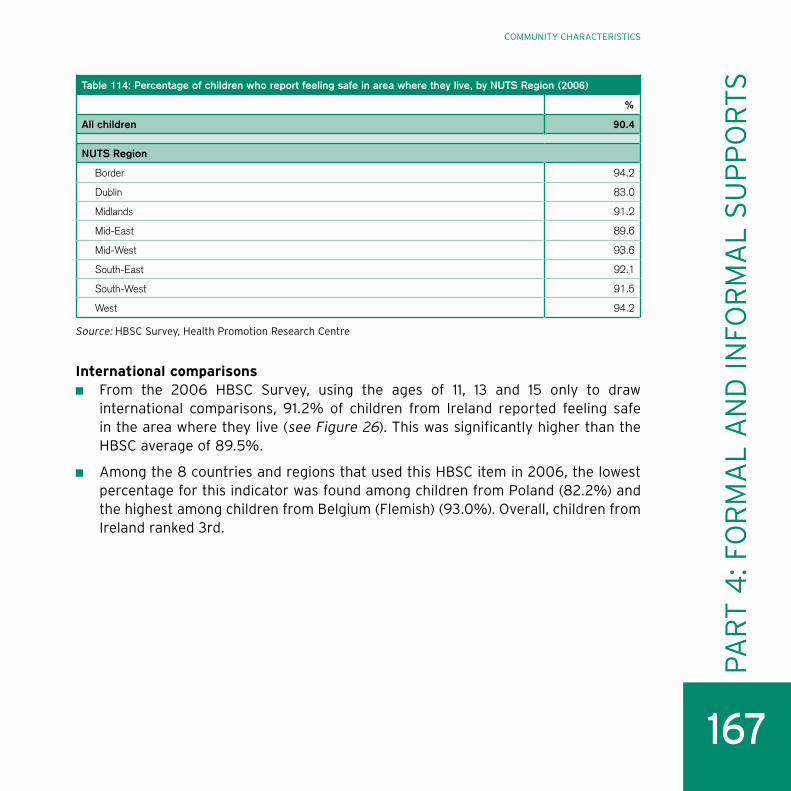
167
COMMUNITY CHARACTERISTICS
PA
RT
4: F
OR
MA
L A
ND
IN
FOR
MA
L S
UP
PO
RT
STable 114: Percentage of children who report feeling safe in area where they live, by NUTS Region (2006)
%
All children 90.4
NUTS Region
Border 94.2
Dublin 83.0
Midlands 91.2
Mid-East 89.6
Mid-West 93.6
South-East 92.1
South-West 91.5
West 94.2
Source: HBSC Survey, Health Promotion Research Centre
international comparisonsFrom the 2006 HBSC Survey, using the ages of 11, 13 and 15 only to draw ■
international comparisons, 91.2% of children from Ireland reported feeling safe in the area where they live (see Figure 26). This was significantly higher than the HBSC average of 89.5%.
Among the 8 countries and regions that used this HBSC item in 2006, the lowest ■
percentage for this indicator was found among children from Poland (82.2%) and the highest among children from Belgium (Flemish) (93.0%). Overall, children from Ireland ranked 3rd.

168
STATE OF THE NATION’S CHILDREN – IRELAND 2010
Figure 26: percentage of children who report feeling safe in the area where they live, by country (2006)
% of children
93.0
92.4
91.2
90.0
90.0
89.6
89.5
88.8
82.2
0 10 20 30 40 50 60 70 80 90 100
Poland
Romania
HBSC Average
United Kingdom
Germany
Italy
Ireland
Canada
Belgium (Flemish)
Source: HBSC Survey, Health Promotion Research Centre

169
ENVIRONMENT AND PLACES
PA
RT
4: F
OR
MA
L A
ND
IN
FOR
MA
L S
UP
PO
RT
SenvironMent And plAces
traveller children and immigrant children are more likely to report having good places in their area to spend their free time.
Measure
the percentage of children aged 9-17 who report there are good places in their area to spend their free time.
key findingsIn 2006, 42.2% of children aged 9-17 reported that there were good places in their ■
area to spend their free time.
differences by population groupsWhen compared to other children, Traveller children and immigrant children were ■
more likely to report that there are good places in their area to spend their free time (see Table 115). These differences were statistically significant.
There were no significant differences between children with and children without a ■
disability and/or chronic illness.

170
STATE OF THE NATION’S CHILDREN – IRELAND 2010
Table 115: Percentage of children who report that there are good places in their area to spend their free time, by population groups (2006)
%
All children 42.2
Traveller status
Traveller children 58.4
All other children 41.8
Immigrant status
Immigrant children 48.7
All other children 41.9
Disability and/or Chronic Illness status
Children with a disability and/or chronic illness 43.6
All other children 41.9
Source: HBSC Survey, Health Promotion Research Centre
differences by age, gender, social class and over timeStatistically significant differences were also observed across age, gender and ■
social class categories, with a higher percentage of boys, younger children and children in the lowest social class category reporting that there are good places in their area where they can spend their free time (see Table 116).

171
ENVIRONMENT AND PLACES
PA
RT
4: F
OR
MA
L A
ND
IN
FOR
MA
L S
UP
PO
RT
STable 116: Percentage of children who report that there are good places in their area to spend their free time, by age, gender and social class (2002 and 2006)
2002 2006
Total (%) Boys (%) Girls (%) Total (%)
All children 43.9 45.4 39.0 42.2
Age
9 – 75.9 78.3 77.1
10-11 59.6 56.6 54.9 55.6
12-14 47.5 49.7 41.9 45.9
15-17 32.6 37.6 28.5 33.3
Social class
SC 1-2 43.0 42.0 35.0 38.6
SC 3-4 44.4 45.4 38.8 42.1
SC 5-6 44.1 49.1 41.7 45.2
Source: HBSC Survey, Health Promotion Research Centre
differences by geographic locationChildren in the Dublin region were more likely to report that there are good places ■
in their area where they can spend their free time (58.4%), while children in the West were least likely to report this (33.4%) (see Table 117). These differences were statistically significant.
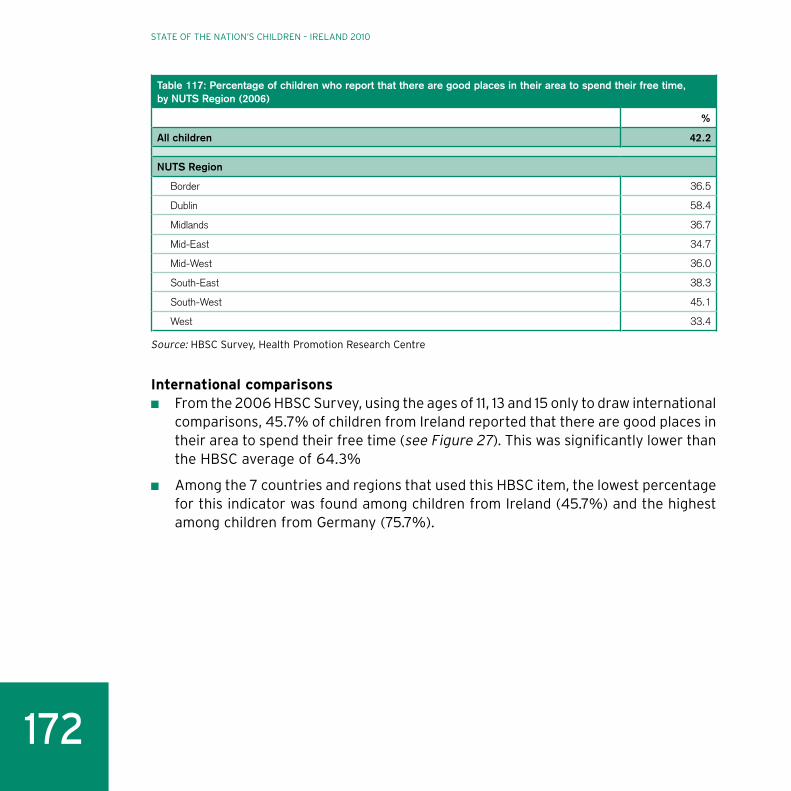
172
STATE OF THE NATION’S CHILDREN – IRELAND 2010
Table 117: Percentage of children who report that there are good places in their area to spend their free time, by NUTS Region (2006)
%
All children 42.2
NUTS Region
Border 36.5
Dublin 58.4
Midlands 36.7
Mid-East 34.7
Mid-West 36.0
South-East 38.3
South-West 45.1
West 33.4
Source: HBSC Survey, Health Promotion Research Centre
international comparisonsFrom the 2006 HBSC Survey, using the ages of 11, 13 and 15 only to draw international ■
comparisons, 45.7% of children from Ireland reported that there are good places in their area to spend their free time (see Figure 27). This was significantly lower than the HBSC average of 64.3%
Among the 7 countries and regions that used this HBSC item, the lowest percentage ■
for this indicator was found among children from Ireland (45.7%) and the highest among children from Germany (75.7%).

173
ENVIRONMENT AND PLACES
PA
RT
4: F
OR
MA
L A
ND
IN
FOR
MA
L S
UP
PO
RT
SFigure 27: percentage of children who report that there are good places in their area to spend their free time, by country (2006)
% of children
75.7
68.8
68.0
65.5
64.3
62.5
50.1
45.7
0 10 20 30 40 50 60 70 80 90 100
Ireland
Italy
United Kingdom
HBSC Average
Belgium (Flemish)
Romania
Canada
Germany
Source: HBSC Survey, Health Promotion Research Centre

174
STATE OF THE NATION’S CHILDREN – IRELAND 2010
gArdA Juvenile diversion progrAMMe reFerrAls
there has been a substantial decrease in the number of children referred to the garda Juvenile diversion programme.
Measure
the number of children aged 10-17 referred to the garda Juvenile diversion programme.
key findingsIn 2009, there were 18,519 children referred and 23,952 referrals to the Garda ■
Juvenile Diversion Programme, a rate of 1.3 referrals per child referred.
differences by age, gender, offence and over time77.3% (18,525) of referrals were from children aged 15-17 years ( ■ see Table 118). This equates to a rate of 1,094.3 referrals per 10,000 children aged 15-17 years.
80.7% (14,950) of children referred to the Garda Juvenile Diversion Programme ■
were boys and 19.3% (3,569) were girls.
The majority of referrals were dealt with by way of a formal (22.3%) or informal ■
(45.8%) caution, while 25.3% (6,050) were considered unsuitable. A referral is recorded as unsuitable if (a) the child does not accept responsibility for his or her behaviour, (b) the child is offending persistently or (c) it would not be in the interest of society to caution the child.
Alcohol-related offences were the single highest cause of referrals to the Garda ■
Juvenile Diversion Programme, representing 17.8% of all referrals (see Figure 28).
Since 2008, there has been a substantial decrease in the number of children ■
referred and in the number of referrals.

175
GARDA JUVENILE DIVERSION PROGRAMME REFERRALS
PA
RT
4: F
OR
MA
L A
ND
IN
FOR
MA
L S
UP
PO
RT
STable 118: Number, percentage and rate (per 10,000) of children aged 10-17 referred/referrals to the Garda Juvenile Diversion Programme, by age, gender and outcome (2005-2009)
2005 2006 2007 2008 2009
No. No. No. No. No. % Rate per 10,000
Total number of children 17,567 20,016 21,941 21,412 18,519 100.0 404.9
Gender
Boys 13,933 16,257 17,802 17,195 14,950 80.7 637.6
Girls 3,634 3,759 4,139 4,217 3,569 19.3 160.1
Total number of referrals 21,497 25,080 27,853 27,422 23,952 100.0 523.7
Age
10-14 6,067 6,582 6,543 6,278 5,427 22.7 188.4
15-17 15,430 18,498 21,310 21,144 18,525 77.3 1,094.3
Outcome
Formal 3,677 4,687 5,291 5,108 5,345 22.3 116.9
Informal 10,999 12,225 13,651 12,884 10,979 45.8 240.1
No further action 1,073 1,380 1,275 1,682 946 3.9 20.7
Pending 1,143 939 1,084 732 632 2.6 13.8
Not suitable 4,605 5,849 6,552 7,016 6,050 25.3 132.3
Source: An Garda Síochána

176
STATE OF THE NATION’S CHILDREN – IRELAND 2010
Figure 28: percentage referrals to the garda Juvenile diversion programme, by type of offence (2009)
Source: An Garda Síochána
differences by geographic locationAlmost one-third (32.4%) of all referrals and of all children referred to the ■
Garda Juvenile Diversion Programme were in the Dublin Metropolitan Region (see Table 119).
0
2
4
6
8
10
12
14
16
18
20
BurglaryPossessionof drugs
Minorassault
TrespassPublicorder
Criminaldamage
TrafficOtheroffences
TheftAlcohol-related
17.8
16.6
13.2 12.9
10.6
9.5
6.5
4.4 4.3 4.2
% o
f re
ferr
als
Type of offence

177
GARDA JUVENILE DIVERSION PROGRAMME REFERRALS
PA
RT
4: F
OR
MA
L A
ND
IN
FOR
MA
L S
UP
PO
RT
STable 119: Number and percentage of children aged 10-17 referred/referrals to the Garda Juvenile Diversion Programme, by Region and Division (2009)
Total number of children referred
Total number of referrals
No. % No. %
Total 18,519 100.0 23,952 100.0
Eastern Region 2,488 13.4 3,163 13.2
Kildare 546 2.9 670 2.8
Laois/Offaly 574 3.1 744 3.1
Meath 472 2.5 618 2.6
Westmeath 339 1.8 450 1.9
Wicklow 557 3.0 681 2.8
Dublin Metropolitan Region (DMR) 6,006 32.4 7,769 32.4
DMR East 610 3.3 735 3.1
DMR North 1,633 8.8 2,086 8.7
DMR North Central 451 2.4 676 2.8
DMR South 1,309 7.1 1,708 7.1
DMR South Central 358 1.9 464 1.9
DMR West 1,645 8.9 2,100 8.8
Northern Region 1,961 10.6 2,505 10.5
Cavan/Monaghan 518 2.8 672 2.8
Donegal 626 3.4 778 3.2
Louth 537 2.9 720 3.0
Sligo/Leitrim 280 1.5 335 1.4
South-Eastern Region 2,159 11.7 2,900 12.1
Kilkenny/Carlow 486 2.6 641 2.7
Tipperary 557 3.0 737 3.1
Waterford 670 3.6 919 3.8
Wexford 446 2.4 603 2.5
continued

178
STATE OF THE NATION’S CHILDREN – IRELAND 2010
Table 119 (continued)
Total number of children referred
Total number of referrals
No. % No. %
Southern Region 3,780 20.4 5,009 20.9
Cork City 1,230 6.6 1,595 6.7
Cork North 657 3.5 844 3.5
Cork West 432 2.3 603 2.5
Kerry 510 2.8 653 2.7
Limerick 951 5.1 1,314 5.5
Western Region 2,072 11.2 2,545 10.6
Clare 379 2.0 462 1.9
Galway 844 4.6 1,021 4.3
Mayo 510 2.8 665 2.8
Roscommon/Longford 339 1.8 397 1.7
Outside jurisdiction 53 0.3 61 0.3
Source: An Garda Síochána

179
ANTENATAL CARE
PA
RT
4: F
OR
MA
L A
ND
IN
FOR
MA
L S
UP
PO
RT
SAntenAtAl cAre
early antenatal care is lowest among younger mothers.
Measure
the percentage of mothers attending for antenatal care in the first trimester of pregnancy.
key findingsIn 2008, 70.4% of women attended for antenatal care in the first trimester of ■
pregnancy.
differences by age, social class and over timeAntenatal care in the first trimester of pregnancy is lowest among mothers aged ■
15-19 (56.3%) (see Table 120).
Women who were primarily engaged in ‘home duties’ also had one of the lowest ■
percentages of antenatal visits in the first trimester of pregnancy (62.5%) (see Figure 29).
Table 120: Percentage of mothers attending for antenatal care in the first trimester of pregnancy, by mothers’ age (2004-2008)*
2004 2005 2006 2007 2008
Total 68.3 71.5 72.8 70.9 70.4
Age
15-19 56.8 61.2 62.3 57.4 56.3
20-24 61.8 65.8 65.2 62.4 61.9
25-29 66.8 71.0 72.9 69.4 68.3
30-34 71.7 74.4 75.6 74.1 73.6
35-39 71.2 73.2 74.6 74.1 74.4
40-44 68.3 70.0 72.5 73.8 72.3
45 and over 68.9 64.5 53.6 64.2 70.9
* Categories where percentages are based on less than 100 births (i.e. ‘under 15 years’ and ‘age not stated’) have been omitted from this Table.
Source: National Perinatal Reporting System, ESRI

180
STATE OF THE NATION’S CHILDREN – IRELAND 2010
Figure 29: percentage of mothers attending for antenatal care in the first trimester of pregnancy, by mothers’ occupation (2008)*
* Categories where percentages are based on less than 100 births (i.e. ‘unskilled manual workers’, ‘other agricultural occupations and fishermen’, ‘farmers and farm managers’) and ‘not stated’ and ‘not classifiable’ categories have been omitted from this Figure.
Source: National Perinatal Reporting System, ESRI
differences by geographic location91.7% of women in Donegal attended for antenatal care in the first trimester of ■
pregnancy, compared to 33.2% of women in Louth (see FIgure 30). This may be due, in part at least, to some differences in recording first contact with General Practitioner (GP) services.
% of mothers
78.1
76.8
76.3
76.3
75.5
73.4
70.4
69.1
65.8
63.7
62.5
0 10 20 30 40 50 60 70 80 90
Home Duties
Unemployed
Semi-skilled Manual Workers
Other Non-manual Workers
State
Intermediate Non-manual Workers
Salaried Employees
Employers and Managers
Lower Professional
Skilled Manual Workers
Higher Professional
Occ
up
atio
n o
f m
oth
er

181
ANTENATAL CARE
PA
RT
4: F
OR
MA
L A
ND
IN
FOR
MA
L S
UP
PO
RT
SFigure 30: percentage of mothers attending for antenatal care in the first trimester of pregnancy, by mothers’ county of residence (2008)*
0 20 40 60 80 100
Louth
Mayo
Monaghan
Clare
Limerick
Meath
Tipperary NR
Dublin City
Dublin County
Cavan
Galway
State
Wicklow
Waterford
Kildare
Laois
Wexford
Longford
Kilkenny
Offaly
Westmeath
Carlow
Tipperary SR
Leitrim
Sligo
Roscommon
Kerry
Cork
Donegal
% of mothers
33.2
42.3
48.5
50.5
52.2
55.1
59.9
62.6
63.9
66.8
69.5
70.4
72.9
73.2
75.9
78.4
81.3
82.3
82.7
83.6
84.6
84.8
85.2
85.4
86.4
87.8
89.0
91.3
91.7
* Categories where percentages are based on less than 100 births (i.e. ‘other’ and ‘not stated’) have been omitted from this Figure.
Source: National Perinatal Reporting System, ESRI

182
STATE OF THE NATION’S CHILDREN – IRELAND 2010
childhood iMMunisAtion
in 2009, roscommon had the highest uptake of the recommended doses of all vaccines among children at 12 and 24 months.
Measure
the percentage uptake of the recommended doses of vaccines among children at (a) 12 months and (b) 24 months of age.
List of vaccines presented below (see technical notes in Appendix 1 for immunisation schedule):
D3 3 doses of vaccine against diphtheria
P3 3 doses of vaccine against pertussis
T3 3 doses of vaccine against tetanus
Hib3
3 doses of vaccine against Haemophilus influenzae type bPolio
3 3 doses of vaccine against polio
HepB3
3 doses of vaccine against hepatitis BMenC
3 3 doses of vaccine against meningococcal group C
MenC2 2 doses of vaccine against meningococcal group C
PCV2
2 doses of vaccine against pneumococcal conjugate vaccineHib
b 1 booster dose of vaccine against Haemophilus influenzae type b
MMR1 1 dose of vaccine against measles, mumps and rubella
BCG 1 dose of Bacillus Calmette-Guerin vaccine
key findingsIn 2009, the national uptake rates (based on available data) for children at ■
12 months of age were 89% for D3, P
3, T
3, Hib
3 and Polio
3; 95% for BCG;
86% for MenC3 (based on Quarters 1 and 2 2009 data only); and 89% for HepB
3,
MenC2 and PCV
2 (based on available data in Quarters 3 and 4 2009 only).
The national uptake rates (based on available data) for children at ■ 24 months of age were 94% for D
3, P
3, T
3 and Polio
3; 93% for MenC
3 and Hib
3; 90% for MMR
1;
and 87% for Hibb.

183
CHILDHOOD IMMUNISATION
PA
RT
4: F
OR
MA
L A
ND
IN
FOR
MA
L S
UP
PO
RT
Sdifferences by age, vaccine type and over timeOver the period 2005-2009, for children at ■ 12 months of age the national uptake rates (based on available data) have increased, from 85% to 89% for D
3, P
3, T
3, Hib
3
and Polio3; and from 93% to 95% for BCG (see Table 121).
Over the same period, for children at ■ 24 months of age the national uptake rates (based on available data) have increased, from 89% to 93% for MenC
3; from 90%
to 94% for D3, P
3, T
3 and Polio
3; from 90% to 93% for Hib
3; and from 84% to 90%
for MMR1.
Table 121: Immunisation uptake rates, by age and vaccine type (2005-2009)*
2005 2006 2007 2008 2009
At 12 months
BCG 93 93 93 94 95
D3 85 86 87 88 89
P3 85 86 87 88 89
T3 85 86 87 88 89
Hib3 85 86 87 88 89
Polio3 85 86 87 88 89
MenC3 85 85 87 88 86
HepB3 n/a n/a n/a n/a 89
MenC2 n/a n/a n/a n/a 89
PCV2 n/a n/a n/a n/a 89
At 24 months
D3 90 91 92 93 94
P3 90 91 92 93 94
T3 90 91 92 93 94
Hib3 90 91 92 93 93
Hibb n/a n/a 74 82 87
Polio3 90 91 92 93 94
MenC3 89 90 91 92 93
MMR1 84 86 87 89 90
n/a = not applicable (see below)
* Please see technical notes in Appendix 1 for caveats to data (as a number of figures presented here are incomplete) and for changes to the primary childhood immunisation schedule introduced on 1st September 2008.
Source: Immunisation Uptake Statistics, Health Protection Surveillance Centre
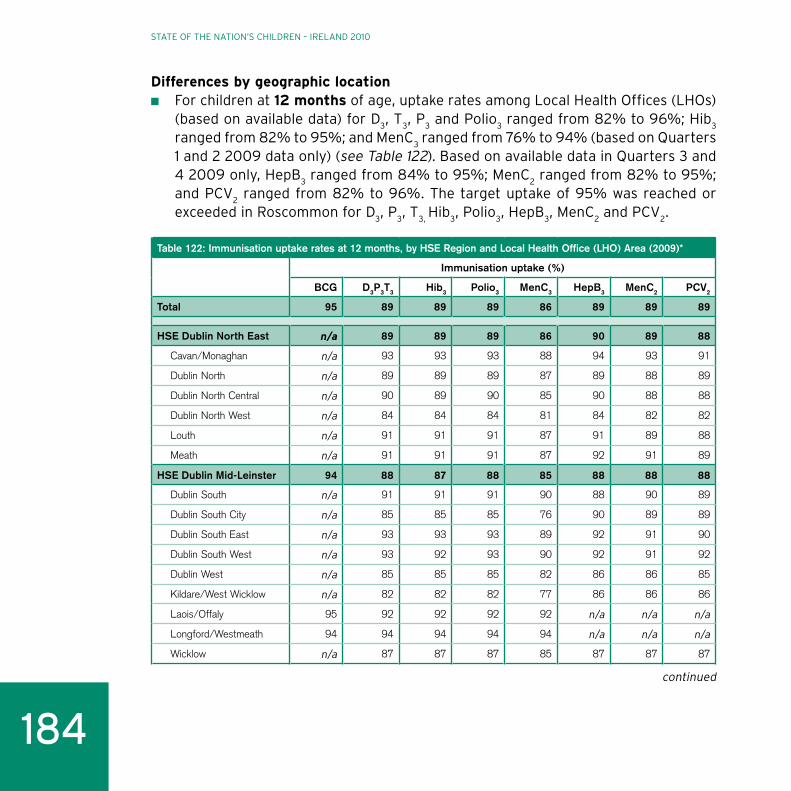
184
STATE OF THE NATION’S CHILDREN – IRELAND 2010
differences by geographic locationFor children at ■ 12 months of age, uptake rates among Local Health Offices (LHOs) (based on available data) for D
3, T
3, P
3 and Polio
3 ranged from 82% to 96%; Hib
3
ranged from 82% to 95%; and MenC3 ranged from 76% to 94% (based on Quarters
1 and 2 2009 data only) (see Table 122). Based on available data in Quarters 3 and 4 2009 only, HepB
3 ranged from 84% to 95%; MenC
2 ranged from 82% to 95%;
and PCV2 ranged from 82% to 96%. The target uptake of 95% was reached or
exceeded in Roscommon for D3, P
3, T
3, Hib
3, Polio
3, HepB
3, MenC
2 and PCV
2.
Table 122: Immunisation uptake rates at 12 months, by HSE Region and Local Health Office (LHO) Area (2009)*
Immunisation uptake (%)
BCG D3P3T3 Hib3 Polio3 MenC3 HepB3 MenC2 PCV2
Total 95 89 89 89 86 89 89 89
HSE Dublin North East n/a 89 89 89 86 90 89 88
Cavan/Monaghan n/a 93 93 93 88 94 93 91
Dublin North n/a 89 89 89 87 89 88 89
Dublin North Central n/a 90 89 90 85 90 88 88
Dublin North West n/a 84 84 84 81 84 82 82
Louth n/a 91 91 91 87 91 89 88
Meath n/a 91 91 91 87 92 91 89
HSE Dublin Mid-Leinster 94 88 87 88 85 88 88 88
Dublin South n/a 91 91 91 90 88 90 89
Dublin South City n/a 85 85 85 76 90 89 89
Dublin South East n/a 93 93 93 89 92 91 90
Dublin South West n/a 93 92 93 90 92 91 92
Dublin West n/a 85 85 85 82 86 86 85
Kildare/West Wicklow n/a 82 82 82 77 86 86 86
Laois/Offaly 95 92 92 92 92 n/a n/a n/a
Longford/Westmeath 94 94 94 94 94 n/a n/a n/a
Wicklow n/a 87 87 87 85 87 87 87
continued

185
CHILDHOOD IMMUNISATION
PA
RT
4: F
OR
MA
L A
ND
IN
FOR
MA
L S
UP
PO
RT
STable 122 (continued)
Immunisation uptake (%)
BCG D3P3T3 Hib3 Polio3 MenC3 HepB3 MenC2 PCV2
HSE South 95 88 88 88 87 90 90 90
Carlow/Kilkenny 95 88 88 88 87 88 87 87
Kerry 93 83 83 83 82 n/a n/a n/a
North Cork n/a 87 87 87 87 n/a n/a n/a
North Lee/South Lee** n/a 87 87 87 87 n/a n/a n/a
Tipperary SR 95 91 91 91 91 92 91 91
Waterford 95 89 89 89 87 89 89 89
West Cork n/a 82 82 82 82 n/a n/a n/a
Wexford 96 91 91 91 89 92 92 92
HSE West 96 90 90 90 89 89 88 90
Clare 98 91 91 91 89 93 n/a 93
Donegal 94 92 92 92 91 91 91 92
Galway n/a 87 87 87 85 86 87 87
Limerick 97 90 90 90 87 92 n/a 91
Mayo n/a 88 88 88 87 88 86 88
Roscommon n/a 96 95 96 94 95 95 96
Sligo/Leitrim/West Cavan 96 91 91 91 91 88 87 88
Tipperary NR 96 91 91 91 91 91 n/a 92
n/a = not applicable (see below)
* Please see technical notes in Appendix 1 for caveats to data (as a number of figures presented here are incomplete) and for changes to the primary childhood immunisation schedule introduced on 1st September 2008.
** While North Lee and South Lee are two separate LHOs, their combined immunisation uptake data are reported here.
Source: Immunisation Uptake Statistics, Health Protection Surveillance Centre
For children at ■ 24 months of age, uptake rates among Local Health Offices (LHOs) (based on available data) for D
3, T
3, P
3, Hib
3, Polio
3 and MenC
3 ranged from 89%
to 98%; Hibb ranged from 78% to 98%; and MMR
1 ranged from 84% to 97% (see
Table 123). Again, Roscommon had the highest uptake of the recommended doses of all vaccines.

186
STATE OF THE NATION’S CHILDREN – IRELAND 2010
Table 123: Immunisation uptake rates at 24 months, by HSE Region and Local Health Office (LHO) Area (2009)*
Immunisation uptake (%)
D3P3T3 Hib3 Hibb Polio3 MenC3 MMR1
Total 94 93 87 94 93 90
HSE Dublin North East 94 93 88 94 94 90
Cavan/Monaghan 95 95 92 95 96 92
Dublin North Central 95 94 83 95 93 90
Dublin North West 92 91 85 92 92 87
Dublin North 94 93 86 94 93 91
Louth 93 93 92 93 95 91
Meath 94 94 92 94 95 92
HSE Dublin Mid-Leinster 93 93 85 93 93 89
Dublin South 97 96 87 97 96 93
Dublin South City 90 89 78 90 89 84
Dublin South East 97 97 86 97 97 93
Dublin South West 95 94 86 95 93 94
Dublin West 92 92 82 92 91 88
Kildare/West Wicklow 89 89 80 89 89 85
Laois/Offaly 95 95 92 95 95 92
Longford/Westmeath 97 97 94 97 97 94
Wicklow 92 91 81 92 91 85
HSE South 93 93 89 93 93 90
Carlow/Kilkenny 92 91 91 92 91 91
Kerry 92 92 84 92 91 87
North Cork 96 96 89 96 95 92
North Lee/South Lee** 95 95 90 95 95 92
Tipperary SR 93 93 90 93 92 90
Waterford 90 90 87 90 89 86
West Cork 90 90 82 90 89 84
Wexford 94 94 92 94 93 91
continued

187
CHILDHOOD IMMUNISATION
PA
RT
4: F
OR
MA
L A
ND
IN
FOR
MA
L S
UP
PO
RT
STable 123 (continued)
Immunisation uptake (%)
D3P3T3 Hib3 Hibb Polio3 MenC3 MMR1
HSE West 94 94 89 94 94 91
Clare 93 93 89 93 93 92
Donegal 96 96 93 96 95 92
Galway 94 94 86 94 93 90
Limerick 92 92 86 92 92 89
Mayo 93 93 82 93 93 87
Roscommon 98 98 98 98 98 97
Sligo/Leitrim/West Cavan 96 96 93 97 94 93
Tipperary NR 96 95 91 96 95 94
* Please see technical notes in Appendix 1 for caveats to data (as a number of figures presented here are incomplete) and for changes to the primary childhood immunisation schedule introduced on 1st September 2008.
** While North Lee and South Lee are two separate LHOs, their combined immunisation uptake data are reported here.
Source: Immunisation Uptake Statistics, Health Protection Surveillance Centre
international comparisonsUptake rates of the recommended doses of vaccines among children of relevant ■
age for D3, P
3, T
3 and Polio
3 reported in countries across the EU-27 ranged from
73% in Malta to 100% in Hungary (see Table 124). Hungary also reported a 100% uptake rate of a measles-containing vaccine.

188
STATE OF THE NATION’S CHILDREN – IRELAND 2010
Table 124: Immunisation uptake rates among children of relevant age, by vaccine type and EU-27 (2009)
D3P3T3 Polio3 Measles-containing vaccine
Country
Austria 83 83 76
Belgium 99 99 94
Bulgaria 94 94 96
Cyprus 99 99 87
Czech Republic 99 99 n/a
Denmark 89 89 84
Estonia 95 95 95
Finland 99 99 99
France 99 n/a 90
Germany n/a 96 96
Greece 99 99 99
Hungary 100 100 100
Ireland 94 94 90
Italy n/a n/a n/a
Latvia 95 96 96
Lithuania 98 98 96
Luxembourg 99 99 96
Malta 73 73 82
Netherlands 97 n/a 96
Norway 93 93 92
Poland 99 96 98
Portugal 96 96 95
Romania n/a n/a n/a
Slovakia 99 99 99
Slovenia 96 96 95
Spain 96 96 98
Sweden 98 98 97
United Kingdom 93 93 86
n/a = not available
Source: Centralised Information System for Infectious Diseases, WHO

189
ACCESSIBILITY OF BASIC HEALTH SERVICES
PA
RT
4: F
OR
MA
L A
ND
IN
FOR
MA
L S
UP
PO
RT
SAccessiBility oF BAsic heAlth services
in April 2010, 2,591 children were known to be on a hospital waiting list.
Measure
the number of children on hospital waiting lists.
key findingsIn April 2010, 2,591 children were known to be on a hospital waiting list awaiting ■
treatment.
differences by waiting time and speciality47.8% (1,238) of these children were on the hospital list for 3-6 months, 43.5% ■
(1,128) for 6-12 months and 8.7% (225) for 1 year or more (see Table 125).
Of the 2,591 children who were known to be on a hospital waiting list awaiting ■
treatment, 88.8% (2,302) were awaiting surgical treatment and 11.2% (289) were awaiting medical treatment.
differences by geographic locationHospitals in Dublin accounted for approximately 60% of the total number of ■
children waiting for treatment (1,563) (see Table 125).

190
STATE OF THE NATION’S CHILDREN – IRELAND 2010
Table 125: Number of children on hospital waiting lists (surgical and medical), by hospital and waiting time (2010)
3-6 months
6-12 months
Over 12 months
Total
Total 1,238 1,128 225 2,591
Hospital
Beaumont Hospital, Dublin 9 2 1 12
Cappagh Orthopaedic Hospital 2 1 0 3
Cavan General Hospital 2 0 0 2
Children’s University Hospital Temple Street, Dublin 181 176 79 436
Cork University Hospital 30 42 4 76
Kerry General Hospital 3 0 0 3
Letterkenny General Hospital 7 2 0 9
Mercy University Hospital, Cork 19 29 0 48
Merlin Park Hospital, Galway 1 1 0 2
Midland Regional Hospital, Mullingar 0 1 0 1
Midland Regional Hospital, Portlaoise 2 0 0 2
Midland Regional Hospital, Tullamore 102 37 2 141
Mid-Western Regional Hospital, Dooradoyle 36 17 8 61
Monaghan General Hospital 37 38 0 75
Our Lady of Lourdes Hospital, Drogheda 129 46 10 185
Our Lady’s Hospital for Sick Children, Crumlin 401 505 116 1,022
Royal Victoria Eye and Ear Hospital, Dublin 6 3 0 9
Sligo General Hospital 38 29 2 69
South Infirmary Victoria University Hospital, Cork 6 2 0 8
St. John’s Hospital, Limerick 1 0 2 3
St. Luke’s General Hospital, Kilkenny 2 0 0 2
Tallaght Hospital (AMNCH), Dublin 60 20 1 81
University College Hospital, Galway 115 149 0 264
Waterford Regional Hospital 49 28 0 77
Source: Patient Treatment Register, National Treatment Purchase Fund

191
CHILDREN AND YOUNG PEOPLE IN CARE
PA
RT
4: F
OR
MA
L A
ND
IN
FOR
MA
L S
UP
PO
RT
Schildren And young people in cAre
Almost 9 out of 10 children in the care of the health service executive live in foster family homes.
Measure
the number of children who are in the care of the health service executive (hse).
key findingsIn 2008, 5,357 children were in the care of the HSE. ■
differences by age, gender, type placement, length of stay and over time50.7% (2,717) of children in the care of the HSE were boys and 49.3% (2,640) were ■
girls (see Table 126).
The majority of children (88.5%) in the care of the HSE lived with foster families ■
and more than one in 3 (36.2%) were in care for a period of 5 years or more.
Over the period 2006-2008, the number of children in the care of the HSE has ■
increased.

192
STATE OF THE NATION’S CHILDREN – IRELAND 2010
Table 126: Number and percentage of children in the care of the HSE, by age, gender, type of placement and length of stay (2006-2008)
2006 2007 2008
No. No. No. %
Total 5,247 5,307 5,357 100.0
Age
0-4 852 819 834 15.6
5-9 1,420 1,434 1,452 27.1
10-14 1,764 1,780 1,799 33.6
15-17 1,211 1,274 1,272 23.7
Gender
Boys 2,681 2,695 2,717 50.7
Girls 2,566 2,612 2,640 49.3
Type of placement
Foster Care – General 3,073 3,141 3,134 58.5
Foster Care – Special 40 31 27 0.5
Foster Care – Relative 1,482 1,552 1,581 29.5
Pre-adoptive placement 36 26 24 0.4
Residential – General 351 337 328 6.1
Residential – Special Care 16 21 30 0.6
Residential – High Support 41 30 23 0.4
At home under Care Order 44 41 38 0.7
Other 164 128 172 3.2
Length of stay
Less than 1 year 1,414 1,339 1,236 23.1
1-5 years 2,069 1,985 2,181 40.7
5 years or more 1,764 1,983 1,940 36.2
Source: Child Care Interim Data Set, HSE

193
CHILDREN AND YOUNG PEOPLE IN CARE
PA
RT
4: F
OR
MA
L A
ND
IN
FOR
MA
L S
UP
PO
RT
Sdifferences by geographic locationThe highest number and percentage of children in the care of the HSE was in the ■
Dublin North West Local Health Office (LHO) Area in the HSE Dublin North East Region (see Table 127). This was followed by the North Lee LHO Area in the HSE South Region.
Table 127: Number and percentage of children in the care of the HSE, by HSE Region and Local Health Office (LHO) Area (2008)
No. %
Total 5,357 100.0
HSE Dublin North East 1,396 26.1
Cavan/Monaghan 152 2.8
Dublin North 137 2.6
Dublin North Central 356 6.6
Dublin North West 430 8.0
Louth 178 3.3
Meath 143 2.7
HSE Dublin Mid-Leinster 1,456 27.2
Dublin South 141 2.6
Dublin South City 141 2.6
Dublin South East 102 1.9
Dublin South West 183 3.4
Dublin West 214 4.0
Kildare/West Wicklow 209 3.9
Laois/Offaly 202 3.8
Longford/Westmeath 116 2.2
Wicklow 148 2.8
continued

194
STATE OF THE NATION’S CHILDREN – IRELAND 2010
Table 127 (continued)
No. %
HSE South 1,471 27.5
Carlow/Kilkenny 148 2.8
Kerry 130 2.4
North Cork 78 1.5
North Lee 363 6.8
South Lee 190 3.5
Tipperary SR 134 2.5
Waterford 187 3.5
West Cork 61 1.1
Wexford 180 3.4
HSE West 1,034 19.3
Clare 126 2.4
Donegal 124 2.3
Galway 170 3.2
Limerick 225 4.2
Mayo 111 2.1
Roscommon 121 2.3
Sligo/Leitrim/West Cavan 76 1.4
Tipperary NR 81 1.5
Source: Child Care Interim Data Set, HSE

195
MENTAL HEALTH REFERRALS
PA
RT
4: F
OR
MA
L A
ND
IN
FOR
MA
L S
UP
PO
RT
SMentAl heAlth reFerrAls
there has been an increase in the number of children admitted to psychiatric hospitals.
Measure
the number of admissions to psychiatric hospitals among children.
key findingsIn 2008, there were 406 admissions to psychiatric hospitals among children. This ■
equates to an overall rate of 37.4 children per 100,000.
differences by age, gender, diagnosis and over time84.0% (341) of children admitted to psychiatric hospitals were aged 15-17 years ■
(see Table 128).
41.9% (170) of children admitted to psychiatric hospitals were boys and 58.1% ■
(236) were girls. This equates to a rate of 30.6 per 100,000 boys and 44.6 per 100,000 girls.
The most common reason for children being admitted to psychiatric hospitals was ■
for ‘neuroses’ (33.7%), followed by ‘depressive disorders’ (26.1%) Other common reasons included ‘personality disorders’ (7.4%) and ‘other psychoses’ (6.9%).
Over the period 2004-2008, the number of admissions to psychiatric hospitals ■
among children ranged from 333 in 2005 to 406 in 2008.

196
STATE OF THE NATION’S CHILDREN – IRELAND 2010
Table 128: Number, percentage and rate (per 100,000) of admissions to psychiatric hospitals among children, by age, gender and diagnosis (2004-2008)
2004 2005 2006 2007 2008
No. No. No. No. No. %Rate per 100,000
Total 352 333 398 364 406 100.0 37.4
Age
0-4 0 0 0 0 0 0.0 0.0
5-9 5 1 4 4 3 0.7 1.0
10-14 38 46 61 72 62 15.3 22.1
15-17 309 286 333 288 341 84.0 197.0
Gender
Boys 185 181 218 153 170 41.9 30.6
Girls 167 152 180 211 236 58.1 44.6
Diagnosis
Alcoholic disorders 17 13 17 12 8 2.0 0.7
Depressive disorders 79 88 118 90 106 26.1 9.8
Drug dependence 32 33 23 15 17 4.2 1.6
Mania 22 11 23 18 21 5.2 1.9
Mental handicap 5 6 1 2 2 0.5 0.2
Neuroses 75 63 56 104 137 33.7 12.6
Organic psychoses 7 5 15 12 3 0.7 0.3
Other psychoses 13 14 19 10 28 6.9 2.6
Personality disorders 40 36 29 21 30 7.4 2.8
Schizophrenia 27 30 32 27 13 3.2 1.2
Unspecified 35 34 65 53 41 10.1 3.8
Source: National Psychiatric In-Patient Reporting System (NPIRS), Health Research Board
differences by geographic location23.2% of children admitted to psychiatric hospitals were from Dublin ( ■ see Table 129).

197
MENTAL HEALTH REFERRALS
PA
RT
4: F
OR
MA
L A
ND
IN
FOR
MA
L S
UP
PO
RT
STable 129: Number and percentage of admissions to psychiatric hospitals among children, by county (2008)
No. %
Total 406 100.0
County
Carlow 7 1.7
Cavan 6 1.5
Clare 5 1.2
Cork City and County 25 6.2
Donegal 9 2.2
Dublin 94 23.2
Galway City and County 24 5.9
Kerry 19 4.7
Kildare 20 4.9
Kilkenny 5 1.2
Laois 10 2.5
Leitrim 4 1.0
Limerick City and County 24 5.9
Longford 3 0.7
Louth 2 0.5
Mayo 14 3.4
Meath 20 4.9
Monaghan 3 0.7
Offaly 8 2.0
Roscommon 2 0.5
Sligo 5 1.2
Tipperary 23 5.7
Waterford City and County 9 2.2
Westmeath 13 3.2
Wexford 32 7.9
Wicklow 19 4.7
England and Northern Ireland 1 0.3
Source: National Psychiatric In-Patient Reporting System (NPIRS), Health Research Board

198
STATE OF THE NATION’S CHILDREN – IRELAND 2010

199
APPENDIX 1: MAIN DATA SOURCES
AP
PE
ND
IX 1
: MA
IN D
ATA
SO
UR
CE
SAppendices
APPENDICES

200
AppendiX 1: MAin dAtA sources, deFinitions And relevAnt technicAl notes
report of the committee Appointed to Monitor the effectiveness of the diversion programme: An garda síochána
The Report of the Committee Appointed to Monitor the Effectiveness of the Diversion Programme is published on an annual basis. The following indicator draws on data from this source:
Number of children aged 10-17 referred/referrals to Garda Juvenile Diversion ■
Programme.
census of the population and population estimates: central statistics office
The Census of Population is conducted by the Central Statistics Office (CSO) on a quinquennial basis. The following indicators, which draw on data from this source, define children as ‘all population under 18 years of age’ when the data were collected. Figures are based on either place of usual residence and present on Census night or de facto presence on Census night:
Number of children (de facto). ■
Number of children living in a lone-parent household (usual residence and present). ■
Percentage of children whose mothers have attained (a) primary, (b) lower secondary, (c) ■
upper secondary or (d) third-level education (usual residence and present).
Number of Traveller children (de facto). ■
Number of foreign national children (usual residence and present). ■
Number of children with a disability (de facto). ■
parental education level data refer to the highest educational attainment of the mother rather than the head of household. Where no mother is present, the highest educational attainment of the father is used instead. The figures are based on responses to Question 23 of the 2006 Census, which distinguishes between the following main categories:
No formal education or just primary education.1.
Lower secondary education: Junior, Intermediate/Group Certificate, ‘O’ levels/GCSEs, 2. NCVA Foundation Certificate, Basic Skills Training Certificate or equivalent.
Upper secondary: Leaving Certificate, ‘A’ levels, NCVA Level 1 Certificate or 3. equivalent, Technical or Vocational qualification, both Upper Secondary and Technical or Vocational qualification.

201
APPENDIX 1: MAIN DATA SOURCES, DEFINITIONS AND RELEVANT TECHNICAL NOTES
AP
PE
ND
IX 1
: MA
IN D
ATA
SO
UR
CE
SThird level: Non-degree, primary degree, professional qualification (of Degree status 4. at least), both a Degree and a Professional qualification, post-graduate Certificate or Diploma, post-graduate Degree (Masters) or Doctorate (PhD).
A person is classified as a traveller in the 2006 Census if the answer is ‘Irish Traveller’ to Question 14: ‘What is your ethnic or cultural background?’.
A person is identified as a foreign national in the 2006 Census if the answer is not ‘Irish’ to Question 6: ‘What is your nationality?’.
A person is defined as having a disability if they answer ‘Yes’ to any of the 5 options in Question 15 or Question 16.
Question 15: ‘ ■ Do you have any of the following long-lasting conditions?’
Blindness, deafness or a severe vision or hearing impairment.(a)
A condition that substantially limits one or more basic physical activities, (b) such as walking, climbing stairs, reaching, lifting or carrying.
A learning or intellectual disability.(c)
A psychological or emotional condition.(d)
Other, including any chronic illness.(e)
Question 16: ‘ ■ If Yes to any of the conditions specified in Question 15, do you have any difficulty in doing any of the following activities?’
Learning, remembering or concentrating.(a)
Dressing, bathing or getting around inside the home.(b)
Going outside the home alone to shop or visit a doctor’s surgery.(c)
Working at a job or business or attending school or college.(d)
Participating in other activities, for example, leisure or using transport.(e)
childcare interim dataset: health service executive
The Childcare Interim Dataset is an administrative data source managed by the Health Service Executive (HSE). The following indicators draw on data from this source:
The number of separated children seeking asylum. ■
The number of child welfare and protection reports that went to initial assessment. ■
The number of confirmed child abuse cases. ■
The number of children in the care of the HSE. ■

202
STATE OF THE NATION’S CHILDREN – IRELAND 2010
The number of child welfare and protection reports that went to initial assessment and confirmed child abuse cases are important measures of the incidence of child abuse and neglect in Ireland. It should be noted, however, that these are affected by a number of factors other than the actual incidence of abuse and neglect, and some caution is thus required in drawing conclusions concerning the overall prevalence of abuse and neglect for the following reasons: (1) some cases of abuse and neglect are never reported; (2) some incidents are reported more than once and several reports may relate to a single family; and (3) reports tend to increase for reasons unrelated to the actual prevalence of abuse and neglect, such as a highly publicised case or public awareness campaign.
Some caution should be adopted when comparing across HSE Regions because of differences in the way in which cases are recorded. Work is currently taking place on the development of consistent approaches across the HSE Regions.
childcare Module: Quarterly national household survey: central statistics office
The Childcare Module attached to Quarter 4 of 2007 of the Quarterly National Household Survey is conducted by the Central Statistics Office (CSO). This Module is administered to all households in which there were primary school-going children or pre-school children. The following indicators draw on data from this source:
Percentage of children under 13 years of age who avail of non-parental childcare. ■
Percentage of households with children under 13 years of age who report that ■
they ‘have access to high-quality, affordable childcare in the community’.
Households were asked to indicate from the following categories the main type of childcare for their pre-school and primary school-going children:
Child minded at home by me/my partner.1.
Unpaid relative or family friend.2.
Paid relative or family friend.3.
Paid childminder/au pair/nanny.4.
Work-based crèche.5.
Crèche/Montessori/playgroup/after-school facility.6.
Special needs facility.7.
Other.8.

203
APPENDIX 1: MAIN DATA SOURCES, DEFINITIONS AND RELEVANT TECHNICAL NOTES
AP
PE
ND
IX 1
: MA
IN D
ATA
SO
UR
CE
S‘childcare’ was defined as types of childcare arrangements usually made by parents/guardians on a regular weekly basis during the working day (e.g. Monday to Friday, 7am-7pm, or similar, as applicable to the household).
‘pre-school’ refers to children aged up to 5 years who are not attending primary school and a small number who have not stated if they are attending primary school.
‘primary school’ refers to children aged between 4 and 12 years who are attending primary school and a small number aged 6 to 12 years who have not stated if they are attending primary school or who have stated that they are not attending primary school.
department of education and skills
The following indicators draw on data from the Department of Education and Skills:Percentage of children leaving national school by destination. ■
Public expenditure on education. ■
children leaving national school by destination are drawn from the school-based returns collated by the Department of Education and Skills. Tables refer to children leaving ordinary classes in national schools.
Non-capital public expenditure on education includes direct public expenditure on educational institutions, public subsidies to other private entities for education matters and public subsidies to households, such as scholarships and loans to students for tuition fees and student living costs.
The expenditure has been deflated to real prices by using the National Accounts series for net expenditure by Central and Local Government on current goods and services at base year 2008.
Public expenditure on education as used for the international comparison includes both current and capital expenditure.
In the mid-1990s, undergraduate tuition fees were abolished in Ireland.
Educational institutions are defined as entities that provide instructional services to individuals or education-related services to individuals and other educational institutions.
International data are collected through the joint UNESCO-OECD-Eurostat data collection questionnaires on educational finance. Countries provide data, coming usually from administrative sources on the basis of commonly agreed definitions.

204
STATE OF THE NATION’S CHILDREN – IRELAND 2010
Data on total public expenditure on education are expressed as a percentage of Gross Domestic Product (GDP). GDP is the central aggregate of National Accounts. It represents the total value added (output) in the production of goods and services in the country.
National public expenditure as a percentage of GDP is calculated using figures in national currency both for public expenditure and for GDP. European averages are weighted and therefore take into account the relative proportion of the student population or the education expenditure of the considered countries. They are calculated taking into account all relevant countries for which data are available. They are considered of sufficient quality if countries with available data exceed 70% of the population or of the GDP of the European aggregate.
GDP less net primary incomes from abroad less EU taxes plus EU subsidies is equal to Gross National Income (GNI). As can be seen from Table A1-1, Ireland is almost unique among EU countries in the level of divergence between GDP and GNI. Therefore in tables comparing expenditure across EU countries, Irish expenditure is shown under two measures – % of GDP and % of GNI – to reflect this situation.
table A1-1: eu – gross domestic product (gdp) and gross national income (gni) at current market
prices, by country (2009)
Country GDP €bn
GNI €bn
GNI as % of GDP
Luxembourg 37.8 25.9 68.7
Ireland 159.6 132.6 83.1
Malta 5.7 5.3 93.4
Czech Republic 137.2 129.1 94.1
Hungary 93.1 87.6 94.1
Portugal 167.6 162.0 96.6
Poland 310.1 300.0 96.7
Greece 237.5 230.9 97.2
Estonia 13.7 13.4 97.7
Netherlands 570.2 557.1 97.7
Bulgaria 33.9 33.1 97.7
Spain 1,051.2 1,031.4 98.1
Romania 115.9 113.7 98.2
Cyprus 16.9 16.6 98.2
Italy 1,520.9 1,494.6 98.3
Slovenia 34.9 34.4 98.5
continued

205
APPENDIX 1: MAIN DATA SOURCES, DEFINITIONS AND RELEVANT TECHNICAL NOTES
AP
PE
ND
IX 1
: MA
IN D
ATA
SO
UR
CE
S
Country GDP €bn
GNI €bn
GNI as % of GDP
Slovakia 63.3 62.6 98.8
Austria 277.1 274.2 99.0
Lithuania 26.6 26.5 99.3
EU-27 11,802.5 11,749.7 99.6
Finland 171.0 170.9 99.9
Belgium 337.3 340.0 100.8
France 1,907.1 1,922.8 100.8
Germany 2,409.1 2,444.0 101.4
Sweden 292.7 298.0 101.8
United Kingdom 1,566.7 1,598.1 102.0
Denmark 222.9 229.4 102.9
Latvia 18.5 20.0 107.8
ecce database: office of the Minister for children and youth Affairs
The Early Childhood Care and Education (ECCE) Database is an administrative data source managed by the Office of the Minister for Children and Youth Affairs. This was established in 2010 to monitor the Free Pre-School Year (ECCE) Scheme. The following indicator draws on data from this source:
Percentage of Early Childhood Care and Education (ECCE) services under contract to ■
deliver the Free Pre-School Year Scheme that meet basic and higher capitation criteria.
The Free Pre-School Year (ECCE) Scheme provides every child in the eligible age cohort (i.e. participating children must normally be more than 3 years 2 months and less than 4 years 7 months in September of the relevant year) with up to 15 hours per week of free early childhood care and education provision for 38 weeks per year. Pre-school services are contracted by the State to provide the free pre-school year on the basis of meeting a number of criteria, including qualification of staff. Two capitation rates are available:
The ■ basic capitation rate requires the following qualification profile:
Pre-School Leaders must hold certification for a major award in childcare/early education at a minimum of Level 5 on the National Framework of Qualifications of Ireland (NFQ) or an equivalent nationally recognised qualification or a higher award in the childcare/early education field.
table A1-1 (continued)

206
STATE OF THE NATION’S CHILDREN – IRELAND 2010
In recognition of the unprecedented nature of these criteria, an interim measure was provided for whereby services could be contracted to deliver the Free Pre-school Year Scheme if they could meet the following criteria:
During the period September 2010 to August 2012, the qualification requirement will be considered to be met where a person can demonstrate that he or she has achieved a certification for an award in ECCE that includes significant content covering the core knowledge areas, child development, early learning, health and welfare, and has at least 2 years’ experience of working in a position of responsibility with children in the 0-6 age range.
The ■ higher capitation rate is awarded based on the following criteria:
A higher capitation fee, equivalent to €75 per week for 38 weeks, will be payable to playschool sessional service providers where all Pre-school Leaders hold a Bachelor degree in childcare/early education (minimum of Level 7 on the National Framework of Qualifications (NFQ) or equivalent) and have 3 years’ experience working in the sector, and where all Pre-school Assistants hold a relevant major award in childcare/early education at Level 5 on the NFQ or its equivalent.
The Free Pre-School Year (ECCE) Scheme commenced in January 2010, therefore data above for 2009/2010 pertains to the period January – June 2010. A full year will normally comprise data from September to June of the following year.
Data are collected by each City and County Childcare Committee. In some cases, larger counties will have both a City and County Committee, e.g. Cork. Dublin has a childcare committee for each Local Authority area, e.g. Fingal, Dun Laoghaire/Rathdown.
european union survey on income and living conditions (eu-silc): central statistics office
The European Union Survey on Income and Living Conditions (EU-SILC) is conducted in Ireland by the Central Statistics Office. The EU-SILC collects information on poverty, deprivation and social exclusion. The following indicators draw on data from this source:
At risk of poverty: ■ The percentage of children living in households with an equivalised household disposable income below the 60% median.
consistent poverty: ■ The percentage of children living in households with an equivalised household disposable income below the 60% median who experienced at least two forms of enforced deprivation.

207
APPENDIX 1: MAIN DATA SOURCES, DEFINITIONS AND RELEVANT TECHNICAL NOTES
AP
PE
ND
IX 1
: MA
IN D
ATA
SO
UR
CE
SThere are two definitions of income and ‘at risk of poverty’ (EU and national) used in the measures shown in this report. The key difference between the national and EU definition of income is that the national definition includes income from private pensions, while the EU definition does not. The calculation of national and EU risk of poverty measures involves the use of different equivalence scales. The purpose of an equivalence scale is to account for the size and composition of different income units (households) and thus allows for a more accurate comparison between households.
The national equivalence scale used to obtain the equivalised household size attributes a weight of 1.0 to the first adult in a household, 0.66 to each subsequent adult (aged 14+ living in the household) and 0.33 to each child less than 14.
For EU at risk of poverty rates, the equivalised disposable income for each person is calculated as the total net income figure divided by the equivalised household size according to the modified OECD scale (which gives a weight of 1.0 to the first adult, 0.5 to other persons aged 14 or over who are living in the household and 0.3 to each child aged less than 14).
In the Tables and Figures given in this report, tables with national data only use the national income definition and equivalence scale to calculate the ‘risk of poverty’ rate, while tables showing EU comparisons use the corresponding EU definitions.
The indicators shown in this report refer to income after social transfers are included.
In 2009, the ‘at risk of poverty’ threshold for an individual was €12,064.*
‘consistent poverty’ is a measure designed to examine the extent to which persons at risk of poverty may be excluded and marginalised from participating in activities that are considered the norm for other people in society. To this end, a set of basic deprivation indicators (listed below) have been agreed. Persons in consistent poverty are defined as persons who are at risk of poverty (national measure) and who live in households deprived, through inability to afford them, of two or more of the following basic deprivation items:
Two pairs of strong shoes. ■
A warm waterproof overcoat. ■
Buy new (not second-hand) clothes. ■
Eat a meal with meat, chicken, fish (or vegetarian equivalent) every second day. ■
Have a roast joint or its equivalent once a week. ■
Had to go without heating during the last year through lack of money. ■
Keep the home adequately warm. ■
* Central Statistics Office (2010) Survey on Income and Living Conditions: 2009. Dublin: Government Publications.

208
STATE OF THE NATION’S CHILDREN – IRELAND 2010
Buy presents for family or friends at least once a year. ■
Replace any worn-out furniture. ■
Have family or friends for a drink or meal once a month. ■
Have a morning, afternoon or evening out in the last fortnight for entertainment. ■
health Behaviour of school-aged children (hBsc) survey: health promotion research centre
The Health Behaviour in School-aged Children (HBSC) Survey is conducted in Ireland by the Health Promotion Research Centre on a quadrennial basis. This comprises self-report, self-completion questionnaires completed by children in schools. The following indicators draw on data from this source:
Percentage of children who report that they find it easy to talk to their mother when ■
something is really bothering them.
Percentage of children who report that they find it easy to talk to their father when ■
something is really bothering them.
Percentage of children who report to have 3 or more friends of the same gender. ■
Percentage of children who report having a pet of their own or a pet in their family. ■
Percentage of children who report to have been bullied in school (in the past couple ■
of months).
Percentage of children who report that students at their school participate in making ■
the school rules.
Percentage of children who report smoking cigarettes every day. ■
Percentage of children who report to have been drunk at least once in the last 30 days. ■
Percentage of children who report having taken cannabis at least once in their lifetime. ■
Percentage of children who report feeling happy with the way they are. ■
Percentage of children who report being happy with their lives at present. ■
Percentage of children who report to be physically active for at least 60 minutes ■
per day on more than 4 days per week.
Percentage of children who report to eat breakfast 5 or more days per week. ■
Percentage of children who report feeling safe in the area where they live. ■
Percentage of children who report that there are good places in their area to spend ■
their free time.

209
APPENDIX 1: MAIN DATA SOURCES, DEFINITIONS AND RELEVANT TECHNICAL NOTES
AP
PE
ND
IX 1
: MA
IN D
ATA
SO
UR
CE
SData are subject to potential bias in relation to self-presentation and memory. They may also suffer from social desirability bias.
social class is classified into one of the following social class groups (introduced in 1996 by the CSO), which are defined on the basis of occupation:
Social Class I: ProfessionalSocial Class II: ManagerialSocial Class III: Non-manualSocial Class IV: Skilled manualSocial Class V: Semi-skilledSocial Class VI: Unskilled
nuts is an acronym for the EU Nomenclature of Territorial Units for Statistics. This classification was legally established by EU Regulation No. 1059/2003 on 29 May 2003. The 8 Regional Authorities (NUTS 3 regions) were established under the Local Government Act, 1991. In Ireland, it is classified hierarchically as Level 1 – Ireland, Level 2 – Regions and Level 3 – Regional Authorities (see Appendix 2).
Children are identified as Traveller children if they answered ‘Yes’ to the question ‘Are you a member of the Traveller community?’.
Children are identified as having a disability and/or chronic illness if they answered ‘Yes’ to the question ‘Do you have a long-term illness, disability, or a medical condition (like diabetes, asthma, allergy or cerebral palsy) that has been diagnosed by a doctor?’.
Children are identified as immigrants if both their parents were born outside of Ireland.
hospital in-patient enquiry: department of health and children
The Hospital In-Patient Enquiry (HIPE) system is an administrative data source managed by the Economic and Social Research Institute (ESRI) on behalf of the Department of Health and Children and the Health Service Executive. HIPE provides information on each hospital discharge. The following indicators draw on data from this source, which was provided by the Department of Health and Children:
The number of hospital discharges among children. ■
The number of hospital discharges among children with a diagnosis of external causes of ■
injury or poisoning.
HIPE data for 1994-2004 were classified using ICD-9-CM. All HIPE discharges from 2005 are now coded using ICD-10-AM (the Australian Modification of ICD-10 incorporating the Australian Classification of Health Interventions). This system includes significant changes in

210
STATE OF THE NATION’S CHILDREN – IRELAND 2010
the classification of diagnoses and procedures. This means that it is not possible to directly compare the data published for 2005-2009 in this report to previously reported data for 1994-2004.
Care must be taken not to use hospitalisation rates as a proxy for incidence or prevalence of ill-health in children. Rates are based on episodes of care such that an individual case will be counted separately in the statistics for each admission to hospital. In addition, hospital data will reflect changes in treatment protocols, as well as issues of access to care.
HIPE has covered close to 100% of the discharges from publicly funded acute hospitals in recent years.
immunisation uptake statistics: health protection surveillance centre
National data on immunisation are collated by the Health Protection Surveillance Centre (HPSC) using data provided by the HSE Regions on a quarterly basis. There is no national database on immunisation. The following indicator draws on data from this source:
The percentage uptake of the recommended doses of vaccines among children at ■
(a) 12 months and (b) 24 months of age.
The immunisation uptake data presented relate to children who reached their first or second birthday (uptake at 12 and 24 months respectively) during the quarters/year in question and who have received the following as appropriate (i.e. depending on their age/birth cohort):
D ■3 3 doses of vaccine against diphtheria
P ■3 3 doses of vaccine against pertussis
T ■3 3 doses of vaccine against tetanus
Hib ■3 3 doses of vaccine against Haemophilus influenzae type b
Polio ■3 3 doses of vaccine against polio
HepB ■3 3 doses of vaccine against hepatitis B
MenC ■3 3 doses of vaccine against meningococcal group C
MenC ■2 2 doses of vaccine against meningococcal group C
PCV ■2 2 doses of vaccine against pneumococcal conjugate vaccine
Hib ■b 1 booster dose of vaccine against Haemophilus influenzae type b
after 12 months of age
MMR ■1 1 dose of vaccine against measles, mumps and rubella
BCG 1 dose of Bacillus Calmette-Guerin vaccine ■

211
APPENDIX 1: MAIN DATA SOURCES, DEFINITIONS AND RELEVANT TECHNICAL NOTES
AP
PE
ND
IX 1
: MA
IN D
ATA
SO
UR
CE
SSince 18 September 2006, a Hib booster was recommended at the same time as MMR1. This
followed the national Hib campaign from November 2005 to May 2006 among children less than 4 years of age. Since 1st September 2008, the new primary childhood immunisation schedule has been implemented. The changes to the primary schedule for children born on or after 1st July 2008 include:
Introduction of a hepatitis B vaccine (as part of a 6 in 1 vaccine) given at ■
2, 4 and 6 months of age.
Introduction of pneumococcal conjugate vaccine given at 2, 6 and 12 months of age. ■
Change in timing of meningococcal serogroup C conjugate vaccination, now given at ■
4, 6 and 13 months of age.
Change in timing of the ■ Haemophilus influenzae type b vaccination, now given at 2, 4, 6 and 13 months of age.
Please see www.immunisation.ie for complete information on the Irish childhood immunisation schedule and changes to the schedule introduced in September 2008.
As a new childhood immunisation schedule was introduced in 2008 for those born on or after 1st July 2008, the 2009 MenC
3 data at 12 months are for those born between 1st January and
30th June 2008 (i.e. Quarters 1 and 2 data only) and the 2009 HepB3, MenC
2 and PCV
2 data at
12 months are for those born between 1st July and 31st December 2008 (i.e. Quarters 3 and 4 data only).
Some of the immunisation uptake data presented in this report are incomplete. The 2008 national MenC
3 data at 12 months are incomplete as MenC
3 data were not available for 13
Local Health Offices (LHOs) in Quarter 3 2008. The available 2008 12-month national MenC3
data may be around 98% of the national birth cohort. The 2009 data for those at 12 months are incomplete since the following were unavailable: the Quarter 1 2009 D
3, T
3, P
3 and Polio
3
data for 10 LHOs for those born on 31st March 2008; the Quarter 3 2009 data for 6 LHOs; the MenC
2 data for 13 LHOs; the PCV
2 data for 10 LHOs; and the Quarter 4 2009 data for 9 LHOs.
The available 2009 national 12-month D3, T
3, P
3, Hib
3 and Polio
3 cohort data may be around 88%
of the 2009 national birth cohort. The MenC3 cohort data are complete (for Quarters 1 and 2
2009). The available 2009 national HepB3, MenC
2 and PCV
2 data may be around 76%, 54%
and 58% respectively of (the combined Quarters 3 and 4) national birth cohorts. BCG uptake data were available for 12 LHOs from 2005 to Quarter 2 2009, and represent approximately one-third of the national birth cohort. BCG uptake data were available for 9 LHOs in Quarter 3 2009 and for 6 LHOs in Quarter 4 2009. The available 2009 national BCG cohort data may be around 27% of the national birth cohort.

212
STATE OF THE NATION’S CHILDREN – IRELAND 2010
The 2005 MMR1 data at 24 months are incomplete since in Quarter 4 2005 MMR
1 data were
not available for 10 LHOs. The 2006 MMR1 data includes MMR
1 data for 10 LHOs, which are an
estimate only (due to technical problems with extracting MMR1 data). The 2007 Hib
b data are
incomplete since data for 3 LHOs in Quarter 1 2007 and for 2 LHOs in Quarter 3 2007 were not available. The 2007 Hib
b data also include data from 4 LHOs that were an underestimate due
to data extraction methods. The 2008 MenC3 data are incomplete since MenC
3 data for 13 LHOs
were not available in Quarter 3 2008. The 2008 Hibb data are incomplete since Quarter 2 2008
data for 4 LHOs and Quarter 3 2008 for 3 LHOs were not available. The 2009 data for those at 24 months are incomplete since the following were unavailable: the Quarter 1 2009 D
3, T
3, P
3
and Polio3 data for 10 LHOs for those born on 31st March 2007; the Quarter 2 2009 Hib
b uptake
data for one LHO; the Quarter 4 2009 data for 3 LHOs; the Hibb data for one LHO and Hib
b data
for 4 LHOs for those given a Hib dose as part of the 5 in 1 or 6 in 1 vaccine after 12 months of age. The available 2009 national 24-month D
3, T
3, P
3, Hib
3, Polio
3, MenC
3 and MMR
1 birth cohort
data may be around 98% of the national birth cohort and the available Hibb data may be around
95% of the national birth cohort.
International data on immunisation is collated by the World Health Organization (WHO) to monitor and assess the impact of strategies and activities for reducing morbidity and mortality of vaccine-preventable diseases. In most countries, the data collected refer to the number of doses administered to the target population divided by the total estimated number of people in the target population. The target population groups vary from country to country and are dependent on the national immunisation schedule in place.
national educational welfare Board database
National data on school attendance are drawn from the School Attendance Reports, which are prepared by individual schools at primary and post-primary level and collated by the National Educational Welfare Board (NEWB). The following indicator draws on data from this source:
Percentage of children who are absent from school for 20 days or more ■
in the school year.
For the 2007/08 school year, 95% of primary schools and 91% of post-primary schools returned School Attendance Reports to the NEWB.
Data in Table 49 present 20-day absences at the student level and data in Table 50 present 20-day absences at the school level.

213
APPENDIX 1: MAIN DATA SOURCES, DEFINITIONS AND RELEVANT TECHNICAL NOTES
AP
PE
ND
IX 1
: MA
IN D
ATA
SO
UR
CE
Snational intellectual disability database: health research Board
The National Intellectual Disability Database (NIDD) is an administrative data source managed by the Health Research Board. The NIDD was established in 1995 to provide a comprehensive and accurate information base for decision-making in relation to the planning, funding and management of services for people with an intellectual disability. The following indicator draws on data from this source:
The number of children under 18 years registered as having an intellectual disability. ■
Currently, there is approximately 95% coverage on the NIDD. Participation in this database is voluntary and only includes those in receipt of, or requiring, specialised disability services; therefore, the NIDD may not include all people living in Ireland who have an intellectual disability.
national perinatal reporting system: economic and social research institute
The National Perinatal Reporting System (NPRS) is an administrative data source managed by the Economic and Social Research Institute (ESRI) on behalf of the Department of Health and Children and the Health Service Executive. The NPRS provides details of national statistics on perinatal events (live births, late foetal deaths and still births). The information collected includes data on pregnancy outcomes, with particular reference to perinatal mortality and important aspects of perinatal care. In addition, descriptive social and biological characteristics of mothers giving birth and their babies are recorded. The following indicators draw on data from this source:
Percentage of babies born weighing less than 2,500 grams (live and still births). ■
Percentage of infants who are breastfed (exclusive or combined) on discharge ■
from hospital.
Percentage of mothers attending for antenatal care in the first trimester of pregnancy. ■
The collection of data on timing of first antenatal contact variable attempts to capture important information on Irish women’s first contact with the healthcare services during pregnancy. This variable acts as an indicator of the length of antenatal care each mother has received and can be examined with birth, still birth and mortality rates. The completion of this indicator at present, however, may not provide an accurate estimation of this information. Although 79.1% of total births were recorded as receiving combined antenatal care in 2008, the date of the first visit to the doctor was recorded as ‘not known’ for 43.4% of these births. As a result of the absence of these data, the timing of first contact with health professionals within this category will reflect the date of the first hospital visit, even though this is likely to have been later than the first doctor visit.

214
STATE OF THE NATION’S CHILDREN – IRELAND 2010
national physical and sensory disability database: health research Board
The National Physical and Sensory Disability Database (NPSDD) is an administrative data source managed by the Health Research Board. The NPSDD was established in 2000 to provide a comprehensive and accurate information base for decision-making in relation to the planning, funding and management of services for people with a physical and/or sensory disability. The following indicator draws on data from the NPSDD:
The number of children under 18 years registered as having a physical and/or sensory ■
disability.
Currently, there is approximately 65% coverage on the NPSDD. Participation in this database is voluntary and only includes those in receipt of, or requiring, specialised disability services who are aged under 66 years of age; therefore, the NPSDD may not include all people living in Ireland who have a physical and/or sensory disability.
national psychiatric in-patient reporting system: health research Board
The National Psychiatric In-Patient Reporting System (NPIRS) is an administrative data source managed by the Health Research Board. The data collected for the NPIRS include demographic data relating to each patient (such as gender, date of birth, marital status, address from which admitted and socio-economic group), together with clinical and diagnostic information (such as date of admission/discharge, legal category, order of admission, diagnosis on admission and discharge in accordance with the WHO International Classification of Diseases categories (ICD 10), and reason for discharge). The following indicator draws on data from the NPIRS:
Number and percentage of admissions to psychiatric hospitals among children. ■
patient treatment register: national treatment purchase Fund
The Patient Treatment Register (PTR) is an administrative data source managed by the National Treatment Purchase Fund. This on-line register of patients on in-patient and day-case surgical and medical waiting lists in Ireland has been operational since September 2005 and now includes information from 44 hospitals (see below). The following indicator draws on data from the PTR:
Number of children on hospital waiting lists (surgical and medical). ■

215
APPENDIX 1: MAIN DATA SOURCES, DEFINITIONS AND RELEVANT TECHNICAL NOTES
AP
PE
ND
IX 1
: MA
IN D
ATA
SO
UR
CE
SBantry General Hospital
Beaumont Hospital, Dublin
Cappagh Orthopaedic Hospital
Cavan General Hospital**
Children’s University Hospital, Temple Street**
Connolly Hospital, Blanchardstown
Cork University Hospital
Kerry General Hospital
Letterkenny General Hospital
Lourdes Orthopaedic Hospital, Kilcreene**
Louth County Hospital**
Mallow General Hospital
Mater Hospital, Dublin
Mayo General Hospital
Mercy University Hospital, Cork
Merlin Park Hospital, Galway
Midlands Regional Hospital, Mullingar
Midlands Regional Hospital, Portlaoise
Midlands Regional Hospital, Tullamore
Mid-Western Regional Hospital, Croom
Mid-Western Regional Hospital, Dooradoyle
Mid-Western Regional Hospital, Ennis
Mid-Western Regional Hospital, Nenagh
Monaghan General Hospital**
Naas General Hospital
Our Lady of Lourdes Hospital, Drogheda**
Our Lady’s Hospital for Sick Children, Crumlin
Our Lady’s Hospital, Navan**
Portiuncula Hospital
Roscommon County Hospital
Royal Victoria Eye and Ear Hospital, Dublin
Sligo General Hospital
South Infirmary – Victoria Hospital, Cork
South Tipperary General Hospital**
St. Colmcille’s Hospital, Loughlinstown
St. James’s Hospital, Dublin
St. John’s Hospital, Limerick*
St. Luke’s Hospital, Kilkenny**
St. Michael’s Hospital, Dun Laoghaire
St. Vincent’s University Hospital, Dublin
Tallaght Hospital (AMNCH), Dublin
University College Hospital, Galway
Waterford Regional Hospital**
Wexford General Hospital**
* St. John’s Hospital has been unable to provide information in prescribed extract format since May 2009.
** These hospitals have not returned data since January due to industrial action. Waiting list volumes for these hospitals are the most recent data received.
The PTR only includes children who have been assessed at an out-patient clinic as in need of a surgical or medical procedure; it does not include children who are waiting to be seen at an out-patient clinic.

216
STATE OF THE NATION’S CHILDREN – IRELAND 2010
programme of international student Assessment (pisA) survey: education research centre
The Programme of International Student Assessment (PISA) Survey is conducted in Ireland by the Education Research Centre on a triennial basis. This comprises self-report, self-completion questionnaires completed by children in schools. The following indicators draw on data from this source:
Percentage of children aged 15 who report that their parents spend time just talking ■
with them several times a week.
Percentage of children aged 15 who report that their parents discuss with them ■
how well they are doing at school more than once a week.
Percentage of children aged 15 who report that their parents eat a main meal ■
with them around a table more than once a week.
Percentage of children aged 15 who report that reading is one of their favourite hobbies. ■
These data may be subject to bias in relation to self-presentation and memory. They may suffer from social desirability bias.
PISA also includes an assessment of ‘literacy’. In 2009, reading was a major assessment domain in PISA, meaning that it was comprehensively assessed, using a large number of test items. Mathematical literacy and science literacy were minor assessment domains. The following indicators draw on data from this source:
Mean score for children aged 15 based on OECD-PISA Reading Literacy Scale. ■
Mean score for children aged 15 based on OECD-PISA Mathematics Literacy Scale. ■
Mean score for children aged 15 based on OECD-PISA Combined Scientific Literacy Scale. ■
The figures referred to as the OECD ‘mean score’ refer to the OECD ‘country average’, i.e. it is the average of the country means and not of all the OECD students pooled together.
Children are identified as Traveller children if they answer ‘Yes’ to the question ‘Are you a member of the Traveller community?’. In 2009, 2% of 15-year-olds in PISA reported that they were members of the Traveller community.
Children are identified as immigrants if the answer is not ‘Republic of Ireland’ to the question ‘In what country were you and your parents born?’. The percentage of immigrant children in PISA increased from 2.3% in 2000 to 8.3% in 2009. Some immigrant children in Ireland speak English or Irish as their first language.

217
APPENDIX 1: MAIN DATA SOURCES, DEFINITIONS AND RELEVANT TECHNICAL NOTES
AP
PE
ND
IX 1
: MA
IN D
ATA
SO
UR
CE
Striennial Assessment of housing needs: department of the environment, heritage and local government
The Triennial Assessment of Housing Needs is conducted by the Department of the Environment, Heritage and Local Government on a triennial basis. The following indicator draws on data from this source:
Number of households with children identified as being in need of social housing. ■
Data represent net need for social housing, meaning households who have been assessed as being in need of either Local Authority or voluntary housing. The terminology used to describe a Local Authority’s housing needs varies. These figures are net of duplicate applications (i.e. applicants who have applied to more than one Local Authority). A Local Authority’s waiting list may contain duplicate applications.
One of the weaknesses of Local Authority Assessments of Housing Needs (LAAHNs) is that they do not measure severity of housing need and all households on housing waiting lists are treated as though they have an equal level of housing need. This means that there may be some people registered on housing waiting lists who have a very low housing need. On the other hand, LAAHNs may underestimate other elements of housing need. For example, Local Authorities are asked to exclude from the final figure certain households that are not assessed as suitable for Local Authority housing, namely:
Households whose need for assistance could, in the opinion of the Authority, be more ■
appropriately met by rent or mortgage supplementation under the Supplementary Welfare Allowance Scheme. Arguably, this highly unsatisfactory category was originally a euphemism for single people, who were not seen as appropriate for housing by Local Authorities.
Households living in unfit Local Authority housing. ■
Households living in overcrowded or materially unsuitable Local Authority housing. ■
Households whose need could be more appropriately met by other social housing measures ■
(this includes households with a particular need in addition to their housing need).
vital statistics: central statistics office
Vital statistics relating to births, deaths and marriages are compiled by the Central Statistics Office on an annual basis. The following indicators draw on data from this source:
Number of deaths of children under 18. ■
Number of births to mothers aged 10-17. ■
Number of suicides of children aged 10-17. ■

218
STATE OF THE NATION’S CHILDREN – IRELAND 2010
deaths are coded according to the 9th Revision of the International Statistical Classification of Diseases, Injuries and Causes of Death. Stillborn babies are excluded from infant mortality figures, which refer to deaths of children aged less than one year. The mortality figures refer to crude death rates and are classified by year of registration.
Births to mothers aged 10-17 years include a small number of births to mothers aged 10-14 years. The denominator used to calculate the birth rate of mothers aged 10-17 is based on the population age group 15-17 years (rather than 10-17 years). Births relate to registered live births and exclude stillborn babies.
suicides of children aged 10-17 years include a small number of suicides of children aged 10-14 years. The denominator used to calculate the suicide rate of children aged 10-17 is based on the population age group 15-17 years (rather than 10-17 years).
who european childhood obesity surveillance initiative: national nutrition surveillance centre
The WHO European Childhood Obesity Surveillance Initiative is conducted in Ireland by the National Nutrition Surveillance Centre. This collects the weight, height and waist circumference of primary school children aged 7.0 - 7.9 years. The following indicator draws on data from this source:
The percentage of children aged 7 in BMI categories: normal, overweight and obese. ■
The measurements were recorded over the period 10 April – 26 June 2008. Height was recorded to the last 0.1cm, weight recorded to the last 0.1kg and waist circumference to the last mm. Training in standardised measurement techniques and standard equipment was provided to 30 nutritionists who carried out the fieldwork.

219A
PP
EN
DIX
2: N
UT
S C
LA
SS
IFIC
AT
ION
SAppendiX 2: nuts clAssiFicAtions
NUTS is an acronym for the EU Nomenclature of Territorial Units for Statistics. This classification was legally established by EU Regulation No. 1059/2003 on 29 May 2003. The 8 Regional Authorities for Ireland (NUTS 3 Regions), which were established under the Local Government Act, 1991, are set out below:
NUTS 2 Regions Regional Authorities (NUTS 3 Regions)
Constituent counties (NUTS 4 Regions)
Type of area
Border, Midland and Western
Border Cavan Donegal Leitrim Louth Monaghan Sligo
Administrative county Administrative county Administrative county Administrative county Administrative countyAdministrative county
Midlands LaoisLongfordOffalyWestmeath
Administrative county Administrative county Administrative county Administrative county
West Galway Galway Mayo Roscommon
County Borough Administrative county Administrative county Administrative county
Southern and Eastern Dublin Dublin Dun Laoghaire/Rathdown Fingal South Dublin
County Borough Administrative county Administrative county Administrative county
Mid-East Kildare Meath Wicklow
Administrative county Administrative county Administrative county
Mid-West Clare Limerick Limerick Tipperary North Riding
Administrative county County Borough Administrative county Administrative county
continued

220
STATE OF THE NATION’S CHILDREN – IRELAND 2010
NUTS 2 Regions Regional Authorities (NUTS 3 Regions)
Constituent counties (NUTS 4 Regions)
Type of area
Southern and Eastern (continued)
South-East Carlow Kilkenny Tipperary South Riding Waterford Waterford Wexford
Administrative county Administrative county Administrative county County Borough Administrative county Administrative county
South-West Cork Cork Kerry
County Borough Administrative county Administrative county

221
APPENDIX 1: MAIN DATA SOURCES
AP
PE
ND
IX 1
: MA
IN D
ATA
SO
UR
CE
SindeX
INDEX

A
absenteeism from school, 70–72, 212accidents and injuries, 96–99alcohol use, 126–29antenatal care
attendance in first trimester of pregnancy, 179–81
National Perinatal Reporting System (NPRS), 213asylum, separated children seeking, 34, 201Australian Classification of Health Interventions
(ICD-10-AM), 209
B
birth rate among girls aged 10-17, 134–36, 218birth weight, 86–88, 213body mass index (BMI) weight categories, 100, 218breakfast, eating, 149–52breastfeeding, 89–92, 213bullying among children, 57–60
c
cannabis use. See smoking cannabiscapitation criteria for early childhood care and
education (ECCE) services, 68–69, 205–6care, children and young people in, 191–94, 201Census of Population
definitions of indicators, 200–1Central Statistics Office, 200, 202, 206, 217–18‘child’, definition of (Census of Population), 200child welfare and protection
Childcare Interim Dataset, 201–2confirmed child abuse cases, 112–14, 201initial assessments of concerns, 109–11, 201types of abuse, 112types of concerns, 109
Child Well-Being Indicators, National Set of, 2definitions of indicators, 200–218disaggregation of data, 4new indicators (2010), 3statistical significance testing, 4updating indicator data, 3
Childcare Interim Dataset, 201–2Childcare Module, Quarterly National Household
Survey, 202–3
childcare, non-parentaldefinition of ‘childcare’ (CSO), 203ECCE Database, 205–6enrolment in, 64–65Free Pre-School Year (ECCE) Scheme, 68–69,
205–6parental satisfaction with, 66–67quality of, 68–69types of childcare, 202
chronic illness. See disabilityCity and County Childcare Committees, 206community characteristics
children feeling safe in area where they live, 165–68
good places in area to spend free time, 169–73country comparisons. See individual indicatorscounty comparisons. See individual indicatorsCSO. See Central Statistics Office
Ddata sources, 2–3, 200–218death rate. See mortalitydecision-making, participation of children in, 116–19Delivering Equality of Opportunity in Schools
(DEIS), 70–71Department of Education and Skills, 203Department of Health and Children
Hospital In-Patient Enquiry (HIPE), 209–10National Perinatal Reporting System (NPRS), 213
Department of the Environment, Heritage and Local Government, 217
deprivation indicators of consistent poverty, 160, 207–8
disabilitychildren with a, 32–33definition of (Census of Population), 201intellectual disability, 101–4, 213National Intellectual Disability Database (NIDD),
213National Physical and Sensory Disability
Database (NPSDD), 214physical and/or sensory disability, 105–8, 214See also individual indicators
disaggregation of data, 4drinking. See alcohol usedrug use. See smoking cannabis222
e
early childhood care and educationcapitation criteria for ECCE services, 68–69,
205–6ECCE Database, 205–6enrolment in, 64–65Free Pre-School Year (ECCE) Scheme, 68–69,
205–6parental satisfaction with, 66–67quality of, 68–69
Early Childhood Care and Education (ECCE) Database, 205–6
eating habits. See breakfast, eatingECCE. See early childhood care and educationEconomic and Social Research Institute (ESRI),
209, 213education
definition of ‘parental education level’ (Census of Population), 200–1
literacy/numeracy levels, 75–83parental education level, 22–25public expenditure on education, 154–57, 203–5school attendance, 70–72transfer to second level, 73–74
Education Research Centre, 216environment
children feeling safe in local area, 165–68recreation places in local area, 169–73
equivalence scale (household), 207EU-27 Member States, comparisons with.
See individual indicatorsEU-SILC. See Survey on Income and Living
Conditions, EUexercise. See physical activity
F
familychildcare arrangements, 64–67children’s relationships
with parents, 35–60eating meals together, 48–49foster homes, 191lone-parent households, 19–21structure of, 19–21talking together, 44–45
father and child relationship, 40–43
foreign national childrendefinition of (Census of Population), 201population in Ireland, 28–31See also individual indicators
foster family homes, 191Free Pre-School Year (ECCE) Scheme, 68–69, 205–6friendships among children, 50–53
g
Garda Juvenile Diversion Programmereferrals to, 174–78Report of the Committee Appointed to
Monitor the Effectiveness of the Diversion Programme, 200
Gross Domestic Product (GDP), 154, 204Gross National Income (GNI), 154, 204
h
happiness, self-reported, 140–42HBSC surveys. See Health Behaviour in School-aged
Children Surveyhealth
accessibility of services for children, 189–90alcohol use, 126–29antenatal care, 179–81, 213birth weight, 86–88, 213breastfeeding, 89–92, 213child welfare and protection, 109–14children on waiting lists, 189–90, 214–15disability, 32–33, 101–8hospitalisation of children, 93–99immunisation uptake rates, 182–88, 210–12mental health, 195–97, 214overweight and obese children, 100, 218sexual health and behaviour, 134–36smoking cannabis, 130–33smoking cigarettes, 122–25See also hospitalisation of children
Health Behaviour in School-aged Children (HBSC) Surveyindicators in, 208–9
Health Promotion Research Centre, 208Health Protection Surveillance Centre (HPSC), 210Health Research Board, 213, 214 223
INDEX
IND
EX

Health Service Executive (HSE)child welfare and protection, 109–14, 201–2Childcare Interim Dataset, 201–2children and young people in care, 191–94, 201–2Health Protection Surveillance Centre (HPSC),
210Hospital In-Patient Enquiry (HIPE), 209–10Local Health Offices and immunisation uptake
data, 211–12National Perinatal Reporting System (NPRS), 213
health services, accessibility for children, 189–90hobbies. See reading as a leisure activityHospital In-Patient Enquiry (HIPE), 209–10hospitalisation of children
accidents and injuries, 96–99discharges from hospital, 93–99, 209–10principal diagnosis (main causes), 93–94psychiatric hospital admissions, 195–97, 214waiting lists for children, 189–90, 214–15
hospitals on Patient Treatment Register (PTR), 189–90, 214–15
housing, socialhouseholds with children in need, 162–64Local Authority Assessments of Housing Needs
(LAAHNs), 217Triennial Assessment of Housing Needs, 217
HSE Regions comparisons. See individual indicators
i
immigrant childrendefinition of (HBSC), 209definition of (PISA), 216See also individual indicators
immunisation for childrenchildhood immunisation schedule (2008), 211uptake rates at 12 and 24 months, 182–88, 210–12
indicators of children’s well-being. See Child Well-Being Indicators, National Set of
intellectual disability, 101–4, 213International Classification of Diseases
ICD-10-AM, 209ICD-9-CM, 209
international comparisons. See individual indicatorsInternational Statistical Classification of Diseases,
Injuries and Causes of Death, 9th Revision of, 218
k
key findings of 2010 State of the Nation’s Children report, 4–8
l
leisure activity. See reading; physical activityliteracy
in mathematics, 78–80, 216in reading, 75–77, 216in science, 81–84, 216
Local Authority Assessments of Housing Needs (LAAHNs), exclusion criteria of, 217
Local Authority housing. See housing, socialLocal Health Offices (LHOs)
provision of immunisation uptake data for children, 211–12
lone-parent households. See family
M
mathematics, children’s literacy in, 78–80, 216mental health
National Psychiatric In-Patient Reporting System (NPIRS), 214
psychiatric hospital admissions, 195–97reasons for admissions, 195–96See also happiness; self-esteem; suicide among
youthmortality
among children, 14–18among infants (under 1 year), 14, 15, 16–17, 218causes of death, 15–16
mother and child relationship, 36–39
n
National Data and Research Strategy on Children’s Lives, iii
National Educational Welfare Board (NEWB) Database, 212
National Framework of Qualifications of Ireland (NFQ), 205
National Intellectual Disability Database (NIDD), 213National Nutrition Surveillance Centre, 218National Perinatal Reporting System (NPRS), 213224
STATE OF THE NATION’S CHILDREN – IRELAND 2010

National Physical and Sensory Disability Database (NPSDD), 214
National Psychiatric In-Patient Reporting System (NPIRS), 214
National Treatment Purchase Fund, 214Nomenclature of Territorial Units for Statistics, EU.
See NUTS classificationsNUTS classifications, 209, 219–20NUTS Regions comparisons. See individual
indicators
o
obese children, 100, 218Obesity Taskforce Standards, International, 100OECD-PISA Literacy Scales
combined scientific, 81–84, 216mathematics, 78–80, 216reading, 75–77, 216
offences by youth, types of, 174–76Office of the Minister for Children and Youth Affairs
(OMCYA), 4, 205OMCYA. See Office of the Minister for Children and
Youth Affairsoutcomes for children
data sources, 2education, 63–83health, 85–114nutritional, 100, 149–52social, emotional and behavioural, 115–52
overweight children, 100, 218
p
parentschildren’s relationships with, 36–49definition of ‘parental education level’
(Census of Population), 200–1early childhood care and education, 64–69eating meals with their children, 48–49education level of mothers, 22–25, 200–1involvement in children’s schooling, 46–47lone-parent families, 19–21relationship with fathers, 40–43relationship with mothers, 36–39satisfaction with early childhood care and
education, 66–67talking with their children, 44–45
participation of children in school decision-making, 116–19
Patient Treatment Register (PTR), 214–15peers, children’s relationships with, 50–53, 57–60pets and animals in family, 54–56physical activity, time spent in, 145–48physical disability, 105–8, 214PISA surveys. See Programme of International
Student Assessment SurveyPopulation Estimates (CSO), 200population of children
children with a disability, 32–33foreign national children, 28–31separated children seeking asylum, 34total in Ireland, 10–13Traveller community, 26–27
povertyat risk of poverty, 158–59, 206–7consistent poverty, 160–61, 207–8definition of ‘income’, 207deprivation indicators, 160, 207–8
pregnancyantenatal care during trimesters, 179–81, 213
Programme of International Student Assessment (PISA) Surveyassessment domains in, 76, 79, 82, 216indicators in, 216
psychiatric hospital admissions among children, 195–97, 214
public expenditure on educationIreland and EU-27, 154–57, 203–5
Q
Quarterly National Household Survey, 202
r
readingas a leisure activity, 120–21children’s literacy in, 75–77, 216
relationships, children’sdata sources, 2with parents and peers, 35–60
225
INDEX
IND
EX

s
School Support Programme (SSP), 70schools
attendance at, 70–72, 212bullying in, 57–60DEIS schools, 70–71Free Pre-School Year (ECCE) Scheme, 68–69,
205–6national, 73parental involvement in children’s schooling,
46–47participation of students in decision-making,
116–19‘pre-school’, definition of (CSO), 203‘primary school’, definition of (CSO), 203School Attendance Reports, 212transfer to second-level education, 73–74
science, children’s literacy in, 81–84, 216self-esteem, 137–39sensory disability, 105–8, 214sexual health and behaviour, 134–36smoking
cannabis, 130–33cigarettes, 122–25
social class groups, definition of (CSO), 209socio-demographics of children in Ireland, 9–34
data sources, 2, 200–1, 217–18statistical significance testing, 4stillborn babies, 86–88, 213, 218suicide among youth, 143–44, 218supports for children
data sources, 2–3formal and informal, 153–98
Survey on Income and Living Conditions, EU (EU-SILC), 206–8
t
teenage pregnancy, 134–36, 218Traveller community
children in, 26–27definition of ‘Traveller’ (Census of Population),
201See also individual indicators
Triennial Assessment of Housing Needs, 217
v
vaccination. See immunisation for childrenVital Statistics (CSO), 217–18
w
waiting listsfor hospitalisation of children, 189–90for Local Authority social housing, 217hospitals on Patient Treatment Register (PTR),
214–15World Health Organization (WHO)
collation of international data on immunisation, 212
European Childhood Obesity Surveillance Initiative, 218
International Classification of Diseases (ICD-10), 209, 214
226
STATE OF THE NATION’S CHILDREN – IRELAND 2010

227
notes

228
STATE OF THE NATION’S CHILDREN – IRELAND 2010
notes


230
STATE OF THE NATION’S CHILDREN — IRELAND 2010
Office of the Minister for Children and Youth AffairsDepartment of Health and ChildrenHawkins HouseHawkins StreetDublin 2
Tel: +353 (0)1 635 4000Fax: +353 (0)1 674 3223E-mail: [email protected]: www.omcya.ie
Designed by Penhouse Design www.penhouse.ie
PUBLISHED BY GOVERNMENT PUBLICATIONS, DUBLIN
To be purchased from the GOVERNMENT PUBLICATIONS SALES OFFICE,
SUN ALLIANCE HOUSE, MOLESWORTH STREET, DUBLIN 2
or by mail order from GOVERNMENT PUBLICATIONS,
POSTAL TRADE SECTION, 51 ST. STEPHEN’S GREEN, DUBLIN 2
[Tel: 01 647 6834; Fax: 01 647 6843]
or through any bookseller
Price: E5.00Prn: A10/1665