F. Sauli - LHCb Muon Group Home Pagelhcb-muon.web.cern.ch/lhcb-muon/documents/Sauli_77-09.pdf · F....
98
CERN 77-09 3 May 1977 ORGANISATION EUROP~ENNE POUR LA RECHERCHE NUCLEAIRE PRINCIPLES OF OPERATION OF MULTIWIRE PROPORTIONAL AND DRIn (3WfBERS F. Sauli Lectures given in the Academic Training Progranmne of CERN 197.5-1976 GENEVA 1977
Transcript of F. Sauli - LHCb Muon Group Home Pagelhcb-muon.web.cern.ch/lhcb-muon/documents/Sauli_77-09.pdf · F....

CERN 77-09 3 May 1977
ORGANISATION E U R O P ~ E N N E POUR LA RECHERCHE NUCLEAIRE
PRINCIPLES OF OPERATION OF MULTIWIRE
PROPORTIONAL AND D R I n (3WfBERS
F. Sauli
Lectures given in the
Academic Training Progranmne of CERN
197.5-1976
G E N E V A
1977
CERN - Service d'Information scientifique - RDJ233 - 2000 - Mai 1977 - .l500 - Mai 1982 - 500 - Mai 1986 - 500 - novembn 1990

ABSTRACT
The report gives a detailed review of energy-loss processes and of
charge drift and diffusion in gases, which define the operational charac- teristics of this family of charged-particle and photon detectors. In a
practical discussion of the chambers themselves, emphasis is placed on
gas properties and electrostatics whereas the mechanics and electronics
of the chambers are covered by references to the extensive bibliography.

CONTENTS
1. INTRODUCTION
Page
1
2. DETECTION OF CHARGED PARTICLES
2.1 General i t i e s
2.2 Energy l o s s due t o e lec t romagnet i c i n t e r a c t i o n s
2.3 The r e l a t i v i s t i c r i s e o f energy l o s s
2.4 & - r a y p r o d u c t i o n
2.5 Range o f s low e l e c t r o n s
2.6 Energy l o s s d i s t r i b u t i o n
2.7 Pr imary and t o t a l i o n i z a t i o n
2.8 S t a t i s t i c s o f i o n - p a i r p r o d u c t i o n
3. DETECTION OF PHOTONS
3.1 D i f f e r e n t processes o f a b s o r p t i o n
3.2 P h o t o e l e c t r i c a b s o r p t i o n
3.3 Cornpton s c a t t e r i n g
3.4 P a i r p r o d u c t i o n
4. DRIFT AND DIFFUSION OF CHARGES I N GASES
4.1 I o n and e l e c t r o n d i f f u s i o n w i t h o u t e l e c t r i c f i e l d s
4.2 M o b i l i t y o f i o n s
4.3 D r i f t o f e l e c t r o n s
4.4 D i f f u s i o n o f e l e c t r o n s
4.5 D r i f t o f e l e c t r o n s i n magnet ic f i e l d s
4.6 E f f e c t o f e l e c t r o n e g a t i v e gases
4.7 H igh e l e c t r i c f i e l d s : e x c i t a t i o n and i o n i z a t i o n
5. PROPORTIONAL COUNTERS
5.1 Bas ic o p e r a t i o n
5.2 Time development o f t h e s i g n a l
5.3 Choice o f t h e gas f i l l i n g
5.4 Space-charge g a i n l i m i t a t i o n

6. MULTIWIRE PROPORTIONAL CHAMBERS
Principles of operation
Choice of geometrical parameters
Dependence of the gain on mechanical tolerances
Electrostatic forces
General operational characteristics: proportional and semi-proportional
Saturated amplification reqion
Limited Geiger and full Geiger operation
Rate effects and ageing
Mechanics and electronics
7. DRIFT CHAMBERS
7 . l Principles of operation
7.2 Space-time correlation and intrinsic accuracy
7.3 Stability of operation
7.4 Behaviour of drift chambers in magnetic field
7.5 Mechanical construction and associated electronics
Page - 5 0
BASIC BIBLIOGRAPHY
REFERENCES

INTRODUCTION
The f i r s t multiwire proportional chamber, i n its modern conception, was constructed
and operated by Charpak and h is collaborators i n the years 1967-68 l ) . I t was soon recog-
nized tha t the main properties of a multiwire proportional chamber, i . e . very good time re-
solution, good position accuracy and self-triggered operation, a re very a t t rac t ive fo r the
use of the new device i n high-energy physics experiments. Today, most f a s t detectors con-
t a in a large number of proportional chambers, and t he i r use has spread t o many different
f ie lds of applied research, such as X-ray and heavy ion astronomy, nuclear medicine, and
protein crystallography2). In many respects, however, multiwire proportional chambers a re
s t i l l experimental devices, requiring continuous at tent ion for good operation and sometimes
reacting i n unexpected ways t o a change i n the environmental conditions. Furthemore, i n
the fabrication and operation of a chamber people seem t o use a mixture of competence,
technical s k i l l and magic r i t e s , of the kind "I do not know why I'm doing t h i s but some-
body told me to do so".
In these notes I w i l l t r y t o i l l u s t r a t e the basic phenomena underlying the behaviour
of a gas detector, with the hope tha t the reader w i l l not only be t te r understand the reasons
fo r some irrational-seeming preferences (such as , for example, i n the choice of the gas
mixture), but w i l l a lso be able be t te r t o design detectors fo r h i s specif ic experimental
needs.
Most of the recent development on multiwire proportional chambers is due t o the enthusi-
a s t i c work of Georges Charpak who in i t i a ted me into t h i s exciting f i e ld of applied research;
these notes are dedicated t o him.
A large number of the i l lus t ra t ions have been extracted from old textbooks and a r t i c l e s ,
and I would l i ke to thank Claude Rigoni for her great s k i l l and patience i n making them su i t -
able for reproduction.
2. DETECTION OF CHARGED PARTICLES
2.1 Generalities
A f a s t charged par t ic le , traversing a gaseous o r condensed medium, can interact with
it i n many ways. 3f a l l possible interactions, however, only the electromagnetic one is
generally used as a basis f o r detection, being many orders of magnitude more probable than
strong o r weak interactions and therefore leaving a "message" even i n very th in samples of
material. These notes are mainly concerned with the highly probable incoherent Coulomb
interactions between the electromagnetic f ie lds of the incoming charged par t ic le and of the
medium, resulting i n both excitation and ionization of the atoms of the medium i t s e l f . The
contribution of other electromagnetic processes (at l e a s t f o r par t ic les heavier than elec- "
t rons) , such as bremsstrahlung, Cerenkov, and t ransi t ion radiation, t o the t o t a l energy
loss i s negligible i n gas detectors and we w i l l ignore them.
2.2 Energy loss due to electromagnetic interactions
An expression for the average d i f fe ren t ia l energy loss (loss per uni t length) due t o
Coulomb interactions has been obtained by Bethe and b loch^) in the framework of r e l a t i v i s t i c
quantum mechanics, and can be written as follows (in the e lec t ros ta t ic uni t system):

where N is the Avogadro number, m and e are the electron mass and charge, Z , A and p
are the atomic number and mass, and the density of the medium, respectively, and I is i t s
effect ive ionization potential; z i s the charge and B the velocity ( in uni ts of the speed
of l igh t c) of the project i le . In the e lec t ros ta t ic un i t system and expressing energies i n
MeV, K = 0.154 MeV g-' cm2 for uni t charge project i les . In the system used, the r e s t energy
of the electron, mc2, equals 0.511 MeV.
The quantity EM represents the maximum energy t ransfer allowed i n each interaction,
and simple two-body r e l a t i v i s t i c kinematics gives
For example, for 1 GeV/c protons (B = 0.73) EM = 1 . 2 MeV. Not always, however, can t h i s
kinen~atical l i m i t be used, par t icular ly i n the case of th in detectors where energy can
escape i n the form of &rays (see Section 2.4).
I t i s customary t o subst i tute for the length X a reduced length X defined as Xp and
measured i n g cm-'. In t h i s case, the reduced energy loss can be wri t ten as
The value of the effect ive ionization potential I is i n general the resul t of a measure-
ment for each material; a rather good approximation is, however, I = IoZ with
I. = 12 eV. Values of I, are given in Table 1 for several gases. For molecules and for
gas mixtures, average values for Z , A, and I have t o be taken.
Table 1
Properties of several gases used in proportional counters (from different sources, see the bibliography for this section). Energy loss and ion pairs per unit length are given
at atmospheric pressure for minimum ionizing particles
Cns
Nc
Ar
Kr
a I, C 4 l l l 0
- -- E,,
--
10.8
19.8
8 .1
7.9
16.6
11.6
10.0
8.4
5.2
a ) i . p . = i o n p a i r s
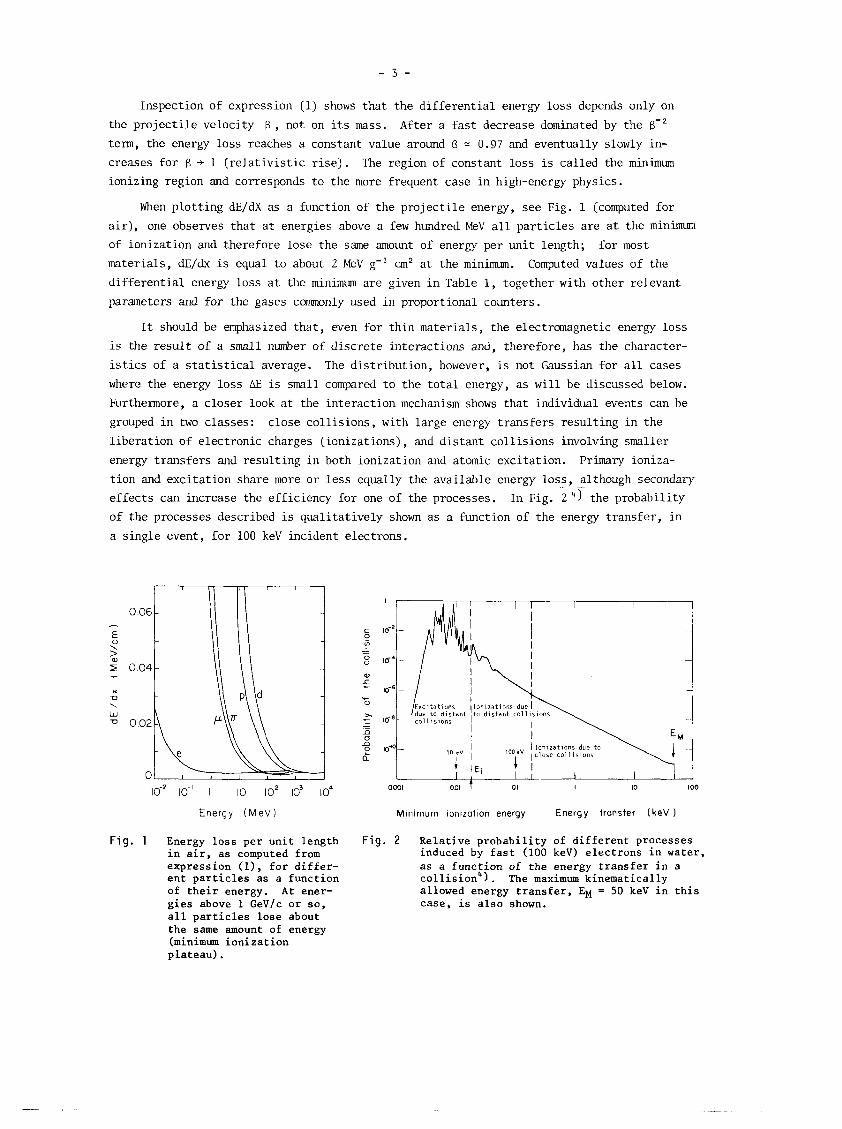
Inspection of expression (1) shows that the d i f fe ren t ia l energy loss depends only on
the pro jec t i l e velocity B , not on i t s mass. After a f a s t decrease dominated by the f?-'
term, the energy loss reaches a constant value around f? 2 0.97 and eventually slowly in-
creases for B + 1 ( r e l a t i v i s t i c r i s e ) . The region of constant loss is called the minimum
ionizing region and corresponds t o the more frequent case in high-energy physics.
When plot t ing dE/dX as a function of the pro jec t i l e energy, see Fig. 1 (computed for
a i r ) , one observes tha t a t energies above a few hundred MeV a l l par t ic les are a t the minimum
of ionization and therefore lose the same amount of energy per uni t length; for most
materials, dE/dx i s equal t o about 2 MeV cm2 a t the minimum. Computed values of the
d i f fe ren t ia l energy loss a t the minimum are given i n Table 1, together with other relevant
parameters and for the gases commonly used i n proportional counters.
I t should be emphasized tha t , even for thin materials, the electromagnetic energy loss
i s the resul t of a small number of discrete interactions and, therefore, has the character-
i s t i c s of a s t a t i s t i c a l average. The dis t r ibut ion, however, i s not Gaussian for a l l cases
where the energy loss E i s small compared t o the t o t a l energy, as w i l l be discussed below.
Furthermore, a closer look a t the interaction mechanism shows that individual events can be
grouped i n two classes: close col l is ions, with large energy transfers resulting i n the
l iberat ion of electronic charges (ionizations), and dis tant col l is ions involving smaller
energy transfers and resulting i n both ionization and atomic excitation. Primary ioniza-
t ion and excitation share more or l ess equally the available energy loss, . although secondary
effects can increase the efficiency for one of the processes. In Fig. 2 ''1 the probability
of the processes described is qualitatively shown as a function of the energy transfer, i n
a single event, fo r 100 keV incident electrons.
Energy ( M e V )
F i g . 1 Energy loss per unit length in air, as computed from expression (l), for differ- ent particles as a function of their energy. At ener- gies above 1 GeV/c or so, all particles lose about the same amount of energy (minimum ionization plateau).
M~nirnurn ionlzotion energy Energy transfer ( k e V
F ig . 2 Relative probability of different processes induced by fast (100 keV) electrons in water, as a function of the energy transfer in a collision4) . The maximum kinematically allowed energy transfer, EM = 50 keV in this case, is also shown.

2 . 3 The r e l a t i v i s t i c r i s e of energy loss
A t very high momenta, above 10 GeV/c or so, the logarithmic te rn i n the Bethe-Block
formula produces an increase of the energy loss; t h i s may constitute a basis for par t ic le
ident i f icat ion a t very high energies since, for a given momentum, the average energy loss
w i l l be s l igh t ly different for different masses. Polarization effects , not taken into
account by expression ( l ) , however, produce a saturation i n the increase, tha t would other-
wise indefinitely continue. In gases, saturation occurs around a few hundred GeV/c a t a
value which is about 50% above minimum ionizing; Fig. 3 shows a collection of experimental
data for argon5). For s t a t i s t i c a l reasons, discussed more fu l ly l a t e r , an effect ive par-
t i c l e ident i f icat ion i n the region of the r e l a t i v i s t i c r i s e requires a very large number of
independent measurements of energy loss for each track, and stacks of multiwire proportional
chambers have been succesfully used for t h i s purpose6).
STERNHEIMES,,- MEASURED AT 1.LS Gey, THEORY,// . l . MEASURED AT 16 Gev/, ./'
0 PARRY ,a T A RAMANA-MURTHY
D IM~OVSKI ./'
Fig. 3 Relativistic rise of the energy luss in argon, as a function of particle mass and momentum; the vertical scale gives the relative increase above the minimum of ionization5)
2.4 &-ray production
In ionizing encounters, the ejected electron i s l iberated with an energy E that can
assume any value, up to the maximum allowed EM, as given by expression ( 2 ) . An approximate
expression for the probability of an electron receiving the energy E is given by3)
that corresponds essent ial ly to the f i r s t term i n the Bethe-Bloch formula. ?.lore accurate
expressions can be found elsewhere7,'), but for our needs the approximation (3) is suff i -
cient. I f the reduced thickness x = X6 i s introduced, and given i n g cm-', the expression
can be conveniently rewritten as
K Z x dE P ( E ) d E = - - 7 d E = W 7 . B 2 A E E

Electrons ejected with an energy above a few keV are normally cal led &rays, using an old
emulsion terminology. Integration of expression (3') allows one t o obtain an expression for
the number of 6 electrons having an energy E. or larger:
the l a s t approximation being val id for E, << %- A s an example, Fig. 4 shows the number of electrons ejected with energy E ? E. by
1 GeV/c protons, as a function of E, in 1 cm of argon a t normal conditions. There are ,
for example, about ten electrons emitted with energy above 15 eV, which i s the ionization
potential of argon (see Table 1) ; these considerations are very important for the under-
standing of secondary processes (see below). In Fig. 4, the maximum energy t ransfer for
1 GeV/c protons as project i les i s a lso shown, as given by expression ( 2 ) .
The angle of emission of a 6 electron of energy E i s given in a free-electron approxi-
mation, by the expressions)
F i g . 4 Computed number of 6 e l e c t r o n s e j e c t e d a t a n energy l a r g e r than o r equa l t o E, , a s a f u n c t i o n of E o , i n 1 cm of argon a t normal c o n d i t i o n s . The aver- age number of primary i o n i z i n g c o l l i - s i o n s (29 p e r cm) and t h e maximum a l - lowed energy t r a n s f e r f o r 1 GeV/c pro tons a r e shown.

Therefore for minimum ionizing part ic les (k > 1 MeV), and up t o energies of emission of
several keV, 6 rays are emitted perpendicularly t o the incident track; however, multiple
scattering in the medium quickly randomizes the direction of motion of 6 electrons. In f ac t ,
typical electron molecule cross-sections, in the keV region, are around 10-l6 cm2 3 ) , a t a t -
mospheric pressure, t h i s corresponds t o a mean free path between col l is ions of a few microns.
For energies around a hundred electronvolts, the cross-section i s increased by an order of
magnitude or so owing t o the high probability of ine las t ic col l is ions (see Section 4.7). Be-
cause of the large mass difference between target and project i le , large momentum transfers
(scattering angles) are highly probable, which means tha t in a few col l is ions any t race of
the electron's original emission angle w i l l be obliterated. A detailed discussion of the
process can be found in Refs. 6 and 7.
2.5 Range o f slow electrons
Depending on t he i r energy, 6 electrons w i l l cover a cer tain distance in the gas, suf-
fering e l a s t i c and inelast ic scat ters from the molecules. The t o t a l range RT for an energy
E, along the t rajectory, can be calculated integrating the Bethe-Block formula over the
length RT and requiring the integral t o equal the t o t a l available energy; however, it
gives a bad representation of the distance effectively covered by an electron, because of
the randomizing effect of the multiple col l is ions. I t i s customary t o define a pract ical
range RP that appears t o be two or three times smaller than the t o t a l range and in general
i s the resu l t of an absorption measurement. For energies up t o a few hundred keV, a rather
good approximation for the practical range, in g cm-2, i s B ]
1 . 7 2 R = 0.71 E (E i n MeV) . P
Figure 5 gives the range of electrons i n argon, under normal conditions, as a function of
energy. Combining the data of Figs. 4 and 5, one can deduce, for example, that i n 1 cm of
argon, one out of twenty minimum ionizing part ic les ejects a 3 keV electron having a prac-
t i c a l range of 100 urn.
F i g . 5 Range of e l e c t r o n s i n argon, a t normal c o n d i t i o n s a s a f u n c t i o n of energy, de- duced from measurement i n l i g h t m a t e r i a l s 8 )
Since the average energy loss i n argon is 2.5 keV/an, these events w i l l resul t i n a
much bigger pulse height, and also the centre of gravity of the detected charge, which is
the best position information one can get , w i l l be systematically displaced t o one s ide of
the or iginal track. This obviously s e t s a l i m i t t o the best accuracy of position one can
hope t o obtain i n a single gas counter operating a t atmospheric pressure, somewhere between
20 and 30 m. Actual measurements obtained so f a r with high accuracy d r i f t chambers pro-
vide accuracies of localization of between 50 and 100 pm 9910). Notice tha t an increase i n
the gas density or pressure does not obviously improve the accuracy since, although the
range of electrons w i l l decrease, the number produced a t any given energy w i l l increase.
Also, from Fig. 5 one can deduce tha t electrons produced with energies above 30 keV
have a range larger than 1 c m of argon, and w i l l escape detection from the 1 cm thick
layer. In t h i s case use of the Bethe-Block formula i s not completely jus t i f ied , since the
maximum energy t ransfer E& cannot i n fac t be dissipated i n the detector.
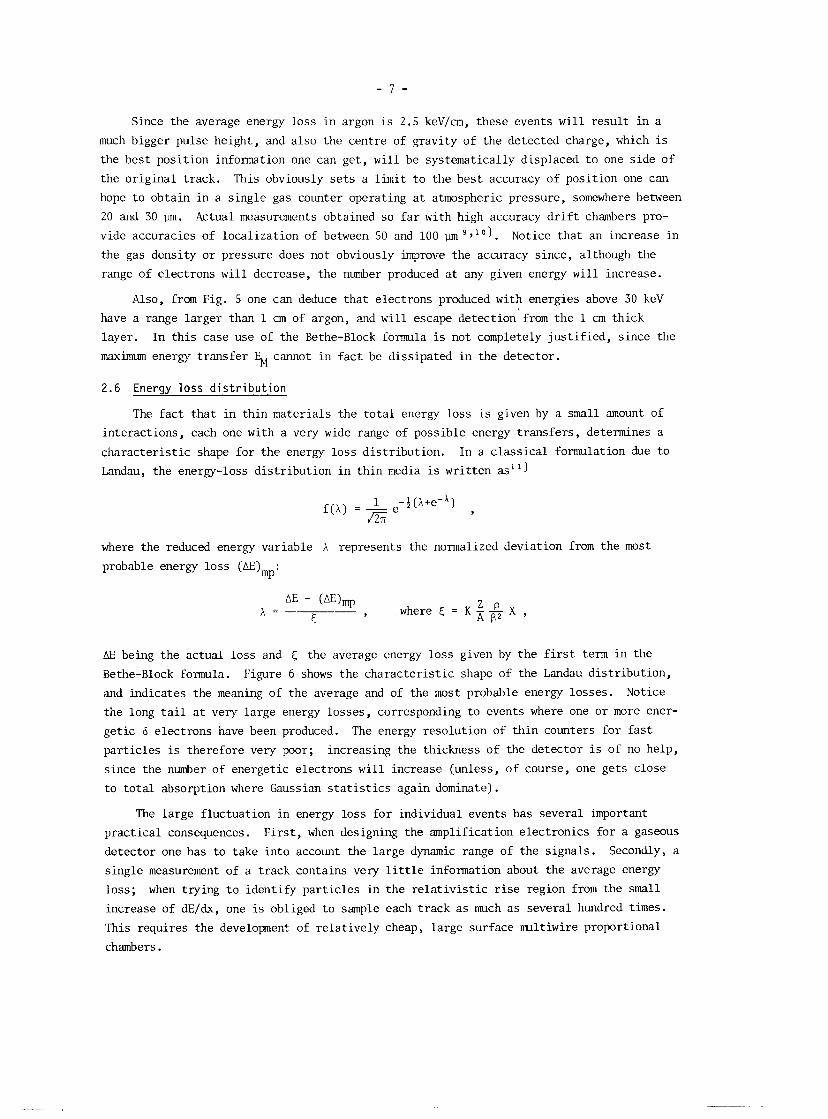
2.6 Energy loss dis t r ibut ion
The fac t tha t i n thin materials the t o t a l energy loss is given by a small amount of
interactions, each one with a very wide range of possible energy t ransfers , determines a
character is t ic shape for the energy loss dis t r ibut ion. In a classical formulation due t o
Landau, the energy-loss dis t r ibut ion i n th in media i s wri t ten as1 l )
where the reduced energy variable A represents the normalized deviation from the most
probable energy loss (AE) mp'
AE - (W, A =
z P 5
, where 5 = K - - X , A B 2
AE being the actual loss and 5 the average energy loss given by the f i r s t term i n the
Bethe-Block formula. Figure 6 shows the character is t ic shape of the Landau dis t r ibut ion,
and indicates the meaning of the average and of the most probable energy losses. Notice
the long t a i l a t very large energy losses, corresponding t o events where one or more ener-
get ic 6 electrons have been produced. The energy resolution of th in counters for f a s t
par t ic les is therefore very poor; increasing the thickness of the detector is of no help,
since the number of energetic electrons w i l l increase (unless, of course, one gets close
t o t o t a l absorption where Gaussian s t a t i s t i c s again dominate).
The large fluctuation i n energy loss for individual events has several important
practical consequences. F i r s t , when designing the amplification electronics for a gaseous
detector one has t o take into account the large dynamic range of the signals. Secondly, a
single measurement of a track contains very l i t t l e information about the average energy
loss; when trying t o identify part ic les i n the r e l a t i v i s t i c r i s e region from the small
increase of dE/dx, one i s obliged t o sample each track a s much as several hundred times.
This requires the developent of relat ively cheap, large surface ml t iw i r e proportional
chambers.

Fig. 6 (From Franzen and Cochran, see bibliography for Section 5.) Comparison of the experi- mental energy loss distribution, in an argon- carbon dioxide counter, with the distribu- tion computed using a simple Gaussian theory and the Landau expression.
2.7 Primary and total ionization
We are now i n a position t o understand i n de ta i l the process of energy loss by ioniza-
t ion of a charged part ic le . On the passage of the par t ic le , a discrete number of primary
ionizing col l is ions takes place which l iberate electron-ion pairs i n the medium. The
electron ejected can have enough energy (larger than the ionization potential of the medium)
t o further ionize, producing secondary ion pairs; the sum of the two contributions is called t o t a l ionization. Both the primary and the t o t a l ionization have been measured for
most gases, although not always i n the minimum ionizing region. The t o t a l number of ion
pairs can be conveniently expressed by
where AE is the t o t a l energy loss i n the gas volume considered, and W; is the effect ive I
average energy t o produce one pair. Values of W. for different gases are given i n Table 1. 1
No simple expression ex is t s for the number of primary ion pairs ; i n the table, experimental
values of n for minimum ionizing part ic les are given, per uni t length and a t normal condi- P
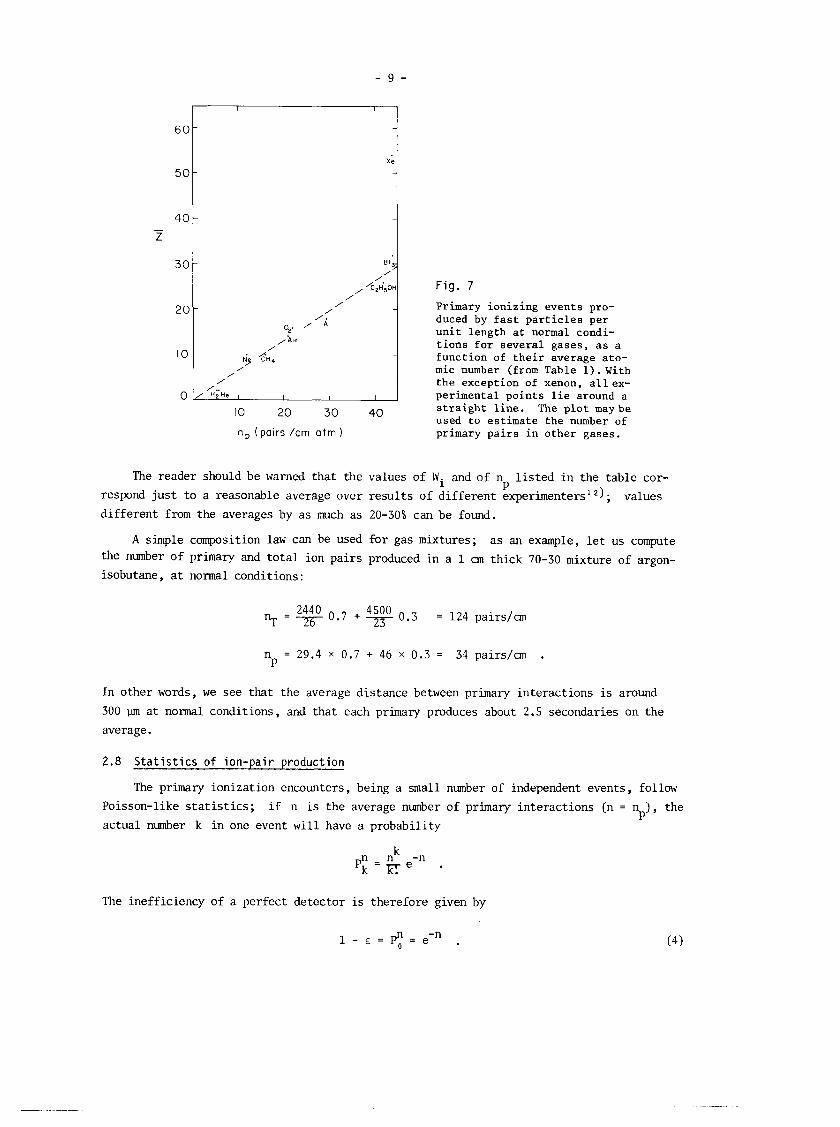
tions. As Fig. 7 shows, n i s roughly l inearly dependent on the average atomic number of - P
the gas, and the figure can be used t o estimate the number of primary pairs for other m l e -
cules (an exception is xenon). This has been done, for example, to obtain Wi f o r carbon
dioxide ( 0 2 ) and isobutane (C4H10) (values i n brackets in Table 1 ) .
n,, (pairs /cm a tm
Fig. 7
Primary ionizing events pro- duced by fast particles per unit length at normal condi- tions for several gases, as a function of their average ato- mic number (from Table l).With the exception of xenon, allex- perimental points lie around a straight line. The plot maybe used to estimate the number of primary pairs in other gases.
The reader should be warned that the values of Wi and of n l i s t e d i n the table cor- P
respond just t o a reasonable average over resu l t s of different experimenters12); values
different from the averages by as much as 20-30% can be found.
A simple composition law can be used for gas mixtures; as an example, l e t us compute the number of primary and t o t a l ion pairs produced in a 1 cm thick 70-30 mixture of argon-
isobutane, a t normal conditions:
In other words, we see that the average distance between primary interactions i s around
300 um a t normal conditions, and that each primary produces about 2.5 secondaries on the
average.
2.8 S t a t i s t i c s of ion-pair production
The primary ionization encounters, being a small number of independent events, follow
Poisson-like s t a t i s t i c s ; i f n is the average number of primary interactions (n = n ), the P
actual number k i n one event w i l l have a probability
The inefficiency of a perfect detector i s therefore given by
In the gas mixture previously considered, the inefficiency will be around 10-' for a 1 cm
thick detector (n = 34), and 3.3% for a 1 mm thick detector (n = 3.4). As a matter of fact,
it is from inefficiency measurements in low-pressure proportional counters that the values of
have been deduced. When k ion pairs are produced in a given event, simple probabilistic
considerations provide the space distribution of each pair j (1 5 j 5 k) along a normalized
coordinate X (0 5 X 5 l) :
k D.(x) = k! (l - x)k-~xj-l
J (k- j)! (j -l)!
and the general expression for the space distribution of the pair j , when n is the average nmber produced, is obtained as follows:
Consider, in particular, the distribution of the pair closer to one end of the detection
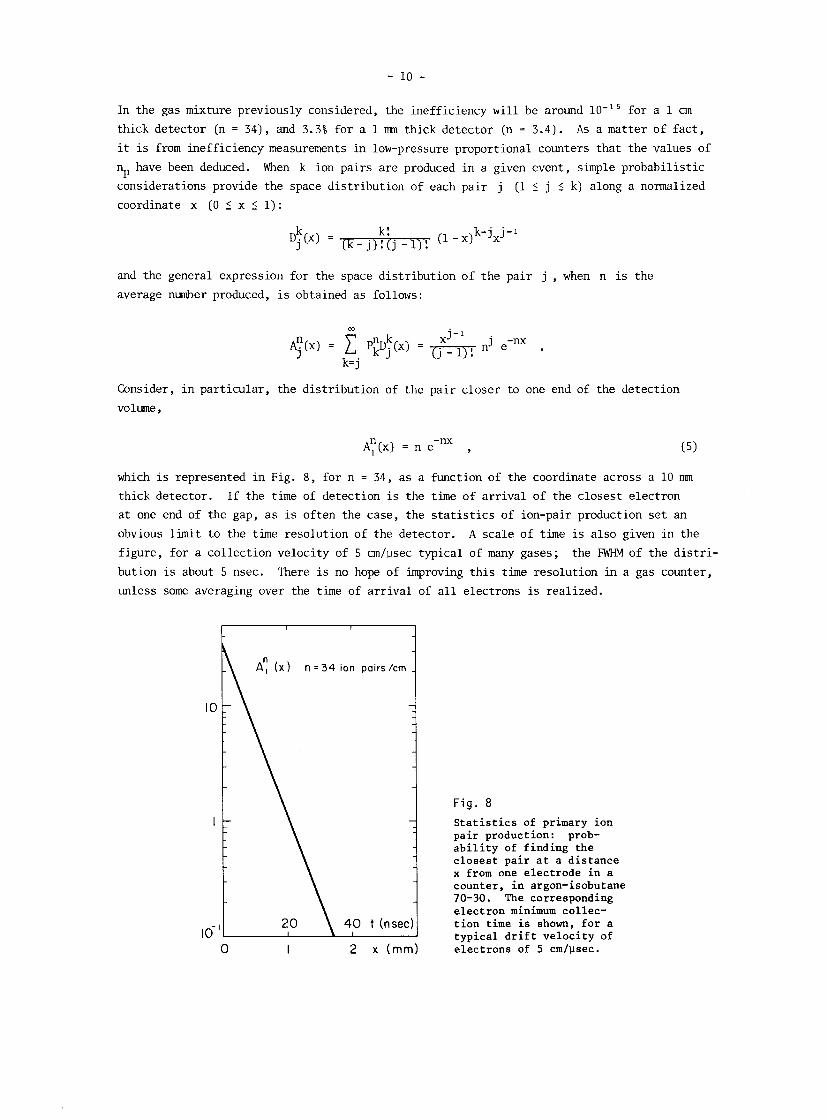
volume,
which is represented in Fig. 8, for n = 34, as a function of the coordinate across a 10 nun
thick detector. If the time of detection is the time of arrival of the closest electron
at one end of the gap, as is often the case, the statistics of ion-pair production set an
obvious limit to the time resolution of the detector. A scale of time is also given in the figure, for a collection velocity of 5 an/psec typical of many gases; the FWHM of the distri-
bution is about 5 nsec. There is no hope of improving this time resolution in a gas counter,
unless some averaging over the time of arrival of all electrons is realized.
A: ( X ) n = 34 ion pairs /cm -
-
40 t (nsec) I
F i g . 8
Statistics of primary ion pair production: prob- ability of finding the closest pair at a distance X from one electrode in a counter, in argon-isobutane 70-30. The corresponding electron minimum collec- tion time is shown, for a typical drift velocity of
0 I 2 X (mm) electrons of 5 cm/usec.
3. DETECTION OF PHOTONS
3.1 Different processes of absorption
As for charged particles, an electromagnetic interaction allows the detection of
photons; in this case, however, the interaction is a single localized event. lle probabi-
lity of absorption can be written in terms of the cross-section o , and the attenuation of a beam of photons traversing a thickness X of a medium having N molecules per unit volume
is given by
where p is the mass attenuation coefficient (normally expressed in cm2 g-l) and X = pX is
the reduced thickness of the medium, see Section 2.2. One can also define an absorption
mean free path X = (pp)-' and in this case Eq. (6) is rewritten as
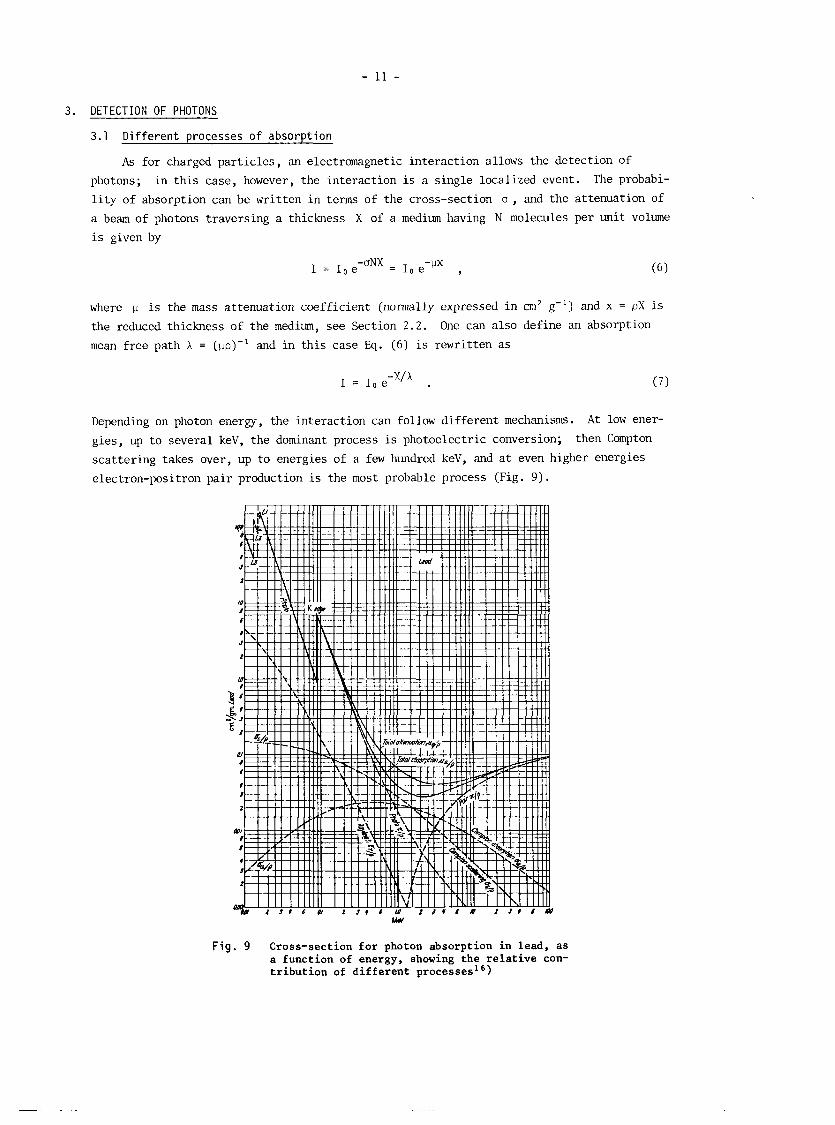
Depending on photon energy, the interaction can follow different mechanisms. At low ener-
gies, up to several keV, the dominant process is photoelectric conversion; then Compton
scattering takes over, up to energies of a few hundred keV, and at even higher energies
electron-positron pair production is the most probable process (Fig. 9).
F i g . 9 Cross-section for photon absorption in lead, as a function of energy, showing the relative con- tribution of different processes16)
3.2 Photoelectric absorption
We w i l l consider t h i s process i n some de ta i l for two reasons. F i r s t ly , it i s common
practice for laboratory test ing of proportional chambers t o use X-ray emitting isotopes
producing energy losses i n the few keV region (as can be seen from Table 1, t h i s i s equal
t o the typical energy loss of a minimum ionizing par t ic le i n 1 cm of gas). Secondly, multi-
wire proportional chambers are used as so f t X-ray detectors i n many applications, such as , fo r
example, t o study t ransi t ion radiation, in crystal diffract ion experiments, and in X-ray
astronomy. A clear understanding of the detailed process of energy loss by the photoelec-
t r i c effect is necessary i n a l l these cases.
Photoelectric absorption i s a quantum process involving one or more t ransi t ions i n the
electron shel ls of a molecule. Denoting by E . the energy of a she l l j , photoelectric J
absorption i n the she l l can take place only for photon energies E -> E. and, a t a given Y J
energy, the contributions of a l l levels having E . < E add up. The absorption i s a maxi- J Y
mum a t the edge, and then very rapidly decreases with energy.
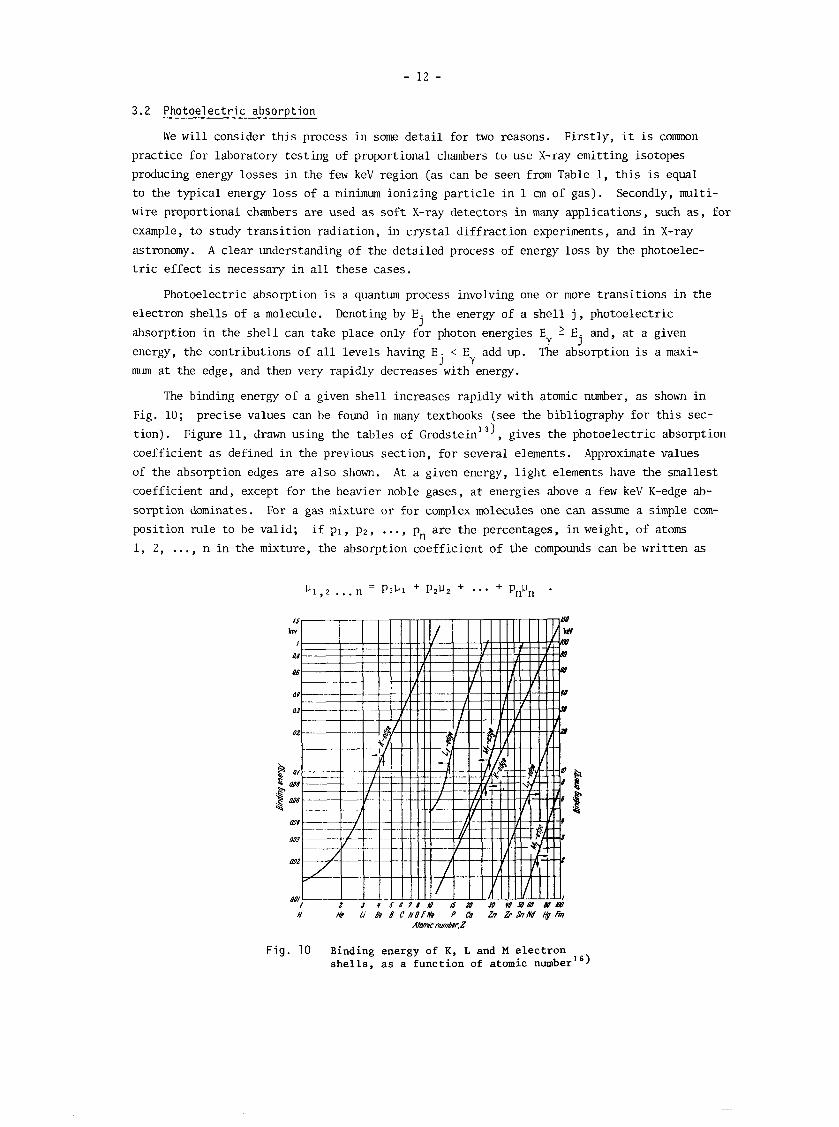
The binding energy of a given she l l increases rapidly with atomic number, a s shown i n
Fig. 10; precise values can be found in many textbooks (see the bibliography for t h i s sec-
t ion) . Figure 11, drawn using the tables of rod stein'^), gives the photoelectric absorption
coefficient as defined i n the previous section, f o r several elements. Approximate values
of the absorption edges are also shown. A t a given energy, l i gh t elements have the smallest
coefficient and, except for the heavier noble gases, a t energies above a few keV K-edge ab-
sorption dominates. For a gas mixture o r for complex molecules one can assume a simple com-
position rule t o be valid; i f p ] , p2 , ..., pn are the percentages, i n weight, of atoms
1, 2 , ..., n i n the mixture, the absorption coefficient of the compounds can be wri t ten as
F ig . 10 Binding energy of K, L and M electron s h e l l s , as a function of atomic nurnber16)
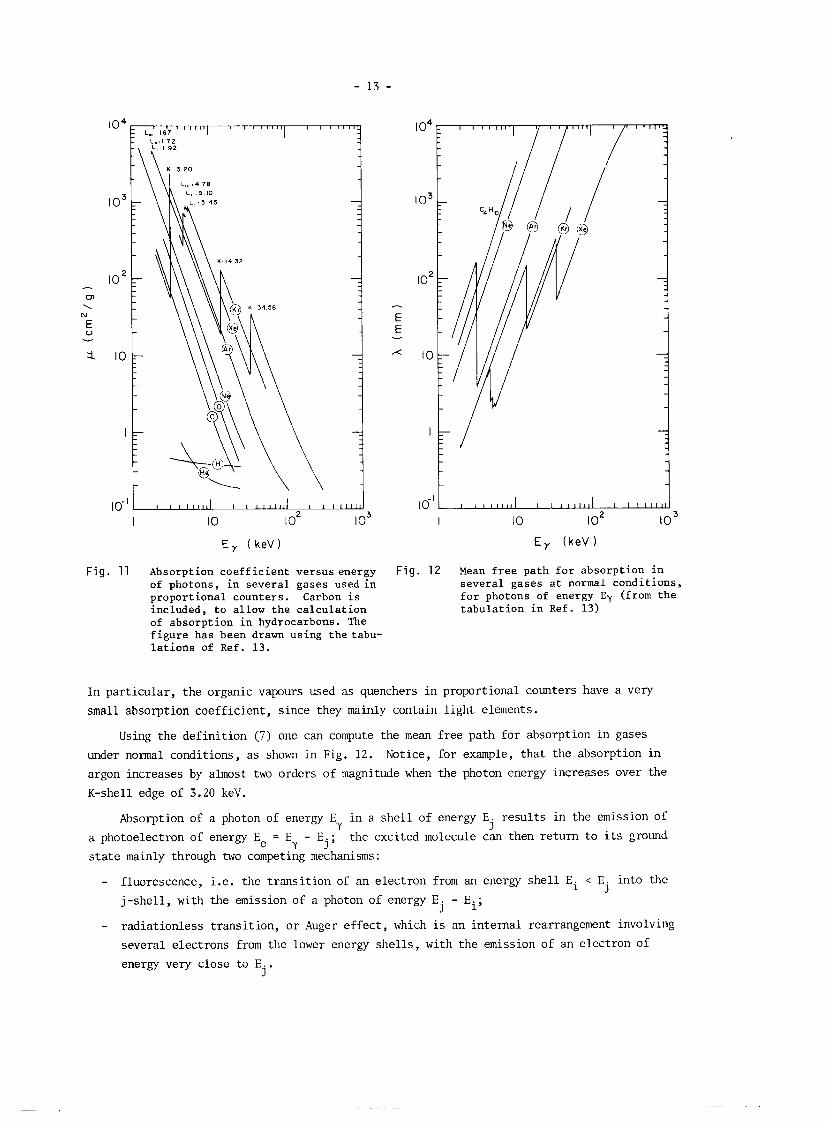
F i g . 11 Absorption c o e f f i c i e n t versus energy F ig . 12 Mean f r e e pa th f o r ab so rp t i on i n of photons, i n s e v e r a l gases used i n s eve ra l gases a t normal cond i t i ons , p ropo r t i ona l counters . Carbon i s f o r photons of energy Ey (from t h e inc luded , t o a l low t h e c a l c u l a t i o n t a b u l a t i o n i n Ref. 13) of absorp t ion i n hydrocarbons. The f i g u r e has been drawn us ing t h e t a b u - l a t i o n s of Ref. 13 .
In par t icular , the organic vapours used as quenchers i n proportional counters have a very
small absorption coefficient, since they mainly contain l ight elements.
Using the definition (7) one can compute the mean free path for absorption i n gases
under normal conditions, as shown i n Fig. 1 2 . Notice, for example, that the absorption i n
argon increases by almost two orders of magnitude when the photon energy increases over the
K-shell edge of 3.20 keV.
Absorption of a photon of energy E i n a she l l of energy E . resul ts i n the emission of Y J
a photoelectron of energy Ee = E - E . - the excited molecule can then return t o its ground Y l '
s t a t e mainly through two competing mechanisms:
- fluorescence, i . e . the t ransi t ion of an electron from an energy she l l Ei < E . into the 1
j-shell , with the emission of a photon of energy E - Ei; j - radiationless t ransi t ion, o r Auger e f fec t , which i s an internal rearrangement involving
several electrons from the lower energy she l l s , with the emission of an electron of
energy very close t o E.. J

The fraction of de-excitations producing the emission of a photon i s called fluorescence
yield. For the K-shell, the fluorescence yield increases with the atomic number as shown
i n Fig. 13 ' 4, . In argon, for example, about 15% of the photoelectric absorptions are
followed by the emission of a photon, while i n 85% of the events two electrons, of energy
E - EK and s l igh t ly smaller than EK, respectively, are produced. The secondary photon, Y emitted a t an energy just below the K-edge, has of course a very long mean free path for
absorption and can therefore escape from the volume of detection. This produces the
character is t ic escape peak of argon, a t an energy E - EK. In detectors where localization Y
of the conversion p i n t i s required, the emission of a long-range photon can introduce a
large error i f the position i s estimated with a centre-of-gravity method as i s often the
case. A quantitative discussion on th i s point can be found i n Bateman e t a1.15) fo r xenon-
f i l l e d counters.
The primary photoelectron is emitted i n a preferential direction, depending on its
energy, as shown i n Fig. 14; up t o a few tens of keV, the direction of emission i s roughly
perpendicular t o the incoming photon direction. However, as already discussed i n Sec-
t ion 2 . 4 , multiple scattering quickly randomizes the motion of the heavily ionizing photo-
electron. The range of electrons in gases was also discussed in Section 2.5.
Fig . 13 Fluorescence yield of the K shell F ig . 14 Probability of emission of a i.e. the fraction of de-excitations photoelectron at a given angle producing the emission of a photon, in respect to the incoming photon versus atomic number 4 , direction, as a function of the
quantum energy4)
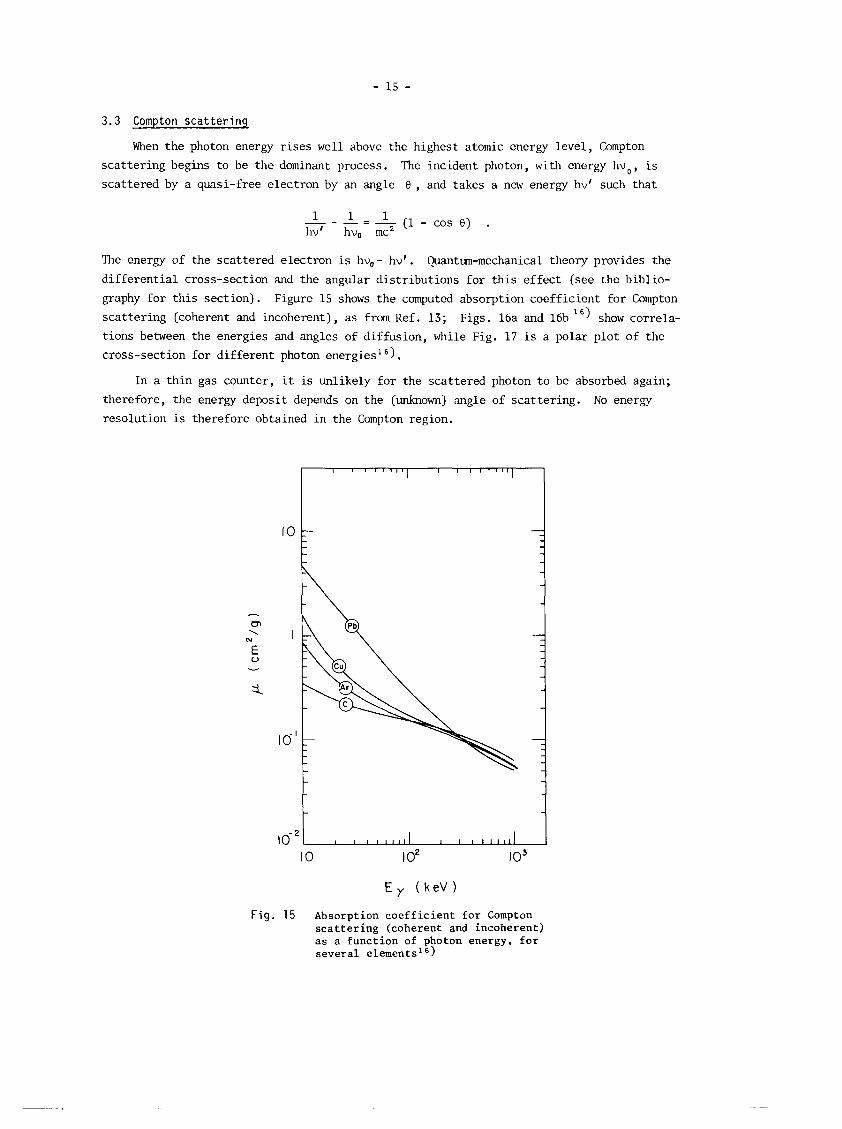
3.3 Compton scattering
When the photon energy r i ses well above the highest atomic energy level, Compton
scat ter ing begins to be the dominant process. Thc incident photon, with energy hv,, i s
scattered by a quasi-free electron by an angle 8 , and takes a new energy hv' such that
- (1 - cos 0) . v hv, mc2
The energy of the scattered electron is hv, - hv' . wantun-mechanical theory provides the
d i f fe ren t ia l cross-section and the angular dis t r ibut ions for t h i s effect (see the biblio-
graphy for t h i s section). Figure 15 shows the computed absorption coefficient for Compton
scattering (coherent and incoherent) , as from Ref. 13; Figs. 16a and 16b 6, show correla-
t ions between the energies and angles of diffusion, while Fig. 17 is a polar plot of the
cross-section for different photon energies1 6).
In a th in gas counter, it i s unlikely for the scattered photon t o be absorbed again;
therefore, the energy deposit depends on the (unknown) angle of scattering. No energy
resolution i s therefore obtained i n the Compton region.
Fig. 15 Absorption coefficient for Compton scattering (coherent and incoherent) as a function of photon energy, for several elements1 6,
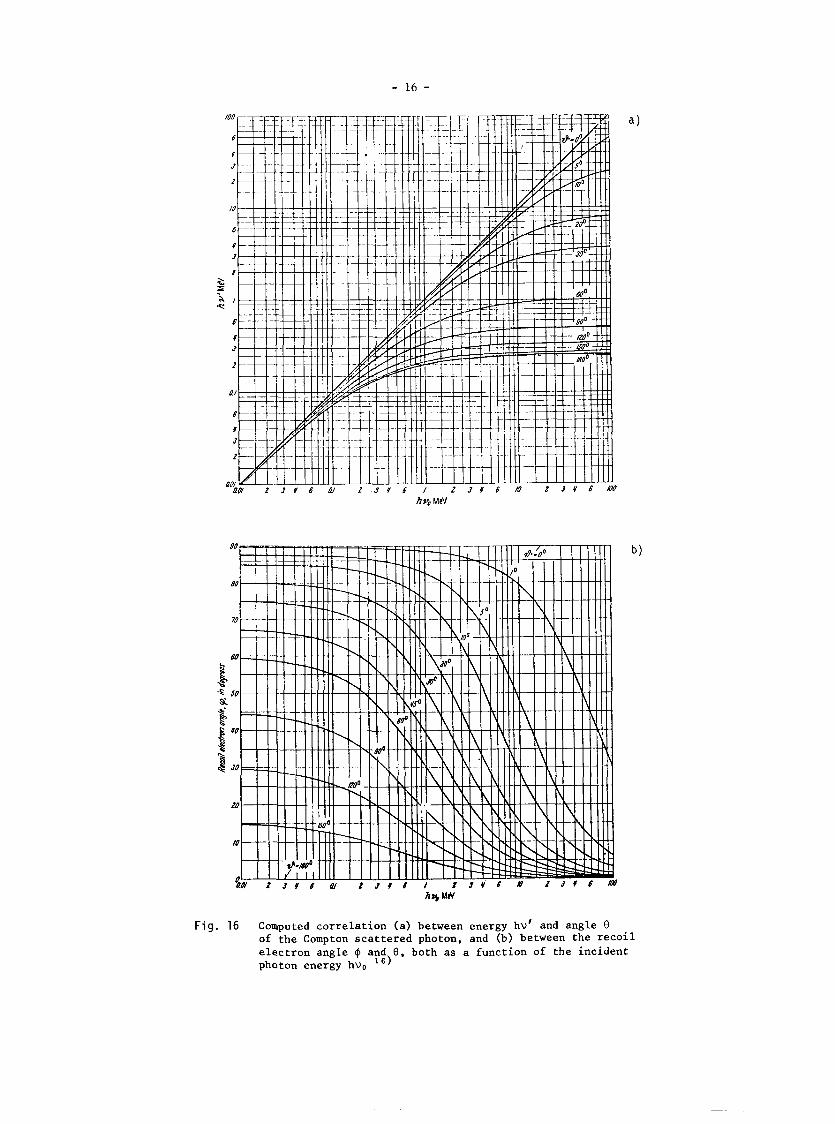
F i g . 16 Computed correlation (a) between energy hv' and angle 0 of the Compton scattered photon, and (b) between the recoil electron angle 4 and 0, both as a function of the incident photon energy hvo l')

F i g . 17 Polar plot of the Compton cross-section as a function of the photon scattering angle 8, for several incident photon energies1 6,
3.4 P a i r p r o d u c t i o n
Electron-positron pair production can take place at photon energies above the threshold
of 1.02 MeV (corresponding to two electron masses); Figure 18 shows the absorption coeffi- cient due to pair production for several elements13), while Fig. 19 gives the relative
F i g . 18 Absorption coefficient for e'e- F i g . 19 Relative energy sharing between e+ pair production in several mate- and e- in pair production, for rials, as a function of the in- several incoming energies (given coming photon energy (drawn from in terms of the electron rest energy the Tables of Ref. 13) mc2 = 0.511 MeV). The ordinate is
proportional to the cross-section for the process, as given in the previous curve. (From N.A. Dyson, see bibliography for this section.)
energy-sharing between e+ and e-. In the figure, the ordinate i s a quantity proportional
t o the d i f fe ren t ia l cross-section for the process, increasing with photon energy (given i n
terms of the electron r e s t mass). Because of the very small value of the absorption coef-
f ic ien t , proportional chambers are used i n t h i s energy region only t o detect the pairs pro-
duced in a layer of heavy material placed in front of the chamber. Shower counters are e i ther
constructed in t h i s way sandwiching chambers with conversion plates , or by using high density 1 7 ) d r i f t chambers with conversion c e l l s of heavy material i n the gas volume .
DRIFT AND DIFFUSION OF CHARGES I N GASES
4.1 Ion and e lec t ron d i f f u s i o n w i thout e l e c t r i c f i e l d s
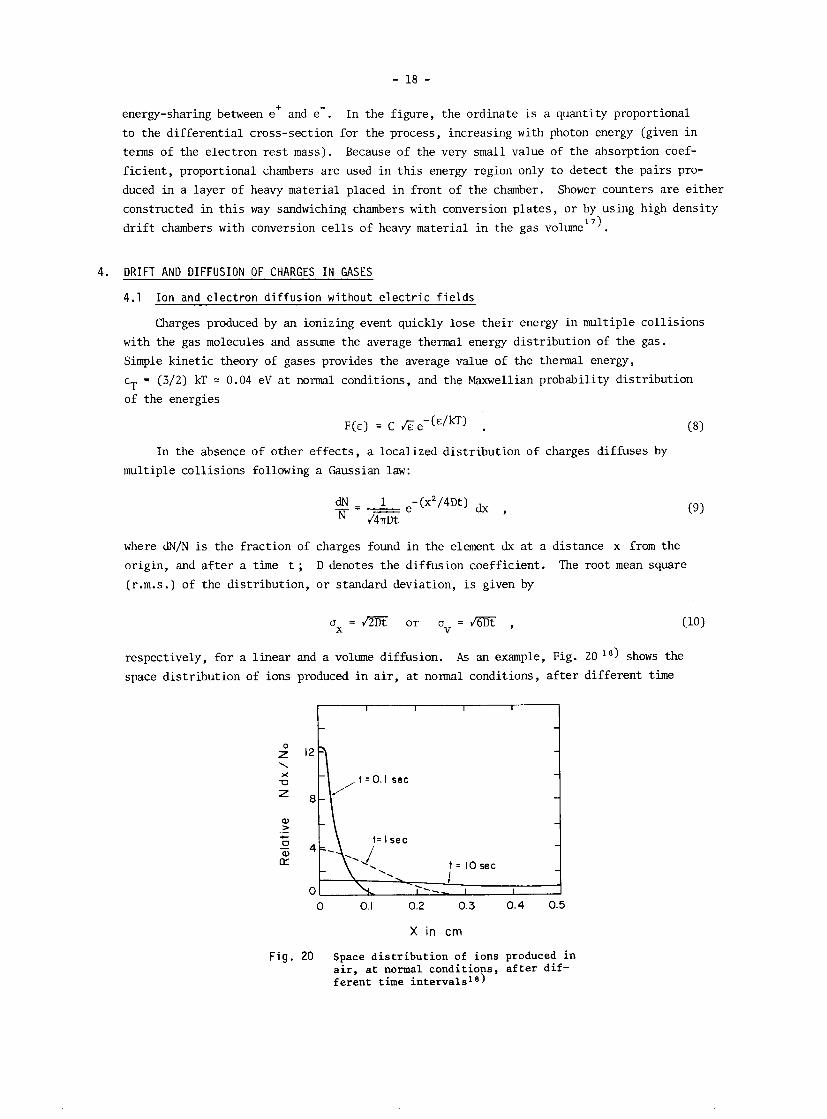
Charges produced by an ionizing event quickly lose t he i r energy i n multiple col l is ions
with the gas molecules and assume the average thermal energy dis t r ibut ion of the gas.
Simple kinet ic theory of gases provides the average value of the thermal energy,
cT = (3/2) KT = 0.04 eV a t normal conditions, and the W e l l i a n probability dis t r ibut ion
of the energies
In the absence
multiple col l is ions
of other e f fec t s , a localized dis t r ibut ion of charges diffuses by
following a Gaussian law:
where &/N is the fract ion of charges found i n the element dx a t a distance X from the
origin, and a f t e r a time t ; D denotes the diffusion coefficient. The root mean square
(r.m.5.) of the dis t r ibut ion, o r standard deviation, i s given by
respectively, fo r a l inear and a volume diffusion. As an example, Fig. 2 0 18) shows the
space dis t r ibut ion of ions produced i n a i r , a t normal conditions, a f t e r different time
Fig . 20 Space dis t r ibut ion of ions produced in a i r , a t normal conditions, a f te r dif- ferent time intervals18)
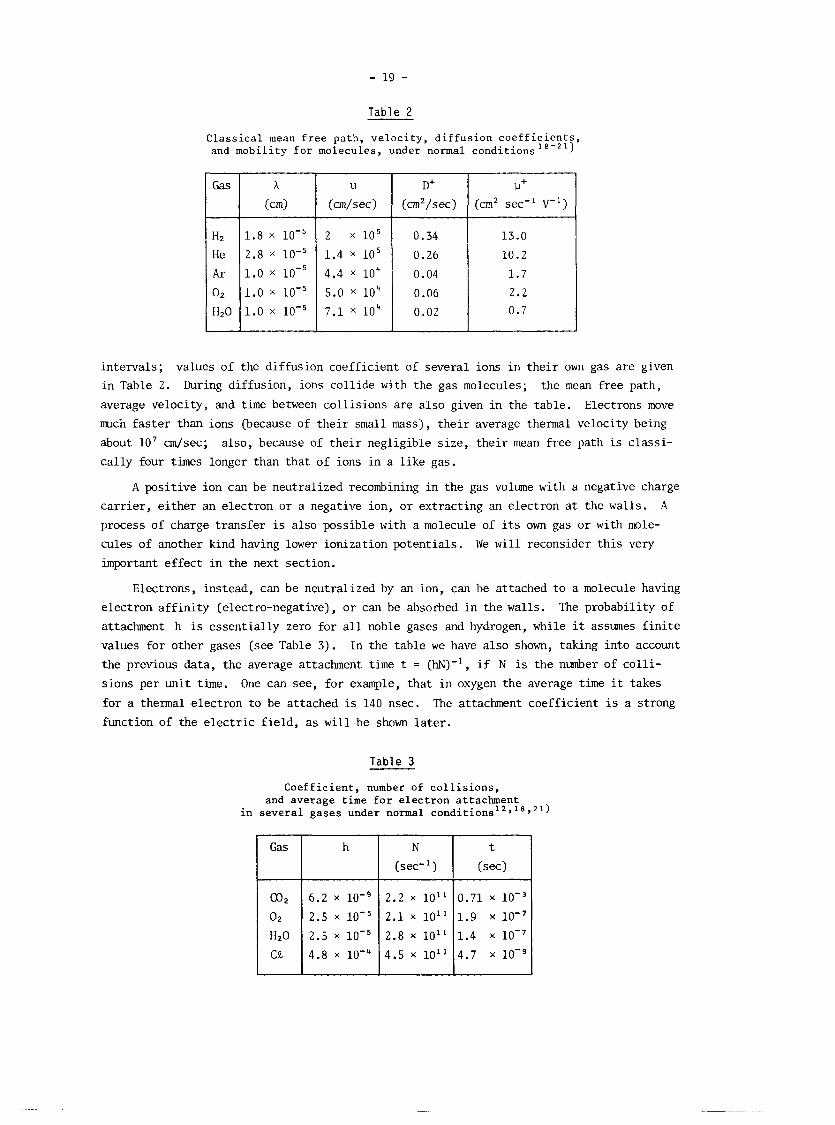
Table 2
Classical mean free p a t h , velocity, diffusion coefficients, and m o b i l i t y f o r molecules, under normal conditions ' '1
U+
(cm2 sec-' V-')
Gas
H2
He
A r
02
H20
intervals; values of the diffusion coefficient of several ions i n the i r own gas are given
in Table 2. During diffusion, ions collide with the gas molecules; the mean free path,
average velocity, and time between col l is ions are also given in the table. Electrons move
much fas te r than ions (because of the i r small mass), t he i r average thermal velocity being
about 107 cm/sec; also, because of t he i r negligible s ize, t he i r mean free path is classi-
ca l ly four times longer than tha t of ions i n a l i ke gas.
A positive ion can be neutralized recombining i n the gas volume with a negative charge
car r ie r , e i ther an electron o r a negative ion, o r extracting an electron a t the walls. A
process of charge transfer is also possible with a molecule of i t s own gas o r with mole-
cules of another kind having lower ionization potent ials . We w i l l reconsider t h i s very
important effect i n the next section.
A
(cm)
1.8 X 10-'
2.8 X 10-'
1.0 X 10-'
1.Ox10-'
1 . 0 x 10-5
Electrons, instead, can be neutralized by an ion, can be attached t o a molecule having
electron a f f i n i t y (electro-negative), o r can be absorbed i n the walls. The probability of
attachment h i s essent ial ly zero for a l l noble gases and hydrogen, while it assumes f i n i t e
values for other gases (see Table 3). In the table we have also shown, taking into account
the previous data, the average attachment time t = (M)-', i f N is the number of co l l i -
sions per un i t time. One can see, fo r example, tha t i n oxygen the average time it takes
for a thermal electron t o be attached i s 140 nsec. The attachment coefficient is a strong
function of the e l ec t r i c f i e ld , as w i l l be shown l a t e r .
U
(cm/sec>
2 x 10'
1.4 X 10⁵
4.4 X l o 4 5 .Ox10 '
7.1 X 10'
Tab le 3
Coefficient, number of col l is ions, and average time for electron attachment
i n several gases under normal conditions1 2 s ' 8 , 2 l )
N
(sec- l )
4.2 Mobility o f ions
When an e l ec t r i c f i e ld i s applied across the gas volume, a net movement of the ions
along the f i e ld direct ion i s observed. The average velocity of t h i s slow motion (not t o be
confused with the instant ion velocity) is called d r i f t velocity W+, and it is found t o be
l inearly proportional t o the reduced f i e ld E/P up t o very high f ie lds , P being the gas
pressure. I t is therefore convenient t o define a quantity U+, called mobility, as
The value of the mobility is specif ic t o each ion moving i n a given gas. A constant mobi-
l i t y is the d i rec t consequence of the fac t tha t , up t o very high f ie lds , the average energy of ions is almost unmodified; we w i l l see tha t t h i s is not the case f o r the electrons.
A c lassical argument allows one t o obtain the following relationship between mobility
and diffusion coefficient :
Values of the mobility and diffusion coefficient f o r ions moving in a l i ke gas were given in
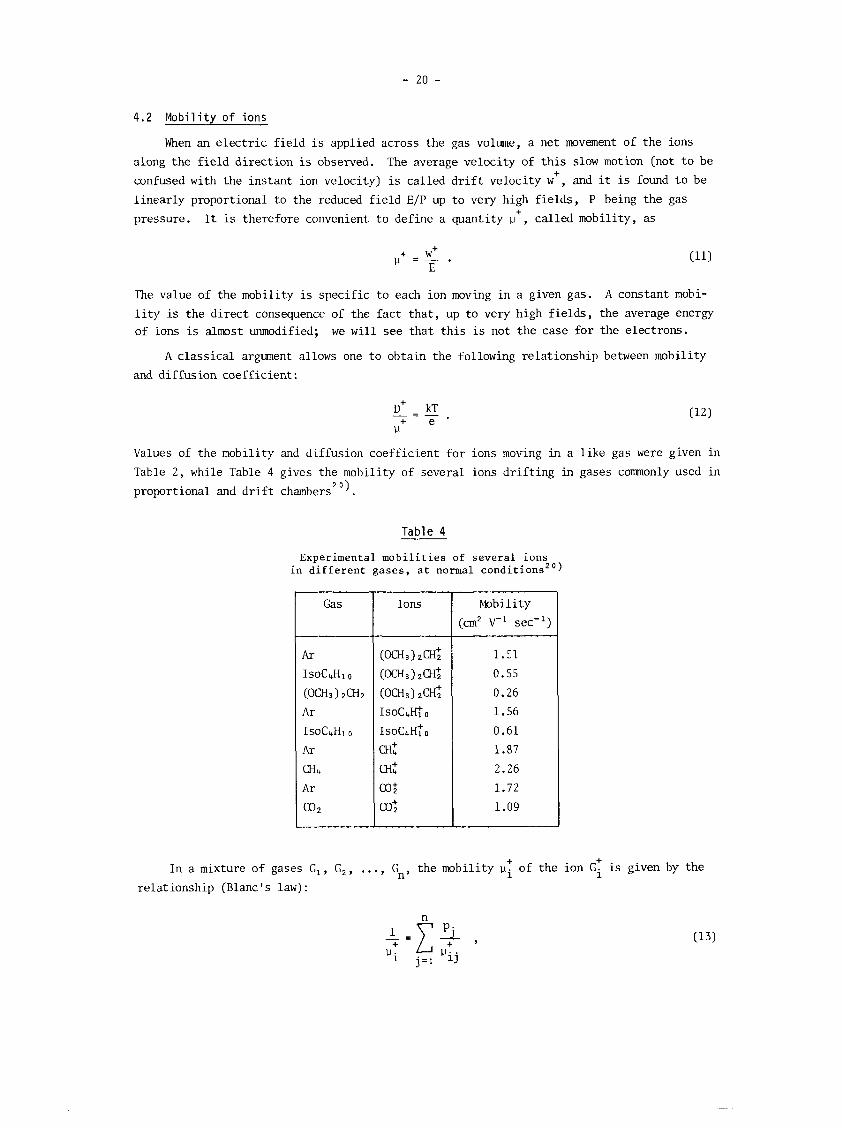
Table 2 , while Table 4 gives the mobility of several ions dr i f t ing in gases commonly used in 20) proportional and d r i f t chambers .
Tab le 4
Experimental mobilities of several ions in different gases, at normal conditionsz0)
Mobility
(cm2 V-' sec-')
In a mixture of gases G , , G, , . . . , Gn, the mobility 11; of the ion G: i s given by the
relationship (Blanc's law):
where p. is the volume concentration of gas j in the mixture, and y I j the nobility of ion + . J Gi in gas G.. In gas mixtures, however, a very effective process of charge transfer takes
3 place, and very quickly removes all ions except the ones with the lower ionization poten-
tial. Depending on the nature of the ions, and on the difference in the ionization potential
(small differences increase the charge-transfer probability), it takes between 100 and 1000
collisions for an ion to transfer its charge to a molecule having a lower ionization potential
Since mean free paths for collision are of the order of 10-5 cm under normal conditions, see
Table 2, one can assume that after a drift length between 10-~ p-1 and 10-2 p-' cm, where p
is the percentage of the lowest ionization potential molecules, the charge-exchange mechanism
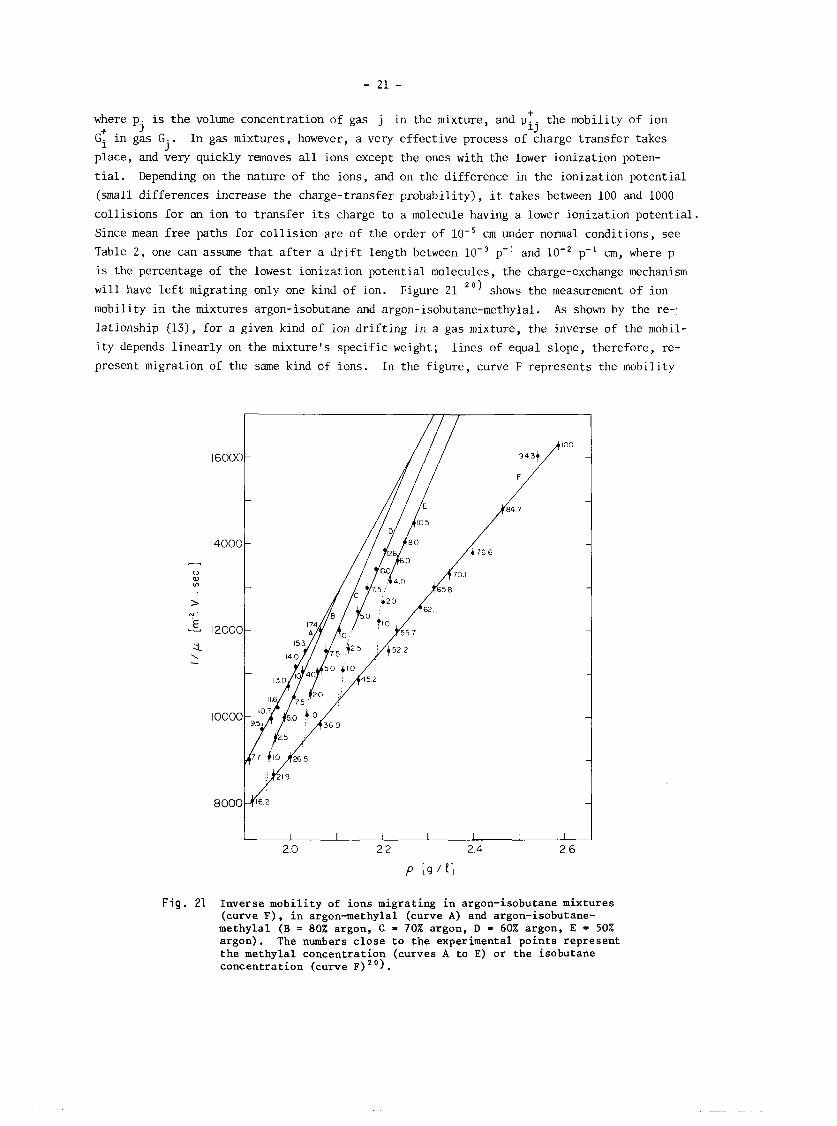
will have left migrating only onc kind of ion. Figure 21 shows the measurement of ion
mobility in the mixtures argon-isobutane and argon-isobutane-methylal. As shown by the re-,
lationship (13), for a given kind of ion drifting in a gas mixture, the inverse of the mobil-
ity depends linearly on the mixture's specific weight; lines of equal slope, therefore, re- present migration of the same kind of ions. In the figure, curve F represents the mobility
Fig. 21 Inverse mobility of ions migrating in argon-isobutane mixtures (curve F), in argon-methylal (curve A) and argon-isobutane- methylal (B = 80% argon, C = 70% argon, D = 60% argon, E = 50% argon). The numbers close to the experimental points represent the methylal concentration (curves A to E) or the isobutane concentration (curve F) '1.

of isobutane ions in variable argon-isobutane mixtures, while curves B, C, D, E represent
the measured mobility of methylal ions in several argon-isobutane-methylal mixtures; the
fraction of methylal in each measurement is written close to the experimental points. Clearly,
in the range of electric fields considered (a few hundred to a thousand volts/cm) and for 1 cm
of drift, if methylal is present in the mixture by more than 3-4% the exchange mechanism is
fully efficient and only methylal ions are found to migrate. The relevance of this mechanism
in the operation of proportional counters will be discussed in Section 5.3.
Ions migrating in a time t over a length X diffuse with a probability distribution
expressed by Eq. (g), and the standard deviation is given by [introducing expressions (12)
and (11) in (10)]:
...
Therefore the r.m.s. linear diffusion is independent of the nature of the ions and the gas;
the variation of ox with the electric field, at 1 atm, is shown in Fig. 22, as well as the
equivalent time dispersions at for several gas mixtures2 '1, and 1 cm drift.
Cx for al l gases
6 --- q for 7 0 % Ar and 3 0 % CH4
40- for 7 0 % Ar and 30% CO2 -- q for 6 7 % Ar . 3 0 % Isn C4 HIO and \\'\. \
3 % Methylal
F i g . 22 Positive ion diffusion in space (a,) and in time (at) for a drift length of 1 cm, at normal conditions as a function of electric field2~). Notice that a, is the same for all gases.
4.3 D r i f t o f e l e c t r o n s
A simple theory of mobility can be constructed following the same lines as for positive
ions; it was found very early on, however, that except for very low fields the mobility of
electrons is not constant. In fact, due to their small mass, electrons can substantially in-
crease their energy between collisions with the gas molecules under the influence of an elec-
tric field. In a simple formulation, due to owns send^') one can write the drift velocity as
where r is the mean time between col l is ions, i n general a function of the e l ec t r i c f i e ld E .
I t has been found that the col l is ion cross-section, and therefore T , varies for some gases
very strongly with E , going through maxima and minima (Ramsauer e f fec t ) . This i s a con-
sequence of the f ac t tha t the electron wavelength approaches those of the electron she l l s
of the molecule, and complex quantum-mechanical processes take place. The energy distribu-
t ion w i l l therefore change from the original Maxwellian shape [as given by Eq. (8)] and the
average energy can exceed the thermal value by several orders of magnitude, a t high f ie lds .
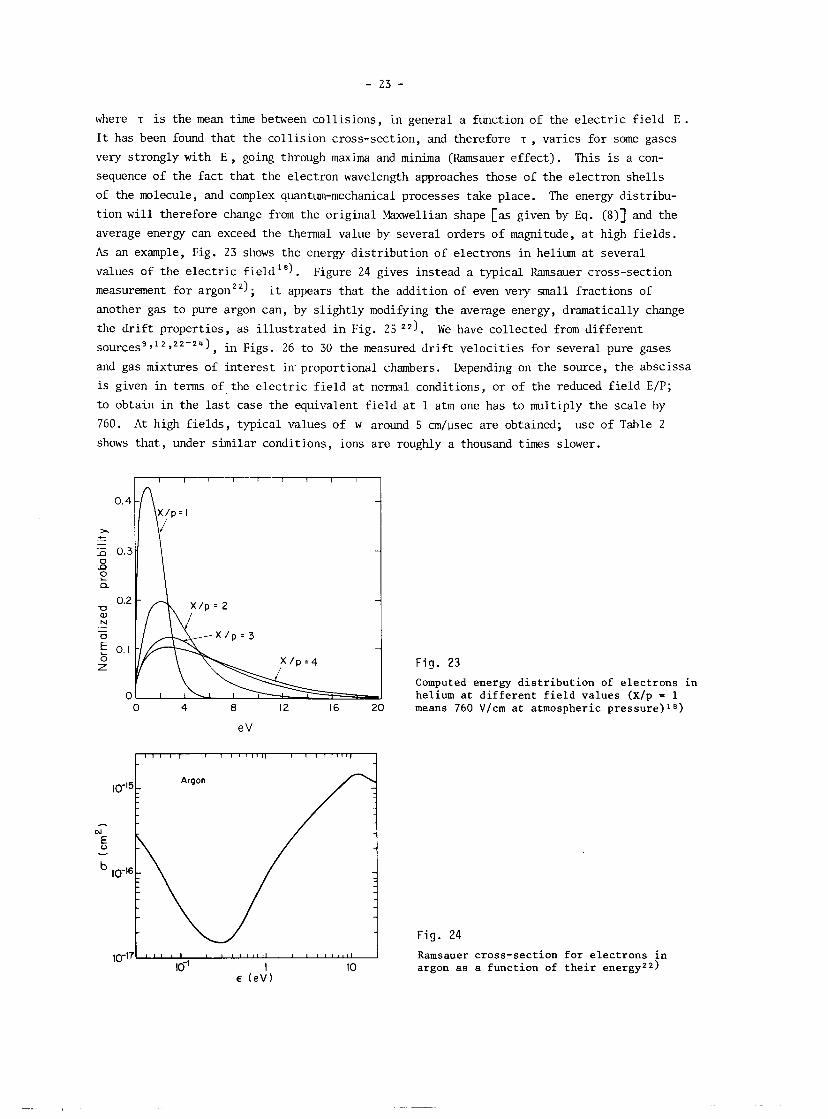
A s an example, Fig. 23 shows the energy dis t r ibut ion of electrons i n helium a t several
values of the e l ec t r i c f ie ld1 ' ) . Figure 24 gives instead a typical Ramsauer cross-section
measurement for argonz2); it appears tha t the addition of even very small fractions of
another gas t o pure argon can, by s l igh t ly modifying the average energy, dramatically change
the d r i f t properties, as i l lus t ra ted i n Fig. 25 Z Z ) . We have collected from different
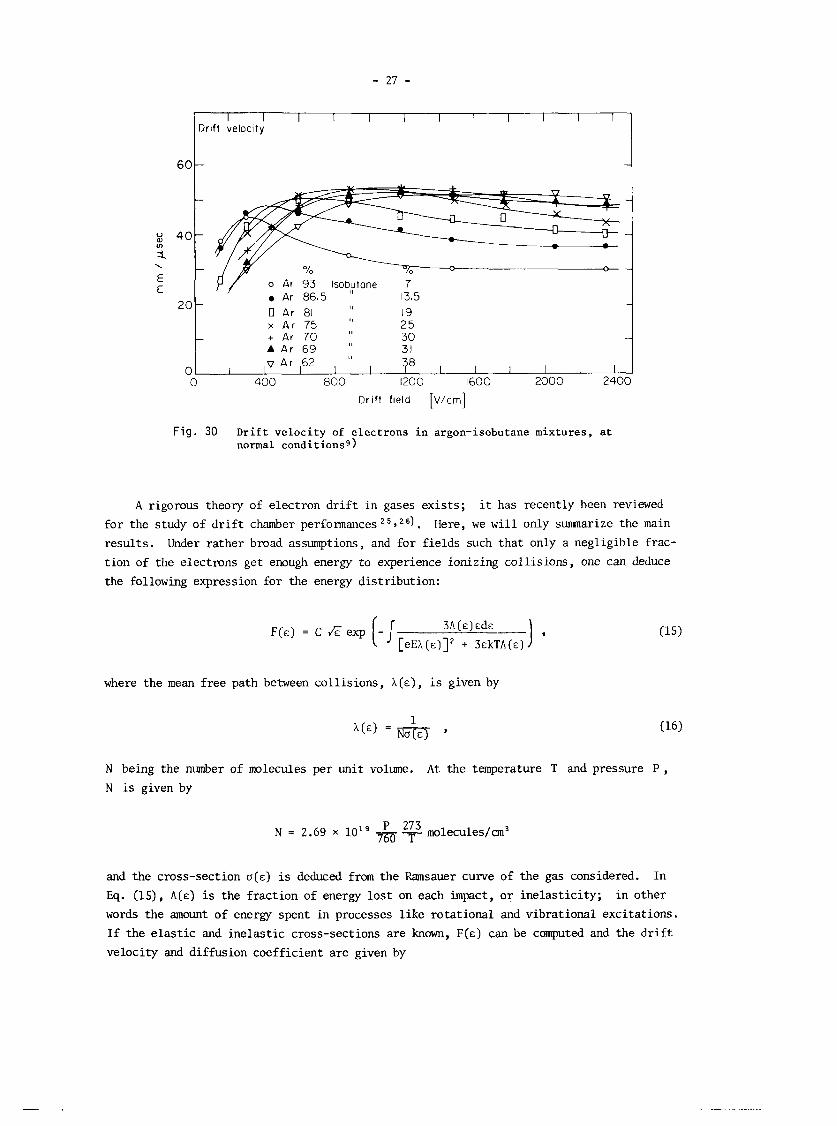
sources9 9 ' , z 2 - z 4 ) , i n Figs. 26 t o 30 the measured d r i f t veloci t ies fo r several pure gases
and gas mixtures of in te res t in' proportional chambers. Depending on the source, the abscissa
i s given i n terms of the e l ec t r i c f i e ld a t normal conditions, or of the reduced f i e l d E/P;
t o obtain i n the l a s t case the equivalent f i e ld a t 1 atm one has t o multiply the scale by
760. A t high f ie lds , typical values of W around 5 cm/psec are obtained; use of Table 2
shows tha t , under similar conditions, ions are roughly a thousand times slower.
F i g . 23
Computed energy distribution of electrons helium at different field values ( ~ / p = 1
0 4 8 12 16 20 means 760 V/cm at atmospheric pressure)l8)
e V
F i g . 24
10-l7 Ramsauer cross-section for electrons in 16' 1 10 argon as a function of their energy22)
E ( e V )

F i g . 25 Drift velocity of electrons in pure argon, and in argon with small added quantities of nitrogen. The very large effect on the velocity for small additions is apparentzz).
E l e c t r i c f ~ e l d ( k V / c m )
F ig . 26 Drift velocity of electrons in several gases at normal condi- tions12,22,23)
Fig . 27 Drift velocity of electrons in methylal [(OCHB),CH~] and in ethylene ( C ~ H L , ) 24)
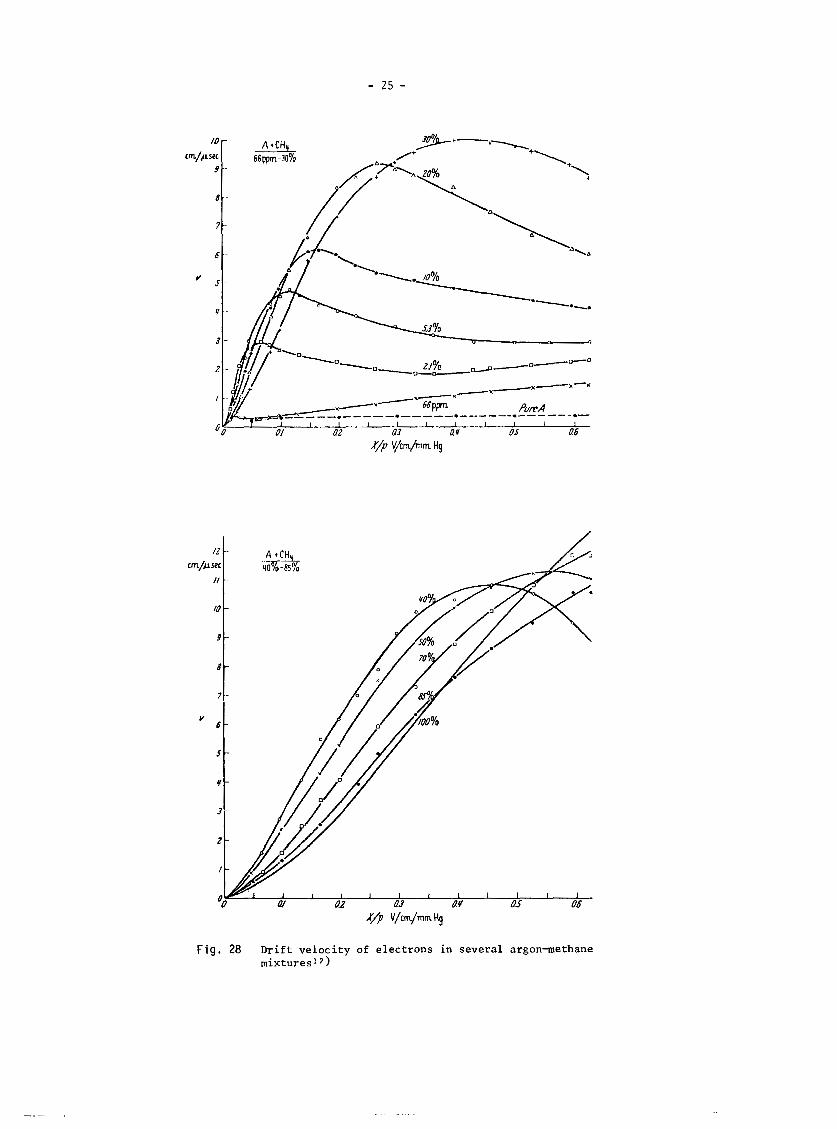
F i g . 28 Drift velocity of electrons in several argon-methane mixturesl2)
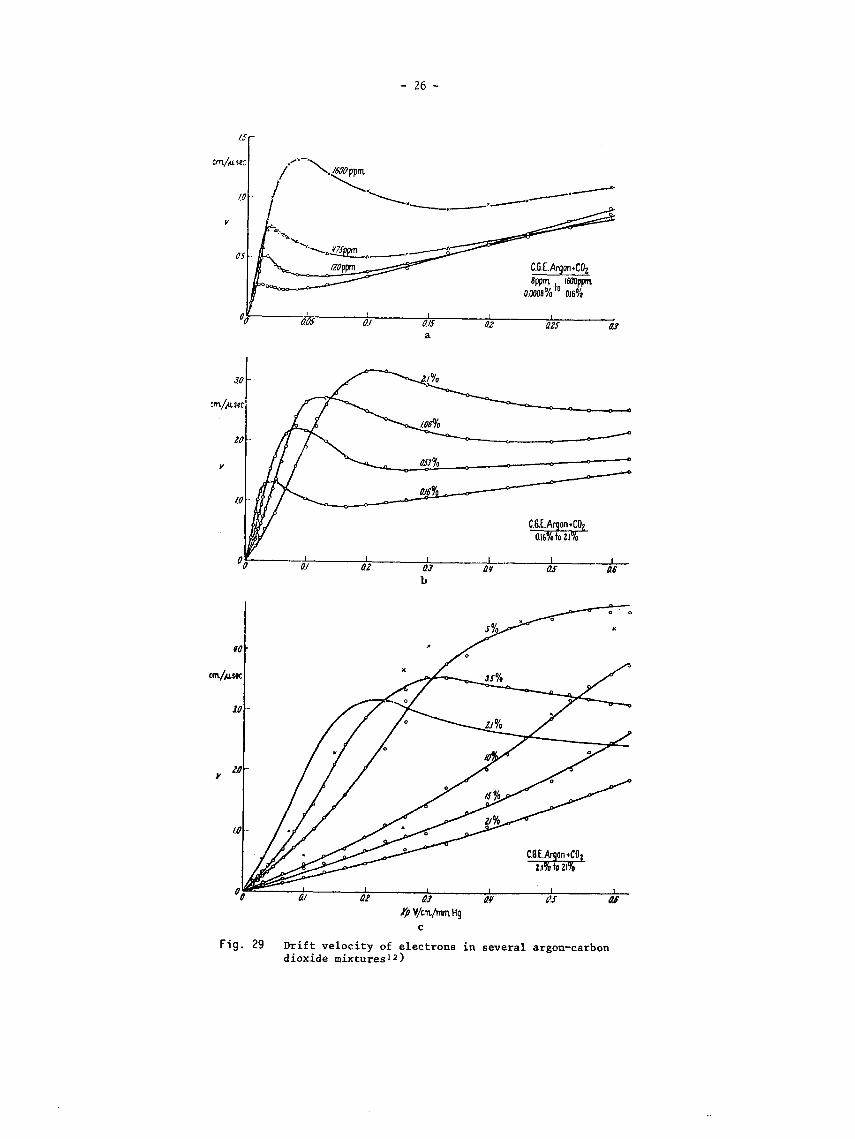
F i g . 29 Drift velocity of electrons in several argon-carbon dioxide mixtures12 )
I I I I I I I l I I I I - Drift velocity
D r i f t f ield [ ~ / c r n ]
F i g . 30 D r i f t velocity of electrons i n argon-isobutane mixtures, a t normal conditions9 )
A rigorous theory of electron d r i f t i n gases exis ts ; it has recently been reviewed
for the study of d r i f t chamber performance^'^,^^), Here, we w i l l only sumnarize the main
resul ts . Under rather broad assumptions, and for f ie lds such tha t only a negligible frac-
t ion of the electrons get enough energy to experience ionizing col l is ions, one can deduce
the following expression for the energy distribution:
where the mean f ree path between col l is ions, X ( E ) , is given by
N being the number of molecules per uni t volume. A t the temperature T and pressure P ,
N is given by
and the cross-section U(€) is deduced from the Pmsauer curve of the gas considered. In
Eq. (15) , A(&) is the fract ion of energy l o s t on each impact, o r ine las t ic i ty ; i n other
words the amount of energy spent i n processes l ike rotat ional and vibrational excitations.
I f the e l a s t i c and ine las t ic cross-sections are known, F(&) can be computed and the d r i f t
velocity and diffusion coefficient a re given by
where U = m i s the instant velocity of electrons of energy E .
Simple rules hold fo r gas mixtures
with obvious meaning. I t is customary t o define a character is t ic energy as follows:
eE D (E) E k = m . .
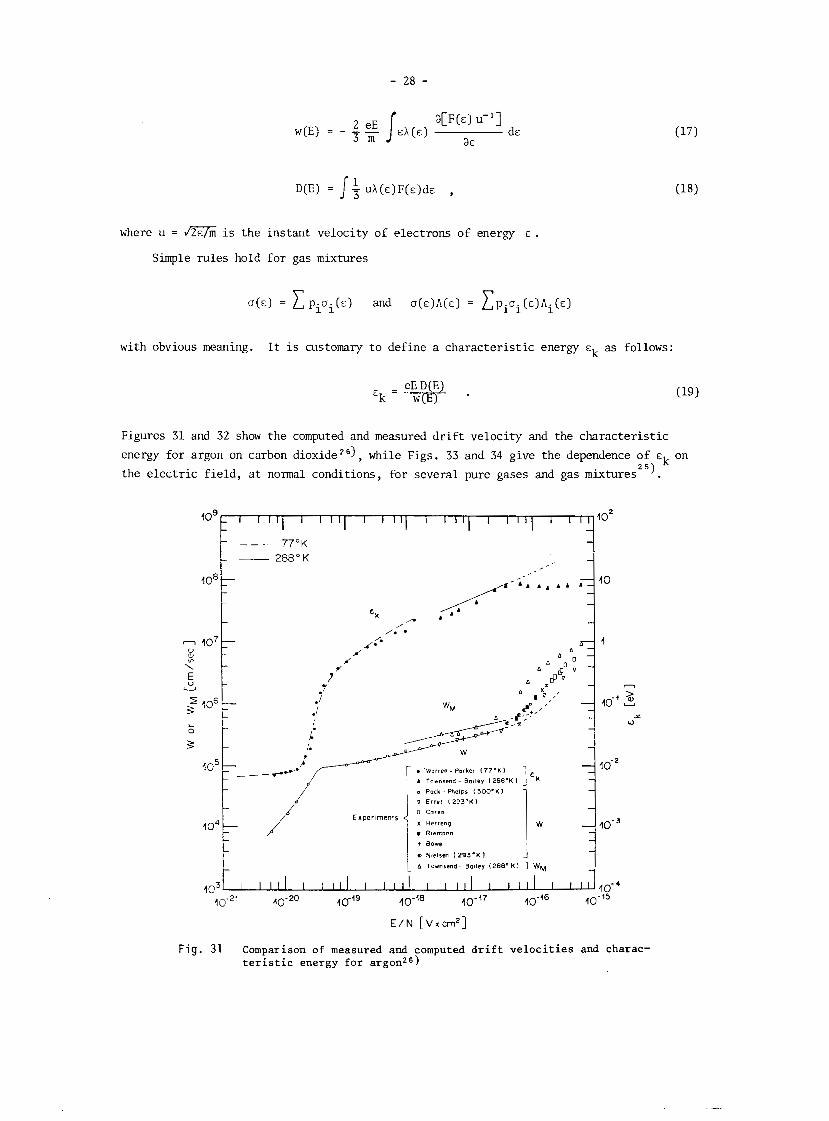
Figures 31 and 32 show the computed and measured d r i f t velocity and the character is t ic
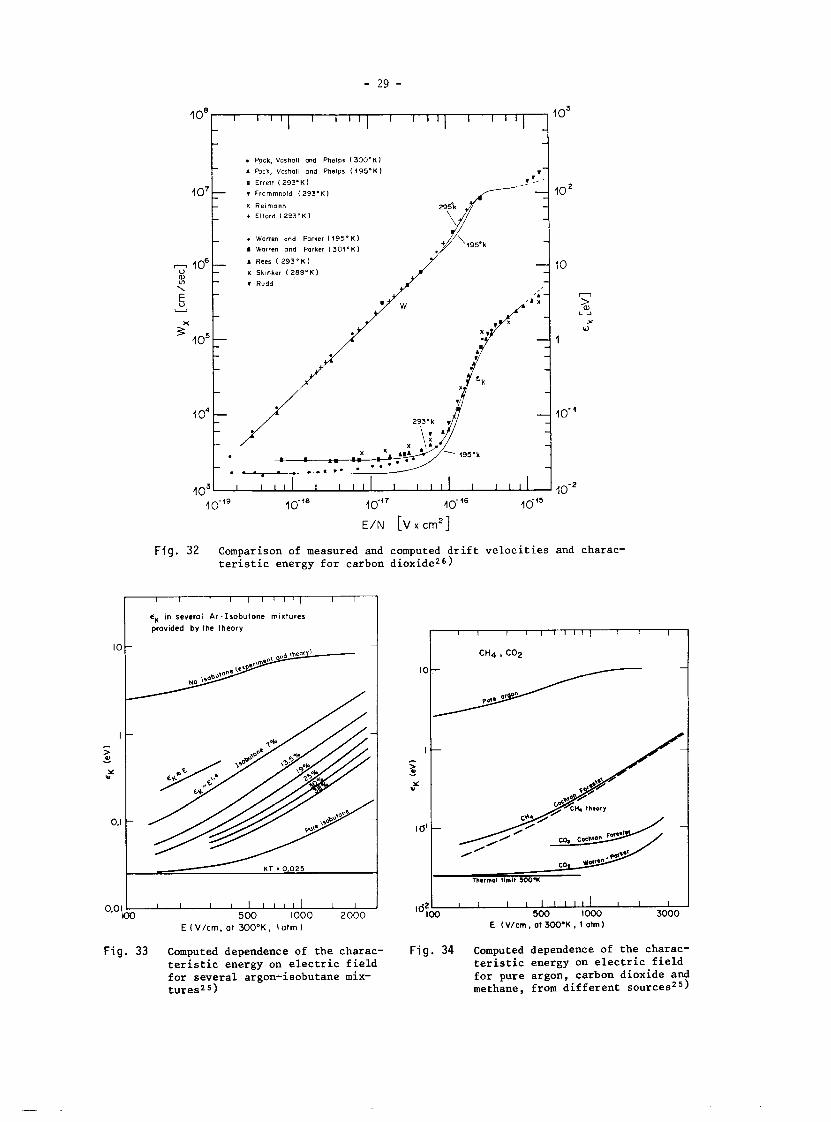
energy for argon on carbon dioxide"), while Figs. 33 and 34 give the dependence of E~ on 5, the e lec t r ic f ie ld , a t normal conditions, for several pure gases and gas mixtures .
F ig . 31 Comparison of measured and computed drift velocities and charac- teristic energy for argon26)
Pock, Vosholl and Phelps 1 300•‹K1
A Pock, Vosholl and Phelpr (195-K 1 m Errelt 1293-K l v Frornmnold ( 2 9 3 . ~ 1
X R e ~ m a n n
t Elford (293'K)
. Women and Porker (195.K)
1 Warren ond Parker (301•‹K)
A Reer I 2 9 3 ' K I
X Sklnker 1285DK1 3 \
r Rudd
,; U
F i g . 32 Comparison of measured and computed d r i f t ve loc i t i e s and charac- t e r i s t i c energy for carbon dioxide2 6 ,
cK in several Ar-Isobuione mlxtures provlded by the theory
I I I I I I l l l l I I l 5 0 0 1000 2000
E ( V / c m , 01 300• ‹K , l o tm )
F i g . 33 Computed dependence of the charac- t e r i s t i c energy on e l e c t r i c f i e l d for several argon-isobutane mix- turesZ5)
c I a:00 500 1000 3000
E (V /cm, ot 300 • ‹K , I oim )
F i g . 34 Computed dependence of the charac- t e r i s t i c energy on e l e c t r i c f i e l d for pure argon, carbon dioxide and methane, from different sourcesz5)
4.4 D i f f u s i o n o f e l e c t r o n s
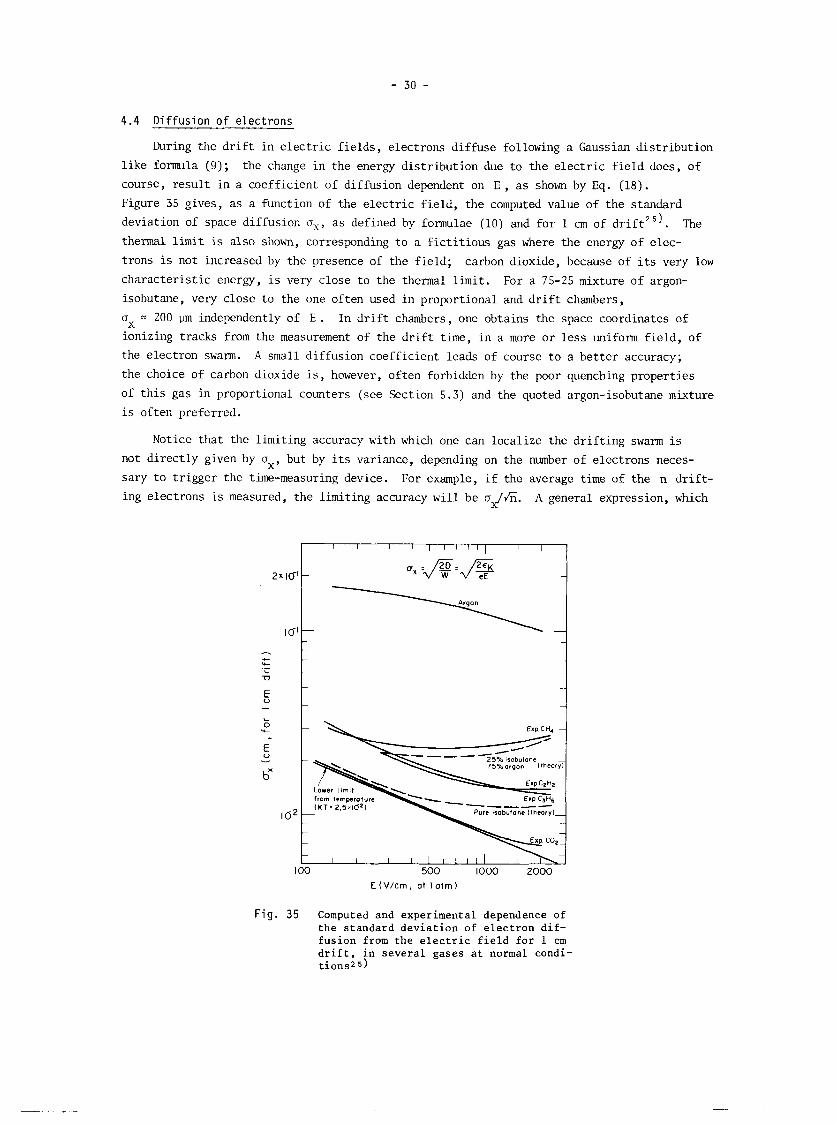
During the d r i f t i n e l ec t r i c f ie lds , electrons diffuse following a Gaussian dis t r ibut ion
l i ke formula (9); the change i n the energy dis t r ibut ion due t o the e lec t r ic f i e ld does, of
course, resul t i n a coefficient of diffusion dependent on E , a s shown by Eq. (18).
Figure 35 gives, as a function of the e l ec t r i c f i e ld , the computed value of the standard
deviation of space diffusion ox, as defined by formulae (10) and for 1 cm of d r i f t 2 5 ) . The
thermal l i m i t i s also shown, corresponding t o a f i c t i t i ous gas where the energy of elec-
trons i s not increased by the presence of the f ie ld ; carbon dioxide, because of its very low
character is t ic energy, i s very close t o the thermal l imit . For a 75-25 mixture of argon-
isobutane, very close t o the one often used i n proportional and d r i f t chambers,
U = 200 p independently of E . In d r i f t chambers, one obtains the space coordinates of X
ionizing tracks from the measurement of the d r i f t time, i n a more o r less uniform f i e ld , of
the electron swarm. A small diffusion coefficient leads of course t o a be t te r accuracy;
the choice of carbon dioxide i s , however, often forbidden by the poor quenching properties
of t h i s gas in proportional counters (see Section 5.3) and the quoted argon-isobutane mixture
i s often preferred.
Notice that the limiting accuracy with which one can localize the dr i f t ing swarm is
not d i rec t ly given by ox, but by i t s variance, depending on the number of electrons neces-
sary t o t r igger the time-measuring device. For example, i f the average time of the n d r i f t -
ing electrons i s measured, the limiting accuracy w i l l be a d h i . A general expression, which
Fig . 35 Computed and experimental dependence of the standard deviation of electron dif- fusion from the electric field for 1 cm drift, in several gases at normal condi- tions25)
can be written for the case where k electrons out of n are necessary t o t r igger the detect-
ing electronics2 ') , is
For k = 1, the expression can be seen t o reduce t o
for example, fo r n = 100 (typical value for 1 cm of gas), o l = 0.4 ox. We w i l l discuss
t h i s point further i n the section devoted to high-accuracy d r i f t chambers.
4.5 D r i f t o f e l e c t r o n s i n magnet ic f i e l d s
The presence of a magnetic f i e ld modifies the d r i f t properties of a swarm of electrons.
The Lorentz force applied t o each moving charge transforms the small segment of motion
between two col l is ions into circular t ra jec tor ies , and also modifies the energy dis t r ibu-
tion. The net e f fec t i s a reduction of the d r i f t velocity, a t l eas t a t low e l ec t r i c f ie lds ,
and a movement of the swarm along a l i ne different from a f i e ld l ine. In the case of a
movement i n a constant e lec t r ic and magnetic f i e ld , the swarm
l i ne a t an angle 4, with the f i e l d l ines , and with a velocity
theory tha t gives the expression (14) allows one t o write the
applied i n a direction perpendicular t o the e l ec t r i c f i e ldz1 )
tan ccH = wr .
Substituting the value of T obtained from Eq. (14), one gets
w i l l d r i f t along a s t ra igh t
wH # W. The same simple
effect of a magnetic f i e ld H
as follows:
an approximation which i s
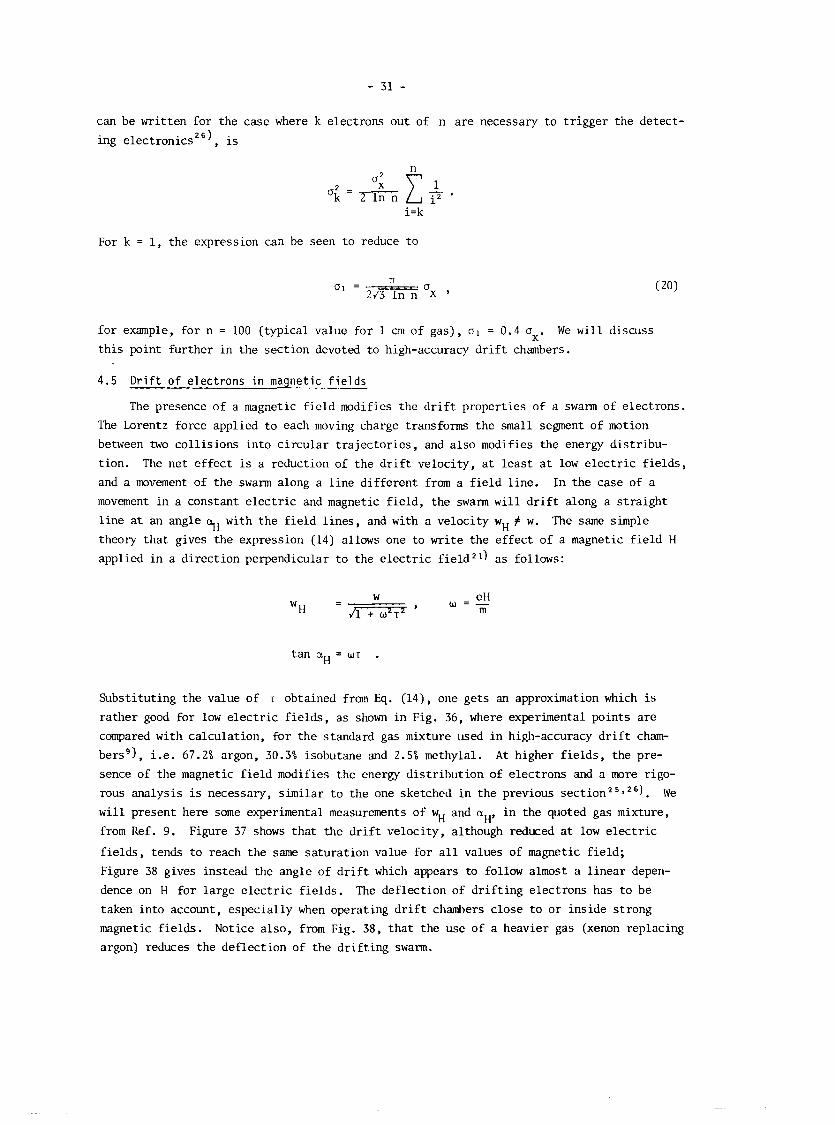
rather good for low e l ec t r i c f i e ld s , as shown i n Fig. 36, where experimental points are
compared with calculation, for the standard gas mixture used i n high-accuracy d r i f t cham-
bersg) , i . e . 67.2% argon, 30.3% isobutane and 2.5% methylal. A t higher f i e ld s , the pre-
sence of the magnetic f i e ld modifies the energy dis t r ibut ion of electrons and a more rigo-
rous analysis is necessary, similar t o the one sketched i n the previous s e c t i ~ n ~ ~ * ~ ~ ) . We
w i l l present here some experimental measurements of wH and aH, i n the quoted gas mixture,
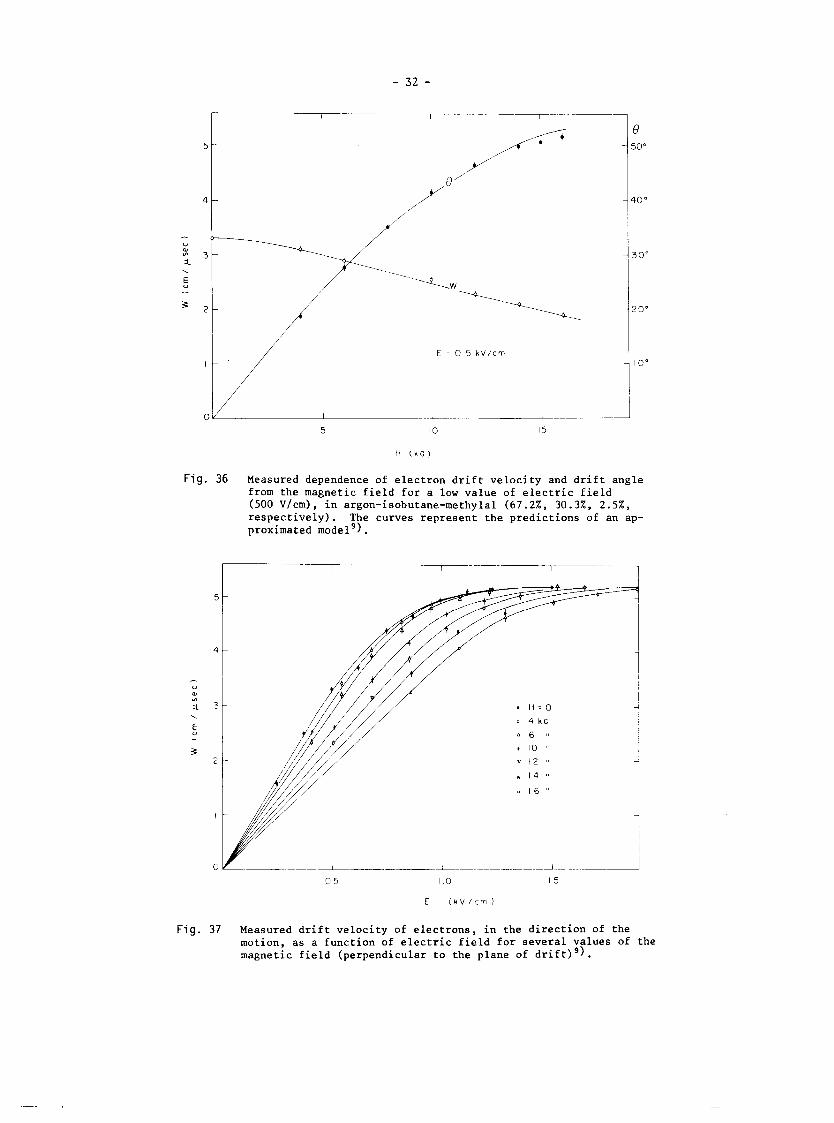
from Ref. 9. Figure 37 shows that the d r i f t velocity, although reduced a t low e l ec t r i c
f ie lds , tends t o reach the same saturation value for a l l values of magnetic f ie ld ;
Figure 38 gives instead the angle of d r i f t which appears to follow almost a l inear depen-
dence on H for large e l ec t r i c f ie lds . The deflection of d r i f t ing electrons has t o be
taken into account, especially when operating d r i f t chambers close t o o r inside strong
magnetic f ie lds . Notice also, from Fig. 38, tha t the use of a heavier gas (xenon replacing
argon) reduces the deflection of the dr i f t ing swarm.
F ig . 36 Measured dependence of electron drift velocity and drift angle from the magnetic field for a low value of electric field (500 V/cm), in argon-isobutane-methylal (67.2%, 30.3%, 2.5%, respectively). The curves represent the predictions of an ap- proximated modelg).
Fig . 37 Measured drift velocity of electrons, in the direction of the motion, as a function of electric field for several values of the magnetic field (perpendicular to the plane of driftIg).
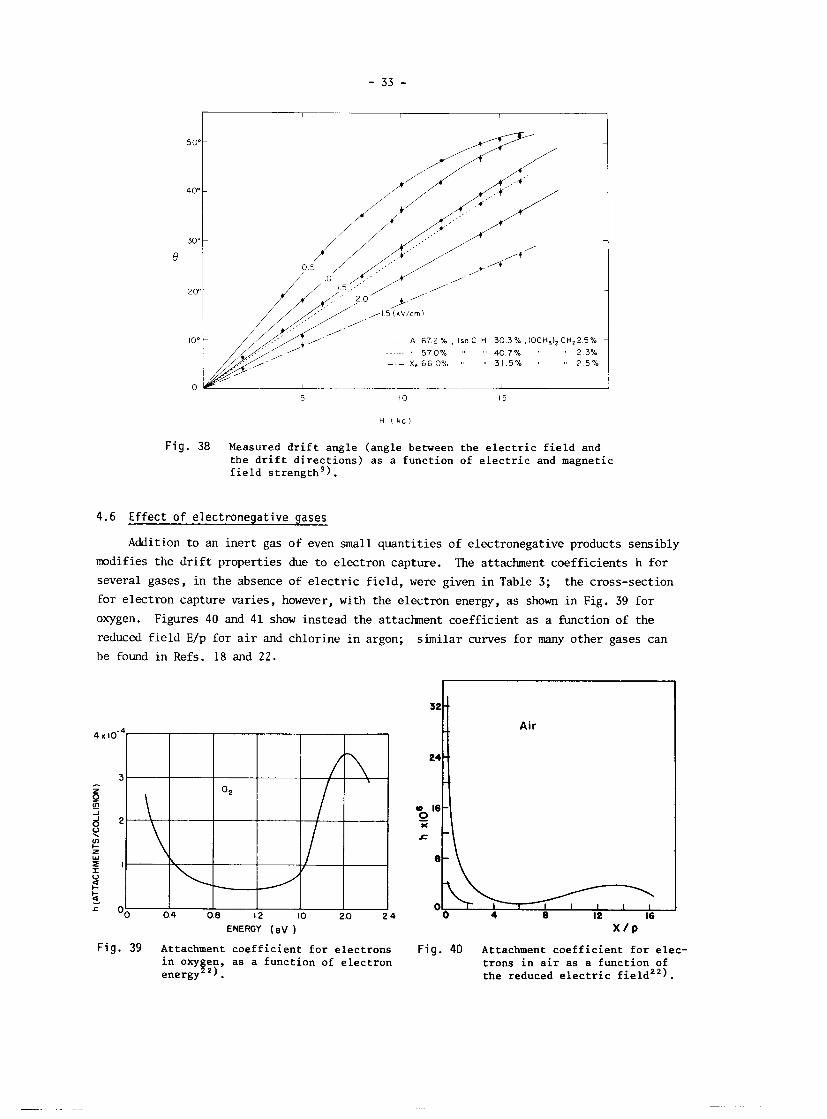
Fig. 38 Measured drift angle (angle between the electric field and the drift directions) as a function of electric and magnetic field strengthg).
4.6 Effect o f electronegative gases
Addition t o an iner t gas of even small quant i t ies of electronegative products sensibly
md i f i e s the d r i f t properties due t o electron capture. The attachment coefficients h f o r
several gases, i n the absence of e l ec t r i c f i e ld , were given i n Table 3; the cross-section
for electron capture varies, however, with the electron energy, as shown i n Fig. 39 fo r
oxygen. Figures 40 and 41 show instead the a t t a c h e n t coefficient as a function of the
reduced f i e l d E/p for a i r and chlorine i n argon;
be found i n Refs. 18 and 2 2 .
ENERGY (gV )
Fig. 39 Attachment coefficient for electrons in oxygen, as a function of electron energy .
similar curves fo r many other gases can
I
Fig. 40 Attachment coefficient for elec- trons in air as a function of the reduced electric fieldz2).

F i g . 41 Attachment coefficient for elec- trons in an argon-chlorine m i x - tu reZ2) .
The presence of electronegative polluants, mostly oxygen and water, i n proportional
counters reduces the detected pulse height because of electron capture. Let p be the
fraction of electronegative polluant i n the gas, X and U the electron mean free path and
instant velocity, respectively, and W the d r i f t velocity. The number of col l is ions per
uni t time of an electron with the electronegative molecules is therefore up/X and the
probability of attachment
,
i t u t where Xc is the mean free path for capture. Subst
and the defini t ion of u , one gets
ing i n Eq. (21) the expression (16)
The loss of electrons i n a swarm dr i f t ing i n constant f ie lds across a distance X is given
by
As an example, l e t us consider the e f fec t of a i r pollution i n pure argon, a t normal condi-
t ions. We sha l l assume that the presence of the pollution does not modify the energy d i s t r i -
bution of electrons in argon. (This is, as we have seen, a rather naive assumption!) From
previous figures one gets , a t E = 500 V/cm: ~k = 6 eV = 1.9 X 10-l2 erg, W = 4 X 10' an/sec,
a(ck) = 5 X 10-l6 cm2, and for a i r h = 2 X 10⁻⁵. From Eq. (21), therefore, pXc = 2.5 X 10-' cm.
A 1% pollution of a i r i n argon, therefore, w i l l remove about 33% of the migrating electrons,
per an of d r i f t , due t o electron capture.
4.7 High e lec t r ic f ie lds : excitation and ionization
Increasing the e l ec t r i c f i e ld above a few kV per cm, more and more electrons can re-
ceive enough energy between two col l is ions t o produce ine las t ic phenomena, excitation of
various kinds, and ionization. Even a simplified description of the energy dependence of
ine las t ic processes would exceed the purpose of these notes; here, we w i l l only summarize
some phenomenological aspects which are relevant for understanding the operation of propor-
t ional counters. A molecule can have many character is t ic modes of excitation, increasing
i n number and complexity for polyatomic molecules. In part icular , noble gases can only be
excited through photon absorption or emission, while weakly-bound polyatomic molecules, fo r
example the hydrocarbons used i n proportional counters as a quencher, have radiationless
transition5 of a rotational and vibrational nature. Addition of an organic vapour t o noble
gases w i l l therefore allow the dissipation of a good fraction of energy i n radiationless
t ransi t ion, and, as w i l l be discussed l a t e r , t h i s i s essent ial fo r high gain and s table
operation of proportional counters.
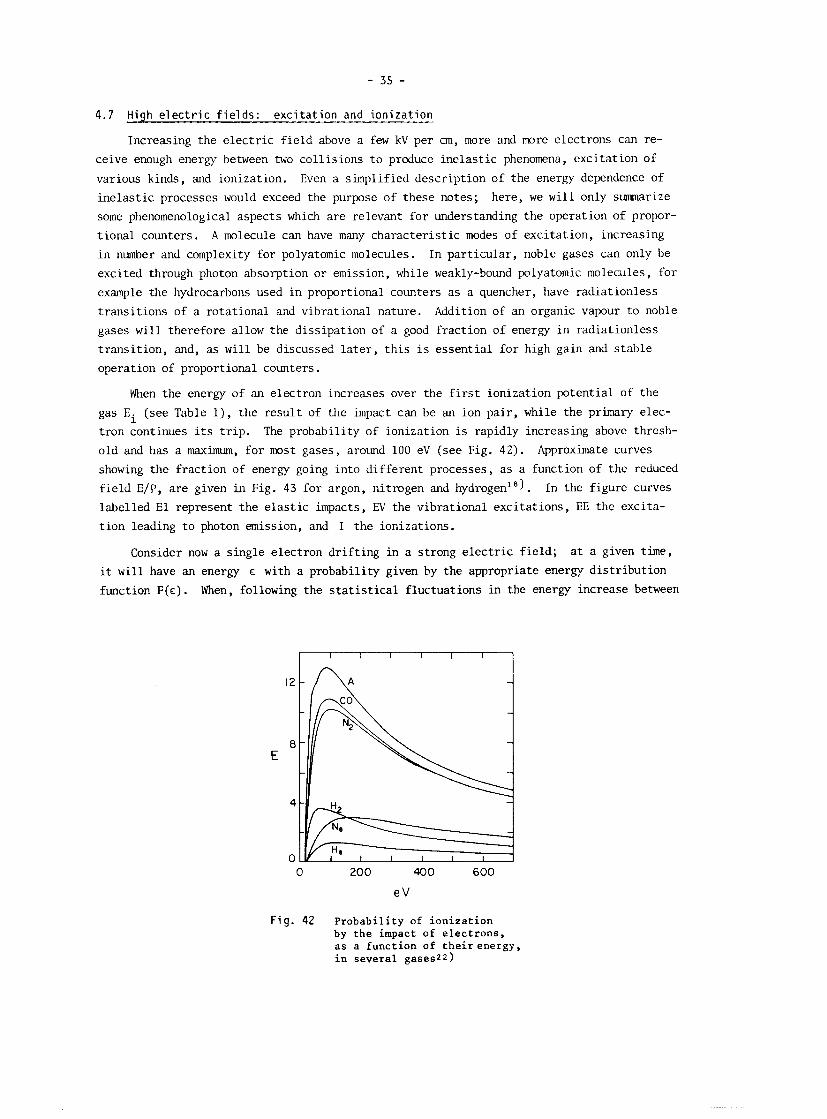
When the energy of an electron increases over the f i r s t ionization potential of the
gas Ei (see Table l ) , the resul t of the impact can be an ion pair , while the primary elec-
tron continues i t s t r i p . The probability of ionization i s rapidly increasing above thresh-
old and has a maximum, for most gases, around 100 eV (see Fig. 4 2 ) . Approximate curves
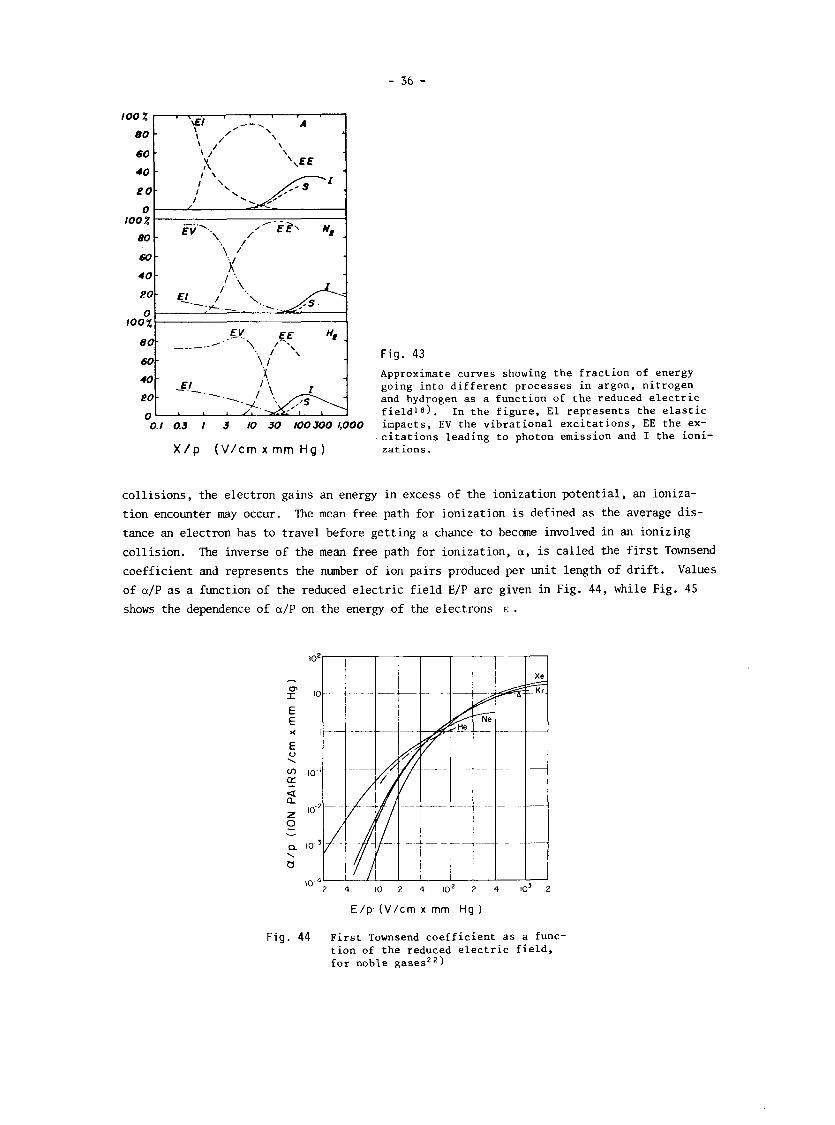
showing the fraction of energy going into different processes, as a function of the reduced
f i e ld E/P, are given i n Fig. 43 for argon, nitrogen and hydrogen1 '1. In the figure curves
labelled E l represent the e l a s t i c impacts, W the vibrational excitations, EE the excita-
t ion leading t o photon emission, and I the ionizations.
Consider now a single electron dr i f t ing in a strong e l ec t r i c f i e ld ; a t a given time,
it w i l l have an energy E with a probability given by the appropriate energy dis t r ibut ion
function F ( € ) . When, following the s t a t i s t i c a l fluctuations in the energy increase between
F i g . 42 Probability of ionization by the impact of electrons, as a function of theirenergy, in several gases*2)
l00 X
80
60
40
collisions, the electron gains an energy in excess of the ionization potential, an ioniza- tion encounter may occur. The mean free path for ionization is defined as the average dis-
tance an electron has to travel before getting a chance to become involved in an ionizing
collision. The inverse of the mean free path for ionization, a, is called the first Townsend
coefficient and represents the number of ion pairs produced per unit length of drift. Values
of a/P as a function of the reduced electric field E/P are given in Fig. 44, while Fig. 45 shows the dependence of a/P on the energy of the electrons E .
--. ' 'F' ' , A - ' /' ' / \ - \ 1 X 'i l\
\,EE - I \
100 %
80-
60
40
PO
0
F ig . 44 First Townsend coefficient as a func- tion of the reduced electric field, for noble gases22)
,' '\ I
P O - \ I
0
0.1 0 3 I 3 10 30 100500 1,000 impacts, EV the vibrational excitations, EE the ex- citations leading to photon emission and I the ioni-
X / p ( V / c r n X mm HQ) zat ions.
E V , - - . E € W---- - H - \., p,,
- ! I F ig . 43
- Approximate curves showing the fraction of energy -E!-. going into different processes in argon, nitrogen
- -. and hydrogen as a function of the reduced electric fieldl8). In the figure, El represents the elastic
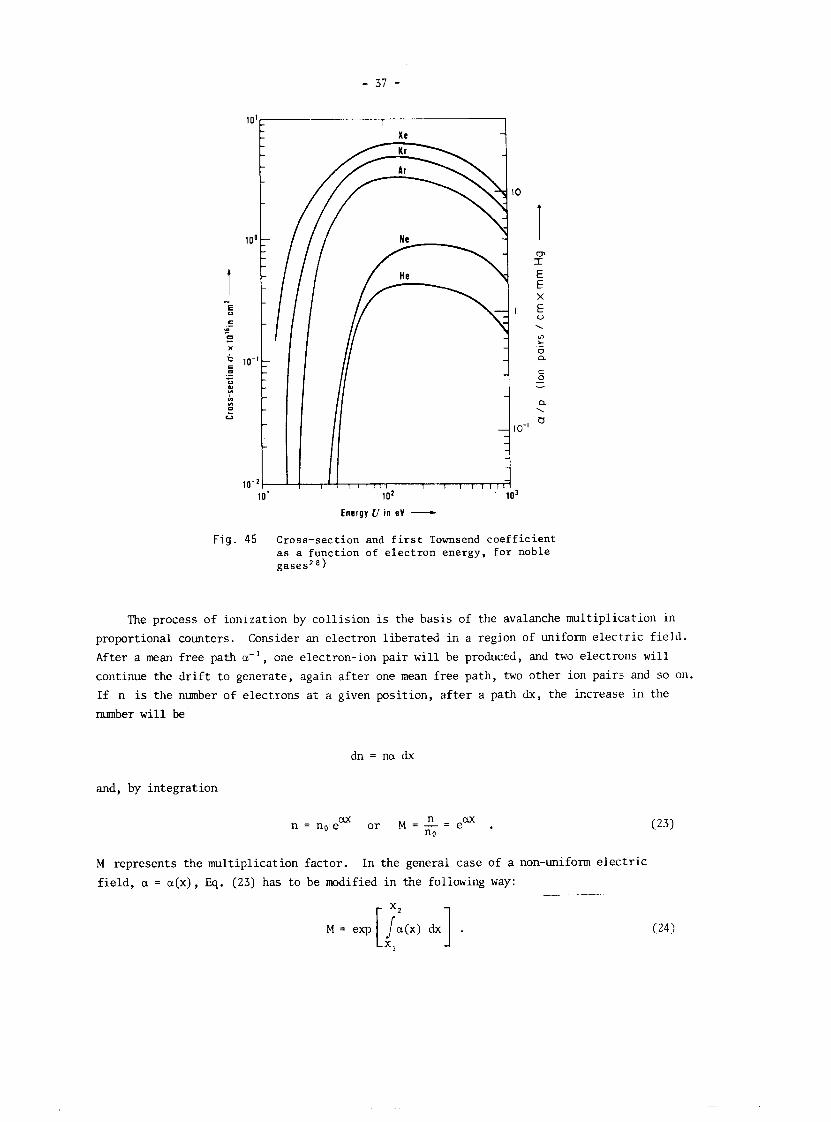
Energy U in eV - F i g . 45 Cross-section and first Townsend coefficient
as a function of electron energy, for noble gases28)
The process of ionization by collision is the basis of the avalanche multiplication in
proportional counters. Consider an electron liberated in a region of uniform electric field.
After a mean free path a-', one electron-ion pair will be produced, and two electrons will
continue the drift to generate, again after one mean free path, two other ion pairs and so on.
If n is the number of electrons at a given position, after a path dx, the increase in the number will be
and, by integration
M represents the multiplication factor. In the general case of a non-uniform electric
field, a = a(x) , E q . (23) has to be modified in the foliowing way:

F i g . 46 Drop-like shape of an avalanche, showing t h e posi- t i v e ions l e f t behind t h e f a s t e l e c t r o n f r o n t . The photograph shows t h e a c t u a l avalanche shape, a s made v i s i b l e i n a cloud chamber by d r o p l e t s condensing around ions l ' ) .
If one remembers now the big difference i n the d r i f t velocity of ions and electrons -- about a factor of thousand -- and the diffusion of migrating charges i n the gas, the follow-
ing picture of an avalanche multiplication appears (see Fig. 46): a t a given instant , a l l
electrons a re s i tuated i n the front of a drop-like dis t r ibut ion of charges, with a t a i l of
positive ions behind, decreasing in number and l a t e r a l extension; half of the t o t a l ions
are contained i n the front par t , since they have just been produced i n the l a s t mean free
path. Knowing the dependence of the Townsend coefficient on the e l ec t r i c f ie ld , one can
compute the multiplication factor for any f i e ld geometry. Many approximated analytic ex-
pressions exis t for a , valid i n different regions of E ; for a sunnnary see Ref. 25. We
w i l l mention here a simple approximation, due t o ~ o r f f ~ ' ) and valid fo r low values of a
a p = Ae -BP/E 9
where A and B are constants as given i n Table 5 . In the same region one can assume the
coefficient t o be l inearly dependent on the energy of the electrons
N being the number of molecules per unit volume; the values of k are given i n Table 5 . The l imits of the approximation can readily be estimated by inspection of Figs. 44 and 45.
Knowing the dependence of a on the e l ec t r i c f ie ld , the multiplication factor can be com-
puted for any f i e ld configuration; an example w i l l be given i n Section 5.1. No simple
rules can be given for the behaviour of the f i r s t Townsend coefficient i n gas mixtures. A s
a general trend, addition t o a noble gas of a polyatomic gas o r vapour increases the value
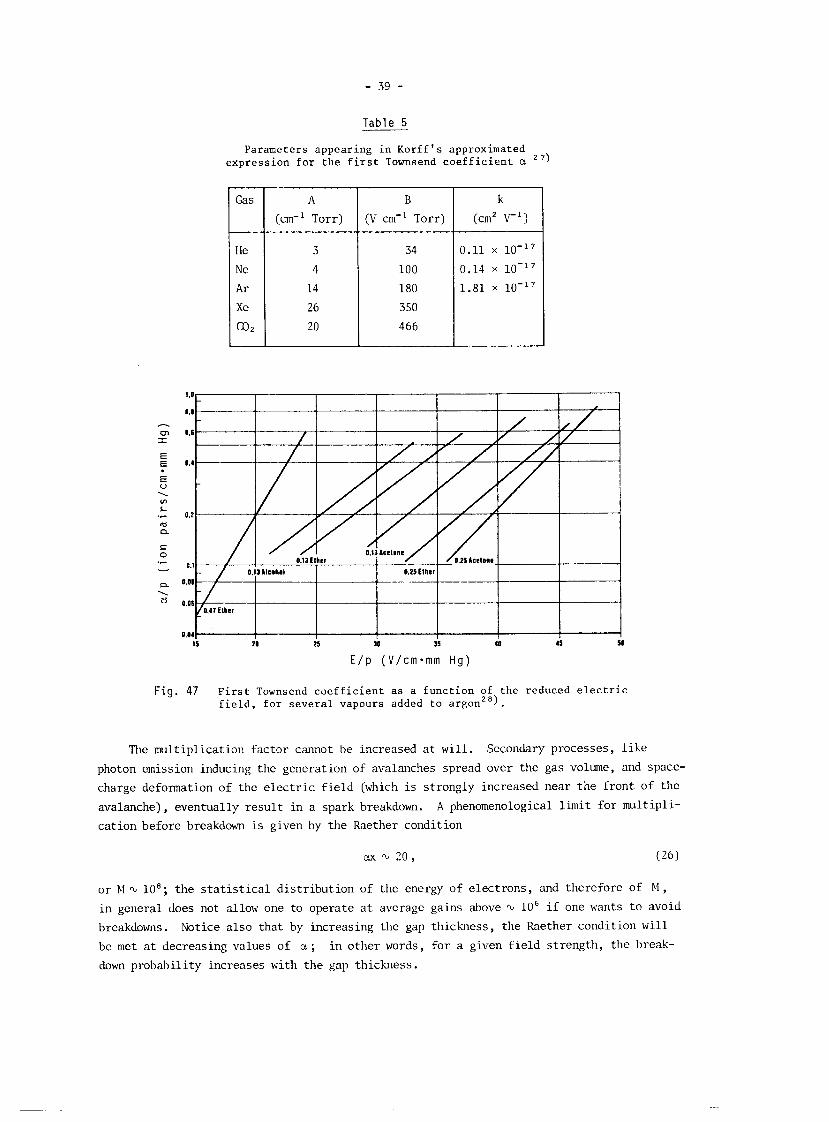
of the f i e ld necessary t o obtain a given value of a ; Figure 47 shows the effect of adding
several vapours t o argonz8). An exponential approximation i s s t i l l possible, a t l eas t for
small values of a .
Tab le 5
Parameters appearing in Korff's approximated expression for the first Townsend coefficient a 27)
F i g . 47 First Townsend coefficient as a function of the reduced electric field, for several vapours added to argon2 .
Gas
The multiplication factor cannot be increased a t w i l l . Secondary processes, l i ke
photon emission inducing the generation of avalanches spread over the gas volume, and space-
charge deformation of the e l ec t r i c f i e l d (which i s strongly increased near the front of the
avalanche), eventually resu l t in a spark breakdown. A phenomenological limit for multipli-
cation before breakdown i s given by the Raether condition
o r bl % 10'; the s t a t i s t i c a l dis t r ibut ion of the energy of electrons, and therefore of M ,
i n general does not allow one to operate a t average gains above % 106 i f one wants t o avoid
breakdowns. Notice also that by increasing the gap thickness, the Raether condition w i l l
be met a t decreasing values of a ; i n other words, for a given f i e ld strength, the break-
down probability increases with the gap thickness.
A
(cm-' Torr)
B
(V cm-' Torr)
k
(cm2 V-')
5. PROPORTIONAL COUNTERS
5.1 Bas ic ope ra t i on
Consider a thin layer of gas, fo r example 1 cm of argon a t normal conditions, between
two f l a t electrodes. A minimum ionizing par t ic le w i l l release (see Section 2.7) about
120 ion pairs ; i f t h i s charge is collected a t one electrode, the detected signal w i l l be
which, for n = 120 and a typical system capacitance C = 10 pF, gives V % 2 uV; t h i s i s so
f a r below any possibi l i ty of detection. I f , however, a strong e l ec t r i c f i e ld i s applied
between the electrodes, avalanche multiplication can occur, boosting the signal amplitude
by several orders of magnitude. This kind of para l le l plane detector suffers , however,
from severe limitations. The detected signal, t o s t a r t with, depends on the avalanche
length, i . e . on the point where the original charge has been produced: no proportionality
can be obtained between the energy d e p s i t and the detected signal. Also, because of the
uniform value of a over the thickness, the Raether condition (26) i s readily met for some
electrons i n the energy distribution: only moderate gains can be obtained before breakdown,
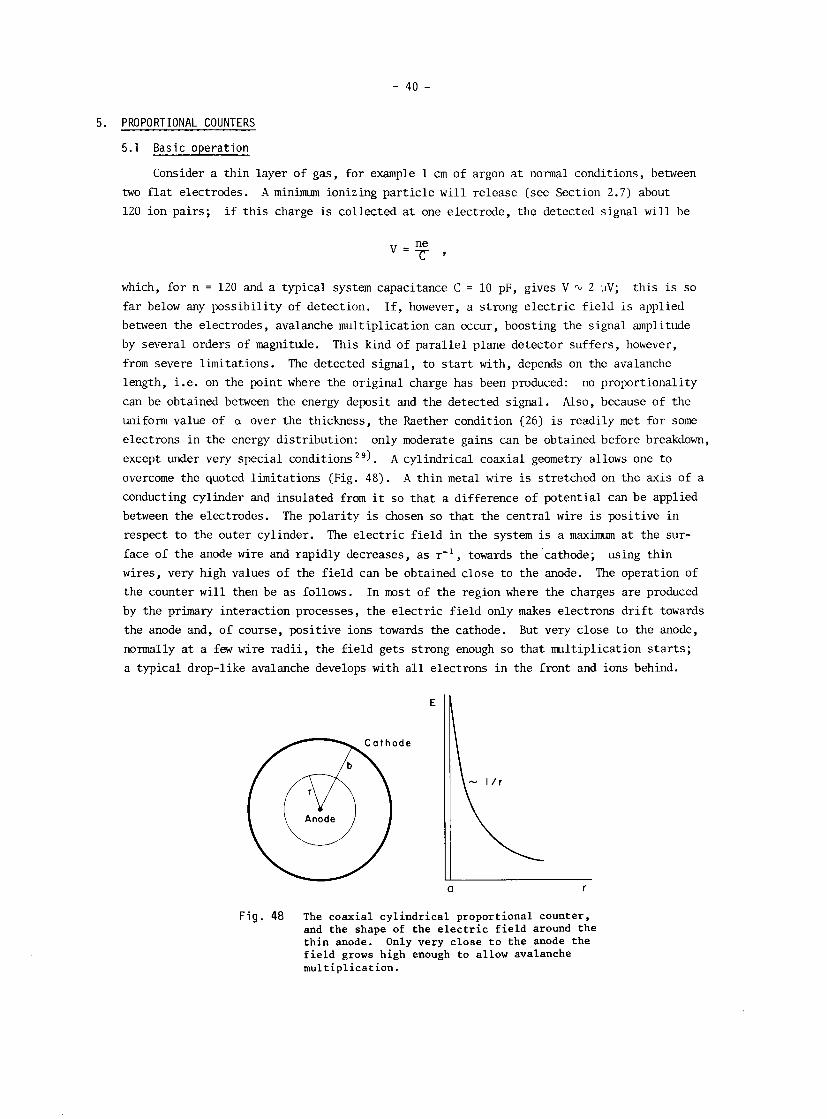
except under very special conditions 29). A cylindrical coaxial geometry allows one t o
overcome the quoted limitations (Fig. 48). A th in metal wire i s stretched on the axis of a
conducting cylinder and insulated from it so tha t a difference of potential can be applied
between the electrodes. The polar i ty is chosen so tha t the central wire is positive i n
respect t o the outer cylinder. The e l ec t r i c f i e ld i n the system is a maximum a t the sur-
face of the anode wire and rapidly decreases, as r-l, towards the'cathode; using thin
wires, very high values of the f i e ld can be obtained close t o the anode. The operation of
the counter w i l l then be as follows. In most of the region where the charges are produced
by the primary interaction processes, the e l ec t r i c f i e ld only makes electrons d r i f t towards
the anode and, of course, positive ions towards the cathode. But very close t o the anode,
normally a t a few wire r ad i i , the f i e ld gets strong enough so that multiplication s t a r t s ;
a typical drop-like avalanche develops with a l l electrons i n the front and ions behind.
F i g . 48 The coaxial cylindrical proportional counter, and the shape of the e l e c t r i c f i e l d around the thin anode. Only very c lose t o the anode the f i e l d grows high enough to allow avalanche multiplication.
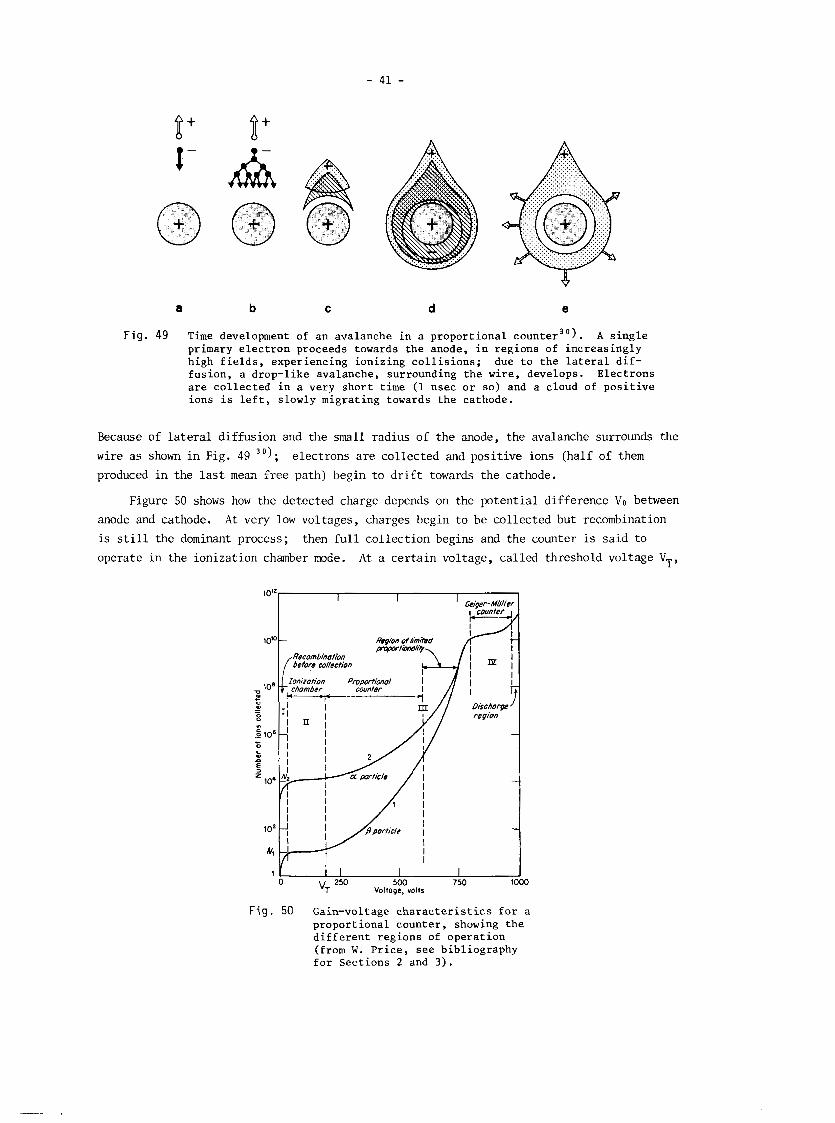
F i g . 49 Time development of an avalanche in a proportional counter30). A single primary electron proceeds towards the anode, in regions of increasingly high fields, experiencing ionizing collisions; due to the lateral dif- fusion, a drop-like avalanche, surrounding the wire, develops. Electrons are collected in a very short time (1 nsec or so) and a cloud of positive ions is left, slowly migrating towards the cathode.
Because of l a t e r a l diffusion and the small radius of the anode, the avalanche surrounds the
wire as shown i n Fig. 49 30); electrons are collected and positive ions (half of them
produced i n the l a s t mean free path) begin t o d r i f t towards the cathode.
Figure 50 shows how the detected charge depends on the potential difference V0 between
anode and cathode. A t very low voltages, charges begin t o be collected but recombination
i s s t i l l the dominant process; then f u l l collection begins and the counter i s said t o
operate i n the ionization chamber mode. A t a cer tain voltage, called threshold voltage VT,
F i g . 50 Gain-voltage characteristics for a proportional counter, showing the different regions of operation (from W. Price, see bibliography for Sections 2 and 3).

the e lec t r ic f i e ld close to the surface of the anode i s large enough t o begin the process
of multiplication. Increasing V, above VT, gains i n excess of 104 can be obtained, st i l l
having the detected charge proportional, through a multiplication factor M , t o the original
deposited charge. A t even higher voltages, however, t h i s proportionality i s gradually l o s t ,
as a consequence of the e l ec t r i c f i e ld dis tor t ions due t o the large space charge bu i l t around
the anode. This region of limited proportionality eventually ends i n a region of saturated
gain, where the same signal i s detected independently of the or iginal ionizing event. Pro-
ceeding even fur ther , the photon emission process outlined i n Section 4.7 begins t o propagate
avalanches i n the counter, and the f u l l length of the anode wire is surrounded by a sheath
of electrons and ions: t h i s i s the typical Geiger-Riller operation.
In the development of multiwire proportional chambers, i n order t o reduce the cost and
complexity of the electronics, very often one tends t o work a t the highest possible gains,
without entering into the Geiger-Miller region which would introduce prohibitive dead-times
for the counter (see l a t e r ) , i . e . e i ther i n the semiproportional o r in the saturated mode.
The maximum amplification i s limited, of course, by discharge or spark breakdown; the maxi-
mum gain tha t can be obtained before breakdown depends on the gas used (see l a t e r ) .
Let a and b then be the rad i i of anode and cathode; a t a distance r from the centre,
the e l ec t r i c f i e ld and potential can be wri t ten as
2mo In , where C = m , V(r) = - 2ne0 a
V, = V(b) i s the over-all potential difference and V(a) = 0; C i s the capacitance per uni t
length of the system and E, i s the d ie lec t r ic constant (for gases E , = 8.85 pF/m) . Following 2 7 , 3 1 )
Rose and Korff we w i l l compute the multiplication factor of a proportional counter,
within the l imits of the approximation (25). If l / a i s the mean free path for ionization,
the average energy E obtained by an electron from the e l ec t r i c f i e ld between col l is ions is
E/a; using the expl ic i t value of E and expression (25) one gets
and therefore
The multiplication factor can then be obtained from the defini t ion (24). To f i x the l imi t s
of integration, we w i l l assume that avalanche multiplication begins a t a distance rc from
the centre, where the e l ec t r i c f i e ld exceeds a c r i t i c a l value Ec:
Recalling the definition of threshold voltage VT, one can write
Substituting Eq. (28) in Eq. (B), integrating and using Eq. (30) one gets to the two
alternative expressions:
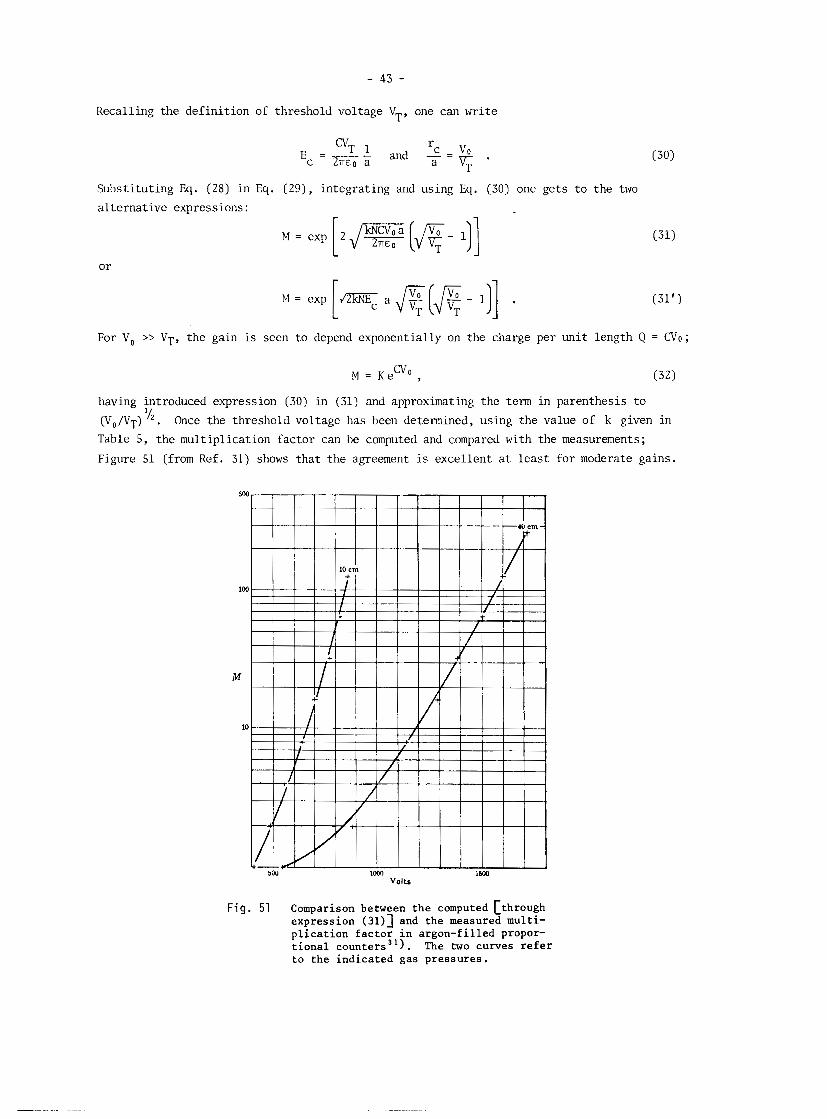
For V, >> VT, the gain is seen to depend exponentially on the charge per unit length Q = CVo;
having introduced expression (30) in (31) and approximating the term in parenthesis to
(Vo/VT) l". Once the threshold voltage has been determined, using the value of k given in
Table 5, the multiplication factor can be computed and compared with the measurements;
Figure 51 (from Ref. 31) shows that the agreement is excellent at least for moderate gains.
Fig . 51 Comparison between the computed [through expression (3111 and the measured multi- plication factor in argon-filled propor- tional counters3'). The two curves refer to the indicated gas pressures.
For higher values above 104 , the approximation used for a i s not jus t i f ied ; in Ref. 25
a s m a r y of calculations by different authors is given. For a qual i ta t ive understanding of
the proportional counters' operation, however, e i ther expressions (31), (31') or (32) are
quite suff ic ient .
5.2 Time development of the signal
We can now analysc i n de ta i l the time development of the avalanche and of the detected
signal. A s shown i n Fig. 49, the whole process begins a t a few wire r ad i i , i .e . typically
a t less than 50 pm from the anode surface. Taking a typical value of 5 an/vsec fo r the
d r i f t velocity of electrons i n t h i s region, it appears that the whole process of multipli-
cation w i l l take place i n less than 1 nsec: a t that instant , electrons have been collec-
ted on the anode and the positive ion sheath w i l l d r i f t towards the cathode a t decreasing
velocity. The detected signal, negative on the anode and positive on the cathode, is the
consequence of the change i n energy of the system due t o the movement of charges. Simple
e lec t ros ta t ic considerations show that i f a charge Q i s moved by dr , i n a system of t o t a l
capacitance RC ( R is the length of the counter), the induced signal i s
Electrons i n the avalanche are produced very close t o the anode (half of them i n the l a s t
mean free path); therefore the i r contribution t o the t o t a l signal w i l l be very small:
positive ions, instead, d r i f t across the counter and generate most of the signal. Assuming
that a l l charges are produced a t a distance A from the wire, the electron and ion contri-
butions to the signal on the anode w i l l be, respectively,
and
The t o t a l maximum signal induced on the anode is seen to be
and the r a t i o of the two contributions i s
- I T = In ( a + A ) - l n a
v + In b - In (a + h )
Typical values for a counter are a = 10 m, A = l um, and b = 10 mm; substituting i n the
previous expression one finds that the electron contribution t o the signal i s about 1% of
the t o t a l . I t is therefore, i n general, neglected for a l l pract ical purposes. The time
development of the signal can easi ly be computed assuming that ions leaving the surface of

the wire with constant mobility are the only contribution. In t h i s case, integration of
formula (33) gives for the signal induced on the anode
From the defini t ion of mobility, Eq. (11) , it follows that
and therefore
Substituting i n Eq. (34) one gets
The t o t a l d r i f t time of the ions, T, i s obtained from the condition r(T) = b, and i s
T = moP(b2 - a2) (36) u+mo
and it is easi ly seen tha t v(T) = -Q/RC as it should be. As an example, l e t us consider an
argon-filled counter under normal conditions, and with a = 10 m, b = 8 mm; it follows from
Eqs. (27) that C = 8 pF/m. From Table 2 , v+ = 1.7 cm2 sec-' V-' atm-' ; for a typical opera-
t ional voltage V, = 3 kV, one gets T = 550 vsec. The time growth of the signal is very f a s t
a t the beginning, as shown in Fig. 52; from Eq. (35) one can see that
I-" ' t '
Fig. 52 Time development of the pulse in a proportional counter; T is the total drift time of positive ions from anode to cathode. The pulse shape obtained with several differ- entiation time constants is also shown.
hence half of the signal i s developed a f t e r one thousandth of the t o t a l time, about 700 nsec
in the example. I t i s therefore normal practice t o terminate the counter with a res i s tor R ,
such that the signal i s different iated with a time constant T = RC; very short pulses can be
obtained using low impedance terminations, with the aim of increasing the r a t e capability of
the counter (see below). The figure shows some examples of pulse shape obtained by differen-
t ia t ion. A t the l imit fo r R + 0, one speaks rather of a current signal than a voltage; t h i s
is given by
The current i s maximum for t = 0:
Substituting the numerical values of the previous example, and assuming Q = 106e, (where e
i s the electron charge) one gets h, = 13 uA, which i s a typical value for the operation of
multiwire proportional chambers.
5.3 Choice o f the gas f i l l i n g
Since avalanche multiplication occurs i n a l l gases, v i r tua l ly any gas or gas mixture
can be used i n a proportional counter. In most cases, however, the specif ic experimental
requirements r e s t r i c t the choice t o several families of compounds; low working voltage,
high gain operation, good proportionality, high r a t e capabi l i t ies , long lifetime, f a s t re-
covery, e tc . , a re examples of sometimes conflicting requirements. In what follows, we w i l l
br ief ly outline the main properties of different gases i n the behaviour of the proportional
counter; a more detailed discussion can be found i n the bibliography for t h i s section ( i n
part icular i n the book by Korff).
Comparison of Figs. 44 and 4 7 shows tha t avalanche multiplication occurs i n noble
gases a t much lower f ie lds than i n complex molecules: t h i s is a consequence of the many
non-ionizing energy dissipation modes available i n polyatomic molecules. Therefore, con-
venience of operation suggests the use of a noble gas as the main component; addition of
other components, for the reasons t o be discussed below, w i l l of course s l igh t ly increase
the threshold voltage. The choice within the family of noble gases i s then dictated, a t
l eas t fo r the detection of minimum ionizing part ic les , by a high specif ic ionization; with
reference t o Table l, and disregarding for economic reasons the expensive xenon or krypton,
the choice f a l l s naturally on argon. An argon-operated counter, however, does not allow
gains i n excess of 103-104 without entering into a permanent discharge operation; t h i s is
for the following reasons. During the avalanche process, excited and ionized atoms are
formed. The excited noble gases can return t o the ground s t a t e only through a radiative
process, and the minimum energy of the emitted photon (11.6 eV for argon) i s well above the
ionization potential of any metal constituting the cathode (7.7 eV for copper). Photo-
electrons can therefore be extracted from the cathode, and i n i t i a t e a new avalanche very
soon a f t e r the primary.
Argon ions, on the other hand, migrate t o the cathode and are there neutralized
extracting an electron; the balance of energy i s e i ther radiated as a photon, o r by secon-
dary emission, i . e . extraction of another electron from the metal surface. Both processes
resul t i n a delayed spurious avalanche: even for moderate gains, the probability of the
processes discussed is high enough t o induce a permanent regime of discharge.
Polyatomic molecules have a very different behaviour, especially when they contain
more than four atoms. The large amount of non-radiative excited s ta tes (rotational and
vibrational) allows the absorption of photons in a wide energy range: for methane, for
example, absorption is very e f f ic ien t i n the range 7.9 t o 14.5 eV, which covers the range
of energy of photons emitted by argon. This is a common property of most organic compounds
i n the hydrocarbon and alcohol families, and of several inorganic compounds l ike freons,
CO2, BF, and others. The molecules diss ipate the excess energy e i ther by e l a s t i c co l l i -
sions, or by dissociation into simpler radicals. The same behaviour is observed when a
polyatomic ionized molecule neutralizes a t the cathode: secondary emission is very unlikely.
In the neutralization, radicals recombine e i ther into simpler molecules (dissociation) or
forming larger complexes (polymerization). Even small amounts of a polyatomic quencher
added t o a noble gas changes completely the operation of a counter, because of the lower
ionization potential that resu l t s i n a very e f f ic ien t ion exchange (see Section 4.2). Good
photon absorption and suppression of the secondary emission allows gains i n excess of 106
t o be obtained before discharge.
The quenching efficiency of a polyatomic gas increases with the number of atoms i n the
molecule; isobutane (C4Hlo) is very often used for high-gain s table operation. Secondary
emission has been observed, although with low probability, fo r simpler molecules l i ke carbon
dioxide, which may therefore occasionally produce discharge.
Addition of small quantities of electronegative gases, l i ke freons (CF3Br i n particular)
o r ethyl bromide (C2H5Br) allows one t o obtain the highest possible gains before Geiger-
M l l e r discharge, i . e . saturated operation (see Section 5.1). Apart from the i r additional
photon-quenching capability, the electronegative gases capture free electrons forming ne-
gative ions tha t cannot induce avalanches (a t l eas t i n the f i e ld values normally met i n a
proportional counter). If the mean free path for electron capture is shorter than the
distance from anode t o cathode, electrons liberated a t the cathode by any of the described
processes w i l l have very l i t t l e probability of reaching the anode, and gains around 107 can
be safely obtained before discharge o r breakdown. To preserve detection efficiency, how-
ever, only limited amounts of electronegative gases can be used. Unfortunately, the use of
polyatomic organic gases can have a dramatic consequence on the lifetime of counters, when
high fluxes of radiation are detected. To s t a r t with, the dissociation process, which is
a t the basis of the quenching action, quickly consmes the available molecules i n a sealed
counter. For a gain of 106 and assuming there are 100 ion pairs detected i n each event,
about 108 molecules are dissociated i n each event. In a typical 10 cm3 counter operated a t
atmospheric pressure i n a 90-10 mixture of noble gas and quencher, there are about 10"
polyatomic molecules available and therefore a sealed counter is expected t o change i t s
operational character is t ics substantially a f t e r about 101•‹ counts. As we w i l l see l a t e r ,
multiwire proportional chambers are normally operated i n an open flow of gas, essent ial ly
because the necessity for large surfaces of detection with th in gas windows does not allow
ef f ic ien t sealing, and therefore gas consumption i s not a problem. However, we have seen
tha t some products of molecular recombination are l iquid or solid polymers. These products
w i l l deposit on cathodes and anodes, depending on the i r a f f i n i t y , and substant ial ly modify
the operation of the counter a f t e r integral fluxes of radiation around 10'-10' counts per
cm2. The following process takes place (Malter effect) 3 2 ) . When a thin layer of insulator
develops on the cathode, as a resu l t of the deposit of polymers, positive ions created i n
further avalanches deposit on the outer s ide of the layer and only slowly leak through the
insulator t o be neutralized on the cathode. When the detected radiation f lux grows above
a threshold value (10' o r 103 counts per second per cm2) the production ra te of the ions
exceeds the leakage r a t e and very quickly a high density of charge develops across the thin
layer. The dipole e l ec t r i c f i e ld can be so high as t o extract electrons from the cathode
and through the insulator: a r6gime of permanent discharge i s therefore induced, even i f
the original source of radiation i s removed. Temporary suppression of the counter voltage
stops the discharge; the counter, however, remains damaged and an expsure t o lower and
lower radiation fluxes w i l l s t a r t the process again. Only complete cleaning can regenerate
a damaged counter.
Flows of 10' counts per cm2 are very quickly met i n high-energy beams having typical
intensi t ies of 106/sec an2. Use of non-polymerizing quenchers, l i ke alcohols, aldehydes,
and acetates, was soon recognized t o strongly suppress the ageing e f fec t ; however, t he i r
low vapour pressure as compared with hydrocarbons does not allow one t o obtain an e f f ic ien t
quenching against photoionization and secondary emission (for example, isopropylic alcohol
has a vapour pressure, a t 20•‹, of 30 Torr). A solution t o the dilennna has been found by
taking advantage of the ion exchange mechanism already mentioned several times. I f a non-
polymerizing agent i s chosen having its ionization potential lower than those of the other
constituents of the gas mixture, addition of even a small quantity of the new quencher w i l l
modify the nature of the ions neutralized a t the cathode into a non-polymerizing species.
Propylic alcohol [ C ~ H ~ O H ] and methylal [(oCH~)~CH~] are often used, having ionization po-
t e n t i a l ~ of 10.1 and 10.0 eV, respectively. Integrated ra tes i n excess of 10" counts per
an2 have been measured, without a l te ra t ion of the counter p o p e r t i e s 3 3, . Use of a single inorganic quenching gas, l ike carbon dioxide, would of course avoid
the ageing effect ; the quoted ins tab i l i ty of operation a t high gains of argon-carbon
dioxide counters, however, l imits t he i r use. Incidentally, radiation damage of carbon
dioxide counters has been reported, probably as a resul t of a small amount of polluting
agents i n the gas3" 3 Use of gas mixtures of three or four components may appear t o be
a nuisance, but i n practice the advantages of having a high gain, s table operation i n a
large ml t iw i r e proportional chamber complex widely counteract the mixing problems.
5.4 Space-charge g a i n l i m i t a t i o n
The growth i n the avalanche process of a positive ion sheath around the wire has as a
consequence the local reduction of the e l ec t r i c f ie ld ; the normal f i e l d i s completely
restored only when a l l ions have been neutralized a t the cathode (i .e. a f te r several
hundred psec). When the counter i s operated in the proportional or semiproportional mode,
the extension of the avalanche along the wire i s very small, between 0.1 and 0.5 m, and
therefore the f i e ld modification is confined t o a small region of the counter. In Geiger-
Miller operation, on the other hand, the avalanches spread a l l along the wire and the f i e ld
i n the whole counter i s distorted: for several hundred Usec no further detection is
possible.
When a counter is operated i n a proportional mode, the effect of a uniformly d i s t r i -
buted flow of radiation i s t o reduce the average gain. Figures 53 and 54 show the

F i g . 53 Rate dependence of t h e peak cu r r en t on 5.9 keV X-rays i n a d r i f t p ropor t iona l chamber, f o r s eve ra l anodic p o t e n t i a l s g )
H V , = - 3 5 0 0 V
0 10. 2-10' 3-10'
R A T E / m m . s e c
F i g . 54 Rate dependence of t he peak cu r r en t f o r minimum ion i z ing p a r t i c l e s , i n a d r i f t chamber. The dashed curves show t h e equal i ne f f i c i ency i n t e r c e p t , f o r a f i xed d e t e c t i o n threshold (5 VA) 9 ) .
pulse-height reduction due to space charge, as measured in a drift chamber for "Fe 5.9 keV
X-rays and for minimum ionizing particlesg). The incident fluxes are given in counts per second per millimetre of anode wire; the corresponding surface rate can be obtained taking into account the counter geometry. Following the formulation of Hendricks 36), one can com- pute the approximate change in the anodic potential V. due to a flux R of ionizing events, each producing nMe charges in the avalanche,
where T is the total drift time of positive ions, as given by Eq. (36). Introducing
Eq. (37) into the dependence of the multiplication factor on the voltage, one can obtain the corresponding change in the gain. This could be done using expression (31); however, it appears that in the region of gain values we are normally concerned with (106 or more),
the simpler expression for M given by formula (32) can be used; in this case MO = K eCVO and M = MO Substituting this in Eq. (37) one gets
which, for small variations of AV (eAV = 1) gives AV = KMoR and
The exponential decrease in the multiplication factor with the rate is precisely what has
been observed (see Figs. 53 and 54), at least for moderate rates. At higher rates, eAv > 1
and therefore AV < KMoR; then the decrease of the gain with rate is less than exponential
as shown by the data. A practical consequence of a gain decreasing with the rate is, of
course, loss of efficiency when operating at fixed detection thresholds, as is the case in
multiwire proportional chambers. We will come back to this point in Section 6.
6. MULTIWIRE PROPORTIONAL CHAMBERS
6.1 Principles of operation
Proportional counters have been and are widely used whenever measurement of energy loss
of radiation is required. The space localization capability of a counter is, however, limited
to the determination that a particle has or has not traversed the counter's volume. Stacking
of many independent counters is possible, but is not very attractive mechanically. There was
a vague belief that multiwire structures in the same gas volume would not properly work, be-
cause the large capacitance existing between parallel non-screened wires would cause the
signal to spread, by capacitive coupling, in all wires, therefore frustrating any localiza-
tion attempt in the structure. It was the merit of Charpak and collaborators to recognize
that the positive induced signals in all electrodes surrounding the anode interested by an
avalanche largely compensate the negative signals produced by capacitive coupling; these
authors operated in 1967-68 the first effective multiwire proportional chambers1), which com-
prised a set of anode wires closely spaced, all at the same potential, each wire acting as
an independent counter.
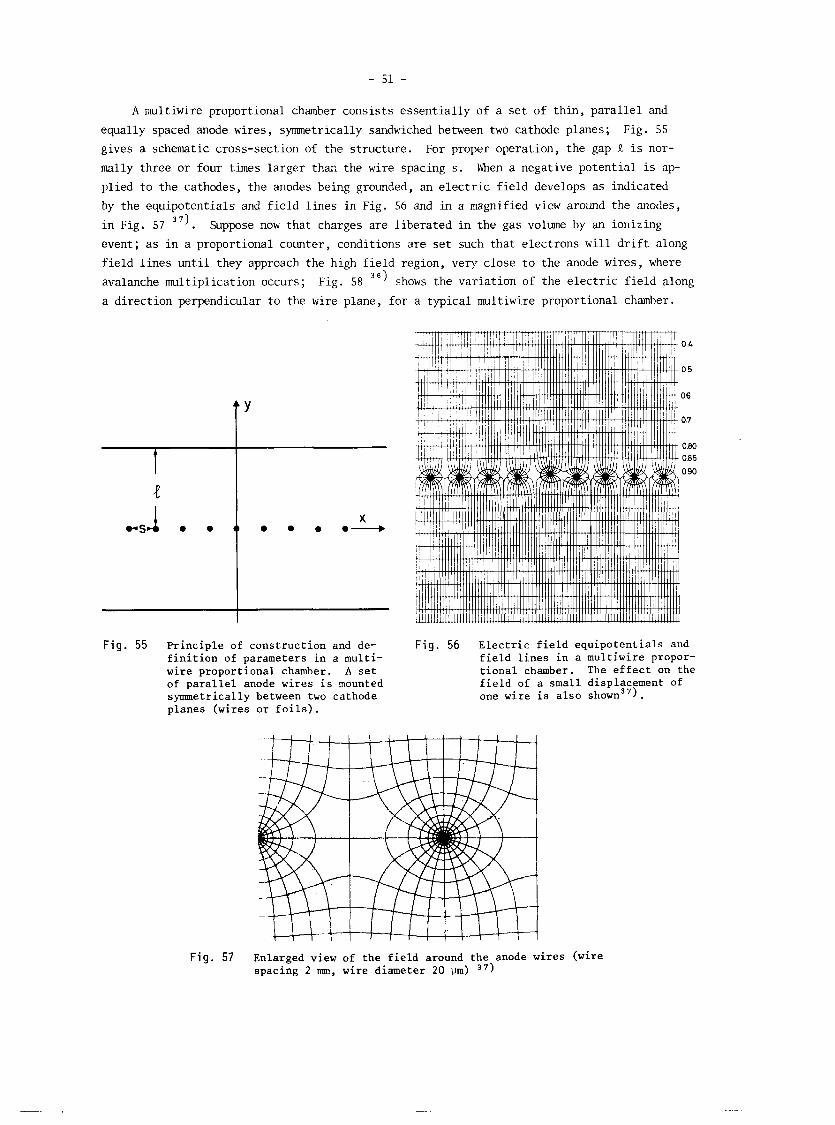
A multiwire proportional chamber consists essentially of a set of thin, parallel and
equally spaced anode wires, symmetrically sandwiched between two cathode planes; Fig. 55
gives a schematic cross-section of the structure. For proper operation, the gap R is nor-
mally three or four times larger than the wire spacing S. When a negative potential is ap-
plied to the cathodes, the anodes being grounded, an electric field develops as indicated
by the equipotentials and field lines in Fig. 56 and in a magnified view around the anodes,
in Fig. 57 37). Suppose now that charges are liberated in the gas volume by an ionizing
event; as in a proportional counter, conditions are set such that electrons will drift along
field lines until they approach the high field region, very close to the anode wires, where
avalanche multiplication occurs; Fig. 58 3 8 ) shows the variation of the electric field along
a direction perpendicular to the wire plane, for a typical multiwire proportional chamber.
F i g . 55 Principle of construction and de- F i g . 56 Electric field equipotentials and finition of parameters in a multi- field lines in a multiwire propor- wire proportional chamber. A set tional chamber. The effect on the of parallel anode wires is mounted field of a small displacement of symnetrically between two cathode one wire is also shown37). planes (wires or foils).
F i g . 57 Enlarged view of the field around the anode wires (wire spacing 2 mm, wire diameter 20 pm) 37)

D r ~ f t reglon ~n D r ~ f t region in va r~ab le f ~ e l d constant f ield
f ~ e l d along X 0x1s
D i s t a n c e f r o m centre o f wire
F i g . 58 Variation of the electric field along the axis per- pendicular to the wire plane and centred on one wire in a multiwire proportional chamber (X), and along the direction parallel to the wire plane (y) 3 8 )
The analytic expression for the e l ec t r i c f i e ld can be obtained by standard e lec t ros ta t ic algorithms, and i s given in many textbooks 39,40) . An approximated expression has been given
by ~ r s k i n e ~ ' ) , who also computed the f i e ld deformations due t o wire displacements.
With the definitions of Fig. 55 and requiring V(a) = V, , V(R) = 0, one gets
and the capacitance per uni t length i s given by
where a i s the anode wire radius. Notice tha t , since a << S, the value given by Eq. (39) i s
always smaller than the capacity of the plane condenser with the same surface (2~ ,s /R) . Com-
puted values of C are given in Table 6 for several typical geometries; in general, one can
see that the capacitance i s quickly decreasing with the wire spacing, while it does not de-
pend very much on the wire diameter. Along the symmetry l ines X = 0 and y = 0, the e l ec t r i c
f ie ld can be written as
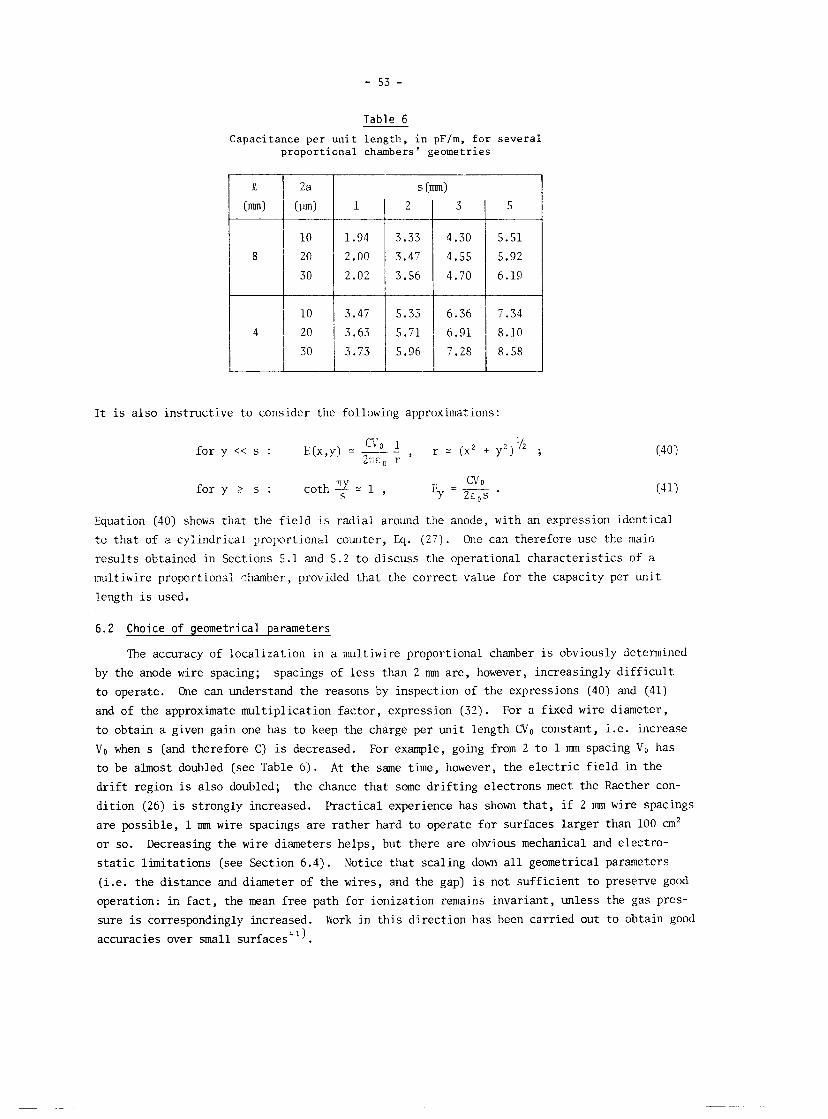
Table 6
Capacitance per u n i t length, i n pF/m, for several proportional chambers' geometries
I t i s a lso instructive t o consider the following approximations:
f o r y 2 S : coth Ly S = 1 ,
Equation (40) shows that the f i e ld is radial around the anode, with an expression identical
t o tha t of a cylindrical proportional counter, Eq. (27). One can therefore use the main
resul ts obtained in Sections 5 . 1 and 5.2 t o discuss the operational character is t ics of a
multiwire proportional chamber, provided that the correct value for the capacity per uni t
length i s used.
6.2 Choice o f geometrical parameters
The accuracy of localization in a multiwire proportional chamber i s obviously determined
by the anode wire spacing; spacings of l ess than 2 mm are , however, increasingly d i f f i cu l t
t o operate. One can understand the reasons by inspection of the expressions (40) and (41)
and of the approximate multiplication factor , expression (32). For a fixed wire diameter,
t o obtain a given gain one has t o keep the charge per uni t length CVo constant, i . e . increase
V D when S (and therefore C) i s decreased. For example, going from 2 t o 1 nun spacing V0 has
t o be almost doubled (see Table 6 ) . A t the same time, however, the e l ec t r i c f i e ld in the
d r i f t region is also doubled; the chance that some dr i f t ing electrons meet the Raether con-
di t ion (26) i s strongly increased. Practical experience has shown tha t , i f 2 mm wire spacings
are possible, 1 mm wire spacings are rather hard t o operate for surfaces larger than 100 an2
or so. Decreasing the wire diameters helps, but there are obvious mechanical and electro-
s t a t i c l imitations (see Section 6.4). Notice tha t scaling down a l l geometrical parameters
( i .e . the distance and diameter of the wires, and the gap) i s not suff ic ient t o preserve good
operation: i n fac t , the mean free path for ionization remains invariant, unless the gas pres-
sure is correspondingly increased. MJork in t h i s direction has been carried out t o obtain good
accuracies over small surfaces l ) .

F i g . 59 Dependence of the multiplication factor on the operational voltage, relative to the thresh- old voltage, in a 2 m spacing multiwire propor- tional chamber with several wire diameters [computed from expression (3l)].
Let us now investigate the influence of the wire diameter, on a given geometry. Figure 59
shows how the gain varies, as a function of the ratio Vo/VT, for an S = 2 mm, R = 8 mm chamber
with several anode radii; the approximate expression (31) has been used, with the correct
value for C as given by formula (39) for each geometry and for argon (k = 1.8 X 10-'l m2 V-').
Clearly, although in principle any wire diameter allows one to obtain any gain, the steeper
slope obtained for large diameters means a much more critical operation. We can represent the
effect of all mechanical and electrical tolerances (see the next section) as a widening of
the lines drawn in the figure into narrow bands; for a given Vo/VT, the multiplication factor
will vary, across the chamber, between two extremes. The steeper the slope of a given band,
the more likely it is that one section of a chamber will begin to discharge when another sec-
tion is not yet properly amplifying. Obviously, however, thick anode wires are easier to
handle than thin ones and a compromise has to be found; diameters around 10 pm are a prac-
tical limit, while that of 20 pm is more frequently used.
6.3 Dependence of the gain on mechanical tolerances
The gain of a chamber at a given operational voltage depends on the detailed shape and value of the electric field in the multiplication region and can therefore change along a
wire or from wire to wire as a consequence of mechanical variations. The maximum tolerable
differences in gain depend, of course, on the specific application: in pulse-height mea-
suring devices, requirements are much more severe than in threshold-operated chambers.
A detailed analysis of the gain variations due to several kinds of mechanical tolerances
can be found in Erskine 7, and ~im?owski'~). Here we would like to give only a qualitative
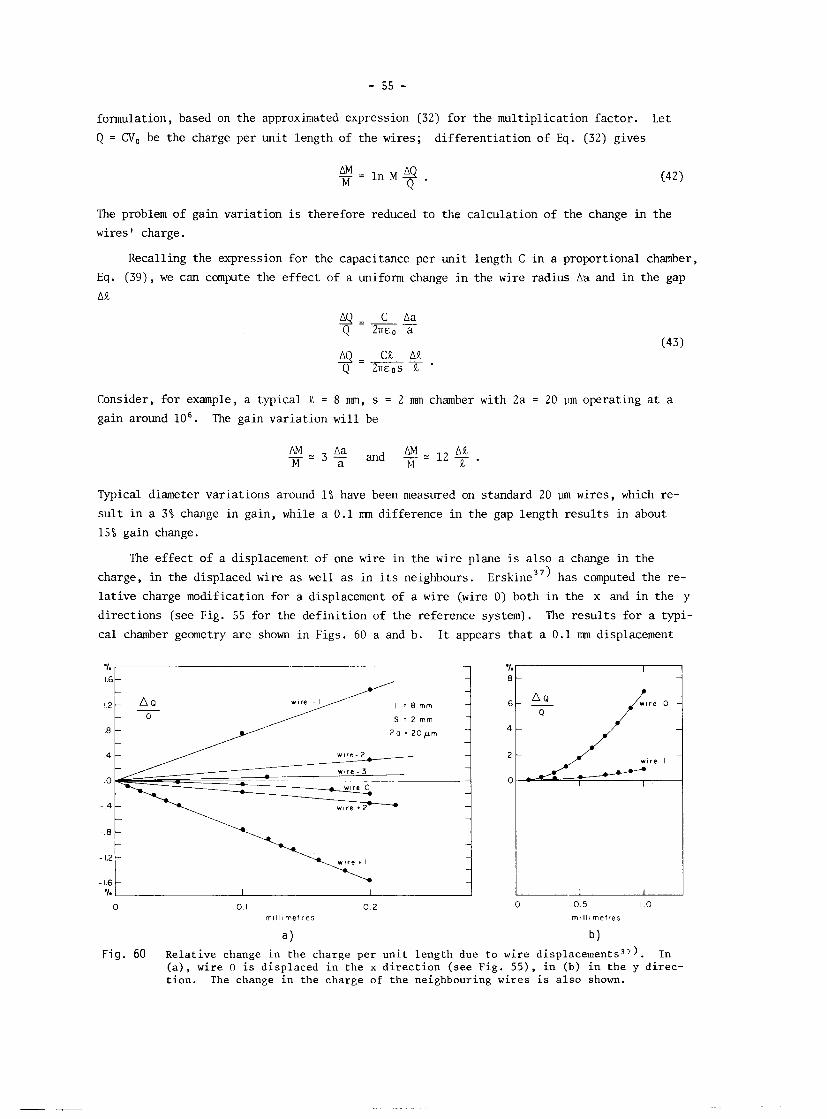
formulation, based on the approximated expression (32) fo r the multiplication factor. Let
Q = CV, be the charge per uni t length of the wires; different iat ion of Eq. (32) gives
The problem of gain variation is therefore reduced t o the calculation of the change in the
wires' charge.
Recalling the expression fo r the capacitance per uni t length C i n a proportional chamber,
Eq. (39), we can compute the effect of a uniform change i n the wire radius Aa and i n the gap AR
Consider, f o r example, a typical R = 8 mm, S = 2 mm chamber with 2a = 20 pm operating a t a
gain around 106. The gain variat ion w i l l be
Typical diameter variations around 1% have been measured on standard 20 pm wires, which re-
s u l t i n a 3% change in gain, while a 0.1 mn difference in the gap length resu l t s in about
15% gain change.
The effect of a displacement of one wire i n the wire plane i s a lso a change in the
charge, in the displaced wire as well as in i t s neighbours. ~ r s k i n e ~ ~ ) has computed the re-
l a t ive charge modification for a displacement of a wire (wire 0) both i n the X and i n the y
directions (see Fig. 55 for the defini t ion of the reference system). The resu l t s for a typi-
cal chamber geometry are shown i n Figs. 60 a and b. I t appears tha t a 0.1 mm displacement
F ig . 60 Relative change in the charge per unit length due to wire di~~lacernents~~). In (a), wire 0 is displaced in the X direction (see Fig. 55), in (b) in the y direc- tion. The change in the charge of the neighbouring wires is also shown.

of a wire in the wire plane results in a 1% change in the charge of the two adjacent wires,
and from Eq. (42) this means, at gains around 106, more than a 10% change! This is obviously
the most critical parameter in chambers' construction, if a good energy resolution is
required.
Expression (42) can also be used to estimate the variation of the multiplication factor
with the operational voltage V,; a 1% change in V, results in an increase of about 15% in M
at gains around 106. Practical experience shows that, with normal mechanical tolerances and
for medium-size chambers, an over-all gain variation around 30-40% can be expected, and this
has to be taken into account when designing the detection electronics.
6.4 E lec t ros t a t i c forces
In a structure like that of a multiwire proportional chamber, the anode wires are not
in a stable equilibrium condition when a difference of potential is applied. In fact, as-
suming that one wire is slightly displaced from the middle plane, it will be attracted more
to the side of the displacement and less to the other, and the movement would continue in-
definitely if there was no restoring force (the mechanical tension on the wires). It has
been observed in large size chambers (1 m or more) that, above a certain value of the opera-
tional voltage, the wires are unstable and the new equilibrium has all wires alternatively
displaced up and down, as shown in Fig. 61. Following ~ r i ~ ~ e ~ ~ ) we can compute the critical
length of a chamber for wire stability. Assuming a radial field as given by Eq. (40), not
modified by the small displacement 6, the force between two equal linear charges CV, at a
distance r, per unit length, is
and, from Fig. 61 and approximating the tangents to the arcs, the total force on a given wire,
per unit length, in the direction normal to the wire plane, is
F i g . 61 Electrostatic instability in multi- wire proportional chambers. The wires are shown alternatively dis- placed by a quantity 6 from the central plane.

If T is now the mechanical tension of the wire, tne restoring force, in the direction per-
pendicular to the wire plane and per unit length, is
where S = &(X) is the displacement of the wire along its length, with the conditions
6(0) = &(L) = 0 if L is the total wire length. For equilibrium, therefore, one must have
R = -1 F,, or
The equation has the solution
6(x) = 6, sin (%v$ X)
and the boundary condition &(L) = 0 means
For tensions larger than this, no solution is possible other than &(X) r 0, which means that
the wires remain stable. The required stability condition is, therefore,
or, for a given maximum tension TM allowed by the elasticity module of a given wire, the
critical stability length is
Table 7 gives for tungsten wires of several Table 7
diameters the maximum mechanical tension that Maximum mechanical tension (in new-
can be applied before inelastic deformation. tons) for tungsten wires, as a function of their diameter
As an example, in an S = 2 mm, II = 8 mm multi-
wire proportional chamber with 20 pm wires,
the critical length is about 85 cm for an opera-
tional voltage V, = 5 kV (normal for this geo-
metry, see Section 6.5). When larger sizes are
necessary, some kind of mechanical support has
to be foreseen for the wires, at intervals
shorter than Lc 44,45) . Using thinner wires,
if on the one hand one gains in performance
as shown above, on the other hand one needs much more closely spaced supports and
a severe mechanical complication and a source of localized inefficiencies.
this is
Another consequence of electrostatic forces in a multiwire chamber is the over-all
attraction of the outer elcctrodes towards thc anode plane, and therefore an inflection of
the cathode planes with a reduction of the gap width in the centre of a large ch,mher. As

we have seen in the previous section, the multiplication factor is very sensitive to the
gap width and this can be a problem in large size chambers. Taking into account all charge
distributions in the multiwire chamber structure, one can compute the over-all electrostatic
force per unit surface, or pressure, on each cathode461 ; the calculation is, however, rather tedious. We can reach essentially the same result using the approximated expression (41) for
the field in the drift volume. The field at the surface of the cathode conductors is then
Simple charge balance shows that the average charge per unit surface on each cathode is
CVo/2 S [this can also be deduced from expression (41) if one remembers the basic electro- static relationship E = u/E,]. The electrostatic pressure on each cathode is, therefore,
The limits of validity of this expression can be found in the requirement that the field (and
therefore the charge distribution) on the surface of the cathodes is constant; from Fig. 56,
one can see that this assumption is essentially true for chambers having II >> S.
The maximum inwards deflection of a square foil of surface H', stretched with a linear
tension 'Y, and subject to a pressure p, is given by
Combining Eqs. (46) and (47), one cane deduce the maximum deflection for a given chamber geometry, or the maximum size for a chamber if a limit is set for the deflection. In case
of large surfaces, a mechanical gap-restoring spacer may be necessary.
As an example, let us compute the maximum gap reduction in an S = 2 mm, 8 mm gap chamber
with H = 3 m operating at 4.5 kV; from Table 6 one obtains
Q = CV, = 1.5 X 10-' C/m
and, from Eq. (46), p = 0.8 ~/m*. The yield strength of aluminium alloys is around
2 X 10' N/m2, and for a 20 pm thick foil this gives a maximum stretching tension T of 4 X 10³ N/m. Introducing this value in Eq. (47), one can see that the maximum deflection
is about 220 pm, which implies a gain increase in the centre of the chamber of about 35% at
gains around 106 (see Section 6.3), in general not tolerable for correct operation. A mechani-
cal gap-restoring device or spacer is necessary; several kind of spacers have been de- 47948)
veloped but they are, of course, a source of inefficiency.
6.5 General operational characteristics: proportional and semi-proportional
A large variety of gases and gas mixtures is currently used in multiwire proportional
chambers. Except for special applications (for example, high densities or very good pro-
portionality) all mixtures are more or less equivalent, in terms of performances, at least
for moderate gains. Exceptionally large gains are, however, possible only in several speci-
fic mixtures containing an electronegative controlled impurity.
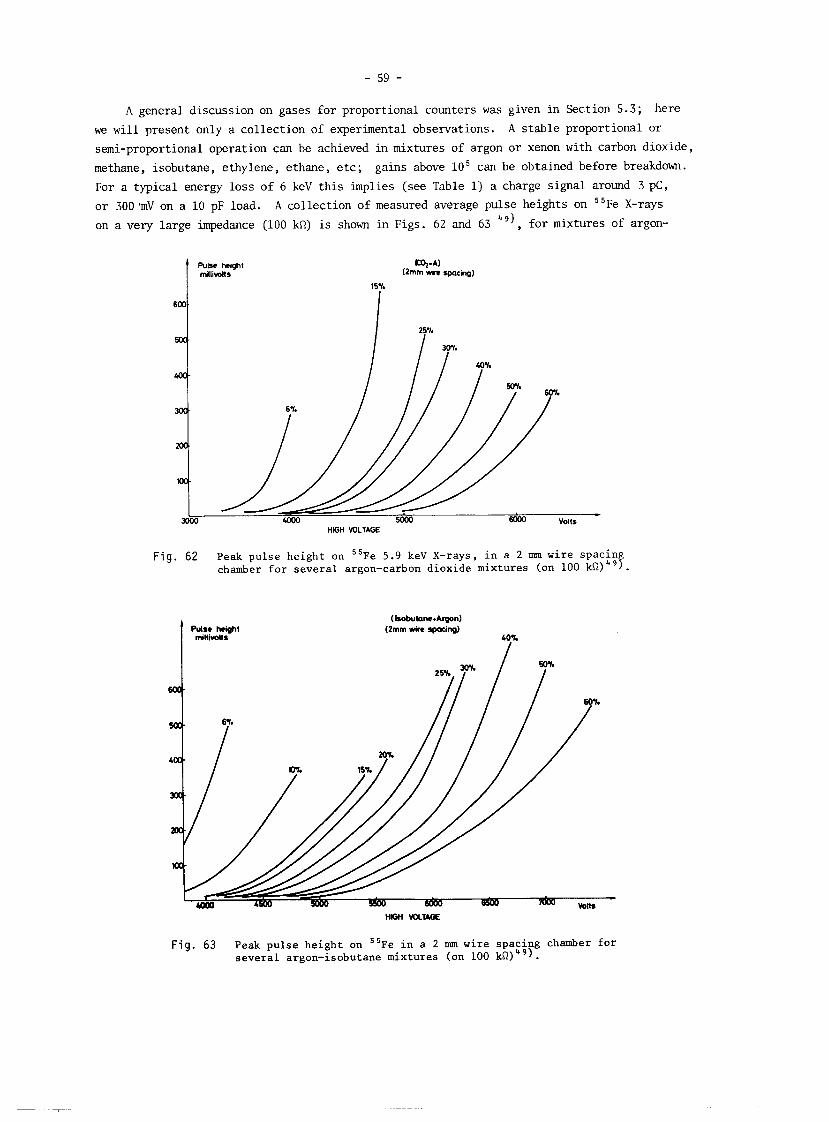
A general discussion on gases fo r proportional counters was given in Section 5 .3 ; here
we w i l l present only a collection of experimental observations. A s table proportional or
semi-proportional operation can be achieved in mixtures of argon or xenon with carbon dioxide,
methane, isobutane , ethylene, ethane, e t c ; gains above 10 can be obtained before breakdown.
For a typical energy loss of 6 keV t h i s implies (see Table 1) a charge signal around 3 pc,
or 300 'mV on a 10 pF load. A collection of measured average pulse heights on 5 5 ~ e X-rays
on a very large impedance (100 kR) i s shorn i n Figs. 62 and 63 "), for mixtures of argon-
Pulse hcqht mlliwlts
5000 HIGH VOLTAGE
F i g . 62 Peak pulse height on 5 5 ~ e 5.9 keV X-rays, in a 2 mm wire spacin chamber for several argon-carbon dioxide mixtures (on 100 La) f .
F i g . 63 Peak pulse height on 5 5 ~ e i n a 2 mm wire spacing chamber for several argon-isobutane mixtures (on 100 kR)").
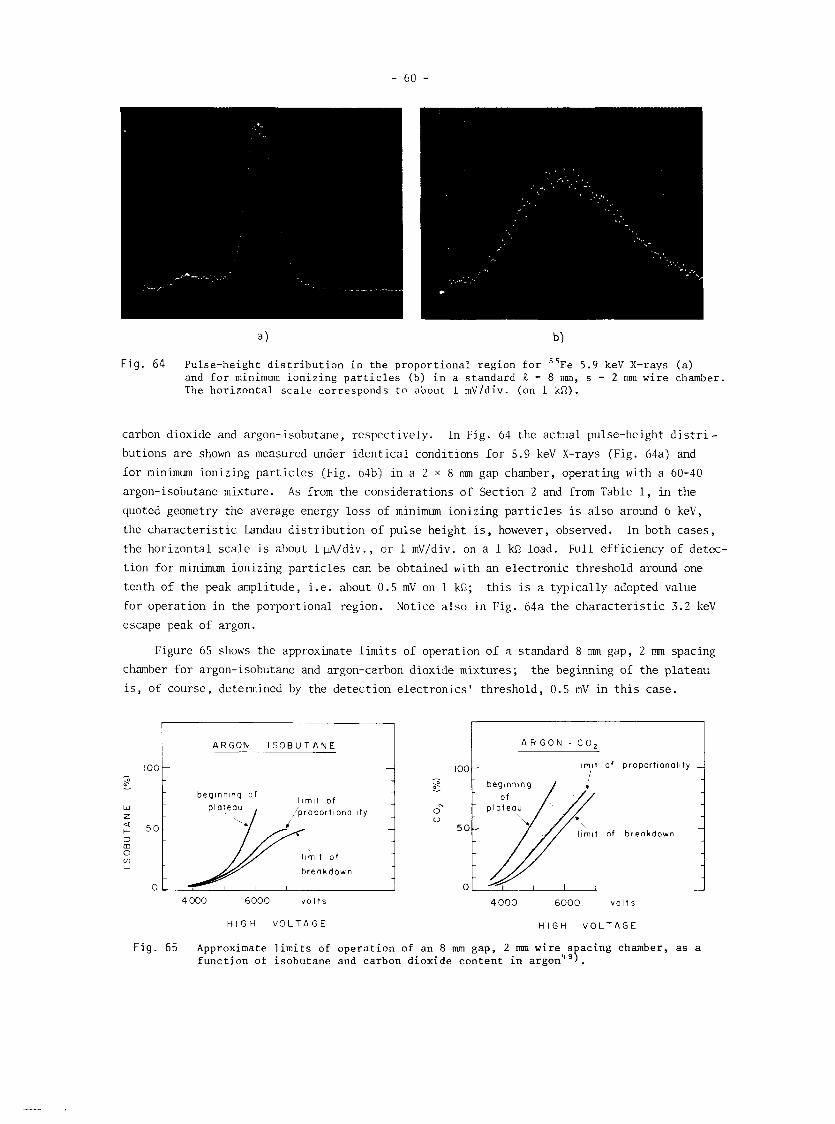
F i g . 64 Pulse-height distribution in the proportional region for " ~ e 5.9 keV X-rays (a) and for minimum ionizing particles (b) in a standard R = 8 mm, S = 2 mm wire chamber. The horizontal scale corresponds to about 1 mV/div. (on 1 kR).
carbon dioxide and argon-isobutane, respectively. In Fig. 64 the actual pulse-height distri-
butions are shown as measured under identical conditions for 5.9 keV X-rays (Fig. 64a) and
for minimum ionizing particles (Fig. 64b) in a 2 X 8 m gap chamber, operating with a 60-40
argon-isobutane mixture. As from the considerations of Section 2 and from Table 1, in the
quoted geometry the average energy loss of minimum ionizing particles is also around 6 keV,
the characteristic Landau distribution of pulse height is, however, observed. In both cases,
the horizontal scale is about 1 uA/div., or. 1 mV/div. on a 1 kR load. Full efficiency of detec-
tion for minimum ionizing particles can be obtained with an electronic threshold around one
tenth of the peak amplitude, i.e. about 0.5 mV on 1 kR; this is a typically adopted value
for operation in the porportional region. Notice also in Fig. 64a the characteristic 3.2 keV
escape peak of argon.
Figure 65 shows the approximate limits of operation of a standard 8 m gap, 2 m spacing
chamber for argon-isobutane and argon-carbon dioxide mixtures; the beginning of the plateau
is, of course, determined by the detection electronics' threshold, 0.5 mV in this case.
A R G O N - I S O B U T A N E l 1 A R G O N - CO,
4 000 6 0 0 0 v o l t s 4000 6 0 0 0 v o l t s
too- - 5 W
H I G H V O L T A G E H I G H V O L T A G E
F i g . 65 Approximate limits of operation of an 8 mm gap, 2 mm wire s acing chamber, as a function of isobutane and carbon dioxide content in arg~n'~Y.
-
b e g l n n l n g o f l h m ~ l o f
p l o t e o u
100 - l l r n ~ t o f proportionality -
b e q ~ n n i n q
z / p r o p o r t ~ o n o t ~ t ~ -
- 3 m 0 V) l l rn l t o f
b r e a k d o w n
0
0 v
- lhrnlt o f b r e a k d o w n
J 0 I I
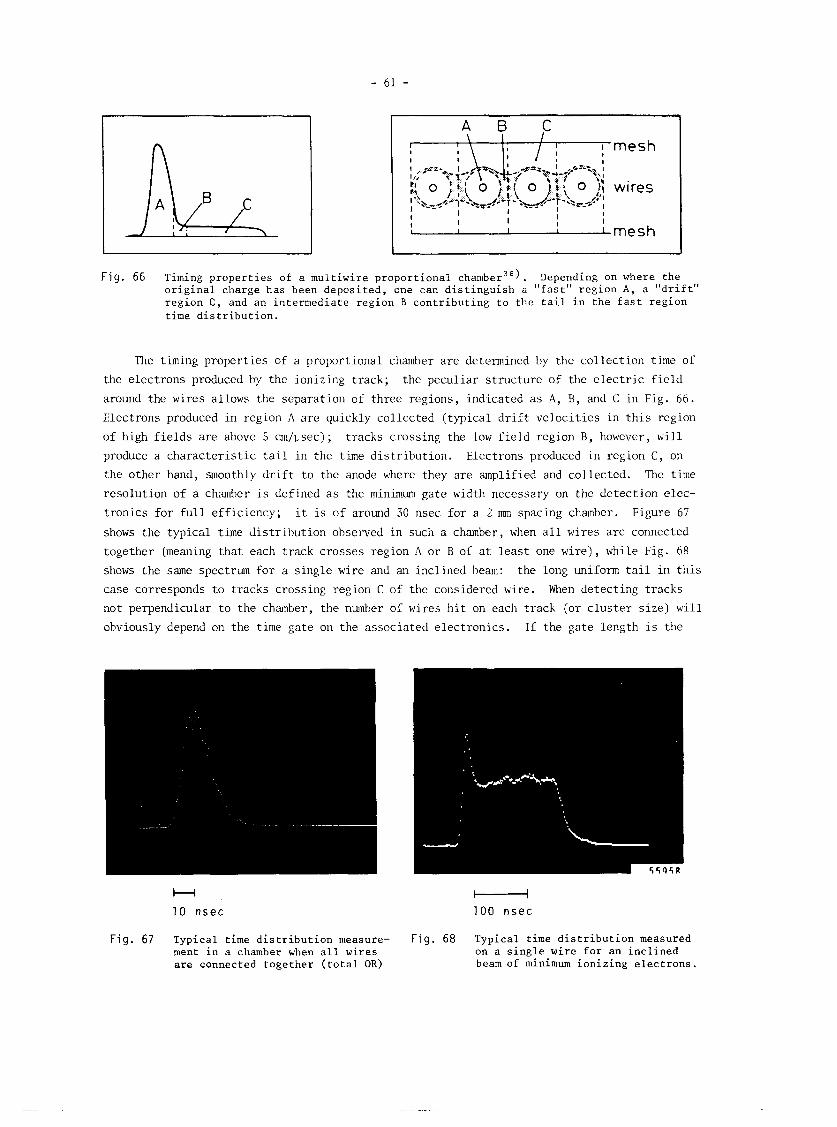
l I I I l I mesh
F i g . 66 Timing properties of a multiwire proportional chamber3'). Depending on where the original charge has been deposited, one can distinguish a "fast" region A, a "drift" region C, and an intermediate region B contributing to the tail in the fast region time distribution.
The timing properties of a proportional chamber are determined by the collection time of
the electrons produced by the ionizing track; the peculiar structure of the electric field
around the wires allows the separation of three regions, indicated as A, B, and C in Fig. 66.
Electrons produced in region A are quickly collected (typical drift velocities in this region
of high fields are above 5 cm/llsec); tracks crossing the low field region B, however, will
produce a characteristic tail in the time distribution. Electrons produced in region C, on
the other hand, smoothly drift to the anode where they are amplified and collected. The time
resolution of a chamber is defined as the minimum gate width necessary on the detection elec-
tronics for full efficiency; it is of around 30 nsec for a 2 mm spacing chamber. Figure 67
shows the typical time distribution observed in such a chamber, when all wires are connected
together (meaning that each track crosses region A or B of at least one wire), while Fig. 68
shows the same spectrum for a single wire and an inclined beam: the long uniform tail in this
case corresponds to tracks crossing region C of the considered wire. When detecting tracks
not perpendicular to the chamber, the number of wires hit on each track (or cluster size) will
obviously depend on the time gate on the associated electronics. If the gate length is the
H
1 0 nsec 100 nsec
F i g . 67 Typical time distribution measure- F i g . 68 Typical time distribution measured ment in a chamber when all wires on a single wire for an inclined are connected together (total OR) beam of minimum ionizing electrons.
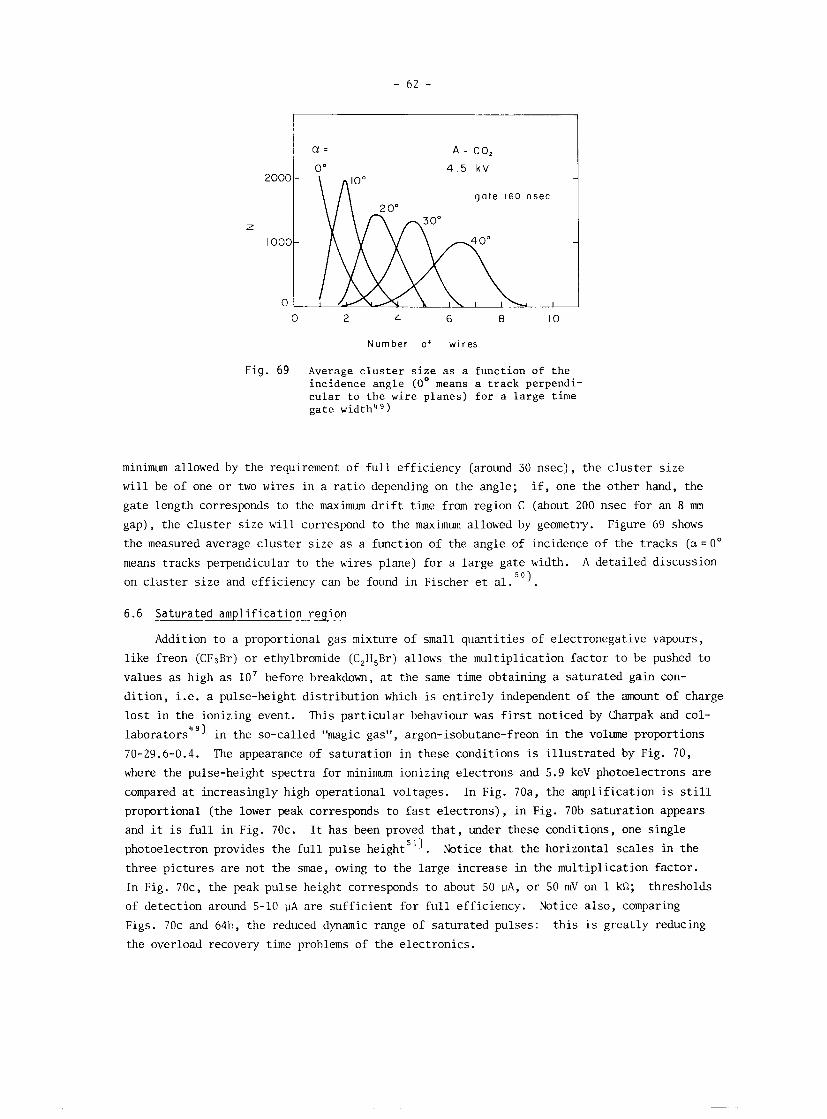
A - CO,
2 0 0 0
g a t e I 6 0 nsec
Z
1000
0
Number o f w ~ r e s
F i g . 69 Average c l u s t e r s i z e a s a f unc t i on of t h e inc idence angle ( o O means a t r a c k perpendi- c u l a r t o t h e wi re p lanes) f o r a l a r g e time g a t e width4')
minimum allowed by the requirement of full efficiency (around 30 nsec), the cluster size
will be of one or two wires in a ratio depending on the angle; if, one the other hand, the
gate length corresponds to the maximum drift time from region C (about 200 nsec for an 8 m
gap), the cluster size will correspond to the maximum allowed by geometry. Figure 69 shows
the measured average cluster size as a function of the angle of incidence of the tracks (a = 0'
means tracks perpendicular to the wires plane) for a large gate width. A detailed discussion = o ) on cluster size and efficiency can be found in Fischer et al. .
6.6 Saturated amplification region
Addition to a proportional gas mixture of small quantities of electronegative vapours,
like freon (CF3Br) or ethylbromide (C,HsBr) allows the multiplication factor to be pushed to
values as high as 107 before breakdown, at the same time obtaining a saturated gain con-
dition, i.e. a pulse-height distribution which is entirely independent of the amount of charge
lost in the ionizing event. This particular behaviour was first noticed by Charpak and col- 49) .
laborators in the so-called "magic gas", argon-isobutane-freon in the volume proportions
70-29.6-0.4. The appearance of saturation in these conditions is illustrated by Fig. 70,
where the pulse-height spectra for minimum ionizing electrons and 5.9 keV photoelectrons are
compared at increasingly high operational voltages. In Fig. 70a, the amplification is still
proportional (the lower peak corresponds to fast electrons), in Fig. 70b saturation appears
and it is full in Fig. 70c. It has been proved that, under these conditions, one single
photoelectron provides the full pulse heights1'. Notice that the horizontal scales in the
three pictures are not the smae, owing to the large increase in the multiplication factor.
In Fig. 70c, the peak pulse height corresponds to about 50 pA, or 50 mV on 1 kR; thresholds
of detection around 5-10 UA are sufficient for full efficiency. Notice also, comparing
Figs. 70c and 64b, the reduced dynamic range of saturated pulses: this is greatly reducing
the overload recovery time problems of the electronics.
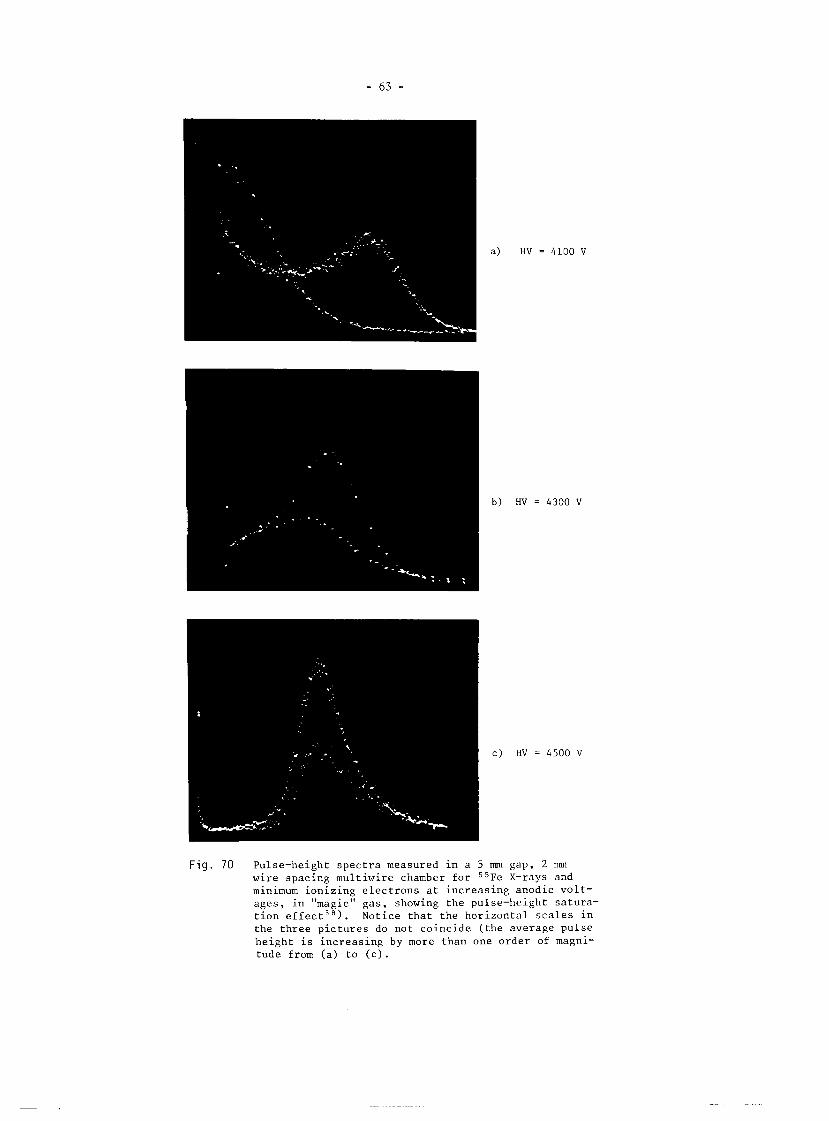
F i g . 70 Pulse-height spectra measured in a 5 m gap, 2 mm wire spacing multiwire chamber for 55Fe X-rays and minimum ionizing electrons at increasing anodic volt- ages, in "magic" gas, showing the pulse-height satura- tion effect3'). Notice that the horizontal scales in the three pictures do not coincide (the average pulse height is increasing by more than one order of magni- tude from (a) to ( c ) .

Gate 60 n sec
4 0 4 5 5 0
High voltage [ k ~ ]
Fig. 71 Typical efficiency plateau and noise rate versus high voltage for an 8 mm gap, 2 mm wire spacing chamber, operating with magic gas and 5 mV (on 1 kR) detection threshold^'^)
Figure 71 shows a typical efficiency plateau for minimum ionizing particles, of a multi-
wire proportional chamber operated with magic gas; the average wire noise rate, i.e. the
counting rate in the absence of radiation, is also indicated.
The amount of electronegative gas that can be used in a,chamber is obviously limited by
the requirement of full efficiency; roughly speaking, the mean free path for electron capture
A, should not be smaller than half the wire spacing. Figure 72 shows the measured efficiency
for a 2 mm wire spacing chamber, at increasingly high concentrations of freon; under rea-
sonable assumptions on the detection and capture mechanisms, the experimental points are well
approximated by a calculation that assumes X,' = 1.5 p mm-', where p is the percentage of
freon.
:f ficiency
4 measured
F i g . 72 Average efficiency for minimum ionizing particles, as a function of freon content in a 2 mm wire spacing chambers1 )

An important consequence of the presence of an electronegative gas in the mixture is a different behaviour in the cluster size versus gate length; electrons produced in the drift
region (region C of Fig. 66) have a very small probability of reaching the anodes, and the
cluster size is limited even for long gates, as illustrated in Fig. 73.
N
l OOC
500
0
Number of w~res touched
Fig. 73 Cluster s i z e for 30' tracks, for a large time gate, as a function of freon content4 g ) . Reduction of the sens i t ive zone around the wires re- s u l t s in a reduced c luster s i z e .
6.7 Limited Geiger and full Geiger operation
A peculiar mode of operation has been observed in proportional chambers having thick
wires widely spaced5'). At sufficiently high voltages, and using a reduced concentration
of organic quenchers (for example a 90-10 argon-isobutane mixture), a transition is observed
from the nonnal proportional r6gime to a damped Geiger propagation, limited in spatial ex-
tension to 10 mm or so along the wire. Although very attractive because of the remarkable
signal pulse height that can be obtained (30-40 mV on 50 R, see Fig. 74) , this mode of opera- tion has a severe rate limitation in the long time it takes the positive ion sheath to clear
the activated anode wire section. For an 8 mm gap chamber, the assumption that after each
count a 10 mm long section of the wire is dead for about 300 usec provides a good agreement
with the experimentally measured efficiency.
Full Geiger propagation has been observed in multiwire proportional chambers when only
a small percentage of quencher, like methylal or ethyl bromide, is added to pure argon:
again, very long dead-times are obtained. On the other hand, a measurement of the propaga-
tion time of the Geiger streamer along the wires can be used to provide two-dimensional
images of the conversion points 3 ) .
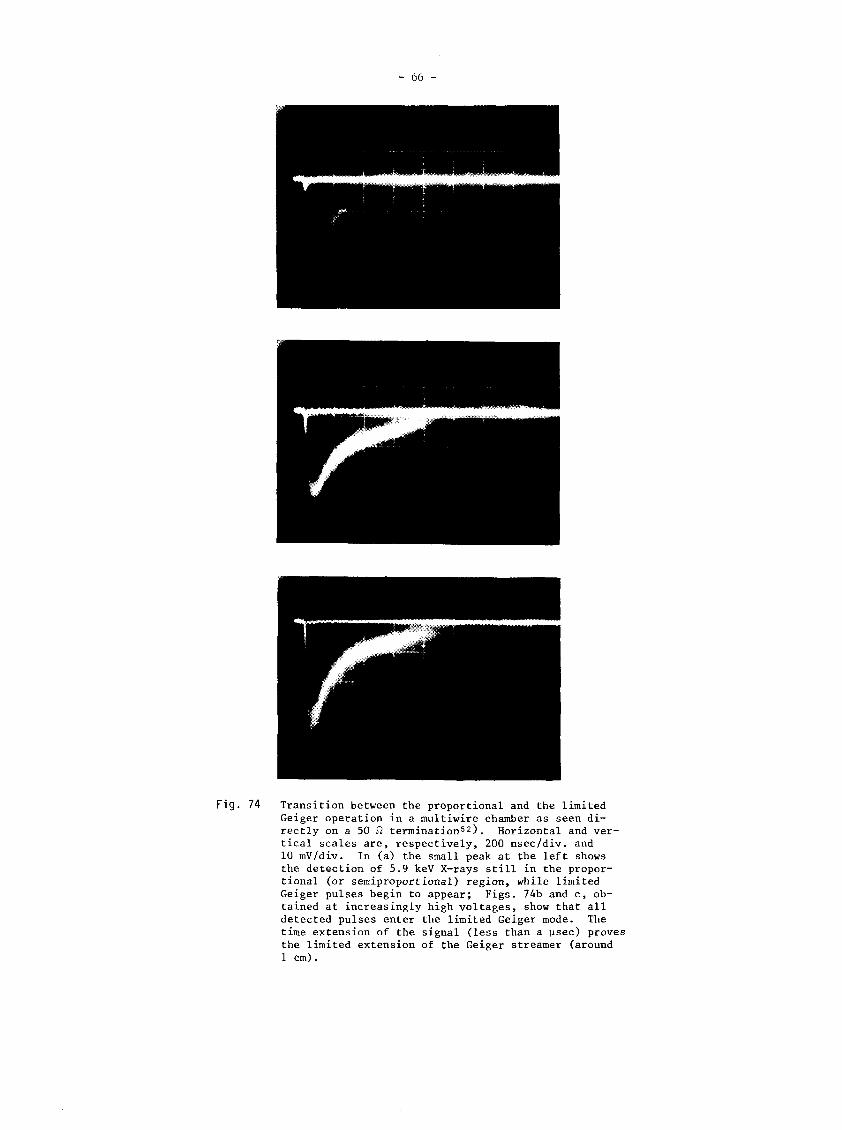
F i g . 74 Transition between the proportional and the limited Geiger operation in a multiwire chamber as seen di- rectly on a 50 R termination52). Horizontal and ver- tical scales are, respectively, 200 nsecldiv. and 10 mV/div. In (a) the small peak at the left shows the detection of 5.9 keV X-rays still in the propor- tional (or semiproportional) region, while limited Geiger pulses begin to appear; Figs. 74b and c, ob- tained at increasingly high voltages, show that all detected pulses enter the limited Geiger mode. The time extension of the signal (less than a usec) proves the limited extension of the Geiger streamer (around 1 cm).

6.8 Rate e f f e c t s and ageing
We have already discussed i n Section 5 .4 the e f f e c t on the gain of a pos i t ive space
charge b u i l t up a t high r a t e s . Since the gain reduction i s a localized e f f e c t , extending
perhaps one o r two gap lengths around the hot spot i n a chamber, subs tan t i a l modification
in the d i s t r ibu t ions of measured p a r t i c l e s can be produced i f the r a t e limit is loca l ly ex-
ceeded. Measurements of the average pulse-height reduction a s a function of r a t e were given
i n Figs. 53 and 54 fo r a spec i f i c geometry and gas mixture; of course, the e f f e c t depends
on the gap and ion mobili ty, which however cannot vary over a very wide range. Inspection
of the f igures shows c lea r ly t h a t , a t f ixed tllreshold of detect ion, one w i l l s t a r t losing
eff ic iency when the l o w r pa r t of the pulse-height spectrum d i s t r ibu t ion decreases below
threshold. High chamber gains and low thresholds a re therefore recommended f o r higher r a t e
f u l l ef f ic iency operation. I t appears i n p rac t i ce , however, t h a t a t any given chamber gain
the threshold value cannot sa fe ly he reduced helow one tenth o r one twentieth of the average
pulse height ( e s sen t i a l ly because of noise due t o micro-discharges), and therefore almost
ident ica l e f f i c i enc ies of detect ion versus r a t e have been measured i n a large va r i e ty of
gases and conditions. We w i l l quote here a measurement real ized i n a multiwirc proportional
chamber having 1 nun wire spacing, and operating i n magic gas [ ~ i g . 75 ')l, and a s imi la r
measurement obtained in a d r i f t chamber having 50 m wire spacing and operating i n argon-
isobutane [ ~ i ~ . 76 "]. The eff ic iency loss per un i t length of the anode w i r e a t high r a t e s
is about the same; obviously, the d i f fe ren t surface acceptance i n the two cases (50 t o 1)
reduces correspondingly the to le rab le surface ra t e . Small wire spacings a re therefore neces-
sary f o r operation a t high r a t e s , although the s p a t i a l extension of the pos i t ive charges may
c rea te some degree of interdependence between wires.
150,01 Ineff ic iency as f u n c t ~ o n of surface density 4
Number of pa r t i c l es per mm2 and per second
F i g . 75 Space-charge effect on chamber efficiency. Measured inefficiency on a s = 1 mm chamber, operating in magic gas, as a function of beam intensity54).
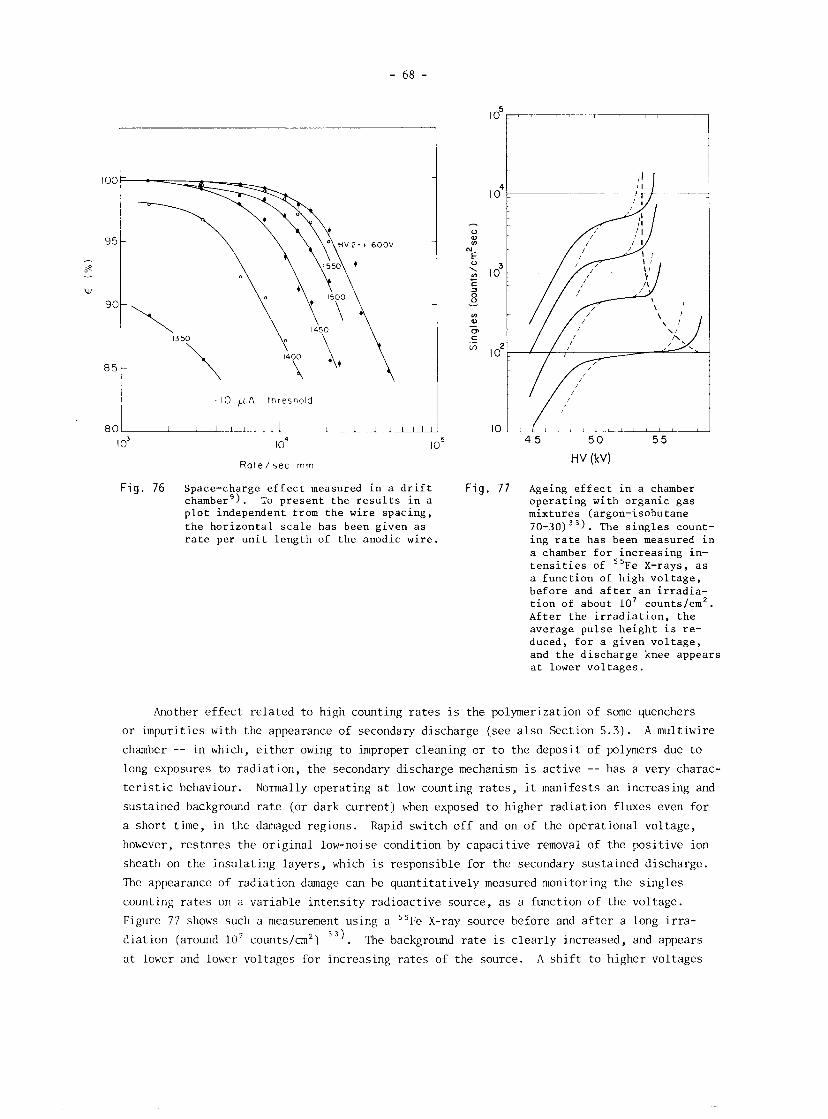
F i g . 76 Space-charge e f f e c t measured i n a d r i f t chamberg). To p r e s e n t t h e r e s u l t s i n a p l o t independent from t h e w i r e spac ing , t h e h o r i z o n t a l s c a l e has been g i v e n a s r a t e per u n i t l e n g t h of t h e anodic wi re .
8 0
F i g . 77
- 10 p 4 threshold
I I I I I I I I I I 1 1 / 1 1
Ageing e f f e c t i n a chamber o p e r a t i n g w i t h o r g a n i c g a s mix tures (argon-isobutane 70-30) 3 ) . The s i n g l e s count- ing r a t e has been measured i n a chamber f o r i n c r e a s i n g in- t e n s i t i e s of 5 5 ~ e X-rays, a s a f u n c t i o n of h igh v o l t a g e , before and a f t e r a n i r r a d i a - t i o n of about 10' counts/cm2. A f t e r t h e i r r a d i a t i o n , t h e average p u l s e h e i g h t i s r e - duced, f o r a g iven v o l t a g e , and t h e d i s c h a r g e knee appears a t lower v o l t a g e s .
Another effect related to high counting rates is the polymerization of some quenchers
or impurities with the appearance of secondary discharge (see also Section 5.3). A multiwire
chamber -- in which, either owing to improper cleaning or to the deposit of polymers due to
long exposures to radiation, the secondary discharge mechanism is active -- has a very charac-
teristic behaviour. Normally operating at low counting rates, it manifests an increasing and
sustained background rate (or dark current) when exposed to higher radiation flues even for
a short time, in the damaged regions. Rapid switch off and on of the operational voltage,
however, restores the original low-noise condition by capacitive removal of the positive ion
sheath on the insulating layers, which is responsible for the secondary sustained discharge.
The appearance of radiation damage can he quantitatively measured monitoring the singles
counting rates on a variable intensity radioactive source, as a function of the voltage.
Figure 77 shows such a measurement using a 5 5 ~ e X-ray source before and after a long irra-
diation (around lo7 counts/cm2) 3 3 ) . The background rate is clearly increased, and appears
at lower and lowr voltagcs for increasing rates of the source. A shift to higher voltages
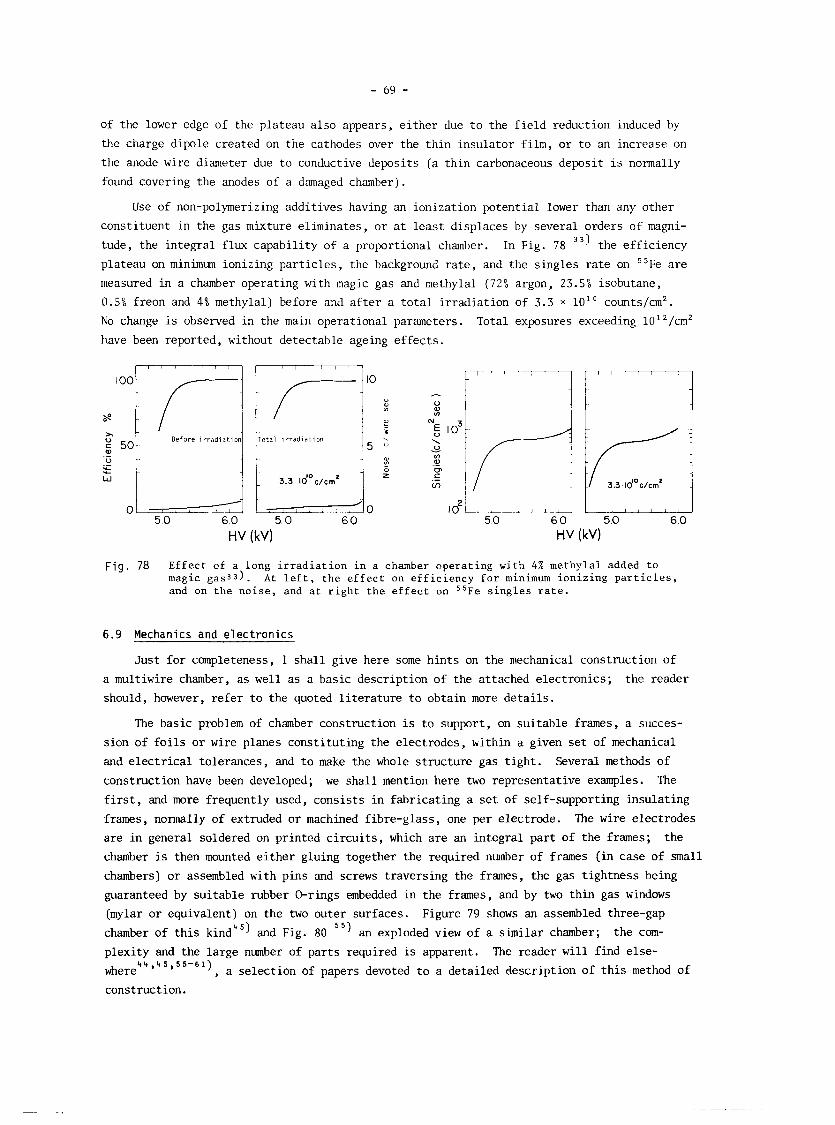
of the lower edge of the plateau also appears, either due to the field reduction induced by
the charge dipole created on the cathodes over the thin insulator film, or to an increase on
the anode wire diameter due to conductive deposits (a thin carbonaceous deposit is normally
found covering the anodes of a damaged chamber).
Use of non-polymerizing additives having an ionization potential lower than any other
constituent in the gas mixture eliminates, or at least displaces by several orders of magni-
tude, the integral flu capability of a proportional chamber. In Fig. 78 33) the efficiency
plateau on m i n i . ionizing particles, the background rate, and the singles rate on 5Fe are
measured in a chamber operating with magic gas and methylal (72% argon, 23.5% isobutane,
0.5% freon and 4% methylal) before and after a total irradiation of 3.3 X 10' counts/cm2. No change is observed in the main operational parameters. Total exposures exceeding 10'~/cm~
have been reported, without detectable ageing effects.
F i g . 78 E f f e c t of a long i r r a d i a t i o n i n a chamber o p e r a t i n g wi th 4% methyla l added t o magic gas33) . A t l e f t , t h e e f f e c t on e f f i c i e n c y f o r minimum i o n i z i n g p a r t i c l e s , and on t h e n o i s e , and a t r i g h t t h e e f f e c t on 5 5 ~ e s i n g l e s r a t e .
6.9 Mechanics and electronics
Just for completeness, I shall give here some hints on the mechanical construction of
a multiwire chamber, as well as a basic description of the attached electronics; the reader
should, however, refer to the quoted literature to obtain more details.
The basic problem of chamber construction is to support, on suitable frames, a succes-
sion of foils or wire planes constituting the electrodes, within a given set of mechanical
and electrical tolerances, and to make the whole structure gas tight. Several methods of
construction have been developed; we shall mention here two representative examples. The
first, and more frequently used, consists in fabricating a set of self-supporting insulating
frames, normally of extruded or machined fibre-glass, one per electrode. The wire electrodes
are in general soldered on printed circuits, which are an integral part of the frames; the
chamber is then mounted either gluing together the required number of frames (in case of small
chambers) or assembled with pins and screws traversing the frames, the gas tightness being
guaranteed by suitable rubber 0-rings embedded in the frames, and by two thin gas windows
(mylar or equivalent) on the two outer surfaces. Figure 79 shows an assembled three-gap
chamber of this kindq5) and Fig. 80 an exploded view of a similar chamber; the com-
plexity and the large number of parts required is apparent. The reader will find else- 44,45,55-61)
where , a selection of papers devoted to a detailed description of this method of construction.
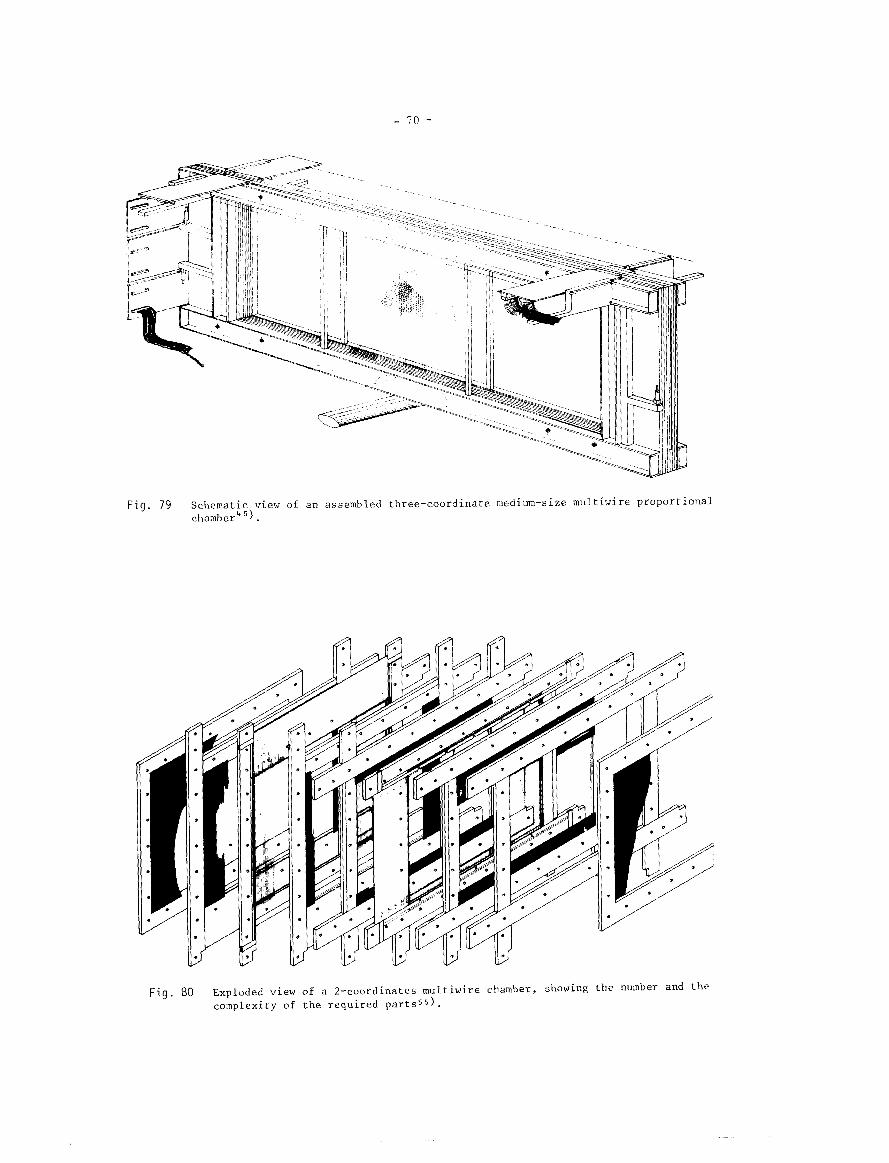
Fig. 79 Schematic view of an assembled three-coordinate medium-size multiwire proportional chamber4 5 ) .
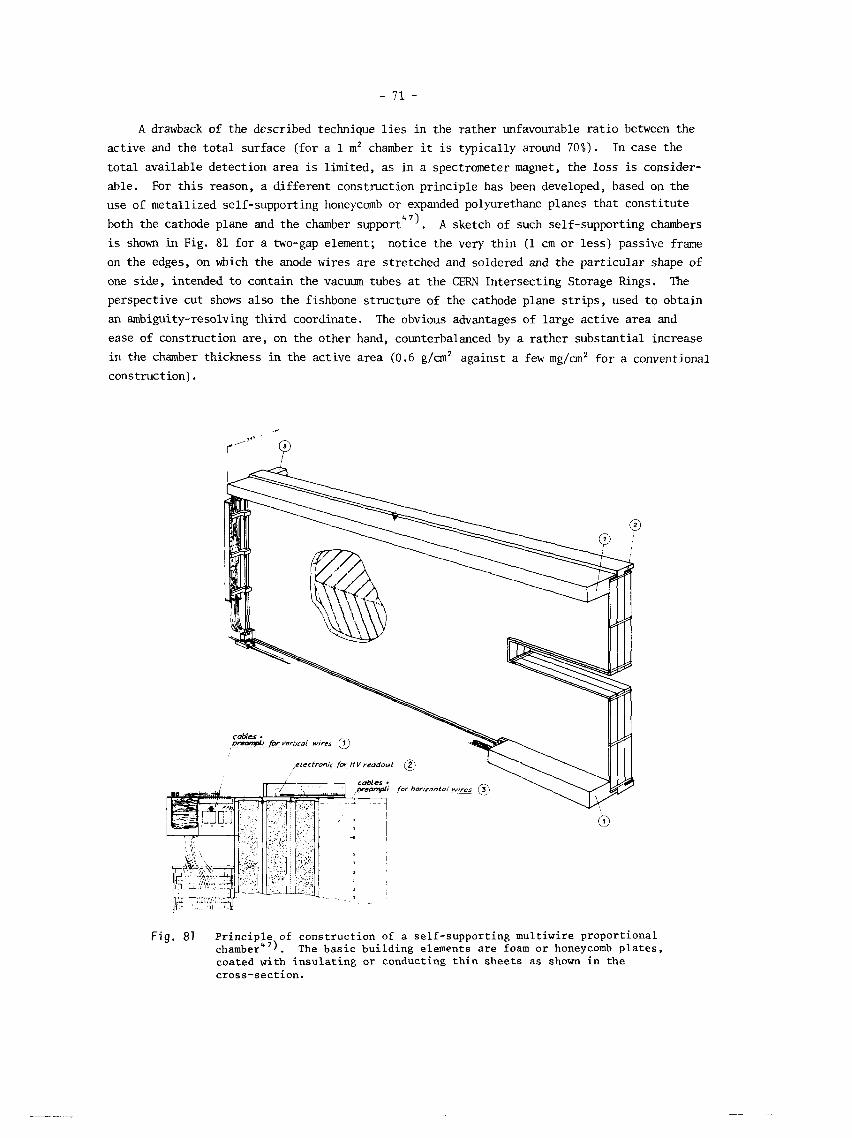
A drawback of the described technique lies in the rather unfavourable ratio between the active and the total surface (for a l m2 chamber it is typically around 70%). In case the
total available detection area is limited, as in a spectrometer magnet, the loss is consider-
able. For this reason, a different construction principle has been developed, based on the
use of metallized self-supporting honeycomb or expanded polyurethane planes that constitute
both the cathode plane and the chamber A sketch of such self-supporting chambers is shown in Fig. 81 for a two-gap element; notice the very thin (1 cm or less) passive frame on the edges, on which the anode wires are stretched and soldered and the particular shape of
one side, intended to contain the vacuum tubes at the CERN Intersecting Storage Rings. The
perspective cut shows also the fishbone structure of the cathode plane strips, used to obtain
an ambiguity-resolving third coordinate. The obvious advantages of large active area and
ease of construction are, on the other hand, counterbalanced by a rather substantial increase in the chamber thickness in the active area (0.6 g/cm2 against a few mg/an2 for a conventional
construction).
Fig . 81 Principle of construction of a self-supporting multiwire proportional chamberb7). The basic building elements are foam or honeycomb plates, coated with insulating or conducting thin sheets as shown in the cross-section.
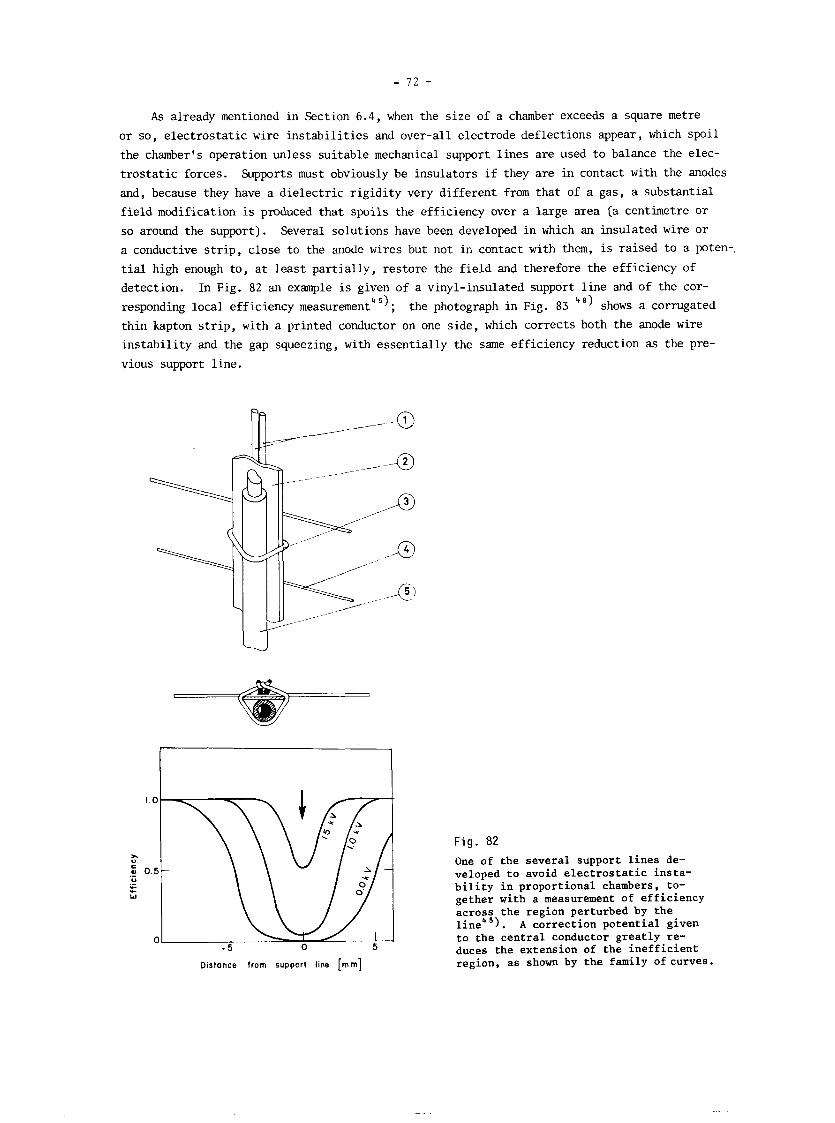
As already mentioned in Section 6.4, when the size of a chamber exceeds a square metre
or SO, electrostatic wire instabilities and over-all electrode deflections appear, which spoil
the chamber's operation unless suitable mechanical support lines are used to balance the elec-
trostatic forces. Supports must obviously be insulators if they are in contact with the anodes
and, because they have a dielectric rigidity very different from that of a gas, a substantial
field modification is produced that spoils the efficiency over a large area (a centimetre or
so around the support). Several solutions have been developed in which an insulated wire or
a conductive strip, close to the anode wires but not in contact with them, is raised to a poten-
tial high enough to, at least partially, restore the field and therefore the efficiency of detection. In Fig. 82 an example is given of a vinyl-insulated support line and of the cor- responding local efficiency measurement4 ; the photograph in Fig. 83 shows a corrugated
thin kapton strip, with a printed conductor on one side, which corrects both the anode wire
instability and the gap squeezing, with essentially the same efficiency reduction as the pre-
vious support line.
Fig. 82
Distance from support line [mm]
One of the several support lines de- veloped to avoid electrostatic insta- bility in proportional chambers, to- gether with a measurement of efficiency across the region perturbed by the line" 5 ) . A correction potential given to the central conductor greatly re- duces the extension of the inefficient region, as shown by the family ofcurves.
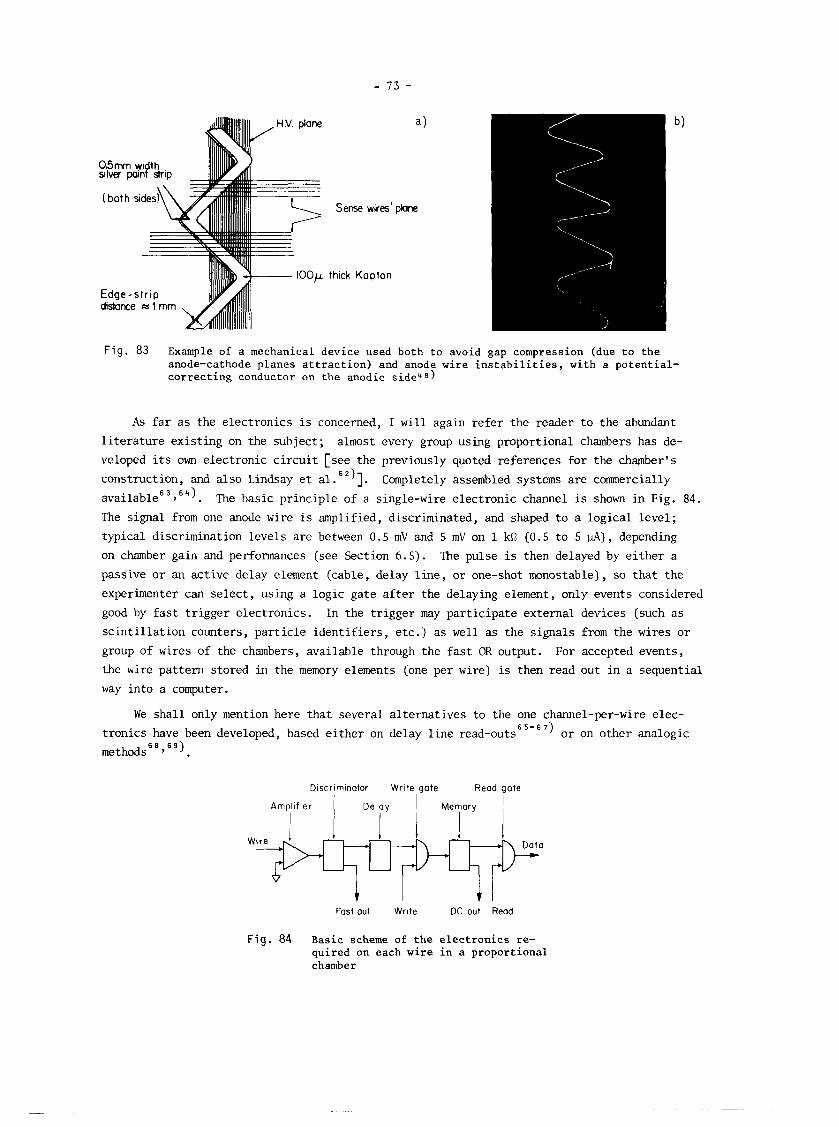
distance FC l mm
Sense wires'
thick K o ~ t o n
F i g . 83 Example of a mechanical device used both to avoid gap compression (due to the anode-cathode planes attraction) and anode wire instabilities, with a potential- correcting conductor on the anodic side48)
As far as the electronics is concerned, I will again refer the reader to the abundant
literature existing on the subject; almost every group using proportional chambers has de- veloped its own electronic circuit [see the previously quoted references for the chamber's
construction, and also Lindsay et al. 'I]. Completely assembled systems are commercially available 63,64) . The basic principle of a single-wire electronic channel is shown in Fig. 84.
The signal from one anode wire is amplified, discriminated, and shaped to a logical level;
typical discrimination levels are between 0.5 mV and 5 mV on 1 kR (0.5 to 5 PA), depending
on chamber gain and performances (see Section 6.5). The pulse is then delayed by either a
passive or an active delay element (cable, delay line, or one-shot monostable), so that the
experimenter can select, using a logic gate after the delaying element, only events considered
good by fast trigger electronics. In the trigger may participate external devices (such as scintillation counters, particle identifiers, etc.) as well as the signals from the wires or
group of wires of the chambers, available through the fast OR output. For accepted events,
the wire pattern stored in the memory elements (one per wire) is then read out in a sequential
way into a computer.
We shall only mention here that several alternatives to the one channel-per-wire elec- 6 5-6 7) tronics have been developed, based either on delay line read-outs or on other analogic
68,69) methods
Discr~minotor Write gate Read gate
DC out Read
6
Fast out Write
F ig . 84 Basic scheme of the quired on each wire chamber
electronics re- in a proportional
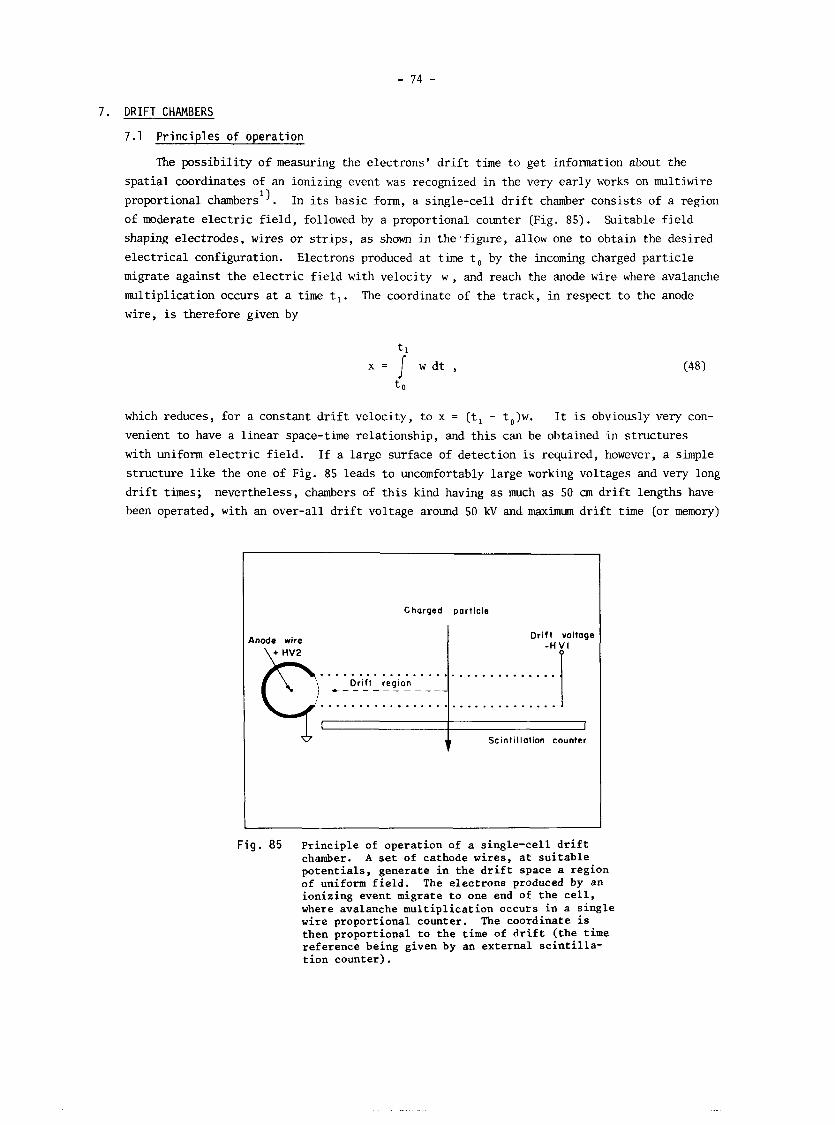
7. DRIFT CHAMBERS
7.1 P r inc ip les o f operat ion
The possibi l i ty of measuring the electrons' d r i f t time t o get information about the
spa t ia l coordinates of an ionizing event was recognized i n the very ear ly works on multiwire 1) proportional chambers . In i t s basic form, a single-cell d r i f t chamber consists of a region
of moderate e l ec t r i c f i e ld , followed by a proportional counter (Fig. 85). Suitable f i e ld
shaping electrodes, wires o r s t r i p s , a s shown i n the figure, allow one t o obtain the desired
e lec t r ica l configuration. Electrons produced a t time t o by the incoming charged par t ic le
migrate against the e l ec t r i c f i e ld with velocity W , and reach the anode wire where avalanche
multiplication occurs a t a time t , . The coordinate of the t rack, i n respect t o the anode
wire, is therefore given by
t l
= I w d t ,
t 0
which reduces, fo r a constant d r i f t velocity, t o X = ( t , - to)w. I t i s obviously very con-
venient t o have a l inear space-time relationship, and t h i s can be obtained i n structures
with uniform e l ec t r i c f ie ld . I f a large surface of detection is required, however, a simple
structure l i ke the one of Fig. 85 leads t o uncomfortably large working voltages and very long
d r i f t times; nevertheless, chambers of t h i s kind having as much as 50 cm d r i f t lengths have
been operated, with an over-all d r i f t voltage around 50 kV and maximum d r i f t time (or memory)
Charged particle
Anode wire \ + HV2
Drift voltage - H V I
?
6 Scintillation counter
............................... p'.., ! C Drift region
F ig . 85 Principle of operation of a single-cell drift chamber. A set of cathode wires, at suitable potentials, generate in the drift space a region of uniform field. The electrons produced by an ionizing event migrate to one end of the cell, where avalanche multiplication occurs in a single wire proportional counter. The coordinate is then proportional to the time of drift (the time reference being given by an external scintilla- tion counter).
1
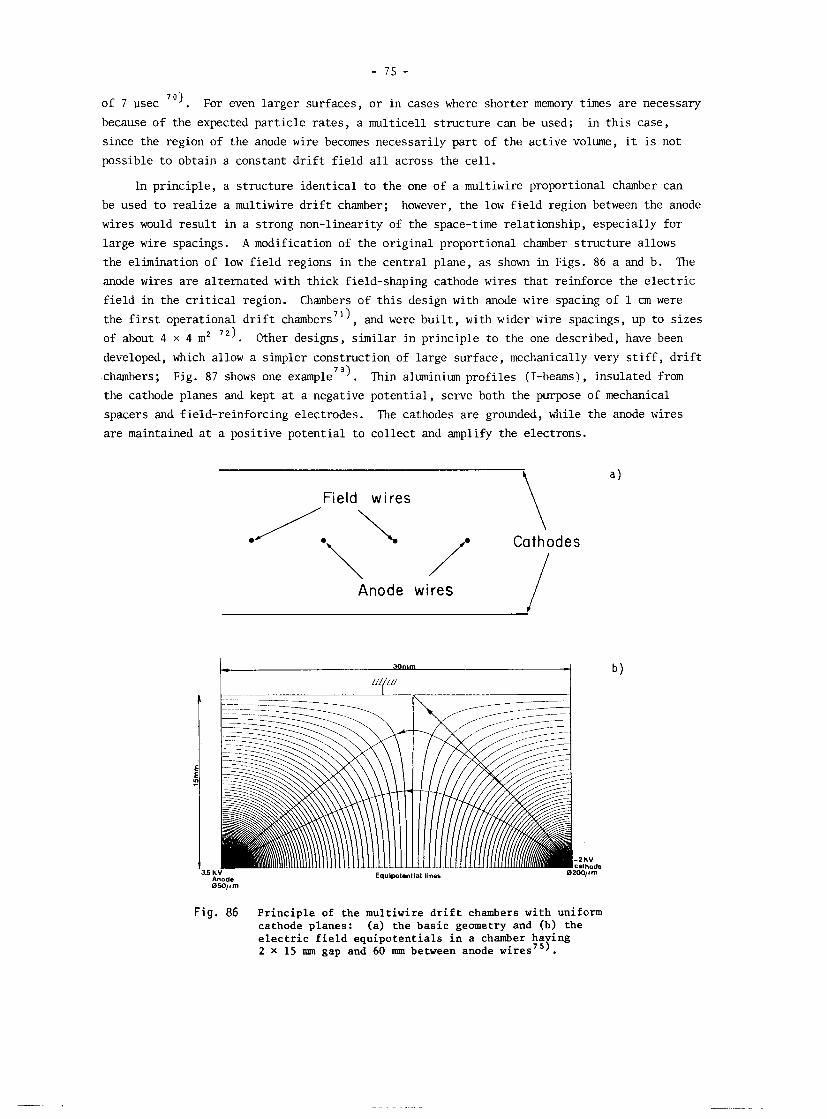
of 7 usec ''I. For even larger surfaces, or in cases where shorter memory times are necessary because of the expected particle rates, a multicell structure can be used; in this case,
since the region of the anode wire becomes necessarily part of the active volume, it is not
possible to obtain a constant drift field all across the cell.
In principle, a structure identical to the one of a multiwire proportional chamber can
be used to realize a multiwire drift chamber; however, the low field region between the anode
wires would result in a strong non-linearity of the space-time relationship, especially for
large wire spacings. A modification of the original proportional chamber structure allows the elimination of low field regions in the central plane, as shown in Figs. 86 a and b. The
anode wires are alternated with thick field-shaping cathode wires that reinforce the electric
field in the critical region. Chambers of this design with anode wire spacing of 1 cm were
the first operational drift chambers7'), and were built, with wider wire spacings, up to sizes
of about 4 X 4 m2 7 2 ) . Other designs, similar in principle to the one described, have been
developed, which allow a simpler construction of large surface, mechanically very stiff, drift
chambers; Fig. 87 shows one example73). Thin aluminium profiles (I-beams), insulated from
the cathode planes and kept at a negative potential, serve both the purpose of mechanical
spacers and field-reinforcing electrodes. The cathodes are grounded, while the anode wires
are maintained at a positive potential to collect and amplify the electrons.
Field wires
Anode wires I
Fig. 86 Principle of the multiwire drift chambers with uniform cathode planes: (a) the basic geometry and (b) the electric field equipotentials in a chamber having 2 X 15 mm gap and 60 mm between anode wires75).
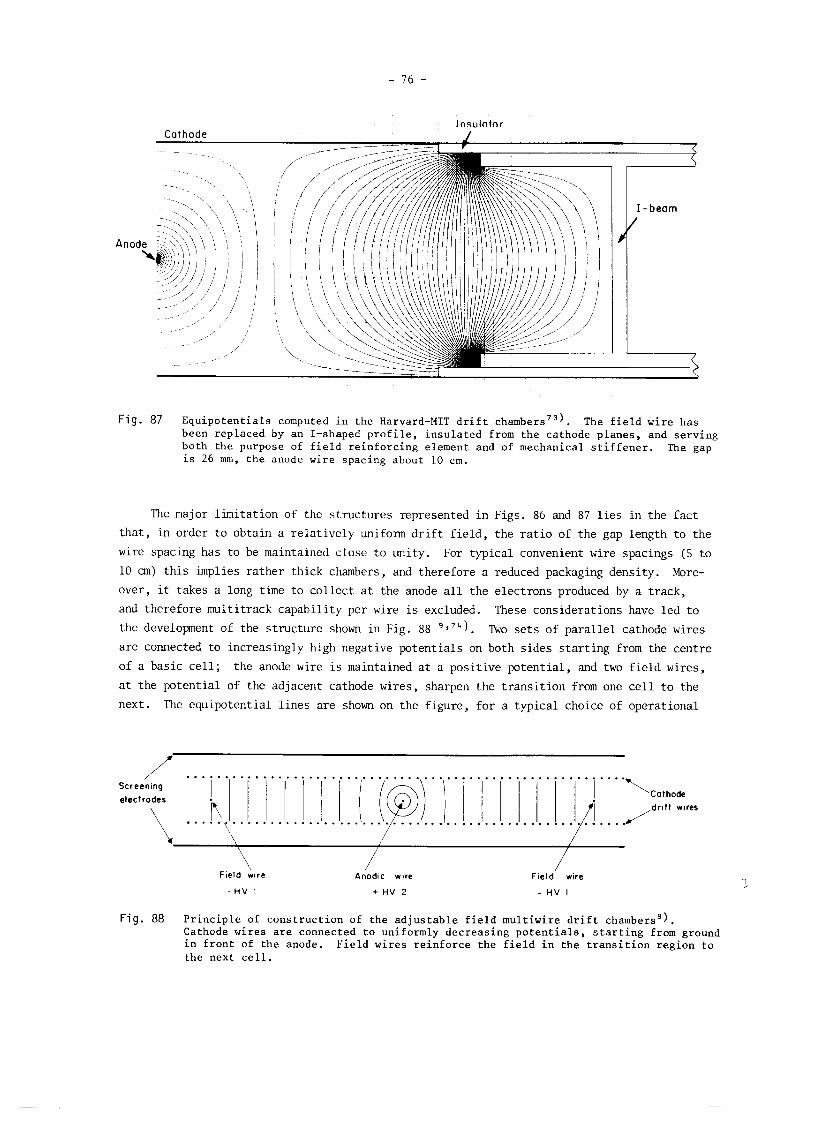
Insulator
F i g . 87 Equipotentials computed in the Harvard-MIT drift chambers73). The field wire has been replaced by an I-shaped profile, insulated from the cathode planes, and serving both the purpose of field reinforcing element and of mechanical stiffener. The gap is 26 mm, the anode wire spacing about 10 cm.
The major limitation of the structures represented i n Figs. 86 and 87 l i e s in the fac t
tha t , in order t o obtain a relat ively uniform d r i f t f i e l d , the r a t i o of the gap length t o the
wire spacing has to be maintained close t o unity. For typical convenient wire spacings (S t o
10 cm) t h i s implies rather thick chambers, and therefore a reduced packaging density. More-
over, it takes a long time to collect a t the anode a l l the electrons produced by a track,
and therefore multitrack capability per wire i s excluded. These considerations have led t o
the development of the structure shown in Fig. 88 >"+l. TWO se t s of paral le l cathode wires
are connected t o increasingly high negative potentials on both sides s ta r t ing from the centre
of a basic c e l l ; the anode wire i s maintained a t a positive potent ial , and two f i e ld wires,
a t the potential of the adjacent cathode wires, sharpen the t ransi t ion from one c e l l t o the
next. The equipotential l ines are shown on the figure, fo r a typical choice of operational
/ ................................. ................... Screening
electrodes I
\ .... ... I.!. l . . 1 . . l . i. p : . . l . . I . 1. l . . ! l ? . . wires
Field ware
- H V I
~ " o d i c wire
+ H V 2
/ Field wire
- H V I
F i g . 88 Principle of construction of the adjustable field multiwire drift chambersg). Cathode wires are connected to uniformly decreasing potentials, starting from ground in front of the anode. Field wires reinforce the field in the transition region to the next cell.
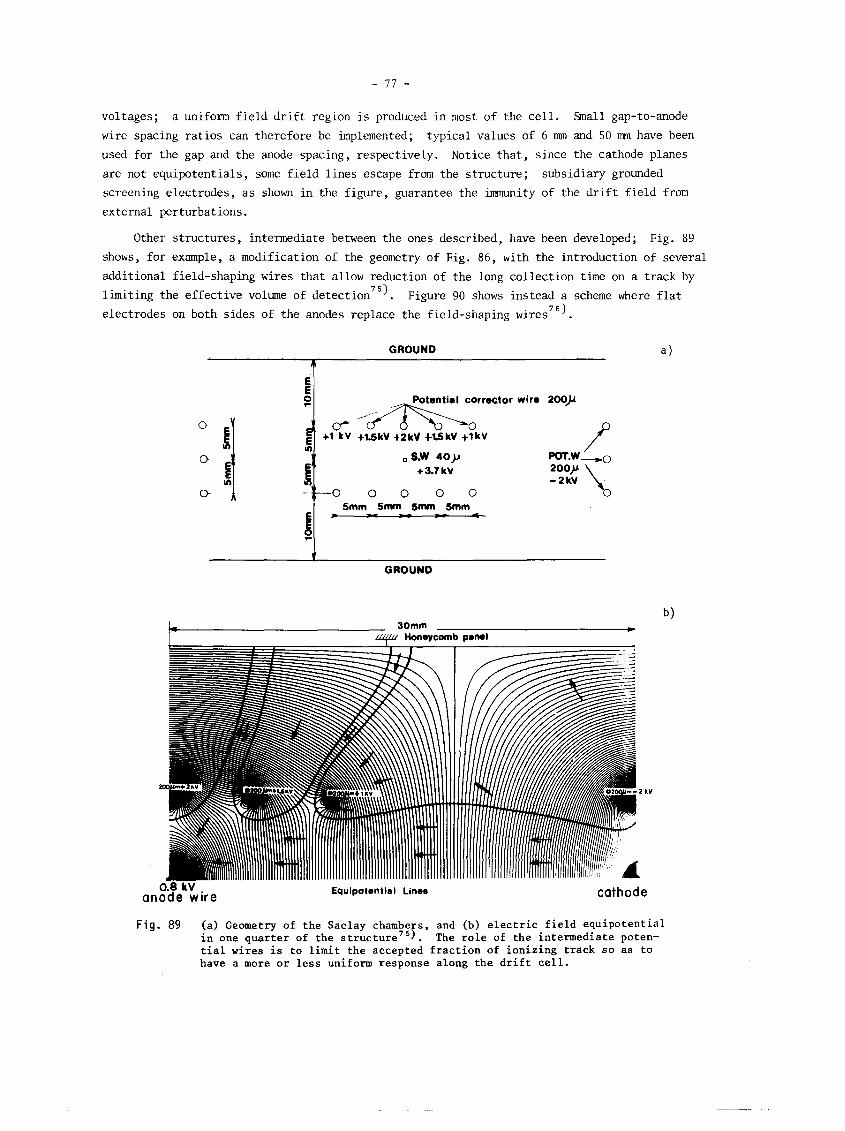
voltages; a uniform field drift region is produced in most of the cell. Small gap-to-anode
wire spacing ratios can therefore be implemented; typical values of 6 mm and 50 mm have been used for the gap and the anode spacing, respectively. Notice that, since the cathode planes
are not equipotentials, some field lines escape from the structure; subsidiary grounded
screening electrodes, as shown in the figure, guarantee the immunity of the drift field from
external perturbations.
Other structures, intermediate between the ones described, have been developed; Fig. 89
shows, for example, a modification of the geometry of Fig. 86, with the introduction of several
additional field-shaping wires that allow reduction of the long collection time on a track by
limiting the effective volume of detection7'). Figure 90 shows instead a scheme where flat 76) electrodes on both sides of the anodes replace the field-shaping wires .
GROUND a
T
Potential corrector wire 200)
k V +lSkV +2kV t1SkV +lkV
., S.W 40p P
~ . W - O + 3.7 kV
0.8 kV anode w i re
F
Equipotential Lines
5mm 5mm Smm Smm
B ' - - - - -
cathode
v GROUND
Fig . 89 (a) Geometry of the Saclay chambers, and (b) electric field equipotential in one quarter of the structure7'). The role of the intermediate poten- tial wires is to limit the accepted fraction of ionizing track so as to have a more or less uniform response along the drift cell.
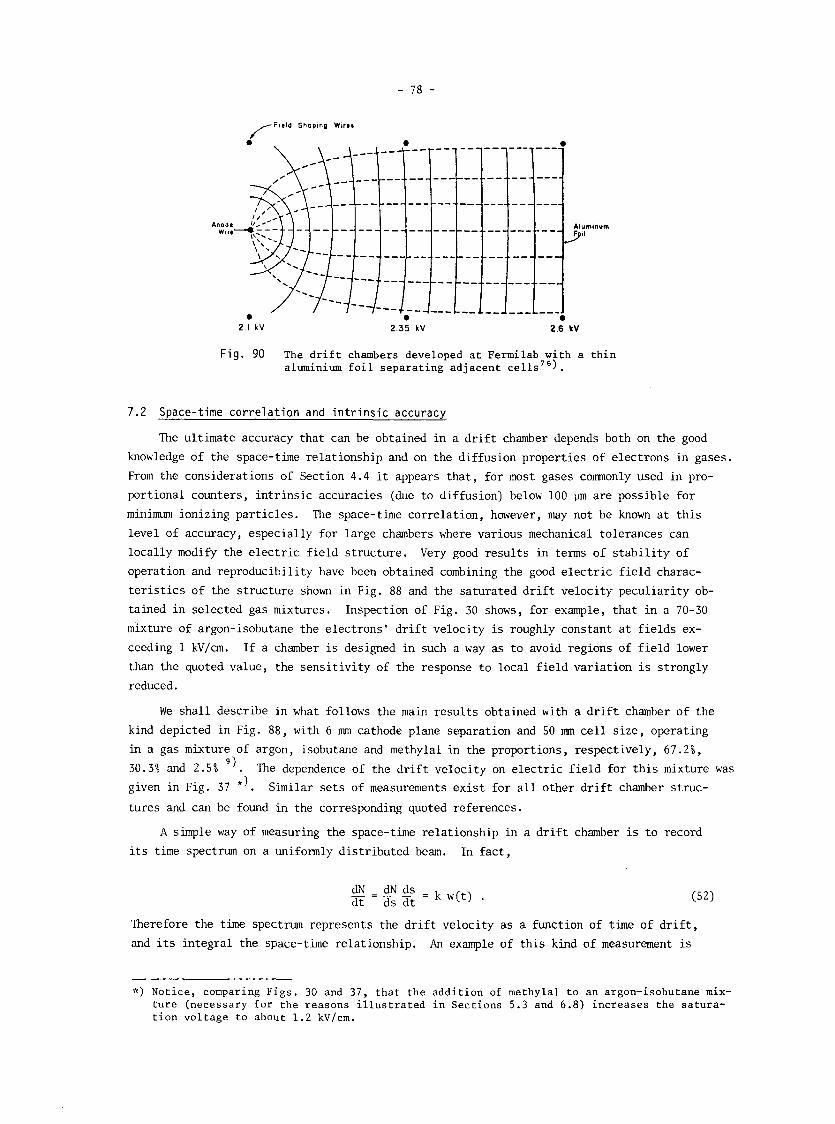
F i g . 90 The drift chambers developed at Fermilab with a thin aluminium foil separating adjacent ~e1l.s'~) .
7.2 Space-time correlation and intrinsic accuracy
The ultimate accuracy that can be obtained in a drift chamber depends both on the good
knowledge of the space-time relationship and on the diffusion properties of electrons in gases.
From the considerations of Section 4.4 it appears that, for most gases commonly used in pro-
portional counters, intrinsic accuracies (due to diffusion) below 100 pm are possible for
minimum ionizing particles. The space-time correlation, however, may not be known at this level of accuracy, especially for large chambers where various mechanical tolerances can
locally modify the electric field structure. Very good results in terms of stability of
operation and reproducibility have been obtained combining the good electric field charac-
teristics of the structure shown in Fig. 88 and the saturated drift velocity peculiarity ob-
tained in selected gas mixtures. Inspection of Fig. 30 shows, for example, that in a 70-30
mixture of argon-isobutane the electrons' drift velocity is roughly constant at fields ex-
ceeding 1 kV/an. If a chamber is designed in such a way as to avoid regions of field lower
than the quoted value, the sensitivity of the response to local field variation is strongly
reduced.
We shall describe in what follows the main results obtained with a drift chamber of the
kind depicted in Fig. 88, with 6 mm cathode plane separation and 50 mm cell size, operating
in a gas mixture of argon, isobutane and methylal in the proportions, respectively, 67.2%, 30.3% and 2 .S% ' l . The dependence of the drift velocity on electric field for this mixture was given in Fig. 37 *I. Similar sets of measurements exist for all other drift chamber struc- tures and can be found in the corresponding quoted references.
A simple way of measuring the space-time relationship in a drift chamber is to record
its time spectrum on a uniformly distributed beam. In fact,
Therefore the time spectrum represents the drift velocity as a function of time of drift,
and its integral the space-time relationship. An example of this kind of measurement is
*) Notice, comparing Figs. 30 and 37, that the addition of methylal to an argon-isobutane mix- ture (necessary for the reasons illustrated in Sections 5.3 and 6.8) increases the satura- tion voltage to about 1.2 kV/cm.
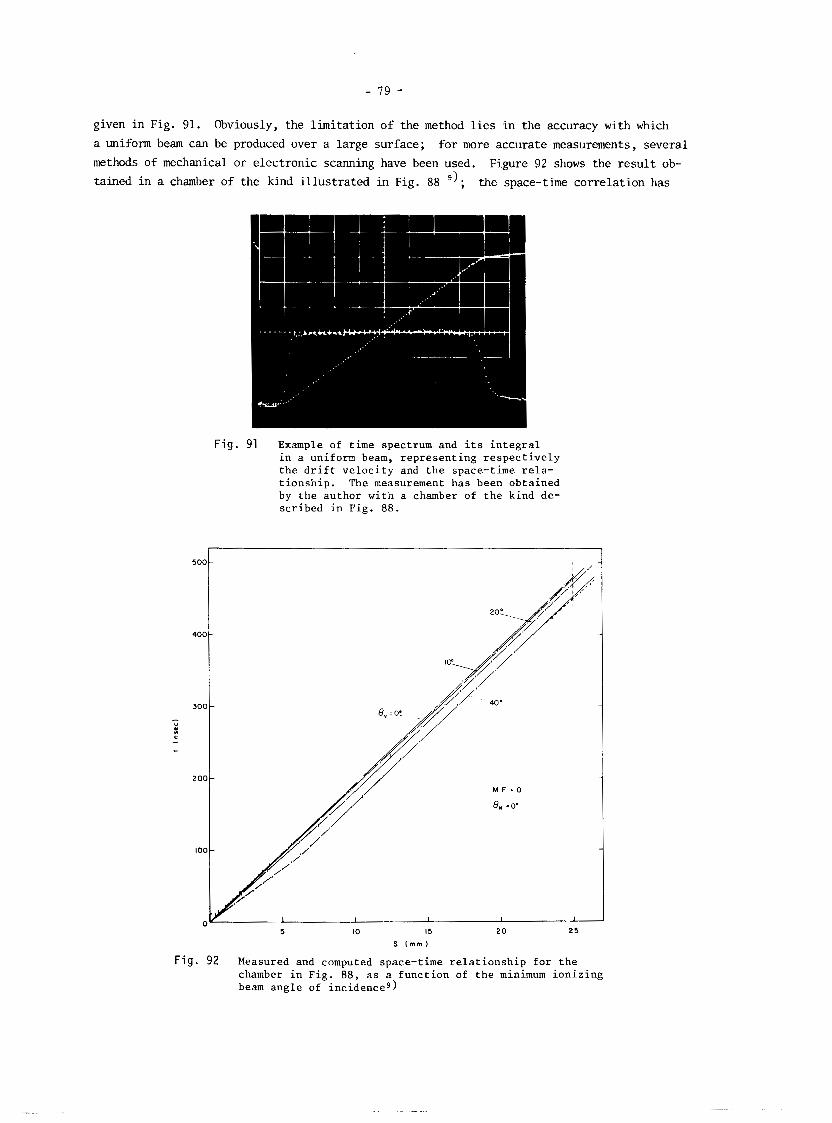
- 79 -
given in Fig. 91. Obviously, the limitation of the method lies in the accuracy with which
a uniform beam can be produced over a large surface; for more accurate measurements, several methods of mechanical or electronic scanning have been used. Figure 92 shows the result ob- tained in a chamber of the kind illustrated in Fig. 88 the space-time correlation has
F ig . 91 Example of t ime spectrum and i t s i n t e g r a l i n a uniform beam, r e p r e s e n t i n g r e s p e c t i v e l y t h e d r i f t v e l o c i t y and t h e space-time r e l a - t i o n s h i p . The measurement h a s been o b t a i n e d by t h e a u t h o r w i t h a chamber of t h e k i n d de- s c r i b e d i n F ig . 88.
5 I0 15 2 0 2 5
S ( m m )
F ig . 92 Measured and computed space- t ime r e l a t i o n s h i p f o r t h e chamber i n F ig . 88, a s a f u n c t i o n of t h e minimum i o n i z i n g beam a n g l e of inc idenceg)
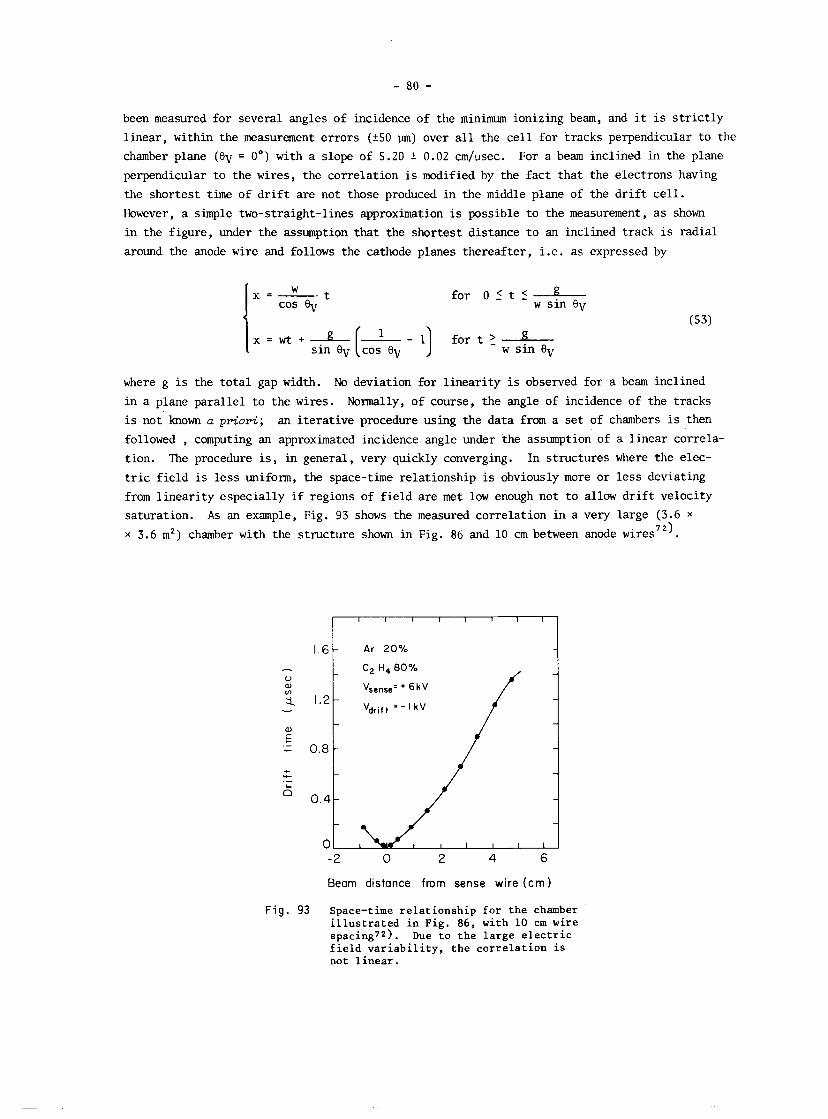
been measured for several angles of incidence of the minimum ionizing beam, and it is strictly
linear, within the measurement errors (+-S0 pm) over all the cell for tracks perpendicular to the
chamber plane ( 8 ~ = 0') with a slope of 5.20 + 0.02 cm/usec. For a beam inclined in the plane
perpendicular to the wires, the correlation is modified by the fact that the electrons having
the shortest time of drift are not those produced in the middle plane of the drift cell.
However, a simple two-straight-lines approximation is possible to the measurement, as shown
in the figure, under the assumption that the shortest distance to an inclined track is radial
around the anode wire and follows the cathode planes thereafter, i.e. as expressed by
W t cos ev l x =- for O < t 5 g
W sin 0v
= wt +-L[A- 1) for t 2 A sin 0~ COS eV W sin OV
where g is the total gap width. No deviation for linearity is observed for a beam inclined
in a plane parallel to the wires. Normally, of course, the angle of incidence of the tracks
is not known a priori; an iterative procedure using the data from a set of chambers is then
followed , computing an approximated incidence angle under the assumption of a linear correla- tion. The procedure is, in general, very quickly converging. In structures where the elec-
tric field is less uniform, the space-time relationship is obviously more or less deviating
from linearity especially if regions of field are met low enough not to allow drift velocity
saturation. As an example, Fig. 93 shows the measured correlation in a very large (3.6 X
X 3.6 m2) chamber with the structure shown in Fig. 86 and 10 cm between anode wires 72)
Beam distance from sense wire ( c m )
Fig. 93 Space-time relationship for the chamber illustrated in Fig. 86, with 10 cm wire spacing72). Due to the large electric field variability, the correlation is not linear.
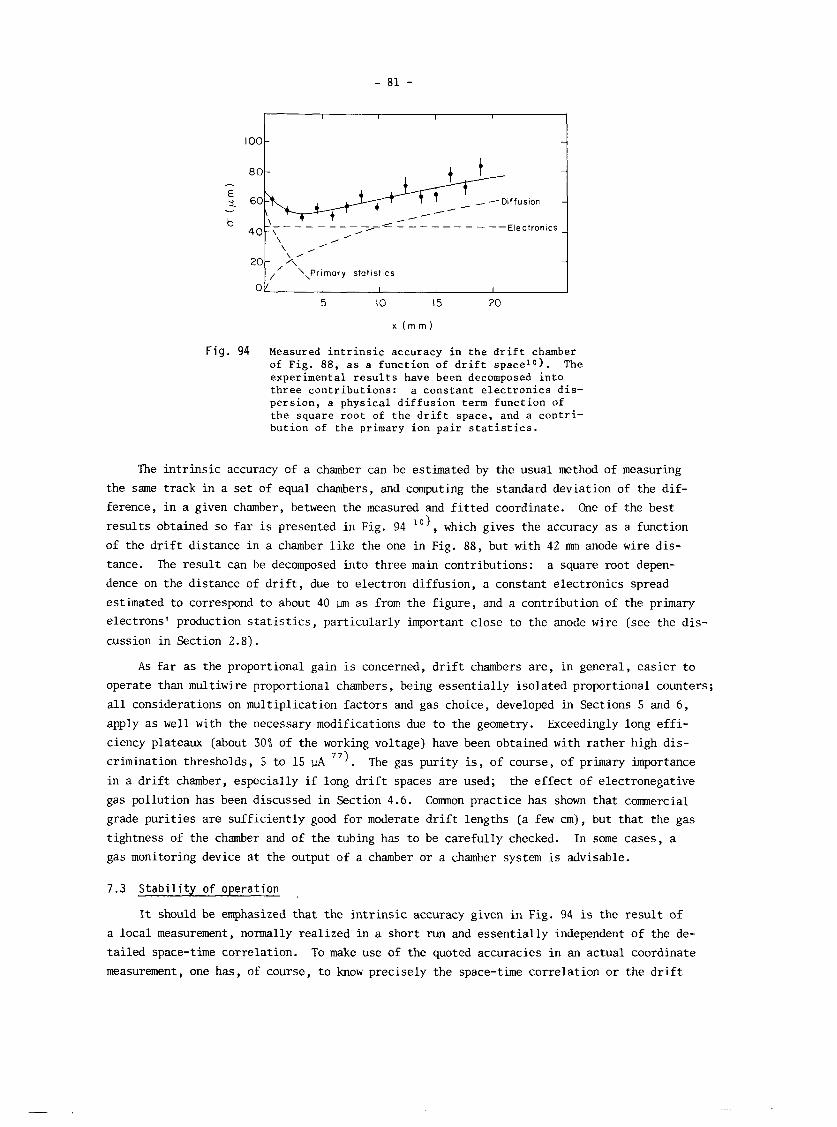
X ( m m )
F i g . 94 Measured i n t r i n s i c accuracy i n t h e d r i f t chamber of F i g . 88, a s a f u n c t i o n of d r i f t space lO) . The experimental r e s u l t s have been decomposed i n t o t h r e e c o n t r i b u t i o n s : a c o n s t a n t e l e c t r o n i c s d i s - p e r s i o n , a phys ica l d i f f u s i o n term f u n c t i o n of t h e square r o o t of t h e d r i f t space, and a c o n t r i - b u t i o n of t h e pr imary i o n p a i r s t a t i s t i c s .
The intrinsic accuracy of a chamber can be estimated by the usual method of measuring
the same track in a set of equal chambers, and computing the standard deviation of the dif-
ference, in a given chamber, between the measured and fitted coordinate. One of the best
results obtained so far is presented in Fig. 94 l ' ) , which gives the accuracy as a function
of the drift distance in a chamber like the one in Fig. 88, but with 42 mm anode wire dis- tance. The result can be decomposed into three main contributions: a square root depen- dence on the distance of drift, due to electron diffusion, a constant electronics spread
estimated to correspond to about 40 p as from the figure, and a contribution of the primary
electrons' production statistics, particularly important close to the anode wire (see the dis- cussion in Section 2.8).
As far as the proportional gain is concerned, drift chambers are, in general, easier to
operate than multiwire proportional chambers, being essentially isolated proportional counters;
all considerations on multiplication factors and gas choice, developed in Sections 5 and 6,
apply as well with the necessary modifications due to the geometry. Exceedingly long effi-
ciency plateaux (about 30% of the working voltage) have been obtained with rather high dis- crimination thresholds, 5 to 15 UA 7 7 ) . The gas purity is, of course, of primary importance in a drift chamber, especially if long drift spaces are used; the effect of electronegative
gas pollution has been discussed in Section 4.6. C m o n practice has shown that commercial
grade purities are sufficiently good for moderate drift lengths (a few an), but that the gas
tightness of the chamber and of the tubing has to be carefully checked. In some cases, a gas monitoring device at the output of a chamber or a chamber system is advisable.
7.3 Stability of operation
It should be emphasized that the intrinsic accuracy given in Fig. 94 is the result of
a local measurement, normally realized in a short run and essentially independent of the de-
tailed space-time correlation. To make use of the quoted accuracies in an actual coordinate
measurement, one has, of course, to how precisely the space-time correlation or the drift
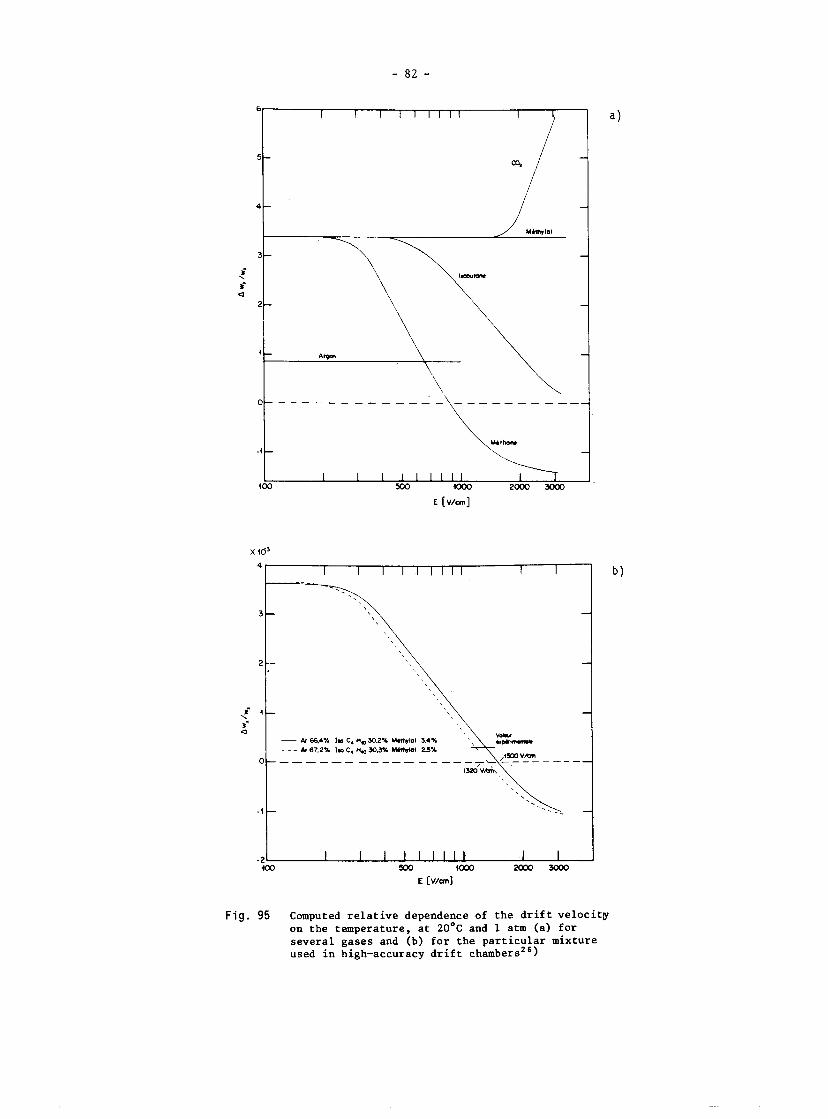
F i g . 95 Computed re la t ive dependence of the d r i f t velocitpr on the temperature, at 20•‹c and 1 atm (a) for several gases and (b) for the particular mixture used in high-accuracy d r i f t chambersz6)
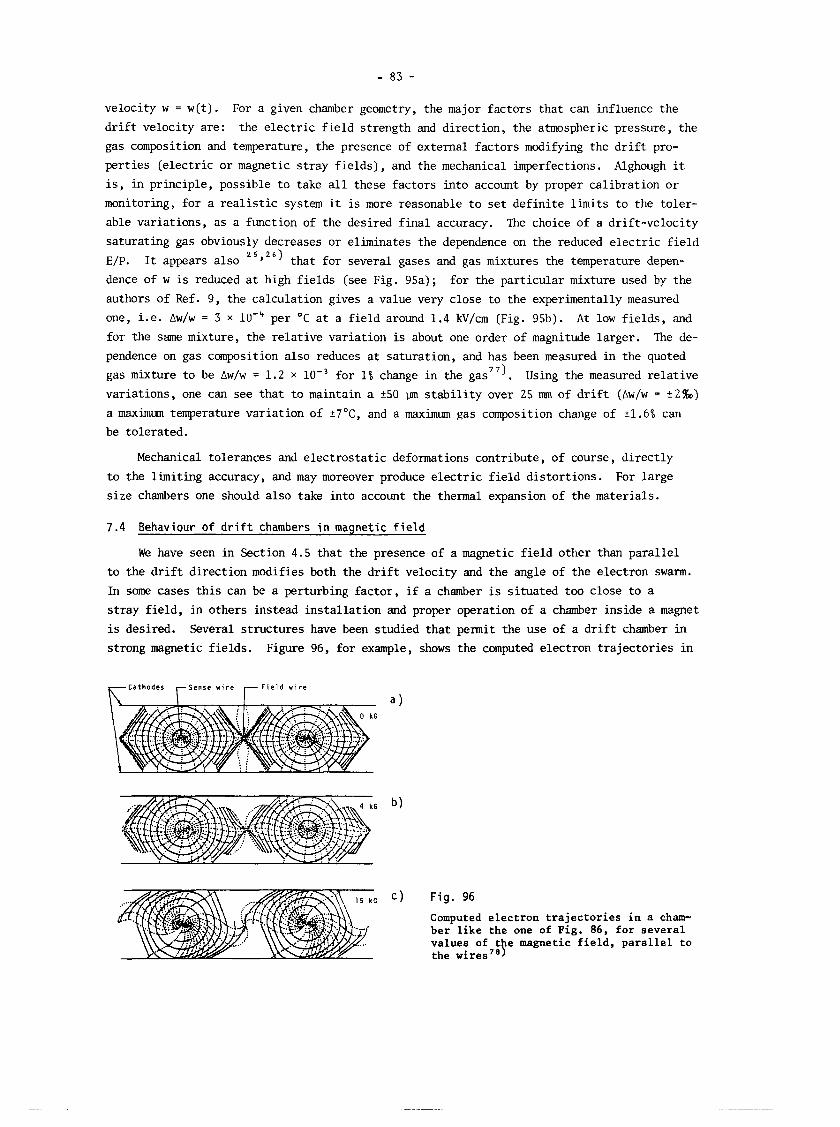
velocity W = w(t). For a given chamber geometry, the major factors that can influence the drift velocity are: the electric field strength and direction, the atmospheric pressure, the
gas composition and temperature, the presence of external factors modifying the drift pro-
perties (electric or magnetic stray fields), and the mechanical imperfections. Alghough it is, in principle, possible to take all these factors into account by proper calibration or
monitoring, for a realistic system it is more reasonable to set definite limits to the toler-
able variations, as a function of the desired final accuracy. The choice of a drift-velocity
saturating gas obviously decreases or eliminates the dependence on the reduced electric field 2 5 , 2 6 )
E/P. It appears also that for several gases and gas mixtures the temperature depen-
dence of W is reduced at high fields (see Fig. 95a); for the particular mixture used by the
authors of Ref. 9, the calculation gives a value very close to the experimentally measured
one, i.e. Aw/w = 3 X 10-' per "C at a field around 1.4 kV/cm (Fig. 95b) . At low fields, and for the same mixture, the relative variation is about one order of magnitude larger. The de- pendence on gas camposition also reduces at saturation, and has been measured in the quoted
gas mixture to be Aw/w = 1.2 X 10e3 for 1% change in the gas77). Using the measured relative
variations, one can see that to maintain a +-S0 p stability over 25 mm of drift (Aw/w = + 2 % )
a maximum temperature variation of +7"C, and a maximum gas composition change of +1.6% can
be tolerated.
Mechanical tolerances and electrostatic deformations contribute, of course, directly
to the limiting accuracy, and may moreover produce electric field distortions. For large
size chambers one should also take into account the thermal expansion of the materials.
7.4 Behaviour o f d r i f t chambers i n magnetic f i e l d
We have seen in Section 4.5 that the presence of a magnetic field other than parallel
to the drift direction modifies both the drift velocity and the angle of the electron swarm.
In some cases this can be a perturbing factor, if a chamber is situated too close to a
stray field, in others instead installation and proper
is desired. Several structures have been studied that
strong magnetic fields. Figure 96, for example, shows
- C a t h o d e s - S e n s e w i r e - F i e l d w i r e
operation of a chamber inside a magnet
permit the use of a drift chamber in
the computed electron trajectories in
values of t e magnetic field, parallel to the
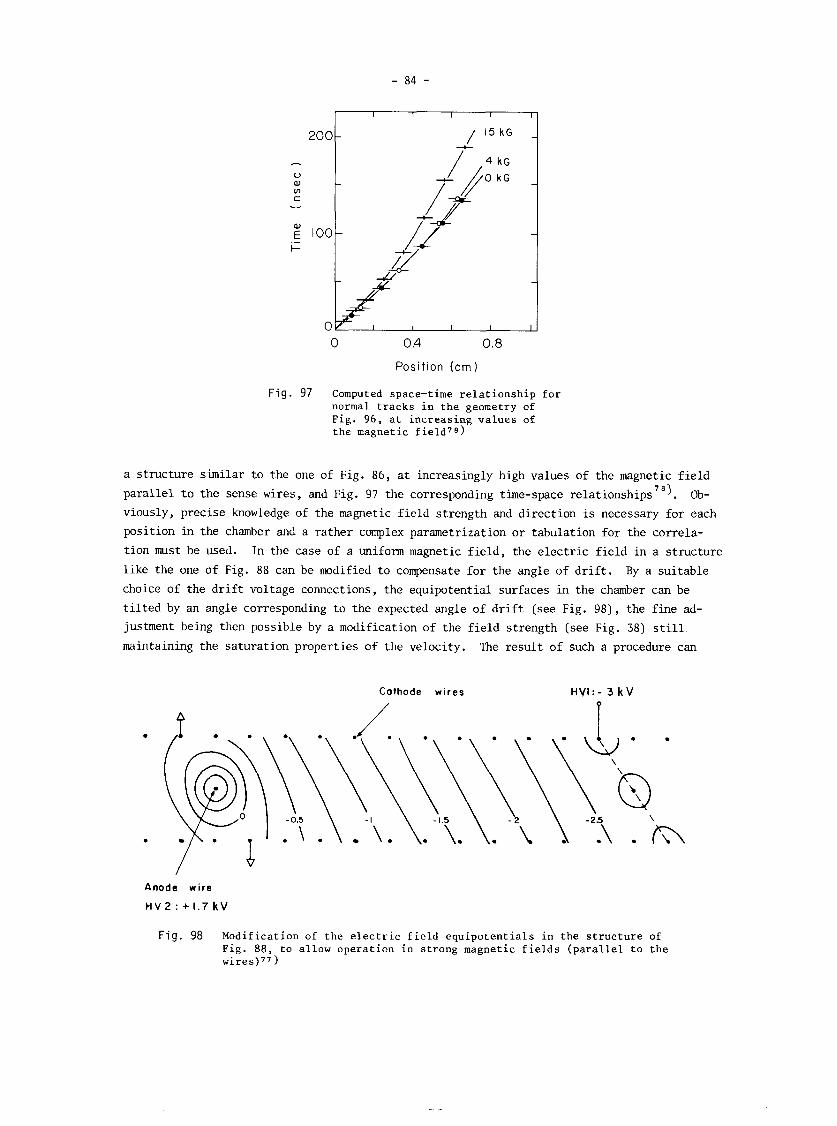
0 0.4 0.8
Position (cm)
F i g . 97 Computed space-time relationship for normal tracks in the geometry of Fig. 96, at increasing values of the magnetic f ield70)
a structure similar to the one of Fig. 86, at increasingly high values of the magnetic field
parallel to the sense wires, and Fig. 97 the corresponding time-space relationship^'^). Ob- viously, precise knowledge of the magnetic field strength and direction is necessary for each
position in the chamber and a rather complex parametrization or tabulation for the correla-
tion must be used. In the case of a uniform magnetic field, the electric field in a structure
like the one of Fig. 88 can be modified to compensate for the angle of drift. By a suitable choice of the drift voltage connections, the equipotential surfaces in the chamber can be
tilted by an angle corresponding to the expected angle of drift (see Fig. 98), the fine ad- justment being then possible by a modification of the field strength (see Fig. 38) still
maintaining the saturation properties of the velocity. The result of such a procedure can
Cothode w i r e s H V I : - 3 k V
- I - 2.5
' . . \ '
Anode w i r e
H V 2 : + 1 . 7 k V
F i g . 98 Modification of the electric field equipotentials in the structure of Fig. 88, to allow operation in strong magnetic fields (parallel to the wires)77 )
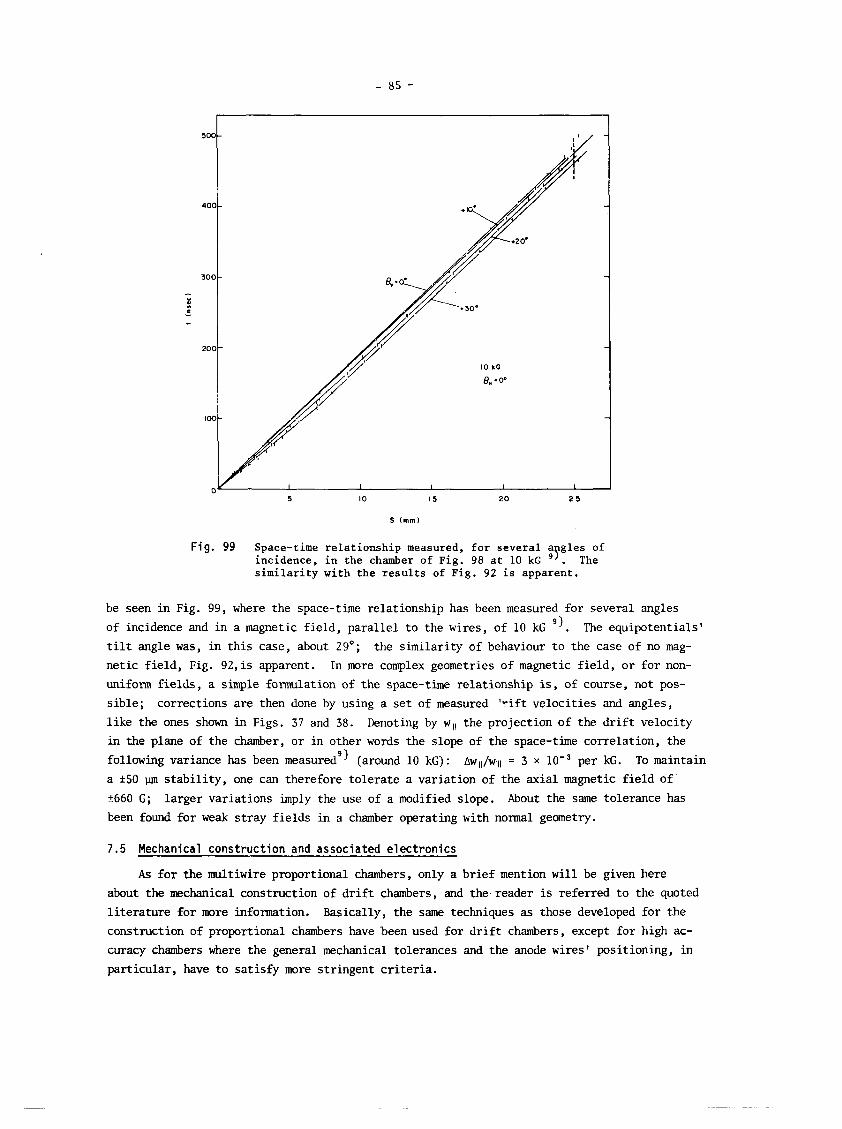
Fig. 99 Space-time relationship measured, for several a gles of incidence, in the chamber of Pig. 98 at 10 lcG ". The similarity with the results of Fig. 92 is apparent.
be seen in Fig. 99, where the space-time relationship has been measured for several angles
of incidence and in a magnetic field, parallel to the wires, of 10 kG The equipotentials'
tilt angle was, in this case, about 29'; the similarity of behaviour to the case of no mag-
netic field, Fig. 92,is apparent. In more complex geometries of magnetic field, or for non-
uniform fields, a simple fonnulation of the space-time relationship is, of course, not pos-
sible; corrections are then done by using a set of measured 'rift velocities and angles,
like the ones shown in Figs. 37 and 38. Denoting by W,, the projection of the drift velocity in the plane of the chamber, or in other words the slope of the space-time correlation, the
following variance has been measuredg) (around 10 kG): A W ~ ~ / W ~ ~ = 3 X 10-~ per kG. To maintain
a *SO pm stability, one can therefore tolerate a variation of the axial magnetic field of
2660 G; larger variations imply the use of a modified slope. About the same tolerance has
been found for weak stray fields in a chamber operating with normal geometry.
7.5 Mechanical construction and associated electronics
As for the multiwire proportional chambers, only a brief mention will be given here
about the mechanical construction of drift chambers, and the reader is referred to the quoted
literature for more information. Basically, the same techniques as those developed for the
construction of proportional chambers have been used for drift chambers, except for high ac-
curacy chambers where the general mechanical tolerances and the anode wires' positioning, in
particular, have to satisfy more stringent criteria.
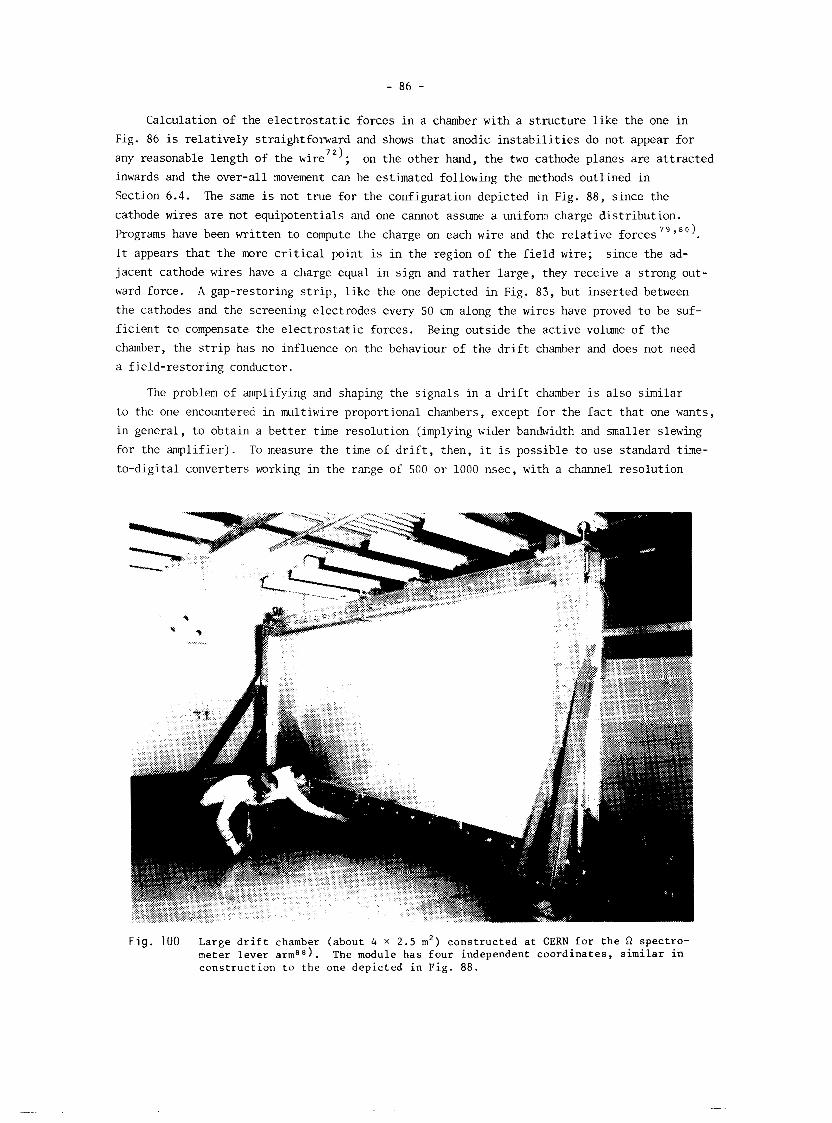
Calculation of the electrostatic forces in a chamber with a structure like the one in
Fig. 86 is relatively straightforward and shows that anodic instabilities do not appear for
any reasonable length of the wire7*); on the other hand, the two cathode planes are attracted
inwards and the over-all movement can be estimated following the methods outlined in
Section 6.4. The same is not true for the configuration depicted in Fig. 88, since the
cathode wires are not equipotentials and one cannot assume a uniform charge distribution.
Programs have been written to compute the charge on each wire and the relative forces 79,80)
It appears that the more critical point is in the region of the field wire; since the ad- jacent cathode wires have a charge equal in sign and rather large, they receive a strong out-
ward force. A gap-restoring strip, like the one depicted in Fig. 83, but inserted between the cathodes and the screening electrodes every 50 cm along the wires have proved to be suf-
ficient to compensate the electrostatic forces. Being outside the active volume of the chamber, the strip has no influence on the behaviour of the drift chamber and does not need
a field-restoring conductor.
The problem of amplifying and shaping the signals in a drift chamber is also similar
to the one encountered in multiwire proportional chambers, except for the fact that one wants,
in general, to obtain a better time resolution (implying wider bandwidth and smaller slewing
for the amplifier). To measure the time of drift, then, it is possible to use standard time-
to-digital converters working in the range of 500 or 1000 nsec, with a channel resolution
F i g . 100 Large d r i f t chamber (about 4 X 2.5 m') c o n s t r u c t e d a t CERN f o r t h e R spec t ro- meter l e v e r a r m a 8 ) . The module has f o u r independent c o o r d i n a t e s , s i m i l a r i n c o n s t r u c t i o n t o t h e one d e p i c t e d i n F ig . 88.
around 1 nsec (for the highest accuracy) or worse. However, several dedicated electronic cir- cuits have been developed for drift chambers either cheaper than the standard time-to-digital
converters, or allowing multihit-per-wire capability and faster conversion and read-out 81-87)
times . Some circuits are already commercially available. A very convenient mode of
operation has been incorporated in almost all dedicated drift time digitizers, which allows
the provision of the time reference, or time zero, as a late stop instead of as an early start
(as required in conventional units). Several hundred nsec are therefore available to the experimenter for making up a trigger selection, using external devices like scintillation
and terenkov counters, before permanently storing the drift chamber data.
Several large drift chamber systems are already or are close to being operational, in-
cluding many thousands of drift wires, at CERN and elsewhere. Figure 100 shows a high ac-
curacy drift chamber module developed at CERN8'); three such chambers approximately 4 X 2.5m2, have been constructed for the hega magnetic spectrometer.
BASIC BIBLIOGRAPHY
Sections 2 and 3
W. PRICE, Nuclear radiation detection (McGraw-Hill, New York, 1958).
J. W E , Nuclear radiation detectors (Methuen, New York, 1964).
D.H. PERKINS, Introduction to high energy physics (Addison-Wesley, Reading, Mass., 1972).
D.M. RITSON, Techniques of high energy physics (Interscience, New York, 1961).
N.A. DYSON, X-rays in atomic and nuclear physics (Longmans, London, 1973).
Section 4
S.C. BROWN, Basic data of plasma physics (Wiley, New York, 19%).
L.B. LOEB, Basic processes of gaseous electronics (University of California Press, Berkeley, 1961).
R.N. VARNEY and L.H. FISHER, Electron swarms, in Methods of experimental physics, (Ed. L. Marton) (Academic Press, New York, 1968), Vol. 7B p. 29.
R.H. HEALEY and J.W. REED, The behaviour of slow electrons in gases (Amalgamated Wireless, Sidney, 1941) .
L.G. (3RISTOPHOROU, Atomic and molecular radiation physics (Wiley, New York, 1971).
V. PALLADINO and B. SADOULET, Application of the classical theory of electrons in gases to multiwire proportional chambers and drift chambers, Report LBL-3013 (1974).
Section 5
S.A. KORFF, Electron and nuclear counters (Van Nostrand, New York, 1955).
W. FRANZEN and L.W. COCHRAN, Pulse ionization chambers and proportional counters, in Nuclear instruments and their uses (Ed. A.H. Snell) (Wiley, New York, 1956).
S.C. CORRAN and J.D. CRAGGS, Counting tubes, theory and applications (Butterworths, London, 1949).
Sections 6 and 7
G. CHARPAK, J3rolution of the automatic spark chambers, Annu. Rev. Nuclear Sci. - 20, 195 (1970).
F. SAULI, Principes de fonctiomement et dlutilisation des chambres proportiomelles multifils &m M6thodes exp6rimentales en physique nucleaire, Ecole d'Et6 de Physique thGorique, Les Houches, semptembre 1974 (SETAR, Ivry).
P. RICE-EVANS, Spark, streamer, proportional and drift chambers (Richelieu, London, 1974).
REFERENCES
1) G. Charpak, R. Bouclier, T. Bressani, J. Favier and E . zupanEiE, Nuclear Instrum. Methods - 62, 235 (1968).
2) See, for example, G. Charpak and F. Sauli, An interesting fall-out of high-energy physics techniques; the imaging of X-rays at various energies for biomedical applications, Proc. Conf. on Computer-Assisted Scanning, Padova, 21-24 April 1976 (Istituto di Fisica, Univ. di Padova, 1976) p. 592.
3) See, for example, D. Ritson, Techniques of high-energy physics (Interscience, New York, 1961).
4) U. Amaldi, Fisica delle radiazioni (Boringhieri, Torino, 1971) . 5) D. Jeanne, P. Lazeyras, I. Lehraus, R. Matthewson, W. Tejessy and M. Aderholz,
Nuclear Instrum. Methods 111, 287 (1973).
6) M. Aderholz, P. Lazeyras, I. Lehraus, R. Matthewson and W. Tejessy, Nuclear Instrum. Methods 118, 419 (1974).
7) H.L. Brandt and B. Peters, Phys. Rev. 74, 1828 (1948).
8) E.J. Kobetich and R. Katz, Phys. Rev. 170, 391 (1968). 9) A. Breskin, G. Charpak, F. Sauli, M. Atkinson and G. Schultz, Nuclear Instrum. Methods
124, 189 (1975).
10) N.A. Filatova, T.S. Nigmanov, V.P. Pugachevich, V.D. Riabtsov, M.D. Shafranov, E.N. Tsyganov, D.V. Uralsky, A.S. Vodopianov, F. Sauli and M. Atac, Study of drift chambers system for K-e scattering experiment at Fermi National Accelerator Laboratory, Nuclear Instrum. Methods 143, 17 (1977).
11) See, for example, J.E. Moyal, Phil. kg. 46, 263 (1955). 12) H.W. Fulbright, Ionization chambers in nuclear physics, in Encyclopedia of Physics
(Ed. S. Fliigge) (Springer-Verlag, Berlin, 1958), p. 1.
13) G. White Grodstein, National Bureau of Standard Circ. 583 (NBS, Washington, 1957). R.T. McGinnies, National Bureau of Standards, Supplement to Circ. 583 (NBS, Washington,
1959).
14) C.D. Brogles, D.A. Thomas and S.K. Ilaynes, Phys. Rev. - 89, 715 (1953).
15) J.E. Bateman, M.W. Waters and R.E. Jones, Nuclear Instrum. Methods 135, 235 (1976). 16) R.D. Evans, Compton effect, in Handbuch der Physik (Ed. J. Fliigge) (Springer-Verlag,
Berlin, 1958), Vol. 34, p. 218.
17) A.P. Jeavons, G. Charpak and R.J. Stubbs, Nuclear Instrum. Methods 124, 491 (1975). 18) L.B. Loeb, Basic processes of gaseous electronics (University of California Press,
Berkeley, 1961).
19) S.C. Curran and J.D. Craggs, Counting tubes, theory and applications (Butterworths, London, 1949).
G. Schultz, G. Charpak and F. Sauli, Mobilities of positive ions in some gas mixtures used in proportional and drift chambers, Rev. Physique Appliquge 2, 67 (1977) .
J. Townsend, Electrons in gases (Hutchinson, London, 1947).
S.C. Brown, Basic data of plasma physics (MIT Press, Cambridge, Mass., 1959).
W.N. English and G.C. Hanna, Canad. J. Phys. - 31, 768 (1953).
A. Breskin, Nuclear Instrum. Methods 141, 505 (1977).
V. Palladino and B. Sadoulet , Nuclear Instrum. Methods 128, 323 (1975).
G. Schultz, Etude d'un dgtecteur de particules 2 trSs haute prgcision spatiale (chambre 2 drift) ThSse, Universit6 L. Pasteur de Strasbourg (1976); also CERN EP Internal Report 76-19 (1976).
S.A. Korff, Electrons and nuclear counters (Van Nostrand, New York, 1946).
0. K. Allkofer, Spark chambers (Theimig, Miinchen, 1969) . R. Bouclier, G. Charpak and F. Sauli, Parallel-plate proportional counters for rela-
tivistic particles, CERN NP Internal Report 71-72 (1971).
G. Charpak, Filet 2 particules, Ecouverte (fgvrier 1972), p. 9.
H. Staub, Detection methods, in Experimental Nuclear Physics (Ed. E. Segrb) (Wiley, New Nork, 1953), Vol. 1, p. 1.
L. Malter, Phys. Rev. 50, 48 (1936).
G. Charpak, H.G. Fisher, C.R. G m , A. Minten, F. Sauli, G. Plch and G. Fliigge, Nuclear Instrum. Methods - 99, 279 (1972).
A. J.F. Den Boggende, A.C. Brinkman and W. de Graaff , J. Sci. Instrum. (J. Phys. E) - 2, 701 (1962).
W.S. Bawdeker, IEEE Trans. Nuclear Sci. NS-22, 282 (1975).
R.W. Hendricks, Rev. Sci. Instrum. 40, 1216 (1969).
G.A. Erskine, Nuclear Instrum. Methods 105, 565 (1972).
G. Charpak, Annu. Rev. Nuclear Sci. - 20, 195 (1970).
P. Morse and H. Feshbach, Methods of theoretical physics (McGraw Hill, New York, 1953).
E. Durand, Electrostatique (Masson, Paris, 1964) Vol. 1.
P.A. Souder, J. Sandweiss and D.A. Disco, Nuclear Instrum. Methods 109, 237 (1973).
Z. ~imzowski, Calculation of some factors governing multiwire proportional chambers, CERN NP Internal report 70-16 (1970).
T. Trippe, Minimm tension requirements for Charpak chambers' wires, CERN NP Internal Report 69-18 (1969).
P. Schilly, P. Steffen, J. Steinberger, T. Trippe, F. Vannucci, H. Wahl, K. Kleinknecht and V. Liith, Nuclear Instrum. Methods 91, 221 (1971).
G. Charpak, G. Fischer, A. Minten, L. Naumann, F. Sauli, G. Fliigge, Ch. Gottfried and P. Tirler, Nuclear Instrum. Methods - 97, 377 (1971).
A. Michelini and K. Zankel, A first design study of a large area proportional counter, CERN Internal Note CM/SPS/75/5 (1975) .
R. Bouclier, G. Charpak, E. Chesi, L. Dumps, H.G. Fischer, H.J. Hilke, P.G. Innocenti, G. Maurin, A. Minten, L. Naumann, F. Piuz, J.C. Santiard and 0. Ullaland, Nuclear Instrum. Methods 115, 235 (1974).
48) S. Majewski and F. Sauli, Support lines and beam killers for large size multiwire proportional chambers, CERN NP Internal Report 75-14 (1975).
49) R. Bouclier, G. Charpak, Z. ~imeowski, G. Fischer, F. Sauli, G. Coignet and G. Fliigge, Nuclear Instrum. Methods - 88, 149 (1970).
50) H. Fischer, F. Piuz, W.G. Schwille, G. Sinapsius and 0. Ullaland, Proc. Internat. Meeting on Proportional and Drift Chambers, Angle measurement and space resolution in proportional chambers, Dubna, 1975.
51) M. Breidenbach, F. Sauli and R. Tirler, Nuclear Instrum. Methods 108, 23 (1973). 52) S. Brehin, A. Diamant Berger, G. Marel, G. Tarte, R. Turlay, G. Charpak and F. Sauli,
Nuclear Instrum. Methods 123, 225 (1975).
53) G. Charpak and F. Sauli, Nuclear Instrum. Methods - 96, 363 (1971).
54) B. Sadoulet and B. Makowski, Space charge effects in multiwire proportional counters, CERN D PH II/PHYS 73-3 (1973).
55) S. Declay, J. Duchon, H. Louvel, J.P. Datry, J. Seguinot, P. Baillon, C. Briman, M. Ferro-Luzzi, J.M. Perreau and T. Ypsilantis, K-p and K-n final states in Kd collisions between 1.2 and 2.2 GeV/c, submitted to Nuclear Phys. B, May 1976.
56) S. Parker, R. Jones, J. Kadyk, M.L. Stevenson, T. Katsure, V.Z. Peterson and D. Yount, Nuclear Instrum. Methods - 97, 181 (1971).
57) E. Bloom, R.L.A. Cottrell, G. Johnson, C. Prescott, R. Siemann and S. Stein, lclear Instrum. Methods - 39, 259 (1972).
58) R. Lanza and N. Hopkins, Nuclear Instrum. Methods 102, 131 (1972).
59) J. Buchanan, L. Gulson, N. Galitzsch, E.V. hgerford, G.S. Mutchler, R. Persson, M.L. Scott, J. Windish and G.C. Phillips, Nuclear Instrum. Methods 2, 159 (1972).
60) K.B. Burns, B.R. G m o n , T.A. Nunamaker , L.W. Who and S.C. Wright, Nuclear Instrum. Methods 106, 171 (1973).
61) L. Baksay, A. Bohm, H. Foeth, A. Staude, W. Lockman, T. Meyer, J. Rander, P. Schlein, R. Webb, M. Bozzo, R. Ellis, B. Naroska, C. Rubbia and P. Strolin, Nuclear Instrum. Methods 133, 219 (1976).
62) J. Lindsay, Ch. Millerin, J.C. Tarl6, H. Verweij and H. Wendler, A general-purpose amplifier and read-out system for multiwire proportional chambers, CERN 74-12 (1974).
63) LeCroy Model 2720 and LD604 (LeCroy Research Systems Co., New York).
64) FILAS, 8-channel MOS circuit for proportional chambers (Soci6tE pour 1'Etude et la Fabrication de Circuits int6grEs sp6ciaux, Grenoble, France).
65) R. Grove, K. Lee, V. Perez-Mendez and J. Sperinde, Nuclear Instrum. Methods 89, 257 (1970).
66) D.M. Lee, J.E. Sobottka and H.A. Thiessen, Los Alamos Report LA-4968-MS (1972).
67) F. Bradamante, S. Connetti, C. Dam, G. Fidecaro, M. Fidecaro, M. Giorgi, A. Penzo, L. Piemontese, A. Prokofiev, M. Renevey, P. Schiavon and A. Vascotto, Electric delay-line read-out for multiwire proportional chambers in Proc. Internat. Conf. on Instrumentation for High-Energy Physics, Frascati, 1973 (Lab. Naz. CNEN, Frascati, 1973).
68) J. Hough and R.W.P. Drever, Nuclear Instrum. Methods 103, 365 (1972).
69) H. Foeth, R. Hammarstrtim and C. Rubbia, Nuclear Instrum. Methods - 109, 521 (1973).
70) J. Saudinos, J.C. Duchazeaubeneix, C. Laspalles and R. Chaminade, Nuclear Instrum. Methods Q, 77 (1973).

A.H. Walenta, J. Heintze and B. Schiirlein, Nuclear Instrum. Methods 92, 373 (1971) . D.C. Cheng, W.A. Kozanecki, R.L. Piccioni, C. Rubbia, R.L. Sulak, H . J . Weedon and
J. Wittaker, Nuclear Instrum. Methods 117, 157 (1974).
Experiment R209 a t CERN (H. Newman, private communication).
G. Charpak, F. Sauli and W. Duinker, Nuclear Instrum. Methods 108, 413 (1973).
G. Marel, P. Bloch, S. Brehin, B. Devaux, A.M. Diamant-Berger, C. Leschevin, J. Maillard, Y. Malbequi, H. Martin, A. Patoux, J. Pel le , J. Plancoulaine, G . Tarte and R. Turlay, Large planar d r i f t chambers, Nuclear I n s t m . Methods 141, 43 (1977).
M. Atac and W.E. Taylor, Nuclear Instrum. Methods - 120, 147 (1974).
A. Breskin, G. Charpak, B. Gabioud, F. Sauli, N. Trautner, W. Duinker and G. Schultz, Nuclear Instrum. Methods 119, 9 (1974).
B. Sadoulet and A. Litke, Nuclear Instrum. Methods 129, 349 (1975).
F. Bourgeois and J.P. Dufey, Programmes de simulation des chambres 5 d r i f t en champs magn6tique, CERN NP Internal Report 73-11 (1973).
A. Wylie, Same calculations of d r i f t chamber e l ec t r i c f i e ld s , CERN NP Internal Report 74-7, September 1974.
B. Schurlein, W. Farr, H.W. Siebert and A.H. Walenta, Nuclear Instrum. Methods 114, 587 (1974).
E. Schuller, A two-clock sensing system, a new time-to-digital converter, CERN NP Internal Report 73-15 (1973).
H. Verweij, Electronics for Drif t Chambers, IEEE Trans. Nuclear Sci. NS-22 437 (1975). See also: DTR, Drift Time Recorder, CERN Type EP247.
W. Sippach, Drif t chambers electronics, NEVIS Internal Report (1975).
C. Rubbia, New electronics for d r i f t chambers, CERN NP Internal Report 75-10 (1975).
M. Atac and T. Droege, Notes on d r i f t chambers time d ig i t ize r meeting, Fermilab Int . Note lM-553 (April 1975).
LeCroy Model 2770A, Drift chambers d ig i t i ze r .
A. Dalluge and M. Jeanrenaud, private co~munication a t CERN.
lrn~rlrnb au CERN. Prlx : 4.15 Fr