Ezzati, Majid; Bentham, James; Di Cesare, Mariachiara...
23
Ezzati, Majid; Bentham, James; Di Cesare, Mariachiara; Bilano, Ver; Bixby, Honor; Zhou, Bin; Stevens, Gretchen A; Riley, Leanne M; Tad- dei, Cristina; Hajifathalian, Kaveh; Lu, Yuan; Savin, Stefan; Cowan, Melanie J; Paciore, Christopher J; Chirita-Emandi, Adela; Hayes, Alison J; Katz, Joanne; Kelishadi, Roya; Kengne, Andre Pascal; Khang, Young-Ho; Laxmaiah, Avula; Li, Yanping; Ma, Jun; Miranda, J Jaime; Mostafa, Aya; Neovius, Martin; Padez, Cristina; Ram- pal, Lekhraj; Zhu, Aubrianna; Bennet, James E; Danaei, Goodarz; Bhutta, Zulfiqar A; Ezzati, Majid; Abarca-Gomez, Leandra; Abdeen, Ziad A; Hamid, Zargar Abdul; Abu-Rmeileh, Niveen M; Acosta- Cazares, Benjamin; Acuin, Cecilia; Adams, Robert J; Aekplakorn, Wichai; Afsana, Kaosar; Aguilar-Salinas, Carlos A; Agyemng, Charles; Ahmadvand, Alireza; Ahrens, Wolfgang; Ajlouni, Kamel; Akhtaeva, Nazgul; Al-Hazzaa, Hazzaa M; Al-Othman, Amani Rashed; Al-Raddadi, Rajaa; AlBuhairan, Fadia; AlDhukai, Shahla; Ali, Mohamed M; Ali, Osman; Alkerwi, Ala’a; Alvarez-Pedrerol, Mar; Aly, Eman; Amara- purkar, Deepak N; Amouyel, Philippe; Amuzu, Antoinette; Ander- sen, Lars Bo; Anderssen, Sigmund A; Andrade, Dolores S; Angquist, Lars H; Anjana, Ranjit Mohan; Aounallah-Skhiri, Hajer; Araujo, Joana; Arianse, Inger; Aris, Tahir; Arlappa, Nimmathota; Arveiler, Dominique; Aryal, Krishna K; Aspelund, Thor; Assah, Felix K; As- suncao, Maria Cecilia F; Aung, May Soe; Avdicova, Maria; Azevedo, Ana; Azizi, Fereidoun; Babu, Bontha V; Bahijri, Suhad; Baker, Jen- nifer L; Balakrishna, Nagalla; Bamoshmoosh, Mohamed; Banach, Maciej; Bandosz, Piotr; Banegas, Jose R; Barbagallo, Carlo M; Barcelo, Alberto; Barkat, Amina; Barros, Aluisio JD; Barros, Mauro VG; Bata, Iqbal; Batieha, Anwar M; Batista, Rosangela L; Batyrbek, Assembekov; Baur, Louise A; Beaglehole, Robert; Ben Romdhane, Habiba; Benedics, Judith; Benet, Mikhail; Bennet, James E; Bern- abe, Antonio; Bernotiene, Gailute; Bettiol, Heloisa; Bhagyalaxmi, Aroor; Bharadwaj, Sumit; Bhargava, Santosh K; Bhatti, Zaid; Bhutta, Zulfiqar A; Bi, Hongsheng; Bi, Yufang; Biehl, Anna; Bikbov, Mukhar- ram; Bista, Bihungum; Bjelica, Dusko J; Bjerregaard, Peter; Bjertnes, Espen; Bjness, Marius B; Bjorkelund, Cecilia; Blokstra, Anneke; Bo, Simona; Bobak, Martin; Boddy, Lynne M; Boehm, Bernhard O; Boe- ing, Heiner; Boggia, Jose G; Boissonnet, Carlos P; Bonaccio, Mari- alaura; Bongard, Vanina; Bovet, Pascal; Braeckevelt, Lien; Braeck- man, Lutgart; Bragt, Marjolijn CE; Brajkovich, Imperia; Branca, Francesco; Breckenkamp, Juergen; Breda, Joao; Brenner, Hermann; Brewster, Lizzy M; Brian, Garry R; Brinduse, Lacramioara; Bruno, Graziella; Bueno-de-Mesquita, HB; Bugge, Anna; Buoncristiano, Marta; Burazeri, Genc; Burns, Con; Cabrera de Leon, Antonio; Cacciot- tolo, Joseph; Cai, Hui; Cama, Tilema; Cameron, Christine; Camola,
Transcript of Ezzati, Majid; Bentham, James; Di Cesare, Mariachiara...
Ezzati, Majid; Bentham, James; Di Cesare, Mariachiara; Bilano, Ver;Bixby, Honor; Zhou, Bin; Stevens, Gretchen A; Riley, Leanne M; Tad-dei, Cristina; Hajifathalian, Kaveh; Lu, Yuan; Savin, Stefan; Cowan,Melanie J; Paciore, Christopher J; Chirita-Emandi, Adela; Hayes,Alison J; Katz, Joanne; Kelishadi, Roya; Kengne, Andre Pascal;Khang, Young-Ho; Laxmaiah, Avula; Li, Yanping; Ma, Jun; Miranda,J Jaime; Mostafa, Aya; Neovius, Martin; Padez, Cristina; Ram-pal, Lekhraj; Zhu, Aubrianna; Bennet, James E; Danaei, Goodarz;Bhutta, Zulfiqar A; Ezzati, Majid; Abarca-Gomez, Leandra; Abdeen,Ziad A; Hamid, Zargar Abdul; Abu-Rmeileh, Niveen M; Acosta-Cazares, Benjamin; Acuin, Cecilia; Adams, Robert J; Aekplakorn,Wichai; Afsana, Kaosar; Aguilar-Salinas, Carlos A; Agyemng, Charles;Ahmadvand, Alireza; Ahrens, Wolfgang; Ajlouni, Kamel; Akhtaeva,Nazgul; Al-Hazzaa, Hazzaa M; Al-Othman, Amani Rashed; Al-Raddadi,Rajaa; AlBuhairan, Fadia; AlDhukai, Shahla; Ali, Mohamed M; Ali,Osman; Alkerwi, Ala’a; Alvarez-Pedrerol, Mar; Aly, Eman; Amara-purkar, Deepak N; Amouyel, Philippe; Amuzu, Antoinette; Ander-sen, Lars Bo; Anderssen, Sigmund A; Andrade, Dolores S; Angquist,Lars H; Anjana, Ranjit Mohan; Aounallah-Skhiri, Hajer; Araujo,Joana; Arianse, Inger; Aris, Tahir; Arlappa, Nimmathota; Arveiler,Dominique; Aryal, Krishna K; Aspelund, Thor; Assah, Felix K; As-suncao, Maria Cecilia F; Aung, May Soe; Avdicova, Maria; Azevedo,Ana; Azizi, Fereidoun; Babu, Bontha V; Bahijri, Suhad; Baker, Jen-nifer L; Balakrishna, Nagalla; Bamoshmoosh, Mohamed; Banach,Maciej; Bandosz, Piotr; Banegas, Jose R; Barbagallo, Carlo M; Barcelo,Alberto; Barkat, Amina; Barros, Aluisio JD; Barros, Mauro VG;Bata, Iqbal; Batieha, Anwar M; Batista, Rosangela L; Batyrbek,Assembekov; Baur, Louise A; Beaglehole, Robert; Ben Romdhane,Habiba; Benedics, Judith; Benet, Mikhail; Bennet, James E; Bern-abe, Antonio; Bernotiene, Gailute; Bettiol, Heloisa; Bhagyalaxmi,Aroor; Bharadwaj, Sumit; Bhargava, Santosh K; Bhatti, Zaid; Bhutta,Zulfiqar A; Bi, Hongsheng; Bi, Yufang; Biehl, Anna; Bikbov, Mukhar-ram; Bista, Bihungum; Bjelica, Dusko J; Bjerregaard, Peter; Bjertnes,Espen; Bjness, Marius B; Bjorkelund, Cecilia; Blokstra, Anneke; Bo,Simona; Bobak, Martin; Boddy, Lynne M; Boehm, Bernhard O; Boe-ing, Heiner; Boggia, Jose G; Boissonnet, Carlos P; Bonaccio, Mari-alaura; Bongard, Vanina; Bovet, Pascal; Braeckevelt, Lien; Braeck-man, Lutgart; Bragt, Marjolijn CE; Brajkovich, Imperia; Branca,Francesco; Breckenkamp, Juergen; Breda, Joao; Brenner, Hermann;Brewster, Lizzy M; Brian, Garry R; Brinduse, Lacramioara; Bruno,Graziella; Bueno-de-Mesquita, HB; Bugge, Anna; Buoncristiano, Marta;Burazeri, Genc; Burns, Con; Cabrera de Leon, Antonio; Cacciot-tolo, Joseph; Cai, Hui; Cama, Tilema; Cameron, Christine; Camola,
Jose; Can, Gunay; Candido, Ana PCC; Capanzana, Mario; Capuano,Vincenzo; Cardoso, Viviane C; Carlsson, Axel C; Carvalho, MariaJ; Casanueva, Felipe F; Casas, Juan Pablo; Caserta, Carmelo A;Chamukuttan, Snehalatha; Chan, Angelique W; Chan, Queenie; Chaturvedi,Himanshu K; Chaturvedi, Nishi; Chen, Chien-Jen; Chen, Fangfang;Chen, Huashuai; Chen, Shuohua; Chen, Zhengming; Cheng, Ching-Yu; Chetrit, Angela; Chikova-Iscener, Ekaterina; Chiolero, Arnaud;Chiou, Shu-Ti; Chirlaque, Maria-Dolores; Cho, Belong; Cho, Yumi;Christensen, Kaare; Christofaro, Diego G; Chudek, Jerzy; Cifkova,Renata; Cinteza, Eliza; Claessens, Frank; Clays, Els; Concin, Hans;Confortin, Susana C; Cooper, Cyrus; Cooper, Rachel; Coppinger,Tara C; Costanzo, Simona; Cottel, Dominique; Cowell, Chris; Craig,Cora L; Crujeiras, Ana B; Cucu, Alexandra; D’Arrigo, Graziella;d’Orsi, Eleonora; Dallongeville, Jean; Damasceno, Albertino; Dams-gaard, Camilla T; Danae, Goodarz; Dankner, Rachel; Dantoft, ThomasM; Dastgiri, Saeed; Dauchet, Luc; Davletov, Kairat; De Backer, Guy;De Bacquer, Dirk; De Curtis, Amalia; de Gaetano, Giovanni; DeHenauw, Stefaan; de Oliveira, Paula Duarte; De Ridder, Karin; DeSmedt, Delphine; Deepa, Mohan; Deev, Alexander D; Dehghan, Ab-bas; Delisle, Helene; Delpeuch, Francis; Deschamps, Valerie; Dhana,Klodian; Di Castelnuovo, Augusto F; Dias-da-Costa, Juvenal Soares;Diaz, Alejandro; Dika, Zivka; Djalalinia, Shirin; Do, Ha TP; Dob-son, Annette J; Donati, Maria Benedetta; Donfrancesco, Chiara;Donoso, Silvana P; Doering, Angela; Dorobantu, Maria; Dorosty,Ahmad Reza; Doua, Kouamelan; Drygas, Wojciech; Duan, Jia Li;Duante, Charmaine; Duleva, Vesselka; Dulskiene, Virginija; Dzerve,Vilnis; Dziankowska-Zaborszczyk, Elzbieta; Egbagbe, Eruke E; Eg-gertsen, Robert; Eiben, Gabriele; Ekelund, Ulf; El Ati, Jalila; Elliott,Paul; Engle-Stone, Reina; Erasmus, Rajiv T; Erem, Cihangir; Erik-sen, Louise; Eriksson, Johan G; Escobedo, Jorge; Evans, Alun; Faeh,David; Fall, Caroline H; Sant’Angelo, Victoria Farrugia; Farzadfar,Farshad; Felix-Redondo, Francisco J; Ferguson, Trevor S; Fernan-des, Romulo A; Fernandez-Berges, Daniel; Ferrante, Daniel; Ferrari,Marika; Ferreccio, Catterina; Ferrieres, Jean; Finn, Joseph D; Fis-cher, Krista; Monterubio Flores, Eric; Foeger, Bernhard; Foo, LengHuat; Forslund, Ann-Sofie; Forsner, Maria; Fouad, Heba M; Fran-cis, Damian K; Franco, Maria do Carmo; Franco, Oscar H; Frontera,Guillermo; Fuchs, Flavio D; Fuch, Sandra C; Fujita, Yuki; Furusawa,Takuro; Gaciong, Zbigniew; Gafencu, Mihai; Galeone, Daniela; Gal-vano, Fabio; Garcia-de-la-Hera, Manoli; Gareta, Dickman; Garnett,Sarah P; Gaspoz, Jean-Michel; Gasull, Magda; Gates, Louise; Geiger,Harald; Geleijnse, Johanna M; Ghasemian, Anoosheh; Giampaoli, Si-mona; Gianfagna, Francesco; Gill, Tiffany K; Giovannelli, Jonathan;Giwerman, Aleksander; Godos, Justyna; Gogen, Sibel; Goldsmith,Rebecca A; Goltzman, David; Goncalves, Helen; Gonzalez-Leon, Mar-got; Gonzalez-Rivas, Juan P; Gonzalez-Gross, Marcela; Gottrand,Frederic; Graca, Antonio Pedro; Graff-Iversen, Sidsel; Grafnetter,Dusan; Grajda, Aneta; Grammatikopoulou, Maria G; Gregor, RonaldD; Grodzicki, Tomasz; Grontved, Anders; Grosso, Giuseppe; Gruden,Gabriella; Grujic, Vera; Gu, Dongfeng; Gualdi-Russo, Emanuela;
2

Guallar-Castillon, Pilar; Guan, Ong Peng; Gudmundsson, Elias F;Gudnason, Vilmundur; Guerrero, Ramiro; Guessous, Idris; Guimaraes,Andre L; Gulliford, Martin C; Gunnlaugsdottir, Johanna; Gunter,Marc; Guo, Xiuhua; Guo, Yin; Gupta, Prakash C; Gupta, Rajeev;Gureje, Oye; Gurzkowska, Beata; Gutierrez, Laura; Gutzwiller, Fe-lix; Hadaegh, Farzad; Hadjigeorgiou, Charalambos A; Si-Ramlee,Khairil; Halkjaer, Jytte; Hambleton, Ian R; Hardy, Rebecca; Kumar,Rachakulla Hari; Hassapidou, Maria; Hata, Jun; Hayes, Alison J;He, Jiang; Heidinger-Felso, Regina; Heinen, Mirjam; Hendriks, Mar-leen Elisabeth; Henriques, Ana; Cadena, Leticia Hernandez; Her-rala, Sauli; Herrera, Victor M; Herter-Aeberli, Isabelle; Heshmat,Ramin; Hihtaniemi, Ilpo Tapani; Ho, Sai Yin; Ho, Suzanne C; Hobbs,Michael; Hofman, Albert; Hopman, Wilma M; Horimoto, AndreaRVR; Hormiga, Claudia M; Horta, Bernardo L; Houti, Leila; Howitt,Christina; Htay, Thein Thein; Htet, Aung Soe; Htike, Maung MaungThan; Hu, Yonghua; Huerta, Jose Maria; Petrescu, Constanta Huidu-mac; Huisman, Martijn; Husseini, Abdullatif; Chinh, Nguyen Huu;Huybrechts, Inge; Hwalla, Nahla; Hyska, Jolanda; Iacoviello, Licia;Iannone, Anna G; Ibarluzea, Jesus M; Ibrahim, Mohsen M; Ikeda,Nayu; Ikram, M Arfan; Irazola, Vilma E; Islam, Muhammad; Ismail,Aziz al-Safi; Ivkovic, Vanja; Iwasaki, Masanori; Jackson, Rod T; Ja-cobs, Jeremy M; Jaddou, Hashem; Jafar, Tazeen; Jamil, Kazi M;Jamrozik, Konrad; Janszky, Imre; Jarani, Juel; Jasienska, Grazyna;Jelakovic, Ana; Jelakovic, Bojan; Jennings, Garry; Jeong, Seung-Lyeal; Jiang, Chao Qiang; Magaly Jimenez-Acosta, Santa; Joffres,Michel; Johansson, Mattias; Jonas, Jost B; Jorgensen, Torben; Joshi,Pradeep; Jovic, Dragana P; Jozwiak, Jacek; Juolevi, Anne; Jurak,Gregor; Juresa, Vesna; Kaaks, Rudolf; Kafatos, Anthony; Kajantie,Eero O; Kalter-Leibovici, Ofra; Kamaruddin, Nor Azmi; Kapantais,Efthymios; Karki, Khem B; Kasaeian, Amir; Katz, Joanne; Kauha-nen, Jussi; Kaur, Prabhdeep; Kavousi, Maryam; Kazakbaeva, Gyulli;Keil, Ulrich; Boker, Lital Keinan; Keinanen-Kiukaanniemi, Sirkka;Kelishadi, Roya; Kelleher, Cecily; Kemper, Han CG; Kengne, AndreP; Kerimkulova, Alina; Kersting, Mathilde; Key, Timothy; Khader,Ousef Saleh; Khalili, Davood; Khang, Young-Ho; Khateeb, Moham-mad; Khaw, Kay-Tee; Khouw, Ilse MSL; Kiechl-Kohlendorfer, Ur-sula; Kiech, Stefan; Killewo, Japhet; Kim, Jeongseon; Kim, Yeon-Yong; Klimont, Jeannette; Klumbiene, Jurate; Knoflach, Michael;Koirala, Bhawesh; Kolle, Elin; Kolsteren, Patrick; Korrovits, Paul;Kos, Jelena; Koskinen, Seppo; Kouda, Katsuyasu; Kovacs, ViktoriaA; Kowlessur, Sudhir; Koziel, Slawomir; Kratzer, Wolfgang; Kriem-ler, Susi; Kristensen, Peter Lund; Krokstad, Steinar; Kromhout,Daan; Kruger, Herculina S; Kubinova, Ruzena; Kuciene, Renata;Kuh, Diana; Kujala, Urho M; Kulaga, Zbigniew; Kumar, R Krishna;Kunesova, Marie; Kurjata, Pawel; Kusuma, Yadlapalli S; Kuulas-maa, Kari; Kyobutungi, Catherine; Quang, Ngoc La; Laamiri, Fa-tima Zahra; Laatikainen, Tina; Lachat, Carl; Laid, Youcef; Lam, TaiHing; Landrove, Orlando; Lanska, Vera; Lappas, Georg; Larijani,Bagher; Laugsand, Lars E; Lauria, Laura; Laxmaiah, Avula; Khanh,Le Nguyen Bao; Tuyen, D Le; Lebanan, May Antonnette O; Leclercq,
3
Catherine; Lee, Jeannette; Lee, Jeonghee; Lehtimaki, Terho; Leon-Munoz, Luz M; Levitt, Naomi S; Li, Yanping; Lilly, Christa L; Lim,Wei-Yen; Fernanda Lima-Costa, M; Lin, Hsien-Ho; Lin, Xu; Lind,Lars; Linneberg, Allan; Lissner, Lauren; Litwin, Mieczyslaw; Liu,Jing; Loit, Helle-Mai; Lopes, Luis; Lorbeer, Roberto; Lotufo, PauloA; Eugenio Lozano, Jose; Luksiene, Dalia; Lundqvist, Annamari;Lunet, Nuno; Lytsy, Per; Ma, Guansheng; Ma, Jun; Machado-Coelho,George LL; Machado-Rodrigues, Aristides M; Machi, Suka; Maggi,Stefania; Magliano, Dianna J; Magriplis, Emmanuella; Mahaletchumy,Alagappan; Maire, Bernard; Majer, Marjeta; Makdisse, Marcia; Malekzadeh,Reza; Malhotra, Rahul; Rao, Kodavanti Mallikharjuna; Malyutina,Sofia; Manios, Yannis; Mann, Jim I; Manzato, Enzo; Margozzini,Paula; Markaki, Anastasia; Markey, Oonagh; Marques, Larissa P;Marques-Vidal, Pedro; Marrugat, Jaume; Martin-Prevel, Yves; Mar-tin, Rosemarie; Martorell, Reynaldo; Martos, Eva; Marventano, Ste-fano; Masoodi, Shariq R; Mathiesen, Ellisiv B; Matijasevich, Ali-cia; Matsha, Tandi E; Mazur, Artur; Mbanya, Jean Claude N; Mc-Farlane, Shelly R; McGarvey, Stephen T; McKee, Martin; McLac,Stela; McLean, Rachael M; McLean, Scott B; McNulty, Breige A; Yu-sof, Safiah Md; Mediene-Benchekor, Sounnia; Medzioniene, Jurate;Meirhaeghe, Aline; Meisfjord, Jorgen; Meisinger, Christa; Menezes,Ana Maria B; Menon, Geetha R; Mensink, Gert BM; Meshram, In-drapal I; Metspalu, Andres; Meyer, Haakon E; Mi, Jie; Michaelsen,Kim F; Michels, Nathalie; Mikkel, Kairit; Miller, Jody C; Minderico,Claudia S; Miquel, Juan Francisco; Miranda, J Jaime; Mirkopoulou,Daphne; Mirrakhimov, Erkin; Misigoj-Durakovic, Marjeta; Mistretta,Antonio; Mocanu, Veronica; Modesti, Pietro A; Mohamed, MostafaK; Mohammad, Kazem; Mohammadifard, Noushin; Mohan, Viswanathan;Mohanna, Salim; Yusoff, Muhammad Fadhli Mohd; Molbo, Drude;Mollehave, Line T; Moller, Niels C; Molnar, Denes; Momenan, Amirab-bas; Mondo, Charles K; Monterrubio, Eric A; Monyeki, KotsediDaniel K; Moon, Jin Soo; Moreira, Leila B; Morejo, Alain; Moreno,Luis A; Morgan, Karen; Mortensen, Erik Lykke; Moschonis, George;Mossakowska, Malgorzata; Mostafa, Aya; Mota, Jorge; Mota-Pinto,Anabela; Motlag, Mohammad Esmaeel; Motta, Jorge; Mu, ThetThet; Muc, Magdalena; Muiesan, Maria Lorenza; Mueller-Nurasyid,Martina; Murphy, Neil; Mursu, Jaakko; Murtagh, Elaine M; Musil,Vera; Nabipour, Iraj; Nagel, Gabriele; Naidu, Balkish M; Naka-mura, Harunobu; Namesna, Jana; Nang, Ei Ei K; Nangia, VinayB; Nankap, Martin; Narake, Sameer; Nardone, Paola; Navarrete-Munoz, Eva Maria; Neal, William A; Nenko, Ilona; Neovius, Mar-tin; Nervi, Flavio; Nguyen, Chung T; Nguyen, Nguyen D; Quang,Ngoc Nguye; Nieto-Martinez, Ramfis E; Ning, Guang; Ninomiya,Toshiharu; Nishtar, Sania; Noale, Marianna; Noboa, Oscar A; No-rat, Teresa; Norie, Sawada; Noto, Davide; Al Nsour, Mohannad;O’Reilly, Dermot; Obreja, Galina; Oda, Eiji; Oehlers, Glenn; Oh,Kyungwon; Ohara, Kumiko; Olafsson, Orn; Anselmo Olinto, MariaTeresa; Oliveira, Isabel O; Oltarzewski, Maciej; Omar, Mohd Aza-hadi; Onat, Altan; Ong, Sok King; Ono, Lariane M; Ordunez, Pedro;Ornelas, Rui; Ortiz, Ana P; Osler, Merete; Osmond, Clive; Ostojic,
4

Sergej M; Ostovar, Afshin; Otero, Johanna A; Overvad, Kim; Owusu-Dabo, Ellis; Paccaud, Fred Michel; Padez, Cristina; Pahomova, Elena;Pajak, Andrzej; Palli, Domenico; Palloni, Alberto; Palmieri, Luigi;Pan, Wen-Harn; Panda-Jonas, Songhomitra; Pandey, Arvind; Panza,Francesco; Papandreou, Dimitrios; Park, Soon-Woo; Parnell, Win-some R; Parsaeian, Mahboubeh; Pascanu, Ionela M; Patel, Nikhil D;Pecin, Ivan; Pednekar, Mangesh S; Peer, Nasheeta; Peeters, PetraH; Peixoto, Sergio Viana; Peltonen, Markku; Pereira, Alexandre C;Perez-Farinos, Napoleon; Perez, Cynthia M; Peters, Annette; Petke-viciene, Janina; Petrauskiene, Ausra; Peykari, Niloofar; Son, ThaiPham; Pierannunzio, Daniela; Pigeo, Iris; Pikhart, Hynek; Pilav,Aida; Pilotto, Lorenza; Pistelli, Francesco; Pitakaka, Freda; Piwon-ska, Aleksandra; Plans-Rubio, Pedro; Poh, Bee Koon; Pohlabeln,Hermann; Pop, Raluca M; Popovic, Stevo R; Porta, Miquel; Porte-gies, Marileen LP; Posch, Georg; Poulimeneas, Dimitrios; Pouraram,Hamed; Pourshams, Akram; Poustchi, Hossein; Pradeepa, Rajen-dra; Prashant, Mathur; Price, Jacqueline F; Puder, Jardena J; Pud-ule, Iveta; Puiu, Maria; Punab, Margus; Qasrawi, Radwan F; Qor-bani, Mostafa; Tran, Quoc Bao; Radic, Ivana; Radisauskas, Ricar-das; Rahman, Mahfuzar; Rahman, Mahmudur; Raitakari, Olli; Raj,Manu; Rao, Sudha Ramachandra; Ramachandran, Ambady; Ramke,Jacqueline; Ramos, Elisabete; Ramos, Rafel; Rampal, Lekhraj; Ram-pal, Sanjay; Rascon-Pacheco, Ramon A; Redon, Josep; Reganit, PaulFerdinand M; Ribas-Barba, Lourdes; Ribeiro, Robespierre; Riboli,Elio; Rigo, Fernando; de Wit, Tobias F Rinke; Rito, Ana; Ritti-Dias,Raphael M; Rivera, Juan A; Robinson, Sian M; Robitaille, Cyn-thia; Rodrigues, Daniela; Rodriguez-Artalejo, Fernando; del CristoRodriguez-Perez, Maria; Rodriguez-Villamizar, Laura A; Rojas-Martinez,Rosalba; Rojroongwasinkul, Nipa; Romaguera, Dora; Ronkainen, Kimmo;Rosengren, Annika; Rouse, Ian; Roy, Joel GR; Rubinstein, Adolfo;Ruhli, Frank J; Ruiz-Betancourt, Blanca Sandra; Russo, Paola; Rutkowski,Marcin; Sabanayagam, Charumathi; Sachdev, Harshpal S; Saidi, Olfa;Salanave, Benoit; Martinez, Eduardo Salazar; Salmeron, Diego; Salo-maa, Veikko; Salonen, Jukka T; Salvetti, Massimo; Sanchez-Abanto,Jose; Sandjaja, ; Sans, Susana; Marina, Loreto Santa; Santos, DianaA; Santos, Ina S; Santos, Osvaldo; dos Santos, Renata Nunes; Santos,Rute; Saramies, Jouko L; Sardinha, Luis B; Sarrafzadegan, Nizal;Saum, Kai-Uwe; Savva, Savvas; Savy, Mathilde; Scazufca, Marcia;Rosario, Angelika Schaffrath; Schargrodsky, Herman; Schienkiewitz,Anja; Schipf, Sabine; Schmidt, Carsten O; Schmidt, Ida Maria; Schultsz,Constance; Schutte, Aletta E; Sein, Aye Aye; Sen, Abhijit; Senbanjo,Idowu O; Sepanlou, Sadaf G; Serra-Majem, Luis; Shalnova, SvetlanaA; Sharma, Sanjib K; Shaw, Jonathan E; Shibuya, Kenji; Shin, DongWook; Shin, Youchan; Shiri, Rahman; Siani, Alfonso; Siantar, Ros-alynn; Sibai, Abla M; Silva, Antonio M; Santos Silva, Diego Augusto;Simon, Mary; Simons, Judith; Simons, Leon A; Sjoberg, Agneta;Sjostrom, Michael; Skovbjerg, Sine; Slowikowska-Hilczer, Jolanta;Slusarczyk, Przemyslaw; Smeeth, Liam; Smith, Margaret C; Sni-jder, Marieke B; So, Hung-Kwan; Sobngwi, Eugene; Soderberg, Ste-fan; Soekatri, Moesijanti YE; Solfrizzi, Vincenzo; Sonestedt, Emily;
5
Song, Yi; Sorensen, Thorkild IA; Soric, Maroje; Jerome, CharlesSossa; Soumare, Aicha; Spinelli, Angela; Spiroski, Igor; Staessen,Jan A; Stamm, Hanspeter; Starc, Gregor; Stathopoulou, Maria G;Staub, Kaspar; Stavreski, Bill; Steene-Johannessen, Jostein; Stehle,Peter; Stein, Aryeh D; Stergiou, George S; Stessman, Jochanan;Stieber, Jutta; Stockl, Doris; Stocks, Tanja; Stokwisze, Jakub; Strat-ton, Gareth; Stronks, Karien; Strufaldi, Maria Wany; Suarez-Medina,Ramon; Sun, Chien-An; Sundstrom, Johan; Sung, Yn-Tz; Sunyer,Jordi; Suriyawongpaisa, Paibul; Swinburn, Boyd A; Sy, Rody G;Szponar, Lucjan; Tai, E Shyong; Tammesoo, Mari-Liis; Tamosiu-nas, Abdonas; Tan, Eng Joo; Tang, Xun; Tanser, Frank; Tao, Yong;Tarawneh, Mohammed Rasoul; Tarp, Jakob; Tarqui-Mamani, Car-olina B; Tautu, Oana-Florentina; Braunerova, Radka Taxova; Taylor,Anne; Tchibindat, Felicite; Theobald, Holger; Theodoridis, Xenophon;Thijs, Lutgarde; Thuesen, Betina H; Tjonneland, Anne; Tolonen,Hanna K; Tolstrup, Janne S; Topbas, Murat; Topor-Madry, Roman;Tormo, Maria Jose; Tornaritis, Michael J; Torrent, Maties; Toselli,Stefania; Traissac, Pierre; Trichopoulos, Dimitrios; Trichopoulou, An-tonia; Trinh, Oanh TH; Trivedi, Atul; Tshepo, Lechaba; Tsigga,Maria; Tsugane, Shoichiro; Tulloch-Reid, Marshall K; Tullu, Fikru;Tuomainen, Tomi-Pekka; Tuomilehto, Jaakko; Turley, Maria L; Tynelius,Per; Tzotzas, Themistoklis; Tzourio, Christophe; Ueda, Peter; Ugel,Eunice E; Ukoli, Flora AM; Ulmer, Hanno; Unal, Belgin; Uusitalo,Hannu MT; Valdivia, Gonzalo; Vale, Susana; Valvi, Damaskini; vander Schouw, Yvonne T; Van Herck, Koen; Hoang, Van Minh; vanRossem, Lenie; Van Schoor, Natasja M; van Valkengoed, Irene GM;Vanderschueren, Dirk; Vanuzzo, Diego; Vatten, Lars; Vega, Tomas;Veidebaum, Toomas; Velasquez-Melendez, Gustavo; Velika, Biruta;Veronesi, Giovanni; Verschuren, WM Monique; Victora, Cesar G;Viegi, Giovanni; Viet, Lucie; Viikari-Juntura, Eira; Vineis, Paolo;Vioque, Jesus; Virtanen, Jyrki K; Visvikis-Siest, Sophie; Viswanathan,Bharathi; Vlasoff, Tiina; Vollenweider, Peter; Voelzke, Henry; Vouti-lainen, Sari; Vrijheid, Martine; Wade, Alisha N; Wagner, Aline;Waldhor, Thomas; Walton, Janette; Bebakar, Wan Mohamad Wan;Mohamud, Wan Nazaimoon Wan; Wanderley, Rildo S; Wang, Ming-Dong; Wan, Qian; Wang, Ya Xing; Wannamethee, S Goya; Ware-ham, Nicholas; Weber, Adelheid; Wedderkopp, Niels; Weerasekera,Deepa; Whincup, Peter H; Widhalm, Kurt; Widyahening, Indah S;Wiecek, Andrzej; Wijga, Alet H; Wilks, Rainford J; Willeit, Jo-hann; Willeit, Peter; Wilsgaard, Tom; Wojtyniak, Bogdan; Wong-McClure, Roy A; Wong, Justin YY; Wong, Jyh Eiin; Wong, TienYin; Woo, Jean; Woodward, Mark; Wu, Frederick C; Wu, Jian-feng; Wu, Shouling; Xu, Haiquan; Xu, Liang; Yamborisut, Uruwan;Yan, Weili; Yang, Xiaoguang; Yardim, Nazan; Ye, Xingwang; Yial-louros, Panayiotis K; Yngve, Agneta; Yoshihara, Akihiro; You, QiSheng; Younger-Coleman, Novie O; Yusoff, Faudzi; Yusoff, Muham-mad Fadhli M; Zaccagni, Luciana; Zafiropulos, Vassilis; Zainuddin,Ahmad A; Zambon, Sabina; Zampelas, Antonis; Zamrazilova, Hana;Zdrojewski, Tomasz; Zeng, Yi; Zhao, Dong; Zhao, Wenhua; Zheng,Wei; Zheng, Yingfeng; Zholdin, Bekbolat; Zhou, Maigeng; Zhu, Dan;
6
Zhussupov, Baurzhan; Zimmermann, Esther; Cisneros, Julio Zuniga(2017) Worldwide trends in body-mass index, underweight, over-weight, and obesity from 1975 to 2016: a pooled analysis of 2416population-based measurement studies in 128.9 million children, ado-lescents, and adults. LANCET, 390 (10113). pp. 2627-2642. ISSN0140-6736 DOI: https://doi.org/10.1016/S0140-6736(17)32129-3
Downloaded from: http://researchonline.lshtm.ac.uk/4650128/
DOI: 10.1016/S0140-6736(17)32129-3
Usage Guidelines
Please refer to usage guidelines at http://researchonline.lshtm.ac.uk/policies.html or alterna-tively contact [email protected].
Available under license: http://creativecommons.org/licenses/by/2.5/
7
Articles
www.thelancet.com Vol 390 December 16, 2017 2627
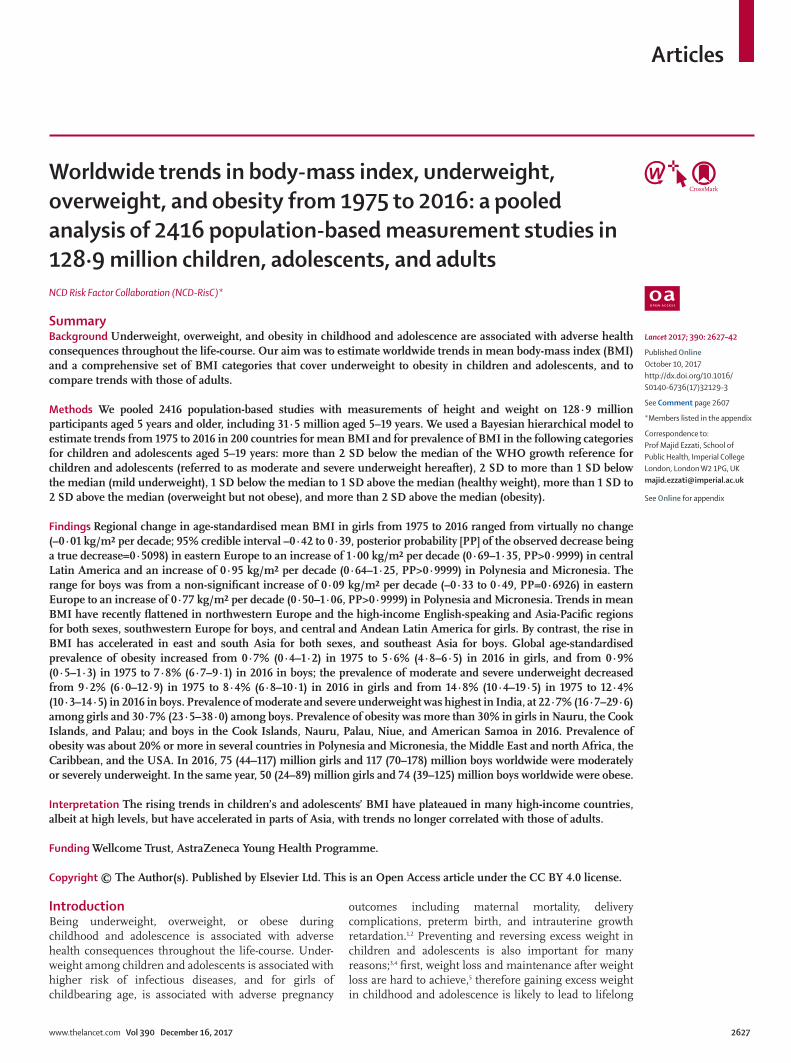
Worldwide trends in body-mass index, underweight, overweight, and obesity from 1975 to 2016: a pooled analysis of 2416 population-based measurement studies in 128·9 million children, adolescents, and adultsNCD Risk Factor Collaboration (NCD-RisC)*
SummaryBackground Underweight, overweight, and obesity in childhood and adolescence are associated with adverse health consequences throughout the life-course. Our aim was to estimate worldwide trends in mean body-mass index (BMI) and a comprehensive set of BMI categories that cover underweight to obesity in children and adolescents, and to compare trends with those of adults.
Methods We pooled 2416 population-based studies with measurements of height and weight on 128·9 million participants aged 5 years and older, including 31·5 million aged 5–19 years. We used a Bayesian hierarchical model to estimate trends from 1975 to 2016 in 200 countries for mean BMI and for prevalence of BMI in the following categories for children and adolescents aged 5–19 years: more than 2 SD below the median of the WHO growth reference for children and adolescents (referred to as moderate and severe underweight hereafter), 2 SD to more than 1 SD below the median (mild underweight), 1 SD below the median to 1 SD above the median (healthy weight), more than 1 SD to 2 SD above the median (overweight but not obese), and more than 2 SD above the median (obesity).
Findings Regional change in age-standardised mean BMI in girls from 1975 to 2016 ranged from virtually no change (–0·01 kg/m² per decade; 95% credible interval –0·42 to 0·39, posterior probability [PP] of the observed decrease being a true decrease=0·5098) in eastern Europe to an increase of 1·00 kg/m² per decade (0·69–1·35, PP>0·9999) in central Latin America and an increase of 0·95 kg/m² per decade (0·64–1·25, PP>0·9999) in Polynesia and Micronesia. The range for boys was from a non-significant increase of 0·09 kg/m² per decade (–0·33 to 0·49, PP=0·6926) in eastern Europe to an increase of 0·77 kg/m² per decade (0·50–1·06, PP>0·9999) in Polynesia and Micronesia. Trends in mean BMI have recently flattened in northwestern Europe and the high-income English-speaking and Asia-Pacific regions for both sexes, southwestern Europe for boys, and central and Andean Latin America for girls. By contrast, the rise in BMI has accelerated in east and south Asia for both sexes, and southeast Asia for boys. Global age-standardised prevalence of obesity increased from 0·7% (0·4–1·2) in 1975 to 5·6% (4·8–6·5) in 2016 in girls, and from 0·9% (0·5–1·3) in 1975 to 7·8% (6·7–9·1) in 2016 in boys; the prevalence of moderate and severe underweight decreased from 9·2% (6·0–12·9) in 1975 to 8·4% (6·8–10·1) in 2016 in girls and from 14·8% (10·4–19·5) in 1975 to 12·4% (10·3–14·5) in 2016 in boys. Prevalence of moderate and severe underweight was highest in India, at 22·7% (16·7–29·6) among girls and 30·7% (23·5–38·0) among boys. Prevalence of obesity was more than 30% in girls in Nauru, the Cook Islands, and Palau; and boys in the Cook Islands, Nauru, Palau, Niue, and American Samoa in 2016. Prevalence of obesity was about 20% or more in several countries in Polynesia and Micronesia, the Middle East and north Africa, the Caribbean, and the USA. In 2016, 75 (44–117) million girls and 117 (70–178) million boys worldwide were moderately or severely underweight. In the same year, 50 (24–89) million girls and 74 (39–125) million boys worldwide were obese.
Interpretation The rising trends in children’s and adolescents’ BMI have plateaued in many high-income countries, albeit at high levels, but have accelerated in parts of Asia, with trends no longer correlated with those of adults.
Funding Wellcome Trust, AstraZeneca Young Health Programme.
Copyright © The Author(s). Published by Elsevier Ltd. This is an Open Access article under the CC BY 4.0 license.
IntroductionBeing underweight, overweight, or obese during childhood and adolescence is associated with adverse health consequences throughout the life-course. Under-weight among children and adolescents is associated with higher risk of infectious diseases, and for girls of childbearing age, is associated with adverse pregnancy
outcomes including maternal mortality, delivery complications, preterm birth, and intrauterine growth retardation.1,2 Preventing and reversing excess weight in children and adolescents is also important for many reasons;3,4 first, weight loss and maintenance after weight loss are hard to achieve,5 therefore gaining excess weight in childhood and adolescence is likely to lead to lifelong
Lancet 2017; 390: 2627–42
Published Online October 10, 2017 http://dx.doi.org/10.1016/S0140-6736(17)32129-3
See Comment page 2607
*Members listed in the appendix
Correspondence to: Prof Majid Ezzati, School of Public Health, Imperial College London, London W2 1PG, UK [email protected]
See Online for appendix
Articles
2628 www.thelancet.com Vol 390 December 16, 2017
overweight and obesity.6 Second, being overweight in childhood and adolescence is associated with greater risk and earlier onset of chronic disorders such as type 2 diabetes.3,4,7–9 Third, childhood and adolescent obesity has adverse psychosocial consequences and lowers educational attainment.3,4,10,11 Finally, children and adolescents are more susceptible to food marketing than adults, which makes reducing children’s exposure to obesogenic foods necessary to protect them from harm.3,12
Although trends in children’s and adolescents’ weight status have been documented in individual countries, little comparable information exists on worldwide trends, and none for mean body-mass index (BMI) and underweight. We pooled population-based data to estimate trends from 1975 to 2016 in mean BMI and in the prevalence of a comprehensive set of BMI categories that cover the underweight to obese range among children and adolescents for all countries in the world. To compare the trajectory of obesity and underweight in children and adolescents with that of adults, we also generated updated estimates for adults.13
MethodsStudy designWe pooled and analysed population-based studies that had measured height and weight in people aged 5 years and older to estimate trends from 1975 to 2016 in mean
BMI and BMI categories in 200 countries and territories (appendix). We started our analysis from 5 years of age because the definitions of underweight, overweight, and obesity change at 5 years of age.14 Further, children enter school at or around this age, which is associated with a change in their nutrition and physical activity.15
We present data on school-aged children and adolescents aged 5–19 years and on adults aged 20 years and older. We did separate analyses for children and adolescents and for adults for two reasons: first, cutoffs used to define underweight, overweight, and obesity for children and adolescents are different from those for adults and vary by age and sex because of the natural growth in childhood and adolescence.16 Second, the trajectory of the obesity epidemic in children and adolescents might be different from that of adults,17 motivating separate analyses of trends. Similarly, underweight in children and adolescents is typically targeted through school and community-based nutrition programmes, decoupling its trajectory from that of adults.
For children and adolescents, we analysed trends in mean BMI and prevalence of BMI in the following categories: more than 2 SD below the median of the WHO growth reference for children and adolescents16 (hereafter referred to as moderate and severe underweight), 2 SD to more than 1 SD below the median (mild underweight), 1 SD below the median to 1 SD above the median (healthy
Research in context
Evidence before this studyWe searched MEDLINE (via PubMed) for articles published in any language between Jan 1, 1950, and July 12, 2017, using the search terms (“body size”[mh:noexp] OR “body height”[mh:noexp] OR “body weight”[mh:noexp] OR “birth weight”[mh:noexp] OR “overweight”[mh:noexp] OR “obesity”[mh] OR “thinness”[mh:noexp] OR “Waist-Hip Ratio”[mh:noexp] OR “Waist Circumference”[mh:noexp] OR “body mass index”[mh:noexp]) AND (“Humans”[mh]) AND (“Health Surveys”[mh] OR “Epidemiological Monitoring”[mh] OR “Prevalence”[mh]) NOT Comment[ptyp] NOT Case Reports[ptyp]. Articles were screened according to the inclusion and exclusion criteria described in the Appendix.
We identified three prior global analyses of mean body-mass index (BMI) or prevalence of overweight and obesity among adults. One of these studies also estimated the prevalence of underweight in adults. Another study also included data on overweight and obesity in children and adolescents, using a combination of measured and self-reported height and weight, and analysed in the same model as adults. A few multicountry studies and systematic reviews have reported, quantitatively or qualitatively, trends in overweight and obesity in children and adolescents, some also reporting underweight. To our knowledge, there is no global analysis of mean BMI, which is a summary measure of population distribution, or prevalence of underweight among children and adolescents aged 5–19 years.
Added value of this studyThis study provides a complete picture of trends in mean BMI and prevalence of BMI categories that cover the underweight to obese range among children and adolescents aged 5–19 years, for all countries in the world with the longest observation period, and compares trends with those of adults. It includes the first global estimates of mean BMI and underweight prevalence for children and adolescents. We also present trends in the number of children, adolescents, and adults who are moderately or severely underweight and obese, and thus at risk of adverse health outcomes.
Implications of all the available evidenceOver the past four decades, mean BMI and obesity in children and adolescents aged 5–19 years have increased in most regions and countries. Despite this rise, more children and adolescents are moderately or severely underweight than obese, with the burden of underweight increasingly concentrated in south Asia and central, east and west Africa. The rise in children’s and adolescents’ BMI has plateaued, albeit at high levels, in many high-income countries but has accelerated in parts of Asia. There is a need for bridging the disconnect between policies that address underweight and overweight in children and adolescents to coherently address the large remaining underweight burden while curbing and reversing the rise in overweight and obesity.
Articles
www.thelancet.com Vol 390 December 16, 2017 2629
Age-
stan
dard
ised
mea
n BM
I (kg
/m²)
Age-
stan
dard
ised
mea
n BM
I (kg
/m²)
Age-
stan
dard
ised
mea
n BM
I (kg
/m²)
Age-
stan
dard
ised
mea
n BM
I (kg
/m²)
Age-
stan
dard
ised
mea
n BM
I (kg
/m²)
Central Asia
15
20
25
30
South Asia Southeast Asia East Asia High-income Asia-Pacific
High-incomeEnglish-speaking countries
15
20
25
30
Northwestern Europe Southwestern Europe Central Europe Eastern Europe
Middle East and north Africa
15
20
25
30
West Africa Central Africa East Africa Southern Africa
Central Latin America
15
20
25
30
Andean Latin America Southern Latin America
Caribbean
15
20
25
30
Melanesia Polynesia and Micronesia
World
15
20
25
30
AdultsChildren and adolescents
1980 1990 2000
Year Year Year Year
2010 1980 1990 2000 2010 1980 1990 2000 2010 1980 1990 2000 2010
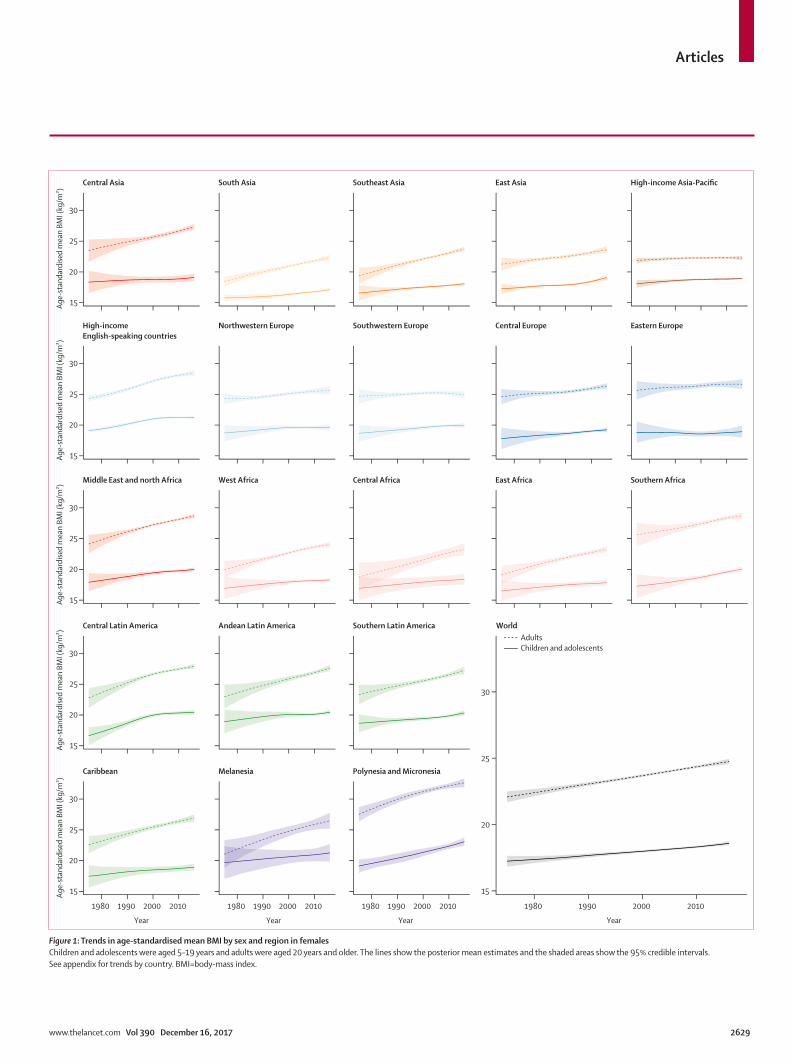
Figure 1: Trends in age-standardised mean BMI by sex and region in femalesChildren and adolescents were aged 5–19 years and adults were aged 20 years and older. The lines show the posterior mean estimates and the shaded areas show the 95% credible intervals. See appendix for trends by country. BMI=body-mass index.

Articles
2630 www.thelancet.com Vol 390 December 16, 2017
Age-
stan
dard
ised
mea
n BM
I (kg
/m²)
Age-
stan
dard
ised
mea
n BM
I (kg
/m²)
Age-
stan
dard
ised
mea
n BM
I (kg
/m²)
Age-
stan
dard
ised
mea
n BM
I (kg
/m²)
Age-
stan
dard
ised
mea
n BM
I (kg
/m²)
Central Asia
15
20
25
30
South Asia Southeast Asia East Asia High-income Asia-Pacific
High-incomeEnglish-speaking countries
15
20
25
30
Northwestern Europe Southwestern Europe Central Europe Eastern Europe
Middle East and north Africa
15
20
25
30
West Africa Central Africa East Africa Southern Africa
Central Latin America
15
20
25
30
Andean Latin America Southern Latin America
Caribbean
15
20
25
30
Melanesia Polynesia and Micronesia
World
15
20
25
30
AdultsChildren and adolescents
1980 1990 2000Year Year Year Year
2010 1980 1990 2000 2010 1980 1990 2000 2010 1980 1990 2000 2010
Figure 2: Trends in age-standardised mean BMI by sex and region in malesChildren and adolescents were aged 5–19 years and adults were aged 20 years and older. The lines show the posterior mean estimates and the shaded areas show the 95% credible intervals. See appendix for trends by country. BMI=body-mass index.
Articles
www.thelancet.com Vol 390 December 16, 2017 2631
weight), more than 1 SD to 2 SD above the median (overweight but not obese), and more than 2 SD above the median (obesity). The cutoffs for calculating prevalence in these BMI categories were all age-specific and sex-specific and were applied to data in 1-year age bands. We used the WHO definitions because they include a comprehensive set of BMI categories ranging from moderate and severe underweight to obesity, defined based on symmetric thresholds of SDs from the reference population median. For adults, we analysed trends in mean BMI and prevalence of a comprehensive set of BMI categories as described in detail elsewhere and in the appendix.13 Results for children and adolescents are presented here; updated results for adults are presented in the appendix except when compared with children and adolescents.
Data sourcesOur methods for identifying and accessing data sources, and our inclusion and exclusion criteria, are described in the appendix. In summary, we used a database of population-based data on cardiometabolic risk factors collated by the Non-communicable Disease Risk Factor Collaboration (NCD-RisC), a worldwide network of health researchers and practitioners whose aim is to document systematically the worldwide trends and variations in non-communicable disease risk factors. The database was collated through multiple routes for identifying and accessing data. We accessed publicly available population-based multi-country and national measurement surveys, as well as the WHO STEPwise approach to Surveillance (STEPS) surveys. We requested, via WHO and its regional and country offices, help with identification and access to population-based surveys from ministries of health and other national health and statistical agencies. We also sent requests via the World Heart Federation to its national partners. We made a similar request to the authors of an earlier pooled analysis of cardiometabolic risk factors,18–21 and invited them to reanalyse data from their studies and join NCD-RisC. To identify major sources not accessed through the above routes, we searched and reviewed published studies as detailed previously,13 and invited all eligible studies to join NCD-RisC. Finally, NCD-RisC members were periodically asked to review the list of sources from their country, to suggest additional sources not in the database, and to verify that the included data from their country met the inclusion criteria as listed in the appendix and that there were no duplicates.
The list of data sources and their characteristics is provided in the appendix. In summary, we included data collected on samples of a national, subnational (ie, covering one or more subnational regions, or more than three communities), or community (one or a few communities) population, which had measured height and weight. We did not use self-reported height and weight because they are subject to biases that vary by geography, time, age, sex, and socioeconomic
characteristics.22–24 Because of these variations, approaches to correcting self-reported data leave residual bias.
Statistical analysisThe statistical models used to estimate mean and prevalence by country, year, sex, and age are described in detail in a statistical paper and related substantive papers;13,25–28 the computer code is available from the NCD-RisC website. In summary, we organised countries into 21 regions, mostly based on geography and national income (appendix). The exception was high-income English-speaking countries (Australia, Canada, Ireland, New Zealand, the UK, and the USA), grouped together in one region because BMI and other cardiometabolic risk factors have similar trends in these countries, which can be distinct from other countries in their geographical regions.13,26–28
The model had a hierarchical structure in which estimates for each country and year were informed by its own data, if available, and by data from other years in the same country and from other countries, especially those in the same region with data for similar time periods. The extent to which estimates for each country-year were influenced by data from other years and other countries depended on whether the country had data, the sample size of data, whether or not they were national, and the within-country and within-region variability of the available data. The model incorporated non-linear time trends comprising linear terms and a second-order random walk, all modelled hierarchically. The age association of BMI was modelled using a cubic spline to allow non-linear age patterns, which might vary across countries. The model accounted for the possibility that BMI in subnational and community samples might systematically differ from nationally representative ones, and have larger variation than in national studies. These features were implemented by including data-driven fixed-effect and random-effect terms for subnational and community data. The fixed effects adjusted for systematic differences between subnational or community studies and national studies. The random effects allowed national data to have larger influence on the estimates than subnational or community data with similar sample sizes. The model also accounted for rural–urban differences in BMI, through the use of data-driven fixed effects for rural-only and urban-only studies. These rural and urban effects were weighted by the difference between study-level and country-level urbanisation in the year when the study was done. The statistical model included a covariate (proportion of national population living in urban areas; data from the World Urbanization Prospects, 2014 revision) that is associated with, and helps predict, BMI.29 Results of model validation are reported elsewhere.13 We performed all analyses by sex, because there are differences in BMI levels and trends in relation to sex.13
We analysed the data on mean BMI and on each of the above prevalence categories separately. We re-scaled the
For the NCD-RisC website see www.ncdrisc.org
Articles
2632 www.thelancet.com Vol 390 December 16, 2017
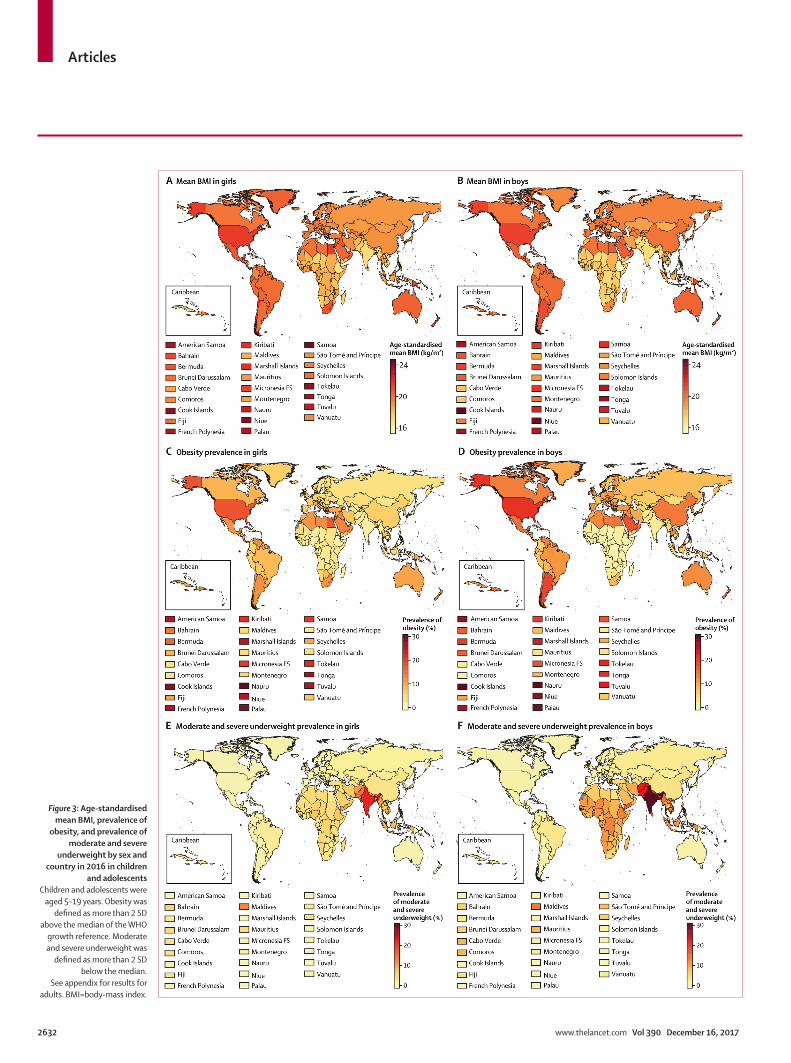
Figure 3: Age-standardised mean BMI, prevalence of
obesity, and prevalence of moderate and severe
underweight by sex and country in 2016 in children
and adolescentsChildren and adolescents were
aged 5–19 years. Obesity was defined as more than 2 SD
above the median of the WHO growth reference. Moderate and severe underweight was
defined as more than 2 SD below the median.
See appendix for results for adults. BMI=body-mass index.
A Mean 8MI in girls
Caribbean
B Mean 8MI in boys
Caribbean
AmericanSamoa Kiribati Samoa Age-standardised American Samoa Kiribati Samoa Age-standardised
Bahrain Maldives Sao Tome and Principe mean BMI (kg/m') Bahrain Maldives Sao Tome and Prfncipe mean 8MI (kg/m')
Bermuda Marshall Islands Seychelles -24 Bermuda Marshall Islands Seychelles 24
Brunei Darussalam Mauritius Solomon Islands Brunei Darussalam Mauritius Solomon Islands
CaboVerde Micronesia FS Tokelau CaboVerde Micronesia FS Tokelau
Comoros Montenegro Tonga -20 Comoros Montenegro Tonga 20
CookIslands Nauru Tuvalu Cook Islands Nauru Tuvalu
Fiji NiueVanuatu
Fiji Niue Vanuatu
French Polynesia Palau -16 French Polynesia Palau 16
C Obesity prevalence in girls D Obesity prevalence in boys
I Caribbean Caribbean
American Samoa Kiribati Samoa Prevalence of American Samoa Kiribati Samoa Prevalence of
Bahrain Maldives SaoTome and Principe obesity (%) Bahrain Maldives SaoTome and Prfncipe obesity (%)
Bermuda Marshall Islands Seychelles30
Bermuda Marshall Islands Seychelles30
Brunei Darussalam Mauritius Solomon Islands Brunei Darussalam Mauritius Solomon Islands
CaboVerde Micronesia FS Tokelau20
CaboVerde Micronesia FS Tokelau20
Comoros Montenegro Tonga Comoros Montenegro Tonga
Cook Islands Nauru Tuvalu 10 Cook Islands Nauru Tuvalu 10
Fiji Niue Vanuatu Fiji Niue Vanuatu
FrenchPolynesia Palau FrenchPolynesia Palau
E Moderate and severe underweight prevalence in girls F Moderate and severe underweight prevalence in boys
I Caribbean Caribbean
American Samoa Kiribati Samoa Prevalence American Samoa Kiribati Samoa Prevalence
Bahrain Maldives SaoTome and Principeof moderate
Bahrain Maldives SaoTome and Prfncipeof moderate
and severe and severeBermuda Marshall Islands Seychelles underweight (%) Bermuda Marshall Islands Seychelles underweight (%)
Brunei Darussalam Mauritius Solomon Islands30
Brunei Darussalam Mauritius Solomon Islands30
CaboVerde Micronesia FS Tokelau CaboVerde Micronesia FS Tokelau20 20
Comoros Montenegro Tonga Comoros Montenegro Tonga
Cook Islands Nauru Tuvalu 10 Cook Islands Nauru Tuvalu 10
Fiji Niue Vanuatu Fiji Niue Vanuatu
FrenchPolynesia Palau French Polynesia Palau
Articles
www.thelancet.com Vol 390 December 16, 2017 2633
estimated prevalence categories so that the sum of different categories was 1·0 in each age, sex, country, and year. The average scaling factors across draws ranged from 1·03 to 1·07, ie, the sum of the separately estimated prevalence categories was close to 1·0.
We fitted the statistical model with the Markov chain Monte Carlo (MCMC) algorithm, and obtained 5000 post-burn-in samples from the posterior distribution of model parameters, which were in turn used to obtain the posterior distributions of the above primary outcomes, ie, mean BMI and each of the prevalence categories. For model fitting, data on participants aged 5–19 years were included in the analysis of trends in children and adolescents, and on participants aged 18 years and older in the analysis of trends in adults. Data on participants aged 18 and 19 years were included in both sets of models because these groups form a transitional age from adolescence to adulthood, and hence help inform the estimates in both groups. Posterior estimates were made in 1-year age groups for ages 5–19 years and in 5-year age groups for those aged 20 years and older. For presentation, we used the posterior estimates for ages 5–19 years for children and adolescents, and for ages 20 years and older for adults. Age-standardised estimates were generated by taking weighted averages of age-sex-specific estimates, separately for children and adolescents and for adults, with use of age weights from the WHO standard population.30 Estimates for regions and the world were calculated as population-weighted averages of the constituent country estimates by age group and sex. The number of children, adolescents, and adults who were underweight, overweight, or obese was calculated by multiplying the corresponding age-specific prevalence by the population by country, year, and sex.
The reported credible intervals (CrI) represent the 2·5th to 97·5th percentiles of the posterior distributions. The uncertainties of our estimates, represented by the widths of the credible intervals, arise from uncertainty due to sampling in each data source; uncertainty associated with the variability of national data beyond what is accounted for by sampling; additional uncertainty associated with subnational and community data, and data that are from rural-only or urban-only samples; and uncertainty due to making estimates by country, year, and age when data were missing or scarce, in the country-year-age group unit for which estimates are made, in proximate time periods and ages in that country and in other countries in the same region. We also report the posterior probability (PP) that an estimated increase or decrease represents a truly increasing or decreasing trend.
Role of the funding sourceThe funder of the study had no role in study design, data collection, analysis, interpretation, or writing of the
report. Country and Regional Data Group members, JB, MDC, VB, HB, and BZ had full access to the data in the study. The corresponding author had final responsibility for the decision to submit for publication.
ResultsThe results can be explored using dynamic visualisations and downloaded from the NCD-RisC website. We pooled 2416 population-based data sources with measurement of height and weight on 128·9 million people aged 5 years and older from 1975 to 2016 (appendix). 1099 sources included data on 24·1 million participants aged 5–17 years, 848 sources included data on 7·4 million participants aged 18–19 years, and 1820 sources included data on
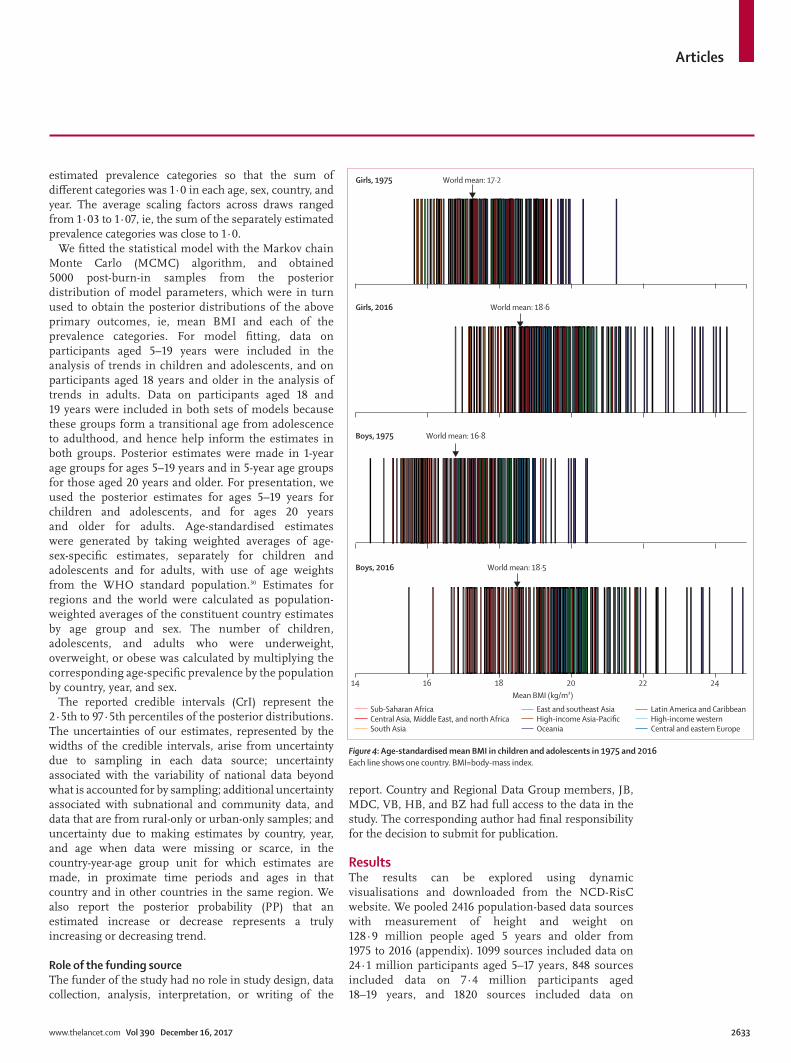
Figure 4: Age-standardised mean BMI in children and adolescents in 1975 and 2016Each line shows one country. BMI=body-mass index.
Girls, 1975
14 16 18 20 22 24
World mean: 17·2
Girls, 2016 World mean: 18·6
Boys, 1975 World mean: 16·8
Boys, 2016 World mean: 18·5
Mean BMI (kg/m²)
Sub-Saharan AfricaCentral Asia, Middle East, and north AfricaSouth Asia
East and southeast AsiaHigh-income Asia-PacificOceania
Latin America and CaribbeanHigh-income westernCentral and eastern Europe
Articles
2634 www.thelancet.com Vol 390 December 16, 2017
97·4 million participants aged 20 years and older (appendix). Additional information on the age dis-tribution of data sources and participants is shown in the appendix. 1187 (49%) of 2416 data sources were from national samples, 390 (16%) covered one or more subnational regions, and the remaining 839 (35%) were from one or a few communities (appendix). 583 (24%) of 2416 data sources were from before 1995 and another 1833 (76%) were from 1995 and later (appendix). The number of data sources per country in different regions ranged from 3·4 in the Caribbean to 54·0 in the high-income Asia-Pacific region (appendix).
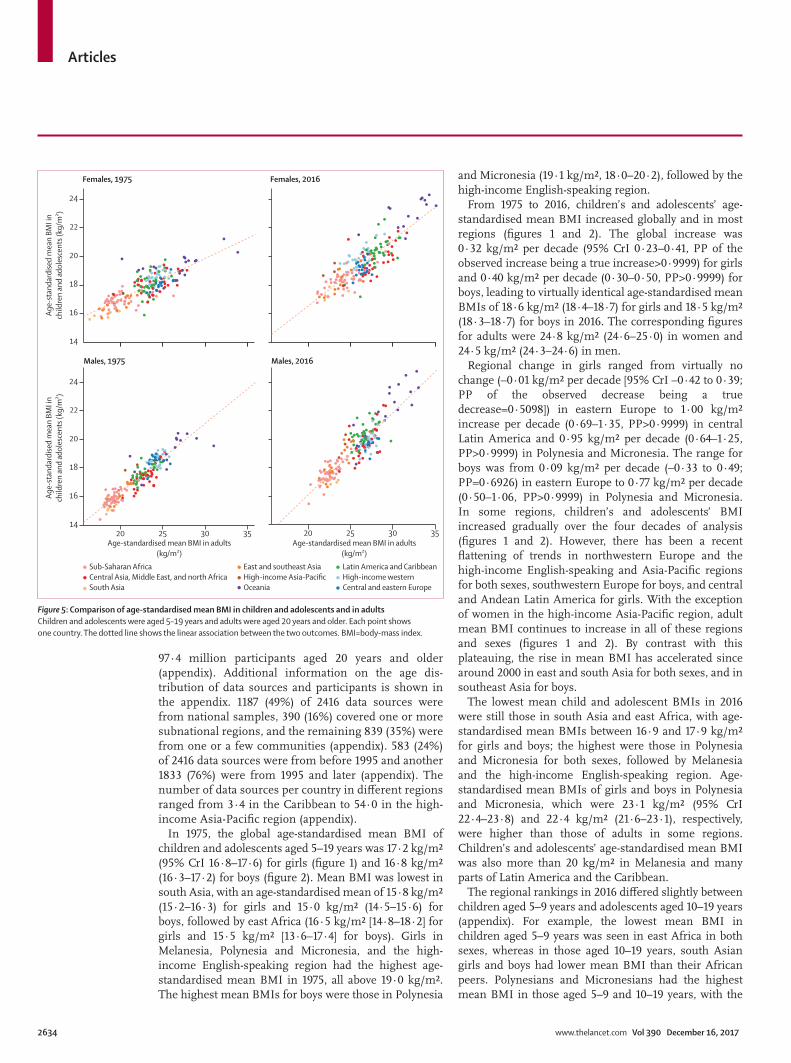
In 1975, the global age-standardised mean BMI of children and adolescents aged 5–19 years was 17·2 kg/m² (95% CrI 16·8–17·6) for girls (figure 1) and 16·8 kg/m² (16·3–17·2) for boys (figure 2). Mean BMI was lowest in south Asia, with an age-standardised mean of 15·8 kg/m² (15·2–16·3) for girls and 15·0 kg/m² (14·5–15·6) for boys, followed by east Africa (16·5 kg/m² [14·8–18·2] for girls and 15·5 kg/m² [13·6–17·4] for boys). Girls in Melanesia, Polynesia and Micronesia, and the high-income English-speaking region had the highest age-standardised mean BMI in 1975, all above 19·0 kg/m². The highest mean BMIs for boys were those in Polynesia
and Micronesia (19·1 kg/m², 18·0–20·2), followed by the high-income English-speaking region.
From 1975 to 2016, children’s and adolescents’ age-standardised mean BMI increased globally and in most regions (figures 1 and 2). The global increase was 0·32 kg/m² per decade (95% CrI 0·23–0·41, PP of the observed increase being a true increase>0·9999) for girls and 0·40 kg/m² per decade (0·30–0·50, PP>0·9999) for boys, leading to virtually identical age-standardised mean BMIs of 18·6 kg/m² (18·4–18·7) for girls and 18·5 kg/m² (18·3–18·7) for boys in 2016. The corresponding figures for adults were 24·8 kg/m² (24·6–25·0) in women and 24·5 kg/m² (24·3–24·6) in men.
Regional change in girls ranged from virtually no change (–0·01 kg/m² per decade [95% CrI –0·42 to 0·39; PP of the observed decrease being a true decrease=0·5098]) in eastern Europe to 1·00 kg/m² increase per decade (0·69–1·35, PP>0·9999) in central Latin America and 0·95 kg/m² per decade (0·64–1·25, PP>0·9999) in Polynesia and Micronesia. The range for boys was from 0·09 kg/m² per decade (–0·33 to 0·49; PP=0·6926) in eastern Europe to 0·77 kg/m² per decade (0·50–1·06, PP>0·9999) in Polynesia and Micronesia. In some regions, children’s and adolescents’ BMI increased gradually over the four decades of analysis (figures 1 and 2). However, there has been a recent flattening of trends in northwestern Europe and the high-income English-speaking and Asia-Pacific regions for both sexes, southwestern Europe for boys, and central and Andean Latin America for girls. With the exception of women in the high-income Asia-Pacific region, adult mean BMI continues to increase in all of these regions and sexes (figures 1 and 2). By contrast with this plateauing, the rise in mean BMI has accelerated since around 2000 in east and south Asia for both sexes, and in southeast Asia for boys.
The lowest mean child and adolescent BMIs in 2016 were still those in south Asia and east Africa, with age-standardised mean BMIs between 16·9 and 17·9 kg/m² for girls and boys; the highest were those in Polynesia and Micronesia for both sexes, followed by Melanesia and the high-income English-speaking region. Age-standardised mean BMIs of girls and boys in Polynesia and Micronesia, which were 23·1 kg/m² (95% CrI 22·4–23·8) and 22·4 kg/m² (21·6–23·1), respectively, were higher than those of adults in some regions. Children’s and adolescents’ age-standardised mean BMI was also more than 20 kg/m² in Melanesia and many parts of Latin America and the Caribbean.
The regional rankings in 2016 differed slightly between children aged 5–9 years and adolescents aged 10–19 years (appendix). For example, the lowest mean BMI in children aged 5–9 years was seen in east Africa in both sexes, whereas in those aged 10–19 years, south Asian girls and boys had lower mean BMI than their African peers. Polynesians and Micronesians had the highest mean BMI in those aged 5–9 and 10–19 years, with the
14
16
18
20
22
24
14
16
18
20
22
24
Age-
stan
dard
ised
mea
n BM
I in
child
ren
and
adol
esce
nts (
kg/m
²)
Females, 1975 Females, 2016
20 25 30 35
Age-
stan
dard
ised
mea
n BM
I in
child
ren
and
adol
esce
nts (
kg/m
²)
Males, 1975
20 25 30 35
Males, 2016
Age-standardised mean BMI in adults(kg/m²)
Age-standardised mean BMI in adults(kg/m²)
Sub-Saharan AfricaCentral Asia, Middle East, and north AfricaSouth Asia
East and southeast AsiaHigh-income Asia-PacificOceania
Latin America and CaribbeanHigh-income westernCentral and eastern Europe
Figure 5: Comparison of age-standardised mean BMI in children and adolescents and in adultsChildren and adolescents were aged 5–19 years and adults were aged 20 years and older. Each point shows one country. The dotted line shows the linear association between the two outcomes. BMI=body-mass index.
Articles
www.thelancet.com Vol 390 December 16, 2017 2635
subsequent spots held by the high-income English-speaking region, regions in Latin America and the Caribbean, and Melanesia. Among these regions, central Latin America had a poorer ranking (ie, higher BMI relative to other regions) at age 10–19 years than at age 5–9 years, as did boys in the high-income English-speaking region. By contrast, east Asia performed worse in ranking in 5–9 years of age than it did in 10–19 years.
The lowest age-standardised mean BMI over the 42 years of analysis among girls was in Bangladesh in 1975 (15·6 kg/m², 95% CrI 13·2–17·9), and among boys was in Ethiopia in 1975 (14·4 kg/m², 11·9–17·0; figures 3 and 4). Age-standardised mean BMI in 1975 was less than 21 kg/m² in every country, except for girls in American Samoa, who had an age-standardised mean BMI of 21·2 kg/m² (20·6–21·9). From 1975 to 2016, age-standardised mean BMI increased by more than 0·25 kg/m² per decade in 155 countries in girls, with the rise more than 1·0 kg/m² per decade in some countries in Polynesia and in Mexico (PP of being a true rise>0·9999); in boys, the rise was more than 0·25 kg/m² per decade in 189 countries and more than 1·0 kg/m² per decade in the Cook Islands. When subsets of the analysis period are considered, before the year 2000, age-standardised mean BMI increased in almost every country. After 2000, there were non-significant declines in mean BMI in 29 countries for girls and 12 (mostly high-income) countries for boys.
In 2016, Ethiopia had the lowest age-standardised mean BMI for both sexes, 16·8 kg/m² (95% CrI 15·6–17·9) for girls and 15·5 kg/m² (14·4–16·6) for boys (figures 3 and 4). Other countries with low BMI in both sexes in 2016 were Niger, Senegal, India, Bangladesh, Myanmar, and Cambodia. At the other extreme, age-standardised mean BMI was more than 24 kg/m² in girls and boys in the Cook Islands and Niue and girls in Samoa, which was greater than that for adults of the same sex in 36 countries for girls and 59 countries for boys. Age-standardised mean BMI was between 22 and 24 kg/m² in another 11 countries for girls and 10 countries for boys including in Polynesian and Micronesian islands, girls in the Bahamas and Chile, and boys in Qatar and Kuwait.
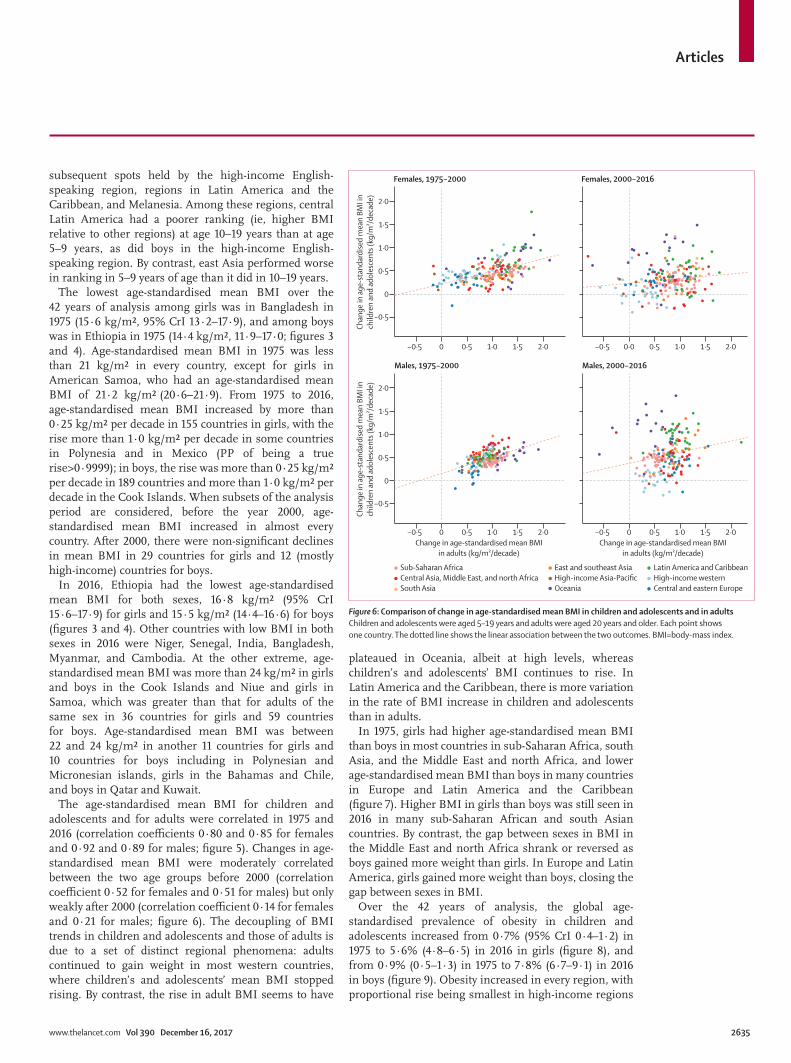
The age-standardised mean BMI for children and adolescents and for adults were correlated in 1975 and 2016 (correlation coefficients 0·80 and 0·85 for females and 0·92 and 0·89 for males; figure 5). Changes in age-standardised mean BMI were moderately correlated between the two age groups before 2000 (correlation coefficient 0·52 for females and 0·51 for males) but only weakly after 2000 (correlation coefficient 0·14 for females and 0·21 for males; figure 6). The decoupling of BMI trends in children and adolescents and those of adults is due to a set of distinct regional phenomena: adults continued to gain weight in most western countries, where children’s and adolescents’ mean BMI stopped rising. By contrast, the rise in adult BMI seems to have
plateaued in Oceania, albeit at high levels, whereas children’s and adolescents’ BMI continues to rise. In Latin America and the Caribbean, there is more variation in the rate of BMI increase in children and adolescents than in adults.
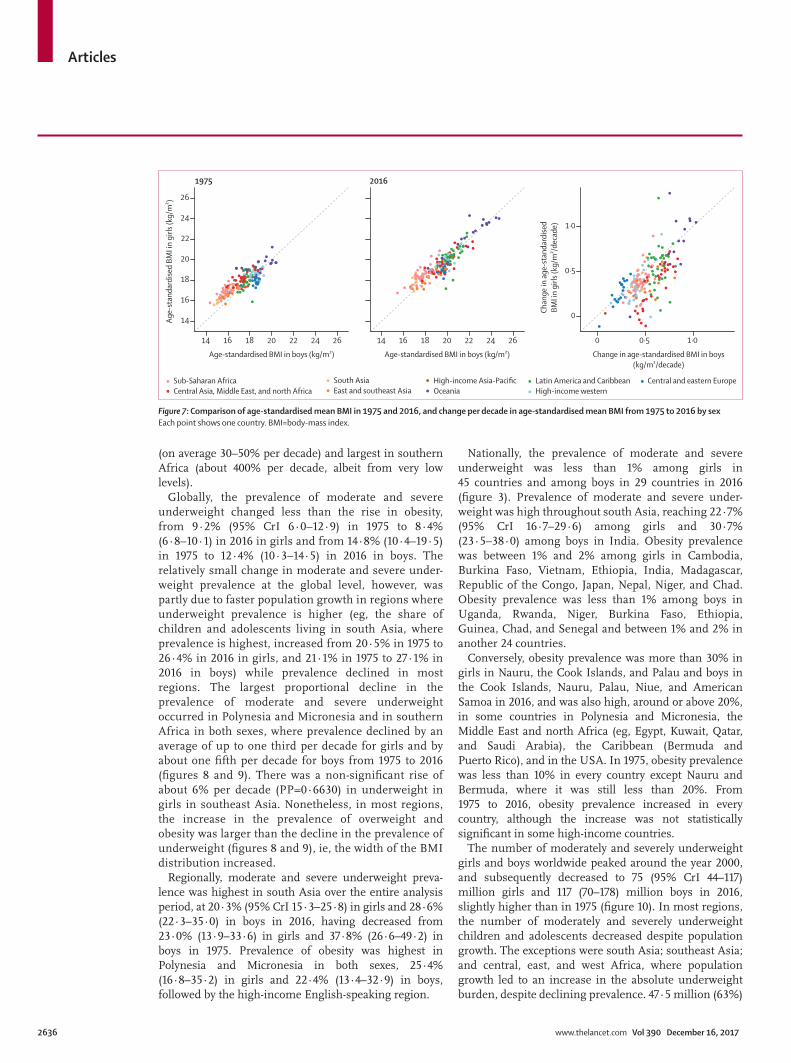
In 1975, girls had higher age-standardised mean BMI than boys in most countries in sub-Saharan Africa, south Asia, and the Middle East and north Africa, and lower age-standardised mean BMI than boys in many countries in Europe and Latin America and the Caribbean (figure 7). Higher BMI in girls than boys was still seen in 2016 in many sub-Saharan African and south Asian countries. By contrast, the gap between sexes in BMI in the Middle East and north Africa shrank or reversed as boys gained more weight than girls. In Europe and Latin America, girls gained more weight than boys, closing the gap between sexes in BMI.
Over the 42 years of analysis, the global age-standardised prevalence of obesity in children and adolescents increased from 0·7% (95% CrI 0·4–1·2) in 1975 to 5·6% (4·8–6·5) in 2016 in girls (figure 8), and from 0·9% (0·5–1·3) in 1975 to 7·8% (6·7–9·1) in 2016 in boys (figure 9). Obesity increased in every region, with proportional rise being smallest in high-income regions
Sub-Saharan AfricaCentral Asia, Middle East, and north AfricaSouth Asia
East and southeast AsiaHigh-income Asia-PacificOceania
Latin America and CaribbeanHigh-income westernCentral and eastern Europe
1·5
2·0
−0·5
Females, 1975−2000 Females, 2000−2016
−0·5 0 0·5 1·0 1·5 2·0Change in age-standardised mean BMI
in adults (kg/m²/decade)
−0·5 0 0·5 1·0 1·5 2·0Change in age-standardised mean BMI
in adults (kg/m²/decade)
−0·5
0
0·5
1·0
0
0·5
1·0
1·5
2·0
Chan
ge in
age
-sta
ndar
dise
d m
ean
BMI i
nch
ildre
n an
d ad
oles
cent
s (kg
/m²/d
ecad
e)Ch
ange
in a
ge-s
tand
ardi
sed
mea
n BM
I in
child
ren
and
adol
esce
nts (
kg/m
²/dec
ade)
−0·5 0 0·5 1·0 1·5 2·0 −0·5 0·0 0·5 1·0 1·5 2·0
Males, 2000−2016Males, 1975−2000
Figure 6: Comparison of change in age-standardised mean BMI in children and adolescents and in adultsChildren and adolescents were aged 5–19 years and adults were aged 20 years and older. Each point shows one country. The dotted line shows the linear association between the two outcomes. BMI=body-mass index.
Articles
2636 www.thelancet.com Vol 390 December 16, 2017
(on average 30–50% per decade) and largest in southern Africa (about 400% per decade, albeit from very low levels).
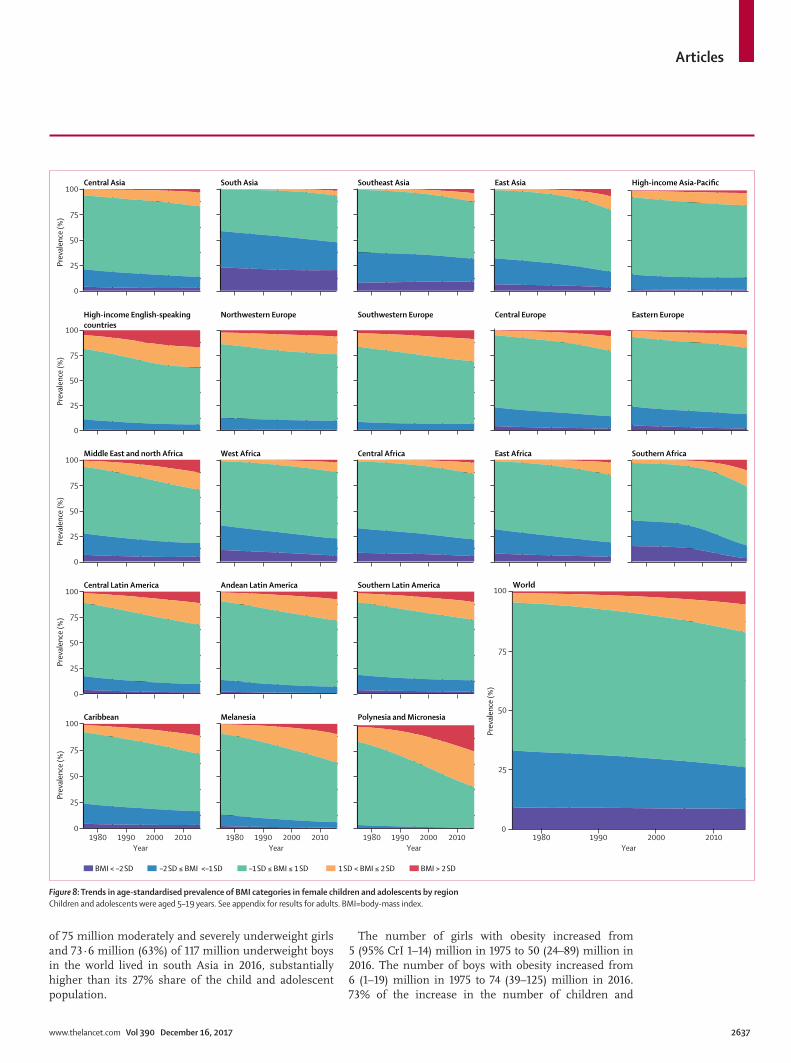
Globally, the prevalence of moderate and severe underweight changed less than the rise in obesity, from 9·2% (95% CrI 6·0–12·9) in 1975 to 8·4% (6·8–10·1) in 2016 in girls and from 14·8% (10·4–19·5) in 1975 to 12·4% (10·3–14·5) in 2016 in boys. The relatively small change in moderate and severe under-weight prevalence at the global level, however, was partly due to faster population growth in regions where underweight prevalence is higher (eg, the share of children and adolescents living in south Asia, where prevalence is highest, increased from 20·5% in 1975 to 26·4% in 2016 in girls, and 21·1% in 1975 to 27·1% in 2016 in boys) while prevalence declined in most regions. The largest proportional decline in the prevalence of moderate and severe underweight occurred in Polynesia and Micronesia and in southern Africa in both sexes, where prevalence declined by an average of up to one third per decade for girls and by about one fifth per decade for boys from 1975 to 2016 (figures 8 and 9). There was a non-significant rise of about 6% per decade (PP=0·6630) in underweight in girls in southeast Asia. Nonetheless, in most regions, the increase in the prevalence of overweight and obesity was larger than the decline in the prevalence of underweight (figures 8 and 9), ie, the width of the BMI distribution increased.
Regionally, moderate and severe underweight preva-lence was highest in south Asia over the entire analysis period, at 20·3% (95% CrI 15·3–25·8) in girls and 28·6% (22·3–35·0) in boys in 2016, having decreased from 23·0% (13·9–33·6) in girls and 37·8% (26·6–49·2) in boys in 1975. Prevalence of obesity was highest in Polynesia and Micronesia in both sexes, 25·4% (16·8–35·2) in girls and 22·4% (13·4–32·9) in boys, followed by the high-income English-speaking region.
Nationally, the prevalence of moderate and severe underweight was less than 1% among girls in 45 countries and among boys in 29 countries in 2016 (figure 3). Prevalence of moderate and severe under-weight was high throughout south Asia, reaching 22·7% (95% CrI 16·7–29·6) among girls and 30·7% (23·5–38·0) among boys in India. Obesity prevalence was between 1% and 2% among girls in Cambodia, Burkina Faso, Vietnam, Ethiopia, India, Madagascar, Republic of the Congo, Japan, Nepal, Niger, and Chad. Obesity prevalence was less than 1% among boys in Uganda, Rwanda, Niger, Burkina Faso, Ethiopia, Guinea, Chad, and Senegal and between 1% and 2% in another 24 countries.
Conversely, obesity prevalence was more than 30% in girls in Nauru, the Cook Islands, and Palau and boys in the Cook Islands, Nauru, Palau, Niue, and American Samoa in 2016, and was also high, around or above 20%, in some countries in Polynesia and Micronesia, the Middle East and north Africa (eg, Egypt, Kuwait, Qatar, and Saudi Arabia), the Caribbean (Bermuda and Puerto Rico), and in the USA. In 1975, obesity prevalence was less than 10% in every country except Nauru and Bermuda, where it was still less than 20%. From 1975 to 2016, obesity prevalence increased in every country, although the increase was not statistically significant in some high-income countries.
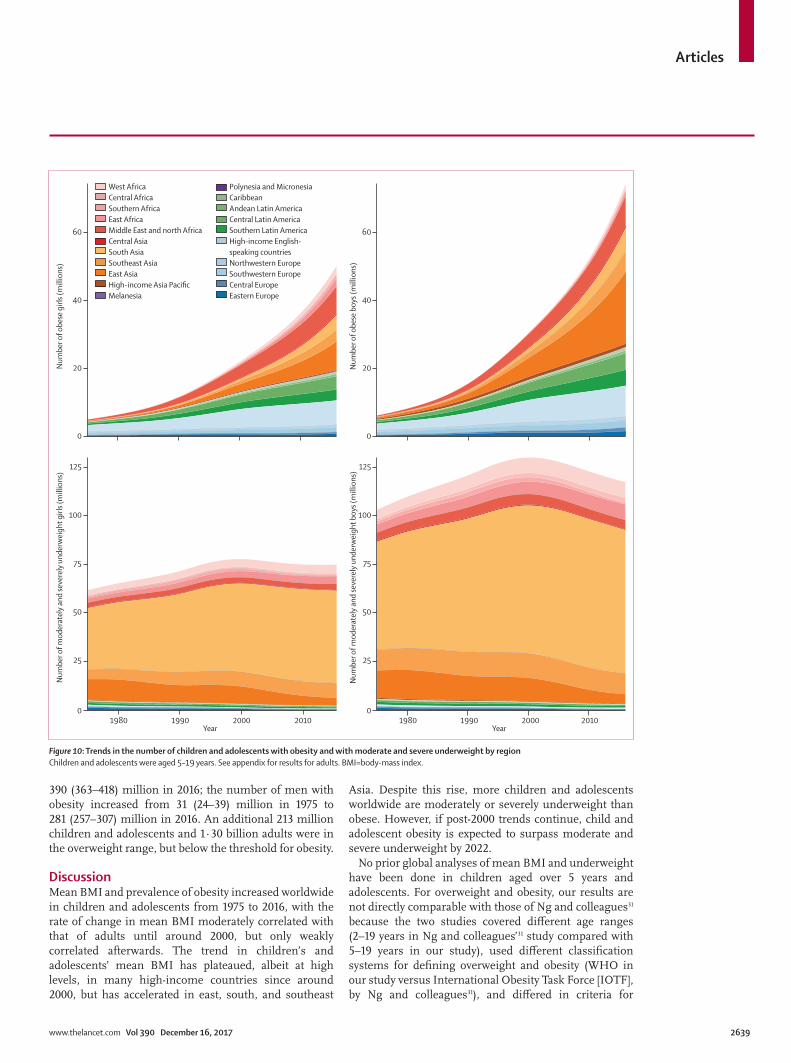
The number of moderately and severely underweight girls and boys worldwide peaked around the year 2000, and subsequently decreased to 75 (95% CrI 44–117) million girls and 117 (70–178) million boys in 2016, slightly higher than in 1975 (figure 10). In most regions, the number of moderately and severely underweight children and adolescents decreased despite population growth. The exceptions were south Asia; southeast Asia; and central, east, and west Africa, where population growth led to an increase in the absolute underweight burden, despite declining prevalence. 47·5 million (63%)
Figure 7: Comparison of age-standardised mean BMI in 1975 and 2016, and change per decade in age-standardised mean BMI from 1975 to 2016 by sexEach point shows one country. BMI=body-mass index.
14 16 18 20 22 24 26
14
16
18
20
22
24
26
Age-
stan
dard
ised
BMI i
n gi
rls (k
g/m
²)1975
14 16 18 20 22 24 26
2016
0 0·5 1·0
0
0·5
1·0
Chan
ge in
age
-sta
ndar
dise
dBM
I in
girls
(kg/
m²/d
ecad
e)
Sub-Saharan AfricaCentral Asia, Middle East, and north Africa
South AsiaEast and southeast Asia
Latin America and CaribbeanHigh-income western
Central and eastern Europe
Age-standardised BMI in boys (kg/m²) Age-standardised BMI in boys (kg/m²) Change in age-standardised BMI in boys(kg/m²/decade)
High-income Asia-PacificOceania
Articles
www.thelancet.com Vol 390 December 16, 2017 2637
of 75 million moderately and severely underweight girls and 73·6 million (63%) of 117 million underweight boys in the world lived in south Asia in 2016, substantially higher than its 27% share of the child and adolescent population.
The number of girls with obesity increased from 5 (95% CrI 1–14) million in 1975 to 50 (24–89) million in 2016. The number of boys with obesity increased from 6 (1–19) million in 1975 to 74 (39–125) million in 2016. 73% of the increase in the number of children and
World
BMI < –2 SD –2 SD ≤ BMI <–1 SD –1 SD ≤ BMI ≤ 1 SD 1 SD < BMI ≤ 2 SD BMI > 2 SD
Central Asia
High-income English-speakingcountries
Middle East and north Africa
Central Latin America
Caribbean
Prev
alen
ce (%
)Pr
eval
ence
(%)
Prev
alen
ce (%
)Pr
eval
ence
(%)
Prev
alen
ce (%
)
0
25
50
75
100
0
25
50
75
100
0
25
50
75
100
0
25
50
75
100
0
25
50
75
100
Prev
alen
ce (%
)
0
25
50
75
100
1980 1990 2000Year Year Year Year
2010 1980 1990 2000 2010 1980 1990 2000 2010 1980 1990 2000 2010
South Asia
Northwestern Europe
West Africa
Andean Latin America
Melanesia
Southeast Asia
Southwestern Europe
Central Africa
Southern Latin America
Polynesia and Micronesia
East Asia
Central Europe
East Africa
High-income Asia-Pacific
Eastern Europe
Southern Africa
Figure 8: Trends in age-standardised prevalence of BMI categories in female children and adolescents by regionChildren and adolescents were aged 5–19 years. See appendix for results for adults. BMI=body-mass index.
Articles
2638 www.thelancet.com Vol 390 December 16, 2017
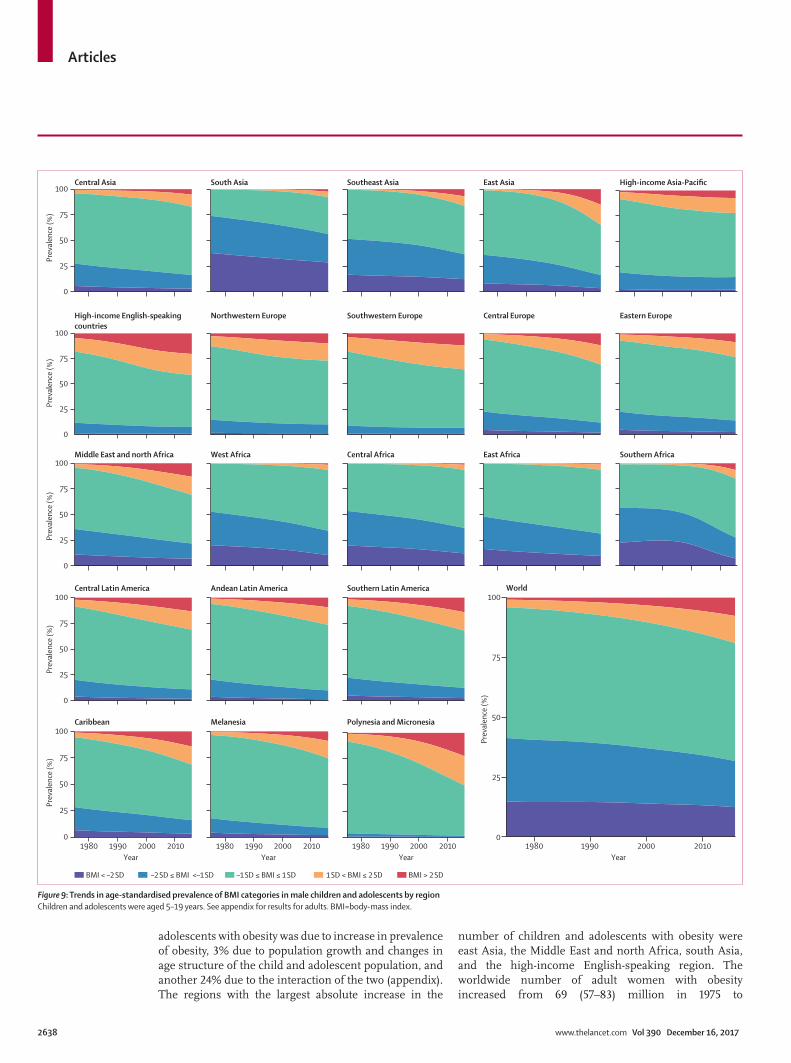
adolescents with obesity was due to increase in prevalence of obesity, 3% due to population growth and changes in age structure of the child and adolescent population, and another 24% due to the interaction of the two (appendix). The regions with the largest absolute increase in the
number of children and adolescents with obesity were east Asia, the Middle East and north Africa, south Asia, and the high-income English-speaking region. The worldwide number of adult women with obesity increased from 69 (57–83) million in 1975 to
BMI < –2 SD –2 SD ≤ BMI <–1 SD –1 SD ≤ BMI ≤ 1 SD 1 SD < BMI ≤ 2 SD BMI > 2 SD
0
25
50
75
100Central Asia South Asia Southeast Asia East Asia High-income Asia-Pacific
0
25
50
75
100
0
25
50
75
100Middle East and north Africa West Africa Central Africa East Africa Southern Africa
0
25
50
75
100Central Latin America Andean Latin America Southern Latin America
01980 1990 2000 2010 1980 1990 2000 2010 1980 1990 2000 2010
25
50
75
100Caribbean Melanesia Polynesia and Micronesia
World
Year Year Year1980 1990 2000 2010
Year
Prev
alen
ce (%
)Pr
eval
ence
(%)
Prev
alen
ce (%
)Pr
eval
ence
(%)
0
25
50
75
100
Prev
alen
ce (%
)
Prev
alen
ce (%
)
High-income English-speakingcountries
Northwestern Europe Southwestern Europe Central Europe Eastern Europe
Figure 9: Trends in age-standardised prevalence of BMI categories in male children and adolescents by regionChildren and adolescents were aged 5–19 years. See appendix for results for adults. BMI=body-mass index.
Articles
www.thelancet.com Vol 390 December 16, 2017 2639
390 (363–418) million in 2016; the number of men with obesity increased from 31 (24–39) million in 1975 to 281 (257–307) million in 2016. An additional 213 million children and adolescents and 1·30 billion adults were in the overweight range, but below the threshold for obesity.
DiscussionMean BMI and prevalence of obesity increased worldwide in children and adolescents from 1975 to 2016, with the rate of change in mean BMI moderately correlated with that of adults until around 2000, but only weakly correlated afterwards. The trend in children’s and adolescents’ mean BMI has plateaued, albeit at high levels, in many high-income countries since around 2000, but has accelerated in east, south, and southeast
Asia. Despite this rise, more children and adolescents worldwide are moderately or severely underweight than obese. However, if post-2000 trends continue, child and adolescent obesity is expected to surpass moderate and severe underweight by 2022.
No prior global analyses of mean BMI and underweight have been done in children aged over 5 years and adolescents. For overweight and obesity, our results are not directly comparable with those of Ng and colleagues31 because the two studies covered different age ranges (2–19 years in Ng and colleagues’31 study compared with 5–19 years in our study), used different classification systems for defining overweight and obesity (WHO in our study versus International Obesity Task Force [IOTF], by Ng and colleagues31), and differed in criteria for
Figure 10: Trends in the number of children and adolescents with obesity and with moderate and severe underweight by regionChildren and adolescents were aged 5–19 years. See appendix for results for adults. BMI=body-mass index.
0
20
40
60
125
100
75
50
25
0
125
100
75
50
25
0
0
1980 1990 2000 2010 1980 1990Year Year
2000 2010
20
40
60
Num
ber o
f obe
se g
irls (
mill
ions
)N
umbe
r of m
oder
atel
y an
d se
vere
ly u
nder
wei
ght g
irls (
mill
ions
)
Num
ber o
f obe
se b
oys (
mill
ions
)N
umbe
r of m
oder
atel
y an
d se
vere
ly u
nder
wei
ght b
oys (
mill
ions
)
West AfricaCentral AfricaSouthern AfricaEast AfricaMiddle East and north AfricaCentral AsiaSouth AsiaSoutheast AsiaEast AsiaHigh-income Asia PacificMelanesia
Polynesia and MicronesiaCaribbeanAndean Latin AmericaCentral Latin AmericaSouthern Latin AmericaHigh-income English-speaking countriesNorthwestern EuropeSouthwestern EuropeCentral EuropeEastern Europe
Articles
2640 www.thelancet.com Vol 390 December 16, 2017
including data (only measured height and weight in our study versus measured and self-reported by Ng and colleagues31). Nonetheless, both studies concluded that the rise in excess weight in children and adolescents has plateaued in high-income countries but continues in low-income and middle-income countries. The plateau in children’s and adolescents’ overweight and obesity in high-income countries32–34 and the relatively rapid transition from underweight to overweight and obesity in low-income and middle-income countries35,36 have also been noted in specific countries.
Our study is the first to make comparable estimates of mean BMI and the prevalence of a complete set of BMI categories with clinical and public health relevance—from underweight to obesity. We used an unprecedented amount of population-based data from almost all of the world’s countries, while maintaining a high standard of data quality and using only measured height and weight data to avoid the bias in self-reported data. Characteristics of data sources were verified through repeated checks by NCD-RisC members, and data that could be systematically different from the general population were excluded, eg, those from samples of students or of ever-married women in ages and countries with low school enrolment or marriage rates. Data were analysed according to a common protocol to obtain the required mean and prevalence by age and sex. Finally, we used a statistical model that used all available data while giving more weight to national data than subnational and community studies, and took into account the epi-demiological features of outcomes such as BMI by using non-linear time trends and age associations, and differences between rural and urban populations.
Despite using the most comprehensive global data-base of human anthropometry to date, some countries and regions had fewer data sources, especially those in the Caribbean, Polynesia and Micronesia, Melanesia, and central Asia. The scarcity of data is reflected in wider uncertainty intervals of our estimates for these countries and regions. Of sources with data on children and adolescents, 39·9% had data for 5–9 years of age, 50·3% for 10–14 years, and 78·9% for 15–19 years. Many sources with data on children aged 5–9 years were school-based measurement studies in high-income countries where school enrolment is almost universal. The relative paucity of data on children aged 5–9 years restricted our capacity to compare trends in this age group with those of adolescents, despite some evidence from high-income countries that trends are somewhat different before and after 10 years of age.33 Finally, although the age-dependent cutoffs for defining overweight and obesity in children and adolescents reflect natural growth in these ages, they are based on BMI distributions in a reference population, and not explicitly selected to represent optimal BMI levels for health in prospective studies, as done for adults, or optimal nutritional status, as done for children younger
than 5 years. The reference population used by WHO,16 and the cutoffs for defining overweight and obesity, differ from those used by IOTF37,38 and the US Centers for Disease Control and Prevention (CDC). Specifically, in the WHO classification, a BMI of 30 kg/m² at ages 18–19 years corresponds to 2 SD (ie, about the 97·5th percentile) from the median of the reference population;16 in the IOTF classification, a BMI of 30 kg/m² at age 18 years corres ponds to the 98·6th percentile for girls and the 98·9th percentile for boys.38 While at 18 years the two systems classify the same children as obese, at younger ages a smaller proportion are classified as obese according to the IOTF definition compared with the WHO definition.38 For this reason, comparisons of overweight and obesity prevalence based on the three definitions36,39–42 found that prevalence using the WHO classification was higher than those of IOTF and CDC, but that trends are similar.
The effectiveness of interventions for overweight and obesity in children and adolescents has been reviewed in several systematic reviews and modelling studies,3,43–47 but how they are selected for implementation and their post-implementation effects at the population level are rarely investigated.48 For this reason, there is no systematic information on the determinants of the divergent trends in BMI in children and adolescents and in adults, be it on food environments and behaviours or on policies that affect them. The plateauing of children’s and adolescents’ BMI in high-income countries as adult BMI continues to increase might be due to specific initiatives by governments, community groups, schools, and notable individuals that have increased public awareness about overweight and obesity in children, leading to changes in nutrition and activity that are sufficient to curb the rise in mean BMI.
A general feature of policies that target overweight and obesity in children and adolescents in high-income countries is a reluctance to use taxes and industry regulations to change eating and drinking behaviours.12,49 Some middle-income countries are also adopting policies to combat overweight and obesity in children and adolescents, in some cases with a stronger emphasis on regulation and taxes than in high-income countries.48 While momentum might be gathering to use taxes and regulations to reduce the consumption of energy-dense foods, few policies and programmes attempt to make healthy foods such as whole grains and fresh fruits and vegetables more affordable through targeted price subsidies, (conditional) cash transfers and food vouchers, or healthy school meals.50 Unaffordability of healthy food options not only leads to social inequalities in overweight and obesity,51,52 but might also limit the effect of policies that target unhealthy foods. Finally, efforts in population-based prevention of over-weight and obesity in children and adolescents should be matched with enhancing access to health-care
Articles
www.thelancet.com Vol 390 December 16, 2017 2641
interventions for weight management and for reducing the adverse effects of obesity, including intensive behavioural therapy to change diet and exercise; screening for and management of hypertension, glucose intolerance, dyslipidaemia, and abnormal liver function in children and adolescents with obesity; and in extreme cases bariatric surgery.4,53,54
Our finding that the number of children and adolescents aged 5–19 years in the world who are moderately or severely underweight remains larger than those who are obese shows the continued need for policies that enhance food security in low-income countries and households, especially in south Asia. Yet the experiences of east Asia and Latin America and the Caribbean show that the transition from underweight to overweight and obesity can be rapid, and overwhelm the national capacity needed to engender a healthy transition. More broadly, in an unhealthy nutritional transition, an increase in nutrient-poor, energy-dense foods can lead to stunted growth along with weight gain in children, adolescents, and adults, resulting in higher BMI and worse health outcomes throughout the life-course. Therefore, the findings from our comprehensive analysis of trends in underweight, as well as overweight and obesity highlight the disconnect between the global dialogue on overweight and obesity, which has largely overlooked the remaining undernutrition burden, and the initiatives and donors focusing on undernutrition that have paid little attention to the looming burden of overweight and obesity, itself a risk factor for adverse pregnancy outcomes.2 The Sustainable Development Goals, which address poverty, education, nutrition, and universal health coverage, provide an opportunity for integrating policies that coherently address underweight and overweight in children and adolescents, and their health consequences, effectively and equitably. Doing so would require commitment from national and international agencies and donors for replacing the fragmented focus with an integrated approach.ContributorsME designed the study and oversaw research. Members of the Country and Regional Data Group collected and reanalysed data, and checked pooled data for accuracy of information about their study and other studies in their country. MDC, VB, HB, and BZ led data collection. JB led the statistical analysis and prepared results. Members of the Pooled Analysis and Writing Group contributed to study design, collated data, checked all data sources in consultation with the Country and Regional Data Group, analysed pooled data, and prepared results. ME and JB wrote the first draft of the report with input from other members of the Pooled Analysis and Writing Group. Members of the Country and Regional Data Group commented on the draft report. The authors alone are responsible for the views expressed in this Article and they do not necessarily represent the views, decisions, or policies of the institutions with which they are affiliated.
Declaration of interestsME reports a charitable grant from the AstraZeneca Young Health Programme, and personal fees from Prudential, Scor, and Third Bridge, outside the submitted work. All other authors declare no competing interests.
AcknowledgmentsWe thank WHO country and regional offices and World Heart Federation for support in data identification and access. We thank Tim Cole for valuable discussions on different classifications systems of underweight, overweight, and obesity. VB is supported by an Imperial College Junior Research Fellowship.
References1 Han Z, Mulla S, Beyene J, Liao G, McDonald SD. Maternal
underweight and the risk of preterm birth and low birth weight: a systematic review and meta-analyses. Int J Epidemiol 2011; 40: 65–101.
2 Black RE, Victora CG, Walker SP, et al. Maternal and child undernutrition and overweight in low-income and middle-income countries. Lancet 2013; 382: 427–51.
3 WHO. Consideration of the evidence on childhood obesity for the Commission on Ending Childhood Obesity: report of the Ad hoc Working Group on Science and Evidence for Ending Childhood Obesity. Geneva: World Health Organization, 2016.
4 Lobstein T, Baur L, Uauy R. Obesity in children and young people: a crisis in public health. Obes Rev 2004; 5: 4–85.
5 MacLean P, Higgins J, Giles E, Sherk V, Jackman M. The role for adipose tissue in weight regain after weight loss. Obes Rev 2015; 16: 45–54.
6 Singh AS, Mulder C, Twisk JW, van Mechelen W, Chinapaw MJ. Tracking of childhood overweight into adulthood: a systematic review of the literature. Obes Rev 2008; 9: 474–88.
7 Must A, Jacques PF, Dallal GE, Bajema CJ, Dietz WH. Long-term morbidity and mortality of overweight adolescents. A follow-up of the Harvard Growth Study of 1922 to 1935. N Engl J Med 1992; 327: 1350–55.
8 Abdullah A, Wolfe R, Stoelwinder JU, et al. The number of years lived with obesity and the risk of all-cause and cause-specific mortality. Int J Epidemiol 2011; 40: 985–96.
9 Park M, Falconer C, Viner R, Kinra S. The impact of childhood obesity on morbidity and mortality in adulthood: a systematic review. Obes Rev 2012; 13: 985–1000.
10 Caird J, Kavanagh J, O’Mara-Eves A, et al. Does being overweight impede academic attainment? A systematic review. Health Educ J 2014; 73: 497–521.
11 Quek YH, Tam WW, Zhang MW, Ho R. Exploring the association between childhood and adolescent obesity and depression: a meta-analysis. Obes Rev 2017; 18: 742–54.
12 Kraak VI, Vandevijvere S, Sacks G, et al. Progress achieved in restricting the marketing of high-fat, sugary and salty food and beverage products to children. Bull World Health Organ 2016; 94: 540–48.
13 NCD Risk Factor Collaboration (NCD-RisC). Trends in adult body-mass index in 200 countries from 1975 to 2014: a pooled analysis of 1698 population-based measurement studies with 19·2 million participants. Lancet 2016; 387: 1377–96.
14 de Onis M, Lobstein T. Defining obesity risk status in the general childhood population: which cut-offs should we use? Int J Pediatr Obes 2010; 5: 458–60.
15 Pérez-Rodrigo C, Aranceta J. School-based nutrition education: lessons learned and new perspectives. Public Health Nutr 2001; 4: 131–39.
16 de Onis M, Onyango AW, Borghi E, Siyam A, Nishida C, Siekmann J. Development of a WHO growth reference for school-aged children and adolescents. Bull World Health Organ 2007; 85: 660–67.
17 Popkin BM, Conde W, Hou N, Monteiro C. Is there a lag globally in overweight trends for children compared with adults? Obesity (Silver Spring) 2006; 14: 1846–53.
18 Finucane MM, Stevens GA, Cowan MJ, et al. National, regional, and global trends in body-mass index since 1980: systematic analysis of health examination surveys and epidemiological studies with 960 country-years and 9·1 million participants. Lancet 2011; 377: 557–67.
19 Danaei G, Finucane MM, Lin JK, et al. National, regional, and global trends in systolic blood pressure since 1980: systematic analysis of health examination surveys and epidemiological studies with 786 country-years and 5·4 million participants. Lancet 2011; 377: 568–77.
Articles
2642 www.thelancet.com Vol 390 December 16, 2017
20 Danaei G, Finucane MM, Lu Y, et al. National, regional, and global trends in fasting plasma glucose and diabetes prevalence since 1980: systematic analysis of health examination surveys and epidemiological studies with 370 country-years and 2·7 million participants. Lancet 2011; 378: 31–40.
21 Farzadfar F, Finucane MM, Danaei G, et al. National, regional, and global trends in serum total cholesterol since 1980: systematic analysis of health examination surveys and epidemiological studies with 321 country-years and 3·0 million participants. Lancet 2011; 377: 578–86.
22 Gorber SC, Tremblay M, Moher D, Gorber B. A comparison of direct vs. self–report measures for assessing height, weight and body mass index: a systematic review. Obes Rev 2007; 8: 307–26.
23 Ezzati M, Martin H, Skjold S, Vander Hoorn S, Murray CJ. Trends in national and state-level obesity in the USA after correction for self-report bias: analysis of health surveys. J R Soc Med 2006; 99: 250–57.
24 Hayes AJ, Clarke PM, Lung TW. Change in bias in self-reported body mass index in Australia between 1995 and 2008 and the evaluation of correction equations. Popul Health Metr 2011; 9: 53.
25 Finucane MM, Paciorek CJ, Danaei G, Ezzati M. Bayesian estimation of population-level trends in measures of health status. Stat Sci 2014; 29: 18–25.
26 NCD Risk Factor Collaboration (NCD-RisC). Worldwide trends in diabetes since 1980: a pooled analysis of 751 population-based studies with 4·4 million participants. Lancet 2016; 387: 1513–30.
27 NCD Risk Factor Collaboration (NCD-RisC). A century of trends in adult human height. eLife 2016; 5: e13410.
28 NCD Risk Factor Collaboration (NCD-RisC). Worldwide trends in blood pressure from 1975 to 2015: a pooled analysis of 1479 population-based measurement studies with 19·1 million participants. Lancet 2017; 389: 37–55.
29 Danaei G, Singh GM, Paciorek CJ, et al. The global cardiovascular risk transition: associations of four metabolic risk factors with macroeconomic variables in 1980 and 2008. Circulation 2013; 127: 1493–502.
30 Ahmad OB, Boschi-Pinto C, Lopez AD, Murray CJ, Lozano R, Inoue M. Age standardization of rates: a new WHO standard. Geneva: World Health Organization; 2001: 1–14.
31 Ng M, Fleming T, Robinson M, et al. Global, regional, and national prevalence of overweight and obesity in children and adults during 1980–2013: a systematic analysis for the Global Burden of Disease Study 2013. Lancet 2014; 384: 766–81.
32 Wabitsch M, Moss A, Kromeyer-Hauschild K. Unexpected plateauing of childhood obesity rates in developed countries. BMC Medicine 2014; 12: 17.
33 Olds T, Maher C, Zumin S, et al. Evidence that the prevalence of childhood overweight is plateauing: data from nine countries. Int J Pediatr Obes 2011; 6: 342–60.
34 Rokholm B, Baker JL, Sørensen TIA. The levelling off of the obesity epidemic since the year 1999–a review of evidence and perspectives. Obes Rev 2010; 11: 835–46.
35 Muthuri SK, Francis CE, Wachira L-JM, et al. Evidence of an overweight/obesity transition among school-aged children and youth in Sub-Saharan Africa: a systematic review. PLoS One 2014; 9: e92846.
36 Rivera JÁ, de Cossío TG, Pedraza LS, Aburto TC, Sánchez TG, Martorell R. Childhood and adolescent overweight and obesity in Latin America: a systematic review. Lancet Diabetes Endocrinol 2014; 2: 321–32.
37 Cole TJ, Bellizzi MC, Flegal KM, Dietz WH. Establishing a standard definition for child overweight and obesity worldwide: international survey. BMJ 2000; 320: 1240–43.
38 Cole TJ, Lobstein T. Extended international (IOTF) body mass index cut-offs for thinness, overweight and obesity. Pediatr Obes 2012; 7: 284–94.
39 Rito A, Wijnhoven TM, Rutter H, et al. Prevalence of obesity among Portuguese children (6-8 years old) using three definition criteria: COSI Portugal, 2008. Pediatr Obes 2012; 7: 413–22.
40 Song Y, Wang H-J, Dong B, Ma J, Wang Z, Agardh A. 25-year trends in gender disparity for obesity and overweight by using WHO and IOTF definitions among Chinese school-aged children: a multiple cross-sectional study. BMJ Open 2016; 6: e011904.
41 Bahk J, Khang Y-H. Trends in measures of childhood obesity in Korea from 1998 to 2012. J Epidemiol 2016; 26: 199–207.
42 Ahrens W, Pigeot I, Pohlabeln H, et al. Prevalence of overweight and obesity in European children below the age of 10. Int J Obes 2014; 38: S99–107.
43 Waters E, de Silva-Sanigorski A, Hall BJ, et al. Interventions for preventing obesity in children. Cochrane Database Syst Rev 2011; 12: CD001871.
44 Wang Y, Cai L, Wu Y, et al. What childhood obesity prevention programmes work? A systematic review and meta-analysis. Obes Rev 2015; 16: 547–65.
45 Sobol-Goldberg S, Rabinowitz J, Gross R. School-based obesity prevention programs: a meta-analysis of randomized controlled trials. Obesity 2013; 21: 2422–28.
46 Lobstein T, Jackson-Leach R, Moodie ML, et al. Child and adolescent obesity: part of a bigger picture. Lancet 2015; 385: 2510–20.
47 Gortmaker SL, Wang YC, Long MW, et al. Three interventions that reduce childhood obesity are projected to save more than they cost to implement. Health Aff (Millwood) 2015; 34: 1932–39.
48 Popkin BM. Relationship between shifts in food system dynamics and acceleration of the global nutrition transition. Nutr Rev 2017; 75: 73–82.
49 Hawkes C, Harris JL. An analysis of the content of food industry pledges on marketing to children. Public Health Nutr 2011; 14: 1403–14.
50 Bleich SN, Rimm EB, Brownell KD. US nutrition assistance, 2018—modifying SNAP to promote population health. N Engl J Med 2017; 376: 1205–07.
51 Darmon N, Drewnowski A. Contribution of food prices and diet cost to socioeconomic disparities in diet quality and health: a systematic review and analysis. Nutr Rev 2015; 73: 643–60.
52 Powell LM, Chriqui JF, Khan T, Wada R, Chaloupka FJ. Assessing the potential effectiveness of food and beverage taxes and subsidies for improving public health: a systematic review of prices, demand and body weight outcomes. Obes Rev 2013; 14: 110–28.
53 Dietz WH, Baur LA, Hall K, et al. Management of obesity: improvement of health-care training and systems for prevention and care. Lancet 2015; 385: 2521–33.
54 US Preventive Services Task Force. Screening for obesity in children and adolescents: US Preventive Services Task Force recommendation statement. JAMA 2017; 317: 2417–26.