Eye Gaze and Individual Differences Consistent With ...kruschke/articles/KruschkeKH2005.pdfEye Gaze...
16
Eye Gaze and Individual Differences Consistent With Learned Attention in Associative Blocking and Highlighting John K. Kruschke, Emily S. Kappenman, and William P. Hetrick Indiana University Bloomington The associative learning effects called blocking and highlighting have previously been explained by covert learned attention, but evidence for learned attention has been indirect, via models of response choice. The present research reports results from eye tracking consistent with the attentional hypothesis: Gaze duration is diminished for blocked cues and augmented for highlighted cues. If degree of attentional learning varies across individuals but is relatively stable within individuals, then the magnitude of blocking and highlighting should covary across individuals. This predicted correlation is obtained for both choice and eye gaze. A connectionist model that implements attentional learning is shown to fit the data and account for individual differences by variation in its attentional parameters. Keywords: blocking, highlighting, learned attention, eye tracking, individual differences The phenomenon of blocking has become a touchstone for theories of learning. Reported initially by Kamin (1968, 1969) and found thereafter in numerous species and procedures, the phenom- enon forced a revolution in theories of learning. In the blocking procedure, a person initially learns to predict an outcome from a single cue. Subsequently, the cue is always accompanied by a second cue, still leading to the same outcome. People tend not to learn a strong association between the second cue and the out- come; that is, previous learning about the first cue has blocked learning about the second cue. This blocking challenges some theories of learning because the second cue has co-occurred with the outcome quite often and their association should be learned. A complementary phenomenon called highlighting suggests augmented learning about a cue, in contrast to the diminished learning in blocking (Kruschke, 2003a). This phenomenon is ex- tremely challenging to learning theories, even those that were created to account for blocking (such as the Rescorla-Wagner model, which will be explained below). In a highlighting proce- dure, participants initially learn that a pair of cues leads to an outcome. Later, participants learn that one of those cues, paired with a different cue, leads to a different outcome. The result is that the association from the distinctive cue to the later-learned out- come is apparently very strong; that is, learning about the distinc- tive cue has been highlighted. To our knowledge, only attentional theory (Kruschke, 2003a) explains both highlighting and blocking. According to this ap- proach, highlighting occurs because people have learned to attend to the distinctive cue for the new outcome. Blocking occurs, at least in part but not fully, because people have learned to ignore the redundant cue. The attentional theory will be explained in more detail later; for now we wish to emphasize that the attention posited in this theory is a theoretical construct referring to a covert aspect of cognition. The formal theory simply states that more strongly attended cues are multiplied by a larger factor in respond- ing and learning. The magnitude of the covert attentional factor is inferred from observed choice data via a mathematical model. The present research is based on the additional premise that overt eye gaze is correlated with the covert attention hypothesized by the learning theory. If this is true, then blocked cues should be gazed at less than control cues, and highlighted cues should be gazed at more than control cues. In this article we report strong confirmation of these predictions. Although the formal attentional theory makes no commitment to the eye gaze premise, and al- though the exact mechanisms by which covert attention is mani- fested in eye gaze are unspecified, the new eye gaze results are highly suggestive of attentional processes in associative learning. In mathematical models of attentional learning (e.g., Kruschke, 2001b), the magnitude of attentional shifting and learning is gov- erned by corresponding parameter values. These parameter values might be determined in part by situational influences and random noise. We make the additional assumption that the attentional shifting and learning magnitudes are, in part, relatively stable and enduring individual traits. This assumption implies that individuals with low attentional shifting rates will show small amounts of blocking and highlighting, whereas individuals with high atten- tional shifting rates will show large amounts of blocking and John K. Kruschke, Emily S. Kappenman, and William P. Hetrick, Department of Psychology, Indiana University Bloomington. This research was supported in part by Grant BCS-9910720 from the National Science Foundation to John K. Kruschke, a Young Investigator Award from the National Alliance for Research on Schizophrenia and Grant R03-MH066149-01A1 from the National Institute of Mental Health to William P. Hetrick, and the Clinical Science Research Training Grant T32-MH017146-20 from the National Institute of Mental Health to Indiana University, Richard McFall, Principle Investigator. We thank Patrick Hill, Blake Hulet, Angela Prather, and Ruth Ann Weaver for their assistance in administering the experiment. Thanks also to Derek Koehler, Douglas Medin, and Michael Young for constructive comments on a draft. John K. Kruschke’s World Wide Web page is at http://www.indiana.edu/kruschke/ Correspondence concerning this article should be addressed to John K. Kruschke, Department of Psychology, Indiana University Bloomington, 1101 East 10th Street, Bloomington, IN 47405-7007. E-mail: [email protected] Journal of Experimental Psychology: Copyright 2005 by the American Psychological Association Learning, Memory, and Cognition 2005, Vol. 31, No. 5, 830 – 845 0278-7393/05/$12.00 DOI: 10.1037/0278-7393.31.5.830 830
Transcript of Eye Gaze and Individual Differences Consistent With ...kruschke/articles/KruschkeKH2005.pdfEye Gaze...
Eye Gaze and Individual Differences Consistent With Learned Attention inAssociative Blocking and Highlighting
John K. Kruschke, Emily S. Kappenman, and William P. HetrickIndiana University Bloomington
The associative learning effects called blocking and highlighting have previously been explained bycovert learned attention, but evidence for learned attention has been indirect, via models of responsechoice. The present research reports results from eye tracking consistent with the attentional hypothesis:Gaze duration is diminished for blocked cues and augmented for highlighted cues. If degree of attentionallearning varies across individuals but is relatively stable within individuals, then the magnitude ofblocking and highlighting should covary across individuals. This predicted correlation is obtained forboth choice and eye gaze. A connectionist model that implements attentional learning is shown to fit thedata and account for individual differences by variation in its attentional parameters.
Keywords: blocking, highlighting, learned attention, eye tracking, individual differences
The phenomenon of blocking has become a touchstone fortheories of learning. Reported initially by Kamin (1968, 1969) andfound thereafter in numerous species and procedures, the phenom-enon forced a revolution in theories of learning. In the blockingprocedure, a person initially learns to predict an outcome from asingle cue. Subsequently, the cue is always accompanied by asecond cue, still leading to the same outcome. People tend not tolearn a strong association between the second cue and the out-come; that is, previous learning about the first cue has blockedlearning about the second cue. This blocking challenges sometheories of learning because the second cue has co-occurred withthe outcome quite often and their association should be learned.
A complementary phenomenon called highlighting suggestsaugmented learning about a cue, in contrast to the diminishedlearning in blocking (Kruschke, 2003a). This phenomenon is ex-tremely challenging to learning theories, even those that werecreated to account for blocking (such as the Rescorla-Wagnermodel, which will be explained below). In a highlighting proce-dure, participants initially learn that a pair of cues leads to an
outcome. Later, participants learn that one of those cues, pairedwith a different cue, leads to a different outcome. The result is thatthe association from the distinctive cue to the later-learned out-come is apparently very strong; that is, learning about the distinc-tive cue has been highlighted.
To our knowledge, only attentional theory (Kruschke, 2003a)explains both highlighting and blocking. According to this ap-proach, highlighting occurs because people have learned to attendto the distinctive cue for the new outcome. Blocking occurs, atleast in part but not fully, because people have learned to ignorethe redundant cue. The attentional theory will be explained in moredetail later; for now we wish to emphasize that the attentionposited in this theory is a theoretical construct referring to a covertaspect of cognition. The formal theory simply states that morestrongly attended cues are multiplied by a larger factor in respond-ing and learning. The magnitude of the covert attentional factor isinferred from observed choice data via a mathematical model.
The present research is based on the additional premise thatovert eye gaze is correlated with the covert attention hypothesizedby the learning theory. If this is true, then blocked cues should begazed at less than control cues, and highlighted cues should begazed at more than control cues. In this article we report strongconfirmation of these predictions. Although the formal attentionaltheory makes no commitment to the eye gaze premise, and al-though the exact mechanisms by which covert attention is mani-fested in eye gaze are unspecified, the new eye gaze results arehighly suggestive of attentional processes in associative learning.
In mathematical models of attentional learning (e.g., Kruschke,2001b), the magnitude of attentional shifting and learning is gov-erned by corresponding parameter values. These parameter valuesmight be determined in part by situational influences and randomnoise. We make the additional assumption that the attentionalshifting and learning magnitudes are, in part, relatively stable andenduring individual traits. This assumption implies that individualswith low attentional shifting rates will show small amounts ofblocking and highlighting, whereas individuals with high atten-tional shifting rates will show large amounts of blocking and
John K. Kruschke, Emily S. Kappenman, and William P. Hetrick,Department of Psychology, Indiana University Bloomington.
This research was supported in part by Grant BCS-9910720 from theNational Science Foundation to John K. Kruschke, a Young InvestigatorAward from the National Alliance for Research on Schizophrenia andGrant R03-MH066149-01A1 from the National Institute of Mental Healthto William P. Hetrick, and the Clinical Science Research Training GrantT32-MH017146-20 from the National Institute of Mental Health to IndianaUniversity, Richard McFall, Principle Investigator.
We thank Patrick Hill, Blake Hulet, Angela Prather, and Ruth AnnWeaver for their assistance in administering the experiment. Thanks also toDerek Koehler, Douglas Medin, and Michael Young for constructivecomments on a draft. John K. Kruschke’s World Wide Web page is athttp://www.indiana.edu/�kruschke/
Correspondence concerning this article should be addressed to John K.Kruschke, Department of Psychology, Indiana University Bloomington,1101 East 10th Street, Bloomington, IN 47405-7007. E-mail:[email protected]
Journal of Experimental Psychology: Copyright 2005 by the American Psychological AssociationLearning, Memory, and Cognition2005, Vol. 31, No. 5, 830–845
0278-7393/05/$12.00 DOI: 10.1037/0278-7393.31.5.830
830
highlighting. In other words, the magnitudes of blocking andhighlighting should covary across individuals.
This article reports the first experiment in which blocking andhighlighting have been measured in the same individuals. Resultsconfirm the predicted correlation of blocking and highlighting, inboth choice responses and in eye gaze. Although it is conceivablethat other individual differences could account for the observedcovariation of blocking and highlighting, the new results are highlysuggestive of attentional processes in associative learning.
To bolster the argument that attention can account for covaria-tion of blocking and highlighting, we present results of computersimulations of the EXIT model (Kruschke, 2001a, 2001b). Themodel was originally proposed to address choice proportions only;in this article we introduce a mapping from attention in the modelto eye gaze in human data. The simulations demonstrate thatblocking, highlighting, and eye gaze covary robustly with atten-tional parameters. Changing nonattentional parameters, such asassociative learning rate or choice decisiveness, do not yield suchcorrelations.
In subsequent sections of this introduction, we describe thedesigns of typical blocking and highlighting experiments, and wesupply a few more details and background for attentional learningtheory. We also provide a little more justification for the hypoth-esis bridging covert attention to eye gaze and provide some back-ground regarding individual differences in attention and learning.After the introduction, we present the new experiment and itsresults. Subsequently, we describe model simulations demonstrat-ing how the model accounts for covariation of blocking andhighlighting. We conclude with a review of the main results and abrief discussion of the multifaceted aspects of attention in learning.
Blocking and Highlighting Designs
Table 1 shows details of a typical design for a blocking exper-iment. In the early training phase, a trial with cue A always hasoutcome X, denoted A3X in Table 1. During this early phase,intermixed trials of F3Y occur so that the learner must discrim-inate A and X from other potential cues and outcomes. AfterA3X has been well learned, the later training phase includes trialsof cue A always accompanied by a second cue B, still leading tothe same outcome, and denoted A.B3X in Table 1. To test thedegree of learning about cue B, the later training phase includes anequal number of trials of C.D3Y. If all that matters for learningis the frequency of co-occurrence, then the strength of association
from B to X should be the same as the strength of association fromD to Y. To test this prediction, the final test phase includes trialsthat display cues B and D together (denoted B.D3?), askingparticipants to provide their best guess on the basis of what theyhave learned. Results for probe B.D3? are that people have astrong preference for outcome Y, which suggests that the associ-ation from D to Y is stronger than the association from B to X.
Table 1 also shows details of a typical design for a highlightingexperiment. In the early training phase, people see trials with cuesPE and I indicating the outcome E, denoted I.PE3E in Table 1. Edenotes the early-learned outcome, PE denotes a perfect predictorof outcome E, and I denotes an imperfect predictor. In the latertraining phase, participants learn about a new outcome L indicatedby cues I and PL, denoted I.PL3L. Notice that the early- andlater-trained outcomes have symmetric cue structures: Each out-come has one perfect predictor and one shared imperfect predictor.If people learn the symmetry (e.g., as normative statistical modelsrequire), then cue I should not be differentially predictive of theoutcomes, and cues PE and PL should be equally predictive oftheir respective outcomes. This prediction is examined in the finaltest phase. When presented with cue I by itself, there is a robusttendency for people to respond with the early-trained outcome E.But this tendency is not just a general preference for the higherbase-rate outcome in the face of ambiguous cues, because whenpresented with cues PE and PL, there is a robust tendency torespond with the later-trained outcome L. The results suggest thatpeople’s knowledge is asymmetric: Cue I is more strongly asso-ciated with outcome E than with L, but cue PL is more stronglyassociated with outcome L than cue PE is associated withoutcome E.
Explanations of Blocking and Highlighting
The dominant explanation of blocking states that associationsare built only when the outcome is surprising or mispredicted. Thisidea of error-driven learning was formalized in the classic modelof Rescorla and Wagner (1972). When a learner sees a case ofA.B3X during the later training phase, the outcome X is fullyanticipated by the cue A. Therefore, because there is little surprisein the outcome, there is little learning about cue B. Other theorists,notably Mackintosh (1975), suggested that there is not merely lackof learning about the redundant cue B, there is learned suppressionof attention to it. Some researchers take for granted the theoreticalstance that blocking involves learned (in-)attention (e.g., Crookes& Moran, 2003), but evidence that attention is involved in block-ing is relatively rare. One type of evidence comes from studies oflearning about a blocked cue subsequent to its being blocked. Ifpeople have learned to ignore a blocked cue, then subsequentlearning about that cue should be retarded. This prediction hasbeen confirmed (in both humans and rats; Kruschke & Blair, 2000;Mackintosh & Turner, 1971). Although the Rescorla–Wagnermodel can explain blocking, per se, it cannot explain subsequentretarded learning about a blocked cue. Notice that the two mech-anisms are not mutually exclusive: There can be lack of learnedassociation and learned inattention simultaneously. Indeed, theconnectionist model described later incorporates both processesgoverned by the same goal: error reduction.
The Rescorla–Wagner model also cannot explain highlighting,because the model predicts that symmetric associations should
Table 1Essence of Blocking and Highlighting Designs
Phase
Design
Blocking Highlighting
Early A3X F3Y I.PE3E
Late A.B3X C.D3Y I.PE3E I.PL3L
Test B.D3? (Y) PE.PL3? (L)A.C3? (X) I3? (E)
Note. Each cell indicates cues3correct response. In the test phase, typ-ical response tendencies are shown in parentheses.
831EYE GAZE AND ATTENTIONAL LEARNING
ultimately be learned. A variation of the model was proposed byMarkman (1989), whereby absent-but-expected cues are encodedwith negative activations, but no method was described wherebycue expectancies could be learned, and this approach to highlight-ing has not been further pursued in the literature. Juslin, Wenner-holm, and Winman (2001) proposed that highlighting was not somuch a learning effect as a decision effect. According to thistheory, when a participant is presented in the test phase with a cuecombination that she or he does not know, such as PE.PL, theparticipant infers that the correct outcome must be one that she orhe does not know. Therefore the participant eliminates the well-known early-learned outcome E, and selects the poorly knownlater-learned outcome L. Decision strategies such as eliminativeinference are, no doubt, being used by participants in these exper-iments, but the particular approach proposed by Juslin et al. (2001)was shown to have serious shortcomings by Kruschke (2001a). Forexample, when human participants are presented with cue I byitself, they tend to respond with outcome E, but when presentedwith the triplet of cues I.PE.PL, the preference for outcome E isgreatly reduced or even reversed. This reduction is not addressedby the eliminative inference model.
Highlighting seems currently to be best explained by attentionshifting. When learning the later-trained cases of I.PL3L, atten-tion shifts away from cue I because cue I predicts the previouslylearned outcome E. Instead, attention shifts to the distinctive cuePL, and a strong association is learned between it and outcome L.This type of attentional theory was described by Medin and Edel-son (1988) to explain the inverse base-rate effect, from which thehighlighting effect was derived.
The attentional theory was formalized in the attention to dis-tinctive input (ADIT) model (Kruschke, 1996) and its successor,the EXIT model (Kruschke, 2001a, 2001b). The EXIT model hasbeen shown to account for both highlighting and retarded learningafter blocking. Later in this article we describe the EXIT modelmore thoroughly and introduce predictions of eye gaze from at-tentional strengths in the model. We also show that if we increasethe attentional parameters, then blocking and highlighting and gazepreferences are simultaneously increased. Thus, if the attentionalparameter values are considered to reflect individual differences,the model accounts for covariation of blocking and highlightingand gaze preference across individuals.
Attention and Eye Gaze
The attentional theory of blocking and highlighting posits covertattentional mechanisms. An attended cue is supposed to have astronger impact on responding, or a larger learning rate, or both.These covert attentional processes influence overt choice prefer-ences. These models fit choice data fairly well in a variety ofexperiments. The good fits countenance the covert attentionalconstructs. It would be even more compelling to have independentevidence that selective attention to cues is involved.
One potential measure of attention to cues is eye gaze. Intu-itively, a person should gaze longer at cues she or he has learnedto attend to than at cues she or he has learned to ignore. There is,however, no necessary link between the covert attention posited bylearning theories and overt eye gaze. Indeed, there are reports offailures to find cognitive processes reflected in eye gaze, whenthere plausibly could have been (e.g., Anderson, Bothell, & Doug-
lass, 2004; Lohmeier, 1996). But there are many precedents sug-gesting that eye gaze is an overt indicator of cognitive attention orrelevance. For example, Kaakinen, Hyona, and Keenan (2002) hadpeople read expository text with a certain topical perspective inmind, so that some topics would be more relevant to the readerthan others, and presumably the reader would pay more attentionto the relevant text than the irrelevant passages. The researchersfound that eye fixations on topic-relevant text were indeed oflonger duration than fixations on irrelevant text.
Most directly related to the present investigation, Rehder andHoffman (2005, in press) reported eye tracking results from cate-gory learning tasks. Different cues were differently predictive ofthe category label. People had to learn the correct category labelfor each set of training cues. After learning the categories, peoplelooked longer (or even exclusively) at relevant cues than at irrel-evant cues. The current investigation goes beyond Rehder andHoffman’s in several ways. First, the category structures are in-terestingly different. Whereas Rehder and Hoffman noted corre-spondences of eye gaze with dimensional relevance—meaningsimple monotonic correspondence of stimulus relevance withgaze—we are looking for reduced gaze to a predictive cue (i.e., theblocked cue B), differential looking to equally predictive cues (i.e.,cues PE and PL in highlighting), and context specific gaze at asingle cue (i.e., cue I in highlighting). Second, we measure gaze atpresent and absent cues in random locations, whereas Rehder andHoffman considered always-present dimensions in fixed locations.Thus, in Rehder and Hoffman’s experiments, spatial location waslearned as an indicator of relevance, but in our experiments,viewers looked at all cues and therefore differential gaze could bemuch more subtle in magnitude. Third, we are specifically inter-ested in assessing individual differences and correlations acrosstasks. Fourth, we do explicit model fitting of choice and gazesimultaneously, with emphasis on explaining correlated individualdifferences via attentional parameters.
In summary, we have reasonable precedents for the hypothesisthat eye gaze could correlate with covert learned attention. Thehypothesis is bolstered by the new results reported in this article.
Individual Differences and Correlations
Our premise is that the degree of attentional shifting or learningis, at least in part, an individual characteristic that is stable overshort time scales (but may change with context or over develop-mental time ranges). In a formal model of attentional learning thatwe detail later, individual levels of attentional processing arereflected by parameter values that govern attention in the model.The model predicts that as attentional shifting and learning in-crease, so should the magnitudes of blocking and highlighting, asmeasured by both choice and gaze. Therefore the magnitudes ofhighlighting and blocking should covary across individuals.
There are numerous precedents for treating attentional ability asa stable individual trait. Here we point out only a few.
Individual differences in blocking per se have been previouslyreported and used as indices of attentional processing. For exam-ple, Crookes and Moran (2003) found age and gender differencesin blocking. In their blocking task (called the mouse in house task),people learned to associate color patches at the top of a computerscreen with displayed goal boxes to which they had to move thecursor using a joystick. Learning (or lack thereof) was measured as
832 KRUSCHKE, KAPPENMAN, AND HETRICK
the latency until the correct goal box was entered. The authorsfound greater blocking for females than for males, and a largerproportion of participants who showed blocking as age increasedthrough childhood to early adolescence. Crookes and Moran(2003, p. 472) stated that “[blocking] can be interpreted as thehabitual filtering of unnecessary information” (i.e., as learnedinattention to the blocked cue). They were especially concernedwith blocking as a diagnostic measure of attentional abilities in thecontext of schizophrenia, which tends to show symptoms in ado-lescence and in males more than females. For our purposes, wetake this research as a precedent that there are meaningful indi-vidual differences in blocking, and that these differences can beinterpreted in terms of attentional abilities.
Gibbons, Rammsayer, and Lubow (2001, Experiment 2) re-ported correlated individual differences in two attentional learningtasks. One task involved visual search, the other task involvedlearning the relationship of a cue and an outcome. In the visualsearch task, people had to determine whether a display consisted of20 identical squiggles or, instead, had a single different squiggleamong 19 identical distractors. The design included an initialphase with multiple trials that used the same distractor squiggles.This phase was intended to encourage people to learn to ignore thatspecific distractor. A subsequent phase included some trials inwhich the initial distractor became the unique target among noveldistractors. Results showed relatively slow detection of the targeton these trials (i.e., apparently, people had indeed learned to ignorethe initial distractor). In the learning task, a trial display consistedof letter trigrams surrounded by a polygonal shape, both of whichcould change across trials. Participants had to learn what aspect ofthe display indicated that a penalty counter would increment.Participants could press a button when they thought the counterwas about to increment, thereby reducing the penalty if they werecorrect. The indicative cue was the shape of the surroundingpolygon. The key result was that people were slower to learn aboutthe relevance of the polygon if they had been preexposed to asituation in which the polygon was irrelevant. In the preexposuretask, people simply had to count the number of repetitions of thetrigrams while the surrounding polygon was held constant. Again,the key findings for our purposes was that both effects wereinterpreted in terms of learned attention and that there were indi-vidual differences correlated across tasks.
Engle (2002) and colleagues have argued that individual abilityin executive attention, meaning the capacity to avoid distractionfrom misleading cues, is crucial for explaining individual ability inworking memory. To provide evidence for the putative correlationof attention and working memory, Kane, Bleckley, Conway, andEngle (2001) used an eye tracking procedure to assess attention.People were required to respond to a target that could appear oneither side of the display. The target was preceded by a prompt onthe opposite side of the display. People who were better able tosuppress visual saccades to the prompt tended to have higherscores on working memory tasks. These results indicate individualdifferences in attention, as measured by eye gaze, that are corre-lated with short-term learning.
Beyond the empirical work cited above, there are also prece-dents of formal modeling that specifically address individual dif-ferences in learned attention. For example, Webb and Lee (2004)examined individual differences in a category learning task re-ported by Kruschke (1993). In that task, people learned to classify
simple rectangles that varied (across trials) in height and in theposition of an internal vertical line segment. In a filtration struc-ture, people could learn to ignore one aspect (e.g., segment posi-tion) and correctly classify by attending to the other aspect (e.g.,height). Webb and Lee (2004) found individual differences inpatterns of learning (e.g., some participants achieved high accu-racy very rapidly whereas others learned gradually). Webb and Leecharacterized those differences, in part, by different attentionallearning rates in a formal attentional learning covering map(ALCOVE) model (Kruschke, 1992).
In summary, we described a few precedents for our hypothesesregarding individual differences in attentional abilities. We estab-lished that there are, in fact, individual differences in attentionalabilities, as manifested in associative blocking, antisaccade tasks,visual search, learned irrelevance, and so on. Performance in theseattentional tasks covaries across individuals, such that people withrelatively high performance in one task tend to have relatively highperformance in another. Individual differences have been ad-dressed in a formal model as differences in the value of anattentional learning parameter. In the present research we applythese ideas to eye gaze in blocking and highlighting. To the extentthat blocking and highlighting rely on attentional shifting andlearning, then magnitudes of blocking and highlighting shouldcovary across individuals.
Having given some background to motivate an expected corre-lation between blocking and highlighting, it is worth mentioningthat such a correlation is by no means a foregone conclusion. Forexample, the classic Rescorla-Wagner model of blocking predictsno highlighting. The eliminative inference model of highlighting(Juslin et al., 2001) predicts no blocking (see the subsection OtherModels near the end of this article). The rule-plus-exception(RULEX) model (Nosofsky, Palmeri, & McKinley, 1994) mightaddress both blocking and highlighting, but it is unlikely that itwould predict any correlation of their magnitudes (again, see thesubsection Other Models below). In other words, there is nonecessary theoretical connection between magnitude of blockingand magnitude of highlighting.
It would also be wrong to infer that blocking and highlightingshould be correlated just because the stimuli and learning task areso similar. In other empirical work (Kappenman, Kruschke, &Hetrick, 2005), we observed no hint of a correlation betweenhighlighting and illusory correlation, which is another learningphenomenon related to base rates. Thus, it is not the case that anytwo learning effects will correlate merely by virtue of generic tasksimilarity.
Never before has there been an investigation of blocking andhighlighting in the same individuals, and never before have eyemovements been measured during these tasks. Finding that block-ing and highlighting covary would suggest that attention is in-volved in both effects.
Experiment: Eye Tracking During Blocking andHighlighting
Our goal was to measure eye gaze at the various cues. Wetherefore required cues that must be fixated to be perceived andthat are spatially separated. Many previous experiments in block-ing and highlighting have used written words as cues, and wecontinued this procedure. Participants made responses by clicking
833EYE GAZE AND ATTENTIONAL LEARNING
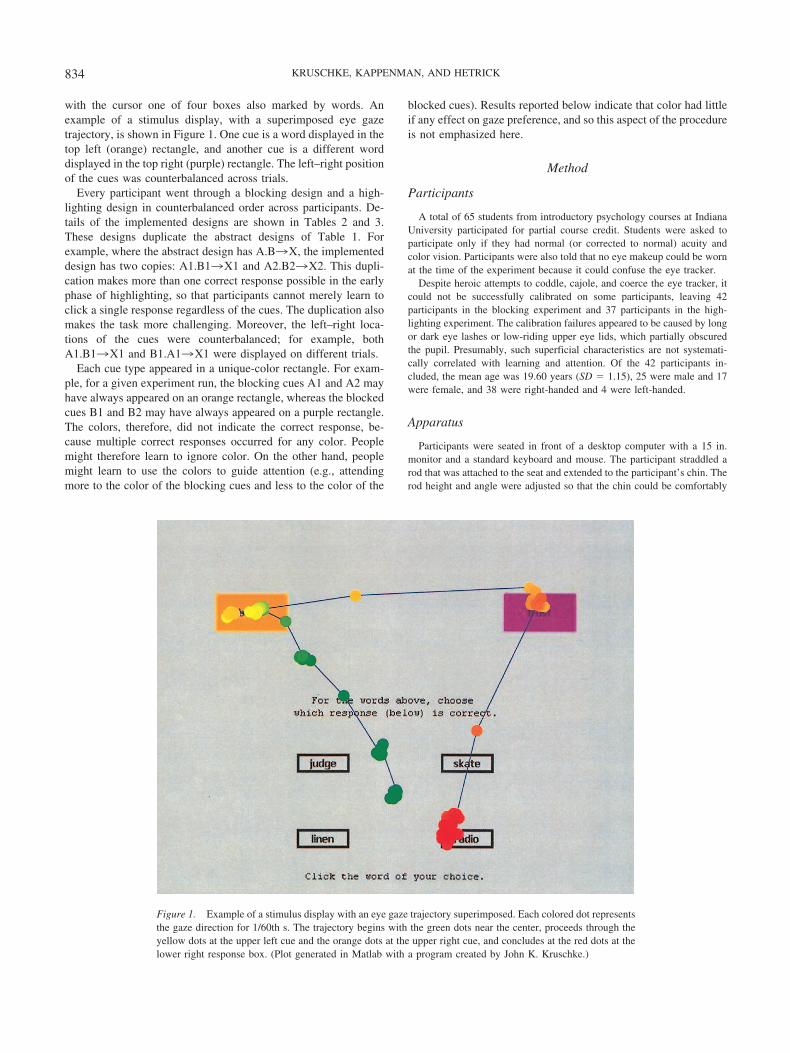
with the cursor one of four boxes also marked by words. Anexample of a stimulus display, with a superimposed eye gazetrajectory, is shown in Figure 1. One cue is a word displayed in thetop left (orange) rectangle, and another cue is a different worddisplayed in the top right (purple) rectangle. The left–right positionof the cues was counterbalanced across trials.
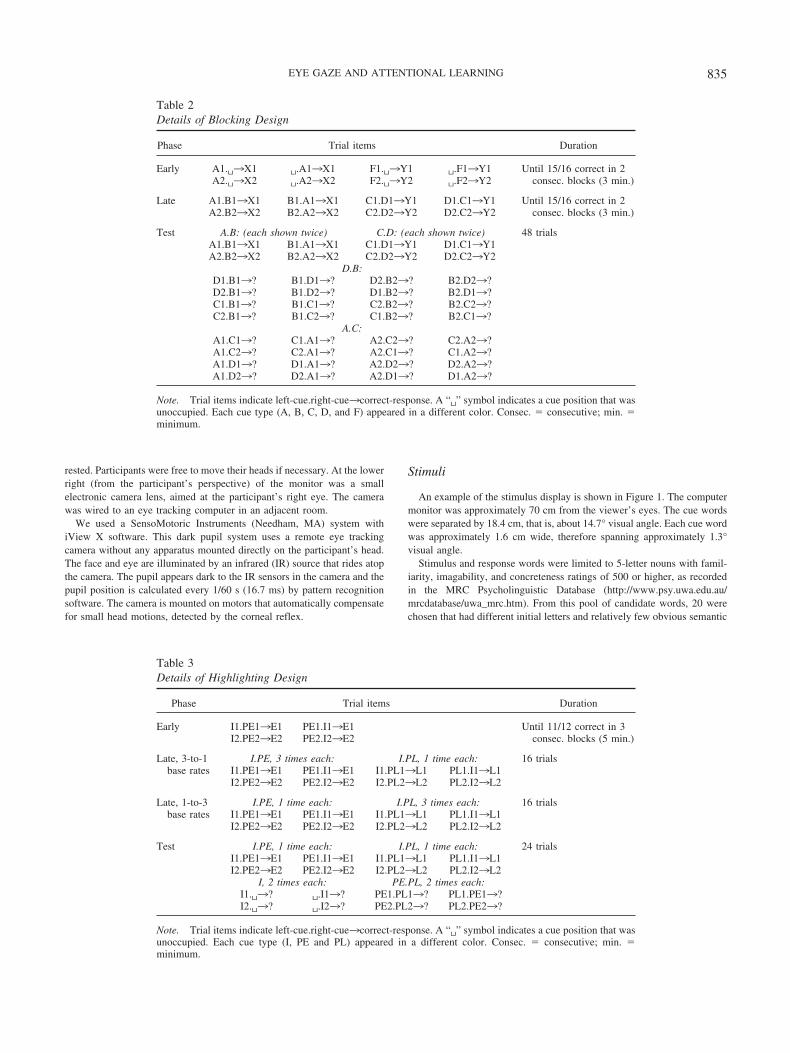
Every participant went through a blocking design and a high-lighting design in counterbalanced order across participants. De-tails of the implemented designs are shown in Tables 2 and 3.These designs duplicate the abstract designs of Table 1. Forexample, where the abstract design has A.B3X, the implementeddesign has two copies: A1.B13X1 and A2.B23X2. This dupli-cation makes more than one correct response possible in the earlyphase of highlighting, so that participants cannot merely learn toclick a single response regardless of the cues. The duplication alsomakes the task more challenging. Moreover, the left–right loca-tions of the cues were counterbalanced; for example, bothA1.B13X1 and B1.A13X1 were displayed on different trials.
Each cue type appeared in a unique-color rectangle. For exam-ple, for a given experiment run, the blocking cues A1 and A2 mayhave always appeared on an orange rectangle, whereas the blockedcues B1 and B2 may have always appeared on a purple rectangle.The colors, therefore, did not indicate the correct response, be-cause multiple correct responses occurred for any color. Peoplemight therefore learn to ignore color. On the other hand, peoplemight learn to use the colors to guide attention (e.g., attendingmore to the color of the blocking cues and less to the color of the
blocked cues). Results reported below indicate that color had littleif any effect on gaze preference, and so this aspect of the procedureis not emphasized here.
Method
Participants
A total of 65 students from introductory psychology courses at IndianaUniversity participated for partial course credit. Students were asked toparticipate only if they had normal (or corrected to normal) acuity andcolor vision. Participants were also told that no eye makeup could be wornat the time of the experiment because it could confuse the eye tracker.
Despite heroic attempts to coddle, cajole, and coerce the eye tracker, itcould not be successfully calibrated on some participants, leaving 42participants in the blocking experiment and 37 participants in the high-lighting experiment. The calibration failures appeared to be caused by longor dark eye lashes or low-riding upper eye lids, which partially obscuredthe pupil. Presumably, such superficial characteristics are not systemati-cally correlated with learning and attention. Of the 42 participants in-cluded, the mean age was 19.60 years (SD � 1.15), 25 were male and 17were female, and 38 were right-handed and 4 were left-handed.
Apparatus
Participants were seated in front of a desktop computer with a 15 in.monitor and a standard keyboard and mouse. The participant straddled arod that was attached to the seat and extended to the participant’s chin. Therod height and angle were adjusted so that the chin could be comfortably
Figure 1. Example of a stimulus display with an eye gaze trajectory superimposed. Each colored dot representsthe gaze direction for 1/60th s. The trajectory begins with the green dots near the center, proceeds through theyellow dots at the upper left cue and the orange dots at the upper right cue, and concludes at the red dots at thelower right response box. (Plot generated in Matlab with a program created by John K. Kruschke.)
834 KRUSCHKE, KAPPENMAN, AND HETRICK
rested. Participants were free to move their heads if necessary. At the lowerright (from the participant’s perspective) of the monitor was a smallelectronic camera lens, aimed at the participant’s right eye. The camerawas wired to an eye tracking computer in an adjacent room.
We used a SensoMotoric Instruments (Needham, MA) system withiView X software. This dark pupil system uses a remote eye trackingcamera without any apparatus mounted directly on the participant’s head.The face and eye are illuminated by an infrared (IR) source that rides atopthe camera. The pupil appears dark to the IR sensors in the camera and thepupil position is calculated every 1/60 s (16.7 ms) by pattern recognitionsoftware. The camera is mounted on motors that automatically compensatefor small head motions, detected by the corneal reflex.
Stimuli
An example of the stimulus display is shown in Figure 1. The computermonitor was approximately 70 cm from the viewer’s eyes. The cue wordswere separated by 18.4 cm, that is, about 14.7° visual angle. Each cue wordwas approximately 1.6 cm wide, therefore spanning approximately 1.3°visual angle.
Stimulus and response words were limited to 5-letter nouns with famil-iarity, imagability, and concreteness ratings of 500 or higher, as recordedin the MRC Psycholinguistic Database (http://www.psy.uwa.edu.au/mrcdatabase/uwa_mrc.htm). From this pool of candidate words, 20 werechosen that had different initial letters and relatively few obvious semantic
Table 2Details of Blocking Design
Phase Trial items Duration
Early A1.�3X1 �.A13X1 F1.�3Y1 �.F13Y1 Until 15/16 correct in 2consec. blocks (3 min.)A2.�3X2 �.A23X2 F2.�3Y2 �.F23Y2
Late A1.B13X1 B1.A13X1 C1.D13Y1 D1.C13Y1 Until 15/16 correct in 2consec. blocks (3 min.)A2.B23X2 B2.A23X2 C2.D23Y2 D2.C23Y2
Test A.B: (each shown twice) C.D: (each shown twice) 48 trialsA1.B13X1 B1.A13X1 C1.D13Y1 D1.C13Y1A2.B23X2 B2.A23X2 C2.D23Y2 D2.C23Y2
D.B:D1.B13? B1.D13? D2.B23? B2.D23?D2.B13? B1.D23? D1.B23? B2.D13?C1.B13? B1.C13? C2.B23? B2.C23?C2.B13? B1.C23? C1.B23? B2.C13?
A.C:A1.C13? C1.A13? A2.C23? C2.A23?A1.C23? C2.A13? A2.C13? C1.A23?A1.D13? D1.A13? A2.D23? D2.A23?A1.D23? D2.A13? A2.D13? D1.A23?
Note. Trial items indicate left-cue.right-cue3correct-response. A “�” symbol indicates a cue position that wasunoccupied. Each cue type (A, B, C, D, and F) appeared in a different color. Consec. � consecutive; min. �minimum.
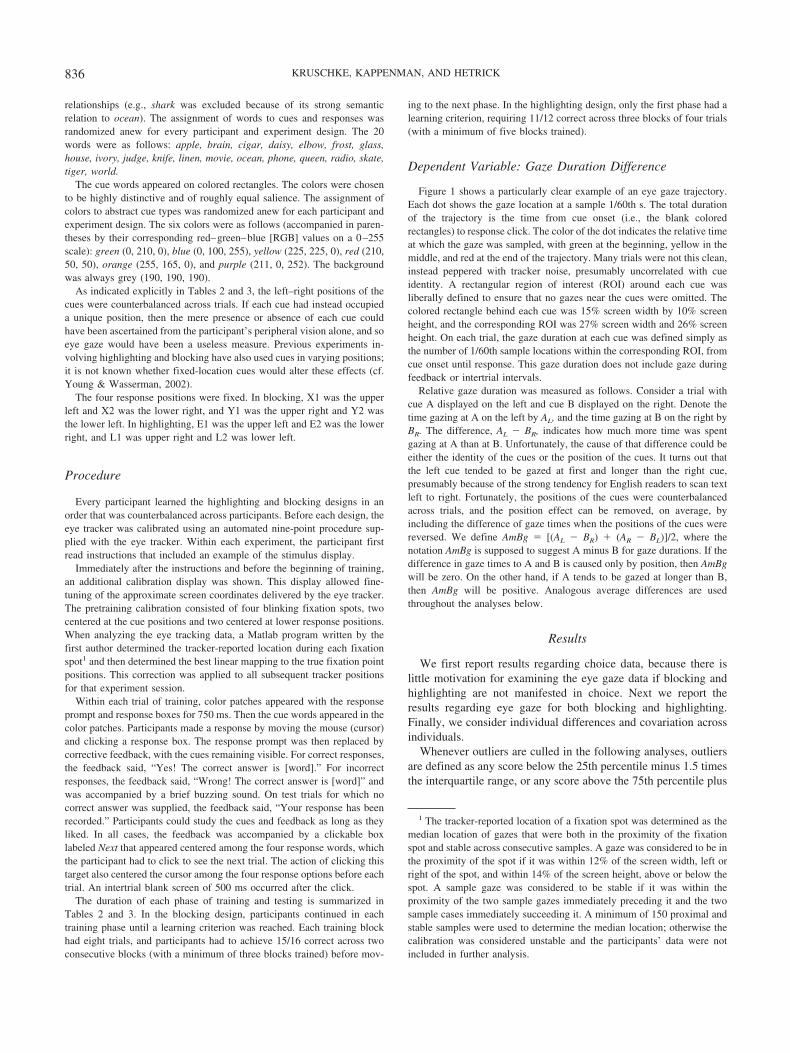
Table 3Details of Highlighting Design
Phase Trial items Duration
Early I1.PE13E1 PE1.I13E1 Until 11/12 correct in 3consec. blocks (5 min.)I2.PE23E2 PE2.I23E2
Late, 3-to-1base rates
I.PE, 3 times each: I.PL, 1 time each: 16 trialsI1.PE13E1 PE1.I13E1 I1.PL13L1 PL1.I13L1I2.PE23E2 PE2.I23E2 I2.PL23L2 PL2.I23L2
Late, 1-to-3base rates
I.PE, 1 time each: I.PL, 3 times each: 16 trialsI1.PE13E1 PE1.I13E1 I1.PL13L1 PL1.I13L1I2.PE23E2 PE2.I23E2 I2.PL23L2 PL2.I23L2
Test I.PE, 1 time each: I.PL, 1 time each: 24 trialsI1.PE13E1 PE1.I13E1 I1.PL13L1 PL1.I13L1I2.PE23E2 PE2.I23E2 I2.PL23L2 PL2.I23L2
I, 2 times each: PE.PL, 2 times each:I1.�3? �.I13? PE1.PL13? PL1.PE13?I2.�3? �.I23? PE2.PL23? PL2.PE23?
Note. Trial items indicate left-cue.right-cue3correct-response. A “�” symbol indicates a cue position that wasunoccupied. Each cue type (I, PE and PL) appeared in a different color. Consec. � consecutive; min. �minimum.
835EYE GAZE AND ATTENTIONAL LEARNING
relationships (e.g., shark was excluded because of its strong semanticrelation to ocean). The assignment of words to cues and responses wasrandomized anew for every participant and experiment design. The 20words were as follows: apple, brain, cigar, daisy, elbow, frost, glass,house, ivory, judge, knife, linen, movie, ocean, phone, queen, radio, skate,tiger, world.
The cue words appeared on colored rectangles. The colors were chosento be highly distinctive and of roughly equal salience. The assignment ofcolors to abstract cue types was randomized anew for each participant andexperiment design. The six colors were as follows (accompanied in paren-theses by their corresponding red–green–blue [RGB] values on a 0–255scale): green (0, 210, 0), blue (0, 100, 255), yellow (225, 225, 0), red (210,50, 50), orange (255, 165, 0), and purple (211, 0, 252). The backgroundwas always grey (190, 190, 190).
As indicated explicitly in Tables 2 and 3, the left–right positions of thecues were counterbalanced across trials. If each cue had instead occupieda unique position, then the mere presence or absence of each cue couldhave been ascertained from the participant’s peripheral vision alone, and soeye gaze would have been a useless measure. Previous experiments in-volving highlighting and blocking have also used cues in varying positions;it is not known whether fixed-location cues would alter these effects (cf.Young & Wasserman, 2002).
The four response positions were fixed. In blocking, X1 was the upperleft and X2 was the lower right, and Y1 was the upper right and Y2 wasthe lower left. In highlighting, E1 was the upper left and E2 was the lowerright, and L1 was upper right and L2 was lower left.
Procedure
Every participant learned the highlighting and blocking designs in anorder that was counterbalanced across participants. Before each design, theeye tracker was calibrated using an automated nine-point procedure sup-plied with the eye tracker. Within each experiment, the participant firstread instructions that included an example of the stimulus display.
Immediately after the instructions and before the beginning of training,an additional calibration display was shown. This display allowed fine-tuning of the approximate screen coordinates delivered by the eye tracker.The pretraining calibration consisted of four blinking fixation spots, twocentered at the cue positions and two centered at lower response positions.When analyzing the eye tracking data, a Matlab program written by thefirst author determined the tracker-reported location during each fixationspot1 and then determined the best linear mapping to the true fixation pointpositions. This correction was applied to all subsequent tracker positionsfor that experiment session.
Within each trial of training, color patches appeared with the responseprompt and response boxes for 750 ms. Then the cue words appeared in thecolor patches. Participants made a response by moving the mouse (cursor)and clicking a response box. The response prompt was then replaced bycorrective feedback, with the cues remaining visible. For correct responses,the feedback said, “Yes! The correct answer is [word].” For incorrectresponses, the feedback said, “Wrong! The correct answer is [word]” andwas accompanied by a brief buzzing sound. On test trials for which nocorrect answer was supplied, the feedback said, “Your response has beenrecorded.” Participants could study the cues and feedback as long as theyliked. In all cases, the feedback was accompanied by a clickable boxlabeled Next that appeared centered among the four response words, whichthe participant had to click to see the next trial. The action of clicking thistarget also centered the cursor among the four response options before eachtrial. An intertrial blank screen of 500 ms occurred after the click.
The duration of each phase of training and testing is summarized inTables 2 and 3. In the blocking design, participants continued in eachtraining phase until a learning criterion was reached. Each training blockhad eight trials, and participants had to achieve 15/16 correct across twoconsecutive blocks (with a minimum of three blocks trained) before mov-
ing to the next phase. In the highlighting design, only the first phase had alearning criterion, requiring 11/12 correct across three blocks of four trials(with a minimum of five blocks trained).
Dependent Variable: Gaze Duration Difference
Figure 1 shows a particularly clear example of an eye gaze trajectory.Each dot shows the gaze location at a sample 1/60th s. The total durationof the trajectory is the time from cue onset (i.e., the blank coloredrectangles) to response click. The color of the dot indicates the relative timeat which the gaze was sampled, with green at the beginning, yellow in themiddle, and red at the end of the trajectory. Many trials were not this clean,instead peppered with tracker noise, presumably uncorrelated with cueidentity. A rectangular region of interest (ROI) around each cue wasliberally defined to ensure that no gazes near the cues were omitted. Thecolored rectangle behind each cue was 15% screen width by 10% screenheight, and the corresponding ROI was 27% screen width and 26% screenheight. On each trial, the gaze duration at each cue was defined simply asthe number of 1/60th sample locations within the corresponding ROI, fromcue onset until response. This gaze duration does not include gaze duringfeedback or intertrial intervals.
Relative gaze duration was measured as follows. Consider a trial withcue A displayed on the left and cue B displayed on the right. Denote thetime gazing at A on the left by AL, and the time gazing at B on the right byBR. The difference, AL � BR, indicates how much more time was spentgazing at A than at B. Unfortunately, the cause of that difference could beeither the identity of the cues or the position of the cues. It turns out thatthe left cue tended to be gazed at first and longer than the right cue,presumably because of the strong tendency for English readers to scan textleft to right. Fortunately, the positions of the cues were counterbalancedacross trials, and the position effect can be removed, on average, byincluding the difference of gaze times when the positions of the cues werereversed. We define AmBg � [(AL � BR) � (AR � BL)]/2, where thenotation AmBg is supposed to suggest A minus B for gaze durations. If thedifference in gaze times to A and B is caused only by position, then AmBgwill be zero. On the other hand, if A tends to be gazed at longer than B,then AmBg will be positive. Analogous average differences are usedthroughout the analyses below.
Results
We first report results regarding choice data, because there islittle motivation for examining the eye gaze data if blocking andhighlighting are not manifested in choice. Next we report theresults regarding eye gaze for both blocking and highlighting.Finally, we consider individual differences and covariation acrossindividuals.
Whenever outliers are culled in the following analyses, outliersare defined as any score below the 25th percentile minus 1.5 timesthe interquartile range, or any score above the 75th percentile plus
1 The tracker-reported location of a fixation spot was determined as themedian location of gazes that were both in the proximity of the fixationspot and stable across consecutive samples. A gaze was considered to be inthe proximity of the spot if it was within 12% of the screen width, left orright of the spot, and within 14% of the screen height, above or below thespot. A sample gaze was considered to be stable if it was within theproximity of the two sample gazes immediately preceding it and the twosample cases immediately succeeding it. A minimum of 150 proximal andstable samples were used to determine the median location; otherwise thecalibration was considered unstable and the participants’ data were notincluded in further analysis.
836 KRUSCHKE, KAPPENMAN, AND HETRICK
1.5 times the interquartile range (and where the interquartile rangeis the 75th percentile minus the 25th percentile). This is a conven-tional definition (e.g., it is the default definition of outliers forboxplots in SPSS statistical software).
We only included data from trials in which people actuallylooked at the cues. That is, there were a few trials in which peopleresponded but the eye tracker recorded no gaze directed at thecues. Those few trials were excluded from the data analysis. Allstatistical tests are two-tailed, with significance (i.e., reliability)taken to be p � .05.
In subsequent sections, all of the results are collapsed acrossexperiment order. Results were also examined separately for theblocking-first and highlighting-first groups. The major trends wereevident within both orders, with no notable differences betweenorders. There was little statistical power to detect differences,however, because of the small sample size within each order.
All of the results were also examined for female or maleparticipants only. Both groups showed the same trends as thecollapsed data reported below, with no obvious differences. Again,there was little statistical power to detect differences betweengroups, so we could not detect sex differences analogous to thosereported by Crookes and Moran (2003).
We also examined gaze durations during the beginning of cuepresentation when the colored rectangles were blank. No statisti-cally significant preferences were found, although there were someweak trends consistent with blocking and highlighting as reportedbelow. We therefore report no further details of the blank rectangleperiod. All of the gaze results reported below refer to the periodfrom blank rectangle onset to response click.
Response Choice
Blocking. We are interested only in data from participants whoretained memory of the training items in the test phase. Thereforewe first culled outlying individuals on the basis of total percentagecorrect on the A.B and C.D training items in the test phase. Therewas just one outlier, leaving N � 41 for subsequent analyses of theblocking data.
Performance in the test phase on the training items was fairlygood. The test phase had eight A.B trials (see Table 2), withaverage performance across the 41 participants of 92.3% correct.Performance on the eight C.D trials was not quite as high, withaverage accuracy of 87.7%. The somewhat low accuracy on C.Dtrials is actually useful, however, insofar as it makes blockingmore challenging to demonstrate statistically, because the blockedcue B must generate an even weaker response than the somewhatweak control cues C and D.
On the test trials that combined the blocked cue B with controlcues C or D, participants chose the response corresponding withthe control cue 55.8% of the time and the response correspondingwith the blocked cue only 21.2% of the time. (The remaining23.0% of responses were for the two remaining choices.) For eachparticipant we considered the 16 test trials that combined theblocked cue B with control cues C or D (see test items labeled D.Bin Table 2) and counted the number of times the participant gavethe corresponding Y outcome, minus the number of times theparticipant gave the corresponding X outcome, divided by thenumber of D.B trials. This difference in choice proportions isdenoted DmBc, which is meant to suggest D minus B for choices.
The mean difference, DmBc, across the 41 participants was 34.5%,which is reliably greater than zero, t(40) � 5.84, p � .001. Thus,there was a robust blocking effect.
As a check that there was not merely a bias to choose thecontrol-cue response when conflicting cues appeared, we alsoexamined choice preferences for trials that combined the blockingcue A with control cues C or D. Specifically, for each participantwe considered the 16 test trials that combined the blocking cue Awith control cues C or D (see test items labeled A.C in Table 2) andcounted the number of times the participant gave the correspond-ing X outcome, minus the number of times the participant gave thecorresponding Y outcome, divided by the number of A.C trials.This difference in choice proportions is denoted AmCc, which ismeant to suggest A minus C for choices. Overall, participantschose the response corresponding with the blocking cue A 70.3%of the time, and the response corresponding with the control cuejust 20.3% of the time. The mean difference of AmCc � 50.0%was reliably greater than zero, t(40) � 8.30, p � .001.
In summary, both the D.B and A.C test items showed robustchoice preferences, indicating strong blocking. In subsequent cor-relational analyses, the DmBc and AmCc choice preferences willbe summed to form an overall measure of a participant’s degree ofblocking as indicated by choice.
Highlighting. The attentional hypothesis relies on the assump-tion that the later-trained I.PL3L items are actually learned. Ifthey are not learned well, then there is no basis for suggesting thatan attentional shift has been learned. Outlying individuals wereculled on the basis of total accuracy on the I.PE and I.PL trainingitems in the test phase. Only one outlier was identified, leaving 36participants contributing data to subsequent analyses.
In the test phase, there were four trials each of I.PL and I.PE (seeTable 3). Accuracy on these items was fairly high: For I.PE, meanaccuracy across the 36 participants was 93.8% correct, and forI.PL, the mean accuracy was 91.0%.
For a given participant, there were eight I test trials (one half ofwhich had I on the left and the other half of which had I on theright; see Table 3). For each participant we counted the number ofchoices for the corresponding E outcome and subtracted the num-ber of choices for the corresponding L outcome, and divided thedifference by the number of I trials. We denote the resultingmeasure as Ic, where the suffixed c indicates choice preference.The mean choice for the corresponding early-trained outcome, E,was 69.1%, and for the late-trained outcome, L, was 16.7%. (Theremaining 24.2% of responses were for the two remainingchoices.) The mean difference, Ic � 52.4%, was reliably greaterthan zero, t(35) � 6.07, p � .001.
For a given participant, there were eight PE.PL test trials (onehalf of which had PE on the left and the other half of which had PLon the left; see Table 3). On these PE.PL trials, outcome L waschosen 66.0% of the time, and outcome E was chosen 26.4% of thetime. The difference is computed for each participant and denotedPLmPEc. The mean difference, PLmPEc � 39.6%, was reliablygreater than zero, t(35) � 4.92, p � .001.
In summary, both the I and PE.PL test items showed robustchoice preferences, indicating strong highlighting. In subsequentcorrelational analyses, the Ic and PLmPEc values will be summedto form an overall measure of a participant’s degree of highlightingas indicated by choice.
837EYE GAZE AND ATTENTIONAL LEARNING
Eye Gaze
Having established that the choice data show substantial block-ing and highlighting, we proceeded to examine the eye gaze data.
Blocking. The attention hypothesis suggests that attention tothe blocked cue B should decrease, whereas attention to the block-ing cue A should increase. The control cues, C and D, should haveintermediate attention.
To test whether the blocked cue B gets less attention than thecontrol cues, we would like to know if gaze time to the control cueD (or C) is greater than the blocked cue B. The correspondingaverage difference is DmBg � [(DL � BR) � (DR � BL)]/2. Thisvalue, DmBg, will be greater than zero if D is gazed at longer thanB. For each participant, the mean difference DL � BR was deter-mined from eight trials: D1.B1, D1.B2, D2.B1, D2.B2, C1.B1,C1.B2, C2.B1, and C2.B2. The mean difference BL � DR wascomputed from the corresponding eight trials with the left–rightpositions reversed. The average of those differences was thenrecorded for each participant as his or her value of DmBg. Therewas one outlier, leaving 40 participants included. The gaze time toD was significantly longer than the gaze time to B, with the meanDmBg � 46.2 ms, reliably greater than zero, t(39) � 3.01, p �.005.
To test whether cue B gets less looking time than A, wecomputed the average difference, AmBg � [(AL � BR) � (AR �BL)]/2, in a manner analogous to DmBg. Because A.B was atraining case, the analysis was restricted to trials that had a correctresponse (although the conclusion remains the same even if allresponses are included). There were three outliers. The gaze timeto A was longer than the gaze time to B, with the mean AmBg �57.2 ms, reliably greater than zero, t(37) � 2.11, p � .041.
It was also found that looking time to A exceeded looking timeto C (or D). We defined AmCg � [(AL � CR) � (AR � CL)]/2analogous to the previous scores. There were four outliers. Thegaze time to A was longer than the gaze time to C, with the meanAmCg � 50.5 ms, reliably greater than zero, t(36) � 3.37, p �.002.
In summary, the eye gaze data are consistent with the predictionthat one mechanism in associative blocking is learned attention:People learn to attend to the blocking cue A and to ignore theblocked cue B. In subsequent correlational analyses, the two gazedifferences that involve blocked cue B, namely DmBg and AmBgwill be summed to form an overall measure of a participant’sdegree of blocking as indicated by gaze.
Highlighting. For highlighting, the attention hypothesis sug-gests that attention to PL should be stronger than to PE or I. Ifpeople tend to look longer at what they are cognitively attendingto, then they should tend to look longer at PL than at PE.
The most straightforward way to test this prediction is byconsidering looking times on PL.PE test trials. We definedPLmPEg � [(PLL � PER) � (PLR � PEL)]/2 analogous to thescores defined in the blocking analysis. Of 36 participants, therewere 2 outliers. The gaze time to PL was longer than the gaze timeto PE, with the mean PLmPEg � 58.4 ms, reliably greater thanzero, t(33) � 2.48, p � .019.
Gaze times to PL and PE can also be compared across PL.I andPE.I trials. The prediction is that for PL.I and PE.I trials, that is,when the perfect predictors are on the left, there should be longerlooking at PL than at PE. That should also be true when the perfect
predictors are on the right, that is, for I.PL and I.PE trials. Wecombine those cases into an average difference, PL.ImPE.Ig �([(PLL � IR) � (PEL � IR)] � [(PLR � IL) � (PER � IL)])/2.Because these are cases of training items, only correct responseswere included in the analysis. There were no outliers but oneparticipant happened to have no correct responses for one of thefour summands, and was therefore excluded. The gaze time to PLwas longer than the gaze time to PE, with the mean PL.ImPE.Ig �90.2 ms, reliably greater than zero, t(34) � 2.08, p � .045.
In summary, the eye gaze data support the claim that onemechanism in highlighting is learned attention: People learn toattend to the later-learned distinctive cue, PL. In subsequent cor-relational analyses, the two gaze differences, PLmPEg andPL.ImPE.Ig, will be summed to form an overall measure of aparticipant’s degree of highlighting as indicated by gaze.
Individual Differences and Covariation
There is variation across individuals in the degree of choice orgaze preference. One possibility is that this variation might beentirely noise, with all individuals having an equal underlyingpreference. On the other hand, the variation might be caused, tosome extent, by individual differences in the underlying prefer-ence. In particular, some people might have more rapid or exten-sive attentional shifting and learning than other people. This hy-pothesis of individual differences in attentional shifting andlearning leads to two predictions: First, within a design (i.e.,blocking or highlighting) people’s choice preferences and gazedifferences should covary. Second, across the highlighting andblocking designs, people should covary in the magnitude of block-ing and highlighting.
We pursue these predicted correlations in three steps. First weshow that within each type of experiment (blocking or highlight-ing), choice preferences for different test cues did indeed correlatewith each other, and gaze preferences for different test cues alsocorrelated with each other. Second, within each type of experi-ment, choice preferences were correlated with gaze preferences.Third, across the experiments, degree of blocking was correlatedwith degree of highlighting, for both choice and gaze measures.
Consider the blocking experiment. For the choice data, thedegree of control-cue preference on DB trials (DmBc) stronglycorrelated with the degree of blocking-cue preference on AC trials(AmCc), r � .522, t(39) � 3.82, p � .001. For the gaze data, thecorrelation of AmBg with DmBg was r � .423, t(35) � 2.76, p �.009. The high correlation of AmBg with DmBg across individualssuggests that people who ignored B in one context also tended toignore B in the other context.
As an overarching measure of an individual’s blocking mani-fested in choice preference, we computed the sum of DB and ACpreferences (DmBc � AmCc). As a summary measure of anindividual’s blocking manifested in gaze preference, we computedthe sum of AmBg and DmBg. These measures of blocking in choiceand blocking in gaze were strongly correlated, r � .481, t(35) �3.24, p � .003. Thus, to the extent that gaze preference indicatesdifferential attention, and gaze preference is correlated with block-ing as measured by choice, we have evidence that blocking in-volves differential attention. Individuals who showed strongergaze preferences tended to show stronger blocking.
838 KRUSCHKE, KAPPENMAN, AND HETRICK
Now consider the highlighting experiment. For the choice data,the degree of L-response preference on PE.PL trials (PLmPEc)strongly correlated with the degree of E-response preference on Itrials (Ic), r � .437, t(34) � 2.84, p � .008. This correlation ispredicted by attentional theory, because the stronger the associa-tion is from I to E, the stronger should be the attentional shift awayfrom I during learning of I.PL. Conversely, the stronger the atten-tional shift away from I during learning of I.PL, the better pre-served is the association from I to E. For the gaze data, the gazedifferences PLmPEg and PL.ImPE.Ig also had a reliable positivecorrelation, r � .369, t(31) � 2.21, p � .035.
As a summary measure of an individual’s highlighting mani-fested in choice, we summed the PE.PL and I choice preferencemagnitudes (PLmPEc � Ic). As a summary measure of an indi-vidual’s highlighting manifested in gaze, we summed the PLmPEgand PL.ImPE.Ig gaze differences. These two measures were pos-itively correlated, as predicted, but the trend was only marginallysignificant statistically, r � .314, t(31) � 1.84, p � .075 (two-tailed). Thus, individuals who showed stronger highlighting intheir choice data tended to show stronger differential looking intheir eye gaze data. Again, to the extent that eye gaze indicatesattention, we have evidence that highlighting involves attention.
Finally, consider correlations across blocking and highlighting.For the choice data, degree of blocking (i.e., DmBc � AmCc)correlated with degree of highlighting (i.e., PLmPEc � Ic), r �.382, t(32) � 2.34, p � .026. For the gaze data, degree of blocking(i.e., AmBg � DmBg) correlated with degree of highlighting (i.e.,PLmPEg � PL.ImPE.Ig), r � .385, t(27) � 2.17, p � .039. Inother words, people who showed stronger blocking also tended toshow stronger highlighting, as measured either by choice or by eyegaze.
Modeling
The empirical results reported above are naturally predicted byattentional learning theory, but until this point in this article thetheory has been only vaguely stated in informal language. Arigorous pursuit of theoretical issues behooves us to ask twofurther questions. First, can an attentional learning theory accountfor the data when it is thoroughly specified in formal detail?Second, are there other models that could account for the results?The goal of this section is to answer those questions: Yes, a formalattentional learning theory can account for the data. No, someother likely models do not so readily account for the results.
A central theme of the modeling is that individual differencescan be captured by parameter value differences. That is, all indi-viduals are assumed to be describable by the same underlyingrepresentations and processing in the model; what varies betweenindividuals are the specific values of parameters that control theirspecific quantitative behaviors. Thus, a successful model shoulddo three things: (a) generate the blocking and highlighting effectsin choice responses, (b) generate the blocking and highlightingeffects in eye gaze, and (c) generate the correlations of blockingand highlighting, in choice and eye gaze, across individuals.
The EXIT Model
The EXIT model is one formal implementation of attentionallearning theory. It has been thoroughly detailed elsewhere (Krus-
chke, 2001a, 2001b) and therefore will be described only brieflyhere. EXIT is a connectionist model that represents each cue as aninput node that has zero activation when the cue is absent andpositive activation when the cue is present. Each cue node ismultiplied by a nonnegative attention strength. By default, anypresent cue gets some attention. The attention on the cues ishypothesized to have limited capacity, and therefore the cuescompete for attention. The attentionally gated cue activations arepropagated across weighted connections to the output nodes, eachof which represents a possible response. The output activations aremapped to choice probabilities such that the responses correspond-ing to the more highly activated output nodes are given a higherprobability. In summary, when a stimulus is presented to thenetwork, the corresponding cue nodes are activated, attention isdistributed across the cues, the attentionally gated cue activationsare spread to the output nodes, and responses are made probabi-listically, corresponding to the relative activations of the outputnodes.
When corrective feedback is supplied for a stimulus (just asfeedback is supplied to people in the learning experiments), thenetwork determines the discrepancy between the correct responseand the output activations that it generated. The goal of thenetwork is to reduce this error. The first action it takes to reducethe error is a shift of attention across the input nodes. Attention isshifted away from cues that cause error and toward cues that eitherreduce error or at least do not increase error.
After attention has been shifted, the network then adjusts itsassociative weights. One set of weights to be adjusted connects the(attentionally gated) cues to the outputs. These weights are ad-justed by simple error-reduction learning, as in standard backpropagation and the Rescorla–Wagner model. Weights fromattended-to cues are adjusted more than ignored cues, by virtue ofthe attentional gating.
The network does not merely learn what overt response to makefor the cues. It also learns what covert attentional shift to makeacross the cues. Recall that the network’s first reaction to error isto shift attention away from error-causing cues. The networkshould learn to reproduce this shifted pattern of attention in thefuture, so that it does not generate the error again. In EXIT, thislearning of attentional distributions is accomplished by connec-tions between the cues and the attentional gates. In fact, there is aset of exemplar nodes that encode configurations of co-occurringcues, and the exemplar nodes are connected to the attentionalgates. The exemplar-mediated mapping from cues to attentiongates allows the network to learn exemplar-specific distributionsof attention. For example, in the context of the highlighting ex-periment, the network can learn to retain some attention on cue Ifor exemplar I.PE, but the network can learn to shift attention awayfrom cue I for exemplar I.PL. Thus, after attention has shifted, theassociative weights from the exemplar nodes to the attention nodesare adjusted, such that the shifted attentional distribution is betterevoked by that exemplar in the future.
Parameters related to attention. There are a number of pa-rameters that govern the specific quantitative behavior of EXIT.Three of these parameters are primarily concerned with attention.One such attentional parameter is the attentional shifting rate (�g inKruschke, 2001a, Equation 7, p. 1400), which determines howlarge a shift is made in response to error. A second attentionalparameter is the attentional learning rate (�x in Kruschke, 2001a,
839EYE GAZE AND ATTENTIONAL LEARNING
Equation 9, p. 1400). This parameter determines how large anadjustment is made to the weights from exemplars to attentionnodes. A third attentional parameter is the exemplar node speci-ficity (c in Kruschke, 2001a, Equation 3, p. 1399). This parametergoverns how much the learned attentional distribution generalizesfrom one exemplar to another. The larger the specificity, the lessthe learned attention generalizes. For example, when the networklearns for exemplar I.PL to shift attention toward PL, the speci-ficity parameter determines how much that learning will generalizeto the test probe PE.PL. In the simulation results reported below,the three attentional parameters will be yoked into a single factorbecause their effects on the model’s behavior are tightly linked.Enhancement of attentional influence is produced by increasingthe attentional shift rate, increasing the attentional learning rate ordecreasing the specificity of the learned attention, or both.
Parameters not directly related to attention. There are twoparameters that primarily govern the overall rate of learning asso-ciations from cues to outcomes. One of these parameters is, ofcourse, the learning rate for the weights connecting cues to outputs(�w in Kruschke, 2001a, Equation 8, p. 1400). The second param-eter is the capacity (P in Kruschke, 2001a, Equation 5, p. 1400).This parameter determines the total attentional weighting that canbe allocated across cues. Essentially, when the capacity is high,there is more attentional multiplication overall, and overall learn-ing is faster. The attentional capacity also has an influence on thedegree of competition between cues, but, at least in the presentexperimental designs, the parameter appears to have an influencevery similar to the learning rate on the output weights.
Another parameter in EXIT determines the decisiveness of themapping from output activations to choice probabilities (� inKruschke, 2001a, Equation 2, p. 1399). Suppose that one outputnode has activation of .7 and another output node has activation of.3. A highly decisive network would assign a high probability tothe first response and a low probability to the second response. Aweakly decisive network, on the other hand, would assign lessextreme probabilities to the two responses. It is important to noticethat this decisiveness parameter can greatly influence the magni-tude of choice probabilities generated by the network, but it has noinfluence whatsoever on learning or attention shifting. The deci-siveness parameter merely governs the back end of the networkthat maps network behavior to human choice data. The decisive-ness parameter does not directly influence the internal workings ofthe network.
A final parameter is the context node salience (� in Kruschke,2001a, Equations 3 and 4, p. 1399). In every stimulus, it isassumed that there is a shared context cue (e.g., the responseprompt that occurs with every stimulus in the experiment). Thiscue can be useful for learning differential base rates of outcomes,but in the present experimental designs it is essentially inconse-quential, and so the best fitting salience turns out to be close tozero.
Fit of EXIT
The EXIT model was formulated to generate choice probabili-ties. It was never explicitly meant to predict eye gaze. Neverthe-less, we will cautiously make the assumption that attention allo-cated to a cue generates eye gaze to that cue. Thus, to get arough-and-ready prediction of eye gaze from the model, we will
assume that the relative attention across cues predicts the relativeamount of eye gaze across cues.
In the Results section, we reported the absolute difference ingaze durations. For example, in the blocking paradigm we definedthe difference between duration of gaze at the control cue, D, andduration of gaze at the blocked cue, B, as DmBg � [(DL � BR) �(DR � BL)]/2. We now simply convert that difference to a relativemeasure, DmBg* � [(DL � BR)/(DL � BR) � (DR � BL)/(DR �BL)]/2. The value of DmBg* can range from �1 to �1. If a persongazes exclusively at D and never at B, then DmBg* � 1.0. If aperson gazes at D 55% of the time at at B 45% of the time, thenDmBg* � 0.10.
Across participants, the means of the relative gaze durationswere DmBg* � 0.0224, AmBg* � 0.0808, PLmPEg* � 0.0489,and PL.ImPE.Ig* � 0.0511.2 We shall attempt to fit these empir-ically measured values with the corresponding attentional differ-ences in the model. For example, on a D.B test trial in the blockingexperiment, the model’s attention to cue D is D� and the attentionto cue B is B�, and the relative attention is DmBg* � (D� �B�)/(D� � B�). That attention ratio in the model will be directly fitto the corresponding empirical gaze ratio, DmBg*. Notice thatthere are no additional parameters introduced to the model inmaking this direct mapping from model attention ratios to gazeduration ratios. This mapping is, no doubt, incomplete and quan-titatively lacking, but it turns out to be good enough for reasonablefits.
Other mappings from model attention to gaze ratios are possible.For example, when the stimuli appear, there might be an initialduration in which both cues are looked at and encoded (becausetheir positions are random) regardless of which cue will subse-quently in the trial get more sustained gaze because of learnedrelevance. In this case, the gaze ratios might instead correspond to(D� � B�)/(2E � D� � B�), where E reflects the time for initiallyencoding a cue. Other measures of relative gaze might also beused, such as the overall priority of looking at one cue or the otherwithin the sequence of fixations. Such a measure might be espe-cially appropriate if there were a process model describing eyemovements as a function of learned relevance of cues. After wecompleted our modeling, we noted that Rehder and Hoffman (inpress) reported a linear correspondence between model attentionvalues and gaze preferences. Merely for simplicity, however, wewill identify model attention ratio with empirical gaze ratio.
We will fit the EXIT model to overall mean data from all of theparticipants and then explore how the model behavior changeswhen parameter values deviate from the best fitting values. Theidea is that the parameter values that fit the overall mean mightdescribe an average participant, and variations from those centralparameter values would yield predictions of variations acrossindividuals. In particular, we are specifically interested in knowingwhether variations in attentional parameters generate correlatedvariations in blocking and highlighting, as predicted by the infor-mal theory that motivated the experiments and as suggested by thedata analyses reported above.
2 Using the proportional measure of gaze time, all of the resultsremained statistically reliable except a subset of those involvingPL.ImPE.Ig*, which had a relatively large variance. All of the trendsremained the same as those reported for the difference measure.
840 KRUSCHKE, KAPPENMAN, AND HETRICK
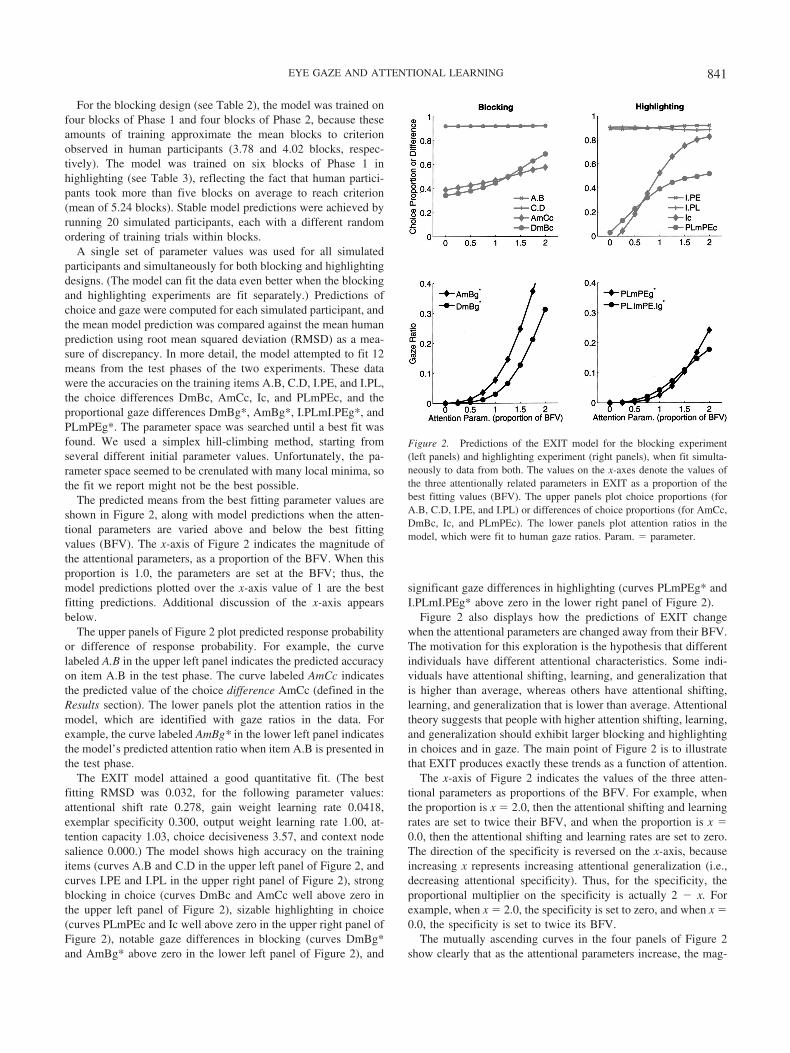
For the blocking design (see Table 2), the model was trained onfour blocks of Phase 1 and four blocks of Phase 2, because theseamounts of training approximate the mean blocks to criterionobserved in human participants (3.78 and 4.02 blocks, respec-tively). The model was trained on six blocks of Phase 1 inhighlighting (see Table 3), reflecting the fact that human partici-pants took more than five blocks on average to reach criterion(mean of 5.24 blocks). Stable model predictions were achieved byrunning 20 simulated participants, each with a different randomordering of training trials within blocks.
A single set of parameter values was used for all simulatedparticipants and simultaneously for both blocking and highlightingdesigns. (The model can fit the data even better when the blockingand highlighting experiments are fit separately.) Predictions ofchoice and gaze were computed for each simulated participant, andthe mean model prediction was compared against the mean humanprediction using root mean squared deviation (RMSD) as a mea-sure of discrepancy. In more detail, the model attempted to fit 12means from the test phases of the two experiments. These datawere the accuracies on the training items A.B, C.D, I.PE, and I.PL,the choice differences DmBc, AmCc, Ic, and PLmPEc, and theproportional gaze differences DmBg*, AmBg*, I.PLmI.PEg*, andPLmPEg*. The parameter space was searched until a best fit wasfound. We used a simplex hill-climbing method, starting fromseveral different initial parameter values. Unfortunately, the pa-rameter space seemed to be crenulated with many local minima, sothe fit we report might not be the best possible.
The predicted means from the best fitting parameter values areshown in Figure 2, along with model predictions when the atten-tional parameters are varied above and below the best fittingvalues (BFV). The x-axis of Figure 2 indicates the magnitude ofthe attentional parameters, as a proportion of the BFV. When thisproportion is 1.0, the parameters are set at the BFV; thus, themodel predictions plotted over the x-axis value of 1 are the bestfitting predictions. Additional discussion of the x-axis appearsbelow.
The upper panels of Figure 2 plot predicted response probabilityor difference of response probability. For example, the curvelabeled A.B in the upper left panel indicates the predicted accuracyon item A.B in the test phase. The curve labeled AmCc indicatesthe predicted value of the choice difference AmCc (defined in theResults section). The lower panels plot the attention ratios in themodel, which are identified with gaze ratios in the data. Forexample, the curve labeled AmBg* in the lower left panel indicatesthe model’s predicted attention ratio when item A.B is presented inthe test phase.
The EXIT model attained a good quantitative fit. (The bestfitting RMSD was 0.032, for the following parameter values:attentional shift rate 0.278, gain weight learning rate 0.0418,exemplar specificity 0.300, output weight learning rate 1.00, at-tention capacity 1.03, choice decisiveness 3.57, and context nodesalience 0.000.) The model shows high accuracy on the trainingitems (curves A.B and C.D in the upper left panel of Figure 2, andcurves I.PE and I.PL in the upper right panel of Figure 2), strongblocking in choice (curves DmBc and AmCc well above zero inthe upper left panel of Figure 2), sizable highlighting in choice(curves PLmPEc and Ic well above zero in the upper right panel ofFigure 2), notable gaze differences in blocking (curves DmBg*and AmBg* above zero in the lower left panel of Figure 2), and
significant gaze differences in highlighting (curves PLmPEg* andI.PLmI.PEg* above zero in the lower right panel of Figure 2).
Figure 2 also displays how the predictions of EXIT changewhen the attentional parameters are changed away from their BFV.The motivation for this exploration is the hypothesis that differentindividuals have different attentional characteristics. Some indi-viduals have attentional shifting, learning, and generalization thatis higher than average, whereas others have attentional shifting,learning, and generalization that is lower than average. Attentionaltheory suggests that people with higher attention shifting, learning,and generalization should exhibit larger blocking and highlightingin choices and in gaze. The main point of Figure 2 is to illustratethat EXIT produces exactly these trends as a function of attention.
The x-axis of Figure 2 indicates the values of the three atten-tional parameters as proportions of the BFV. For example, whenthe proportion is x � 2.0, then the attentional shifting and learningrates are set to twice their BFV, and when the proportion is x �0.0, then the attentional shifting and learning rates are set to zero.The direction of the specificity is reversed on the x-axis, becauseincreasing x represents increasing attentional generalization (i.e.,decreasing attentional specificity). Thus, for the specificity, theproportional multiplier on the specificity is actually 2 � x. Forexample, when x � 2.0, the specificity is set to zero, and when x �0.0, the specificity is set to twice its BFV.
The mutually ascending curves in the four panels of Figure 2show clearly that as the attentional parameters increase, the mag-
Figure 2. Predictions of the EXIT model for the blocking experiment(left panels) and highlighting experiment (right panels), when fit simulta-neously to data from both. The values on the x-axes denote the values ofthe three attentionally related parameters in EXIT as a proportion of thebest fitting values (BFV). The upper panels plot choice proportions (forA.B, C.D, I.PE, and I.PL) or differences of choice proportions (for AmCc,DmBc, Ic, and PLmPEc). The lower panels plot attention ratios in themodel, which were fit to human gaze ratios. Param. � parameter.
841EYE GAZE AND ATTENTIONAL LEARNING
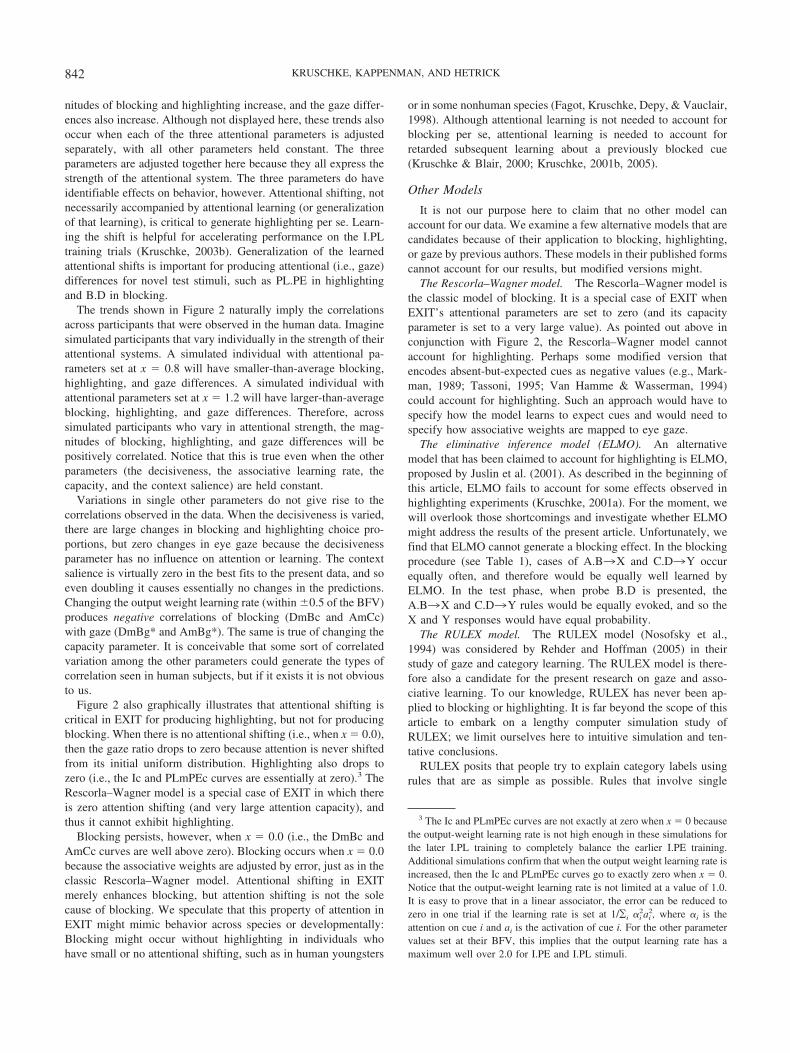
nitudes of blocking and highlighting increase, and the gaze differ-ences also increase. Although not displayed here, these trends alsooccur when each of the three attentional parameters is adjustedseparately, with all other parameters held constant. The threeparameters are adjusted together here because they all express thestrength of the attentional system. The three parameters do haveidentifiable effects on behavior, however. Attentional shifting, notnecessarily accompanied by attentional learning (or generalizationof that learning), is critical to generate highlighting per se. Learn-ing the shift is helpful for accelerating performance on the I.PLtraining trials (Kruschke, 2003b). Generalization of the learnedattentional shifts is important for producing attentional (i.e., gaze)differences for novel test stimuli, such as PL.PE in highlightingand B.D in blocking.
The trends shown in Figure 2 naturally imply the correlationsacross participants that were observed in the human data. Imaginesimulated participants that vary individually in the strength of theirattentional systems. A simulated individual with attentional pa-rameters set at x � 0.8 will have smaller-than-average blocking,highlighting, and gaze differences. A simulated individual withattentional parameters set at x � 1.2 will have larger-than-averageblocking, highlighting, and gaze differences. Therefore, acrosssimulated participants who vary in attentional strength, the mag-nitudes of blocking, highlighting, and gaze differences will bepositively correlated. Notice that this is true even when the otherparameters (the decisiveness, the associative learning rate, thecapacity, and the context salience) are held constant.
Variations in single other parameters do not give rise to thecorrelations observed in the data. When the decisiveness is varied,there are large changes in blocking and highlighting choice pro-portions, but zero changes in eye gaze because the decisivenessparameter has no influence on attention or learning. The contextsalience is virtually zero in the best fits to the present data, and soeven doubling it causes essentially no changes in the predictions.Changing the output weight learning rate (within �0.5 of the BFV)produces negative correlations of blocking (DmBc and AmCc)with gaze (DmBg* and AmBg*). The same is true of changing thecapacity parameter. It is conceivable that some sort of correlatedvariation among the other parameters could generate the types ofcorrelation seen in human subjects, but if it exists it is not obviousto us.
Figure 2 also graphically illustrates that attentional shifting iscritical in EXIT for producing highlighting, but not for producingblocking. When there is no attentional shifting (i.e., when x � 0.0),then the gaze ratio drops to zero because attention is never shiftedfrom its initial uniform distribution. Highlighting also drops tozero (i.e., the Ic and PLmPEc curves are essentially at zero).3 TheRescorla–Wagner model is a special case of EXIT in which thereis zero attention shifting (and very large attention capacity), andthus it cannot exhibit highlighting.
Blocking persists, however, when x � 0.0 (i.e., the DmBc andAmCc curves are well above zero). Blocking occurs when x � 0.0because the associative weights are adjusted by error, just as in theclassic Rescorla–Wagner model. Attentional shifting in EXITmerely enhances blocking, but attention shifting is not the solecause of blocking. We speculate that this property of attention inEXIT might mimic behavior across species or developmentally:Blocking might occur without highlighting in individuals whohave small or no attentional shifting, such as in human youngsters
or in some nonhuman species (Fagot, Kruschke, Depy, & Vauclair,1998). Although attentional learning is not needed to account forblocking per se, attentional learning is needed to account forretarded subsequent learning about a previously blocked cue(Kruschke & Blair, 2000; Kruschke, 2001b, 2005).
Other Models
It is not our purpose here to claim that no other model canaccount for our data. We examine a few alternative models that arecandidates because of their application to blocking, highlighting,or gaze by previous authors. These models in their published formscannot account for our results, but modified versions might.
The Rescorla–Wagner model. The Rescorla–Wagner model isthe classic model of blocking. It is a special case of EXIT whenEXIT’s attentional parameters are set to zero (and its capacityparameter is set to a very large value). As pointed out above inconjunction with Figure 2, the Rescorla–Wagner model cannotaccount for highlighting. Perhaps some modified version thatencodes absent-but-expected cues as negative values (e.g., Mark-man, 1989; Tassoni, 1995; Van Hamme & Wasserman, 1994)could account for highlighting. Such an approach would have tospecify how the model learns to expect cues and would need tospecify how associative weights are mapped to eye gaze.
The eliminative inference model (ELMO). An alternativemodel that has been claimed to account for highlighting is ELMO,proposed by Juslin et al. (2001). As described in the beginning ofthis article, ELMO fails to account for some effects observed inhighlighting experiments (Kruschke, 2001a). For the moment, wewill overlook those shortcomings and investigate whether ELMOmight address the results of the present article. Unfortunately, wefind that ELMO cannot generate a blocking effect. In the blockingprocedure (see Table 1), cases of A.B3X and C.D3Y occurequally often, and therefore would be equally well learned byELMO. In the test phase, when probe B.D is presented, theA.B3X and C.D3Y rules would be equally evoked, and so theX and Y responses would have equal probability.
The RULEX model. The RULEX model (Nosofsky et al.,1994) was considered by Rehder and Hoffman (2005) in theirstudy of gaze and category learning. The RULEX model is there-fore also a candidate for the present research on gaze and asso-ciative learning. To our knowledge, RULEX has never been ap-plied to blocking or highlighting. It is far beyond the scope of thisarticle to embark on a lengthy computer simulation study ofRULEX; we limit ourselves here to intuitive simulation and ten-tative conclusions.
RULEX posits that people try to explain category labels usingrules that are as simple as possible. Rules that involve single
3 The Ic and PLmPEc curves are not exactly at zero when x � 0 becausethe output-weight learning rate is not high enough in these simulations forthe later I.PL training to completely balance the earlier I.PE training.Additional simulations confirm that when the output weight learning rate isincreased, then the Ic and PLmPEc curves go to exactly zero when x � 0.Notice that the output-weight learning rate is not limited at a value of 1.0.It is easy to prove that in a linear associator, the error can be reduced tozero in one trial if the learning rate is set at 1/¥i �i
2ai2, where �i is the
attention on cue i and ai is the activation of cue i. For the other parametervalues set at their BFV, this implies that the output learning rate has amaximum well over 2.0 for I.PE and I.PL stimuli.
842 KRUSCHKE, KAPPENMAN, AND HETRICK
features or dimensions are simplest and therefore tested first. Nextsimplest, usually, are single-feature rules with a small number ofexceptions specified by a small number of additional features.Conjunctive rules involving as few features as possible are usuallyconsidered next. Among the free parameters of RULEX is abranching parameter that specifies the probability of testing im-perfect single-feature rules before testing conjunctive rules.RULEX retains a rule as long as it makes enough correct predic-tions (according to a criterion that is a parameter of the model),otherwise the rule is jettisoned and a different rule is tested. In thisway RULEX is error-driven, as is the Rescorla–Wagner model andthe EXIT model. Because RULEX encodes only a small number offeatures whenever possible, it is also attentionally selective, likeEXIT.
When applied to blocking (see Table 1), RULEX would learn inPhase 1 the rule A3X. In Phase 2, that rule would correctlypredict the outcome of cases A.B3X, and therefore would beretained, and no new rule involving B would be learned. Whenlearning cases of C.D3Y, RULEX would learn one of the single-feature rules, C3Y or D3Y, but presumably not both. Finally,when confronted with test case B.D, RULEX would do one of twothings. If it had learned D3Y in Phase 2, then this rule would bematched and RULEX would respond with Y. If it had learnedC3Y in Phase 2, then RULEX would have no known rulesinvolving B or D, and it would simply choose randomly from theresponse options. Analogous reasoning applies to test case A.C.Thus, on average, RULEX would exhibit blocking in its choicepredictions.
Rehder and Hoffman (2005) hypothesized that if RULEX hadeyes, it would look at the features in its learned rules more than atfeatures that were not in its learned rules, because only the featuresin its learned rules are informative for making responses. From thishypothesis mapping covert rules to overt gaze, it follows thatRULEX would also show blocking in gaze (i.e., look more onaverage at control cues C and D than at blocked cue B, and lookmore at the blocking cue A than at the control cues).
When applied to highlighting (see Table 1), the predictions ofRULEX are more complicated. In the early training phase,RULEX would learn from training case I.PE3E either the ruleI3E or the rule PE3E. Suppose RULEX learned PE3E. In thelater learning phase, RULEX might test the rule I3L but find itimperfect, and therefore settle on PL3L. With these rules (PE3Eand PL3L), RULEX would not show highlighting. Suppose,however, that RULEX learned I3E in the early training phase. Inthe later training phase, RULEX could jettison that now-imperfectearly rule and learn the rules PE3E and PL3L. Again in this caseit would not show highlighting. Alternatively, with a probabilitygoverned by a free parameter, RULEX could retain the early ruleI3E and learn I.PL3L as an exception. In this case, RULEXwould show highlighting. In summary, RULEX predicts that atleast one half of the participants would learn the rules PE3E andPL3L, and therefore would not show highlighting, but at leastsome of the remaining half of the participants would learn the rulesI3E and I.PL3L, and therefore would exhibit highlighting.
Thus, RULEX could qualitatively produce the basic blockingand highlighting effects. Unfortunately, RULEX might sufferwhen trying to simultaneously fit data from other probe items. Forexample, in highlighting, the test phase can include the case of PEby itself. People respond E in this case at very high rates (e.g.,
92.5% in Experiment 2 of Kruschke, 1996). For RULEX to exhibitstrong highlighting, a sizable proportion of its simulated partici-pants do not know anything about PE, and therefore RULEXwould probably not show high response rates for PE.
It is also not clear how RULEX would show correlations inblocking and highlighting. Whereas the degree of highlightingwould be governed by the degree to which people look for excep-tions to rules (rather than jettisoning imperfect rules), it is not clearhow that would govern the degree of blocking. Indeed, the block-ing procedure is so simple that it is unclear how RULEX wouldshow any variance at all, except through its response-error param-eter, which governs the extent to which individuals make a ran-dom, unintended response.
Despite these potential problems, it is likely that a reasonablevariant of RULEX could account for the blocking and highlightingdata we have presented in this article. If so, the essential explan-atory principles in RULEX are fundamentally similar to those inEXIT: Cues are selectively attended to, and the selection of cues isdriven by error reduction.
Variants of ALCOVE. The ALCOVE model (Kruschke, 1992)learns to differentially attend to psychological stimulus dimensionsdepending on their relevance to the category label, and the rapidattention shifts ‘n’ learning (RASHNL) model (Kruschke & Jo-hansen, 1999) is an extension of ALCOVE that incorporates rapidshifts of attention (in contradistinction to the presumably moregradual shifts in ALCOVE). Both models assume that what isattended to is dimensions, as opposed to values within dimensions,whereas the CORNER model (Kalish & Kruschke, 2000) alsoselectively attends to values within dimensions. None of thesemodels is specifically designed to address traditional blocking orhighlighting procedures, however, which rely on the presence orabsence of cues (cf. Kalish, 2001). Verguts, Ameel, and Storms(2004) incorporated into ALCOVE a different similarity functionthat can accommodate present and absent features, in a model theycalled additive ALCOVE (ADDCOVE). The ADDCOVE modelhas no attention-shifting mechanism, however, and therefore can-not account for highlighting. Perhaps future work could combinethe similarity function of ADDCOVE with the rapid shifts ofattention in RASHNL or EXIT to address the results reported inthe present article.
Summary and Discussion
Previous research using choice data alone has suggested thathighlighting and blocking involve learned shifts of cognitive at-tention. If people tend to look at what they are cognitively attend-ing to, then they should tend to look more at highlighted cues andless at blocked cues. These predictions were confirmed.
To the extent that attentional shifting and learning vary acrossindividuals and are stable individual differences, there should becovariation of attention-dependent behaviors across individuals. Ifattentional shifting and learning is an important factor in blocking,and if eye gaze is linked with cognitive attention, then individualswho show stronger blocking in choice should show stronger dif-ferences in eye gaze. This predicted correlation was confirmed.Analogously, if attentional shifting and learning is an importantfactor in highlighting, and if eye gaze is linked with cognitiveattention, then individuals who show stronger highlighting inchoice should show stronger differences in eye gaze. This pre-
843EYE GAZE AND ATTENTIONAL LEARNING
dicted correlation was also confirmed (although marginal two-tailed). If attentional shifting and learning is an important factor inboth blocking and highlighting, and if eye gaze is linked withcognitive attention, then individuals who show larger gaze differ-ences in blocking should tend to show larger gaze differences inhighlighting. This predicted correlation was confirmed. Finally, ifattentional shifting and learning is an important factor in bothblocking and highlighting, then individuals who show strongerblocking (measured by choice) should tend to show strongerhighlighting (measured by choice). This predicted correlation wasalso confirmed. Note that this last prediction does not depend oneye gaze.
A formal model of attentional shifting and learning was fitsimultaneously to choice and gaze data from blocking and high-lighting experiments. The model could also naturally account forcorrelations of blocking, highlighting, and gaze by varying theattentional parameters across simulated participants. Other param-eters in the model, such as choice decisiveness or learning rate, donot easily show such correlations. Other candidate models from theliterature cannot account for the findings, but perhaps those modelscould be modified in future research.
As a whole, this research adds significant new evidence to theargument that highlighting and blocking involve learned attention.Not only do people tend to look less at blocked cues and more athighlighted cues, but covariation across people suggests enduringindividual differences in attentional shifting and learning.
Attention in EXIT and Other Formalizations
Attention means different things to different researchers, de-pending in part on what is conceived to be the recipient ofattention. Attention can be allocated to spatial locations, to objects,to features or dimensions (either spatially localized or spreadacross space and time), to response options, to outcomes, or todiscrepancies between actual and predicted outcomes. Attentionalso means different things depending on its role in processing.Attention can refer to an enhanced effect on immediate generationof a response, or it can refer to enhanced learning that is onlymanifested in later behavior. In this section we briefly discuss whatsort of attention is formalized in the EXIT model.
In EXIT (Kruschke, 2001a, 2001b), attention is formalized asmultipliers on cue activations. The multipliers affect both imme-diate response generation and subsequent learning about the cues.Some previous theories have separated those functions; for exam-ple, Mackintosh (1975) emphasized attention to a cue as its learn-ing rate or associability, distinct from its immediate impact onresponse generation. The associability of a cue increased if it waspredictive of the outcome, and decreased otherwise. Kruschke(2001b) described formal relationships between Mackintosh’s ap-proach and the EXIT model. Pearce and Hall (1980) proposed analternative perspective in which the associability of a cue is de-termined as the error it caused on its previous presentation. Thisapproach implies that after sufficient learning, when there is littleerror, the associability of a cue is low. The different approachesaddress different sets of data, and a unified approach has yet toemerge. Pearce and Bouton (2001) provided a nice review of theseissues. In EXIT, predictions of differential gaze come from thenotion of attention as a multiplier for immediate response gener-ation. It is not clear how the Mackintosh or Pearce and Hall
approaches might be modified to address eye gaze (and, note thatthose approaches were designed with animal, not human, learningin mind).
The EXIT model attends to cues. In general, cues can be(circularly) defined as any psychological entity to which attentioncan be allocated. A cue can be a concept, a word, a color value(e.g., red), color as a dimension (as distinct from, say, the dimen-sion of shape), objects, locations, and so on. Cues can be spatio-temporally localized or distributed. More specifically, the EXITmodel attends to present and absent features (e.g., the word ocean,which can be present or absent). Other models, such as RASHNL(Kruschke & Johansen, 1999) and its predecessor ALCOVE(Kruschke, 1992), attend to dimensions (e.g., the dimensions ofcolor vs. shape). The CORNER model (Kalish & Kruschke, 2000)extends the representation of EXIT to include continuous dimen-sions, so that the model simultaneously attends to dimensions andvalues within dimensions. Our aim here is simply to point out thatthese distinctions exist and to be clear that connections betweenthese varieties of attention are not a foregone conclusion. In thepresent research, we relied on a hypothesized correspondencebetween (a) cognitive attention to a concept and (b) perceptualattention to the word designating that concept (although the loca-tion of the word varied across trials and people could not uselocation as an indicator of relevance, unlike the experiments ofRehder & Hoffman, 2005, in press). This correspondence does notpreserve some aspects of attention in the two realms. For example,cognitive attention might be distributed across several conceptssimultaneously, but eye gaze is directed at one location at a time.
Logan (2002) presented a unified view of attention to dimen-sions, response options, and objects, which he called the instancetheory of attention and memory (ITAM; see also Logan, 2004). InITAM, selective attention to an item in space is conceptualized asthe same process as selective attention to a categorical response.The two selective processes take place simultaneously and in aunified formalization. This is unlike the approach taken by EXIT,in which competition between response options is distinct fromcompetition between cues (or objects). ITAM learns by storingcopies of whatever instances it has attended to, but it does not havea mechanism for shifting or learning attention analogous to EXIT.Perhaps an even broader unification of these attentional theorieswill emerge soon.
References
Anderson, J. R., Bothell, D., & Douglass, S. (2004). Eye movements do notreflect retrieval processes: Limits of the eye–mind hypothesis. Psycho-logical Science, 15, 225–231.
Crookes, A. E., & Moran, P. M. (2003). An investigation into age andgender differences in human Kamin blocking, using a computerizedtask. Developmental Neuropsychology, 24, 461–477.
Engle, R. W. (2002). Working memory capacity as executive attention.Current Directions in Psychological Science, 11, 19–23.
Fagot, J., Kruschke, J. K., Depy, D., & Vauclair, J. (1998). Associativelearning in humans (Homo sapiens) and baboons (Papio papio): Speciesdifferences in learned attention to visual features. Animal Cognition, 1,123–133.
Gibbons, H., Rammsayer, T. H., & Lubow, R. E. (2001). Latent inhibitiondepends on inhibitory attentional learning to the preexposed stimulus:Evidence from visual search and rule-learning tasks. Learning andMotivation, 32, 457–476.
844 KRUSCHKE, KAPPENMAN, AND HETRICK
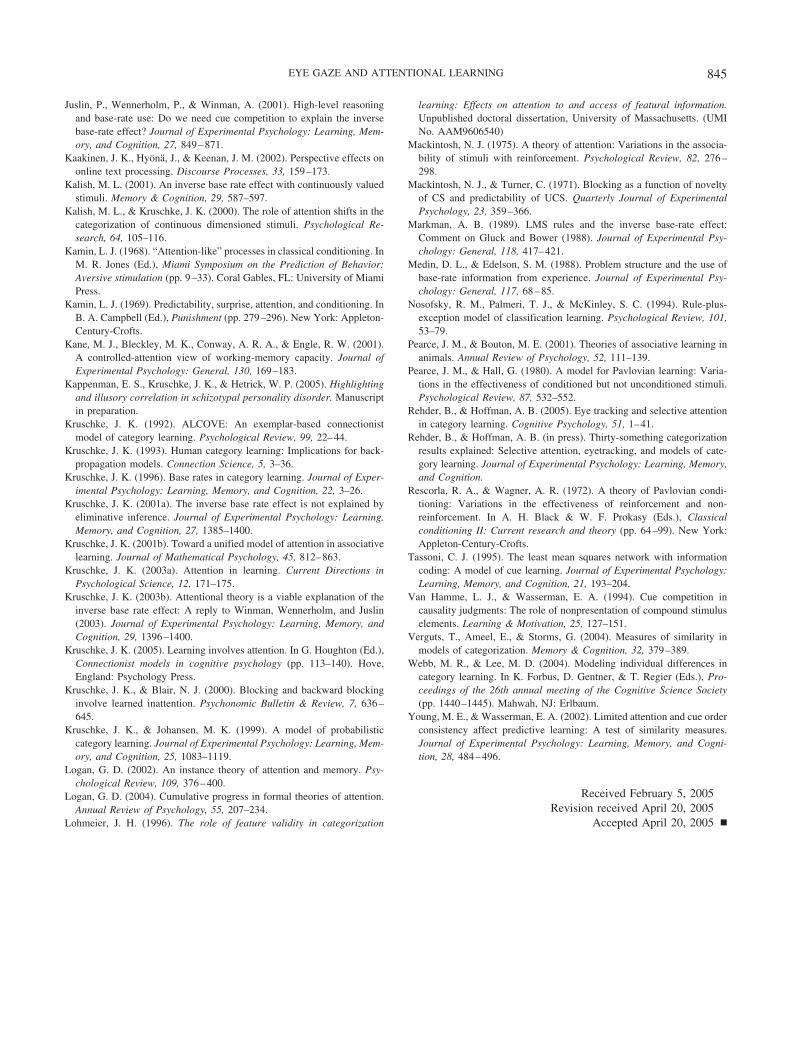
Juslin, P., Wennerholm, P., & Winman, A. (2001). High-level reasoningand base-rate use: Do we need cue competition to explain the inversebase-rate effect? Journal of Experimental Psychology: Learning, Mem-ory, and Cognition, 27, 849–871.
Kaakinen, J. K., Hyona, J., & Keenan, J. M. (2002). Perspective effects ononline text processing. Discourse Processes, 33, 159–173.
Kalish, M. L. (2001). An inverse base rate effect with continuously valuedstimuli. Memory & Cognition, 29, 587–597.
Kalish, M. L., & Kruschke, J. K. (2000). The role of attention shifts in thecategorization of continuous dimensioned stimuli. Psychological Re-search, 64, 105–116.
Kamin, L. J. (1968). “Attention-like” processes in classical conditioning. InM. R. Jones (Ed.), Miami Symposium on the Prediction of Behavior:Aversive stimulation (pp. 9–33). Coral Gables, FL: University of MiamiPress.
Kamin, L. J. (1969). Predictability, surprise, attention, and conditioning. InB. A. Campbell (Ed.), Punishment (pp. 279–296). New York: Appleton-Century-Crofts.
Kane, M. J., Bleckley, M. K., Conway, A. R. A., & Engle, R. W. (2001).A controlled-attention view of working-memory capacity. Journal ofExperimental Psychology: General, 130, 169–183.
Kappenman, E. S., Kruschke, J. K., & Hetrick, W. P. (2005). Highlightingand illusory correlation in schizotypal personality disorder. Manuscriptin preparation.
Kruschke, J. K. (1992). ALCOVE: An exemplar-based connectionistmodel of category learning. Psychological Review, 99, 22–44.
Kruschke, J. K. (1993). Human category learning: Implications for back-propagation models. Connection Science, 5, 3–36.
Kruschke, J. K. (1996). Base rates in category learning. Journal of Exper-imental Psychology: Learning, Memory, and Cognition, 22, 3–26.
Kruschke, J. K. (2001a). The inverse base rate effect is not explained byeliminative inference. Journal of Experimental Psychology: Learning,Memory, and Cognition, 27, 1385–1400.
Kruschke, J. K. (2001b). Toward a unified model of attention in associativelearning. Journal of Mathematical Psychology, 45, 812–863.
Kruschke, J. K. (2003a). Attention in learning. Current Directions inPsychological Science, 12, 171–175.
Kruschke, J. K. (2003b). Attentional theory is a viable explanation of theinverse base rate effect: A reply to Winman, Wennerholm, and Juslin(2003). Journal of Experimental Psychology: Learning, Memory, andCognition, 29, 1396–1400.
Kruschke, J. K. (2005). Learning involves attention. In G. Houghton (Ed.),Connectionist models in cognitive psychology (pp. 113–140). Hove,England: Psychology Press.
Kruschke, J. K., & Blair, N. J. (2000). Blocking and backward blockinginvolve learned inattention. Psychonomic Bulletin & Review, 7, 636–645.
Kruschke, J. K., & Johansen, M. K. (1999). A model of probabilisticcategory learning. Journal of Experimental Psychology: Learning, Mem-ory, and Cognition, 25, 1083–1119.
Logan, G. D. (2002). An instance theory of attention and memory. Psy-chological Review, 109, 376–400.
Logan, G. D. (2004). Cumulative progress in formal theories of attention.Annual Review of Psychology, 55, 207–234.
Lohmeier, J. H. (1996). The role of feature validity in categorization
learning: Effects on attention to and access of featural information.Unpublished doctoral dissertation, University of Massachusetts. (UMINo. AAM9606540)
Mackintosh, N. J. (1975). A theory of attention: Variations in the associa-bility of stimuli with reinforcement. Psychological Review, 82, 276–298.
Mackintosh, N. J., & Turner, C. (1971). Blocking as a function of noveltyof CS and predictability of UCS. Quarterly Journal of ExperimentalPsychology, 23, 359–366.
Markman, A. B. (1989). LMS rules and the inverse base-rate effect:Comment on Gluck and Bower (1988). Journal of Experimental Psy-chology: General, 118, 417–421.
Medin, D. L., & Edelson, S. M. (1988). Problem structure and the use ofbase-rate information from experience. Journal of Experimental Psy-chology: General, 117, 68–85.
Nosofsky, R. M., Palmeri, T. J., & McKinley, S. C. (1994). Rule-plus-exception model of classification learning. Psychological Review, 101,53–79.
Pearce, J. M., & Bouton, M. E. (2001). Theories of associative learning inanimals. Annual Review of Psychology, 52, 111–139.
Pearce, J. M., & Hall, G. (1980). A model for Pavlovian learning: Varia-tions in the effectiveness of conditioned but not unconditioned stimuli.Psychological Review, 87, 532–552.
Rehder, B., & Hoffman, A. B. (2005). Eye tracking and selective attentionin category learning. Cognitive Psychology, 51, 1–41.
Rehder, B., & Hoffman, A. B. (in press). Thirty-something categorizationresults explained: Selective attention, eyetracking, and models of cate-gory learning. Journal of Experimental Psychology: Learning, Memory,and Cognition.
Rescorla, R. A., & Wagner, A. R. (1972). A theory of Pavlovian condi-tioning: Variations in the effectiveness of reinforcement and non-reinforcement. In A. H. Black & W. F. Prokasy (Eds.), Classicalconditioning II: Current research and theory (pp. 64–99). New York:Appleton-Century-Crofts.
Tassoni, C. J. (1995). The least mean squares network with informationcoding: A model of cue learning. Journal of Experimental Psychology:Learning, Memory, and Cognition, 21, 193–204.
Van Hamme, L. J., & Wasserman, E. A. (1994). Cue competition incausality judgments: The role of nonpresentation of compound stimuluselements. Learning & Motivation, 25, 127–151.
Verguts, T., Ameel, E., & Storms, G. (2004). Measures of similarity inmodels of categorization. Memory & Cognition, 32, 379–389.
Webb, M. R., & Lee, M. D. (2004). Modeling individual differences incategory learning. In K. Forbus, D. Gentner, & T. Regier (Eds.), Pro-ceedings of the 26th annual meeting of the Cognitive Science Society(pp. 1440–1445). Mahwah, NJ: Erlbaum.
Young, M. E., & Wasserman, E. A. (2002). Limited attention and cue orderconsistency affect predictive learning: A test of similarity measures.Journal of Experimental Psychology: Learning, Memory, and Cogni-tion, 28, 484–496.
Received February 5, 2005Revision received April 20, 2005
Accepted April 20, 2005 �
845EYE GAZE AND ATTENTIONAL LEARNING