Export Sector in Sri Lanka: Issues and Challenges · 2017-06-05 · Export Sector in Sri Lanka:...
22
Export Sector in Sri Lanka: Issues and Challenges Saman Kelegama Institute of Policy Studies of Sri Lanka Presentation to the 18 th AGM of the National Chamber of Exporters of Sri Lanka, Colombo Hilton, 10 January 2013
Transcript of Export Sector in Sri Lanka: Issues and Challenges · 2017-06-05 · Export Sector in Sri Lanka:...

Export Sector in Sri Lanka: Issues and Challenges
Saman KelegamaInstitute of Policy Studies of Sri LankaPresentation to the 18th AGM of the National Chamber of Exporters of Sri Lanka, Colombo Hilton, 10 January 2013

Presentation FormatPresentation Format
• Emerging Picture at the Macro and• Emerging Picture at the Macro and Disaggregated level
• Comparing current performance and overall performance with some competitor countries
• Major concerns on the export sector• Major concerns on the export sector
• Way Forward
Overall Macro Picture of ExportsOverall Macro Picture of Exports
• Sri Lanka’s export performance since 2000 has p pnot been satisfactory
• Sri Lankan share in global exports has been on the declinethe decline
• Sri Lankan exports as a share of GDP has been on the declinethe decline
• Sri Lanka witnessed a decline in absolute earnings of exports in 2012
• Expanding trade deficit in 2011 and 2012 is partly explained by the unimpressive performance of the export sectorthe export sector

Declining Export Share
Sri Lanka’s Export Share, 1990-2011
Sources: Central Bank of Sri Lanka & IMF Direction of Trade Statistics

Reflected at the Disaggregated LevelReflected at the Disaggregated Level
• This decrease in export share in the globalThis decrease in export share in the global market is reflected at the disaggregated level of exports
• The decline in absolute export earnings in 2012 is also reflected at the disaggregated level
• There was hardly any improvement in the trade deficit in 2012 because of the decline in growth of exports in 2012
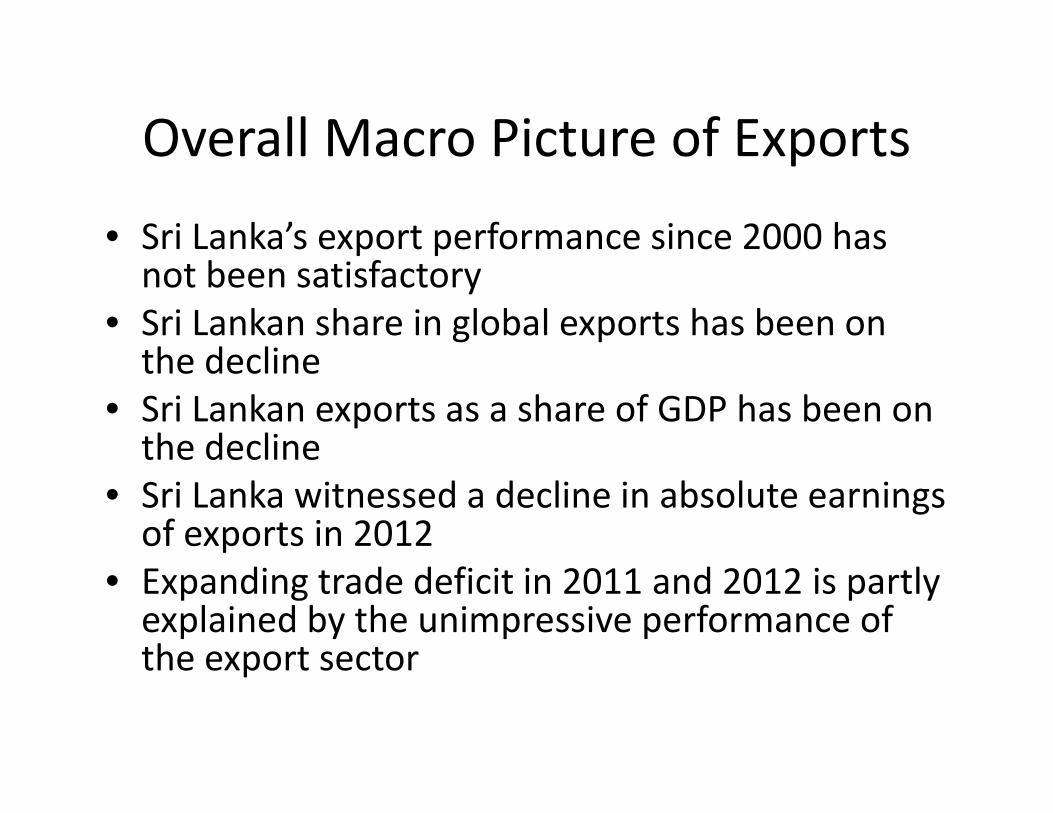
Declining Export Share: Disaggregated Level
• Stagnant or declining shares for most key products
Sri Lanka’s Share in World Exports 2005 & 2010
HSCode
Product Description Share in World Exports (%)
Sri Lanka s Share in World Exports, 2005 & 2010
2005 2010
61 Articles of apparel, knitted or crocheted 0.9 0.9
62 Articles of apparel, not knitted or crocheted 1.1 0.9
09 Coffee, tea, mate & spices 4.6 4.2
40 Rubber & articles thereof 0.4 0.4
71 Pearls precious stones metals 0 2 0 171 Pearls, precious stones, metals 0.2 0.1
69 Ceramic products 0.1 0.1
14 Vegetable plaiting materials 0.8 1.3
03 Fish, crustaceans, molluscs, aquatic invertebrates
0.2 0.2
Source: Export Development Board, 2012.
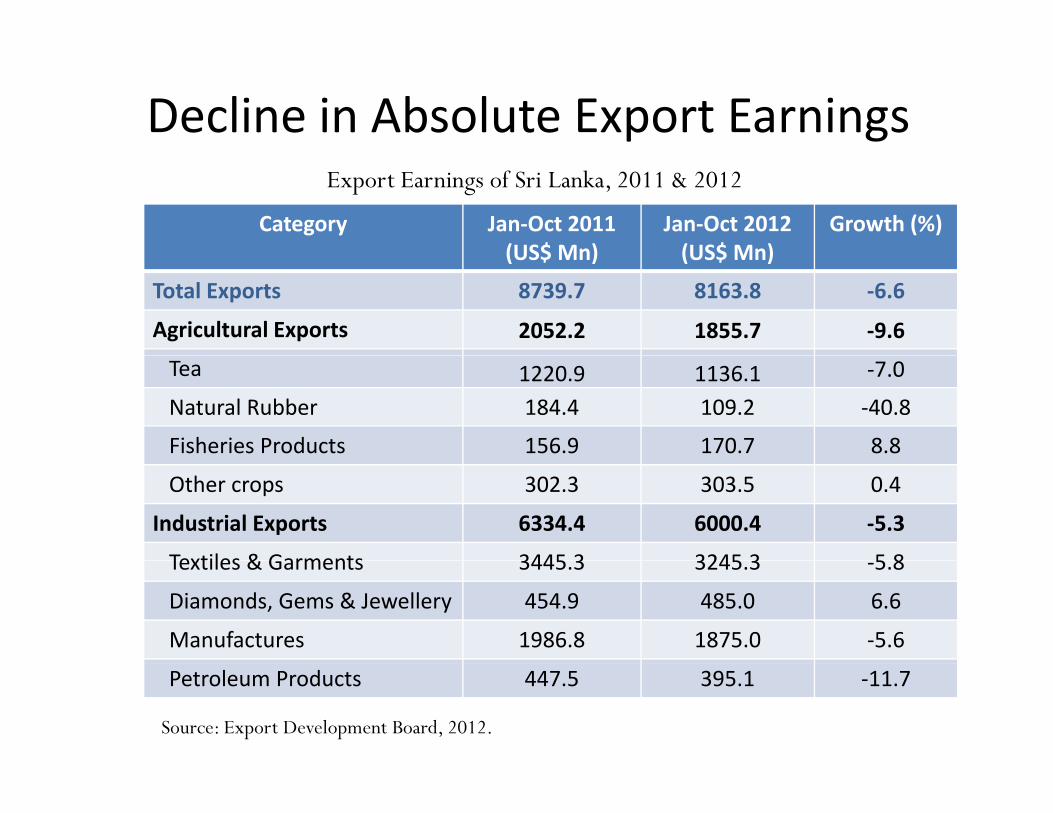
Decline in Absolute Export Earnings
Category Jan‐Oct 2011 (US$ Mn)
Jan‐Oct 2012 (US$ Mn)
Growth (%)
Export Earnings of Sri Lanka, 2011 & 2012
(US$ Mn) (US$ Mn)
Total Exports 8739.7 8163.8 ‐6.6
Agricultural Exports 2052.2 1855.7 ‐9.6
Tea 1220.9 1136.1 ‐7.0
Natural Rubber 184.4 109.2 ‐40.8
Fisheries Products 156.9 170.7 8.8
Other crops 302.3 303.5 0.4
Industrial Exports 6334.4 6000.4 ‐5.3
Textiles & Garments 3445 3 3245 3 5 8Textiles & Garments 3445.3 3245.3 ‐5.8
Diamonds, Gems & Jewellery 454.9 485.0 6.6
Manufactures 1986.8 1875.0 ‐5.6
Petroleum Products 447.5 395.1 ‐11.7
Source: Export Development Board, 2012.
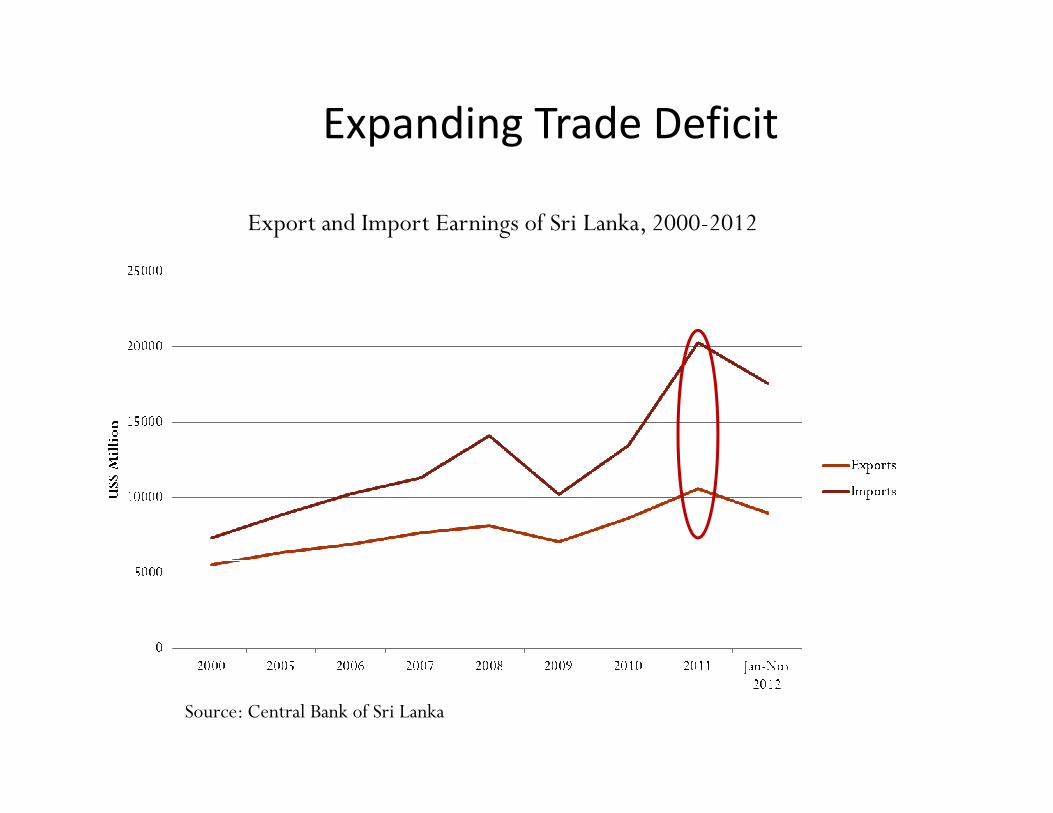
Expanding Trade Deficit
Export and Import Earnings of Sri Lanka, 2000-2012
Source: Central Bank of Sri Lanka

Sri Lankan Performance compared hwith Competitors ?
• Is it the global economic downturn that hasIs it the global economic downturn that has been responsible for the unimpressive export performance in 2010 and 2011 ?performance in 2010 and 2011 ?
• We will examine the performance of some competitors of Sri Lanka in 2010 and 2011competitors of Sri Lanka in 2010 and 2011
• We will then highlight two countries that have ll k S i L k iwell overtaken Sri Lanka in export
performance

Comparing Sri Lanka with CompetitorsComparing Sri Lanka with Competitors
• In 2010 Sri Lankan exports grew at 18.2%0 0 S a a e po ts g e at 8. %compared to India‐ 40.5%, Vietnam 26.4%, Thailand 28.1%, Philippines 34% and Mauritius 18.7%
• In 2011 Sri Lankan exports grew at 5.4% d t I di 29 3% Vi t 33 3%compared to India ‐ 29.3%, Vietnam – 33.3%,
Thailand‐ 17.4%, Pakistan 29.3%, Bangladesh41.5% and Mauritius 23%41.5% and Mauritius 23%
• Clearly the global economic downturn is not the only reason for the low export growth in Sri Lankay p g
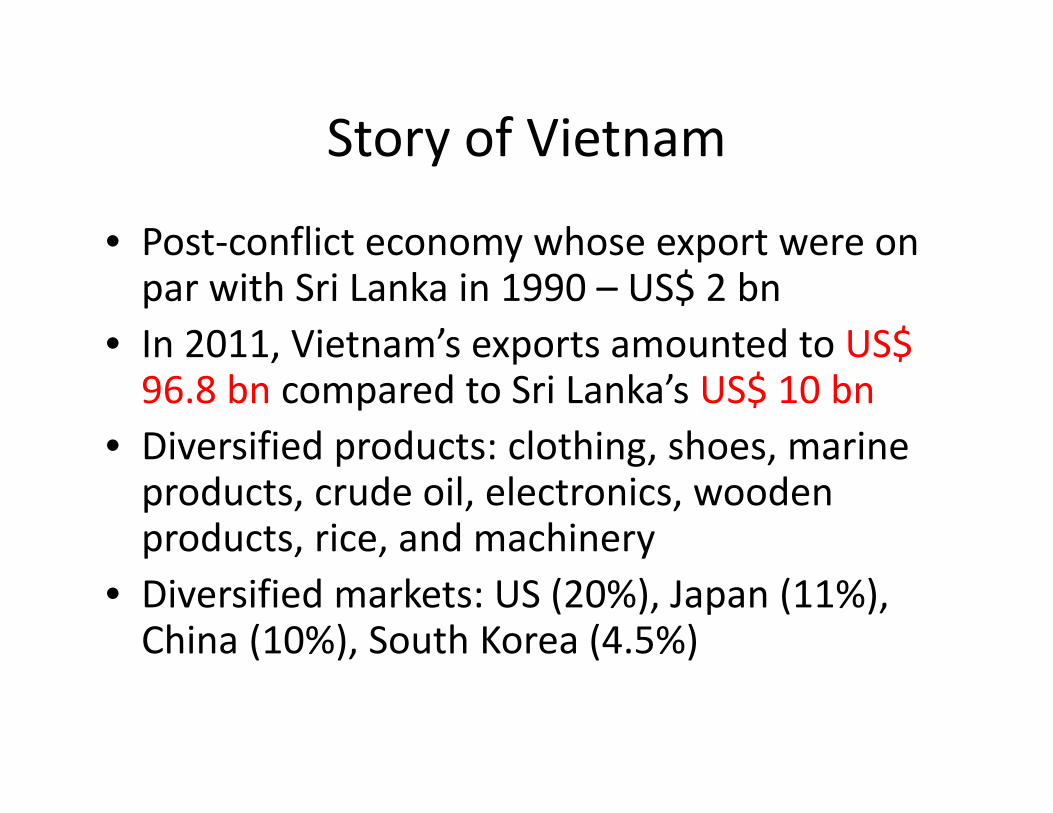
Story of VietnamStory of Vietnam
• Post‐conflict economy whose export were onPost conflict economy whose export were on par with Sri Lanka in 1990 – US$ 2 bn
• In 2011, Vietnam’s exports amounted to US$In 2011, Vietnam s exports amounted to US$ 96.8 bn compared to Sri Lanka’s US$ 10 bn
• Diversified products: clothing, shoes, marineDiversified products: clothing, shoes, marine products, crude oil, electronics, wooden products, rice, and machinery
• Diversified markets: US (20%), Japan (11%), China (10%), South Korea (4.5%)

Story of BangladeshStory of Bangladesh
• In 1990, Bangladeshi exports were US$ 1.7 bn, g p $compared to Sri Lanka at US $ 2 bn
• Bangladeshi overall exports in 2011‐2012 amounted to US$ 24 b d t S i L k t US$ 10 b i 2011US$ 24 bn compared to Sri Lanka at US$ 10 bn in 2011
• Bangladesh is the 2nd largest ready‐made garment exporter of the world (after China) and in 2011‐2012exporter of the world (after China) and in 2011 2012 amounted to US$ 19 bn (compared to Sri Lanka’s US$ 4 bn); a global leader in the low‐end RMG exports
• Bangladesh is now focusing, among other items, on ship building and pharmaceuticals and exporting them
Major Concerns of the Sri Lankan Export Sector
• Export sector is characterized by productExport sector is characterized by product concentration: ready‐made garments and a few manufactured items amount to 62% offew manufactured items amount to 62% of overall exports
• The sector is also characterized by heavy• The sector is also characterized by heavy dependence on few markets: EU and NAFTA amounting to 54% of the marketamounting to 54% of the market

Product and Market Concentration
• Heavy concentration of export markets/products:Exports by Region 2011Exports by Region, 2011
56% to the EU & NAFTA
Exports by Product, 2011
Source: EDB, 2012
62% of earnings from garments & manufactures
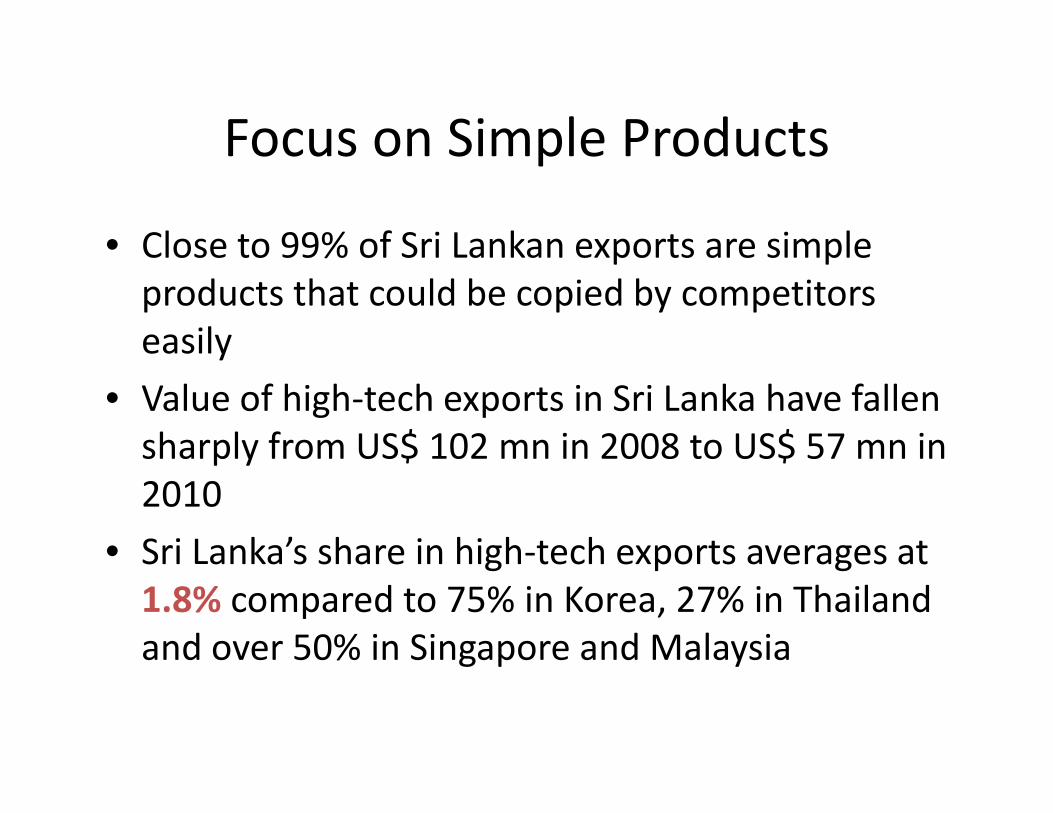
Focus on Simple ProductsFocus on Simple Products
• Close to 99% of Sri Lankan exports are simpleClose to 99% of Sri Lankan exports are simple products that could be copied by competitors easilyy
• Value of high‐tech exports in Sri Lanka have fallen sharply from US$ 102 mn in 2008 to US$ 57 mn insharply from US$ 102 mn in 2008 to US$ 57 mn in 2010
• Sri Lanka’s share in high‐tech exports averages atSri Lanka s share in high tech exports averages at 1.8% compared to 75% in Korea, 27% in Thailand and over 50% in Singapore and Malaysiag p y

Way ForwardWay Forward
• In addition to creating the conducive macroeconomic policy environment (flexible exchange rate, lower interest rates, trade facilitation, etc)
• Identify emerging new export sectors and theIdentify emerging new export sectors and the government should promote/encourage them
• Make maximum use of existing preferential and free trade agreementstrade agreements
• Increase investment in R&D by the private sector• Change from simple products to more complex g p p pproducts
• Should recognize innovations in the export sector

Emerging Sectors/Markets
Products Description Potential Markets
Light • Supplies parts & spares for machinery, Singapore, India, EU, gengineering products
pp p p y,equipment and tools
• Currently uses only 20% of its capacity
g p , , ,US, Hong Kong, Japan
Plastic products Main exports: US, SAARC region, EU, • Polyethylene bags, (door knob bags, shirt
bags and food wrap bags etc.)• Packaging products to exporting industries
such as garments, food processing &
Japan, China, UAE, Vietnam, Philippines
such as garments, food processing & jewellery exports.
Printing services
Considerable export potential in:• Print packaging materials and labels and
SAARC region, the Middle East, Russia,
tags, stationery products• Opportunities in typesetting, colour
separations, offset printing, web offset printing gravure printing carton gluing
UAE, China, Kenya, Australia
printing, gravure printing, carton gluing, screen printing

Emerging Sectors/Markets Cont.
Products Description Potential Markets
T M i t US EU I di C dToys Main exports:• Plush toys, rag dolls and animals, puzzles,
mobiles, educational toys, pull along toys, skittles, children’s furniture, wooden
US, EU, India, Canada, Australia, Hong Kong, UAE, New Zealand, Japan
boats
Wooden furniture
Export potential in:• Household furniture (bedroom & living
India, Australia, UAE, EU, New Zealand, Maldives,
room, kitchen furniture, garden furniture).
• Office furniture (computer tables, office tables etc)
US, Thailand, China
tables etc) • Commercial and institutional furniture
(furniture for hotels and schools, hospitals etc)
Source: Export Development Board, 2012. Export potential in:
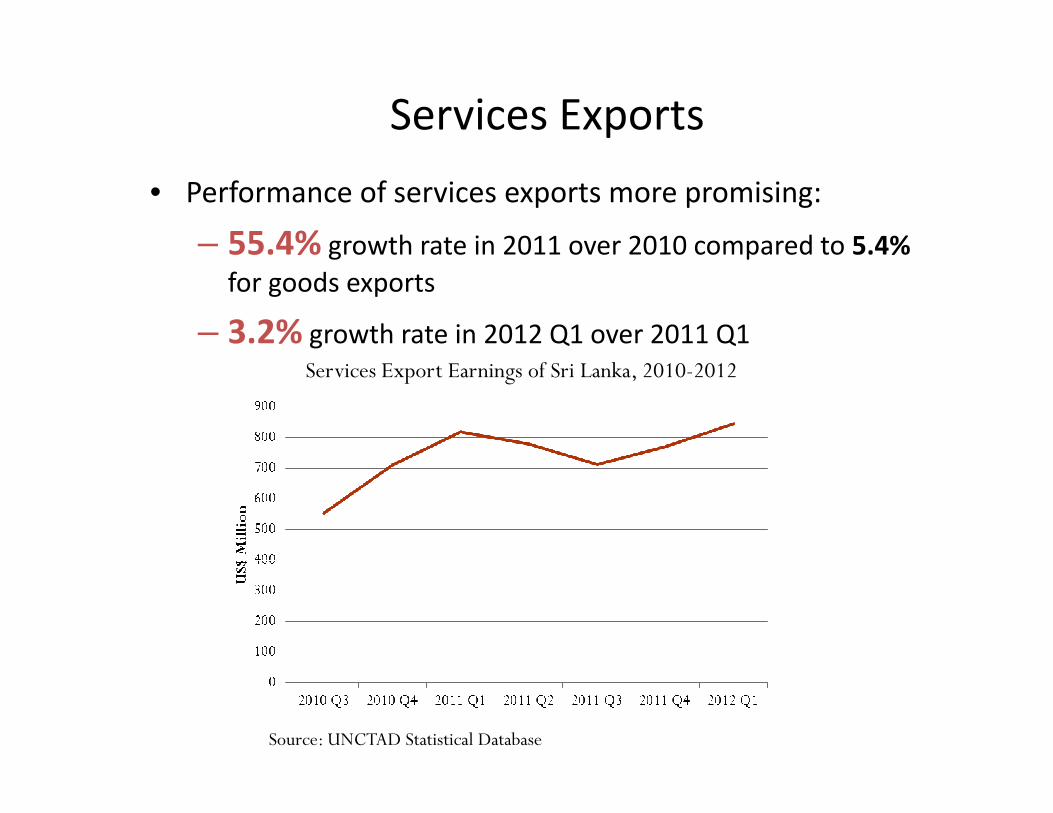
Services Exports
• Performance of services exports more promising:
– 55.4% growth rate in 2011 over 2010 compared to 5.4%55.4% growth rate in 2011 over 2010 compared to 5.4%for goods exports
– 3.2% growth rate in 2012 Q1 over 2011 Q1Services Export Earnings of Sri Lanka, 2010-2012
Source: UNCTAD Statistical Database

Emerging Sectors/Markets Cont.
• SL ranked among top 25 in A.T. Kearney’s Global Services
IT/BPO
Location Index in 2011
• 5th largest export revenue earner for the country with US$ 392 Mn in 2010Mn in 2010
• Has been resilient in the face of the global recession
• 100% value addition
• Key area: Financial & Accounting Outsourcing (FAO) – SL ranked among top 20 centres of excellence for FAO
k l d h l &• Current export markets include North America, EU, Australasia & East Asia
• Significant opportunities emerging in the Middle East – ICTSignificant opportunities emerging in the Middle East ICT sector in ME expected to grow at 8‐10% annually compared to a global average of 3%

Way ForwardWay Forward• Sri Lanka’s export share in India is 5%, Pakistan 0.7%, and China 1%. It is
time to fully exploit ISLBFTA PSLBFTA SAFTA and APTA to penetrate thesetime to fully exploit ISLBFTA, PSLBFTA, SAFTA, and APTA to penetrate these markets further
• Growing markets are in China, India, East Asia, and Middle East and they are the future markets and early mover advantage has to be gained
• How long can we move forward with low cost labour based comparative advantage ?
• There is a need to increase R&D expenditure in export firms – it is true that the overall R&D expenditure is low (0 11% of GDP) but what isthat the overall R&D expenditure is low (0.11% of GDP) but what is alarming is the private sector share in this is only 18%, where as in other successful exporting nations private sector share is above 65%
• South Korea’s Hyundai and KIA are the most fuel efficient cars today; Brazil’s Emraer is one of the leading jet manufacturers and has partnershipBrazil s Emraer is one of the leading jet manufacturers and has partnership with both Boeing and Airbus; Taiwan’s Acer and Asus are now two leading Notebook manufacturers in the world; South Korea’s Samsung Galaxy smart phones have a competitive edge over Apple i‐phones and Samsung will become the top home appliance maker by 2015 etcwill become the top home appliance maker by 2015, etc.

Way ForwardWay Forward
• These possibilities have emerged from investing in R&D p g gand focusing on innovation
• Export innovation is the way forward for Sri Lanka and it i hi h ti th t h A d S h fit is high time that we have an Awards Scheme for rewarding innovations in the export sector
• NCE already has one award for innovation, howeverNCE already has one award for innovation, however with the recent MOU signed with the NSF, NCE should consider expanding these awards to cover more sectorssectors
• Thank you• Thank you