
Exploring the usability of sound strategies for guiding task ... the usability of sound strategies...
16
Exploring the usability of sound strategies for guiding task: toward a generalization of sonification design Ga¨ etan Parseihian 1 , Charles Gondre 1 , Mitsuko Aramaki 1 , Richard Kronland Martinet 1 , and Sølvi Ystad 1 ? LMA, CNRS, UPR 7051, Aix-Marseille Univ, Centrale Marseille [email protected] Abstract. This article aims at providing a new Parameter Mapping Sonification approach in order to facilitate and generalize sonification design for different applications. First a definition of the target as a con- cept that enables a general sonification strategy that is not limited to specific data types is given. This concept intends to facilitate the sepa- ration between sound and information to display. Rather than directly displaying data dimensions through the variation of a specific sound pa- rameter, the approach aims at displaying the distance between a given data value and the requested value. Then a taxonomy of sound strategies based on sound that allow the construction of several strategy types is presented. Finally, several sound strategies are evaluated with a user ex- periment and the taxonomy is discussed on the basis of user’s guidance behavior during a guiding task. 1 Introduction Thanks to the development of research in data processing and auditory display, the use of sound in user interfaces has considerably grown over the past few decades. Employed as a means of conveying information, auditory display ex- ploits the superior ability of the human auditory system to recognize temporal changes and patterns. It has the advantage of relieving the visual system when it is overcrowded with information or busy with another task or allows to supply it when it is not available (if the user is physically visually impaired or as a result of environmental factors such as smoke). Furthermore, our ability to monitor and process multiple auditory data stream at the same time and our ability for rapid auditory detection place the auditory modality as a good candidate to supply or augment the vision. Using sound to communicate information has been called sonification. In [14], Kramer defines sonification as “the use of non-speech audio to convey informa- tion or perceptual data”. Many studies have investigated methods of conversion from data to sound depending of the type of information. From auditory icons ? This work is supported by the MetaSon Project - CONTINT 2010: ANR-10-CORD- 010 - French National Research Agency (ANR).
Transcript of Exploring the usability of sound strategies for guiding task ... the usability of sound strategies...

Exploring the usability of sound strategies forguiding task: toward a generalization of
sonification design
Gaetan Parseihian1, Charles Gondre1, Mitsuko Aramaki1, Richard KronlandMartinet1, and Sølvi Ystad1 ?
LMA, CNRS, UPR 7051, Aix-Marseille Univ, Centrale [email protected]
Abstract. This article aims at providing a new Parameter MappingSonification approach in order to facilitate and generalize sonificationdesign for different applications. First a definition of the target as a con-cept that enables a general sonification strategy that is not limited tospecific data types is given. This concept intends to facilitate the sepa-ration between sound and information to display. Rather than directlydisplaying data dimensions through the variation of a specific sound pa-rameter, the approach aims at displaying the distance between a givendata value and the requested value. Then a taxonomy of sound strategiesbased on sound that allow the construction of several strategy types ispresented. Finally, several sound strategies are evaluated with a user ex-periment and the taxonomy is discussed on the basis of user’s guidancebehavior during a guiding task.
1 Introduction
Thanks to the development of research in data processing and auditory display,the use of sound in user interfaces has considerably grown over the past fewdecades. Employed as a means of conveying information, auditory display ex-ploits the superior ability of the human auditory system to recognize temporalchanges and patterns. It has the advantage of relieving the visual system when itis overcrowded with information or busy with another task or allows to supply itwhen it is not available (if the user is physically visually impaired or as a resultof environmental factors such as smoke). Furthermore, our ability to monitorand process multiple auditory data stream at the same time and our ability forrapid auditory detection place the auditory modality as a good candidate tosupply or augment the vision.
Using sound to communicate information has been called sonification. In [14],Kramer defines sonification as “the use of non-speech audio to convey informa-tion or perceptual data”. Many studies have investigated methods of conversionfrom data to sound depending of the type of information. From auditory icons
? This work is supported by the MetaSon Project - CONTINT 2010: ANR-10-CORD-010 - French National Research Agency (ANR).

2 Parseihian et al.
and earcons that are brief sounds used to monitor events in user interfaces, toparameter mapping sonification, different sonification techniques have been de-fined. The Sonification Handbook [11] provides a good introduction to variousmethods depending on the application.
This article is based on the Parameter Mapping Sonification (PMS) approach.This method consists in representing changes in data dimension through an au-ditory variation [13,20,10]. Since its first definition, a number of softwares havebeen constructed to help the engineer to design PMS for different applications[2,4,5,6,7,12,15,17]. These softwares mostly use the basic sound parameters (fre-quency, intensity and tempo) as the principal mapping parameters applied onsound synthesis or MIDI instruments. Other parameters like right-left panning[12,5,7], timbre (proposing the choice of a MIDI instrument [12,15,7], or allowingto control the frequency shape or the brightness of the sound [2,16]), its rhythm[15] or the time gap between sounds, the consonance and the register [12,17] arealso frequently encountered.
For instance, in [21], Walker and Kramer explored the influence of the soundparameter choice and the effect of the mapping polarity on a task of generic pro-cess control in a widget factory. In this study, the authors monitored four datatypes from the fictitious factory (temperature, pressure, size and rate) with dif-ferent auditory dimensions (loudness, pitch, tempo and onset time) while chang-ing mapping strategies and polarity for each experimental group. By measuringresponse time and precision, they showed a strong influence of the mappingstrategies and the mapping polarity: some data types are best represented bya particular display dimension with a specific polarity (loudness is, for examplethe best dimension to represent temperature and tempo is not necessarily thebest choice to represent the rate).
Since its first conceptualization by [14], many works have studied PMS forspecific data dimensions (pressure, size, temperature, number of dollars, urgency,danger, ...). Since they require awareness of the user’s expectations, the resultsof these studies are quasi impossible to generalize for the design of other ap-plications. In practice, the PMS softwares usually allow the designer to choosedifferent mapping strategies for the sonification of several multidimensional datatypes, but none intend to help the designer on the choice of the sound strate-gies, the optimal polarity for these mappings and the scaling of the parameters.In addition, the scaling function between display dimension and data changealso appears to be an important part of the design. However, it is difficult tofind information about it in sonification literature. Few studies aim at exploringits influence on the mapping efficiency [18,19] and most of the works doesn’tmention the range values of the studied display parameters. To face this prob-lem, Grond and Berger [10] purpose to establish this function while taking intoaccount the perception of each sounds parameter, their Just Noticeable Differ-ence (JND) and the masking threshold, and Ferguson et al. [9] suggest to usepsychoacoustic models for the sonification. They introduce the psychoacousticdefinition of the pitch, the loudness, the roughness and the brightness and pro-pose a theoretical implementation of these parameters. If the perception of some

Sonification strategies for guiding task 3
of these parameters is well known (the JND of the pitch and the loudness havebeen defined several years ago), it is difficult to find a consensus for the JNDperception of the roughness and the brightness.
The present article aims at generalizing PMS strategies for guiding tasks byidentifying perceptual cues that are optimally efficient for precise or rapid guid-ance. It first introduces the notion of “target” and define a normalized distancebetween a given data value and the requested data value. This notion allow todisconnect the sonification from the application and the type of data to display.It proposes then a taxonomy based on fundamental sound attributes of soundperception used for the PMS (pitch, loudness, tempo and “timbre”). Finally, itpresents the results of the perceptual experiment guidance task with respect tothese PMS strategies.
The obtained results would bring relevant information for the prediction ofthe user’s behavior with a chosen sonification and constitute a first step towardgeneral guidelines for mapping data onto display dimensions.
2 The concept of “target”
In several applications, the sound is used as a dynamic status and progressindicator in order to guide or inform the user on the evolution of a dynamicsystem. In such tasks, instead of directly monitoring the state of the system’sparameter, it is possible to define a distance between the current and a desiredstate. The information that sonification needs to convey corresponds to one (orseveral) particular system’s state(s) or to one point in an n-dimensional space inwhich the user (or any process) is evolving. These states, that may change overtime, are defined as “targets”.
In a driving aid application, for example, the target can represent the optimalspeed for the road section on which the user is located. The system will then giveinformation on the speed difference to be applied to the car to reach the optimalspeed. The display information will be the distance between the current valueand the target (e.g. the distance between the current speed and the optimalspeed).
This concept of “target” allows to treat a number of specific application caseswith a general sonification design. It is then possible to avoid the commonlyencountered problem of the mapping of information to the display parameters(such as: “frequency is better to represent temperature than loudness”) andto characterize different types of sonification strategies affected by the soundparameters (pitch, loudness, tempo, ...). This concept of “target” is, however,specific to inform or guide the user about a particular state and is difficult toapply to the simple monitoring of several state cases.
The aims of the sonification when guiding a user toward a target can bemultiple:
– to guide as precisely as possible,– to guide as quickly a possible,

4 Parseihian et al.
– to guide without passing the target.
These guidance behaviors should be directly affected by the sound design choiceas some acoustic properties may mainly affect the speed, and others the precision.To take into account these guidance behaviors, a taxonomy of sound strategies,based on sound morphology, is proposed in the next section.
3 Sound strategies
As mentioned in the introduction, several sound parameter may be used to con-vey data information. The use of the “target” notion allows the use of any ofthese parameters independently of a meaningful correlation of auditory dimen-sions and display dimensions. It is then possible to use any sound parameter torepresent any display dimension but, in addition to the aesthetic problem, allparameters will not lead to the same level of information which may affect theguidance task in both precision and time. In order to characterize the ability ofthe sound parameters to convey information and guide the user, it is importantto classify them.
This section aims at defining a taxonomy of sound strategies for sonification.It begins with the definition of this taxonomy then, after some considerationsabout the general approach, presents the different sound strategies designed ineach category and tested in the experiment.
3.1 Towards a taxonomy of sound strategies
The proposed taxonomy is based on the definition of three morphological cate-gories:
– Basic strategies: These strategies are based on the variation of basic per-ceptual sound attributes such as pitch, loudness, tempo or brightness. Thesound attribute is directly a function of the distance to the target. Twopolarities may be chosen (the attribute is maximum on the target or theattribute is minimum on the target). Furthermore, these strategies are con-strained by human perceptual limits and the maximum reachable precisionwill be defined by the just noticeable difference of the attribute.
– Strategies with reference: The idea here is to include a sound reference cor-responding to the target. Using this reference, the user should be able (bycomparing the varying parameter to the reference) to evaluate the distanceto the target without exploring the strategy. In the pitch case, adding a ref-erence tone will produce modulation strength (if the frequencies are close)near the target and a continuous sound on the target. The same conceptcan be applied to the loudness using the concept of emergency of a maskedsound or to the tempo with desynchronized rhythms. It is also possible touse an implicit perceptual reference such as the inharmonicity (the sound isharmonic only on the target) or the roughness (there is no roughness on thetarget).
Sonification strategies for guiding task 5
– Strategies with reference and “zoom effect”: In order to increase the pre-cision around the target and to reduce the target’s identification time, itis possible to augment the “strategies with reference” concept by adding a“zoom effect”. This zoom consists in duplicating the strategy in differentfrequency bands. For example, in the case of the pitch with reference, ratherthan constructing the strategy with a pure tone, the use of a harmonic soundwith several frequencies will create different modulations within different fre-quencies.
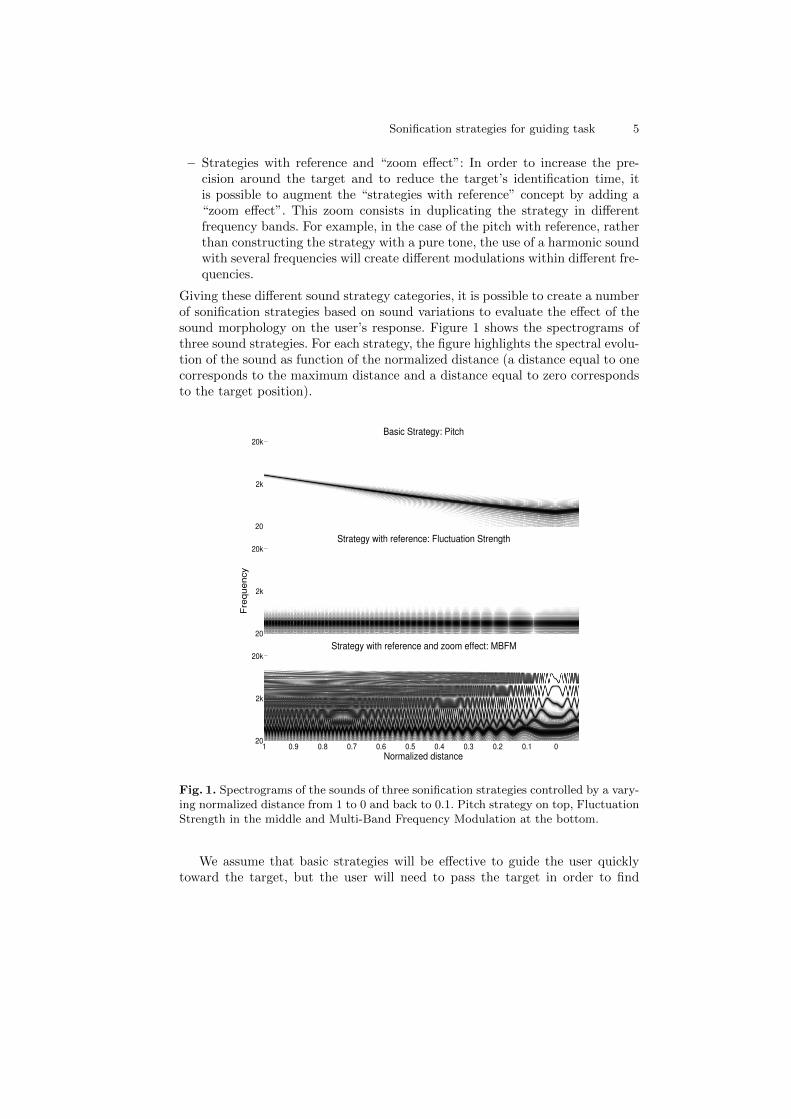
Giving these different sound strategy categories, it is possible to create a numberof sonification strategies based on sound variations to evaluate the effect of thesound morphology on the user’s response. Figure 1 shows the spectrograms ofthree sound strategies. For each strategy, the figure highlights the spectral evolu-tion of the sound as function of the normalized distance (a distance equal to onecorresponds to the maximum distance and a distance equal to zero correspondsto the target position).
20
2k
20k
Basic Strategy: Pitch
20
2k
20k
Strategy with reference: Fluctuation Strength
1 0.9 0.8 0.7 0.6 0.5 0.4 0.3 0.2 0.1 020
2k
20k
Strategy with reference and zoom effect: MBFM
Normalized distance
Fre
quency
Fig. 1. Spectrograms of the sounds of three sonification strategies controlled by a vary-ing normalized distance from 1 to 0 and back to 0.1. Pitch strategy on top, FluctuationStrength in the middle and Multi-Band Frequency Modulation at the bottom.
We assume that basic strategies will be effective to guide the user quicklytoward the target, but the user will need to pass the target in order to find

6 Parseihian et al.
the inflection point of the sound attribute (as the user is not familiar with thesound corresponding to the target beforehand). Strategies with reference shouldgive higher precision than basic strategies but might take more time (the closerthe target, the longer the time to perceive sound differences). Strategies withreference and zoom effect should give faster results and better precision thanstrategies with reference since high frequency components induce more rapidbeats.
3.2 Designing of the sound strategies
In [18], Walker pointed out at least three design choices for the mapping sonifi-cation issue.
First, he highlighted the importance of the sound parameter choice to repre-sent a given data dimension (e.g. pitch, loudness, tempo or timbre). Using the“target” concept, the mapping parameter choice is no longer important as thesound dimension is related to a normalized distance and not to a specific datadimension.
Second, according to Walker, designers must choose an appropriate polar-ity for the data-to-display mappings. Previous studies highlighted preferencesfor one or the other polarities for a particular application depending of theusers’ mental model. With the taxonomy introduced above this issue seems tobe important for basic parameter strategies (such as pitch, loudness, tempo orbrightness) but out of interest for strategies with references and strategies withreference and zoom effect. Furthermore, with the concept of target (which isnot related to a specific data type), the notion of positive or negative polarityis difficult to establish and both polarities can be chosen. Considering that thisproblem is principally due to the user’s perceptual association between data andsound dimension, we will not consider the potential influence of the mappingpolarity of basic parameter strategies in this article.
The third design choice corresponds to the effect of the data dimension on thedisplay dimension (how much change in sound parameter is needed to conveya given change in the data dimension?). For this scaling, the designer mustchoose a mapping function (linear, exponential, etc.) and a range of values. Themapping functions for this article were chosen to have the same precision of thesound parameter everywhere (perceptually linear). Defining a range of values foreach sound parameter is still problematic as there is no definition of the JustNoticeable Difference for each sound parameter used in this study (apart frombasic strategies). Aware that this choice may affect the results, we tried for eachsound parameter to define the range of values that we believed was the mostefficient.
On the basis of the proposed taxonomy, nine sound strategies were createdwhile taking into account these design choices. These strategies are describedbelow and sound examples resulting from these strategies controlled by a varyingnormalized distance from 1 to 0 and back to 0.5 are available online 1.
1 http://www.lma.cnrs-mrs.fr/~kronland/SonificationStrategies/

Sonification strategies for guiding task 7
Basic strategies
Pitch This strategy is based on frequency perception of sounds. It is constructedwith a sinusoid with a varying frequency depending on the normalized distancebetween the user and the target:
s(t) = cos (2πf(x)t)
with x ∈ [0, 1], the normalized distance between the user and the target.Several scaling functions f(x) can be considered (linear, logarithm, exponential,etc.). As human perception of frequency is logarithmic, we used the followingfunction (weighted by the isophonic curve from the ISO 226 norm [1] to varyindependently from the loudness) :
f(x) = fmin.2x.noct
with noct = ln fmax
fmin× 1
ln 2 the number of octaves covered by the strategy andfmin and fmax the extreme values of the frequency.
The pitch polarity refers to the direction of pitch change as the user ap-proaches the target:
– the frequency is minimal on the target ;– the frequency is maximal on the target.
For this experiment, the polarity was chosen so that the frequency was minimalon the target. While the frequency perception limit is often quoted at 20 –20000 Hz for young healthy listeners, the range of the scaling function was setto the frequencies corresponding to the traditional phone bandwidth (300 –3400 Hz): fmin = 300Hz and fmax = 3394Hz, hence spanning over 3.5 octaves.
Loudness This strategy is based on loudness perception of sounds. It is con-structed with a sinusoid with a varying amplitude A depending on the normal-ized distance x between the user and the target:
s(t) = A(x). cos (2πf0t)
As human perception of loudness is exponential, A(x) is:
A(x) = 10[(logAmax−logAmin).x+logAmin]
For consumer applications (on mobile phone, for example), the maximal avail-able level dynamic is around 40 dB. For the experiment, the polarity was chosenso that the loudness was minimal on the target: amin = −40dB and amax = 0dBso that Amin = 10−
amin20 = 0.01 and Amax = 1.
Tempo This strategy is based on temporal perception of sounds. It is similar tothe famous Geiger counter, often used as a sonification metaphor. This metaphorconsists in repeating a stimulus and varying repetition rate. Thus the closer thetarget, the faster the sound repetition.
The sound stimulus used is a pulse tone of f0 = 1000 Hz and T = 0.1 sec.The repetition rate is 20 Hz (1200 bpm) on the target and 2 Hz (120 bpm) forthe maximum normalized distance x = 1.

8 Parseihian et al.
Brightness This strategy is based on brightness perception of sounds. The bright-ness is considered to be one of the strongest perceptual attribute of the timbre ofa sound. It corresponds to an indication of the amount of high-frequencies con-tent in a sound, and is defined by the spectral centroid [3]. Brightness variationsare obtained with a second order lowpass filtered white noise with a logarithmicdistance dependent cutoff frequency Fc:
Fc(x) = fmin.2x.noct
with noct = ln fmax
fmin× 1
ln 2 the number of octaves covered by the strategy andfmin and fmax the extreme frequency values.
As for the pitch strategy, the range of the scaling function was set to fre-quencies corresponding to the traditional phone bandwidth (300 – 3400 Hz):fmin = 300Hz and fmax = 3394Hz to cross 3.5 octave.
Strategies with reference
Fluctuation Strength This strategy is an extension of the pitch strategy. It usesa fixed tone as a reference for the target and a varying tone to inform about thenormalized distance of the target. The first tone is a sinusoid with a frequencyof f0 = X Hz (which is the reference), the second is a sinusoid with a frequencyvarying from f0 + 10 Hz to f0:
s(t) = 0.5 ∗ cos(2πf0t) + 0.5 ∗ cos(2π(f0 + 10x)t)
The result is an amplitude modulation with a frequency equal to the differencebetween the two tones [8]. When the normalized distance x equal one, there are10 modulations per second. When the target is reached, no more beats are heard.
Synchronicity This strategy is an extension of the tempo strategy. Two pulsetones are repeated. The first is the reference, the second is shifted with a varyingtime ∆t depending on the distance between the user and the target. When thedistance is maximum (x = 1), the second pulse is shifted by 1/4 of the pulsationfrequency. When the target is reached, the two pulses are synchronized.
Inharmonicity This strategy is based on inharmonicity perception of sounds. Ituses an implicit perceptual reference: the harmonic sound. It is constructed witha sum of sinusoids whose fundamental frequency is f0 = 200 Hz and with higherfrequencies computed with the piano’ inharmonicity formula [22]:
s(t) = cos(2πf0t) +
N+1∑k=2
cos(2πfk
√1 + b(x)
f2kf20t)
with fk = kf0, and b(x) the inharmonicity factor: b(x) = x100 , that varies be-
tween 0 and 0.01.

Sonification strategies for guiding task 9
Strategies with reference and zoom effect
Multi-Band Frequency Modulation (MBFM) This strategy is based on the fre-quency modulation of a harmonic sound (a sum of sinusoids with frequenciesequal to integer multiples of a fundamental frequency). Instead of a conven-tional frequency modulation, each partial is here frequency modulated by a dif-ferent modulating frequency : the higher the partial frequency, the higher thefrequency of the modulating signal. When the user is getting closer to the target,the modulating frequencies decrease (there is no modulation when the target isreached). The farther the target, the higher the modulating frequency and themore complex the sound:
s(t) =
N∑k=1
sin(2πfkt+ Ik.sin(2πfm(x)t))
with fk the frequency of the kth harmonic, I the modulation index, and fm(x) =10x, the modulation frequency.
The use of a harmonic sound allows to construct an “auditory zoom”. Theconcept is simple: the frequency modulation affects all the harmonics with dif-ferent temporalities. For a fixed distance, the higher the frequency, the fasterthe modulation. Near the target, the modulation frequency of the first harmonicis too small to rapidly grasp the target, but the modulation from the secondharmonic which is twice as fast and then from the third harmonic (three timesfaster) allow to find the target faster and with more precision.
Multi Scale Beating (MSB) This strategy is based on the same concept as theMBFM strategy. It uses a sound of N harmonics M times duplicated and trans-posed by a few hertz with a factor that depends on the target distance. On thetarget the transposition factor is zero. The farther the target, the higher thetransposition factor and the more complex the sound:
s(t) =
N∑k=1
M∑m=0
Ak cos(2πfk(1 +m(α(x)− 1))t)
with α(x) ∈ [0.94, 1.06] characterizing transposition factors. On the target (α(0) =1) m(α − 1) is equal to zero and different when moving away from the target.This creates a spectrum of M versions of N harmonics transposed by factorsm(α−1). It results in an “auditory zoom” due to the use of the harmonic soundand to the transposition factors that depend on the harmonic order.
4 Method
The first aim of the experiment was to evaluate the strategies’ capacity to dy-namically guide a user toward a target in a one dimensional space with onepolarity. Then the aim was to quantitatively assess the potential behavioural

10 Parseihian et al.
differences in the grasping induced by the different strategy’ categories. The ex-periment was based on a within-subject design with a simple hand guidance taskon a pen tablet.
4.1 Subjects
A total of 28 subjects participated in the experiment (8 women and 20 men).Mean age: 33 ± 12 years (min. 21; max. 58 years); 21 subjects were consideredas experts (musicians or people working in the audio field), 7 were non-experts.All were naive regarding the purpose of the experiment. No audiogram wasperformed, but none of the subjects reported hearing losses.
4.2 Stimuli and Apparatus
The subjects were equipped with a stereo closed-ear headphone (model SennheiserHD280). They were placed in a quiet room, in front of a pen tablet with a 24”screen display (model Wacom Cintiq 24HD). The experimental session was runusing a Max/MSP interface running on an Apple computer. The stimuli weresynthesized in real-time with the nine strategies defined in section 3.2 as functionof the normalized distance between the pen and the target.
4.3 Procedure
The nine sonification strategies were evaluated with a guiding task on eightdistances (10, 12.5, 15, 17.5, 20, 22.5, 25, and 27.5 cm with a maximum distanceto the target of 30 cm, that gives normalized distances of: 0.33, 0.47, 0.5, 0.58,0.67, 0.75, 0.83, and 0.92). The experiment was divided in nine blocs of ninetrials, each bloc containing the nine strategies in a random order. Participantswere told to find, for each trial, a hidden target randomly placed on a line.They were not given any explanation about each sound strategy, and were justinstructed that the real-time sound transformations would inform them aboutthe distance between the pen and the hidden target. The first bloc was consideredas a training bloc and the subjects were free to explore the sound transformationswithout instruction. After this training, they were instructed to find the targetas quickly, as accurately, and as directly as possible without removing the penfrom the tablet. In each trial, subjects first were to place the pen on a startingposition (on the left side of the screen). Then, they started the trial by pushingthe space bar of a keyboard and moving on a visual line to find the position of thehidden target. Finally, when the target was identified, the subjects validated theestimated position of the target with the space bar of the keyboard to proceedto the next trial. The order of the trial presentation was calculated so that astrategy never appeared twice in a row and a distance never appeared threetimes in a row. The order and the starting position were randomized to avoidany potential learning effect and to exclude any possible visual aid on the screen.No accuracy feedback was provided after each trial.

Sonification strategies for guiding task 11
5 Results
Figure 2 shows typical trajectories collected on several subjects during a trial.The analysis of these trajectories highlights different subject’s behaviors to findthe target. First, the total duration of the task performance was spread betweena few seconds to 40 sec. The subjects were able to find the target directly insome cases (figure 2 at top left) or with a lot of direction changes in other cases(figure 2 at top right). Finally the error can vary from less than 1 cm to morethan 15 cm (figure 2 at bottom right).
Time (sec)
No
rma
lize
d d
ista
nce
0 1 2 3 4
−0.2
0
0.2
0.4
0.6
0.8
0 5 10 15 20 25
−0.2
0
0.2
0.4
0.6
0.8
0 3 6 9 12
−0.2
0
0.2
0.4
0.6
0.8
0 6 12 18 24 30
−0.2
0
0.2
0.4
0.6
0.8
Fig. 2. Different examples of distance evolution to find the hidden target.
Although it would be interesting to analyse and classify these trajectorytypes regarding the subjects and the sound strategies, this article analysed theeffect of each strategy on the guiding task only by comparing the final precision,the total time, and the number of oscillations needed to find the target. Theanalysis was performed by separating expert (musician or people working onaudio processing) and non-expert subjects.
5.1 Precision
The final precision corresponds to the distance between the pen and the targetwhen the subject validated the trial. The mean value of the final precision withthe 95 % confident interval is represented in figure 3 for non expert (top) andexpert subjects (bottom). There is a large difference between these two groups.The mean value of final precision for the non-expert group is 4.58 ± 2.88 %while it is 1.04 ± 0.75 % for the expert group. The final precision as functionof the strategy highlights a strong effect of the strategy. The bests strategiesfor the non expert group are the Tempo and the Inharmonicity while the worst

12 Parseihian et al.
Pitch Loudness Tempo Bright. FS Synchro. Inharmo. MBFM MSB0
0.01
0.02
0.03
0.04
0.05
0.06
0.07
0.08
0.09
0.1
Strategy
Fin
al E
rro
r
Non Expert
Expert
Fig. 3. Mean and 95 % confident interval of the final precision for non expert (top)and expert (bottom) subjects as function of the sound strategy.
are the Loudness and the Synchronicity. For the expert group, the best resultsare obtained with the reference and zoom effect strategies (the MBFM andthe MSB) and the worst are obtained with the Loudness and the Brightnessstrategies. For the expert group, the results for the three strategies with referenceare similar and the results for the two strategies with reference and loop areequal. The results for simple parameter strategies show large differences betweenPitch and Tempo in one part and Loudness and Brightness in another part. Thiscan be explained by the perceptual resolution of these parameters that is highfor pitch and tempo perception and low for loudness and brightness perception.
5.2 Time
The mean of total time spent for all the experiment is 30± 10 min The mean oftotal time spent in each trial with the 95 % confident interval is represented infigure 4 for non expert (square) and expert subjects (circles). The mean responsetime for one trial is 11.2 ± 3.2 sec for the non expert group and 12.9 ± 2.6 secfor the expert group. If the expert subjects spend more time on each trial, thesmaller standard deviation shows more consistency across all the trials.
If the results tend to show the same tendencies for both groups, the meantime spent on Tempo and MBFM strategies is significantly shorter for the nonexpert group. Despite a strong effect of the strategy on the mean response time,it is difficult to find an effect of the morphological category types. A shorter

Sonification strategies for guiding task 13
Pitch Loudness Tempo Bright. FS Synchro. Inharmo. MBFM MSB6
8
10
12
14
16
18
Strategy
To
tal T
ime
(se
c)
Non Expert
Expert
Fig. 4. Mean and 95 % confident interval of the total time for one trial for non expert(top) and expert (bottom) subjects as function of the sound strategy.
response time was expected for simple parameter strategies, while it turns outthat this is only true for the Pitch strategy for the experts and for the Pitchand Tempo strategies for the non experts. As expected, the two groups spentmost time on strategies with references (Fluctuation Strength and Synchronicity)because of the sound morphology of these strategies.
5.3 Number of oscillations
The number of oscillations around the target corresponds to the number ofdirection changes around the target. On the examples of figure 2, the numberof oscillations is 0 for the first example (top-left), 24 for the second (top-right),4 for the third (bottom-left) and 5 for the fourth (bottom-right). Regardingthese examples, it seems clear that these oscillations don’t represent the samepointing behavior for each trial. For the second trial, the oscillations are close tothe target and allow the subject to refine the perceived position. For the fourthtrial, the oscillations have large amplitudes and no convergence tendency, whichhighlights a lack of strategy understanding.
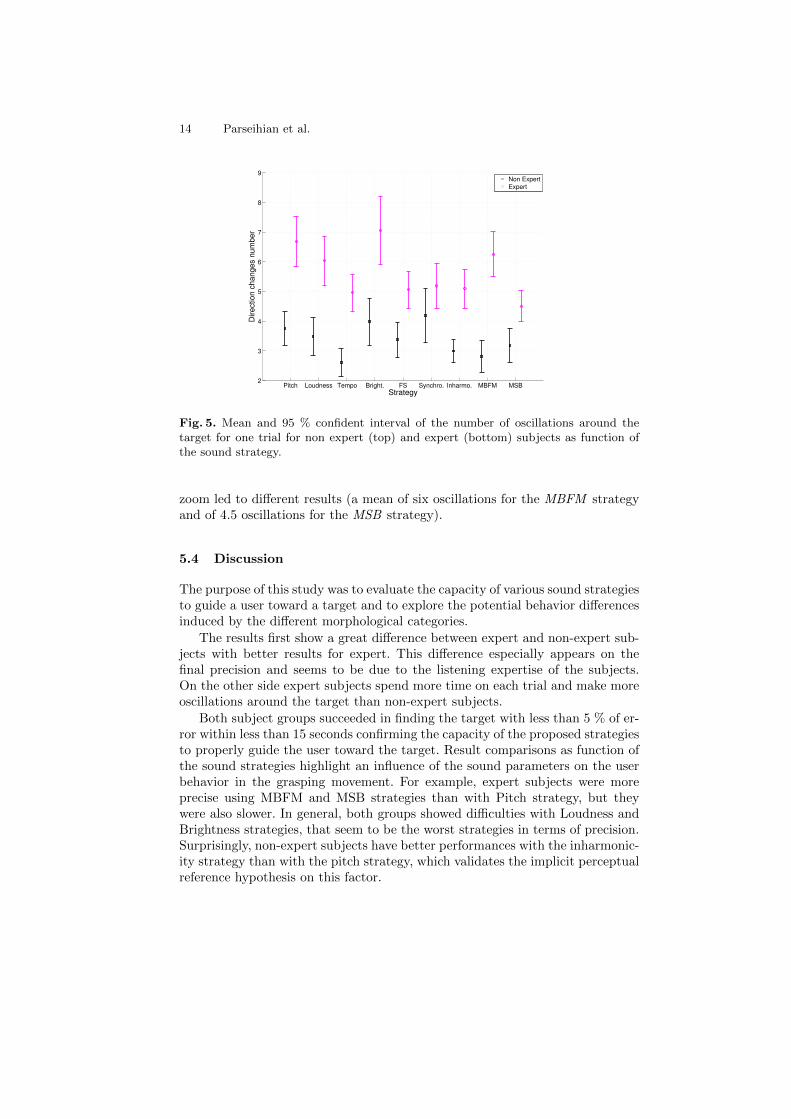
The mean number of oscillations for each trial with the 95 % confident inter-val is represented in figure 5 for non expert (square) and expert subjects (circles).Expert subjects made more oscillations around the target than non expert sub-jects (6.3±2.0 vs. 3.6±1.5). Except for the Tempo, the expert group made moreoscillations (between six and seven) for the basic parameter strategies than forthe other groups of strategies. The strategies with reference parameters led to thesame number of oscillations (e.g. five) and the two strategies with reference and
14 Parseihian et al.
Pitch Loudness Tempo Bright. FS Synchro. Inharmo. MBFM MSB2
3
4
5
6
7
8
9
Strategy
Dire
ctio
n c
ha
ng
es n
um
be
r
Non Expert
Expert
Fig. 5. Mean and 95 % confident interval of the number of oscillations around thetarget for one trial for non expert (top) and expert (bottom) subjects as function ofthe sound strategy.
zoom led to different results (a mean of six oscillations for the MBFM strategyand of 4.5 oscillations for the MSB strategy).
5.4 Discussion
The purpose of this study was to evaluate the capacity of various sound strategiesto guide a user toward a target and to explore the potential behavior differencesinduced by the different morphological categories.
The results first show a great difference between expert and non-expert sub-jects with better results for expert. This difference especially appears on thefinal precision and seems to be due to the listening expertise of the subjects.On the other side expert subjects spend more time on each trial and make moreoscillations around the target than non-expert subjects.
Both subject groups succeeded in finding the target with less than 5 % of er-ror within less than 15 seconds confirming the capacity of the proposed strategiesto properly guide the user toward the target. Result comparisons as function ofthe sound strategies highlight an influence of the sound parameters on the userbehavior in the grasping movement. For example, expert subjects were moreprecise using MBFM and MSB strategies than with Pitch strategy, but theywere also slower. In general, both groups showed difficulties with Loudness andBrightness strategies, that seem to be the worst strategies in terms of precision.Surprisingly, non-expert subjects have better performances with the inharmonic-ity strategy than with the pitch strategy, which validates the implicit perceptualreference hypothesis on this factor.

Sonification strategies for guiding task 15
The search for similarities within each strategy category (basic, with referenceand with reference and zoom effect) has so far been unsuccessful with respect tothe final precision, the total time and the number of oscillations around the tar-get. For example, in basic strategies, pitch and tempo led to significantly betterresults than loudness and brightness strategies. It therefore seems necessary toapply a more complex analysis than in the present paper to evaluate each soundstrategy.
6 Conclusions
In the current study, a new parameter mapping sonification design approach wasintroduced. This approach is first based on the definition of a “target” conceptwhich aim is to facilitate the separation between the informative sound strategyand the information to display. This separation allows to evaluate given soundstrategies independently from the application and to predict the sonification re-sult for any type of guiding task. We expect that the use of a normalized distanceto the target allows to use different strategy types for the same data type. Inthis article, a taxonomy of sound strategies based on sound morphology wasproposed. The aim of this taxonomy was to predict the user’s guidance behaviorwith the use of several sound strategies. An experiment based on a guidance taskwas realized in order to evaluate the user’s guidance behavior. The results high-lighted great differences between expert and non expert users and showed theinfluence of the sound strategies on the guidance behaviors. While some soundstrategies allow to quickly guide the user towards the targets other strategiesmay allow a better precision or guide more directly to the target. Nevertheless,a simple result analysis does not allow to link the guidance behaviors to the threedefined morphological categories. Therefore, it would be interesting to analyzethe guidance behaviors with a more complex analysis of the grasping movementtoward the targets.
This study only focused on the user evaluation of morphological categories.Therefore it is not possible to conclude on the efficiency of the “target” conceptin parameter mapping sonification. It would be interesting to test this conceptwith an experiment based on the sonification of different applications so as toverify the stability of the guidance behavior toward different types of normalizeddistances.
References
1. Normal equal-loudness level contours - ISO 226. Acoustics International Organi-zation for Standardization, 2003.
2. S. Barrass. Personify: A toolkit for perceptually meaningful sonification. In ACMA,1995.
3. J. W. Beauchamp. Synthesis by spectral amplitude and” brightness” matchingof analyzed musical instrument tones. Journal of the Audio Engineering Society,30(6):396–406, 1982.

16 Parseihian et al.
4. O. Ben-Tal, J. Berger, B. Cook, M. Daniels, G. Scavone, and P. Cook. Sonart: Thesonification application research toolbox. In Proceedings of the 8th InternationalConference on Auditory Display, Kyoto, Japan, 2002.
5. J. W. Bruce and N. T. Palmer. Sift: Sonification integrable flexible toolkit. InProceedings of the 11th International Conference on Auditory Display, Limerick,Ireland, 2005.
6. R. M. Candey, A. M. Schertenleib, and W. L. Diaz Merced. xsonify: Sonificationtool for space physics. In Proceedings of the 12th International Conference onAuditory Display, London, UK, 2006.
7. B. K. Davison and B. N. Walker. Sonification sandbox reconstruction: Softwarestandard for auditory graphs. In Proceedings of the 13th International Conferenceon Auditory Display, Montreal, Canada, 2007.
8. H. Fastl and E. Zwicker. Psychoacoustics: Facts and Models. Springer-Verlag NewYork, Inc., Secaucus, NJ, USA, 2006.
9. S. Ferguson, D. Cabrera, K. Beilharz, and H.-J. Song. Using psychoacoustical mod-els for information sonification. In Proceedings of the 12th International Conferenceon Auditory Display, London, UK, 2006.
10. F. Grond and J. Berger. Parameter mapping sonification. In T. Hermann, A. Hunt,and J. G. Neuhoff, editors, The Sonification Handbook. Logos Publishing House,2011.
11. T. Hermann, A. Hunt, and J. Neuhoff, editors. The Sonification Handbook. LogosPublishing House, Berlin, Germany, 2011.
12. A. J. Joseph and S. K. Lodha. Musart: Musical audio transfer function real-timetoolkit. In Proceedings of the 8th International Conference on Auditory Display,Kyoto, Japan, 2002.
13. G. Kramer. Some organizing principles for representing data with sound. AddisonWesley Longman, 1992.
14. G. Kramer. Auditory Display: Sonification, Audification and Auditory Interfaces.Perseus Publishing, 1993.
15. S. K. Lodha, J. Beahan, T. Heppe, A. Joseph, and B. Zane-Ulman. Muse: A musicaldata sonification toolkit. In Proceedings of the 4th International Conference onAuditory Display, Palo Alto, California, 1997.
16. S. Pauletto and A. Hunt. A toolkit for interactive sonification. In Proceedings ofthe 10th International Conference on Auditory Display, Sidney, Australia, 2004.
17. A. M. Schertenleib. xsonify, 2005.18. B. N. Walker. Magnitude estimation of conceptual data dimensions for use in
sonification. J. of Experimental Psychology Applied, 8(4):211–221, 2002.19. B. N. Walker. Consistency of magnitude estimations with conceptual data dimen-
sions used for sonification. Applied Cognitive Psychology, 21(5):579–599, 2007.20. B. N. Walker and G. Kramer. Mappings and metaphors in auditory displays: An
experimental assessment. In Proceedings of the 3rd International Conference onAuditory Display, Palo Alto, California, 1996.
21. B. N. Walker and G. Kramer. Mappings and metaphors in auditory displays: Anexperimental assessment. ACM Transactions on Applied Perception, 2(4):407–412,October 2005.
22. R. W. Young. Inharmonicity of plain wire piano strings. Journal of the AcousticalSociety of America, 24(3):267–273, May 1952.