EXPLORING SAN FRANCISCO’S TREASURES: … 18 Basemap Services ... GPS Global Positioning System...
137
i EXPLORING SAN FRANCISCO’S TREASURES: MASHING UP PUBLIC ART, SOCIAL MEDIA, AND VOLUNTEERED GEOGRAPHIC INFORMATION TO CREATE A DYNAMIC GUIDE by Nancy Elizabeth Milholland A Thesis Presented to the FACULTY OF THE USC GRADUATE SCHOOL UNIVERSITY OF SOUTHERN CALIFORNIA In Partial Fulfillment of the Requirements for the Degree MASTER OF SCIENCE (GEOGRAPHIC INFORMATION SCIENCE AND TECHNOLOGY) May 2014 Copyright 2014 Nancy Elizabeth Milholland
Transcript of EXPLORING SAN FRANCISCO’S TREASURES: … 18 Basemap Services ... GPS Global Positioning System...

i
EXPLORING SAN FRANCISCO’S TREASURES:
MASHING UP PUBLIC ART, SOCIAL MEDIA, AND VOLUNTEERED GEOGRAPHIC INFORMATION TO CREATE A DYNAMIC GUIDE
by
Nancy Elizabeth Milholland
A Thesis Presented to the FACULTY OF THE USC GRADUATE SCHOOL UNIVERSITY OF SOUTHERN CALIFORNIA
In Partial Fulfillment of the Requirements for the Degree
MASTER OF SCIENCE (GEOGRAPHIC INFORMATION SCIENCE AND TECHNOLOGY)
May 2014
Copyright 2014 Nancy Elizabeth Milholland

ii
Acknowledgements
I wish to thank my committee chair, Edward Pultar and committee members Karen Kemp and
Jennifer Swift for their feedback and support in writing this thesis.
Mono Simeone and Rick Kos of the GIS Education Center for introduced me to GIS
through a variety of short courses. They enthusiastically supported my interest in GIS. Mono also
provided infrastructure for me to keep my application running post graduation.
Susan Sutton, my spouse, created legend graphics for different art types. She helped specify
requirements for building metadata. Most of all, she supported and encouraged my pursuit of a
degree in spatial science.
Some material in this thesis is based on the following:
Milholland, N. and E. Pultar. 2013. . The San Francisco Public Art Map Application: Using
VGI and Social Media to Complement Institutional Data Sources. In MAPINTERACT '13.
Orlando, USA: ACM.

iii
Table of Contents Acknowledgements .................................................................................................................. ii
List of Tables ........................................................................................................................... vi
List of Figures ......................................................................................................................... vii
List of Abbreviations ............................................................................................................. viii
Abstract ..................................................................................................................................... x
Chapter 1: Introduction ......................................................................................................... 1
Chapter 2: Motivation ........................................................................................................... 3 2.1 Art in Every Day Life ................................................................................................................ 3 2.2 Public Art .................................................................................................................................. 3 2.3 Art and Experience ................................................................................................................... 5 2.4 Mobile Devices ......................................................................................................................... 6 2.5 Crowd Sourcing, VGI, and Social Media .................................................................................. 6 2.6 Value of VGI ............................................................................................................................. 8
2.6.1 Traditional Geographic Information (GI) and VGI ............................................................................. 9 2.6.2 VGI Data Quality ..................................................................................................................................... 10 2.6.3 Components of VGI ................................................................................................................................ 11 2.6.4 Different metaphors for VGI Value ..................................................................................................... 12
2.7 Curation and Social Media ..................................................................................................... 13 2.8 Web and Mobile Art Applications .......................................................................................... 14 2.9 Research Questions ................................................................................................................ 17
Chapter 3: Background and Review of Existing Applications ........................................... 18 3.1 Esri Public Information Map .................................................................................................. 18 3.2 Review of Existing Art Applications ....................................................................................... 19
3.2.1 Existing Art Application Description, Extent, and Technology ....................................................... 19 3.2.1.1 ArcGIS Online Art Maps ................................................................................................................................. 22
3.2.2 Public Art Content, VGI, and Social Media ......................................................................................... 23 3.2.3 Mapping Functionality ............................................................................................................................. 24 3.2.4 Limitations of Applications Using the SFAC Public Art Dataset .................................................... 25
3.3 Value of the SFPAM ............................................................................................................... 26
Chapter 4: Methodology ...................................................................................................... 28 4.1 Technology and System Architecture ..................................................................................... 28
4.1.1 Backend Services ...................................................................................................................................... 28 4.1.1.1 Users and Permissions Configuration in the Production Environment ................................................... 29
4.1.2 Web Application Architecture ................................................................................................................ 29 4.1.3 Mobile Application Architecture ........................................................................................................... 31 4.1.4 ArcGIS Online (AGOL) Architecture .................................................................................................. 31
4.2 Use Cases ................................................................................................................................ 33 4.2.1 Actors ......................................................................................................................................................... 33 4.2.2 High Level Use Cases .............................................................................................................................. 34
4.3 Development Process ............................................................................................................. 36 4.3.1 Web Application Development ............................................................................................................. 36 4.3.2 Data Service Development Process ...................................................................................................... 38 4.3.3 Infrastructure ............................................................................................................................................ 39

iv
4.3.4 Web Feature Development ..................................................................................................................... 40 4.3.5 Mobile Development ............................................................................................................................... 43 4.3.6 AGOL Development ............................................................................................................................... 44
4.4 Data Model and Geodatabase Schema ................................................................................... 46 4.4.1 Data Model ................................................................................................................................................ 46 4.4.2 Geodatabase Schema ............................................................................................................................... 48
4.4.2.1 Public Art (SFPubArt84M) Table and Fields ............................................................................................... 50 4.4.2.2 ARTSOURCE Table and Fields ..................................................................................................................... 50 4.4.2.3 SFNeighborhoods Table and Fields ............................................................................................................... 51 4.4.2.4 Buildings Table and Fields ............................................................................................................................... 51 4.4.2.5 Domain Values .................................................................................................................................................. 52
4.5 Data and Services .................................................................................................................... 53 4.5.1 Institutional and Administratively Curated Data Sources .................................................................. 54 4.5.2 SFPAM Services ....................................................................................................................................... 57 4.5.3 Social Media Services ............................................................................................................................... 57 4.5.4 Basemaps ................................................................................................................................................... 58 4.5.5 AGOL Services ......................................................................................................................................... 59
4.6 Application Evaluation ........................................................................................................... 59 4.6.1 Functional Requirements ........................................................................................................................ 60 4.6.2 Non-functional Requirements ................................................................................................................ 61
Chapter 5: Results ............................................................................................................... 63 5.1 Summary of Functional Requirements’ Test Results ............................................................ 63 5.2 Summary of Nonfunctional Test Results ............................................................................... 65 5.3 Changes Based on Initial Requirements Testing .................................................................. 66 5.4 REST Services Summary ........................................................................................................ 68 5.5 SFPAM Web Application Results ........................................................................................... 69
5.5.1 Main Page .................................................................................................................................................. 69 5.5.2 Popups ....................................................................................................................................................... 71 5.5.3 Layer Controls ........................................................................................................................................... 72 5.5.4 Additional Functionality .......................................................................................................................... 74
5.6 AGOL Results ......................................................................................................................... 77 5.7 Esri Mobile Application Results ............................................................................................. 80 5.8 Mobile iOS Pilot Application Results ..................................................................................... 83 5.9 Summary of Functionality Differences Between Clients ....................................................... 84
Chapter 6: Discussion ......................................................................................................... 86 6.1 Data Assessment ..................................................................................................................... 86
6.1.1 Institutional Datasets ............................................................................................................................... 86 6.1.1.1 SFPC Datasets ................................................................................................................................................... 87 6.1.1.2 SFAC Dataset .................................................................................................................................................... 87
6.1.2 Peer Reviewed VGI as Control Points ................................................................................................. 90 6.1.2.1 Comparison of SFAC Sample Data Points Location to Waymarking.com VGI .................................... 91 6.1.2.2 Comparison of iPhone Data Collection to Waymarking.com VGI .......................................................... 93
6.1.3 Analysis of Instagram Sample Set for Relevant Content ................................................................... 94 6.2 Summary of Primary Datasets using the KDC Framework ................................................... 95
6.2.1 Data Assessment Summary ..................................................................................................................... 97
Chapter 7: Conclusions and Future Directions .................................................................. 98 7.1 Conclusions ............................................................................................................................. 98
7.1.1 How can a comprehensive, interactive, dynamic map of public art and architecture for San Francisco be built from disparate data sources? ................................................................................................ 98

v
7.1.2 What is a common, extensible data model for public art and architecture? ................................... 98 7.1.3 How can social media be used to provide information about San Francisco’s public art? .......... 99 7.1.4 How can institutional, peer-reviewed VGI, and social media data sources for San Francisco public art and architecture be evaluated for quality? ......................................................................................... 99
7.2 Future Directions for Improving Data Quality ...................................................................... 99 7.2.1 Recruiting and Training Community of Experts .............................................................................. 100 7.2.2 User Ratings and Feedback .................................................................................................................. 101 7.2.3 Gamification ........................................................................................................................................... 101
7.3 Future Directions for the SFPAM Application ...................................................................... 104
References ............................................................................................................................. 106
Appendix ................................................................................................................................ 110 A. Art Application Assessment ..................................................................................................... 110
A.1 Art Application URLs .............................................................................................................................. 110 A.2 Art Application Client and Mapping Platforms ................................................................................... 111 A.3 Art Location Data, VGI and Social Media ........................................................................................... 112 A.4 Basic Mapping Functionality .................................................................................................................. 114
B. Model Builder Script: Convert Directory of KML/MKZ to Feature Classs ............................ 115 C. Popup Information Template .................................................................................................. 116 D. Code Snippets for Basemaps ................................................................................................... 117
D.1 Basemaps.js Configuration Snippet ....................................................................................................... 117 D.2 mapBasemaps.js Code Snippet to Determine if Basemap is from Stamen ..................................... 118 D.3 mapBasemaps.js Code Snippet to create WebTileLayer Class .......................................................... 119
E. Sample REST Feature Configuration Using Unique Value Rendering .................................. 120 F. ArcGIS Domain Values ............................................................................................................ 123
F.1 Architect Names (Archnames) Domain Values ................................................................................... 123 F.2 Neighborhood Domain Values .............................................................................................................. 123 F.3 Building Style (Style) ................................................................................................................................. 124
G. Organization and Data Source URLs ...................................................................................... 125 G.1 Organization URLs .................................................................................................................................. 125 G.2 Dataset URLs ............................................................................................................................................ 126

vi
List of Tables Table 1 Benefits and Challenges Using VGI 8 Table 2 Selected Art Applications and their Capabilities 14 Table 3 Art Application Description and Extent 20 Table 4 Client Types Summary 22 Table 5 Actors for SFPAM 33 Table 6 Use Cases by Actor and SFPAM Component 36 Table 7 Basemap Integration 41 Table 8 Integrating a New Social Media API into the SFPAM 42 Table 9 AGOL Configuration Steps 44 Table 10 SFPUBART84M (Public Art) Feature Class Fields 50 Table 11 ARTSOURCE 51 Table 12 SFNeighborhoods 51 Table 13 Buildings 51 Table 14 Domains used in Geodatabase Schema 52 Table 15 Organization, Level of Curation, Description of Art Data, and POIs 54 Table 16 Description of REST Services 57 Table 17 Social Media Data Sources (last accessed 13 December 2013) 58 Table 18 Basemap Services (accessed 11 December 2013) 59 Table 19 AGOL Services 59 Table 20 Functional Requirements 60 Table 21 Non-functional Requirements 61 Table 22 Functional Requirements’ Test Results 63 Table 23 Non functional Requirement Results 65 Table 24 Services Used by Each Application 68 Table 25 AGOL map services 77 Table 26 Comparison of functionality differences between clients 85 Table 27 Distance between Waymarking.com, iPhone locations, and SFAC locations. 92 Table 28 Instagram Images by Category 95 Table 29 Dataset evaluation using KDC framework 96

vii
List of Figures Figure 1 System architecture for web application 30 Figure 2 - Mobile application architecture 31 Figure 3 ArcGIS Online (AGOL) architecture 33 Figure 4 High-level use cases 35 Figure 5 PIM Disaster map and SFPAM 40 Figure 6 SFPAM conceptual data model 47 Figure 7 ArcDiagrammer Geodatabase Schema 49 Figure 8 - The main page for sfpublicart.com 70 Figure 9 Sample popup windows 71 Figure 10 Legends for the Art, Building, and POPOS layers 73 Figure 11 Basemap and social media configuration 74 Figure 12 Find a place 75 Figure 13 Places 75 Figure 14 Share map options 76 Figure 15 AGOL San Francisco Public Art and Architecture Map 78 Figure 16 Adding new art features to the AGOL feature service 79 Figure 17 - AGOL SF Art Admin map in editing mode 80 Figure 18 ArcGIS for Mobile basic functionality 81 Figure 19 Collector map view, popup, and directions 82 Figure 20 Editing using mobile applications 82 Figure 21 Native Mobile Application with Popup Display and Basemap Picker 84 Figure 22 Distribution of SFAC art installations per location 89 Figure 23 Discrepancy between SFAC data points and Waymarking.com VGI 91 Figure 24 Music Concourse detailed view 92 Figure 25 IPhone data collection vs. Waymarking.com VGI 94 Figure 26 Screen capture from www.ingress.com of public art “portal” (last accessed 10 December
2013) 102 Figure 27 Ingress portal identification for "Cupid's Span" from http://www.ingress.com/intel (last
accessed 10 December 2013) 103 Figure 28 Convert Directory of KMZ/KML to Feature Class 116

viii
List of Abbreviations AGOL ArcGIS Online
API Application Programming Interface
CCSF Community College of San Francisco
CGI Contributed Geographic Information
CRU Create, Read, Update
CRUD Create, Read, Update, Delete
CSS Cascading Style Sheet
CSV Comma Separated Variable
FIPS Federal Information Processing Standard
FPA Federal Art Program
GI Geographic Information
GPS Global Positioning System
HTML Hypertext Markup Language
IDE Integrated Development Environment
iOS iPhone Operating System
JSON JavaScript Object Notation
KDC Knowledge Discovery in Cyberspace
KML Keyhole Markup Language
KMZ Keyhole Markup Language, Zipped
LBS Location Based Services
MXD Map Exchange Document
NEA National Endowment for the Arts

ix
NOAA National Oceanic and Atmospheric Administration
PIM Public Information Map
POI(s) Point(s) of Interest
PWAP Public Works of Art Program
R Read
REST Representational State Transfer
SDK Software Development Kit
SFAC San Francisco Arts Commission
SFMA San Francisco Mural Arts
SFO San Francisco Airport
SFOM San Francisco Airport Museum
SFPAM San Francisco Public Art Map
SFPC San Francisco Planning Commission
SOD Sudden Oak Death
UCSF University of California San Francisco
URL Uniform Resource Locator
USC University of California San Francisco
VGI Volunteered Geographic Information
WGS84 World Geodetic System 1984
WPA Works Progress Administration
YBG Yerba Buena Gardens

x
Abstract The San Francisco Public Art Map (SFPAM) mashes up disparate sources of data to create a
dynamic, comprehensive, and interactive map of public art and landmark buildings in the City of San
Francisco. The San Francisco Arts Commission administers publicly funded art and is responsible
for over 800 pieces but maps are incomplete or inaccurate. There are hundreds of other art pieces
such as murals, street art, and art funded by private organizations not included in the San Francisco
Arts Commission dataset. Existing applications focus on one type of art or a narrow selection of
installations. No application combines institutional data sets, peer-reviewed volunteered geographic
information, and social media to create a comprehensive view of publicly available art.
The SFPAM consists of a web client and ArcGIS Online maps. The web client uses
JavaScript, Dojo, social media application programming interfaces, ArcGIS Server, ArcSDE , REST
services, and Microsoft SQL Server technologies. Configuration and development to add
functionality to Esri’s Public Information Map 2.0 source code transformed a disaster map to an art
map. The web application incorporates Stamen Design basemaps to provide a fresh look that
complements the art content. ArcGIS Online maps enable users to contribute new art and buildings
and view art data on mobile devices through the ArcGIS for Mobile or Collector applications.
There are three levels of curated data: institutional, administrative, and social. Institutional
curation consists of datasets provided by institutions that administer or fund public art projects. The
administrative level includes reviewed volunteered geographic information. Social curation consists
of a dynamic layer of pictures and comments on public art through social media streams such as
Flickr, Panoramio, Instagram, and YouTube. The application demonstrates a unique method of
combining data sources to provide a public art map for visitors and residents of San Francisco.

1
Chapter 1: Introduction The City of San Francisco is endowed with a rich variety of art in public spaces. The San Francisco
Arts Commission (SFAC) alone curates over 800 pieces of public art. In addition to the SFAC
holdings, there are colorful murals, landscaped parks, art monuments, street art of mysterious origin,
and pieces curated by other organizations. There is no one place to learn about all the different art
available in the city's built environments. Existing mobile and web applications that map art
locations silo information by covering only certain categories of art such as publicly funded pieces,
murals, or street art. No application currently uses social media as a source of art data.
The San Francisco Public Art Map (SFPAM) is a web and mobile application that aggregates
location based publicly accessible art data in San Francisco. The project compiles art location
information from disparate institutional sources. Volunteered Geographic Information (VGI)
creates a dynamic layer of pictures and comments on public art through social media streams such as
Flickr, YouTube, Instagram, and Panoramio. Residents or visitors in San Francisco locate and learn
more about public art through accessing the application.
ArcGIS Server, ArcSDE , ArcGIS Online, and Microsoft SQL Server provide backend
services. Esri's Public Information Map (PIM) provides a development starting point for the web
application. The web application uses JavaScript, Dojo, and social media application programming
interfaces (APIs) to create an interactive user guide. The iPhone Operating System (iOS) software
development kit (SDK) 6.x, XCode 4.6, and ArcGIS Runtime SDK for iOS 10.1.1 furnished a
development environment for exploring the creation of a 6.x native application for iPhone and iPad.

2
ArcGIS Online (AGOL) for Organizations, Esri ArcGIS for Mobile, and Esri Collector provide an
interface to update and add new data in the field, as well as a mobile client map option.

3
Chapter 2: Motivation This chapter explores the value of public art, the ubiquity of mobile devices, and the potential
benefits of a mobile art application in sections 2.1 -2.4. Sections 2.5 - 2.7 investigate VGI, social
media, data quality, and the concept of curation. Section 2.8 describes several web and mobile
applications. Section 2.9 lists the research questions explored in the thesis.
2.1 Art in Every Day Life Dog lovers walking their dogs at Fort Funston encounter two homages to canines installed
on the crumbling concrete wastewater outflow pipes by the ocean. One bas-relief sculpture depicts
running greyhounds. A second shows a mysterious dog buddha gazing out to sea. What is the story
behind these pieces? People see art taking public transportation, playing in parks, reading in libraries,
or performing any number of daily tasks that take them into San Francisco's built environment.
Artists may be well known, such as sculptor Andrew Goldsworthy, little known, or unknown. Over
300 colorful murals depicting daily life, politics, history, community, humor, hope, and culture greet
walkers in the Mission District. Whether sublime or tacky, subversive or bland, moving or
humorous, funded or unfunded, art is part of the fabric of the city of San Francisco.
2.2 Public Art Cartiere (2008) states that the origin, definition, and purposes of public art are not clear. Did
public art originate with the cave paintings at Lascaux? Or did public art in the United States
officially originate in 1967 with a commission for a sculpture by Alexander Calder from the National
Endowment of the Arts’s (NEA) new fund for public art (Miles 2009)? Others such as Cartiere
(2008) argue public art originated in the 1930's with either the Federal Art Program (FPA) of the
Works Progress Administration (WPA) or the Public Works of Art Program (PWAP).

4
Cartiere asks when the term public art became a dirty word, used primarily by administrators
of funds for public art, and notes that many terms and kinds of art such as "permanent works,
temporary works, political activism, service art, performance, earthworks, community projects, street
furniture, monuments, memorials, plunk, and plop art," are used to describe public art works. An art
installation may be as small as one's hand or encompass several acres.
Over time, several paradigms have defined public art (Knight 2008). Memorials
commemorating loss or monuments celebrating heroes and victories comprise early state sanctioned
art. Other paradigms include functional art, such as tables and chairs; art in the park such as
Christo's The Gates; art as the agora or public place; and art as pilgrimage. An extreme example of art
as pilgrimage is De Maria's Lightning Field, a work requiring a guide to find the site, an accident
release form, and overnight stay with up to 5 other pilgrims in a small cabin cut off from cell
coverage.
Miles (2008) wonders whether public art such as monuments, works created through public
funding for urban redevelopment, and those commissioned by public agencies on behalf of the
public are perpetuating a power dynamic and promoting an implicit set of values. He writes, " Public
art in context of the cultural industries as perceived drivers of redevelopment reinvents the tradition
of the public monument. Statues in public parks and squares seem inoffensive as they blend,
covered in moss and pigeon shit into an urban landscape. But public monuments arose as one
element in a spectrum of public institutions which includes the workhouse, the prison, and the
museum." Monuments, statues, and sculptures also serve the common good as references for
navigation or wayfinding due to their landmark saliency: characteristics that differentiate a landmark
visually from the surrounding environment (Raubal and Winter 2002).
5
Hein (2006) notes that concurrent with the development of art by agencies on behalf of the
public, various communities began discovering their own voice in the 1970s through creating murals
on available wall space. The murals were generally funded by grassroots donations and created by
local residents. Hein quotes Timothy Dresher, who talks of public art, "done for a general undefined
population … and commissioned by official bodies" in contrast to community art "created by or
with a group of people who will interact with the finished artwork." The Mission murals of San
Francisco integrate common symbols of Hispanic residents such as the Virgin of Guadalupe with
contemporary events, providing a voice for those communities.
Cartiere defines public art broadly as "art outside of museums and galleries" that meets one
of the following criteria: publicly accessible or visible; of public interest to individuals or a
community; maintained for or used by individuals or a community; or publicly funded. This broad
definition of public art informs the San Francisco Public Art Map (SFPAM). Most individuals are
interested in learning about the art they see in front of them or the art where they will be travelling;
it is of little consequence which organization funded the project. Why should a user have to look at
multiple applications or sources to find out about several pieces of art that are in close proximity?
The SFPAM seeks to improve user access and experience by bringing art data for publicly funded
art, art funded by other organizations, murals, and street art into one application.
2.3 Art and Experience Using John Dewey's work describing types of experience, Hein (2006) classifies the
encounter with art as a kind of consummatory event that adds zest to life. Subject and object are
one, and there is a satisfying completeness. The encounter may be transformative or generative.
Ideas are brought into focus and become private experience as a person engages the object. Art has
the power to challenge ideas and transform people.

6
2.4 Mobile Devices Mobile phones have expanded human capabilities through increased access to information
as well as possibilities for people to connect with one another (Smith 2011). According to Lunden
(2012), Nielsen reports that 50.4% of US consumers use smart phones. The market share for
Android is 48.5% and iOS is 32%. Global Positioning Systems (GPS) chips provide low cost and
efficient navigation and location services for mobile and smart phones (Hwang and Yu 2012). A
mobile-friendly, web-based application bridges the gap between different operating systems and can
be used by more devices than a native application, while a native application offers performance
benefits and broader use of built-in device functionality. A public art application for mobile access
expands human capabilities through publicizing and directing people to accessible public art. People
can engage art on the streets directly instead of from their armchairs.
2.5 Crowd Sourcing, VGI, and Social Media Howe (2006) coined the term crowdsourcing to refer to the ability of socially networked
individuals to produce solutions equal or greater to that of experts or professionals in a fast, cost
effective manner. Crowdsourcing can be used by any group for a variety of reasons in an
asynchronous fashion, (Barbier et al. 2012). Crowd sourced data can also be clustered to create
categories using metadata or hash tags.
Although Boulos et al. (2011) described user-contributed, geo-referenced material as the
“Wikification of GIS by the masses” in 2005, other phrases are more commonly used. Goodchild
(2007) documented the phenomenon of untrained citizens voluntarily contributing geographic
information and remarked:
They represent a dramatic innovation that will certainly have profound impacts on geographic information systems (GIS) and more generally on the discipline of geography and its relationship to the general public. I term this volunteered geographic information (VGI), a

7
special case of the more general Web phenomenon of user-generated content (Goodchild 2007,212).
Urban environments, such as San Francisco, contain large numbers of citizens using mobile
location-based services (LBS). Thus, they also contain inherent resources for generating spatial data
and information to complement traditional means of data mapping, (Mooney, Sun, and Yan 2011).
Cuff (2008) writes that the rise of cell phones with GPS and other sensors in urban environments
signals a shift from centralized, unattended sensors controlled by scientists to decentralized,
distributed citizen sensing. A central authority may maintain the database and rules under which
urban sensors contribute information. Cuff cites the Great Backyard Bird count as an example of
urban sensing. Citizens are both consumers and producers of data, even if inconsistent or not fully
intentional contributors. Dangermond (2011) notes that one critical requirement for using VGI is
structuring data collection for analysis. Geographic information may be challenging to extract from
VGI depending on the source and geospatial data format (Pultar et al. 2009).
Georeferenced social media generates VGI and crowdsources the earth’s surface (Newsam
2010). Work has been done (Kennedy et al. 2007) to demonstrate that photo-sharing services with
tagged and geolocated photos can be mined to discover locations and events. Chen et al. (2009) has
developed a system using georeferenced images to generate maps with images of tourist locations.
Popular social media services include Twitter, Foursquare, Facebook, and YouTube. Flickr, a
cloud based photo-sharing service, posts daily statistics of camera usage by upload total and users.
While the all time camera brand on Flickr is Canon, statistics for June 5, 2013
(www.flickr.com/cameras), show that three iPhone cameras had the largest number of users as well
as image uploads to the service with Canon DSLRs taking the next two spots. The three iPhones
accounted for 635,591 uploads from 19,239 users. The Canon DSLRs accounted for 275,930

8
uploads from 8068 users. The Flickr statistics are an indicator of the growth and dominance of
mobile devices for generating VGI.
The benefits and challenges of using VGI are summarized in Table 1 based on experience
from the Oak Mapper environmental monitoring system (Connors, Lei, and Kelly 2012). Oak
Mapper combines data from different sources: scientists working on mapping Sudden Oak Death
(SOD); citizens who contribute information; and social media streams such as Twitter and Flickr
that have hashtag references to SOD. The Oak Mapper project, while an environmental monitoring
system, models a data acquisition and integration framework similar to the San Francisco Art Map:
there are "official" entries, crowd sourced entries, and social media points. The current version of
Oak Mapper enables users to submit data using an iPhone application that leverages the GPS of the
device and turns a personal phone into a research instrument. Searching social media using a filter of
"Sudden Oak Death” produces additional geolocated points.
Table 1 Benefits and Challenges Using VGI
Benefits Challenges
Ability to leverage volunteers Data credibility, quality, consistency
Increased scale of coverage Metadata standards
More informed public Unpredictability, bias and motivation
Active consensus building Perceptions of surveillance
Community and social networking Reinforced authority and differential empowerment
Massive data flows Access and the digital divide
Increased cooperation Technical challenges Source : (Connors, Lei, and Kelly .2012, 1274)
2.6 Value of VGI This section compares traditional geographic information production and VGI creation.
Quality concerns, value, and benefits are discussed. Different components of VGI are identified as

9
well as types of research using crowd-sourced images. New metaphors for VGI are described and
appropriated for the SFPAM.
2.6.1 Tradit ional Geographic Information (GI) and VGI Flanagin and Metzger (2008) raise questions about VGI with regards to quality, accuracy,
reliability, and value. VGI is difficult to assess from a quality perspective. There are a large number
of contributors and a lack of gatekeepers, and data does not meet academic standards for quality.
Feick and Roche (2013) note that traditional GI is usually constructed by one person and evaluated
according to resolution, positional accuracy, currency, and professional reputation. As Chrisman
(1984) has written, data quality is not just positional accuracy, but communicates information from
the producer to the consumer so that the user can determine the fitness of use for a given purpose.
Value is difficult to measure even with traditional GI. The utility of both GI and VGI depend on the
fitness of use for the consumer’s purpose and the consumer’s perception of value.
Harvey (2013) states that distinctions should be drawn between VGI and contributed GI
(CGI) when discussing crowd-sourced data. VGI has opt-in agreements to clarify data collection and
reuse, whereas CGI has opt-out agreements that are vague, open-ended, and provide the user with
limited controls. Mobile phone tracking data that can be resold is an example of CGI. Social media
streams and peer-reviewed VGI used in the SFPAM contain data reuse agreements that users
confirm when uploading data to the various sites.
Feick and Roche (2013) summarize ways VGI creation differs from traditional GI
production: producers are not experts, but amateurs with a range of interests and abilities;
distinction between producers and consumers is blurred as produsers participate in both roles
Budathoki (2008); creation and use of data is loosely organized; and volunteers may lose interest in a
project and stop participating.
10
Pultar et al. (2009) comment that an advantage of VGI is the creation of a dynamic GIS that
makes use of changing geographic objects over time. A dynamic GIS leverages temporal geodata
and provides better analysis, queries, and visualization. Data creation is driven by personal interest
and motivation, resulting in data that would not have been created by government or commercial
organizations (Goodchild 2008). Additional benefits of VGI include:
• Creation of rich datasets based on local and experiential knowledge Hall (2010). • Fostering of a culture of participation where citizens can participate and control viewpoints
Roche (2011). • Building of technical skills and social networks. • Potential to mobilize large numbers of contributors over short periods of time to construct
data that is more responsive to changing needs than government or commercial organizations can provide (Feick and Roche, 2013, 19-20).
2.6.2 VGI Data Qual i ty As noted in Table 1, challenges to using VGI include data credibility, consistency, and
quality, as well as producer unpredictability, bias, and motivation. These issues are particularly
important when using VGI in a scientific study or in disaster and crises situations. Goodchild and
Glennon (2010), are among those who have discussed strategies and concerns with regards to using
VGI (Elwood, Goodchild, and Sui 2012; Flanagin and Metzger 2008; Barbier et al. 2012). Cuff ,
Hansen, and Kang (2008) question whether data quality concerns are as important when dealing
with art and politics.
VGI for public art differs from disaster or crises mapping in several ways: data quality is not
a time-sensitive matter of life and death; data has a long lifespan unless the point of interest (POI) is
temporary; and data can be revised. A consumer of public art data is not monitoring how close a fire
is to property and making a decision to evacuate. Public art data should be located and described
verbally or through an image with enough accuracy for a consumer to locate the physical POI and
11
learn more about the piece. The POI should be relevant to public art. Strategies such as filtering and
incremental improvement of data accuracy can improve data quality.
2.6.3 Components o f VGI One of the key contributions of both peer-reviewed VGI and social media VGI for the
SFPAM is the inclusion of image content.) One way of making sense of VGI photo collections such
as Flickr comes from clues extracted from user-assigned labels and tags (Kennedy et al. 2007). Tags
are entered without reference to ontology or categorization and can be inaccurate, wrong, or
ambiguous. The tag may not even describe the image content. Geotagged location information
provides another clue to content. Computer vision analysis can be combined with geotags and label
analyses to generate representative pictures of landmarks for an area such as San Francisco.
However vision analysis is not always applicable or practical given the intended use for VGI.
Tsou and Leitner (2013) describe the emerging social media research framework for
knowledge discovery in cyberspace (KDC). The three interdependent components are place, time,
and messages. Place may be the GPS location, the interpretation of a place name, user context, or
scale. Time may be a snapshot or a period of time. Messages consist of different kinds of content
such as text, images, or video depending on the social media stream. Interpretation and analysis
depends on context and medium.
Newsam (2010) divides work leveraging georeferenced crowd-sourced photographs into
three categories: annotating novel images (such as Kennedy’s work above), annotating geographic
locations, and performing geographic discovery. Tsou and Leitner (2013) also distinguish between
social media research as big and small data. VGI in the San Francisco Art Map falls into the category
of geographic discovery and small data. The purpose of the map is to discover, integrate, and

12
visualize as many different locations of art as possible in the San Francisco extent for public use.
VGI data extraction and visualization is constrained both by location and by context. With a few
exceptions, art works, especially murals and street art, will have only one geotagged image. Most art
will not have an obvious or commonly used identifier such as “The Golden Gate Bridge.” The
artist’s name and the work’s title may appear on a nearby plaque or embedded in the artwork. In the
case of murals and street art the identity of the artist and title may be a matter of local knowledge.
2.6.4 Different metaphors for VGI Value Feick and Roche (2013) propose two metaphors to describe the VGI use and production.
The first is based on Debord’s (1958) concept of ‘dérive,’ translated as drift. The second metaphor is
that of Lego building blocks.
Feick and Roche describe drift as wandering in an urban environment “without specific aims
other than to discover and become immersed in a narrative network of experiences and lives.” They
draw an analogy to the VGI produser who:
Explores, uses and produces new VGI without necessarily having a predefined plan, timetable or schedule. Navigation in VGI processes allows produsers to encounter unexpected data sources, discover anticipated phenomenon and then increase the potential value of VGI as processes and as datasets (Feick and Roche 2013, 25).
Further, Feick and Roche link value and creation of VGI to serendipity, a concept describing
“unexpected discoveries that are made randomly and through intelligence in a process that initially
targets a different object than those that are discovered.”
While drift and serendipity may describe creativity in individual VGI contributions, the
second metaphor of VGI as Lego blocks addresses collaborative data usage as well as reuse. Very
different end products can be built from the same blocks, such a space ship, house, or truck. VGI

13
can be seen as data blocks that can be reused, extended, or mashed up to expand the value of the
original data.
Both of these metaphors are helpful in describing the value of peer-reviewed VGI and social
media for the SFPAM. There is a sense of both serendipity and drift as to the art works that have
captured the interest and notice of the contributors. Like a Lego creation, the map uses multiple
VGI sources, extends them through extraction of content into a common data model, and mashes
them up into an art map. In addition, the map itself encourages wandering through data by clicking
and exploring the features. Hopefully the map encourages viewers to engage in their own drifting
discovery of San Francisco’s art treasures.
2.7 Curation and Social Media Liu (2011) has developed a model of socially distributed curation during crises. Curation is a
process of choosing what is meaningful and is usually associated with institutions that employ
curators to make decisions about what stories or objects to preserve. Liu argues that social media
supports curation tasks such as collecting, organizing, storytelling, and preserving of memories in a
way that allows others to reuse and redefine collective memories, whether experienced directly or
indirectly. Social media shifts curation from an individual defining what is worth preserving to a
social network of multiple people defining cultural heritage. While Liu focused on the role of social
media as curator of crisis heritage, the SFPAM uses social media as curator of public art.
There are three levels of curation in the SFPAM: institutional, administrative, and social. Art
data comes from institutions that fund and curate public art. Peer-reviewed VGI, administrative
scraping of web sites, and local knowledge create additional layers. Social media creates a dynamic
layer of pictures and comments on public art from contributors who unknowingly take on the role

14
of curator through posting and tagging images. Combining data from multiple curators creates a
richer set of art data points.
2.8 Web and Mobile Art Applications There are multiple applications available for web and mobile clients that document art
locations. None are comprehensive in their coverage of publicly available art. Table 2 summarizes
features of several applications and indicates if the application is targeted to web and/or mobile
devices. The web applications are not specifically designed to be mobile friendly; organizations
develop native applications for iOS or Android to address mobile users. The San Francisco Arts
Commission has a public art map that was last updated in 2009. The map contains only a subset of
the agency’s holdings, is difficult to find from the main SFAC website, is not designed for mobile
access, and does not have a VGI component or social media layer.
Table 2 Selected Art Applications and their Capabilities Name Description Designed
for Website/ Mobile
SF Art Locations
VGI Social Media as VGI layer
Map
Art and Architecture – San Francisco
Photos and history of buildings and public art in San Francisco
Website Art and building locations. 1800+ map points, but actual POIs is 622
Users can request that the author research and include a building or artwork
No All points shown on map. Selecting a point brings up an image with url to article
Culture Now Art, Architecture and History in the Public Realm. Public art locations, podcasts, videos, events, and tours.
Website/ Mobile. Map function doesn't work on iPhone
12 Users can submit form and images for consideration by admins.
No All points shown on map. Search by artist, city, title, architect, city, or year
Fontly Capture, map, and explore the world of vintage typography
Web, iOS ~200 examples of typography
Yes. All locations user submitted using the IOS application
No All points shown based on map extent. Awkward navigation, interaction with pop ups, point clustering
SF Mural Arts
Online resource for
Website/ Mobile
750+ murals in San
Photos of existing murals.
No All points shown on map

15
murals in San Francisco. Murals listed by neighborhood.
Francisco
San Francisco Arts Commission Public Arts Map
Dated and difficult to find Google map selection of SFAC public art
Website ~100 out of agency's 800+ pieces
No No All points shown on map
SF Mural Arts (www.sfmuralarts.com) has a beautiful web gallery of 750+ murals in San
Francisco. The website documents basic information about murals such as the artist, pictures, date
of creation, and location. The murals can be listed by neighborhood. However, while the website has
a map of the murals, clicking on individual points generates mixed results. SF Mural Arts released an
iOS application in December 2012 that allows a user to view locations of all the murals. Users can
submit pictures of murals on the web for consideration or send an email from the mobile
application suggesting new sites. Some murals are sponsored by SFAC, but the majority are
commissioned locally. The application allows one to select favorite murals to create a tour.
Art and Architecture – San Francisco (www.artandarchitecture-sf.com) is a web site with
pictures and history of buildings and public art organized by neighborhood. The author, Cindy
Casey, has been posting pictures and history of art and buildings since 2011 in response to a New
York Times article that detailed the neglect, loss, and mismanagement of San Francisco’s public art
Wright (2011). The website is a great resource for pictures and history, but difficult to navigate. The
site grew organically over time and does not provide summary of locations included. The art and
architecture covered reflects the author’s interest; however users can send an email to the author
requesting inclusion of a building or public art piece.
The site can be searched for an artist. All points are displayed on a simple Google map with
popup windows containing a title, image, and hyperlink to the article on the image. There is no

16
clustering, and a user cannot navigate from an article on the web site to locate the POI on the map.
While there are over 1800 markers, multiple markers are placed at the same location representing
different photos of the same POI, as well as POIs that should be mapped at a slightly different
latitude and longitude. Overlapping markers do not always link to the same web article. This makes
it difficult to assess the number of buildings or public art pieces covered by the website. When
multiple markers are placed at the identical latitude and longitude, only the last marker placed on the
map is accessible.
Culture Now is a web and mobile application with a wealth of information on public art,
architecture, history of art and architecture, guided tours through the application, and events. Most
locations are events in the Northeastern U.S., although there are a few art pieces in San Francisco.
All locations are mapped and can be searched for or filtered in a variety of ways. This application is
one of the few that contains notable buildings. Users can submit a form and image for consideration
by the application administrators.
Fontly is a mobile application that collects data and images of interesting typography. Users
submit all records with no administrative review. A simple form collects information on what the
sign says and asks the submitter to categorize the sign from a pull down list. Users can "like" a
submission. Records are accessible as points on a map. A subset of records is available for recently
submitted locations, favorites, and a user's submitted locations.
With the exception of Art and Architecture – San Francisco, which includes art based on the
interests of the site curator, applications segregate public art data by agency or type of art. No single
application provides a complete view of art in San Francisco. Some applications accept VGI
contributions. No application uses unstructured social media art POIs as a resource for expanding
art locations.

17
Geotagged social media, filtered by metadata such as "art" or "sfart" within the extent of San
Francisco, provides several hundred photos and videos of unsolicited VGI data. Social media
provides a citizen curated, dynamic, time-sensitive, and decentralized catalog of public art. The best
publicly available source documenting murals and street art may be social media if the art is illegal,
sponsored by a small organization, or sponsored by an individual for a residence. Social media
entries are time-sensitive due to volume limitations placed on API data access.
The SFPAM breaks down barriers between categories of art or agency by aggregating art
data from as many sources as possible and letting the consumer decide which art is interesting. Art
locations come from organization datasets, peer-reviewed VGI, and unsolicited VGI. The map
exists to make art information broadly available and enable the public to be both consumers and
producers of art data.
2.9 Research Questions This thesis investigates the following research questions:
1. How can a comprehensive, interactive, dynamic map of public art and architecture for San Francisco be built from disparate data sources?
2. What is a common, extensible data model for public art and architecture? 3. How can social media be used to provide information about San Francisco’s public art? 4. How can institutional, peer-reviewed VGI, and social media data sources for San Francisco
public art and architecture be evaluated for quality?
The Background chapter following looks more closely at 44 different art applications and
evaluates their technology, datasets, functionality, VGI, and social media capabilities.

18
Chapter 3: Background and Review of Existing Applications
This chapter assesses the Esri Public Information Map and how it contributes to the San Francisco
Public Art Application (SFPAM). Existing art applications are reviewed to determine their
contribution to San Francisco art information, mobile accessibility, technology, datasets, VGI, and
functionality. The final section describes the value of the SFPAM as an art application for San
Francisco.
3.1 Esri Public Information Map In 2010 Esri created a prototype web application for VGI using ArcGIS 10.0 and web
services called the Public Information Map (PIM). The application, which is no longer available
online, was used to support the Deepwater Horizon oil spill recovery by combining authoritative
content from organizations such as the National Oceanic and Atmospheric Administration
(NOAA), the disaster response feed from Ushahidi, and live data feeds from social media such as
YouTube, Twitter, and Flickr. Users also posted content and links. The ArcGIS Server
Development Team (2010) documented the following observations:
• The application provides potential ways for user generated and policed data gathering in regards to things users are passionate about.
• Social media results are unpredictable, and it is tricky to filter social media to include only relevant information.
• Use a generic search term such as "oil spill", use only georeferenced data, and limit the extent.
• Set up social media filters and enable community policing through allowing data to be flagged as inappropriate.
• If you allow people to add data, they will, and contributions may not be relevant. • Time is important for incident data. • This type of application has broader application than disaster response.

19
Esri has released several iterations of the PIM application and code base for public use.
The PIM observations translate well to the SFPAM application. Institutions, user
contributions, and social media provide data. Georeferenced filtering by generic keywords such as
“art” or “sfart” within the San Francisco extent provides rich social media results. Time is not
critical for public art data, with the exception of events. The SFPAM application does not include art
events.
The SFPAM application is an example of how the PIM has broader application than disaster
response. The PIM was customized to become a web-based art map for San Francisco.
Modifications to the PIM code included extent, filters, graphics, text, basemaps, layers, and social
media streams. The PIM provides an attractive interface, includes basic navigation and search
functionality, and is highly configurable and extensible by developers who download the code.
While the PIM provides an excellent framework for desktop browsers, the interface is not
optimized for mobile phones or tablets. A mobile friendly web or native application requires
additional development.
3.2 Review of Existing Art Applications Section 3.2.1 introduces the existing applications and reviews their extent, POIs in San
Francisco, client platforms, and mapping platform. Section 3.2.2 describes data sources for different
art applications and use of VGI. Section 3.2.3 assesses basic mapping functionality for the
applications. Section 3.2.4 looks at the limitations of current applications using the public art
commission dataset in San Francisco.
3.2.1 Exist ing Art Appl i cat ion Descr ipt ion, Extent , and Technology Research on art applications generated a list of forty-four programs for review. Table 3 lists
the application name, brief description, extent, and the number of San Francisco locations mapped.
20
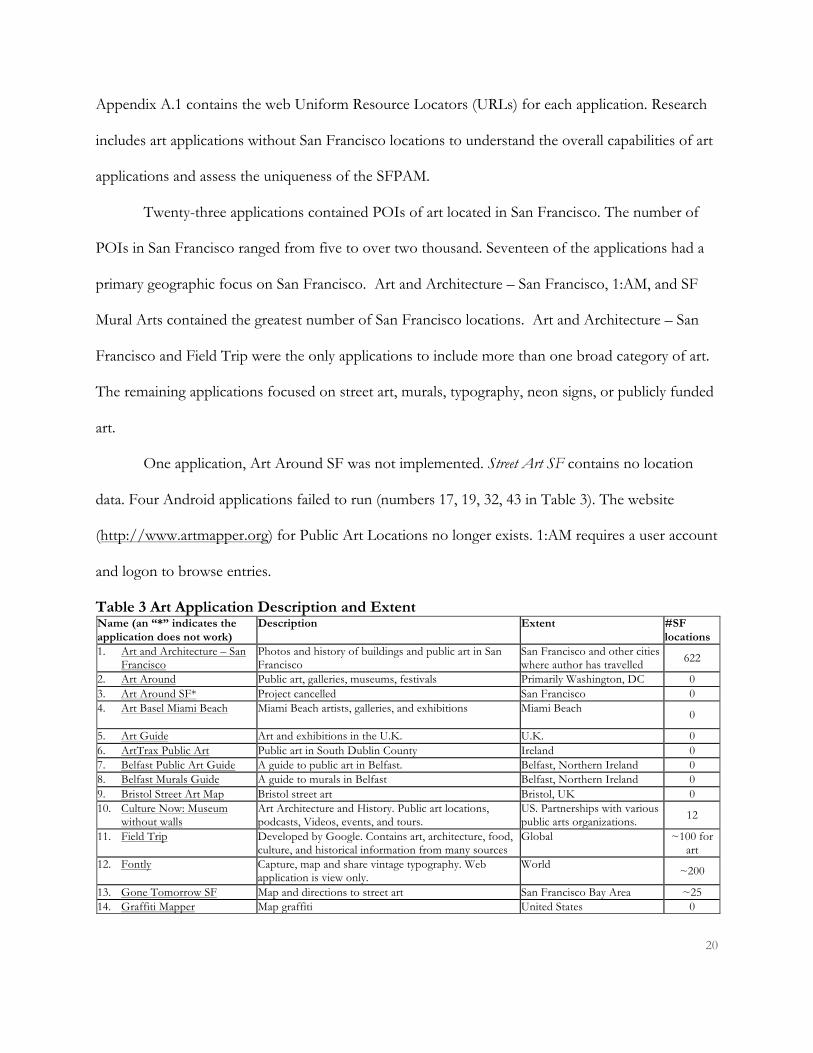
Appendix A.1 contains the web Uniform Resource Locators (URLs) for each application. Research
includes art applications without San Francisco locations to understand the overall capabilities of art
applications and assess the uniqueness of the SFPAM.
Twenty-three applications contained POIs of art located in San Francisco. The number of
POIs in San Francisco ranged from five to over two thousand. Seventeen of the applications had a
primary geographic focus on San Francisco. Art and Architecture – San Francisco, 1:AM, and SF
Mural Arts contained the greatest number of San Francisco locations. Art and Architecture – San
Francisco and Field Trip were the only applications to include more than one broad category of art.
The remaining applications focused on street art, murals, typography, neon signs, or publicly funded
art.
One application, Art Around SF was not implemented. Street Art SF contains no location
data. Four Android applications failed to run (numbers 17, 19, 32, 43 in Table 3). The website
(http://www.artmapper.org) for Public Art Locations no longer exists. 1:AM requires a user account
and logon to browse entries.
Table 3 Art Application Description and Extent Name (an “*” indicates the application does not work)
Description Extent #SF locations
1. Art and Architecture – San Francisco
Photos and history of buildings and public art in San Francisco
San Francisco and other cities where author has travelled 622
2. Art Around Public art, galleries, museums, festivals Primarily Washington, DC 0 3. Art Around SF* Project cancelled San Francisco 0 4. Art Basel Miami Beach
Miami Beach artists, galleries, and exhibitions Miami Beach 0
5. Art Guide Art and exhibitions in the U.K. U.K. 0 6. ArtTrax Public Art Public art in South Dublin County Ireland 0 7. Belfast Public Art Guide A guide to public art in Belfast. Belfast, Northern Ireland 0 8. Belfast Murals Guide A guide to murals in Belfast Belfast, Northern Ireland 0 9. Bristol Street Art Map Bristol street art Bristol, UK 0 10. Culture Now: Museum
without walls Art Architecture and History. Public art locations, podcasts, Videos, events, and tours.
US. Partnerships with various public arts organizations. 12
11. Field Trip Developed by Google. Contains art, architecture, food, culture, and historical information from many sources
Global ~100 for art
12. Fontly Capture, map and share vintage typography. Web application is view only.
World ~200
13. Gone Tomorrow SF Map and directions to street art San Francisco Bay Area ~25 14. Graffiti Mapper Map graffiti United States 0

21
Name (an “*” indicates the application does not work)
Description Extent #SF locations
15. Hong Kong Art Guide Art exhibitions and news in Hong Kong Hong Kong 0 16. Laguna Beach Public Art
Map 65+ Public art locations in Laguna Beach Laguna Beach 0
17. ExperienceLA.com Public Art LA*
ExperienceLA.com Public Art and Historic Sites mobile application pilot project focuses on select art pieces and historic locations in Downtown L.A.
Los Angeles 0
18. Mural Locator News, events, mural gallery, and map of murals around the world
World ~50
19. NYC Subway Art* Graffiti and Street Art New York City 0 20. PDX Art Trekker 475 public art pieces in Portland, OR Portland, OR 0 21. Privately-Owned Public
Open Space (POPOS) and Public Art
Public art located in POPOS in San Francisco. Buildings or new additions over 25,00 sq feet are required to spend 1% of construction cost on Public Art
San Francisco 39
22. Project Neon New York Neon signs New York City 0 23. Public Art Finder Public Art Locations around San Francisco San Francisco ~50 24. Public Art Fund Brings free public art exhibitions to New York New York City 0 25. Public Art Locations* Geolocated tweets of public art to @PublicArtApp with
pictures using yfrog,twitpic, and lockerz San Francisco and Oakland 75
26. Public Art in Public Places Public art in Southern California Southern California 0 27. Public Art Omaha Public art in Omaha, NB Omaha, NB 0 28. Public Art PDX Public art in Portland via iPhone application Portland, OR 0 29. San Francisco Civic Art
Finder San Francisco Art Commission Public dataset San Francisco 600+
30. San Francisco Landmarks Google Map
Landmarks and landmark districts as defined by article 10 of the San Francisco Planning Code. Does not include landmarks such as statues and monuments.
San Francisco ~300
31. San Francisco Mural Project Google Map with pictures, description, title, location, and artist information
San Francisco and Oakland ~40
32. San Francisco Public Art – SF Art*
San Francisco Art Commission Public dataset San Francisco 600+
33. SF Arts.Org Art Events in San Francisco San Francisco 5 34. SF Mural Arts Online resource for murals in San Francisco. Murals
listed by neighborhood San Francisco 757+
35. SF Public Art San Francisco Public Art Commission dataset mobile application
San Francisco 600+
36. SFAC Public Art San Francisco Art Commission map of Public Art Projects. Last updated 2008, limited locations.
San Francisco and airport ~100
37. SF Street Art Map Street art locations primarily in Haight Ashbury, San Francisco
San Francisco ~25
38. SF Street Art 600 photos documenting 250 sites in San Francisco San Francisco, primarily SOMA, Mission, Tenderloin, and Nob Hill
250
39. Street Art SF Street Art Photos and locations - no map available US Unknown 40. SF's Secret Spaces and
Hidden Oases from SPUR Includes POPOS San Francisco 39
41. STQRY Art, culture, and historic sites. Global 65 SFAC artworks
42. The Living New Deal New Deal public works projects in the US. More than public art and architecture. 322 projects for San Francisco some of which are art and architecture.
US ~90
43. Tram Art* Art in the vicinity of Amsterdam’s trains Ansterdam 0 44. 1:AM Mobile Application Archive of street art movement and community of
street art enthusiasts. Global ~2000
22
Appendix A.2 contains the client and mapping platform details for each application. Google
Maps dominated as the mapping platform of choice for thirty-six applications. Mapbox, Mapquest,
and Leaflet with Open Street Maps each provided the platform for one application. One application
uses Apple Maps. Two applications did not contain maps. One application had an unknown
mapping platform, as the program did not load.
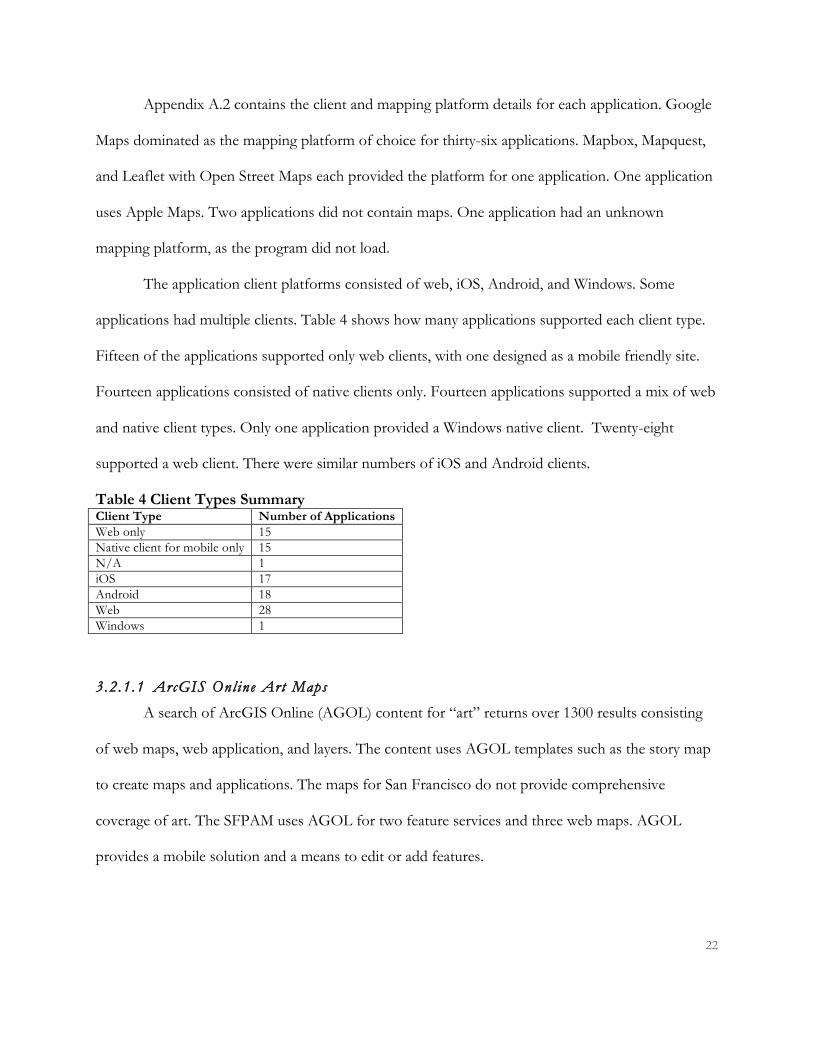
The application client platforms consisted of web, iOS, Android, and Windows. Some
applications had multiple clients. Table 4 shows how many applications supported each client type.
Fifteen of the applications supported only web clients, with one designed as a mobile friendly site.
Fourteen applications consisted of native clients only. Fourteen applications supported a mix of web
and native client types. Only one application provided a Windows native client. Twenty-eight
supported a web client. There were similar numbers of iOS and Android clients.
Table 4 Client Types Summary Client Type Number of Applications Web only 15 Native client for mobile only 15 N/A 1 iOS 17 Android 18 Web 28 Windows 1
3.2.1.1 ArcGIS Online Art Maps
A search of ArcGIS Online (AGOL) content for “art” returns over 1300 results consisting
of web maps, web application, and layers. The content uses AGOL templates such as the story map
to create maps and applications. The maps for San Francisco do not provide comprehensive
coverage of art. The SFPAM uses AGOL for two feature services and three web maps. AGOL
provides a mobile solution and a means to edit or add features.

23
3.2.2 Publ i c Art Content , VGI, and Soc ia l Media Appendix A.3 contains an assessment of each application for public art commission content,
VGI, and social media usage. This section summarizes the results.
Did the application intentionally include a public art commission dataset? Twenty-two of the
applications included a full or partial public art commission dataset. Twelve of the applications used
the San Francisco Arts Commission dataset.
Did the application include art events? Nine applications included information on art events,
two of which contained San Francisco events. One, sfarts.org, focuses primarily on cultural events in
San Francisco.
Did the application solicit user contributions of art locations? Thirteen of the applications
solicit art locations from users, with ten including locations in San Francisco. For applications that
allowed art submissions by users, nine (six for San Francisco) required administrative review before
being added to a map. One reviewed submissions only if flagged by other users for inappropriate
content.
What kind of community VGI such as comments, ratings, photos, likes, or flag for offensive
could a user contribute? Sixteen applications allowed users to comment, rate, like, submit a photo,
or flag entries. Seven applications had the capability for users to add comments or photos.
Did any application use social media as a data source for content? Only one application,
Public Art Locations, requested that users post content to their map via Twitter address
@PublicArtApp. This reflects a conscious choice of the user to post content to the application and
the application consists only of Twitter data posted to the account. The application is no longer
running. None of the applications use Flickr, YouTube, Instagram, or Panoramio as dynamic data

24
sources. None of the applications reuse social media data as a mashup or in a manner unforeseen by
the original contributor.
Can the user share an art location or the web map with others using social media? Seventeen
of the applications allow users to share a map location or art event using social media. The most
common outlets are Twitter and Facebook.
3.2.3 Mapping Funct ional i ty Appendix A.4 describes basic mapping functionality for each application. This section
summarizes the results.
Is the application map or location focused? The map should be easy to find and display all
features when filtering is off. Thirty applications were location and map focused; the remainder
either had no map, a difficult to find or use map, or a map for a single selected entry.
Are basic navigation tools available such as panning and zooming? Almost every map
provided basic navigation tools to pan and zoom, with six exceptions.
Is there any capability to search features by attribute? Twenty-nine applications provided a
range of search options. Some applications provided filtering by prescribed choices, for example a
pull-down list of neighborhoods. Some allowed users a free text-based search. Others searched for
nearby, highly rated, or most recent entries. Three of the applications generated search results in a
list that could not be displayed using a map.
Is there layer control to toggle data display? Surprisingly only four applications, Field Trip,
Privately Owned Public Open Space (POPOS) and Public Art, SF’s Secret Spaces and Hidden Oases
from SPUR, and STQRY allowed the user to turn layers on an off.
25
Can a user choose a different basemap display? Twenty –one or less than half provided the
user the ability to change the basemap display. Some maps allow the user to bring up Google Street
View.
Are points displayed as clusters or is point selection buffered to choose overlapping points?
Eight of the applications either buffered point selection or clustered densely populated locations.
Can the user access navigation tools to find a route to a location? Seventeen of the
applications allow the user to generate navigation instructions to a location.
3.2.4 Limitat ions o f Appl i cat ions Using the SFAC Publ i c Art Datase t San Francisco Public Art-SF Art, San Francisco Public Art Finder, San Francisco Civic Art
Finder, and San Francisco Public Art are mobile applications that use only the full SFAC dataset.
San Francisco Public Art-SF Art does not run. The other three applications have imported the
dataset into a mobile framework with little correction or restructuring of the data. San Francisco
Public Art has linked images to several sites and corrected the locations of some art works.
Public Art Finder no longer returns data, as of 29 November 2013. Privately Owned Public
Open Space (POPOS) and Public Art, Culture Now, SF Arts.Org, have fewer than 20 SFAC
locations. SF Mural Arts focuses on murals in San Francisco. The SFAC Public Art map is outdated,
spatially inaccurate, and covers a subset of the organization’s collection.
Both STQRY and Field Trip, include a subset of the SFAC art locations. STQRY initially
published twenty-six art locations. Eight of the locations were off by several blocks to a mile.
STQRY has corrected the initial entries and expanded the offering to sixty-five entries as of 29
November 13. Entries include images and descriptions.
Field Trip contains over 150 SFAC art works. Most have associated images, a detailed
description and Google has improved or changed the accuracy of many of the points. The data is

26
not accessible outside of the mobile application, so only visual inspection of data is possible. While
Field Trip appears to contain the most spatially accurate subset of SFAC data points for any
application, several still appear to be incorrectly located. Field Trip contains datasets from multiple
sources covering topics such as architecture, historic places, lifestyle, offers, food, art, and museums.
While the application doesn’t narrowly focus on a particular type of art, the interface is complicated
and sluggish. The user has to scroll through many dataset options to narrow what is shown.
3.3 Value of the SFPAM
The SFPAM provides a comprehensive local art map that broadly defines public art. The
combination of datasets and the model of three curation levels are unique to the SFPAM among art
applications. No art application uses social media as a dynamic data source. The SFPAM expands
the functionality of the PIM by adding Instagram and Panoramio as social media layers. By changing
the search parameters for social media, a user can add hundreds of additional results to the art map.
Social media can capture art that is not part of an institutional dataset because the art is new, not
sponsored or tracked by an institution, or illegal. By querying social media, users can also view art
that may have been removed.
Stamen Design produces three beautiful basemaps called Watercolor, Toner, and Terrain.
The SFPAM consumes Stamen Design web map tiles and provides them as basemap choices to
users. Stamen Design basemaps are unique to the SFPAM as an art map. The SFPAM was also the
first application using the Esri JavaScript API to incorporate Stamen Design web map tiles as a
basemap choice. Users have the flexibility to change the look of the map and the results through
layer controls, social media configuration, and basemap choice.

27
Outside of AGOL maps, the SFPAM is the only application built on Esri technology, as the
majority of applications use Google maps. SFPAM leverages AGOL to provide a mobile solution
with ArcGIS for Mobile and Collector. Through AGOL and the mobile applications, users can
submit or edit art and building locations without modifying backend data. The architectural design
of the SFPAM enables incremental improvements to data quality without impacting the user.

28
Chapter 4: Methodology This chapter describes the methodology for developing the SFPAM. Section 4.1 documents the
technology and system architecture used by the application for web and mobile. Use cases are found
in Section 4.2. Section 4.3 details the application development process. Section 4.4 shows the data
model and geodatabase schema implementation. Section 0 lists data sources and services.
Application evaluation methods and requirements are discussed in Section 4.6.
4.1 Technology and System Architecture The SFPAM consists of three client products: a web application, a proof of concept iOS
native mobile application, and an ArcGIS Online (AGOL) for organizations map. The AGOL map
is accessible through web browser, Esri ArcGIS mobile client, and Esri Collector. The AGOL map
allows an authorized user “create, read, update and delete” (CRUD) permission depending on
Representational State Transfer (REST) service configuration. Art data can be updated in the field
using a mobile device or at a desktop using the AGOL web interface.
4.1.1 Backend Serv i c es The SFPAM uses ArcGIS Server 10.1 and 10.2 to provide REST services and mapping
functionality. There are two environments providing REST services. The test REST services
environment consists of a Windows Server 2008 R2 SP1 virtual server, nmilholl.usc.edu. The server
is hosted at the University of Southern California (USC). Services are created from ArcMap 10.1
Map Exchange Document (MXD) files using shapefiles and file geodatabase feature classes. Services
are shared through the http://nmilholl.usc.edu:6080/ArcGIS/rest/services/ endpoint. These
services are read-only. The test environment provides a quick way to share datasets as services to the
SFPAM without requiring the data to conform to a data model. Currently the SFPAM web
application consumes these read-only services.

29
The production environment consists of a Windows Server 2008 R2 SP1 virtual server. The
database backend uses Microsoft SQL Server 2008 R2 with ArcSDE. Services are created from
ArcMap 10.2 MXD files and a database connection to sfpubart. Services are shared using the
http://maps2.ccsf.edu/arcgis/rest/services/SFPUBART endpoint. The production environment
will provide services following the completion of this thesis so that the SFPAM remains publicly
accessible.
4.1.1.1 Users and Permiss ions Conf igurat ion in the Product ion Environment
A Microsoft SQL Server 2008 geodatabase, sfpubart, was created on the production server
database instance using ArcMap 10.2. The database currently is not versioned. In addition to the
database owner, a database user gisManager was created with CRUD permissions. User gisManager
was mapped to a user in the GIS Server Manager Identity Store and given Administrator
permissions.
4.1.2 Web Appl i cat ion Archi te c ture Figure 1 shows the high-level architecture diagram for the web-based application. Three
domain names were purchased to be the entry point for the web application front end:
sfpublicart.com, sfpublicart.org, and sfpublicart.net. The domains are hosted in the cloud and
resolve to the same location provided by the web hosting service. The webhosting x86_64 virtual
server runs Linux kernel 2.6.32. The web application uses hypertext markup language (HTML),
cascading style sheets (CSS), JavaScript, ArcGIS API for JavaScript 2.7, and the Dojo toolkit.
A client web browser accesses the application through www.sfpublicart.com,
www.sfpublicart.org, or www.sfpublicart.net. The application has JavaScript configuration files that
specify which mapping, feature, basemap, and social API services to load and display. Loading of
data is asynchronous, so the user is able to view information on the map display while requests are
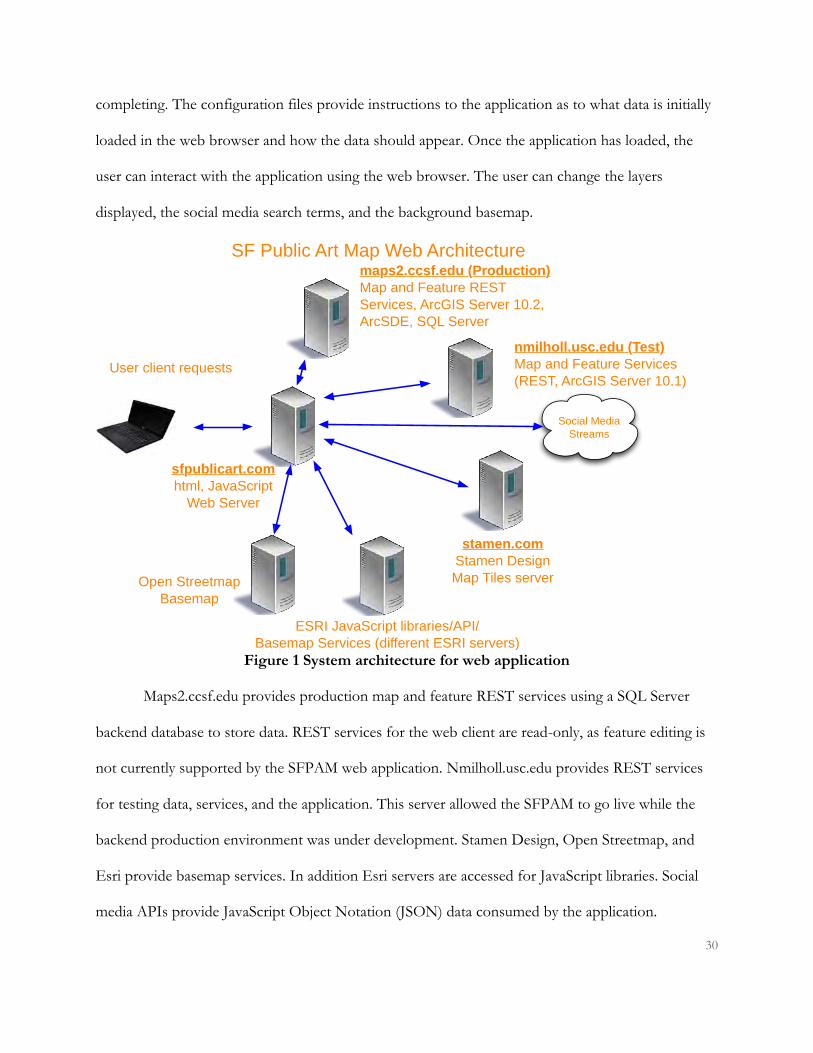
30
completing. The configuration files provide instructions to the application as to what data is initially
loaded in the web browser and how the data should appear. Once the application has loaded, the
user can interact with the application using the web browser. The user can change the layers
displayed, the social media search terms, and the background basemap.
Figure 1 System architecture for web application
Maps2.ccsf.edu provides production map and feature REST services using a SQL Server
backend database to store data. REST services for the web client are read-only, as feature editing is
not currently supported by the SFPAM web application. Nmilholl.usc.edu provides REST services
for testing data, services, and the application. This server allowed the SFPAM to go live while the
backend production environment was under development. Stamen Design, Open Streetmap, and
Esri provide basemap services. In addition Esri servers are accessed for JavaScript libraries. Social
media APIs provide JavaScript Object Notation (JSON) data consumed by the application.
sfpublicart.comhtml, JavaScript
Web Server
ESRI JavaScript libraries/API/ Basemap Services (different ESRI servers)
stamen.comStamen Design Map Tiles server
User client requests
maps2.ccsf.edu (Production)Map and Feature RESTServices, ArcGIS Server 10.2, ArcSDE, SQL Server
SF Public Art Map Web Architecture
Social Media Streams
Open StreetmapBasemap
nmilholl.usc.edu (Test)Map and Feature Services (REST, ArcGIS Server 10.1)

31
4.1.3 Mobile Appl i cat ion Archi t e c ture The native mobile application for Apple iOS development environment uses Xcode 4.6
integrated development environment (IDE) and Esri's ArcGIS Runtime SDK for iOS, Version
10.1.1.The architecture for the native mobile application is shown in Figure 2. The architecture
reflects a simpler scope of functionality, the pilot status of the application, and several technical
challenges. Esri’s SDK for runtime does not currently support map tile services for base maps from
Stamen Design. Social media JSON services are not included due to both programming complexity
and the time required to load data from services on a mobile device.
Figure 2 - Mobile application architecture
4.1.4 ArcGIS Online (AGOL) Archi t e c ture Incorporating AGOL with the existing SFPAM architecture provides flexible and quickly
configurable options for sharing data on multiple devices for editing. Maps created in AGOL for
ESRI Basemap and ArcGIS Services
iOS 6.xNative Application
maps2.ccsf.eduMap and Feature RESTServices, ArcGIS Server 10.2, ArcSDE, SQL Server
Open StreetmapBasemap Service
SF Public Art Mobile Application Architecture

32
Organizations can be shared as a web map and also as a feature service. By combining CRUD REST
services using a backend database with an AGOL map configured for CRUD or create, read, update
(CRU), editing of art POIs can be performed using different devices and interfaces. Esri ArcGIS
for Mobile or Esri Collector for Mobile can be used to collect and update data in the field. The
AGOL map can also be consumed by native mobile applications using the ArcGIS Runtime SDK.
Desktop clients can access the map through a web browser or ARCGIS for Desktop. An AGOL
web map can be shared as a feature service to hide the backend REST service from users. Empty
feature services can be created, associated with a map template and used to allow contributions from
users without changing data stored in the database. These contributions can be reviewed and
incorporated into the feature set by an administrator.
Figure 3 shows the architecture for incorporating AGOL with the SFPAM environment.
AGOL maps were created to consume maps2.ccsf.edu REST services. The maps were configured to
enable editing via web and mobile clients using Esri native applications for iPhone to collect data,
store photographs, and update existing data for art and building POIs.
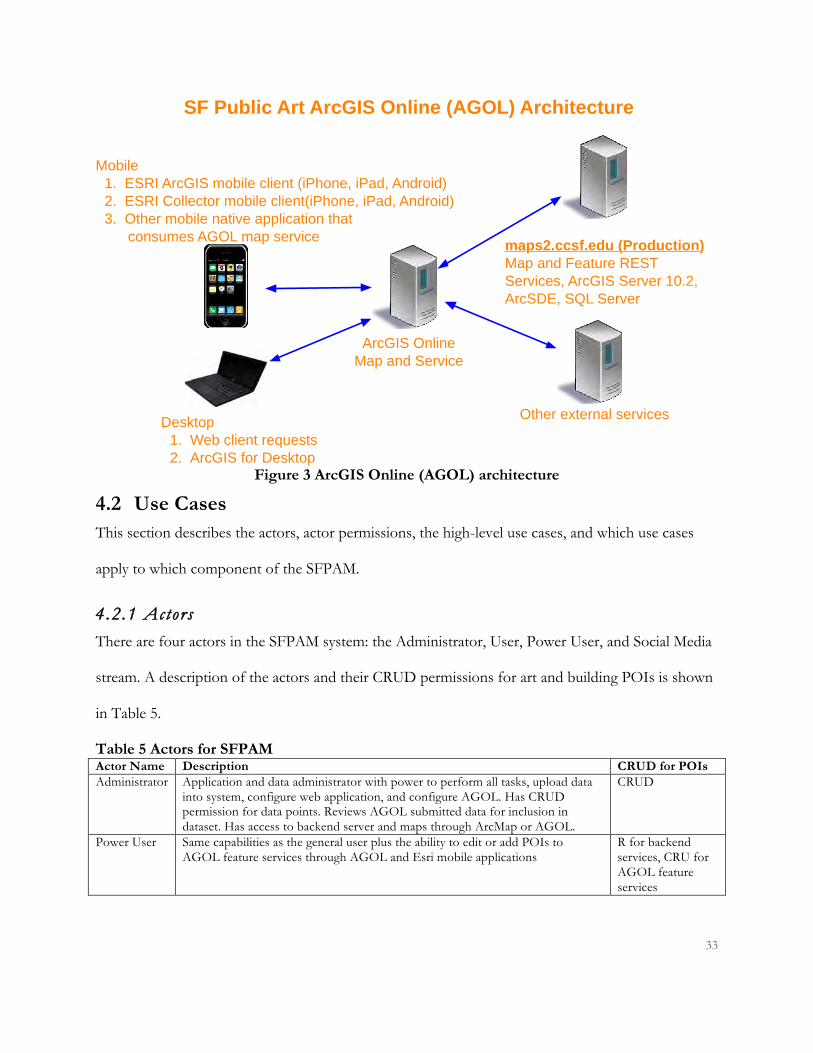
33
Figure 3 ArcGIS Online (AGOL) architecture
4.2 Use Cases This section describes the actors, actor permissions, the high-level use cases, and which use cases
apply to which component of the SFPAM.
4.2.1 Actors There are four actors in the SFPAM system: the Administrator, User, Power User, and Social Media
stream. A description of the actors and their CRUD permissions for art and building POIs is shown
in Table 5.
Table 5 Actors for SFPAM Actor Name Description CRUD for POIs Administrator Application and data administrator with power to perform all tasks, upload data
into system, configure web application, and configure AGOL. Has CRUD permission for data points. Reviews AGOL submitted data for inclusion in dataset. Has access to backend server and maps through ArcMap or AGOL.
CRUD
Power User Same capabilities as the general user plus the ability to edit or add POIs to AGOL feature services through AGOL and Esri mobile applications
R for backend services, CRU for AGOL feature services
ArcGIS OnlineMap and Service
Other external services
maps2.ccsf.edu (Production)Map and Feature RESTServices, ArcGIS Server 10.2, ArcSDE, SQL Server
Mobile1. ESRI ArcGIS mobile client (iPhone, iPad, Android)2. ESRI Collector mobile client(iPhone, iPad, Android)3. Other mobile native application that
consumes AGOL map service
Desktop1. Web client requests2. ArcGIS for Desktop
SF Public Art ArcGIS Online (AGOL) Architecture

34
Actor Name Description CRUD for POIs User The general user who can navigate the SFPAM, change extent, display additional
information, change visible layers or basemap, and change the search configuration for the social media streams.
R
Social Media Provides on demand POIs that match search criteria in JSON format. Authenticates query using application key.
4.2.2 High Leve l Use Cases The high level use cases for the actors are shown in Figure 4. Users interact with the
application through navigation controls such as panning and zooming; locating an art POI on the
map; viewing detailed information about an art piece; sharing a map; and requesting navigation to an
art piece. Users control the display of information through configuring which layers are visible;
selecting a basemap for display; configuring which social media streams are visible; and adjusting a
social media stream’s query volume or search term.
A Power User logs into AGOL, Collector, or ArcGIS mobile using an account created in
AGOL. The account has access to a map containing SFPAM REST services with read (R)
permission and AGOL feature services with CRU permission. The Power User can add new POIs
or update existing POIs in the AGOL feature service layers.
An Administrator adjusts filters on social media streams to include or exclude art related
posts. The Administrator also approves user-submitted art locations following review for accuracy
and content and adds them to the backend geodatabase. Social media authenticates the application
using an application key code, if required. Social media also posts JSON pages to the SFPAM
application based on the submitted search request.

35
Figure 4 High-level use cases
System
2. Search/Locate Art
POI
User
1. Navigate Map
4. Find Location
5. Show/Hide Layers
6. Show/Hide Social
Media
8. Choose Basemap
3. View Detail
7. Submit New Art POI
15. Approve/Add Art POI
12. Set Social Media
Filter
Admin
SFPAM High Level Use Cases
Social Media
17. Authenticate
16. Post Media Stream
9. Share Map
10. Contact Admin
11. Request Navigation
13. Edit Art POI
Information/ LocationPower
User 14. Delete Art POI

36
Table 6 lists the use cases and the applicable actors. The table also shows which use case is
implemented for each component of the SFPAM. Stretch use cases are also indicated. These are
requirements that are desirable but may not be implemented in the current iteration of the SFPAM.
Table 6 Use Cases by Actor and SFPAM Component Use Case Name and Number Actors SFPAM Component
User Power User
Administrator via ArcMap, Source Code, AGOL, Collector, or ArcGIS Mobile
Social Media
Web Mobile AGOL, Collector, ArcGIS Mobile
1. Navigate Map X X X X X X 2. Search/Locate Art POI X X X X X X 3. View Detail X X X X X X 4. Find Location X X X X X X 5. Show/Hide Layers X X X X X X 6. Show/Hide Social Media
Layer X X X X
7. Submit New Art POI X X S S X 8. Choose Basemap X X X X X X 9. Share Map X X X AGOL,
ArcGIS for Mobile
10. Contact Administrator X X X S X 11. Request Navigation X X X S AGOL,
Collector 12. Set Social Media Filter X X X 13. Edit Art POI Information/
Location X X X
14. Delete Art POI X X 15. Approve/Add Art POI X X 16. Post Media Stream X X 17. Authenticate Social Media X X
The use cases drive the functional requirements for the SFPAM. Requirements are described
in Section 4.6.1.
4.3 Development Process The development process for the web, mobile, and AGOL components of the SFPAM are
discussed in the sections following.
4.3.1 Web Appl i cat ion Deve lopment Web application development, data preparation, and requirements development was done
on a Macintosh running OS 10.8.4. Parallels 7.1 provided a Windows 7 environment for Windows-

37
only applications. Aptana Studio 3, QSEE, Dreamweaver, MS Office, ArcDesigner, Firebug,
Firefox, Safari, and ArcMap client 10.1 and 10.2 were the primary development tools.
A Subversion source code repository in Subversion was created and linked to Aptana Studio
3. Major feature changes were checked into the repository following successful testing and
deployment.
Three domains, sfpublicart.com, sfpublicart.org, and sfpublicart.net were purchased and
associated with an existing hosted virtual server account, nmilholland.com. All resolve to an identical
document directory under nmilholland.com. The SFPAM code base was uploaded to the document
directory. Each URL was tested from a client to verify the web application was accessible and
running.
Web application code changes were tested on the local client and debugged. Changes were
then uploaded to the sfpublicart.com server. Affected server files were backed up, new files
deployed, and functionality tested using a client to access the webserver. If significant functionality
was being introduced, the production environment was cloned to a new directory, for example,
sfpublicart.com/deployment/test. Deployment and testing was performed on the cloned directory
prior to pushing changes to sfpublicart.com. Any minor file edits performed on the server were
copied back to the client development environment for check-in.
An iterative spiral method of testing and development was employed throughout the
development process. When new features were implemented, the application was tested to verify the
application loaded, existing functionality did not break, and the feature functioned as expected. The
firebug plug-in on Firefox was used to monitor errors and provide feedback on how to fix issues.

38
4.3.2 Data Serv i c e Deve lopment Process Data came from from multiple sources. Specific details regarding data sources are found in
Section 0. Data source formats included shapefile, comma separated variable (CSV), Keyhole
Markup Language (KML), Keyhole Markup Language Zipped (KMZ), JSON, and text scraped from
JavaScript or HTML files. One shapefile required projection to World Geodetic System 1984
(WGS84) Web Mercator Auxiliary Sphere. All other data sources required editing, formatting, or
processing in order to create a feature set. Some KML/KMZ files needed to be accessed at their
URL using Google Earth before they could be saved on the local client. One site limited
KML/KMZ downloads to 20 POIs per page, necessitating development of a Model Builder script
to process over 15 files. The Model Builder script is shown in Appendix B. Data was cleaned and
transformed in Excel and ArcMap.
Some external images referenced in HTML popup fields could be loaded if the HTML was
accessed from a client system. Once the HTML was loaded onto the sfpublicart.com web server, the
client could no longer load the image due to the image host’s disabling of hot linking. As a
workaround, the thumbnail images were loaded into a client browser, scraped from the browser
cache, and uploaded onto the sfpublicart.com website. Popup fields containing the harvested images
were configured so that clicking on the image directs the user to the original image site.
Data layers were brought into geodatabase feature sets. Services created on nmilholl.usc.edu
used file geodatabases and services created on maps2.ccsf.edu used data stored in the SQL Server
sfpubart geodatabase. Once data was cleaned, an ArcMap MXD file was prepared for publishing as a
REST service. The process for publishing production services from maps2.ccsf.edu was more
complex due to additional security configuration required with database connections, database users,

39
local Windows security, and the Server Manager Identity store. The SFPAM web, AGOL, or mobile
application was then configured to use the published service.
4.3.3 Infrastruc ture The test virtual server nmilholl.usc.edu required minor port, firewall, and directory
permission configuration changes to enable ArcGIS Server to publish services outside the firewall.
The production server required installation of licenses for 10.1 Esri product suite, ArcGIS server
10.1, ArcGIS Web Adaptor, and Microsoft Software updates. A geodatabase was created in the
existing SQL Server instance using ArcMap 10.1. The geodatabase was configured based on an
interpretation of the data model described in Section 4.4.1. The resulting geodatabase schema is
described in Section 4.4.2. Existing database users were given permissions in the database
comparable to permissions in existing databases. The web adaptor was configured to allow access to
Esri services to resolve to maps2.ccsf.edu instead of maps2.ccsf.edu:6080. New database
connections by database user were created from ArcMap to the geodatabase. Database connections
to MXD files were defined. A server connection from ArcMap to maps2.ccsf.edu was created and
the geodatabase registered with ArcServer.
Data was exported from the test environment to the production environment. Fields were
mapped to the data model, data imported into the geodatabase, and feature classes added to MXD
files. New services were created and published for use with AGOL, mobile clients, and the web
application.
Configuration of the production environment was challenging. IT changes, Microsoft
updates, power outages, network port configuration changes, license expiration, and incorrect DNS
server configuration were all system changes outside the control of the thesis project. The ArcGIS
server files were corrupted during the power outage. This contributed to long periods where the

40
REST services were unavailable or the ArcGIS Server service was unable to start. In August of 2013,
the ArcGIS environment was upgraded to 10.2, requiring additional configuration changes.
4.3.4 Web Feature Deve lopment The Esri PIM is a complex multi-file code base with multiple configuration options for
including REST services, configuring the display of REST services, defining REST service legends,
including basemaps, and including social media streams. Untangling the code to determine how to
change existing features or integrate new features proved challenging.
High-level use cases and nonfunctional requirements were defined to prioritize web
development. One nonfunctional requirement was to rebrand the PIM as an art map. shows the
visual difference between the PIM disaster map tracking earthquakes in Japan and the SFPAM,
pictured using the Stamen Design Toner basemap. References to natural disasters, icons, Public
Information Map, and REST services were removed from the code. Text and headings were
rewritten to refer to the San Francisco Public Art Map.
Figure 5 PIM disaster map and SFPAM
Code was developed to incorporate Stamen Design’s Terrain, Toner, and Water Color
basemaps as user configurable options. The visual textures of the Stamen basemaps provide a more
appropriate look as backgrounds to a map highlighting art. The Stamen maps are web tile maps, a

41
case not handled by the existing code. A nonfunctional requirement for the SFPAM was that new
features have functionality identical to similar features and code modifications maintain existing
functionality. Adding tile maps required code modifications for the main display, basemap
configuration, and the “Share” option. The “Share” option allows a user to share a URL containing
the current map configuration or to embed HTML with the map configuration.
Bing basemaps were removed as options given a change in licensing. The Esri Gray basemap
was added. Table 7 shows the files and integration required to configure basemaps and add web tile
map capability. Appendix D contains code snippets illustrating code changes required to include
Stamen Design basemaps.
Table 7 Basemap Integration File Name Basemap Integration: Description of Related Functionality about.html Contains text describing SFPAM application basemaps.js Configures which basemaps to include, their unique id, title, thumbnail image for legend,
copyright text, whether basemap is from OpenStreetMap or Stamen Design, and service URL.
application.js Contains text for social media sharing embed.html Calls embed.js, describes map contents embed.js Creates user interface for generating code to embed shareable map. index.html Contains text describing application mapBasemaps.js Gets list of basemaps, determines if initial basemap set by URL or from configuration,
interprets type of basemap and creates appropriate layer type such as OpenStreetMapLayer, WebTileLayer, or ArcGisTiledMapServiceLayer. Also defines a WebTileLayer class that inherits from the Esri TiledMapServiceLayer.
As REST services became available, the JavaScript layers.js file was updated to incorporate
the service, describe the layer, and define the legend. Multiple options for graphics rendering of
feature services are available: simple, class breaks, and unique value. Appendix E provides an
example of a REST service configured to use unique value rendering based on an attribute field.
Map REST services do not require configuration as they inherit symbology from their service.
Social media streams and APIs were assessed for inclusion. The PIM code included Flickr, Twitter,
and YouTube. SmugMug and Picasa were investigated and rejected as sources. SmugMug contained

42
beautiful pictures of public art in San Francisco, but also many wedding photographs tagged as art.
Picasa contained surprisingly few geotagged photos of art in San Francisco. Panoramio and
Instagram social media feeds were added to the application using search tags of “art” and “sfart”
respectively.
A new social media stream must be integrated into existing application functionality, even if
those capabilities are not used in the SFPAM. Table 8 describes the files that must be edited or
created to incorporate a new social media stream.
Table 8 Integrating a New Social Media API into the SFPAM File Name Social Media Integration: Description of Related Functionality about.html Contains text describing SFPAM application embed.js Creates user interface for generating code to embed shareable map. index.html Includes social media file such as instagram.js. instagram.js, panoramio.js
Contains constructor and methods for adding the Instagram/Panoramio social media stream to SFPAM.
main.js Global variables for layer names and parameters for sharing map. social.js Configures whether the social media stream is included at application launch. Defines title,
description, legend graphics, initial search terms and values. socialLayers.js Updates which layers are on or off based on whether checkbox is checked; calls social media
method to query API; manages layers; determines if social media should be displayed as cluster or heat map; updates social media layer; sets slider values for configuration popup; interprets social parameter settings if application has been shared and parameters for range, dates, and key words are in URL; and constructs the information/user configuration popup window for each social media stream.
tasks.js Interprets current map settings and create a URL or HTML with parameters describing the settings in order to share the map. Interprets values from URL and change map configuration to match.
userinterface.js Listens for user changes to configuration settings such as search term, date, or volume of information to return and request update of social media points.
Each new social media stream required a new JavaScript file to construct the social media
object and its methods. APIs differ as to input parameters, output fields, use of extent as a
parameter, and application key. Date and extent were not used to define the Instagram search due to
the API definition. In contrast, Flickr uses start date, end date, and extent to frame a query to the
API.

43
Instagram.js and panoramio.js were created to define options for constructing the json query
such as the maximum number of json pages to return, extent, key word for search, and the API
application key. The ArcGIS feature collection, geometry, fields, and popup window were also
defined. Behavior for user browser interactions such as “onClick” was specified. Methods were
coded to add layers, turn layers on and off, construct queries to the social media API, parse results,
determine which results contain XY coordinates, correct results, define popup window content, and
push results to a feature layer collection. The feature layer collection is added to an array for
processing and display as a cluster or a heat map based on initial application configuration or
runtime user choice.
4.3.5 Mobile Deve lopment An Apple iOS Developer Program one-year license was acquired. With the license,
provisioning profiles can be obtained to deploy applications to a developer’s iOS devices for testing.
The license also means a new application can be submitted to the App Store for distribution after
approval by Apple. Xcode 4.6 IDE and Esri's ArcGIS Runtime SDK for iOS, Version 10.1.1 were
downloaded to an Apple MacBook Pro Intel laptop running OSX 10.8.4. An iPhone 4s running
6.1.3 was used for testing applications in addition to the 6.1 simulators for iPhone and iPad. A first
generation iPad and an iPad mini were also available for testing.
Mobile iOS client development was chosen because of the availability of devices for testing
and the author’s interest in the technology. While the Android platform dominates the mobile
market globally and in the United States (phys.org 2013), the perception in San Francisco is that
iPhones dominate the San Francisco Bay Area market, (Rosoff 2013). The primary users of the
SFPAM should be in the San Francisco Bay Area.

44
Project iOS samples from Esri were downloaded and combined to consume REST services
and test implementation of functionality such as choosing a basemap, basic navigation controls, and
popup windows.
4.3.6 AGOL Deve lopment AGOL extends the SFPAM by providing a way to collect art data and pictures using either
web or mobile devices. Table 9 describes the steps taken to create three AGOL maps for
consumption by web clients and mobile devices. An AGOL for organizations account with
Administrator or Publisher privileges is required to create the maps described in Table 9.
Table 9 AGOL Configuration Steps AGOL Product
Administrator Steps ArcSDE REST Service
SFPAM Client Role
AGOL Account Type
CRU(D) Web Map or Application
Create Map Add REST services Configure symbology, popups, and layers Create two empty feature service based on existing art and building REST feature services. Configure new feature services so that users can edit or delete only features they create. Share publicly as map or application
Read-only REST services
Power User
Any AGOL user. Map can also be shared outside of AGOL.
CRU(D) Map for Mobile
Copy CRU(D) Web map. Configure popups to display images using fields with links instead of HTML. Share publicly as map
Read-only REST services
Power User
Any AGOL user. Must have an account to use ArcGIS mobile client. Other applications can use ArcGIS map id to use map service.
CRU(D) Web Map or Application
Create Map Add REST services Configure symbology, popups, and layers Keep map as private to Administrator.
CRUD Rest Services (with password access if Delete enabled)
Admin AGOL for Organization Publisher or Administrator
The first map was created using read-only REST services from the CCSF server with two
empty feature services: one feature service is based on the feature layer containing art, and the

45
second is based on the feature service containing buildings. This map also contains the art and
building feature layers.
Access to edit the map is restricted to users with an ArcGIS account. These Power Users can
add new art and buildings to the empty feature layers. The map is configured so that a user can only
edit features the user created in the AGOL feature service. This allows a group of Power Users to
add and edit new features for review by an administrator. The administrator can then import the
features into the production geodatabase. The Power Users cannot edit or add features to the
production geodatabase.
The group of Power Users can be restricted in the future to ArcGIS for Organization
accounts that have been added to a group with CRUD permissions to the ArcGIS feature layers.
Unfortunately, free ArcGIS accounts can’t be added to ArcGIS for Organizations groups.
A second map was created for mobile use, identical to the first except that different fields
were used to present image and image target links. Mobile applications do not interpret HTML text
for rendering. All ArcGIS user accounts can consume the map using ArcGIS for mobile. Only
ArcGIS for Organization accounts can use the Collector application. The AGOL map can also be
consumed by native client applications for Android or iOS.
The third map consumes CRU REST services from the CCSF server. If the services have
delete capability, they must be password protected. This map is only shared with the map publisher
account. The SFPAM administrator can use this map to edit art and building features using a client
other than ArcMap. Esri’s ArcGIS for mobile or Collector for mobile can be used in the field to
update a feature’s location, add a picture, or update attributes, as well as add new features directly to
the production database.
46
Each of the AGOL maps can be accessed using a web browser, Esri ArcGIS for mobile,
Collector, or ArcMap.
4.4 Data Model and Geodatabase Schema This section describes the data model and implementation as a geodatabase schema.
4.4.1 Data Model The normalized conceptual data model for the SFPAM is shown in Figure 6. Attributes are
documented in greater detail in Section 4.4.2 describing the geodatabase schema.
PUBLICART contains features and attributes describing art POIs. An entry may contain 1
to many entries in the ARTDATASOURCE table. The ARTDATASOURCE table contains
metadata from the art POI’s source of origin such as an organization’s unique id for the piece. An
agency may have multiple entries for a single art POI interest in the PUBLICART table, as there
may be multiple panels, pieces, or simply duplicates. From a user’s perspective, one entry is
sufficient. From an SFPAM administrative perspective duplicate entries need to be tracked in case of
future updates from an agency, as it is unknown which entry will be updated.
ARTTYPE describes art categories such as sculpture or mural. NEIGHBOHOOD provides
names of city neighborhoods. ORGANIZATION specifies names of organizations providing data
or responsible for managing art or buildings. PHOTO contains images of POIs. Since there can
potentially be a many to many relationship between photos and art or building POIs,
PUBLICARTPHOTO and BUILDINGPHOTO are used to normalize the joins.
ARTIST provides names and other descriptive information such as website for the primary
creator of a POIs. ARTISTTYPE describes whether the person is an artist or architect. BUILDING
contains architectural POIs such as historic landmarks, Privately Owned Public Open Space,
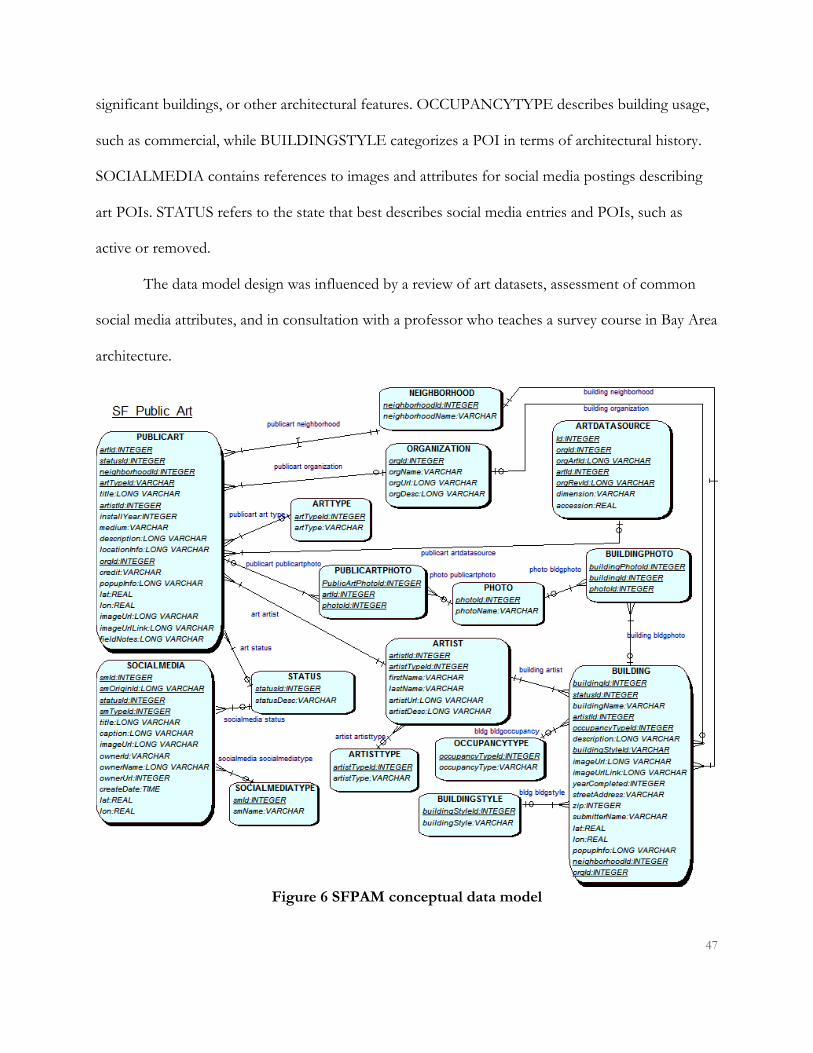
47
significant buildings, or other architectural features. OCCUPANCYTYPE describes building usage,
such as commercial, while BUILDINGSTYLE categorizes a POI in terms of architectural history.
SOCIALMEDIA contains references to images and attributes for social media postings describing
art POIs. STATUS refers to the state that best describes social media entries and POIs, such as
active or removed.
The data model design was influenced by a review of art datasets, assessment of common
social media attributes, and in consultation with a professor who teaches a survey course in Bay Area
architecture.
Figure 6 SFPAM conceptual data model

48
4.4.2 Geodatabase Schema The conceptual data model was translated into an ArcMap geodatabase schema and
instantiated in the sfpubart SQL Server database. Figure 7 shows the ArcDiagrammer visualization
of the schema. PUBLICART became the SFPubArt84M point feature class. Buildings and
ArtSource (ARTDATASOURCE) are also point feature classes. Neighborhoods became a polygon
feature class and a domain. PHOTOS became two attachment tables, one related to Buildings and
one related to SFPubArt84M. SOCIALMEDIA was dropped as a table as social media features are
generated on demand at run time. Some companies also have legal restrictions on storing social
media information in databases.

49
Figure 7 ArcDiagrammer Geodatabase Schema
The schema was simplified, as related tables can’t be used in current versions of Collector
and ArcGIS for Mobile. Remaining tables became domains, with the exception of ARTIST. Artist
and architect names are not normalized due to the complexity of handling related tables. Since there
are a large number of names, and the data is under review and revision, using a domain was not an
option. As the data quality and mobile applications mature, the schema choice for artist names will
be revisited.
Sections 4.4.2.1 to 0 describe the geodatabase feature classes, attributes, and domains in
greater detail.

50
4.4.2.1 Publi c Art (SFPubArt84M) Table and Fie lds
The SFPAM displays art POIs stored in the SFPubArt84M table using REST services. The
attributes are described in Table 10.
Table 10 SFPUBART84M (Public Art) Feature Class Fields Field Name Description Alias Type OBJECTID System generated unique id OBJECTID Esri OID artist Name of artist in Last Name, First Name
format. Artist String
artType Simplified category of type of art Art Type ARTTYPE Coded Value Domain
credit Credit for acquisition of POI Credit String description Description of art Description String fieldNotes Additional information or comments from
user submitting or updating data. Field Notes String
id Temporary field with original organization ID for art point. Field will be deleted after all duplicates identified and removed. Original information stored in ARTSOURCE feature class.
id org gen String
imageUrl URL to picture of art Image URL String String imageUrlLink Target URL for browser when image clicked. imageUrlLink String installYear Year art piece installed. Originally converted
from ARTSOURCE.accession if provided. Install Year Integer
locationInfo General location information about art piece. Location Information
String
medium Detailed information about art materials. Medium String neighborhood Neighborhood of art point Neighborhood NEIGHBORHOOD
Coded Value Domain organization Organization that administers the art piece or
provided the dataset. Organization INSTITUTION
Coded Value Domain popupInfo HTML formatted information about art
piece provided by an organization that may take the place of structured fields. Multiple images can be referenced.
Popup Info String
GlobalID System generated unique ID GlobalID GlobalID status Status of art piece. Active is default. Status STATUS Coded Value
Domain
4.4.2.2 ARTSOURCE Table and Fie lds
The point feature class ARTSOURCE (Table 11) retains original information from datasets
such as an organization’s ID for a POI, the revision ID, and the original XY coordinates. Entries
may have a many to one relationship with SFPubArt84M as duplicates are identified and removed
from the SFPubArt84M table. This table is not shared as a REST service.

51
Table 11 ARTSOURCE Field Name Description Alias Type OBJECTID System generated unique id OBJECTID Esri OID accession Real number representing year of acquisition. Accession Date as
Real Double
artId artId matches OBJECTID of related entry in SFPUBART84M. Many to 1 relationship given duplicate entries.
Art Id SFPAM String
dimension Text describing art piece dimensions. Art Dimension String GlobalID System generated unique ID GlobalID GlobalID orgArtId Art Id from source Org Art Id String orgRevId Revision ID from source Org Revision Id String origLatY Original latitude/Y coordinate Original Latitude Y String origLongX Original longitude/X coordinate Original Longitude X String source URL or other information describing original
source for data Source of Data String
4.4.2.3 SFNeighborhoods Table and Fie lds
SFNeighborhoods (Table 12) is a polygon feature class that displays San Francisco
neighborhood boundaries and labels. The feature class is shared as a REST service. The feature class
was used to locate neighborhoods of POIs and fill in the SFPubArt84M .neighborhood attribute
field during initial data cleanup. The feature class was also used to provide most of the
NEIGHBORHOOD coded domain values. Neighborhoods outside of San Francisco are not
included.
Table 12 SFNeighborhoods Field Name Description Alias Type OBJECTID System generated unique id OBJECTID Esri OID neighborhood Name of San Francisco neighborhood SF Neighborhood String
4.4.2.4 Buildings Table and Fie lds
The Buildings table is a point feature class containing building, POPOS, and architectural
features of interest. Attributes are described in Table 13.
Table 13 Buildings Field Name Description Alias Type OBJECTID System generated unique id OBJECTID Esri OID architect Architect name. Default is “Unknown” Architect Name Coded Value

52
Field Name Description Alias Type address Address of building or architectural
feature Street Address String
description Description of building or feature Description String GlobalID System generated unique ID GlobalID GlobalID imageUrl URL to picture building or feature Url to picture of
building String
imgUrlLink Target URL for browser when image clicked.
imgUrlLink String
name Name of building or feature Building Name String neighborhood Neighborhood of art point Neighborhood NEIGHBORHOOD
Coded Value Domain occType Occupancy designation or type of
Privately Owned Public Open Space. Default is “Res”
Occupancy Type OCCTYPE Coded Value Domain
popupInfo HTML formatted information about building or feature provided by an organization that may take the place of structured fields. Multiple images can be referenced.
Popup Info String
source Organization that provided the information.
source INSTITUTION Coded Value Domain
studentName Optional name of student submitting building or feature
Student Submitter Name
String
style Style of building or feature. Default is “Other”
Building Style String
year Year building or feature completed. 0 for default or unknown
Year Completed YEAR Range Value Domain
zip Zip code where building or feature is located
Zip String
4.4.2.5 Domain Values
The domain values are described in Table 14. The descriptive value and code are provided.
In several cases the full list of domain values is found in Appendix.
Table 14 Domains used in Geodatabase Schema Domain Name Description Value and Code Domain
Type ARCHNAMES Names of prominent San
Francisco Bay Area architects. See F.1 for list of names. Coded Value
Domain ARTSTATUS Status of art POI Active
Duplicate Removed Restricted Unavailable
Coded Value Domain
ARTTYPE Simplified art type or medium Fiber Glass/Light Glaze/Mosaic Mural
Coded Value Domain
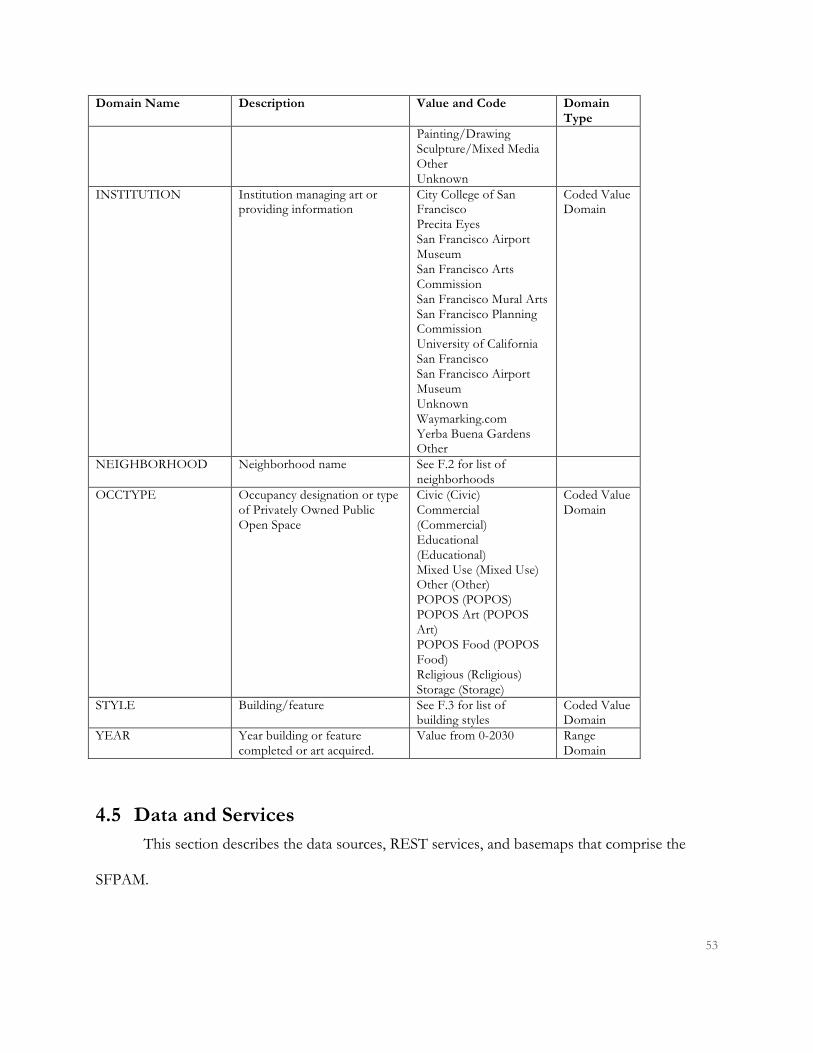
53
Domain Name Description Value and Code Domain Type
Painting/Drawing Sculpture/Mixed Media Other Unknown
INSTITUTION Institution managing art or providing information
City College of San Francisco Precita Eyes San Francisco Airport Museum San Francisco Arts Commission San Francisco Mural Arts San Francisco Planning Commission University of California San Francisco San Francisco Airport Museum Unknown Waymarking.com Yerba Buena Gardens Other
Coded Value Domain
NEIGHBORHOOD Neighborhood name See F.2 for list of neighborhoods
OCCTYPE Occupancy designation or type of Privately Owned Public Open Space
Civic (Civic) Commercial (Commercial) Educational (Educational) Mixed Use (Mixed Use) Other (Other) POPOS (POPOS) POPOS Art (POPOS Art) POPOS Food (POPOS Food) Religious (Religious) Storage (Storage)
Coded Value Domain
STYLE Building/feature See F.3 for list of building styles
Coded Value Domain
YEAR Year building or feature completed or art acquired.
Value from 0-2030 Range Domain
4.5 Data and Services This section describes the data sources, REST services, and basemaps that comprise the
SFPAM.
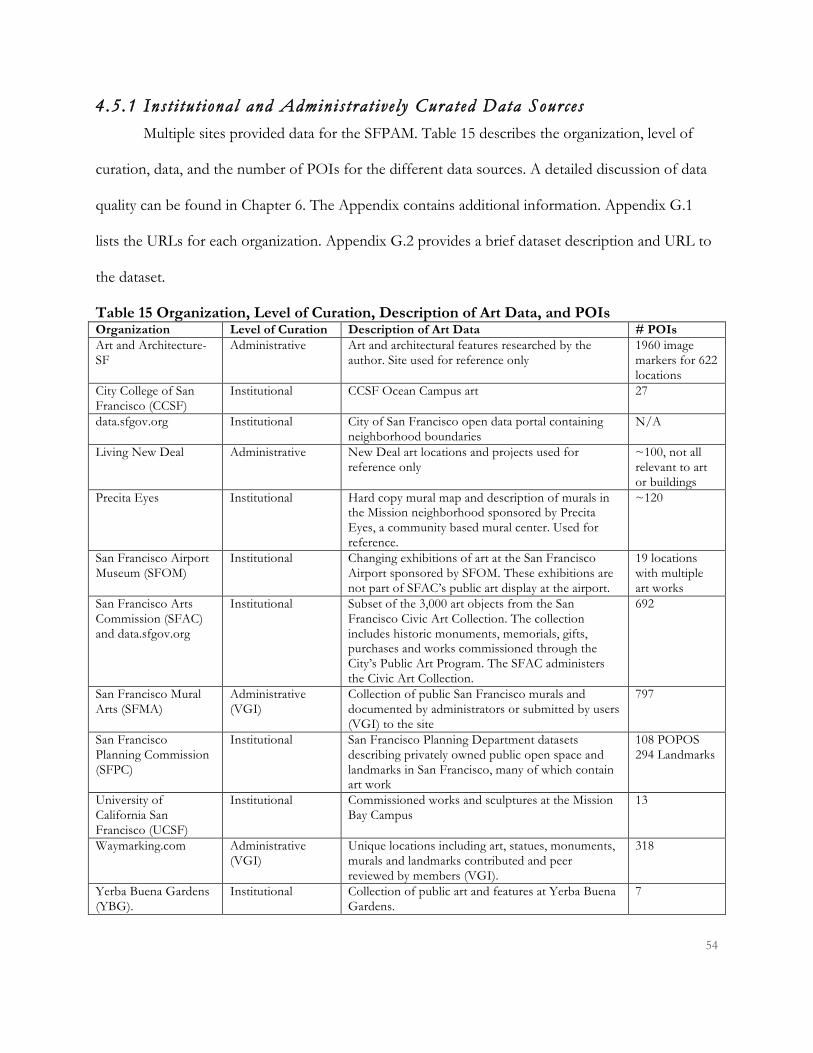
54
4.5.1 Inst i tut ional and Adminis trat ive ly Curated Data Sources Multiple sites provided data for the SFPAM. Table 15 describes the organization, level of
curation, data, and the number of POIs for the different data sources. A detailed discussion of data
quality can be found in Chapter 6. The Appendix contains additional information. Appendix G.1
lists the URLs for each organization. Appendix G.2 provides a brief dataset description and URL to
the dataset.
Table 15 Organization, Level of Curation, Description of Art Data, and POIs Organization Level of Curation Description of Art Data # POIs Art and Architecture-SF
Administrative Art and architectural features researched by the author. Site used for reference only
1960 image markers for 622 locations
City College of San Francisco (CCSF)
Institutional CCSF Ocean Campus art 27
data.sfgov.org Institutional City of San Francisco open data portal containing neighborhood boundaries
N/A
Living New Deal Administrative New Deal art locations and projects used for reference only
~100, not all relevant to art or buildings
Precita Eyes Institutional Hard copy mural map and description of murals in the Mission neighborhood sponsored by Precita Eyes, a community based mural center. Used for reference.
~120
San Francisco Airport Museum (SFOM)
Institutional Changing exhibitions of art at the San Francisco Airport sponsored by SFOM. These exhibitions are not part of SFAC’s public art display at the airport.
19 locations with multiple art works
San Francisco Arts Commission (SFAC) and data.sfgov.org
Institutional Subset of the 3,000 art objects from the San Francisco Civic Art Collection. The collection includes historic monuments, memorials, gifts, purchases and works commissioned through the City’s Public Art Program. The SFAC administers the Civic Art Collection.
692
San Francisco Mural Arts (SFMA)
Administrative (VGI)
Collection of public San Francisco murals and documented by administrators or submitted by users (VGI) to the site
797
San Francisco Planning Commission (SFPC)
Institutional San Francisco Planning Department datasets describing privately owned public open space and landmarks in San Francisco, many of which contain art work
108 POPOS 294 Landmarks
University of California San Francisco (UCSF)
Institutional Commissioned works and sculptures at the Mission Bay Campus
13
Waymarking.com Administrative (VGI)
Unique locations including art, statues, monuments, murals and landmarks contributed and peer reviewed by members (VGI).
318
Yerba Buena Gardens (YBG).
Institutional Collection of public art and features at Yerba Buena Gardens.
7

55
Locations and attributes for SFOM, UCSF, and YBG POIs were extrapolated from map
graphics, web descriptions, and site visits, as these organizations did not have georeferenced datasets
online.
San Francisco Neighborhoods and CCSF datasets were in shapefile format using California
State Plane Zone 3 Federal Information Processing Standard (FIPS) Zone 0403 projection. The
remaining datasets were either Excel files with X, Y coordinates or KMZ files that mapped to the
WGS84 Web Mercator Auxiliary Sphere projection. San Francisco Neighborhoods was converted to
a feature class called SFNeighborhoods in the geodatabase. The feature class retains the California
State Plane projection and is re-projected on the fly. The CCSF dataset attributes were transformed
to match the SFPubArt84M table and missing information filled in where possible.
The SFAC Excel spreadsheet required scrubbing prior to import. XY fields were in a single
column and needed to be split. Each item entry was reviewed and assigned an artType value. Data
was imported into a shapefile and processed further. Neighborhoods were calculated for each entry.
Points located far from San Francisco were moved to their correct location. The shapefile was
imported into the SFPubArt84M table. Location correction and enhancement of data is an ongoing
process facilitated through the use of mobile applications.
SFMA POIs were extracted from a JSON file. The name, image URL, SFMA id, and URL
for additional information on the SFMA website was constructed. PopupInfo was created from the
available fields. Initially a feature class was created and then the information was imported into the
SFPubArt84M feature class.
A search of Waymarking.com for art related POIs resulted in resulted in over 15 KMZ files.
The files were converted into geodatabase feature classes using the Model Builder script described in

56
Appendix B. The feature classes were combined in to one feature class and duplicate features
removed. The POIs were categorized by art type. Fields mapping to SFPubArt84M were created and
populated prior to importing to SFPubArt84M.
The SFPC provided three KMZ files for POPOS and historical landmarks. The KMZ files
provided HTML descriptions of the POIs but no other attributes. Neighborhood was calculated for
each entry. The features were converted from KMZ. POPOS, Food POOS, and Landmarks were
appended into the Buildings feature class. The HTML information was inserted into the popupInfo
field. Html data from KML files often needed editing to remove opening and closing brackets or fix
idiosyncrasies. ArcMap often could not edit the text with field calculator. Importing or cutting and
pasting ended up with truncated data. The field could only be corrected after import into an
ArcSDE database.
Art POPOS were added to the SFPubArt84M as they contain information about artwork.
The POPOS popupInfo fields needed to be split if there were multiple art pieces. The HTML was
simplified as the original fields exceeded 4000 characters, the character limit for SQL Server.
Art and Architecture-SF and Living New Deal provided detailed descriptions, images, and location
information that improved data quality of other datasets. These two sites made it easier to locate
pieces of art in the field when attributes from an SFAC entry were vague. The sites images for POIs
were particularly helpful in providing visual cues. Precita Eyes provided additional information such
as titles, locations, and artist names for a variety of murals.
PopupInfo fields required configuration in ArcMap to display correctly in the web
application. The template can be found in Appendix C.

57
4.5.2 SFPAM Servi c es ArcMap map documents were used to create REST services to publish backend database
features. Feature and map services were published as read-only for use with public maps. Definition
queries created layers to differentiate feature sources, such as POPOS. Art and buildings feature and
map services were created with CRU permission for administrative use in AGOL. The services,
layers, permissions, description and feature class are shown in Table 16. These services were used by
all the SFPAM client application components.
Table 16 Description of REST Services Service Layer
ID CRUD Description Feature Class
SFPUBART/Buildings Feature and map service
0 CRU Everything in the Buildings table
Buildings
SFPUBART/BuildingsRO/Buildings Feature and map service layer
1 R Everything in the Buildings table except POPOS
Buildings
SFPUBART/Neighborhood84MRO Feature and map service
0 R Neighborhood boundaries and labels.
SFNeigborhoods
SFPUBART/SFPubArt84MgrR0/POPOSArt Feature and map service layer
3 R Art POPOS POIs SFPubArt84M
SFPUBART/SFPubArt84MgrR0/SFMuralArts Feature and map service layer
0 R SFMA POIs SFPubArt84M
SFPUBART/SFPubArt84Mgr Feature and map service
0 CRU Everything in the SFPubArt84M table.
SFPubArt84M
SFPUBART/SFPubArt84MgrRO/SFPublicArt Feature and map service layer
1 R Everything in the SFPubArt84M table except SFMA and Waymarking.com POIs
SFPubArt84M
SFPUBART/ BuildingsRO/POPOS Feature and map service layer
0 R POPOS Buildings
SFPUBART/SFPubArt84MgrR0/Waymarking Feature and map service layer
2 R Waymarking.com POIs SFPubArt84M
4.5.3 Socia l Media Serv i c es The social media streams described in Table 17 were added as clustered points to the map.
Flickr and Instagram required API keys in order to do searches. Twitter was dropped due to the
OAUTH multiple hidden key requirements. The filters used for each API are listed, including the
initial keyword. Results are filtered for valid coordinate values, but not extent, before being added to

58
the social media layer. The application tracks the id required to perform callback queries and an
initial maximum page count of results is specified in the application configuration for each social
media stream. Fields extracted from the return results of each point vary by API, but can generically
be described as author, author’s social media home page URL, date of the post, image URL, title,
and description, comment or caption. Each social media stream is a feature layer service that can be
toggled on or off by the user. The user can change the configuration of the search keyword and the
volume of results. The volume of results changes either a time or page count variable used to
construct the search for an API.
Table 17 Social Media Data Sources (last accessed 13 December 2013) Social Media Description Security Search Generic Fields Extracted
Flickr Photo stream service and API; www.flickr.com
API Key Start date, end date, keyword of ‘art’, geotagged, extent, JSON page count
Author, author social media home page URL, date of post, and image URL, title, and description
Photo stream service and API; www.instagram.com
API Key Keyword of ‘sfart’ JSON Page count, recent
Author, author social media home page URL, date of post, and image URL, and first comment
Panoramio
Photo stream service and API; www.panoramio.com
N/A for search
Keyword of ‘art’ JSON page count, extent, order (recent), max number of results
Author, author social media home page URL, date of post, and image URL, and title
YouTube Video stream service and API; www.youtube.com
N/A for search
Keyword of ‘art’ JSON page count, max results, radius from extent mid point, YouTube time variable
Author, author social media home page URL, date of post, and image URL, title, and description
4.5.4 Basemaps Esri, Open Street Map, and Stamen Design provide basemap service layer choices for the
SFPAM. Table 18 lists the basemap and corresponding URLs for accessing the services. Esri Light
Gray and Satellite basemaps require both base and reference Map Servers. Open Street Map is
referenced through a specific OpenStreetMapLayer API call. The three Stamen Design maps call

59
tiled map services. Users can configure which map to display. The Stamen Watercolor basemap
loads by default.
Table 18 Basemap Services (accessed 11 December 2013) Basemap URL for Service or Tiled Map Service Esri Light Gray
http://services.arcgisonline.com/ArcGIS/rest/services/Canvas/World_Light_Gray_Base/MapServer http://services.arcgisonline.com/ArcGIS/rest/services/Canvas/World_Light_Gray_Reference/MapServer
Esri Satellite http://services.arcgisonline.com/ArcGIS/rest/services/World_Imagery/MapServer http://services.arcgisonline.com/ArcGIS/rest/services/Reference/World_Boundaries_and_Places/MapServer
Esri Topographic
http://server.arcgisonline.com/ArcGIS/rest/services/World_Topo_Map/MapServer
Esri World Street Map
http://server.arcgisonline.com/ArcGIS/rest/services/World_Street_Map/MapServer
Open Street Map
esri.layers.OpenStreetMapLayer API call used to create layer, no URL required
Stamen Terrain http://${0}.stamen.com/terrain/${1}/${2}/${3}.jpg Stamen Toner http://${0}.stamen.com/toner/${1}/${2}/${3}.png Stamen Watercolor
http://${0}.stamen.com/watercolor/${1}/${2}/${3}.jpg
4.5.5 AGOL Servi ces Two AGOL feature services were created for Power Users to contribute new building or art
locations without impacting the backend database. The service names and URLs are described in
Table 19.
Table 19 AGOL Services Service Name URL Add a New Building https://ccsfgis.maps.arcgis.com/home/item.html?id=62a8363e4c1d4d679e22dc0baff89925 Add New Art Points https://ccsfgis.maps.arcgis.com/home/item.html?id=5d296b9d6f60425a8e9b68f1bbd7d49d
4.6 Application Evaluation The application was evaluated according to the functional requirements described in Table
20 and the non-functional requirements described in Table 21. Functional requirements were based
on the high-level use cases. The requirements were written at a high level so that users of the system
can verify them through use of the application, also known as User Acceptance Testing (UAT). The

60
requirements were verified using the web, AGOL, or Esri mobile applications. The pilot iOS
application was not be tested, but screen shots are provided.
4.6.1 Funct ional Requirements The results of functional requirements testing are summarized in Section 5. Each
requirement in Table 20 was verified for the appropriate SFPAM component.
Table 20 Functional Requirements Use Case Requirement Number and Description Web (W), AGOL
(A), Esri Mobile (M)
1. Navigate Map 1.1 The system shall provide the capability to pan the map. W, A, M 1.2 The system shall provide the capability to zoom the map in and out. W, A, M
2. Search/ Locate Art POI
2.1 The system shall provide the capability to display art and building POIs on the map that a user can locate using navigation controls.
W, A, M
2.2 The system shall provide the capability to search the art database for POIs by title, artist/architect, or neighborhood; return a list of POIs matching the criteria; select a POI, and focus on the selected POI.
W (Stretch), A
3. View Detail 3.1 The system shall provide the capability to show detailed attribute information for a selected POI.
W, A, M
3.2 The system shall provide the capability to view multiple records at a selected point.
W (Stretch), A, M
4. Find Location 4.1 The system shall provide the capability to enter a location by name or address, select a location, and focus on the selected location.
W, A, M
5. Show/Hide Layers
5.1 The system shall provide the capability for a user to select feature layers to display or to hide.
W, A, M
6. Show/Hide Social Media Layer
6.1 The system shall provide the capability for a user to select social media layers to display or hide. The social media layers choices shall be Flickr, Instagram, Panoramio, and Youtube.
W
7. Submit New Art POI
7.1 The system shall provide the capability for Power Users or administrators to submit new art or architecture POIs. The submitter will be able to geolocate the POI and enter attribute information for the POI.
A, M
8. Choose Basemap
8.1 The system shall provide the capability for users to choose a basemap to display as background. The basemap choices will be Esri Light Gray, Esri Satellite, Esri Topographic, Esri World Street Map, Open Street Map, Stamen Terrain, Stamen, Toner, and Stamen Watercolor.
W
9. Share Map 9.1 The system shall provide the capability for users to share the map as a URL, embedded html, or to Facebook and Twitter. The configuration of the map shall be captured. Depending on the client, configuration will include visible layers, social media search terms, extent, and basemap choice
W, A, M
10. Contact Administrator
10.1 The system shall provide the capability to contact the application administrator through email.
W, A, M
11. Request Navigation
11.1 The system shall provide the capability for the user to request navigation directions to or from a selected POI.
A, M
12. Set Social Media Filter
12.1 The system shall provide the capability for the user to set the search terms for social media queries. Flickr search parameters will be start data, end date, and keyword. Instagram, Panoramio, and YouTube parameters will be a keyword and a volume indicator.
W
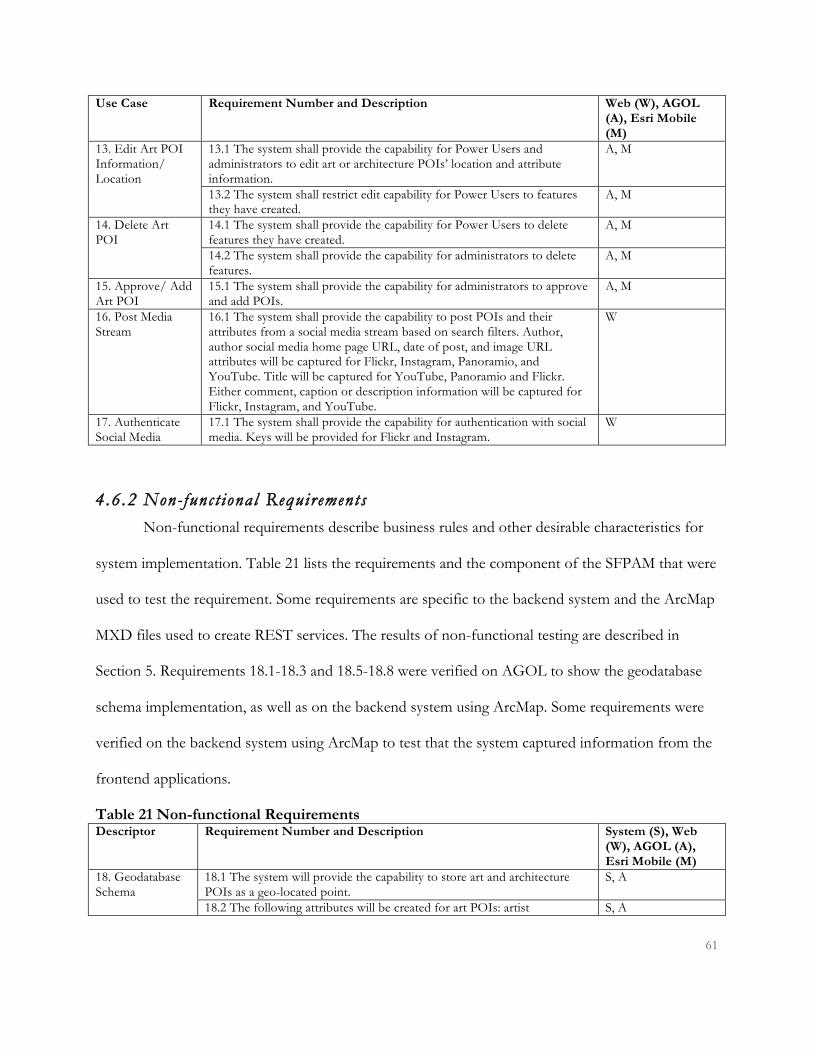
61
Use Case Requirement Number and Description Web (W), AGOL (A), Esri Mobile (M)
13. Edit Art POI Information/ Location
13.1 The system shall provide the capability for Power Users and administrators to edit art or architecture POIs’ location and attribute information.
A, M
13.2 The system shall restrict edit capability for Power Users to features they have created.
A, M
14. Delete Art POI
14.1 The system shall provide the capability for Power Users to delete features they have created.
A, M
14.2 The system shall provide the capability for administrators to delete features.
A, M
15. Approve/ Add Art POI
15.1 The system shall provide the capability for administrators to approve and add POIs.
A, M
16. Post Media Stream
16.1 The system shall provide the capability to post POIs and their attributes from a social media stream based on search filters. Author, author social media home page URL, date of post, and image URL attributes will be captured for Flickr, Instagram, Panoramio, and YouTube. Title will be captured for YouTube, Panoramio and Flickr. Either comment, caption or description information will be captured for Flickr, Instagram, and YouTube.
W
17. Authenticate Social Media
17.1 The system shall provide the capability for authentication with social media. Keys will be provided for Flickr and Instagram.
W
4.6.2 Non-funct ional Requirements Non-functional requirements describe business rules and other desirable characteristics for
system implementation. Table 21 lists the requirements and the component of the SFPAM that were
used to test the requirement. Some requirements are specific to the backend system and the ArcMap
MXD files used to create REST services. The results of non-functional testing are described in
Section 5. Requirements 18.1-18.3 and 18.5-18.8 were verified on AGOL to show the geodatabase
schema implementation, as well as on the backend system using ArcMap. Some requirements were
verified on the backend system using ArcMap to test that the system captured information from the
frontend applications.
Table 21 Non-functional Requirements Descriptor Requirement Number and Description System (S), Web
(W), AGOL (A), Esri Mobile (M)
18. Geodatabase Schema
18.1 The system will provide the capability to store art and architecture POIs as a geo-located point.
S, A
18.2 The following attributes will be created for art POIs: artist S, A

62
Descriptor Requirement Number and Description System (S), Web (W), AGOL (A), Esri Mobile (M)
artType, credit , description, fieldNotes imageUrl, imageUrlLink, installYear, locationInfo, medium, neighborhood, organization, popupInfo, status. 18.3 The following attributes will be created for architecture POIs: architect, address, description, imageUrl, imageUrlLink, name, neighborhood, occType, popupInfo, source, studentName, style, year, and zip.
S, A
18.4 The system will provide the capability to store images for POIs. S, A, M 19.5 The system will provide the capability to capture creator, create date, modifier, and last modified date.
S, A, M
18.6 The system will provide the capability to preserve the original id, revision id, location, and dimension for art POIs.
S, A
18.7 Each POI will have a unique id for the feature class and database. S, A 18.8 A geodatabase schema will be implemented based on the logical data model.
S, A
19. Preserve Functionality
19.1 The functionality of the original web application will be preserved. W 19.2. New functionality shall behave in a manner comparable to existing functionality. Stamen design basemaps, Esri Light Gray basemaps, Instagram, and Panoramio features will exhibit the same functionality as existing features.
W
20. Brand as Art Map
20.1 The PIM will be converted from a disaster map to an art map. References, layers, and imagery supporting a disaster map will be removed. The application will be renamed the San Francisco Public Art Map.
W
20.2 The web application will be hosted at sfpublicart.com, sfpublicart.org, and sfpublicart,net.
W
20.3 The application will support multiple layers of art or architecture features.
S, W, A, M
20.4 Help information will be rewritten to refer to the SFPAM contents. W 21. Display 21.1 The initial extent of the web application will be San Francisco S, W, A, M
22.2 The application will display neighborhood boundaries and names. Boundaries will be displayed at zoom levels below 1:250,000 and names will be displayed at zoom levels below 1:100,000.
S, W, A, M
21.3 Art POIs will be symbolized by art type. Art POPOS are symbolized as Art POPOS.
S, W, A, M
22.4 Building POIs will be symbolized by POPOS type or generic building.
S, W, A, M
21.5 Social Media POIs will either be represented by a cluster marker or symbolized by social media type.
W
22. Security 22.1 Users shall have read-only access to map features. W, A 22.2 Power Users shall have CR access to an empty feature class and UD for features they have created.
A, M
22.3 Administrators shall have shall CRUD access to map features. S, A, M
Since the SFPAM used existing application code, performance and web standards testing
was not performed.

63
Chapter 5: Results This section documents the application results for the SFPAM. The functional and nonfunctional
requirements’ testing results are summarized in 5.1 and 5.2. Additional details and screenshots
supplement the testing summaries. Changes made as a result of initial requirements testing are
described in 5.3. REST services are summarized in 5.4, SFPAM web application results shown in
5.5, and AGOL maps described in 5.6. The Esri mobile application implementation examples are
found in 5.7 and a mobile iOS pilot application is found in 5.8. The section concludes with 5.9, a
summary of functionality differences between the client applications.
5.1 Summary of Functional Requirements’ Test Results Table 22 summarizes the functional requirements’ testing results. Each requirement was
verified for the applicable client application. A ”No” or “N/A” result indicates that the requirement
was not tested for a particular client application. The test may not be applicable to the client; the
functionality only needs to be demonstrated in one environment; or the functionality was not
implemented in the client. A “Yes” result indicates the requirement was verified. The result is
summarized in the “Result Description” column with the last date of verification. Testing occurred
and concluded in August 2013. The final test results verified that the system functioned as expected.
Table 22 Functional Requirements’ Test Results Req #
Yes (Y)/ No (N) Result Description Verified Date Web AGOL Esri
Mobile 1.1 Y Y Y The user can pan the map 8/22/13 1.2 Y Y Y The user can use zoom controls for web interfaces and pinch
controls for mobile to zoom in and out. 8/22/13
2.1 Y Y Y The user can view art and building POIs in the San Francisco extent by using the zoom and pan controls to select points.
8/22/13

64
Req #
Yes (Y)/ No (N) Result Description Verified Date Web AGOL Esri
Mobile 2.2 N Y N Using AGOL a user can filter on art or building fields to return a
subset of results. The web and mobile system does not currently support the functionality to search the art database for POIs by title or artist/architect, return a list of POIs matching the criteria, select a POI, and focus on the selected POI.
8/22/13
3.1 Y Y Y A user can view a popup window with attribute information for the feature by selecting and clicking on a POI.
8/22/13
3.2 N Y Y A user can view multiple records by paging through popup windows when a location with multiple POIs is selected. Or by seeing a list of points selected. This capability is available for AGOL and the Esri Mobile applications. This functionality is not currently available for the SFPAM web application.
8/22/13
4.1 Y Y Y A user can enter a name or address, select a location, and focus on the selected location.
8/22/13
5.1 Y Y Y A user can turn feature layers on and off. 8/22/13 6.1 Y N/A N/A The user can turn Flickr, Instagram, Panoramio, and YouTube social
media layers on and off. 8/22/13
7.1 N/A Y Y A Power User with an AGOL account can add new features to the art or building feature service via a Power User map. The feature services store new features in AGOL, not the back end database. The Power User map is accessible through AGOL and Esri mobile applications. A user with Administrator privileges can access an administrator’s map through AGOL or Esri mobile applications. The administrators map allows the administrator to add new art or architecture POIs to the backend datasets.
8/22/13
8.1 Y Y N/A A user of the web application can choose from the following basemaps: Esri Light Gray, Esri Satellite, Esri Topographic, Esri World Street Map, Open Street Map, Stamen Terrain, Stamen, Toner, and Stamen Watercolor. An AGOL user can choose from Esri provided basemaps. The Stamen Design 8/22/13 basemaps are available as layers that can be turned on or off to hide the Esri basemap. Mobile users can select from Esri provided basemaps. Mobile does not have the capability to use the Stamen Design web tile layers.
8/22/13
9.1 Y Y Y/N Users can share the map as a URL, embedded HTML, or to Facebook and Twitter. The configuration of the map shall be captured including visible layers, social media search terms, extent, and basemap choice. Collector users cannot share a map.
8/22/13
10.1 Y Y Y Users can contact the administrator via email. An email link is provided in the web application about.html. An email address is included in the details about the map for AGOL and Esri mobile applications.
8/22/13
11.1 N/A Y Y/N The user can request navigation directions to or from a selected POI using the Esri Collector application.
8/22/13
12.1 Y N/A N/A The user can set the search terms for social media queries. Flickr search parameters are start date, end date, and keyword. Instagram, Panoramio, and YouTube parameters are a keyword and a volume of information indicator.
8/22/13
13.1 N/A Y Y Power Users and administrators can edit art or architecture POIs, location and attribute information. Collector users must have an ArcGIS for Organizations account.
8/22/13

65
Req #
Yes (Y)/ No (N) Result Description Verified Date Web AGOL Esri
Mobile 13.2 N/A Y Y Power Users can only edit features they have created. 8/22/13 14.1 N/A Y Y Power Users can only delete features they have created. 8/22/13 14.2 N/A Y Y Administrators can delete features. 8/22/13 15.1 N/A Y Y Administrators can evaluate POIs, and approve them by adding
them to the backend datasets. Administrators can then delete them from the user populated feature sets.
8/25/13
16.1 Y N/A N/A The system can post POIs and their attributes from a social media stream based on search filters. Author, author social media home page URL, date of post, and image URL attributes can be for Flickr, Instagram, Panoramio, and YouTube. Title will be captured for YouTube, Panoramio and Flickr. Comment, caption or description information can be captured for Flickr, Instagram, and YouTube.
8/22/13
17.1 Y N/A N/A The system is able to authenticate with Flickr and Instagram. 8/22/13
5.2 Summary of Nonfunctional Test Results Table 23 summarizes the nonfunctional requirements testing results. Each requirement was
verified for the backend system or the applicable client application. ”N/A” indicates that the
requirement was not applicable for the particular client application or that the requirement only
needed to be verified on one client to demonstrate a system capability provided by the backend. A
“Yes” result indicates the requirement was verified. The result is summarized in the “Result
Description” column, and a last verified date provided. Testing occurred and concluded in
September 2013. The final test results verified that the system functioned as expected.
Table 23 Non functional Requirement Results Req #
Yes (Y)/ No (N) Result Description Verified Date Sys. Web AGOL Esri
Mobile 18.1 Y N/A Y N/A The system provides the capability to store art and
architecture POIs as geolocated points. 9/23/13
18.2 Y N/A Y N/A The following attributes can be stored for art POIs: artist, artType, credit, description, fieldNotes imageUrl, imgUrlLink, installYear, locationInfo, medium, neighborhood, organization, popupInfo, status.
9/23/13
18.3 Y N/A Y N/A The following attributes can be stored for building POISs: architect, address, description, imageUrl, imageUrlLink, name, neighborhood, occType, popupInfo, source, studentName, style, year, and zip.
9/23/13
18.4 Y N/A Y Y Images can be stored in the system for POIs. 9/23/13 18.5 Y N/A Y Y The backend system captures and stores creator, create 9/23/13

66
Req #
Yes (Y)/ No (N) Result Description Verified Date Sys. Web AGOL Esri
Mobile date, modifier, and last modified date for art and building features. AGOL hosted feature services store creator, create date, modifier, and last modified date for art and building features.
18.6 Y N/A Y N/A The ARTSOURCE table preserves the original id, revision id, location, and dimension for art POIs.
9/23/13
18.7 Y N/A Y N/A Each POI has a unique id for the feature class and database in the form of a system generated GlobalID.
9/23/13
18.8 Y N/A Y N/A The geodatabase was implemented based on the logical data model.
9/23/13
19.1 N/A Y N/A N/A The functionality of the original application was preserved. 9/23/13 19.2 N/A Y N/A N/A New functionality behaves in a manner comparable to
existing functionality. Stamen design basemaps, Esri Light Gray basemaps, Instagram, and Panoramio features exhibit the same functionality as existing features.
9/23/13
20.1 N/A Y N/A N/A The PIM was converted from a disaster map to an art map. References, layers, and imagery supporting a disaster map were removed. The application was renamed the San Francisco Public Art Map.
9/23/13
20.2 N/A Y N/A N/A The web application is hosted at sfpublicart.com, sfpublicart.org, and sfpublicart.net.
9/23/13
20.3 Y Y Y Y The application supports multiple layers of art or architecture features.
9/23/13
20.4 N/A Y N/A N/A Help information was rewritten to refer to the SFPAM contents.
9/23/13
21.1
Y Y Y Y The initial extent of the web application is San Francisco. 9/23/13
21.2 Y Y Y Y The application displays neighborhood boundaries and names. Boundaries are displayed at zoom levels below 1:250,000 and names are displayed at zoom levels below 1:100,000.
9/23/13
21.3 Y Y Y Y Art POIs are symbolized by art type. Art POPOS are symbolized as Art POPOS.
9/23/13
21.4 Y Y Y Y Building POIs are symbolized by POPOS type, as Landmark, or generic building.
9/23/13
21.5 N/A Y N/A N/A Social Media POIs are represented by a cluster marker or symbolized by social media type.
9/23/13
22.1 N/A Y Y N/A Users have read-only access to map features. 9/23/13 22.2 N/A N/A Y Y Power Users have CR access to an empty feature class and
UD for features they have created. 9/23/13
22.3 Y N/A Y Y Administrators have create, read, update, and delete (CRUD) access to map features.
9/23/13
5.3 Changes Based on Initial Requirements Testing As a result of preliminary requirements testing, several changes were incorporated into the
design and implementation of the SFPAM prior to final verification testing.

67
Coded value domains displayed differently depending on the client application. The domains
were recoded so that the description matched the code value. The neighborhood domain was
expanded to include values for areas such as Alcatraz and the San Francisco Airport (SFO).
The SFPAM web application and AGOL map popups interpret HTML code embedded in
fields correctly for display, but mobile applications simply display the raw HTML code. In particular,
HTML code did not display images on mobile devices. This led to several changes in order to
correctly display images on mobile devices.
A field to complement the existing image URL field was created in the Building and
SFPUBART84M tables. The new image URL link field provides the capability to store a different
target location for the browser when an image is clicked.
A new AGOL map was created and configured specifically for mobile. The map uses image
URL and image URL link fields to display images instead of referencing the popupInfo fields for
building and art features.
Data was extracted from the popupInfo fields to populate image URL and image URL link
fields in the backend database. Additional unstructured text was extracted from the popupInfo field.
This populated blank fields to improve data quality and visibility for mobile devices. For example,
landmark features contained image URL, address, date of construction, building name, and architect
name embedded in the popupInfo field. While web applications could view this data in an easily
readable formatted way, the mobile applications provided a long HTML string.
The popupInfo field in the Building and SFPUBART84M tables was configured to the SQL
Server maximum value of 4000 characters to accommodate long HTML fields from multiple data
sources. The HTML content was revised and reformatted for several hundred records as the content
exceeded 4000 characters. Requirements testing revealed a bug in ArcMap, the ODBC driver, or

68
SQL Server as the system no longer accepted inserts to the Building and SFPUBART84M tables.
The fields were dropped, recreated with a value less than the maximum character length, and
repopulated.
Testing revealed a Flickr API bug with bounding boxes. Queries to the Flicker API that
include a bounding box no longer return entries uploaded after August 6, 2013. There is no current
workaround or date for a fix from Flickr. The SFPAM can be configured to use a hardcoded San
Francisco geographic center as search term instead of the extent, but this removes flexibility from
the application. No results will be returned if the user pans to a region outside of San Francisco.
Finally, testing AGOL maps with different combinations of AGOL accounts and group
settings influenced the decision to make the two AGOL San Francisco Public Art and Architecture
maps open to all types of AGOL accounts for read access of backend services and write access of
the AGOL
5.4 REST Services Summary Map and feature services described in Section 4.5.2 were created and published on the
ArcGIS for Server production server. Two empty AGOL feature services were created and
published for Power Users. Table 24 summarizes which services and their corresponding layers are
consumed by application.
Table 24 Services Used by Each Application Client Application Buildings BuildingsRO Neighbor-
hood84MRO SFPubArt-84Mgr
SFPubArt-84MgrR0
AGOL Add Building/ Art Points
sfpublicart.com website X X X AGOL mobile or web: SF ART Admin
X X X X
AGOL mobile or web: San Francisco Public Art and Architecture
X X X X
AGOL mobile or web: San Francisco Public Art and Architecture for Mobile
X X X X

69
Mobile iOS native pilot application consumes backend services through the configuration of the AGOL San Francisco Public Art and Architecture for Mobile web map service.
X X X
Client applications consuming the BuildingsRO and SFPubArt84MgrRO services were
configured to access each layer within the service.
5.5 SFPAM Web Application Results The web application sfpublicart.com is the primary user interface for the SFPAM. The entry
point to the website is reviewed in Section 5.5.1. Popups are discussed in Section 5.5.2. Section 5.5.3
illustrates basemap, layer, and social media configuration. Searching for a location, managing
bookmarks, sharing the map, and learning more about the map are described in Section 5.5.4.
5.5.1 Main Page The website loads data asynchronously to shorten the length of time the page remains blank
and eliminate load dependencies between data sources. As the application loads, displayed data
volume and visual complexity increases. Figure 8 shows the website’s main page for sfpublicart.com,
sfpublicart.org, or sfpublicart.net.

70
Figure 8 - The main page for sfpublicart.com
Callouts highlight the application’s controls and features. All REST data layers and social
media layers enabled for the application are loaded. The initial basemap is Stamen Design’s
Watercolor tiles. REST service data layers of art and buildings appear display as individual points.
Social media data appears as circular clusters or single points depending on density.
The application provides basic navigation controls such as panning, by clicking and dragging,
and zooming, by using the zoom toolbar. A scale is visible to the lower left of the web page.
Copyright attribution for basemaps appears to the lower right. The top toolbar provides options to
Zoom control
Scale
Find Place
Manage Bookmarks
Share/ Embed
Map
About Application
Layer Controls
Copyright Attribution
Social Media Cluster
ArtFeatures
Social Media
Feature
LandmarkFeatures
Layer Legend
Basemap Controls
Social Layer
Controls
Turn Layers On/
Off
domain

71
locate a place, manage place bookmarks, share or embed the current configuration of the map, learn
more about the map, and control layer selection.
5.5.2 Popups The user can interact with the map and view detailed information through selecting art
points or social media clusters to access popup details. Art and building locations appear as single
points; social media data may appear as either a single point or a cluster. A cluster popup has
navigation controls to page through different social media points. Popup windows have scrollbars
enabled. Figure 9 contains four examples of popup windows that demonstrate different ways the
application can be configured to display POI attributes.
A. Text-only art point
B. Instagram popup within multipage cluster
C. Portion of a Waymarking.com popup
D. Portion of a landmark building popup
Figure 9 Sample popup windows

72
Figure 9A is a text only popup of a SFAC art location. A multipage popup of social media
points showing an Instagram point is found in Figure 9B. Figure 9C displays the top portion of a
popup from Waymarking.com data, while Figure 9D shows the bottom half of the popupinfo field
from a landmark building location. Clicking on an embedded image in a popup opens a browser
window to the image’s original or parent website. Additional links may be embedded in the
popupInfo field. Each popup window contains a link to zoom the map to the POIs location.
5.5.3 Layer Contro ls The layer controls allow the user to change the basemap, turn layers on and off, and change
the search parameters for social media. There are three segment tabs to the layer control; selecting a
segment displays a control panel for the segment. Clicking a depressed tab hides the control panel.
The application loads with the Layers control panel displayed. The control panel lists the
REST service layers portrayed on the map with a title and single legend icon. Additional legend and
layer information is available by clicking the information icon to the right of the layer name. Figure
10 shows the expanded legend panes for the Art (A), Buildings (B. ), and POPOS (C) layers. The Art
and Waymarking.com layers include a transparency slider, and both layers are symbolized by art
type. These examples illustrate different configuration options available to configure a legend.
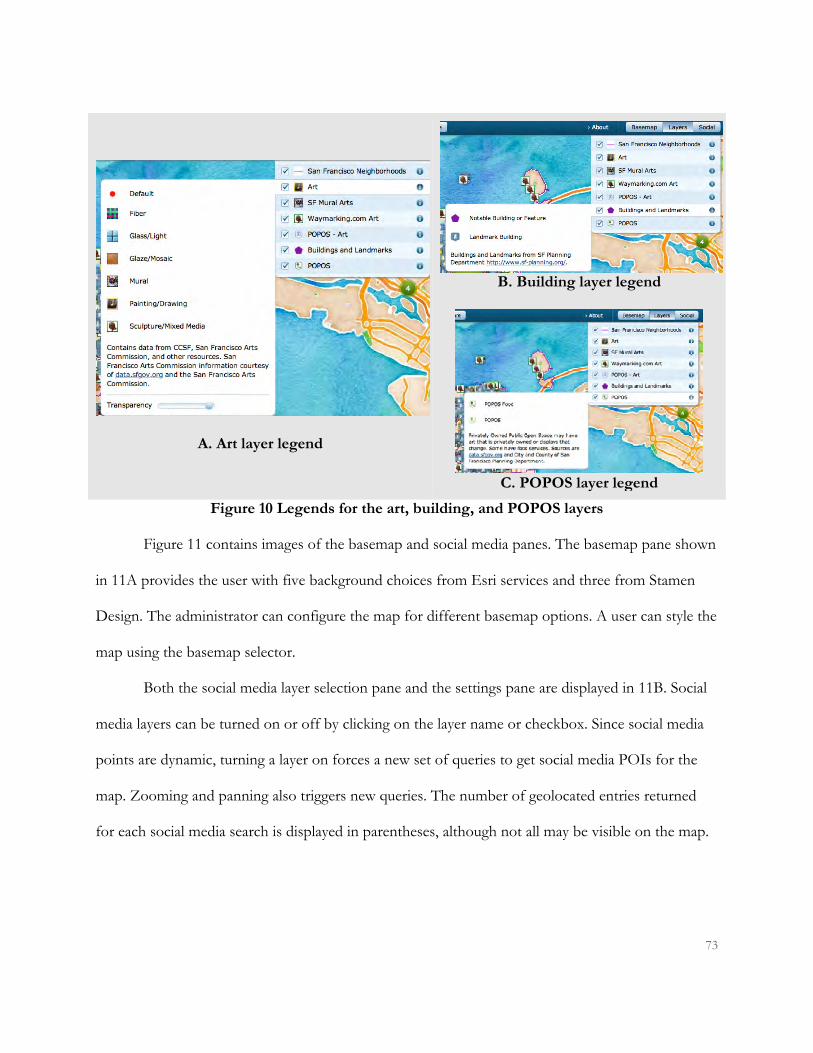
73
A. Art layer legend
B. Building layer legend
C. POPOS layer legend
Figure 10 Legends for the art, building, and POPOS layers
Figure 11 contains images of the basemap and social media panes. The basemap pane shown
in 11A provides the user with five background choices from Esri services and three from Stamen
Design. The administrator can configure the map for different basemap options. A user can style the
map using the basemap selector.
Both the social media layer selection pane and the settings pane are displayed in 11B. Social
media layers can be turned on or off by clicking on the layer name or checkbox. Since social media
points are dynamic, turning a layer on forces a new set of queries to get social media POIs for the
map. Zooming and panning also triggers new queries. The number of geolocated entries returned
for each social media search is displayed in parentheses, although not all may be visible on the map.

74
The user can change the search parameters for each social media stream using the settings
pane. There are tabs for each social media layer. Selecting a tab displays modifiable search
parameters. The search button must be clicked to implement the new filters.
A. Basemap choices
B. Social media search
Figure 11 Basemap and social media configuration
Social media layers can also be displayed as a heatmap by toggling the ”Density” tab. This
disables access to popup displays for social media.
5.5.4 Addit ional Funct ional i ty Additional map functions include “Find a place”, “Places”, “Share”, and “About.” The
“Share” and “About” functions were modified to incorporate changes to the underlying application
code.
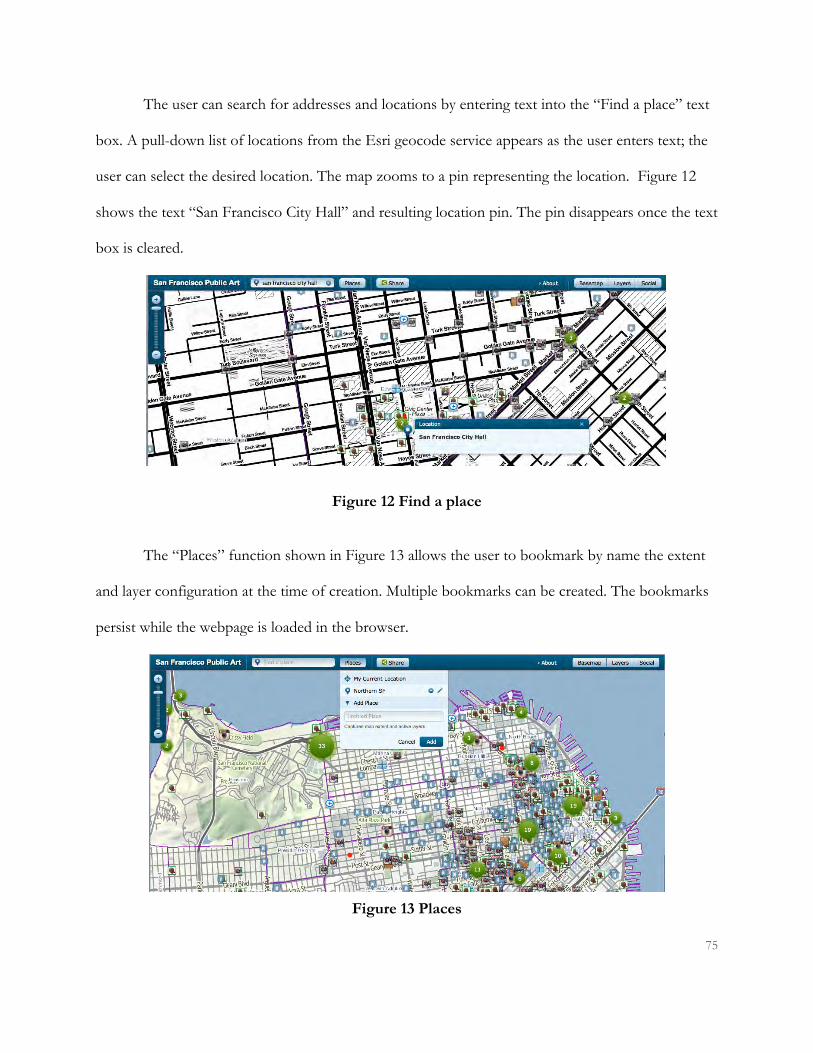
75
The user can search for addresses and locations by entering text into the “Find a place” text
box. A pull-down list of locations from the Esri geocode service appears as the user enters text; the
user can select the desired location. The map zooms to a pin representing the location. Figure 12
shows the text “San Francisco City Hall” and resulting location pin. The pin disappears once the text
box is cleared.
Figure 12 Find a place
The “Places” function shown in Figure 13 allows the user to bookmark by name the extent
and layer configuration at the time of creation. Multiple bookmarks can be created. The bookmarks
persist while the webpage is loaded in the browser.
Figure 13 Places

76
The “Share” function provides the capability to share a map to Facebook or Twitter, as well
as to embed the map in an HTML page. The current layer settings, map extent, basemap
background, and social layer search terms will be saved as parameters to the shared link. Figure 14
shows the two sharing options. In Figure 14A, the user can select either Facebook or Twitter to
share a link to the map on social media. Figure 14B shows the interface to generate HTML code to
embed the map on a web page. The user can choose preconfigured map dimensions or generate a
custom size. The resulting HTML code can be added to a webpage.
A. Share map on Facebook or Twitter
B. Embed map in HTML
Figure 14 Share map options
Finally, clicking the “About” button brings up an information pane with more information
about the map layers. Contact information for the map administrator is included as well as a link to
the AGOL map where new features can be added.

77
5.6 AGOL Results Three maps and two feature services were created in AGOL. The names, purpose, and links
including the AGOL map service ID are listed in Table 25. The primary reasons for creating these
maps and features services are to:
• Provide a means for Power Users with ArcGIS accounts to add new features without touching the backend data
• Enable users to access the art map using ArcGIS mobile clients • Provide a means for the administrator to edit the backend database using web or mobile
clients • Provide a configured map service for use with the pilot native iOS application.
Because mapping services instead of features services are consumed, symbology is retained
from the original MXD files used to generate the REST services.
Table 25 AGOL map services Map or Feature Service Name
Description AGOL Link including ID
Add a New Building
Feature service for new building features. https://ccsfgis.maps.arcgis.com/home/item.html?id=62a8363e4c1d4d679e22dc0baff89925
Add New Art Points
Feature service for new art features. https://ccsfgis.maps.arcgis.com/home/item.html?id=5d296b9d6f60425a8e9b68f1bbd7d49d
San Francisco Public Art and Architecture
Web map displaying existing art and buildings for Power Users to add new features to the AGOL feature services
https://ccsfgis.maps.arcgis.com/home/item.html?id=94d0872b64d849708e620735e861eb98
San Francisco Public Art and Architecture for Mobile
Web map for use with mobile devices. ArcGIS mobile clients can add new features to the AGOL feature services.
https://ccsfgis.maps.arcgis.com/home/item.html?id=173842bc350d4f379ebc184f0c1897eb
SF Art Admin Administrator map with CRU permissions for editing the backend database. Can be used as web map or through ArcGIS mobile clients to edit in the field.
https://ccsfgis.maps.arcgis.com/home/item.html?id=707f6d7440c843db97356357e203b147
Figure 15 shows the AGOL San Francisco Public Art and Architecture web map. On the left side
under “Contents,” the layers from the backend REST services, feature services for adding art and
buildings, and the Stamen Design base map layers are visible. A popup window displays a multi-page
popup window for selected points.

78
Figure 15 AGOL San Francisco Public Art and Architecture Map
A user can select the “Edit” button to add new features to the AGOL features services.
Figure 16 shows the “Add Features” pane with PUBLICART selected. A new feature point has been
added to the map and the editing window is open to add attribute information. A user can add
images through providing external web links or by uploading images. Dropdown windows display
values imported from the backend domains when the feature service was created using a backend
REST service as a model.

79
Figure 16 Adding new art features to the AGOL feature service
The AGOL San Francisco Public Art and Architecture and the San Francisco Public Art and
Architecture for Mobile maps are configured so that users can edit or delete features they create but not
features of other users.
Figure 17 show the AGOL SF Art Admin map in editing mode. The editing pane contains
the AGOL feature services. The map has access to the Buildings feature service with CRU access to
all Building table records and the SFPubArt84Mgr feature service with CRU access to all art features
in the SFPubArt84M table. The editing popup for the selected feature is shown. Since the map is for
administrators to edit backend data, the features within the Buildings and SFPubArt84Mgr service
have not been broken into multiple layers. Both the position and attributes of features can be edited.
Images can be uploaded or deleted from the associated attachment tables.

80
Figure 17 - AGOL SF Art Admin map in editing mode
The SF Art Admin map is not publicly shared, so it will not appear in searches of ArcGIS on
web or mobile unless the user is the map owner.
5.7 Esri Mobile Application Results The AGOL maps described in the previous section can be accessed in the ArcGIS for
Mobile and Collector native applications. Only San Francisco Public Art and Architecture for Mobile is
configured to display images using links properly. This section looks at some of the mapping
functionality provided through the native applications. These examples demonstrate the interaction
of the Esri mobile applications with the backend services of the SFPAM using web map
configuration in AGOL. Images were captured on an iOS 4s phone. The symbology is consistent
with the AGOL web maps and the backend REST services.
Figure 18 displays aspects of the basic interface for the ArcGIS for Mobile iOS application.
18A shows the results of a search for “SF Art” by the Administrative owner of the AGOL maps.

81
Other users will see similar results with SF ART Admin excluded. Selecting San Francisco Public Art
and Architecture for Mobile brings the user to the basic map view (Figure 18B). The client provides
basic functionality such as a legend view (Figure 18C) and layer controls (Figure 18D).
A. Map search results
B. ArcGIS for Mobile
map view
C. ArcGIS for Mobile
legend
D, ArcGis for Mobile
layer controls
Figure 18 ArcGIS for Mobile basic functionality
Figure 19 consists of images from the Collector application. The basic map view is shown in
Figure 19.A. A correctly displayed image in the popup window is found in Figure 19B. In Collector,
a user can navigate between locations; the application contains routing functionality. Figure 19C
shows the route generated between points and Figure 19D shows the route directions.

82
A. Basic map view
B. Popup image display
C. Navigation route to a
POI
D. Route directions
Figure 19 Collector map view, popup, and directions
Figure 20 shows different aspects of editing a point or adding a new feature. In ArcGIS for
Mobile, if a point is selected and edit clicked in the popup pane, the attribute-editing form appears
(Figure 20A). From the attribute-editing form, the point can be repositioned (Figure 20B). In
Collector, selecting the new feature icon brings up a pane to select the feature class (Figure 20C).
The attribute editing screen is shown in Figure 20D.
A. Editing a POI in ArcGIS for Mobile
B. Adjusting a POI
position during editing in ArcGIS for Mobile
C. Choosing which
feature to add in Collector
D. Attribute editing
screen for adding a new feature in Collector
Figure 20 Editing using mobile applications

83
The Esri native client applications provide a mobile option for users to enjoy the art and
building datasets, as well as to contribute additional data.
5.8 Mobile iOS Pilot Application Results While the Esri native clients applications address mobile access to the SFPAM, this solution
requires downloading an Esri application and an Esri user, developer, or organizational account for
access. A less restrictive solution does not require a user account for accessing art data.
Using Esri iOS for mobile sample Xcode projects, a pilot native iOS program was
developed. Figure 21 contains images captured in the iOS emulator for an iPhone 5 running 6.1
showing current functionality. The application consumes the AGOL San Francisco Public Art and
Architecture for Mobile web map. The AGOL configuration is reflected in the layers displayed as well
as attribute order and selection. Symbology is passed by the backend REST map services to AGOL
and the native application.
The pilot application has pan and zoom functionality and a basemap picker. Point selection
is buffered so that underlying points are selected (Figure 20A). Popup displays (Figure 20B) scroll
and reflect the selection of multiple points through multi-page navigation (Figure 20C). The Esri
gray basemap is visible in Figure 20A. The topographic basemap provides the background in Figure
20D.

84
A. Gray basemap and callout for selected
points
B. Popup detail
C. Additional popup details and image
D. Topographic basemap selection
Figure 21 Native mobile application with popup display and basemap picker
Future development of the application could add a legend display and layer control.
Additional functionality could add identify and zoom to current location, search art and building
data for a term, and submit a new building or feature. The application could also be targeted for
iPad displays. Android native client development would make the art data available to a large
segment of the mobile market.
5.9 Summary of Functionality Differences Between Clients Table 26 provides a summary of functionality across the different SFPAM clients. Web maps
(SFPAM and AGOL) do not require an ArcGIS account, but mobile applications do. Only AGOL
web maps and Collector can provide directions to a location. The SFPAM web client doesn’t have
feature-editing capability, but the other client interfaces have editing enabled for both AGOL feature
services and backend services. Only the SFPAM web client displays social media, displayed as
clustered points or a heat map.

85
AGOL provides filtering by attribute field. Web maps can display Stamen Design web tile
layers, share the map configuration as a URL, render HTML fields for popup display, and post the
map to social media such as Twitter or Facebook. AGOL and ArcGIS for mobile can select multiple
points through buffering and display them in popups. The SFPAM client only has this functionality
for social media layers. All clients except the SFPAM can upload images as attachments.
Table 26 Comparison of functionality differences between clients Functionality SFPAM web
client AGOL web maps
ArcGIS for Mobile
Collector for Mobile
ArcGIS user account required to use map N N Y N/A ArcGIS for Organizations account required to use map
N N (except for admin map)
Any ArcGIS account type
Y
Directions to selected location N Y N Y Coded value domain value instead of code automatically displayed
N In popups but not table view
N N
Editing/ Display of AGOL feature services N Y Y Y Editing of backend features N Y admin user
only Y admin user only
Y admin user only
Extent always resets to San Francisco Y N N N Feature clustering or heat map Y (Social
media only) N N N
Filtering by attributes N Y N N HTML rendering in popups Y Y N N Image uploading N Y Y Y Multiple selection of points and display in popups
Y (Social media only)
Y Y N
Share map as URL or to social media Y Y N N Social media layers Y N N N Stamen Designs basemap layers Y Y (as layers,
not basemaps) N N
Functionality differs across client types. Additional functionality can be added to the SFPAM
client and the native pilot application through future work.
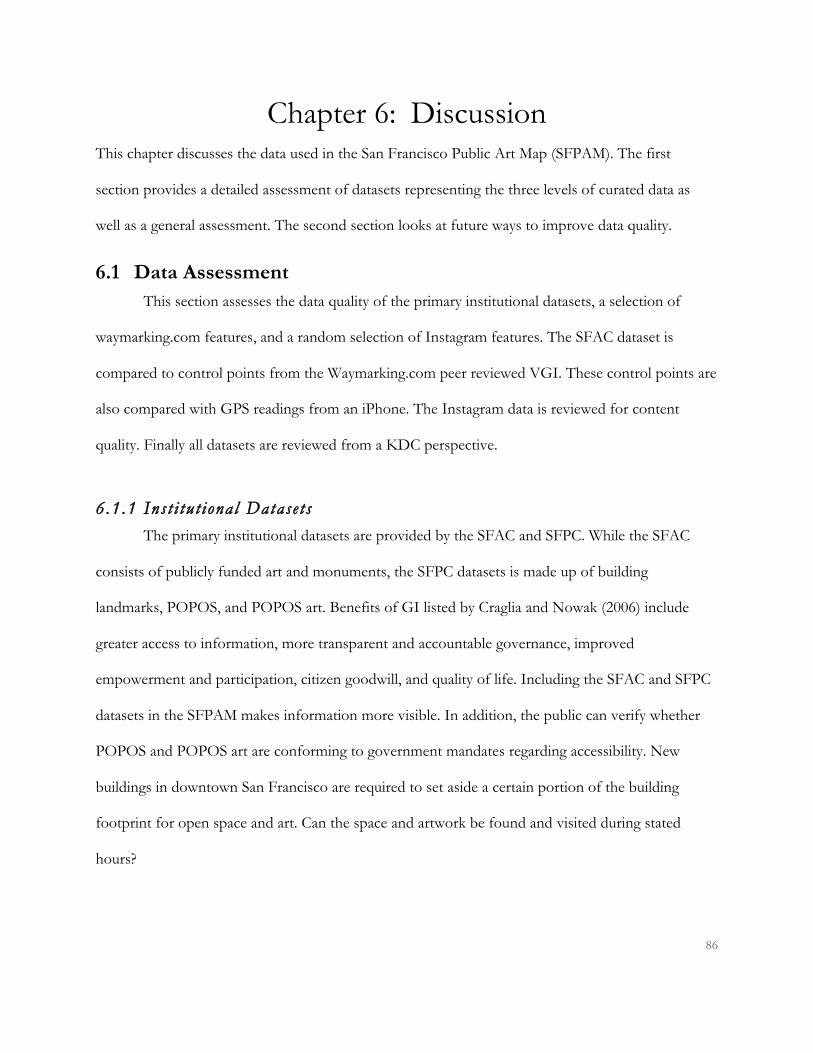
86
Chapter 6: Discussion This chapter discusses the data used in the San Francisco Public Art Map (SFPAM). The first
section provides a detailed assessment of datasets representing the three levels of curated data as
well as a general assessment. The second section looks at future ways to improve data quality.
6.1 Data Assessment This section assesses the data quality of the primary institutional datasets, a selection of
waymarking.com features, and a random selection of Instagram features. The SFAC dataset is
compared to control points from the Waymarking.com peer reviewed VGI. These control points are
also compared with GPS readings from an iPhone. The Instagram data is reviewed for content
quality. Finally all datasets are reviewed from a KDC perspective.
6.1.1 Inst i tut ional Datase ts The primary institutional datasets are provided by the SFAC and SFPC. While the SFAC
consists of publicly funded art and monuments, the SFPC datasets is made up of building
landmarks, POPOS, and POPOS art. Benefits of GI listed by Craglia and Nowak (2006) include
greater access to information, more transparent and accountable governance, improved
empowerment and participation, citizen goodwill, and quality of life. Including the SFAC and SFPC
datasets in the SFPAM makes information more visible. In addition, the public can verify whether
POPOS and POPOS art are conforming to government mandates regarding accessibility. New
buildings in downtown San Francisco are required to set aside a certain portion of the building
footprint for open space and art. Can the space and artwork be found and visited during stated
hours?

87
6.1.1.1 SFPC Datasets
The SFPC datasets were produced by a GIS administrator and consist of POIs associated
with geocoded addresses. Information embedded in the original KML HTML was extracted to map
unstructured content to fields such as name, architect or artist, completion date, address, and
description. Field information was not consistently available across points. The geocoded addresses
are generally adequate for finding landmarks and several of the POPOS. Some landmarks consist of
more than one address, architect, and building completion date, so a choice needed to be made for
the relevant field and other information noted elsewhere. Additional wayfinding instructions were
required for some POPOS features as they are located within a building or on a rooftop and are not
casually found. Art POIs were geocoded by address. If a POPOS contained multiple artworks, they
were described and represented by a single point. The art POPOS would be better served by being
mapped to actual locations as well as providing building address and location descriptions. This will
be addressed in future data quality improvements. According to the KDC components, time is
unspecified. Contents consist of unstructured HTML, which can be extracted into fields, and one or
more images. Place is composed of an address, coordinates, additional directions, and images.
6.1.1.2 SFAC Dataset
The SFAC art collection has over 4000 items (Wright and Harmanci 2011), making the
organization one of the largest administrators of public art in the country. Little money is available
for management and maintenance of the collection, and the organization is uncertain of the actual
inventory or details such as location for all the pieces. This confusion is reflected in the publicly
available dataset. The SFAC dataset is the primary source of information for publicly funded art
POIs, but the data is problematic. Neither detailed descriptions, nor image URLs are included in the

88
dataset. The dataset contains multiple entries for the same art POI. Most challenging is the spatial
accuracy of the entries.
The City of San Francisco is divided politically into 11 districts. Based on the brief location
description included in the SFAC dataset, a district was assigned to each art POI. Each POI’s
assigned district was compared to the actual district. 151 points, or 22 percent, were not located in
their described district.
Figure 22 shows the distribution of collocated art POIs for the SFAC art dataset. There are
157 locations for 689 art pieces. Only 101 locations are associated with one art piece. Three
locations account for over 300 pieces of art. One location containing 123 art works is a hospital
campus with restricted access to all but a handful of pieces. The ninety-three San Francisco Airport
art pieces were collocated despite the airport’s consisting of multiple terminals. Art POIs are located
in publicly accessible locations, private offices, and passenger-only locations past security. Ninety-
two art pieces are collocated by SFAC’s headquarters. A review of each art piece’s assigned district
reveals that most of the points belong in other districts.
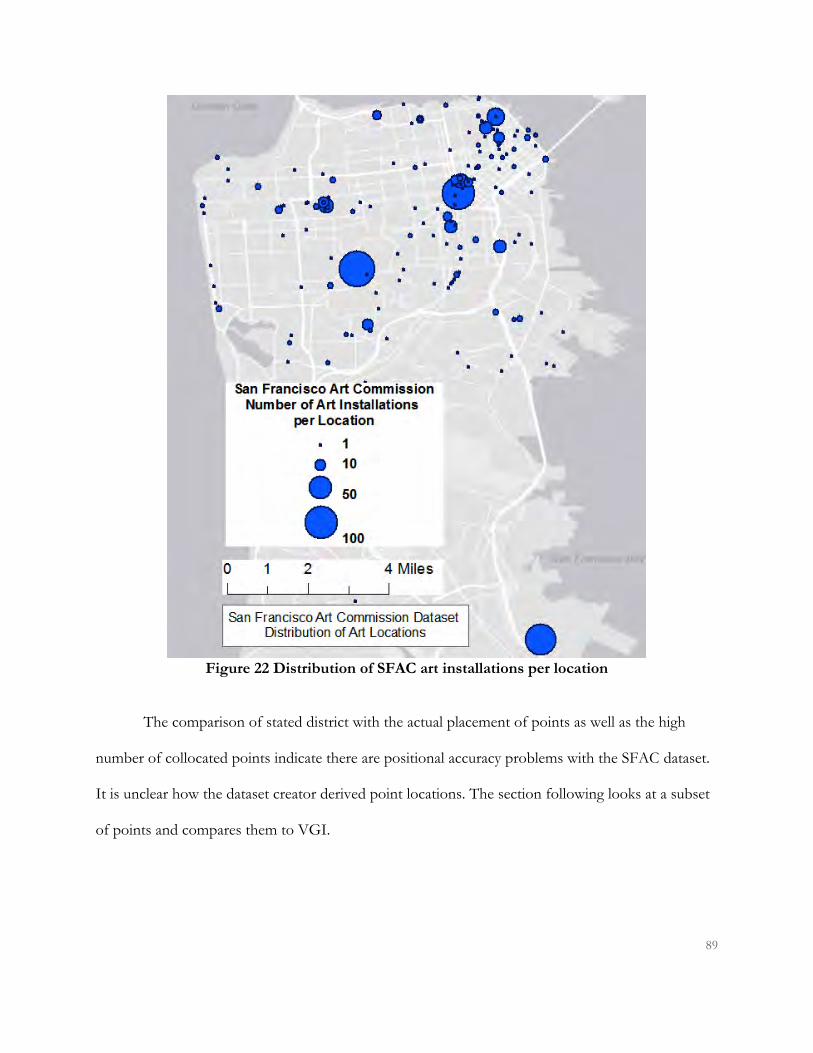
89
Figure 22 Distribution of SFAC art installations per location
The comparison of stated district with the actual placement of points as well as the high
number of collocated points indicate there are positional accuracy problems with the SFAC dataset.
It is unclear how the dataset creator derived point locations. The section following looks at a subset
of points and compares them to VGI.

90
6.1.2 Peer Reviewed VGI as Contro l Points Waymarking.com features represent landmarks of interest to members of Waymarking.com.
A user submits a feature that has been geolocated using a GPS device and includes information such
as an image, title, and other background information. The user also categorizes the submission.
Another member of Waymarking.com reviews the submission for approval to the category. One
drawback of this system is that multiple entries for the same landmark can be submitted by using
different categories. A statue of a lion might show up in the database twice, once categorized as a
lion statue and once categorized as a Smithsonian item, because two different people submitted
entries to two different categories, each with a different reviewer. The SFPAM waymarking.com
dataset was created by extracting KML files from the Waymarking website. Features were chosen for
the dataset based on whether they represented public art such as monuments, sculptures, murals,
street art, or other objects of interest. Multiple KML files were combined into a features set and
fields extracted from the unstructured HTML text. Additional analysis of content provided
additional field values. Duplicates were removed as part of the data mapping process.
A review of art features indicated an overlap between the SFAC dataset and the
Waymarking.com dataset. A high-density area for public art POIs was selected to provide a sample
set to compare positional accuracy of the public art dataset versus Waymarking.com peer reviewed
VGI. The VGI points were also compared to locations captured by an iPhone to see how closely the
points matched. This provides information on how well geolocated social media captured by phone
potentially compares to GPS, as well as verifies whether the Waymarking.com VGI points were
close to the actual landmarks.

91
6.1.2.1 Comparison o f SFAC Sample Data Points Locat ion to Waymarking.com VGI
A high-density area for public art POIs was selected to provide a sample set to compare
positional accuracy of the public art dataset versus Waymarking.com peer reviewed VGI. Twenty-
four GPS data points representing monuments and artwork in Golden Gate Park’s Music
Concourse were mapped using VGI from Waymarking.com. The corresponding twenty-two data
points from the SFAC were identified and mapped. Figure 23 shows the overall location and
discrepancy of the two sets of data points, while Figure 24 shows the Music Concourse in greater
detail.
Figure 23 Discrepancy between SFAC data points and Waymarking.com VGI
Several things are immediately apparent: while there are twenty-two SFAC POIs, only four
are represented graphically, and several points are more than a mile from the Music Concourse.

92
Figure 24 Music Concourse detailed view
Table 27 shows the calculated distance in feet between corresponding datasets for each
applicable point. The average distance between corresponding points excluding the three points over
a mile away was 456 feet. The closest SFAC point to a Waymarking.com point was 101 feet. Feature
8 was 2.7 miles away, while features 10 and 19 were one mile away. Seventeen of the SFAC points
were located at the same coordinates as Feature 5.
Table 27 Distance between Waymarking.com, iPhone locations, and SFAC locations. Marker
ID Name of Point of Interest Discrepancy between
Waymarking and SFAC Locations in Feet
Discrepancy between Waymarking and iPhone
Locations in Feet 1 Beethoven 382 57 2 Cervantes Monument 613 27 3 Dor vase (La poeme de la vigne) 519 11 4 Drawn Stone - Andrew Goldsworthy N/A 137 5 Francis Scott Key 320 14 6 General John Pershing 508 8
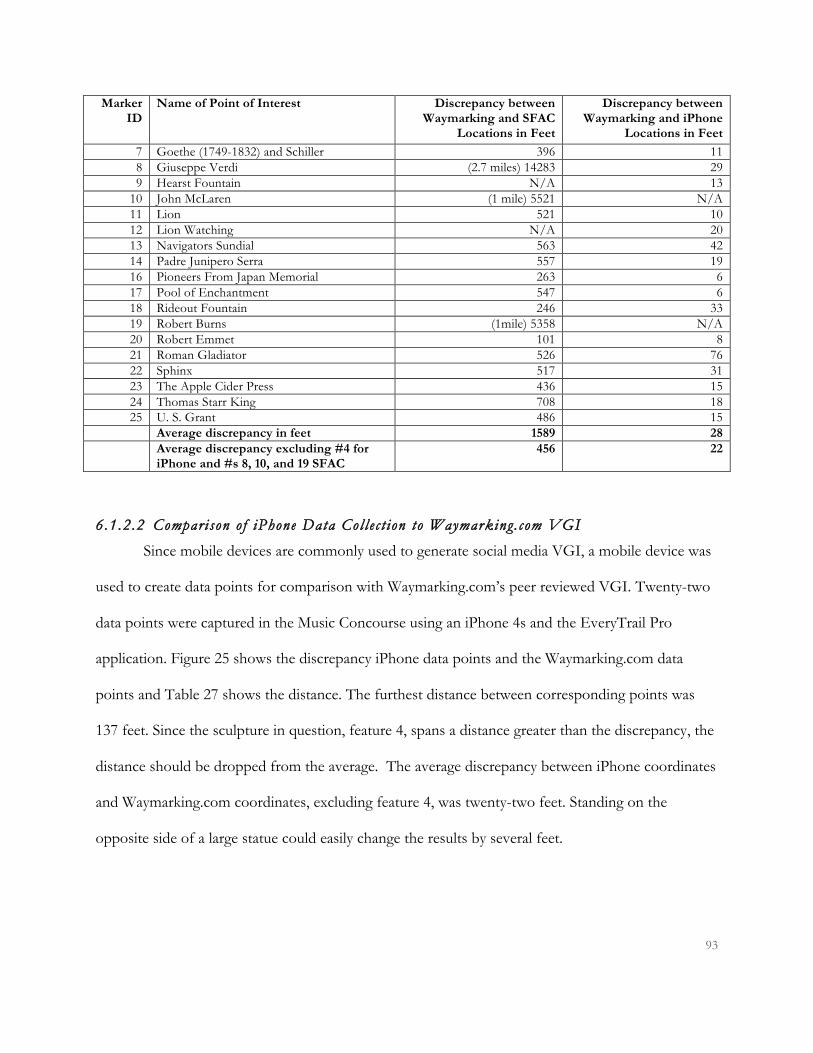
93
Marker ID
Name of Point of Interest Discrepancy between Waymarking and SFAC
Locations in Feet
Discrepancy between Waymarking and iPhone
Locations in Feet 7 Goethe (1749-1832) and Schiller 396 11 8 Giuseppe Verdi (2.7 miles) 14283 29 9 Hearst Fountain N/A 13
10 John McLaren (1 mile) 5521 N/A 11 Lion 521 10 12 Lion Watching N/A 20 13 Navigators Sundial 563 42 14 Padre Junipero Serra 557 19 16 Pioneers From Japan Memorial 263 6 17 Pool of Enchantment 547 6 18 Rideout Fountain 246 33 19 Robert Burns (1mile) 5358 N/A 20 Robert Emmet 101 8 21 Roman Gladiator 526 76 22 Sphinx 517 31 23 The Apple Cider Press 436 15 24 Thomas Starr King 708 18 25 U. S. Grant 486 15
Average discrepancy in feet 1589 28 Average discrepancy excluding #4 for
iPhone and #s 8, 10, and 19 SFAC 456 22
6.1.2.2 Comparison o f iPhone Data Col lec t ion to Waymarking.com VGI
Since mobile devices are commonly used to generate social media VGI, a mobile device was
used to create data points for comparison with Waymarking.com’s peer reviewed VGI. Twenty-two
data points were captured in the Music Concourse using an iPhone 4s and the EveryTrail Pro
application. Figure 25 shows the discrepancy iPhone data points and the Waymarking.com data
points and Table 27 shows the distance. The furthest distance between corresponding points was
137 feet. Since the sculpture in question, feature 4, spans a distance greater than the discrepancy, the
distance should be dropped from the average. The average discrepancy between iPhone coordinates
and Waymarking.com coordinates, excluding feature 4, was twenty-two feet. Standing on the
opposite side of a large statue could easily change the results by several feet.

94
Figure 25 IPhone data collection vs. Waymarking.com VGI
6.1.3 Analys i s o f Instagram Sample Set for Relevant Content The Instagram API does not provide the capability to search using a location bounding box
and tag. The challenge for using this social media stream as a data source for public art was creating
a search to return relevant art images located in San Francisco.
Using the tag “sfart” as shorthand for San Francisco art, 1614 geolocated images were
retrieved from instagram.com on 10/3/2013. The images were mapped and 1582 of the images were
within the greater San Francisco Bay Area. Only thirty-two images (2 percent) were located outside
the area. 1052 (65 percent) of the images were located within the City of San Francisco. The tag

95
“sfart” returned relevant geographically tagged data despite the handicap of not being able to specify
a bounding box as part of the search term.
The Instagram data was analyzed for appropriate content to answer the question, “How
many images are of publicly accessible art, such as murals, street art, or publicly funded art?” A
randomizing program, random.com, was used to generate a random ID list of 105 images
representing a 10 percent sample set of the images within San Francisco. The images were reviewed
and categorized as art, galleries, or personal. The art classification indicated an image was publicly
accessible. Images classified as galleries comprised pictures from art galleries, museums, and fairs.
These images may be time sensitive or require admission, but contain pictures of art. The remaining
images consisted of pictures of people, food, personal artwork, or other content not relevant to
publicly accessible art. Table 28 shows the results.
Table 28 Instagram Images by Category Category # of Images % of Images
Art 67 64% Galleries 24 23% Personal 14 13%
Almost two thirds of the image content was of publicly accessible art, with an additional 23
percent being art related but restricted by time or venue. Only 13 percent of the sample content was
not relevant for the purposes of documenting public art.
6.2 Summary of Primary Datasets using the KDC Framework The primary datasets were evaluated using the KDC components of place, time, and
content. Datasets with features and locations that were inferred from websites or PDFs, such as
UCSF, were not included. Table 29 shows how the datasets map to each component. Place was
assessed by evaluating whether the dataset features for art or buildings contained accurate

96
coordinates, additional text describing the place, or directions to the location. When assessing social
media, only features with coordinates were considered. A “Y” value indicates that the component
was always present for features; an “N” value indicates the component was never present; and “S”
indicates the component was sometimes included with features. Time represents the time and date
that the feature information was collected. Content was divided into title or name for a feature; the
inclusion of an image showing the feature; and the name of the artist or architect. Many of the
datasets have additional content, but these are minimum fields of primary interest. Images could also
be considered a component of place as images provided important waymarking clues.
Table 29 Dataset evaluation using KDC framework Dataset Source
Curation Level
Place Time Content Comments X,Y Direc-
tions Accurate Date
Verified Title/ Name
Image Artist
City College of San Francisco
Inst Y Y Y N Y Y Y Contains additional content.
San Francisco Arts Commission
Inst. Y Y S N Y N Y Contains additional content.
Landmarks and Buildings (SFPC)
Inst. Y Y Y N Y Y S
POPOS and POPOS art (SFPC)
Inst. Y Y S N Y Y S Accurate when coordinates combined with location.
San Francisco Mural Arts
Admin (VGI)
Y N S N Y Y N Artist names at source website
Waymarking.com
Admin (VGI)
Y S Y Y Y Y S
Flickr Social Y S S Y S Y S Instagram Social Y S S Y S Y S Panoramio Social Y S S Y S Y S YouTube Social Y S S Y S Y S
The assessment shows that no single dataset contains features with all components as
defined. The SFAC dataset is the only one with no images. The most spatially accurate datasets are
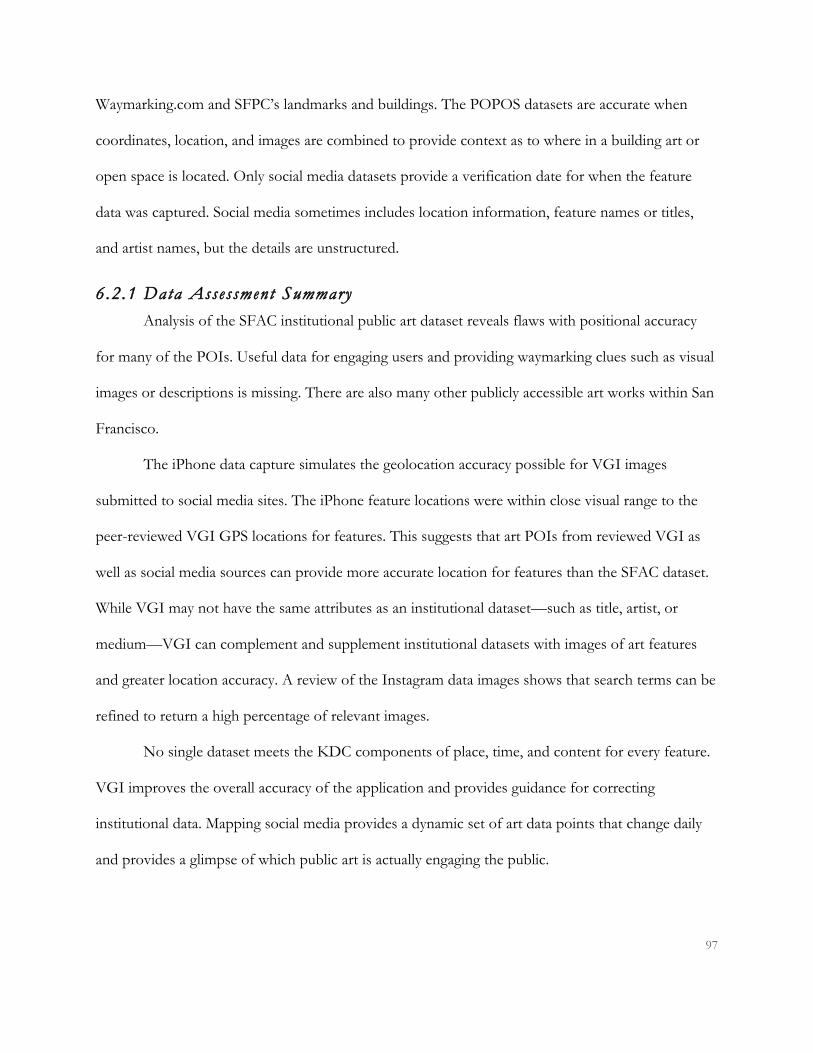
97
Waymarking.com and SFPC’s landmarks and buildings. The POPOS datasets are accurate when
coordinates, location, and images are combined to provide context as to where in a building art or
open space is located. Only social media datasets provide a verification date for when the feature
data was captured. Social media sometimes includes location information, feature names or titles,
and artist names, but the details are unstructured.
6.2.1 Data Assessment Summary Analysis of the SFAC institutional public art dataset reveals flaws with positional accuracy
for many of the POIs. Useful data for engaging users and providing waymarking clues such as visual
images or descriptions is missing. There are also many other publicly accessible art works within San
Francisco.
The iPhone data capture simulates the geolocation accuracy possible for VGI images
submitted to social media sites. The iPhone feature locations were within close visual range to the
peer-reviewed VGI GPS locations for features. This suggests that art POIs from reviewed VGI as
well as social media sources can provide more accurate location for features than the SFAC dataset.
While VGI may not have the same attributes as an institutional dataset—such as title, artist, or
medium—VGI can complement and supplement institutional datasets with images of art features
and greater location accuracy. A review of the Instagram data images shows that search terms can be
refined to return a high percentage of relevant images.
No single dataset meets the KDC components of place, time, and content for every feature.
VGI improves the overall accuracy of the application and provides guidance for correcting
institutional data. Mapping social media provides a dynamic set of art data points that change daily
and provides a glimpse of which public art is actually engaging the public.

98
Chapter 7: Conclusions and Future Directions This chapter draws conclusions about the SFPAM and looks at future directions to improve data
quality and the application.
7.1 Conclusions The thesis answers the proposed research questions. The sections are divided by research
question.
7.1.1 How can a comprehens ive , interac t ive , dynamic map o f publ i c ar t and archi t e c ture for San Franc is co be bui l t f rom disparate data sources? The San Francisco Public Art Map is a comprehensive, interactive, dynamic map that
integrates multiple kinds of curated data to provide San Francisco public art and architecture
information to citizens for free. The Esri PIM was transformed from a disaster map to a public art
map. New functionality incorporated Stamen Design web tiles for basemap options and added
Panoramio and Instagram to social media layer options. The administrator can easily add new layers
to the application through configuration changes. Data and location quality can be improved
incrementally without impacting the application.
AGOL maps and services were created so that users can contribute art or building features
without modifying the backend database; upload images for contributed art; and have a mobile
solution using Esri’s ArcGIS for Mobile or Collector. The functionality available to the user varies
by client.
7.1.2 What i s a common, extens ib le data model for publ i c ar t and archi t e c ture? A data model for art and buildings was designed and implemented in ArcMap using an
ArcSDE SQL Server database. Data from multiple sources was mapped to the data model. The data

99
model is extensible to implement additional functionality. If art is removed or destroyed the
database serve as a historic repository by saving information and images about the feature.
7.1.3 How can soc ia l media be used to provide in formation about San Francis co ’ s publ i c ar t? Institutionally curated data from the SFAC and SFPC was integrated with administratively
curated, peer-reviewed VGI from SF Mural Arts and Waymarking.com to create a database of art
POIs and architecture. By publishing data as REST services using ArcGIS Server, a variety of
application clients can consume the data. The web application was configured to dynamically acquire
art POIs for San Francisco from Instagram, Panoramio, Flickr, and YouTube. Mapping art using
social media is a unique implementation in an art application.
7.1.4 How can inst i tut ional , peer -rev i ewed VGI, and soc ia l media data sources for San Franc is co publ i c ar t and archi t e c ture be eva luated for qual i ty? The requirements for accuracy and data quality for art and building POIs were discussed and
defined. Evaluation of the different data layers showed that peer-reviewed VGI from
Waymarking.com could provide more accurate spatial data than institutional sources such as SFAC.
Peer-reviewed VGI also provided images of POIs, while institutional data provided more attribute
information. Social media sources such as Instagram complemented institutional and peer-reviewed
data sources through focusing on street art and murals, providing a timestamp of when data was
captured, and including images. The KDC framework provided a means of assessing different data
sources and showed that each dataset had both strengths and limitations.
7.2 Future Directions for Improving Data Quality Using the Lego metaphor, the different datasets can build a better inventory of San
Francisco public art. Images from social media can be used as links to corresponding features in the

100
SFAC dataset. Overlapping images from Waymarking.com or SF Mural Arts can help correct the
positional accuracy of the SFAC features. Flickr and Instagram features can be converted to
permanent features and added to the backend database, as location and additional content are
determined.
The primary tasks for data quality improvement are to: verify and update feature locations;
to add image links and POI descriptions; to verify POI status, and to add new POIs. The building
dataset should be expanded to include more examples of San Francisco architectural styles and
interesting buildings.
Data quality can be improved through administrator efforts to compare datasets, to continue
data extraction, and to remove or update POI fields. While the administrator can also collect and
correct data in the field, the number of art and building POIs are more than a single person can
track on a volunteer basis. Field data collection is time consuming. Both the Collector and ArcGIS
for mobile applications drain an iPhone 4s battery within an hour. A more promising strategy is to
recruit others to help with data improvement and collection.
The sections following look at different approaches for improving data quality using
volunteers.
7.2.1 Recrui t ing and Training Community o f Experts One approach is to train a small number of volunteers to perform specific tasks. Tasks could
take the form of researching image links for POIs and updating link and HTML fields with properly
formatted URL references for the POIs. Volunteers could also fill in missing descriptions by
researching a POI. With training, volunteers could relocate poorly placed POIs using location
descriptions, Google Street View, Google Satellite view (for large sculptures), local knowledge,
Internet information, or field research.
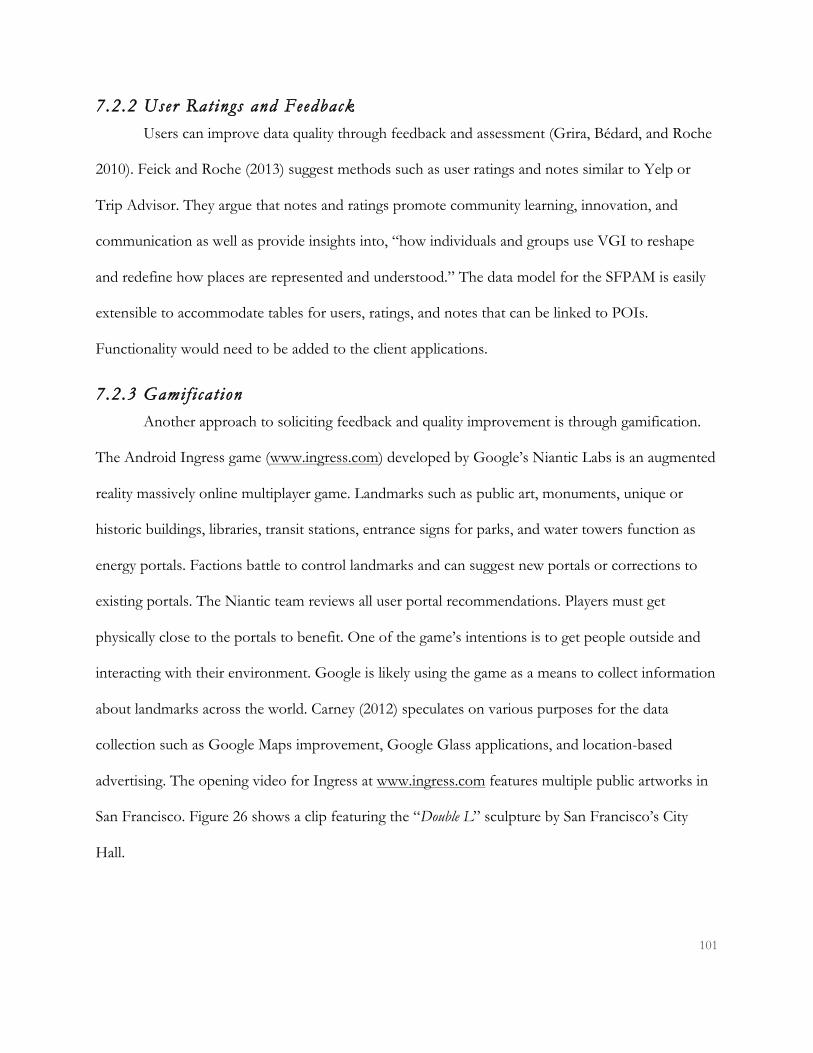
101
7.2.2 User Ratings and Feedback Users can improve data quality through feedback and assessment (Grira, Bédard, and Roche
2010). Feick and Roche (2013) suggest methods such as user ratings and notes similar to Yelp or
Trip Advisor. They argue that notes and ratings promote community learning, innovation, and
communication as well as provide insights into, “how individuals and groups use VGI to reshape
and redefine how places are represented and understood.” The data model for the SFPAM is easily
extensible to accommodate tables for users, ratings, and notes that can be linked to POIs.
Functionality would need to be added to the client applications.
7.2.3 Gamif i cat ion Another approach to soliciting feedback and quality improvement is through gamification.
The Android Ingress game (www.ingress.com) developed by Google’s Niantic Labs is an augmented
reality massively online multiplayer game. Landmarks such as public art, monuments, unique or
historic buildings, libraries, transit stations, entrance signs for parks, and water towers function as
energy portals. Factions battle to control landmarks and can suggest new portals or corrections to
existing portals. The Niantic team reviews all user portal recommendations. Players must get
physically close to the portals to benefit. One of the game’s intentions is to get people outside and
interacting with their environment. Google is likely using the game as a means to collect information
about landmarks across the world. Carney (2012) speculates on various purposes for the data
collection such as Google Maps improvement, Google Glass applications, and location-based
advertising. The opening video for Ingress at www.ingress.com features multiple public artworks in
San Francisco. Figure 26 shows a clip featuring the “Double L” sculpture by San Francisco’s City
Hall.

102
Figure 26 Screen capture from www.ingress.com of public art “portal” (last accessed 10
December 2013)
Figure 27 shows a description of a portal referencing “Cupid’s Span,” a sculpture in San
Francisco. A title, image, and spatial location are captured for each landmark registered as a portal. A
user submitting a new portal can also include a description of the portal’s significance or history.
Inaccurate titles for art as well as locations sometimes make it past the Ingress team review.
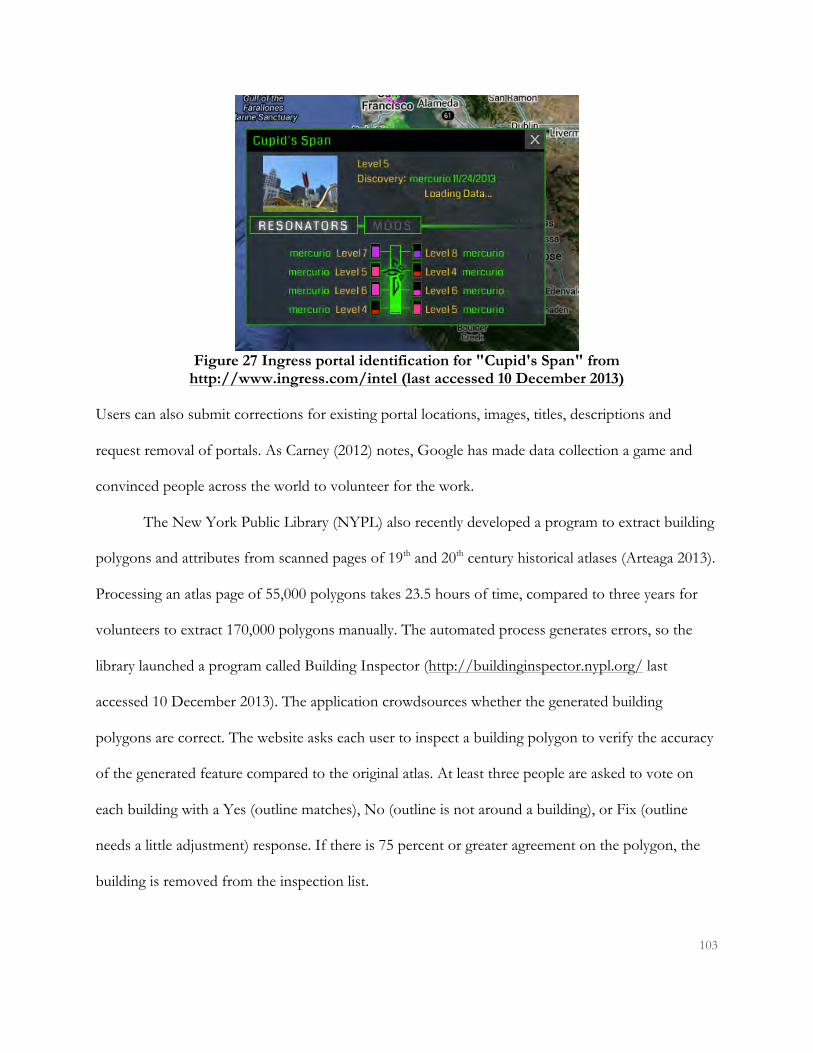
103
Figure 27 Ingress portal identification for "Cupid's Span" from
http://www.ingress.com/intel (last accessed 10 December 2013) Users can also submit corrections for existing portal locations, images, titles, descriptions and
request removal of portals. As Carney (2012) notes, Google has made data collection a game and
convinced people across the world to volunteer for the work.
The New York Public Library (NYPL) also recently developed a program to extract building
polygons and attributes from scanned pages of 19th and 20th century historical atlases (Arteaga 2013).
Processing an atlas page of 55,000 polygons takes 23.5 hours of time, compared to three years for
volunteers to extract 170,000 polygons manually. The automated process generates errors, so the
library launched a program called Building Inspector (http://buildinginspector.nypl.org/ last
accessed 10 December 2013). The application crowdsources whether the generated building
polygons are correct. The website asks each user to inspect a building polygon to verify the accuracy
of the generated feature compared to the original atlas. At least three people are asked to vote on
each building with a Yes (outline matches), No (outline is not around a building), or Fix (outline
needs a little adjustment) response. If there is 75 percent or greater agreement on the polygon, the
building is removed from the inspection list.

104
Mauricio Giraldo Arteaga, the lead developer from the NYPL Labs, remarked in a private
conversation, 7 November 2013, that the Building Inspector program response surpassed everyone’s
wildest expectation. In the first two weeks over 5000 people had voted 350,000 times on polygons.
63,000 out of 65,000 total polygons had received 75 percent agreement of three or more votes.
NYPL Labs will provide more scanned maps for inspection and look at how they can crowd source
fixing the polygons flagged for fixing.
Google draws on the appeal of playing a competitive team game with an evolving story line
to collect data. The added appeal of Google’s approach is people participate by physically engaging
with landmarks. NYPL Labs leverages the popularity of the New York Public Library. The Building
Inspector application provides a simple way to participate in quality control that appeals to people’s
interest in old maps, requires minimal training, and consists of a set of tasks that take only minutes.
7.3 Future Directions for the SFPAM Application The SFPAM application can be improved and enriched in several ways. Functionality should
be added to the www.sfpublicart.com web application to cluster and buffer backend data points
similar to the way social media layers are handled. Clusters and buffered selections would then
display multi-pane popups. Searching and display by attribute and navigation to a POI could also be
implemented. Some changes can engage users to improve data quality through soliciting
feedback.User profiles, comments, ratings, and artist tables could be added to the data model and
database. The application could add functionality for users to provide feedback, view others’
comments, and learn more about artists.
Twitter code could be refactored to include OAUTH authentication on the server side so
that a user could log in to Twitter. Once a user logs in, Twitter can be searched for art tweets and
the results displayed as a layer.

105
The mobile and tablet offering can be improved either by developing native applications for
Android and iOS or by converting the web client code to responsive design. A Google Glass
application potentially could consume REST services as JSON or KML and alert the wearer to
public art or architecture nearby with feature details.
Finally, the data model can be shared as an extensible way of capturing public art and
architecture. The web application code can be shared for public art use in other communities or
adapted for other purposes to combine social media with institutional datasets. As backend data is
reviewed and corrected, the information can be shared with organizations such as the SFAC so that
their official dataset can be corrected. As art works are removed, the database becomes a historical
repository by retaining information about removed art. Forging relationships with art administration
agencies can lead to a partnership that benefits citizens interested in public art and architecture by
making accurate, complete, and timely information readily available to those who want to discover
the city’s treasures.

106
References Apple. 2013. iOS SDK 6.1, XCode 4.6. Cupertino, CA: Apple. ArcGIS Server Development Team. 2010. Lessons learned developing a Web map for volunteered
geographic information (VGI) and social media. http://blogs.esri.com/esri/arcgis/2010/11/04/lessons-learned-developing-a-web-map-for-volunteered-geographic-information-vgi-and-social-media/ (accessed 11 December 2013).
Arteaga, M. G. 2013. Historical map polygon and feature extractor. In MAPINTERACT '13.
Orlando, FL,USA: ACM. Barbier, G., R. Zafarani, H. Gao, G. Fung , and H. Liu. 2012. Maximizing benefits from
crowdsourced data. Computational and Mathematical Organization Theory 18: 257-279. Boulos, K., N. Maged, B. Resch, D. N. Crowley, J. G. Breslin, G. Sohn, R. Burtner, W. A. Pike, E.
Jezierski, and K. Y. S. Chuang. 2011. Crowdsourcing, citizen sensing and sensor web technologies for public and environmental health surveillance and crisis management: trends, OGC standards and application examples. International Journal of Health Geographics 10: 67-67.
Budhathoki, N. R., B. Bruce , and Z. Nedovic-Budic. 2008. Reconceptualizing the role of the user of
spatial data infrastructure. GeoJournal 72: 149–160. Carney, M. 2012. Google’s Ingress is more than a game, it’s a potential data exploitation disaster. In
PandoDaily. http://pandodaily.com/2012/11/19/googles-ingress-is-more-than-a-game-its-a-potential-data-exploitation-disaster/ (accessed 11 December 2013).
Cartiere, C. 2008. Coming in from the Cold: A Public Art History. In The Practice of Public Art, ed. C.
Cartiere and S. Willis, 7-17. New York: Routledge. Chen, W. C., A. Battestini, N. Gelfand , and V. Setlur. 2009. Visual summaries of popular landmarks
from community photo collections. 789-792. ACM. Chrisman, N. R. 1984. The role of quality information in the long-term functioning of a geographic
information system. Cartographica, 21: 79-87. Connors, J. P., S. Lei , and M. Kelly. 2012. Citizen Science in the Age of Neogeography: Utilizing
Volunteered Geographic Information for Environmental Monitoring. Annals of the Association of American Geographers, 102: 1267-1289. NewYork: ACM.
Cuff, D., M. Hansen , and J. Kang. 2008. Urban sensing: out of the woods. Communications of the
ACM. 51 (3): 24-33. New York: ACM. Dangermond, J. 2011. A 'New Geospatial Modality' - Interview with Jack Dangermond. In Geospatial

107
World, 14-22. Elwood, S., M. F. Goodchild , and D. Z. Sui. 2012. Researching Volunteered Geographic
Information: Spatial Data, Geographic Research, and New Social Practice. Association of American Geographers. Annals of the Association of American Geographers, 102 (3): 571-590.
Esri. 2013. ArcGIS API for JavaScript 2.7, ArcGIS For Mobile (iOS) 10.1.2, ArcGIS Online,
ArcGIS Runtime SDK for iOS 10.1.1, ArcMap 10.2, ArcMap 10,1 ArcServer 10.2. ArcServer 10.1., Collector for ArcGIS 10.2 (iOS), Public Information Map 2.0. Redlands, CA: Esri.
Feick, R. , and S. Roche. 2013. Understanding the Value of VGI. In Crowdsourcing Geographic
Knowledge: Volunteered Geographic Information (VGI) in Theory and Practice, 15-29. Dordrecht: Springer Netherlands.
Flanagin, A. J., and M. J. Metzger. 2008. The credibility of volunteered geographic information.
GeoJournal, 72 (3/4): 137-148. Goodchild, M. F. (2007) Citizens as sensors: the world of volunteered geography. GeoJournal, 69 (4):
211-221. –––––– 2008. Commentary: whither VGI? GeoJournal, 72 (3): 239-244. Goodchild, M. F. , andJ. A. Glennon (2010) Crowdsourcing geographic information for disaster
response: a research frontier. International Journal of Digital Earth, 3 (3): 231-241. Hall, G. B., R. Chipeniuk, R. D. Feick, M. G. Leahy , andV. Deparday (2010) Community-based
production of geographic information using open source software and Web 2.0. International Journal of Geographical Information Science, 24 (5): 761-781.
Harvey, F. 2013. To Volunteer or to Contribute Locational Information? Towards Truth in Labeling
for Crowdsourced Geographic Information. In Crowdsourcing Geographic Knowledge: Volunteered Geographic Information (VGI) in Theory and Practice, 31-42. Dordrecht: Springer Netherlands.
Hein, H. 2006. Public Art: Thinking Museums Differently. Lanham, MD.: AltaMira Press. Howe, J. 2006. The Rise of Crowdsourcing. Wired.
http://www.wired.com/wired/archive/14.06/crowds.html (accessed 11 December 2013). Hwang, S. , andD. Yu (2012) GPS Localization Improvement of Smartphones Using Built-in
Sensors. International Journal of Smart Home, 6 (3): 1-8. Kennedy, L., M. Naaman, S. Ahern, R. Nair , and T. Rattenbury. 2007. How Flickr helps us make
sense of the world: context and content in community-contributed media collections. Proceedings of the 15th international conference on multimedia, 631-640. ACM.
Knight, C. K. 2008. Public Art: Theory, Practice, and Populism. Malden, MA: Blackwell.

108
Liu, S. B. 2011. Grassroots heritage: A multi-method investigation of how social media sustain the living heritage of historic crises. Doctoral Thesis. University of Colorado at Boulder.
Lunden, I. 2012. Nielsen: Smartphones Used By 50.4% Of U.S. Consumers, Android 48.5% Of
Them. In TechCrunch. (accessed 11 December 2013). Microsoft Corporation. 2010. Microsoft SQL Server 2008 R2. Redmond, WA: Microsoft
Corporation. Miles, M. 2008. Critical Spaces: Monuments and Changes. In The Practice of Public Art, ed. C. Cartiere
and S. Willis, 66-90. New York: Routledge. ––––––. 2009. Public Art. Encyclopedia of Urban Studies. SAGE Publications, Inc. Thousand Oaks, CA:
SAGE Publications, Inc. Milholland, N. , and E. Pultar. 2013. The San Francisco Public Art Map Application: Using VGI and
Social Media to Complement Institutional Data Sources. In MAPINTERACT '13. Orlando, USA: ACM.
Mooney, P., H. Sun, and L. Yan. VGI as a dynamically updating data source in location-based
services in urban environments. In Proceedings of the 2nd annual workshop on ubiquitous crowsourcing, 13-16. ACM.
Newsam, S. 2010. Crowdsourcing What Is Where: Community-Contributed Photos as Volunteered
Geographic Information. IEEE Multimedia, 17 (4):36-45. Phys.org. 2013. Android smartphones rise as iPhone slips, IDC finds. Phys.org.
http://phys.org/news/2013-08-android-smartphones-iphone-idc.html (accessed 11 December 2013).
Pultar, E., M. Raubal, T. J. Cova , and M. F. Goodchild. 2009. Dynamic GIS Case Studies: Wildfire
Evacuation and Volunteered Geographic Information. Transactions in GIS, 13: 85-104. Raubal, M., Winter, S. 2002. Enriching Wayfinding Instructions with Local Landmarks. In Second
International Conference, GIScience, 243-259. Boulder, CO: Springer. Roche, S. 2011. De la cartographie participative aux WikiSIG. In Les SIG au service du développement
territorial, ed. O. Walser, L. Thévoz, F. Joerin, M. Schuler, S. Joost, B. Debarbieux, and H. Dao, 117–129. Lausanne: Presses polytechniques et universitaires romandes.
Rosoff, M. 7 February, 2013. Smartphone market share on public transit in San Francisco.
CITEWorld. http://www.citeworld.com/mobile/21403/smartphone-market-share-public-transit-san-francisco (accessed 11 December 2013).
Smith, M. L., R. Spence, and A. T. Rashid. 2011. Mobile Phones and Expanding Human
Capabilities. Information Technologies & International Development, 7 (3): 77-88.

109
Tsou, M.-H. , andM. Leitner (2013) Visualization of social media: seeing a mirage or a message?
Cartography and Geographic Information Science, 40 (2): 55-60. Wright, A. and R. Haranci. 2011. City's art is a victim of neglect, damage and loss. The New York
Times. http://www.nytimes.com/2011/04/17/us/17bcart.html?pagewanted=all&_r=1& (accessed 11 December 2013).
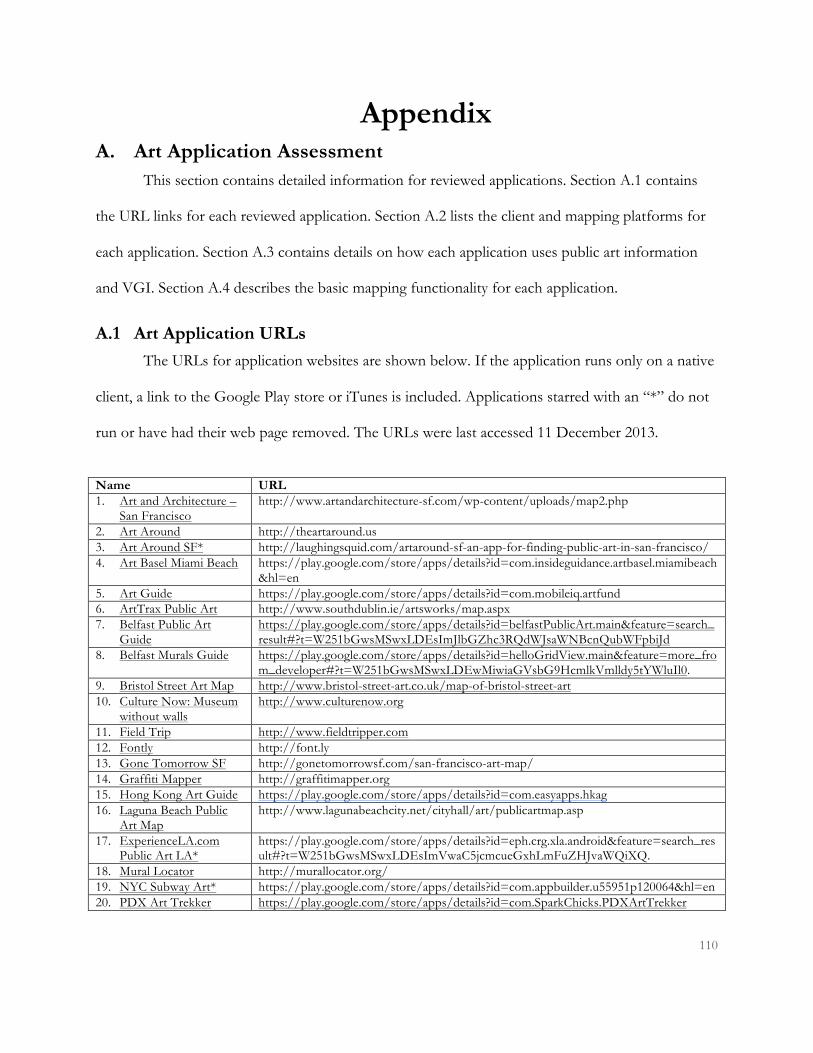
110
Appendix A. Art Application Assessment
This section contains detailed information for reviewed applications. Section A.1 contains
the URL links for each reviewed application. Section A.2 lists the client and mapping platforms for
each application. Section A.3 contains details on how each application uses public art information
and VGI. Section A.4 describes the basic mapping functionality for each application.
A.1 Art Application URLs The URLs for application websites are shown below. If the application runs only on a native
client, a link to the Google Play store or iTunes is included. Applications starred with an “*” do not
run or have had their web page removed. The URLs were last accessed 11 December 2013.
Name URL 1. Art and Architecture –
San Francisco http://www.artandarchitecture-sf.com/wp-content/uploads/map2.php
2. Art Around http://theartaround.us 3. Art Around SF* http://laughingsquid.com/artaround-sf-an-app-for-finding-public-art-in-san-francisco/ 4. Art Basel Miami Beach https://play.google.com/store/apps/details?id=com.insideguidance.artbasel.miamibeach
&hl=en 5. Art Guide https://play.google.com/store/apps/details?id=com.mobileiq.artfund 6. ArtTrax Public Art http://www.southdublin.ie/artsworks/map.aspx 7. Belfast Public Art
Guide https://play.google.com/store/apps/details?id=belfastPublicArt.main&feature=search_result#?t=W251bGwsMSwxLDEsImJlbGZhc3RQdWJsaWNBcnQubWFpbiJd
8. Belfast Murals Guide https://play.google.com/store/apps/details?id=helloGridView.main&feature=more_from_developer#?t=W251bGwsMSwxLDEwMiwiaGVsbG9HcmlkVmlldy5tYWluIl0.
9. Bristol Street Art Map http://www.bristol-street-art.co.uk/map-of-bristol-street-art 10. Culture Now: Museum
without walls http://www.culturenow.org
11. Field Trip http://www.fieldtripper.com 12. Fontly http://font.ly 13. Gone Tomorrow SF http://gonetomorrowsf.com/san-francisco-art-map/ 14. Graffiti Mapper http://graffitimapper.org 15. Hong Kong Art Guide https://play.google.com/store/apps/details?id=com.easyapps.hkag 16. Laguna Beach Public
Art Map http://www.lagunabeachcity.net/cityhall/art/publicartmap.asp
17. ExperienceLA.com Public Art LA*
https://play.google.com/store/apps/details?id=eph.crg.xla.android&feature=search_result#?t=W251bGwsMSwxLDEsImVwaC5jcmcueGxhLmFuZHJvaWQiXQ.
18. Mural Locator http://murallocator.org/ 19. NYC Subway Art* https://play.google.com/store/apps/details?id=com.appbuilder.u55951p120064&hl=en 20. PDX Art Trekker https://play.google.com/store/apps/details?id=com.SparkChicks.PDXArtTrekker

111
21. Privately-Owned Public Open Space (POPOS) and Public Art
http://www.sf-planning.org/index.aspx?page=3339
22. Project Neon http://projectneon.tumblr.com/ 23. Public Art Finder http://sf.publicartapp.mobi 24. Public Art Fund http://www.publicartfund.org/ 25. Public Art Locations * http://www.artmapper.org/ 26. Public Art in Public
Places https://sites.google.com/a/publicartinpublicplaces.info/public-art-in-public-places-project/
27. Public Art Omaha http://publicartomaha.org/search/by_location 28. Public Art PDX http://publicartpdx.com/ 29. San Francisco Mural
Project https://maps.google.com/maps/ms?ie=UTF8&t=h&oe=UTF8&msa=0&msid=105626627087097777761.000491082eb7e90c594eb&dg=feature
30. San Francisco Civic Art Finder
https://itunes.apple.com/us/app/san-francisco-civic-art-finder/id531528632?mt=8
31. San Francisco Landmarks Google Map
http://www.sf-planning.org/index.aspx?page=3313
32. San Francisco Public Art – SF Art*
https://play.google.com/store/apps/details?id=air.com.SFART.app&feature=search_result#?t=W251bGwsMSwxLDEsImFpci5jb20uU0ZBUlQuYXBwIl0.
33. SF Arts.Org http://www.sfarts.org 34. SF Mural Arts http://www.sfmuralarts.com 35. SF Public Art https://itunes.apple.com/us/app/sf-public-art/id580998955?mt=8 36. SFAC Public Art http://www.sfartscommission.org/pubartcollection/pubart-
projects/2008/10/21/public-art-projects-map 37. SF Street Art Map Street art locations primarily in Haight Ashbury, San Francisco 38. SF Street Art 600 photos documenting 250 sites in San Francisco 39. Street Art SF Street Art Photos and locations - no map available 40. SF's Secret Spaces and
Hidden Oases from SPUR Includes POPOS
41. STQRY Art, culture, and historic sites. 42. The Living New Deal New Deal public works projects in the US. More than public art and architecture. 322 projects for
San Francisco some of which are art and architecture. 43. Tram Art* Art in the vicinity of Amsterdam’s trains 44. 1:AM Mobile Application Archive of street art movement and community of street art enthusiasts.
A.2 Art Application Client and Mapping Platforms Name Client Mapping Platform 1. Art and Architecture – San Francisco Web Google 2. Art Around iOS, Android, Web Google 3. Art Around SF* N/A N/A 4. Art Basel Miami Beach Android Google 5. Art Guide Android Google 6. ArtTrax Public Art Web , iOS, Android Google 7. Belfast Public Art Guide Android Google 8. Belfast Murals Guide Android Google 9. Bristol Street Art Map Web Google 10. Culture Now: Museum without walls iOS, Android, Web Google 11. Field Trip iOS, Android Google 12. Fontly iOS, Android, Web Google 13. Gone Tomorrow SF Mobile friendly web version Google

112
Name Client Mapping Platform 14. Graffiti Mapper IOS, Web Leaflet, Open Street Maps 15. Hong Kong Art Guide Android Google 16. Laguna Beach Public Art Map Web Google 17. ExperienceLA.com Public Art LA* Android, Web Google 18. Mural Locator Web Google 19. NYC Subway Art* Android Unknown 20. PDX Art Trekker Android Google 21. Privately-Owned Public Open Space (POPOS) and
Public Art Web Google
22. Project Neon iOS Google 23. Public Art Finder Web Google 24. Public Art Fund Web Google 25. Public Art Locations* Web Google 26. Public Art in Public Places Web Google 27. Public Art Omaha iOS, Android, Web Google 28. Public Art PDX iOS, Web Google 29. San Francisco Civic Art Finder iOS Google 30. San Francisco Landmarks Google Map Web Google 31. San Francisco Mural Project Web Google 32. San Francisco Public Art – SF Art* Android Google 33. SF Arts.Org iOS, Android, Web Mapquest 34. SF Mural Arts IOS, Web Google 35. SF Public Art iOS Google 36. SFAC Public Art Web Google 37. SF Street Art Map Web Google 38. SF Street Art iOS Google 39. Street Art SF Web N/A 40. SF's Secret Spaces and Hidden Oases from SPUR iOS, Web Apple 41. STQRY iOS, Android,, Web, Windows Mapbox 42. The Living New Deal Web Google 43. Tram Art* Android Google 44. 1:AM Mobile Application iOS Google
A.3 Art Location Data, VGI and Social Media
Name Public Arts Commission
layer(s) or data
Art Events
VGI: User Contributed
Art Locations
VGI: User comments (C),
ratings (R), photos (P),
flag for offensive (F),
like (L)
VGI: User generated
content through social media stream
Review of user art
submissions
Share art location/ event
with social media - Twitter,
Foursquare, Facebook, g+
1. Art and Architecture – San Francisco
Y includes subset of public art commission
POIs.
N N C (on blog entry)
N N Y (can share blog entry)
2. Art Around Unknown Y Y C, P N Y N 3. Art Around SF* N N/A N/A N/A N/A N/A N/A 4. Art Basel Miami Beach N Y N N N N N 5. Art Guide Y Y N N N N N 6. ArtTrax Public Art Y N N N N N N 7. Belfast Public Art Guide Y N N N N N N

113
Name Public Arts Commission
layer(s) or data
Art Events
VGI: User Contributed
Art Locations
VGI: User comments (C),
ratings (R), photos (P),
flag for offensive (F),
like (L)
VGI: User generated
content through social media stream
Review of user art
submissions
Share art location/ event
with social media - Twitter,
Foursquare, Facebook, g+
8. Belfast Murals Guide N N N N N N N 9. Bristol Street Art Map Unknown Y Y P N Y N 10. Culture Now: Museum
without walls Y Y Y N N Y Twitter,
Faceboook 11. Field Trip Y N N C, F N N Twitter, g+ 12. Fontly N N Y L, P N N Twitter 13. Gone Tomorrow SF N N N C N N Y (can share
blog entry) 14. Graffiti Mapper N N Y P N N N 15. Hong Kong Art Guide N Y N C N N Fscebook 16. Laguna Beach Public Art
Map Y N N N N N/A N
17. ExperienceLA.com Public Art LA*
Y (subset) N N Unknown N N N
18. Mural Locator N Y Y C N Y Twitter, Facebook, g+
19. NYC Subway Art* N N Unknown Unknown N Unknown Unknown 20. PDX Art Trekker Y N N N N N N 21. Privately-Owned Public
Open Space (POPOS) and Public Art
N N N N N N/A N
22. Project Neon N N N R N N/A Twitter, Facebook
23. Public Art Finder Y N N N N N/A N 24. Public Art Fund Y Y N P N N/A Twitter,
Faceboook 25. Public Art Locations* N N Y P, Photo
required for submission
Y, @PublicA
rtApp twitter hastag
N N
26. Public Art in Public Places Y N N N N N/A N 27. Public Art Omaha Y N N N N N/A N 28. Public Art PDX Y N Y Adjust accuracy
of location N Y N
29. San Francisco Mural Project
N N N N N N/A N
30. San Francisco Civic Art Finder
Y N N N N N/A N
31. San Francisco Landmarks Google Map
N N N N N N/A N
32. San Francisco Public Art – SF Art*
Y N Unknown Unknown N N/A Unknown
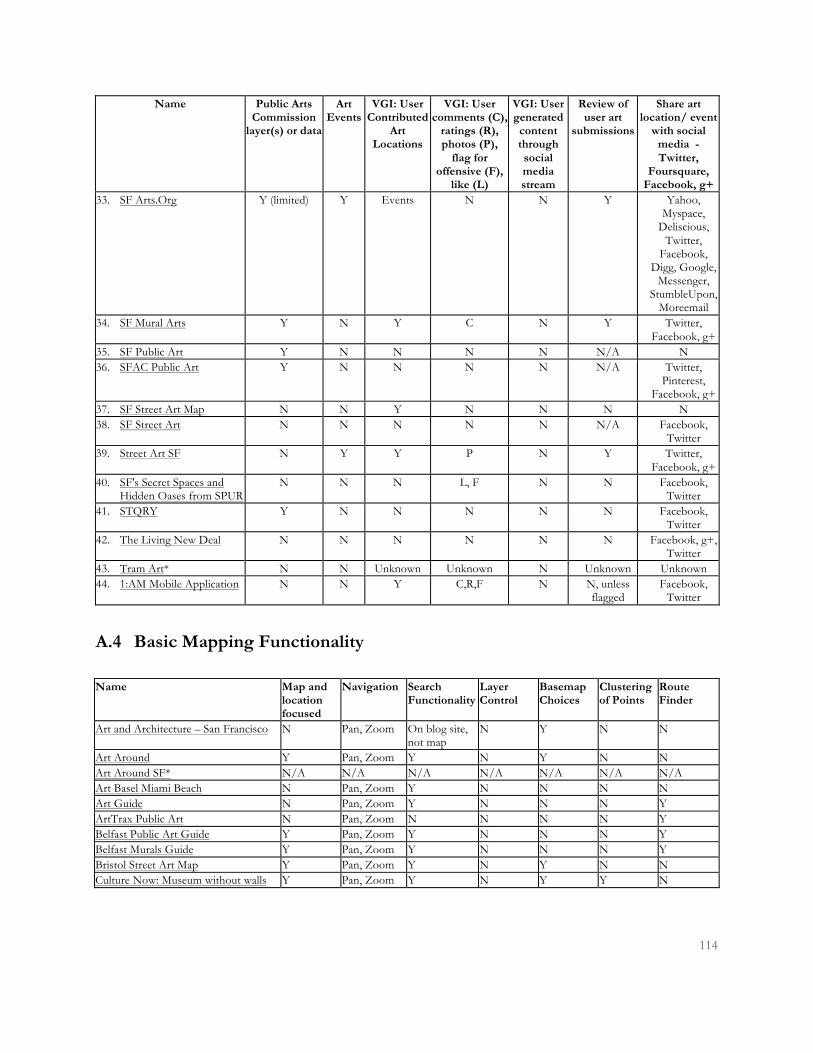
114
Name Public Arts Commission
layer(s) or data
Art Events
VGI: User Contributed
Art Locations
VGI: User comments (C),
ratings (R), photos (P),
flag for offensive (F),
like (L)
VGI: User generated
content through social media stream
Review of user art
submissions
Share art location/ event
with social media - Twitter,
Foursquare, Facebook, g+
33. SF Arts.Org Y (limited) Y Events N N Y Yahoo, Myspace,
Deliscious, Twitter,
Facebook, Digg, Google,
Messenger, StumbleUpon,
Moreemail 34. SF Mural Arts Y N Y C N Y Twitter,
Facebook, g+ 35. SF Public Art Y N N N N N/A N 36. SFAC Public Art Y N N N N N/A Twitter,
Pinterest, Facebook, g+
37. SF Street Art Map N N Y N N N N 38. SF Street Art N N N N N N/A Facebook,
Twitter 39. Street Art SF N Y Y P N Y Twitter,
Facebook, g+ 40. SF's Secret Spaces and
Hidden Oases from SPUR N N N L, F N N Facebook,
Twitter 41. STQRY Y N N N N N Facebook,
Twitter 42. The Living New Deal N N N N N N Facebook, g+,
Twitter 43. Tram Art* N N Unknown Unknown N Unknown Unknown 44. 1:AM Mobile Application N N Y C,R,F N N, unless
flagged Facebook,
A.4 Basic Mapping Functionality Name Map and
location focused
Navigation Search Functionality
Layer Control
Basemap Choices
Clustering of Points
Route Finder
Art and Architecture – San Francisco N Pan, Zoom On blog site, not map
N Y N N
Art Around Y Pan, Zoom Y N Y N N Art Around SF* N/A N/A N/A N/A N/A N/A N/A Art Basel Miami Beach N Pan, Zoom Y N N N N Art Guide N Pan, Zoom Y N N N Y ArtTrax Public Art N Pan, Zoom N N N N Y Belfast Public Art Guide Y Pan, Zoom Y N N N Y Belfast Murals Guide Y Pan, Zoom Y N N N Y Bristol Street Art Map Y Pan, Zoom Y N Y N N Culture Now: Museum without walls Y Pan, Zoom Y N Y Y N
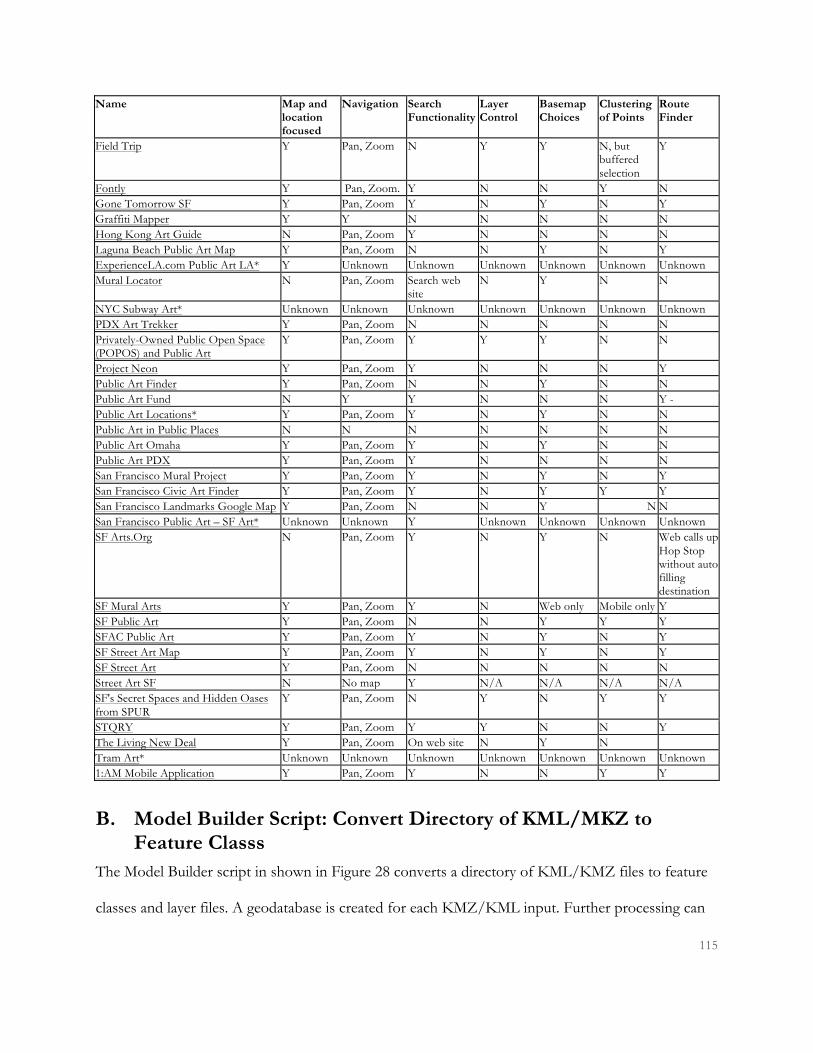
115
Name Map and location focused
Navigation Search Functionality
Layer Control
Basemap Choices
Clustering of Points
Route Finder
Field Trip Y Pan, Zoom N Y Y N, but buffered selection
Y
Fontly Y Pan, Zoom. Y N N Y N Gone Tomorrow SF Y Pan, Zoom Y N Y N Y Graffiti Mapper Y Y N N N N N Hong Kong Art Guide N Pan, Zoom Y N N N N Laguna Beach Public Art Map Y Pan, Zoom N N Y N Y ExperienceLA.com Public Art LA* Y Unknown Unknown Unknown Unknown Unknown Unknown Mural Locator N Pan, Zoom Search web
site N Y N N
NYC Subway Art* Unknown Unknown Unknown Unknown Unknown Unknown Unknown PDX Art Trekker Y Pan, Zoom N N N N N Privately-Owned Public Open Space (POPOS) and Public Art
Y Pan, Zoom Y Y Y N N
Project Neon Y Pan, Zoom Y N N N Y Public Art Finder Y Pan, Zoom N N Y N N Public Art Fund N Y Y N N N Y - Public Art Locations* Y Pan, Zoom Y N Y N N Public Art in Public Places N N N N N N N Public Art Omaha Y Pan, Zoom Y N Y N N Public Art PDX Y Pan, Zoom Y N N N N San Francisco Mural Project Y Pan, Zoom Y N Y N Y San Francisco Civic Art Finder Y Pan, Zoom Y N Y Y Y San Francisco Landmarks Google Map Y Pan, Zoom N N Y N N San Francisco Public Art – SF Art* Unknown Unknown Y Unknown Unknown Unknown Unknown SF Arts.Org N Pan, Zoom Y N Y N Web calls up
Hop Stop without auto filling destination
SF Mural Arts Y Pan, Zoom Y N Web only Mobile only Y SF Public Art Y Pan, Zoom N N Y Y Y SFAC Public Art Y Pan, Zoom Y N Y N Y SF Street Art Map Y Pan, Zoom Y N Y N Y SF Street Art Y Pan, Zoom N N N N N Street Art SF N No map Y N/A N/A N/A N/A SF's Secret Spaces and Hidden Oases from SPUR
Y Pan, Zoom N Y N Y Y
STQRY Y Pan, Zoom Y Y N N Y The Living New Deal Y Pan, Zoom On web site N Y N Tram Art* Unknown Unknown Unknown Unknown Unknown Unknown Unknown 1:AM Mobile Application Y Pan, Zoom Y N N Y Y
B. Model Builder Script: Convert Directory of KML/MKZ to Feature Classs
The Model Builder script in shown in Figure 28 converts a directory of KML/KMZ files to feature
classes and layer files. A geodatabase is created for each KMZ/KML input. Further processing can

116
be performed to combine the resulting feature classes using the ArcGIS Data Management Append
tool.
Figure 28 Convert Directory of KMZ/KML to Feature Class
C. Popup Information Template The following template was used in ArcMap to configure PopupInfo fields containing
HTML to display correctly when selecting the POI in the web application.
<?xml version="1.0" encoding="UTF-8"?> <xsl:stylesheet version="1.0" xmlns:xsl="http://www.w3.org/1999/XSL/Transform" xmlns:fo="http://www.w3.org/1999/XSL/Format" xmlns:msxsl="urn:schemas-microsoft-com:xslt"> <xsl:template match="/"> <html> <head> </head> <body> <table> <tr><td style="white-space: nowrap;"> <xsl:choose> <xsl:when test="FieldsDoc/Fields/Field/FieldName"> <xsl:apply-templates select="FieldsDoc/Fields/Field/FieldName[contains(., 'PopupInfo')]/.." /> </xsl:when> <xsl:otherwise> <xsl:apply-templates select="FieldsDoc/Fields/Field"/> </xsl:otherwise> </xsl:choose> </td></tr>

117
</table> </body> </html> </xsl:template> <xsl:template match="Field"> <xsl:value-of select="FieldValue" disable-output-escaping="yes"/> </xsl:template> </xsl:stylesheet>
D. Code Snippets for Basemaps The following sections contain code snippets for configuring basemaps for inclusion in
SFPAM, as well as some of the coding to use Stamen Design web tile maps.
D.1 Basemaps.js Configuration Snippet // START ITEM { uniqueID: 'wtr', title: 'StamenWatercolor', thumbnail: 'images/basemap/stamen_watercolor.jpg', stamen: true, url: 'http://${0}.stamen.com/watercolor/${1}/${2}/${3}.jpg', copyrightText: '© Map Tiles by <a href="http://www.stamendesign.com/" target="_blank">Stamen Design</a> under <a href="http://creativecommons.org/licenses/by-sa/3.0/" target="_blank">CC-BY-SA</a>.<br /> Data by <a href="http://openstreetmap.org">OpenStreetMap</a>, under <a href="http://creativecommons.org/licenses/by-sa/3.0">CC BY SA</a>.' }, // END ITEM // START ITEM { uniqueID: 'tnr', title: 'StamenToner', thumbnail: 'images/basemap/stamen_toner.jpg', stamen: true, url: 'http://${0}.stamen.com/toner/${1}/${2}/${3}.png', copyrightText: '© Map Tiles by <a href="http://www.stamendesign.com/" target="_blank">Stamen Design</a> under <a href="http://creativecommons.org/licenses/by-sa/3.0/" target="_blank">CC-BY-SA</a>.<br /> Data by <a href="http://openstreetmap.org">OpenStreetMap</a>, under <a href="http://creativecommons.org/licenses/by-sa/3.0">CC BY SA</a>.' }, // END ITEM // START ITEM { uniqueID: 'stp', title: 'StamenTerrain', thumbnail: 'images/basemap/stamen_terrain.jpg', stamen: true, url: 'http://${0}.stamen.com/terrain/${1}/${2}/${3}.jpg', copyrightText: '© Map Tiles by <a href="http://www.stamendesign.com/" target="_blank">Stamen Design</a> under <a href="http://creativecommons.org/licenses/by-sa/3.0/" target="_blank">CC-BY-SA</a>.<br /> Data by <a href="http://openstreetmap.org">OpenStreetMap</a>, under <a href="http://creativecommons.org/licenses/by-sa/3.0">CC BY SA</a>.' }, // START ITEM {

118
uniqueID: 'gry', title: 'Light Grey', thumbnail: 'images/basemap/light_gray_canvas_with_labels__ne_usa.jpg', services: [ { url: 'http://services.arcgisonline.com/ArcGIS/rest/services/Canvas/World_Light_Gray_Base/MapServer' }, { url: 'http://services.arcgisonline.com/ArcGIS/rest/services/Canvas/World_Light_Gray_Reference/MapServer' } ] } // END ITEM
D.2 mapBasemaps.js Code Snippet to Determine if Basemap is from Stamen /*------------------------------------*/ // BASE MAP TOGGLE FUNCTIONS /*------------------------------------*/ function configureBasemaps(){ var i; var j; var mq = ["a.tile", "b.tile", "c.tile"]; var abc = ["a", "b", "c"]; if(userConfig.basemapItems){ // ADD CONTAINER $('#basemapMenu').html('<div id="baseContainer"></div>'); // HTML var html = ''; for(i = 0; i < userConfig.basemapItems.length; ++i){ userConfig.basemapArray[i] = []; console.log (userConfig.basemapItems[i].stamen); if(userConfig.basemapItems[i].osm){ userConfig.basemapArray[i][0] = new esri.layers.OpenStreetMapLayer({ id: userConfig.basemapItems[i].uniqueID + '0', visible: false }); map.addLayer(userConfig.basemapArray[i][0]); } else if (userConfig.basemapItems[i].stamen) { //Add Stamen layers userConfig.basemapArray[i][0] = new esri.layers.WebTileLayer(userConfig.basemapItems[i].url, { id: userConfig.basemapItems[i].uniqueID + '0', visible: false, tileServers: mq }); map.addLayer(userConfig.basemapArray[i][0]); } else{ for(j=0; j < userConfig.basemapItems[i].services.length; j++){ userConfig.basemapArray[i][j] = new esri.layers.ArcGISTiledMapServiceLayer(userConfig.basemapItems[i].services[j].url, { id: userConfig.basemapItems[i].uniqueID + j, visible: false });

119
map.addLayer(userConfig.basemapArray[i][j]); } } var extraClass = ''; var clearDiv = false; if((i + 1) % 2 === 0){ extraClass = 'MB ML'; clearDiv = true; if((i + 1) === userConfig.basemapItems.length){ extraClass = 'ML'; } } var bmSelected = ''; if(i === 0){ bmSelected = 'basemapSelected'; } html += '<div data-basemap-id="' + i + '" title="Switch to the ' + userConfig.basemapItems[i].title + ' Basemap" class="baseMap ' + bmSelected + ' ' + extraClass + '"><div class="baseImage"><img width="100" height="67" class="BG" src="' + userConfig.basemapItems[i].thumbnail + '" /></div><div class="baseTitle">' + userConfig.basemapItems[i].title + '</div></div>'; if(clearDiv){ html += '<div class="clear"></div>'; } } html += '<div class="clear"></div>'; $('#baseContainer').html(html); configBasemap(); } }
D.3 mapBasemaps.js Code Snippet to create WebTileLayer Class // define the WebTileLayer class dojo.ready(function() { dojo.declare("esri.layers.WebTileLayer", [esri.layers.TiledMapServiceLayer], { constructor: function(urlTemplate, options) { var ext = new esri.geometry.Extent({"xmin":-22041259,"ymin":-33265069,"xmax":22041259,"ymax":33265069,"spatialReference":{"wkid":102100}}); var lods = [ {"level" : 0, "resolution" : 156543.033928, "scale" : 591657527.591555}, {"level" : 1, "resolution" : 78271.5169639999, "scale" : 295828763.795777}, {"level" : 2, "resolution" : 39135.7584820001, "scale" : 147914381.897889}, {"level" : 3, "resolution" : 19567.8792409999, "scale" : 73957190.948944}, {"level" : 4, "resolution" : 9783.93962049996, "scale" : 36978595.474472}, {"level" : 5, "resolution" : 4891.96981024998, "scale" : 18489297.737236}, {"level" : 6, "resolution" : 2445.98490512499, "scale" : 9244648.868618}, {"level" : 7, "resolution" : 1222.99245256249, "scale" : 4622324.434309}, {"level" : 8, "resolution" : 611.49622628138, "scale" : 2311162.217155}, {"level" : 9, "resolution" : 305.748113140558, "scale" : 1155581.108577}, {"level" : 10, "resolution" : 152.874056570411, "scale" : 577790.554289}, {"level" : 11, "resolution" : 76.4370282850732, "scale" : 288895.277144}, {"level" : 12, "resolution" : 38.2185141425366, "scale" : 144447.638572}, {"level" : 13, "resolution" : 19.1092570712683, "scale" : 72223.819286}, {"level" : 14, "resolution" : 9.55462853563415, "scale" : 36111.909643}, {"level" : 15, "resolution" : 4.77731426794937, "scale" : 18055.954822}, {"level" : 16, "resolution" : 2.38865713397468, "scale" : 9027.977411}, {"level" : 17, "resolution" : 1.19432856685505, "scale" : 4513.988705}, {"level" : 18, "resolution" : 0.597164283559817, "scale" : 2256.994353}, {"level" : 19, "resolution" : 0.298582141647617, "scale" : 1128.497176} ]; this.spatialReference = new esri.SpatialReference({ wkid: 102100 });

120
this.initialExtent = this.fullExtent = ext; this.tileInfo = new esri.layers.TileInfo({ "rows" : 256, // can also be height "cols" : 256, // can also be width "origin" : { "x" : -20037508.342787, "y" : 20037508.342787 }, "spatialReference" : { "wkid" : 102100 }, "lods" : lods }); this.copyright = options.copyrightText || ""; this.urlTemplate = urlTemplate; this.tileServers = options.tileServers || []; this.loaded = true; this.onLoad(this); }, getTileUrl: function(level, row, col) { var tileServer = this.tileServers[parseInt(Math.random()*this.tileServers.length)]; // console.log("tile server is: ", tileServer); var tileUrl; if ( tileServer ) { tileUrl = dojo.string.substitute(this.urlTemplate, [tileServer, level, col, row]); } else { tileUrl = dojo.string.substitute(this.urlTemplate, [level, col, row]); } // console.log("tile url: ", tileUrl); } return tileUrl;
E. Sample REST Feature Configuration Using Unique Value Rendering
The code following is an excerpt from the layers.js file which defines REST services to
include in the application. The REST service is configured to use unique value rendering based on
the values found in the attribute field, “Type.”
//Start Item //FEATURELAYERS REFERENCE THE FEATURES IN A LAYER, DOES NOT INCLUDE THE SYMBOLOGY AS MAP SERVICES // CHOOSE RENDERER TO SYMBOLIZE FEATURES – SimpleRenderer, ClassBreakRenderer UniqueValueRenderer //START ITEM: CLASS BREAK RENDERER - Symbolizes graphic based on value of a numeric attribute { uniqueID: 'art', // Unique ID (string) for layer featureLayer: { cluster: true, //Sample URL to rest endpoint of a layer in a map service url: 'http://nmilholl.usc.edu:6080/ArcGIS/rest/services/SFPubArt84M/MapServer/0', uniqueValueRenderer: { attributeField: 'Type', //this is case sensitive. Look up the attribute's exact case and spelling using the rest endpoint //you defined above. categories: [ //Default {

121
uniqueValue: '', symbol: { type: 'point', style: 'circle', size: 10, color: "red" }, label: 'Default', description: 'Default' }, //Fiber { uniqueValue: 'Fiber', symbol: { type: 'picture', url: 'images/legend/fiber.png', height: 20, width: 20 }, label: 'Fiber', description: 'Fiber arts' }, //Glass/Light { uniqueValue: 'Glass/Light', symbol: { type: 'picture', url: 'images/legend/glass.png', height: 20, width: 20 }, label: 'Glass/Light', description: 'Glass and Light art pieces' }, //Glass/Light { uniqueValue: 'Glaze/Mosaic', symbol: { type: 'picture', url: 'images/legend/tile.png', height: 20, width: 20 }, label: 'Glaze/Mosaic', description: 'Glaze and Mosaic pieces' }, //Mural { uniqueValue: 'Mural', symbol: { type: 'picture', url: 'images/legend/mural.png', height: 20, width: 20 }, label: 'Mural', description: 'Murals' },

122
//Painting/Drawing { uniqueValue: 'Painting/Drawing', symbol: { type: 'picture', url: 'images/legend/painting.png', height: 20, width: 20 }, label: 'Painting/Drawing', description: 'Paintings and Drawings' }, //Sculpture { uniqueValue: 'Sculpture/Mixed media', symbol: { type: 'picture', url: 'images/legend/sculpture.png', width: 20, height: 20 }, label: 'Sculpture/Mixed Media', description: 'Sculpture and Mixed Media' } //ADD OR REMOVE BREAKS AS NEEDED ] } }, infoWindow: { windowTitle: 'San Francisco Art', attributes: [ { 'title': 'Title', 'attributeLabel': 'title',//this is case sensitive. 'url': false }, { 'title': 'Artist', 'attributeLabel': 'artist', 'url': false }, { 'title': 'Medium', 'attributeLabel': 'medium', 'url': false }, { 'title': 'Type', 'attributeLabel': 'Type', 'url': false }, { 'title': 'Location', 'attributeLabel': 'location_d', 'url': false } ] }, //DESCRIPTIVE INFORMATION FOR LAYER LIST layerInfo: { title: 'Art', // Title visible in the Layers drops down list description: 'San Francisco Public Art information courtesy of <a

123
href="https://data.sfgov.org/d/zfw6-95su" target="_blank">data.sfgov.org</a> and the San Francisco Arts Commission.', //Layer description visible from the layer's info menu in the layer list transparencySlider: true, // Does your layer require transparency? Valid values are 'true' and 'false' transparency: 0.9, // If so, what is the default transparancy value? Values range from 0.0 to 1.0, where 0.0 is 100% //transparent and 1.0 has no transparency. visible: true, // Is the layer visible by default when the app loads? legendIcon: 'images/legend/painting.png' // Reference your own image }, customLegend : "" }, //END ITEM
F. ArcGIS Domain Values This section lists the full set of domain values that describe architect names, neighborhoods,
and building styles.
F.1 Architect Names (Archnames) Domain Values Description Coded Value A. Page Brown A. Page Brown Bernard Maybeck Bernard Maybeck Ernest Coxhead Ernest Coxhead Frank Lloyd Wright Frank Lloyd Wright George Applegarth George Applegarth Henry Doelger Henry Doelger James Dunn James Dunn Joe Esherick Joe Esherick John Galen Howard John Galen Howard Joseph Eichler Joseph Eichler Julia Morgan Julia Morgan Julius Krafft Julius Krafft Other Other Samuel Newsom Samuel Newsom Timothy Pflueger Timothy Pflueger Unknown Unknown Walter Bliss and William Faville Walter Bliss and William Faville William Mooser II William Mooser II WIlliam Mooser III WIlliam Mooser III Willis Polk Willis Polk
F.2 Neighborhood Domain Values Description Coded Value Alcatraz Alcatraz Bayview Bayview

124
Description Coded Value Bernal Heights Bernal Heights Castro/Upper Market Castro/Upper Market Chinatown Chinatown Diamond Heights Diamond Heights Downtown/Civic Center Downtown/Civic Center Excelsior Excelsior Financial District Financial District Glen Park Glen Park Golden Gate Park Golden Gate Park Inner Richmond Inner Richmond Inner Sunset Inner Sunset Lakeshore Lakeshore Marina Marina Mission Mission Nob Hill Nob Hill Noe Valley Noe Valley North Beach North Beach Ocean View Ocean View Outer Mission Outer Mission Outer Richmond Outer Richmond Outer Sunset Outer Sunset Parkside Parkside Potrero Hill Potrero Hill Russian Hill Russian Hill Seacliff Seacliff SFO Airport, San Francisco, San Mateo County SFO Airport, San Francisco, San Mateo County South of Market South of Market Sunnyside Sunnyside Treasure Island/YBI Treasure Island/YBI Twin Peaks Twin Peaks Visitacion Valley Visitacion Valley West of Twin Peaks West of Twin Peaks Western Addition Western Addition
F.3 Building Style (Style)
Description Coded Value Art Deco Art Deco Arts and Crafts Arts and Crafts Beaux Arts Beaux Arts Brutalism Brutalism Colonial Revival Colonial Revival Deconstructionism Deconstructionism EarthQuake Cottage EarthQuake Cottage
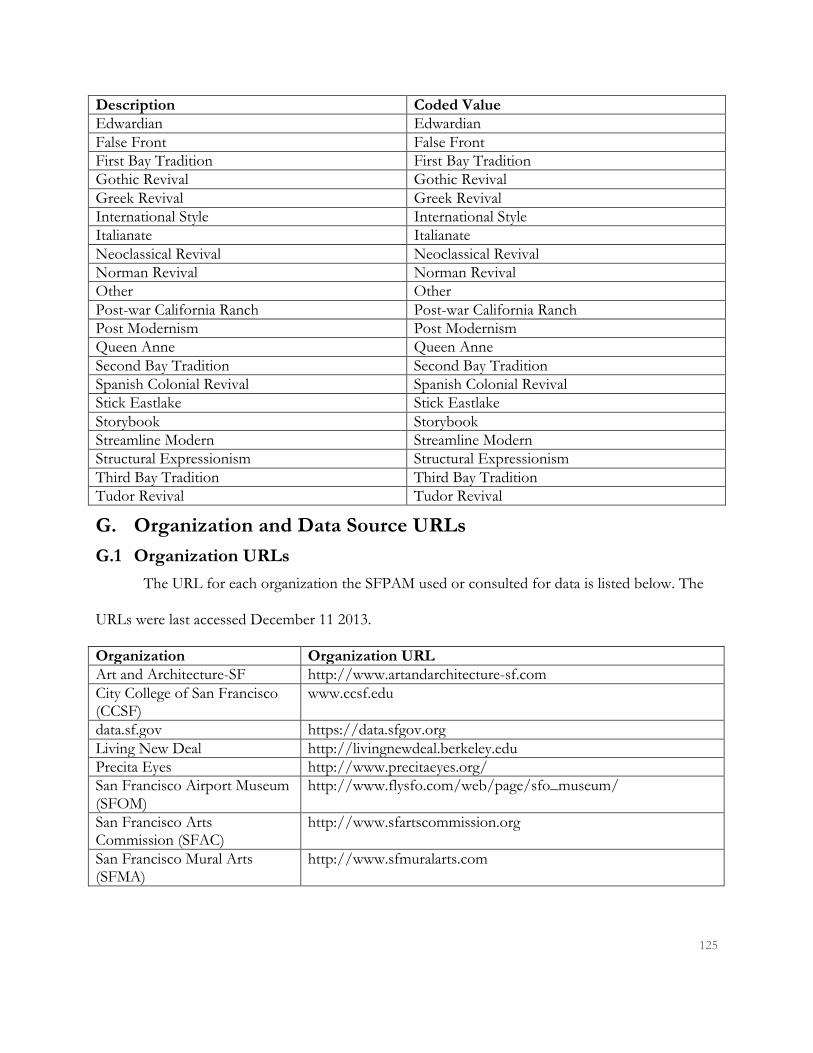
125
Description Coded Value Edwardian Edwardian False Front False Front First Bay Tradition First Bay Tradition Gothic Revival Gothic Revival Greek Revival Greek Revival International Style International Style Italianate Italianate Neoclassical Revival Neoclassical Revival Norman Revival Norman Revival Other Other Post-war California Ranch Post-war California Ranch Post Modernism Post Modernism Queen Anne Queen Anne Second Bay Tradition Second Bay Tradition Spanish Colonial Revival Spanish Colonial Revival Stick Eastlake Stick Eastlake Storybook Storybook Streamline Modern Streamline Modern Structural Expressionism Structural Expressionism Third Bay Tradition Third Bay Tradition Tudor Revival Tudor Revival
G. Organization and Data Source URLs G.1 Organization URLs
The URL for each organization the SFPAM used or consulted for data is listed below. The
URLs were last accessed December 11 2013.
Organization Organization URL Art and Architecture-SF http://www.artandarchitecture-sf.com City College of San Francisco (CCSF)
www.ccsf.edu
data.sf.gov https://data.sfgov.org Living New Deal http://livingnewdeal.berkeley.edu Precita Eyes http://www.precitaeyes.org/ San Francisco Airport Museum (SFOM)
http://www.flysfo.com/web/page/sfo_museum/
San Francisco Arts Commission (SFAC)
http://www.sfartscommission.org
San Francisco Mural Arts (SFMA)
http://www.sfmuralarts.com

126
San Francisco Planning Commission (SFPC)
http://www.sf-planning.org/index.aspx?page=2426
University of California San Francisco (UCSF)
http://chancellor.ucsf.edu/MBA/
Waymarking.com http://www.waymarking.com Yerba Buena Gardens (YBG) http://www.yerbabuenagardens.com
G.2 Dataset URLs The organization, dataset description, and specific map or URL for accessing dataset
information is listed below. The URLs were last accessed December 11 2013.
Organization Dataset Map or dataset URL Art and Architecture-SF
Art and architecture POIs scraped from html and JavaScript, additional details from website
http://www.artandarchitecture-sf.com/wp-content/uploads/map2.php http://www.artandarchitecture-sf.com
CCSF Ocean Campus Art Shapefile that is not publicly available data.sf.gov SF Neighborhoods https://data.sfgov.org/Geography/Planning-
Neighborhoods/qc6m-r4ih Living New Deal Reference information,
location and, pictures http://livingnewdeal.berkeley.edu/map/
Precita Eyes Hard copy map http://www.precitaeyes.org/ SFAC, data.sf.gov Excel spreadsheet with 692
entries, additional images and descriptions from website
https://data.sfgov.org/Arts-Culture-and-Recreation-/SF-Civic-Art-Collection/zfw6-95su http://www.sfartscommission.org/pubartcollection/pubart-projects/2008/10/20/public-art-projects-list/
SFOM Location of exhibitions http://www.flysfo.com/web/page/sfo_museum/exhibitions/map/location_map.html http://www.flysfo.com/web/page/sfo_museum/exhibitions/ for specific exhibition information
SFMA JSON data of San Francisco neighborhood murals scraped from accessing Google map
http://www.sf-planning.org/index.aspx?page=3313
SFPC Landmarks from KML file http://www.sf-planning.org/index.aspx?page=3313
SFPC, data.sfgov.org
POPOS from KML files https://data.sfgov.org/Geography/Privately-Owned-Public-Open-Space-POPOS-and-Public/55um-v9vc?
UCSF UCSF Mission Bay Art Locations from PDF map and site visit
http://chancellor.ucsf.edu/MBA/docs/MBA03_10.pdf
Waymarking.com KML downloads generated by search for art, monuments, statues, and murals in San
http://www.waymarking.com

127
Francisco. Yerba Buena Gardens (YBG)
Data collected from website and site visit
http://www.yerbabuenagardens.com/features/gardens.html http://www.yerbabuenagardens.com/features/public-art.html http://www.yerbabuenagardens.com/maps.html