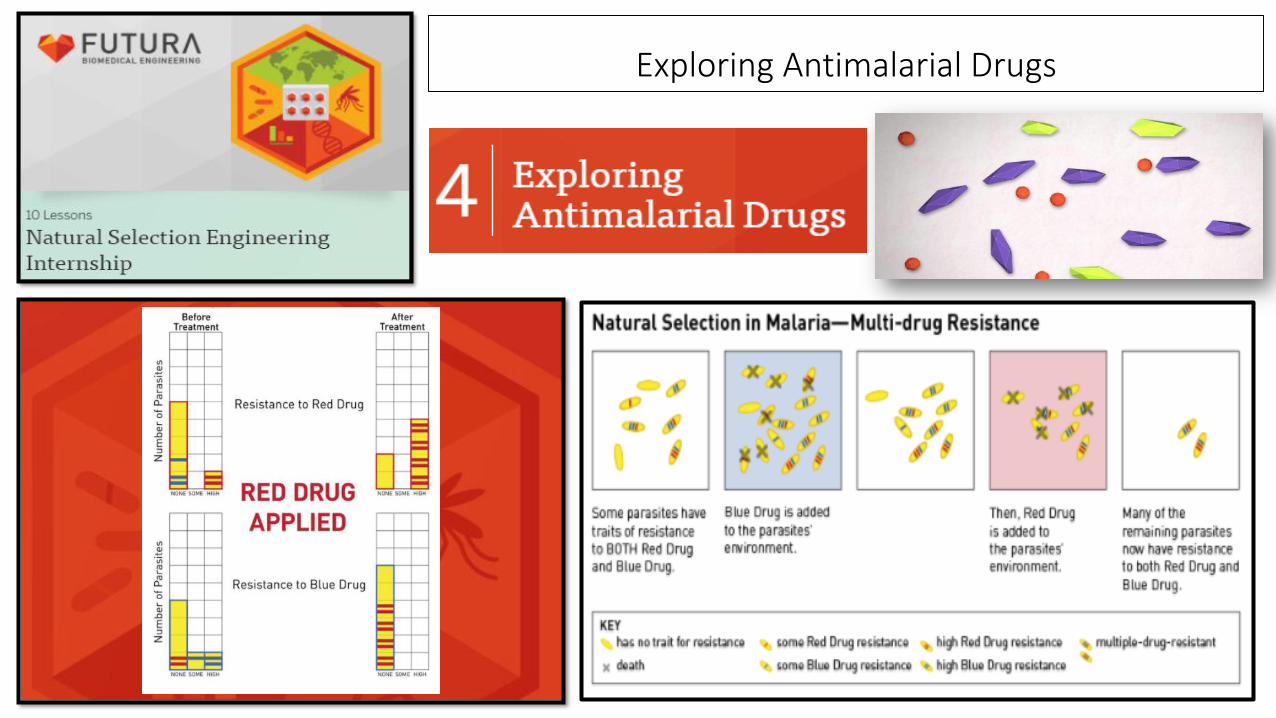
Exploring Antimalarial Drugs
33
Exploring Antimalarial Drugs
Transcript of Exploring Antimalarial Drugs
Exploring Antimalarial Drugs
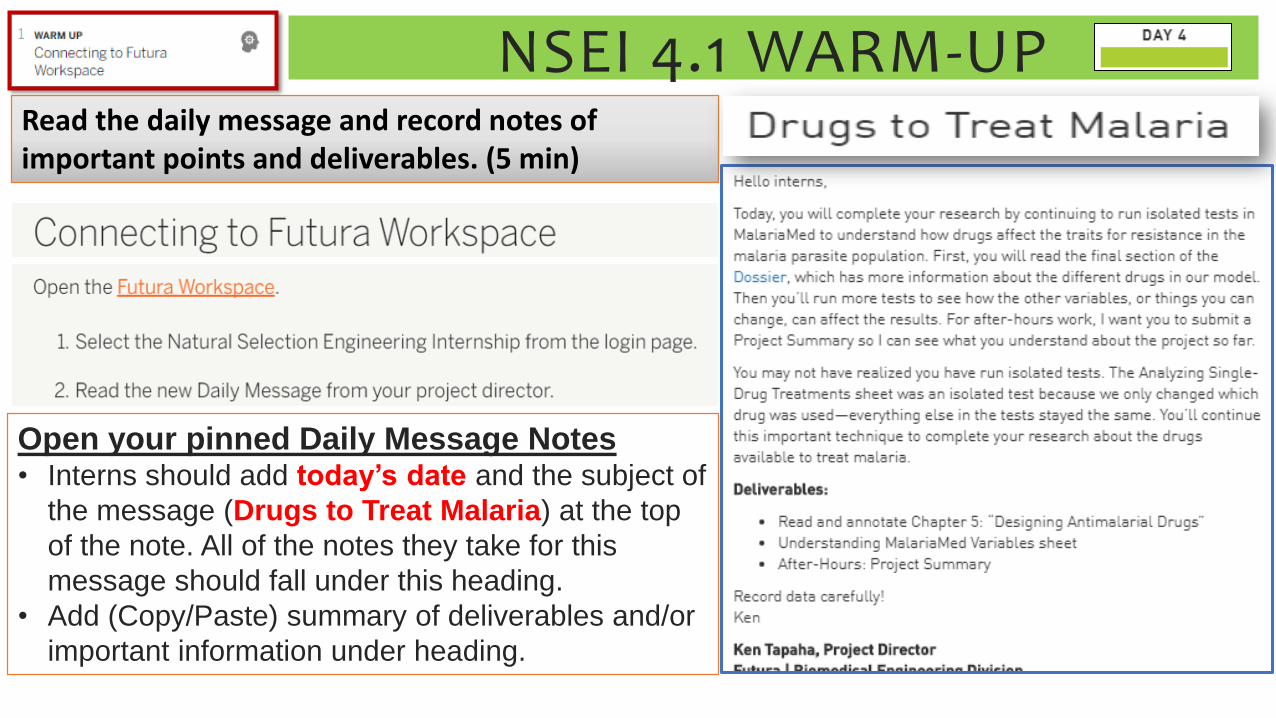
Read the daily message and record notes of important points and deliverables. (5 min)
Open your pinned Daily Message Notes• Interns should add today’s date and the subject of
the message (Drugs to Treat Malaria) at the top
of the note. All of the notes they take for this
message should fall under this heading.
• Add (Copy/Paste) summary of deliverables and/or
important information under heading.
NSEI 4.1 WARM-UP
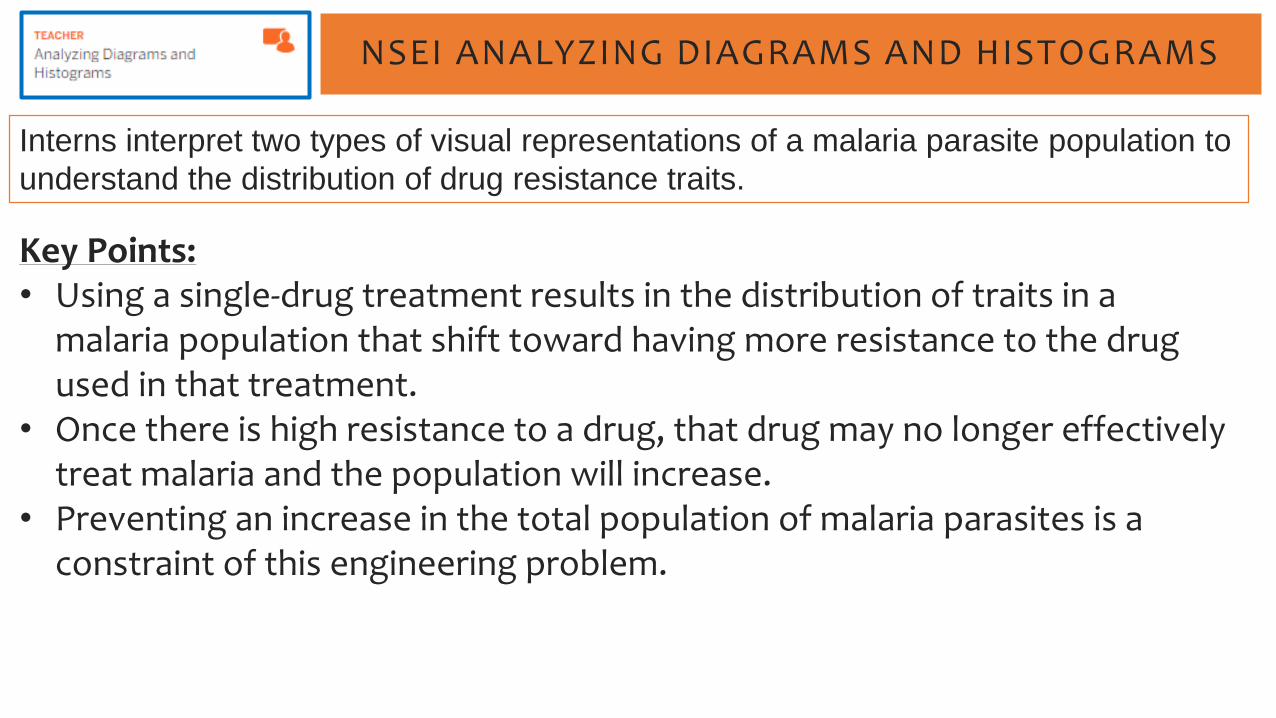
Interns interpret two types of visual representations of a malaria parasite population to
understand the distribution of drug resistance traits.
NSEI ANALYZING DIAGRAMS AND HISTOGRAMS
Key Points:• Using a single-drug treatment results in the distribution of traits in a
malaria population that shift toward having more resistance to the drug used in that treatment.
• Once there is high resistance to a drug, that drug may no longer effectively treat malaria and the population will increase.
• Preventing an increase in the total population of malaria parasites is a constraint of this engineering problem.
NSEI ANALYZING DIAGRAMS AND HISTOGRAMS
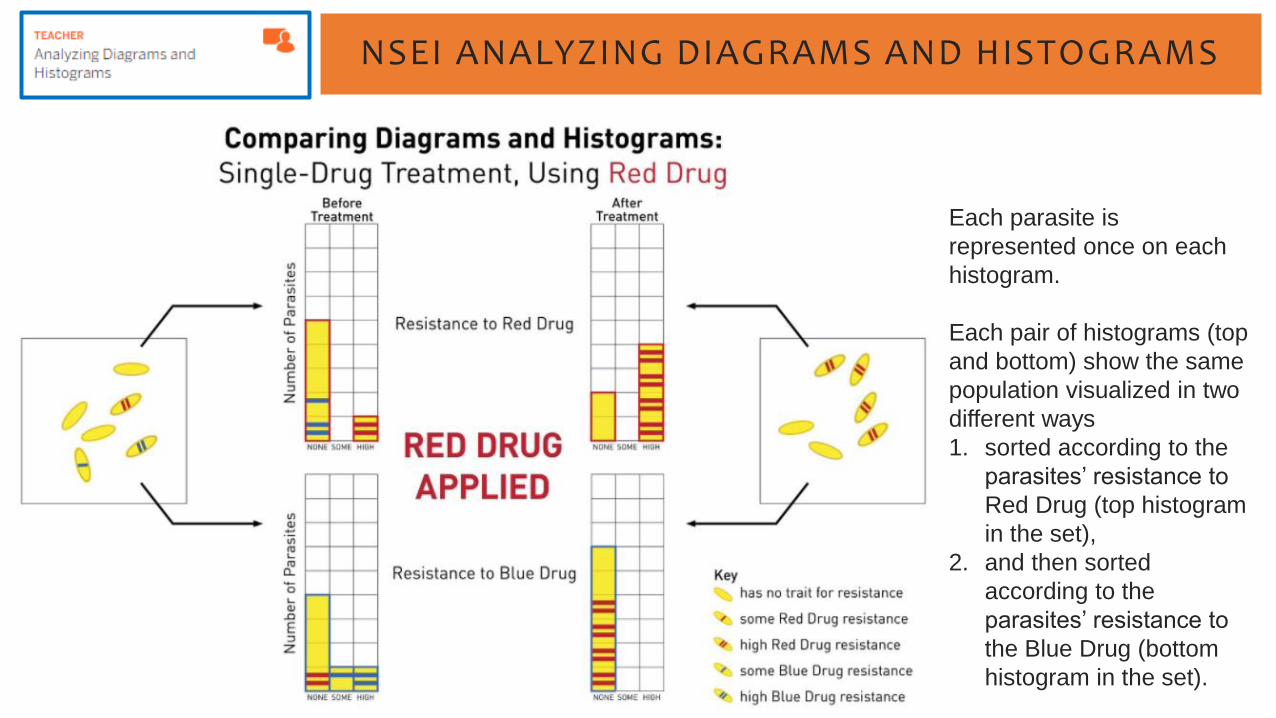
Each parasite is
represented once on each
histogram.
Each pair of histograms (top
and bottom) show the same
population visualized in two
different ways
1. sorted according to the
parasites’ resistance to
Red Drug (top histogram
in the set),
2. and then sorted
according to the
parasites’ resistance to
the Blue Drug (bottom
histogram in the set).
NSEI ANALYZING DIAGRAMS AND HISTOGRAMS
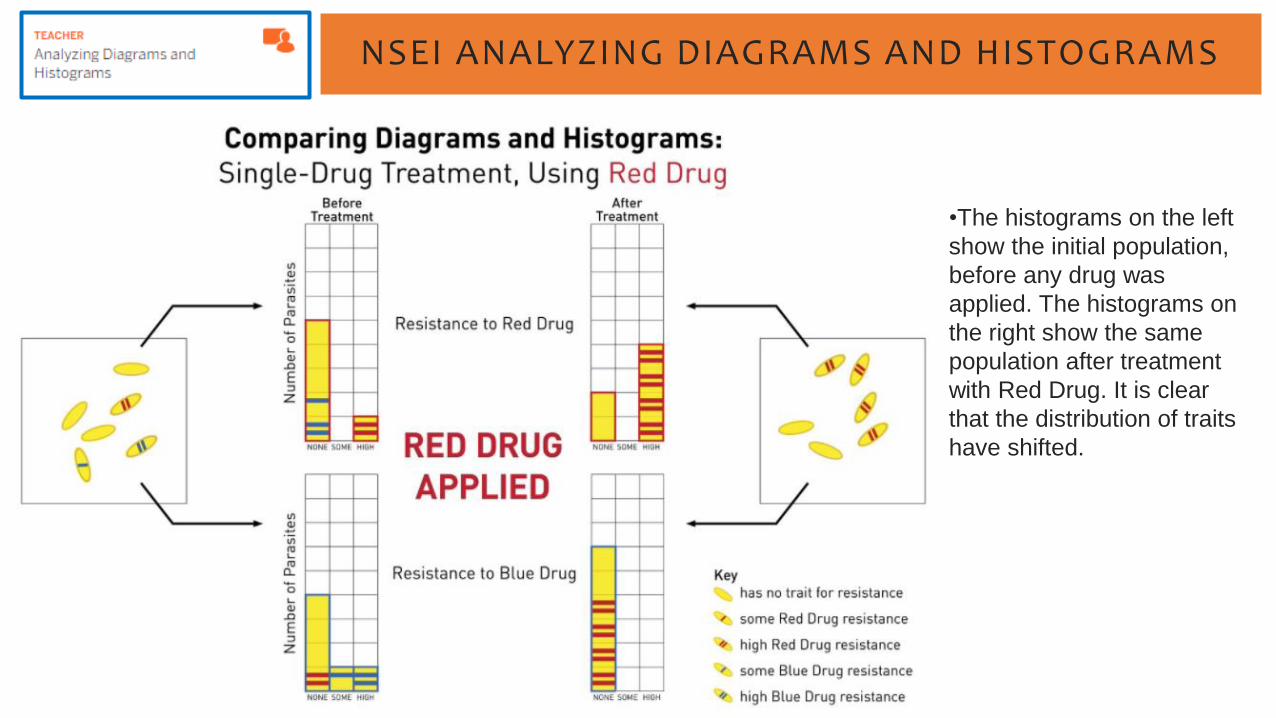
•The histograms on the left
show the initial population,
before any drug was
applied. The histograms on
the right show the same
population after treatment
with Red Drug. It is clear
that the distribution of traits
have shifted.
NSEI ANALYZING DIAGRAMS AND HISTOGRAMS
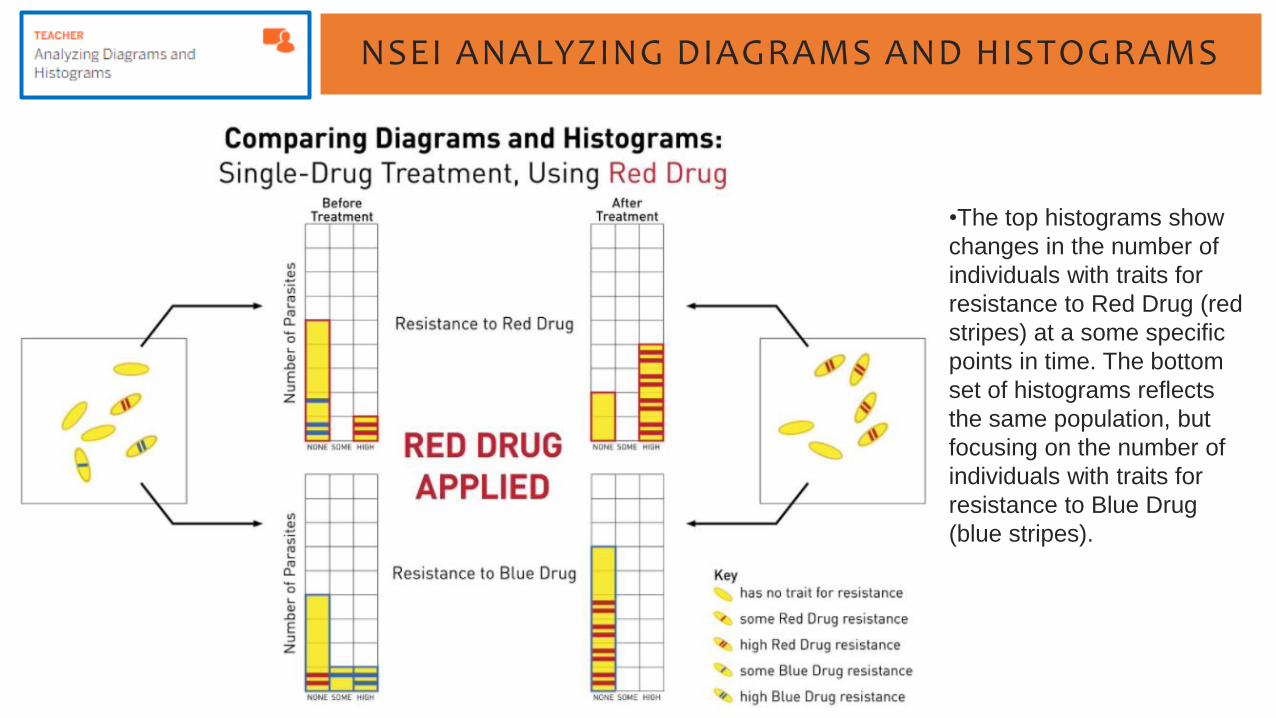
•The top histograms show
changes in the number of
individuals with traits for
resistance to Red Drug (red
stripes) at a some specific
points in time. The bottom
set of histograms reflects
the same population, but
focusing on the number of
individuals with traits for
resistance to Blue Drug
(blue stripes).
NSEI ANALYZING DIAGRAMS AND HISTOGRAMS
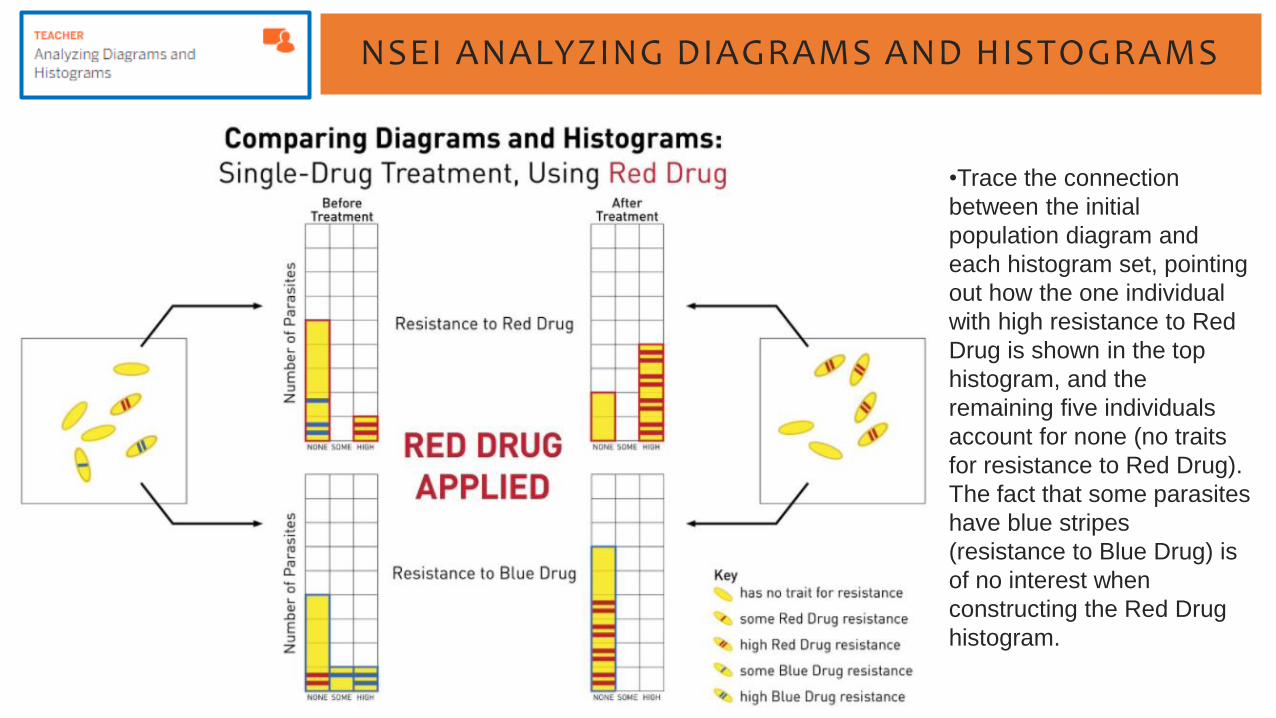
•Trace the connection
between the initial
population diagram and
each histogram set, pointing
out how the one individual
with high resistance to Red
Drug is shown in the top
histogram, and the
remaining five individuals
account for none (no traits
for resistance to Red Drug).
The fact that some parasites
have blue stripes
(resistance to Blue Drug) is
of no interest when
constructing the Red Drug
histogram.
NSEI ANALYZING DIAGRAMS AND HISTOGRAMS
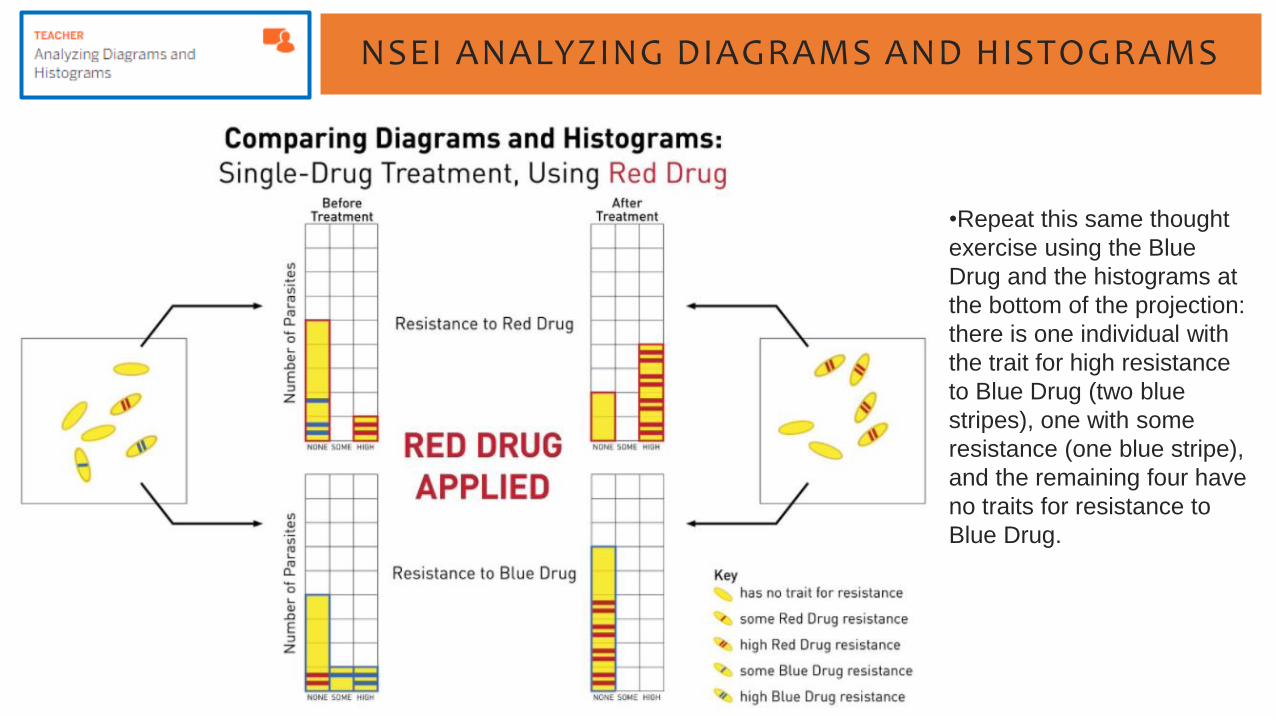
•Repeat this same thought
exercise using the Blue
Drug and the histograms at
the bottom of the projection:
there is one individual with
the trait for high resistance
to Blue Drug (two blue
stripes), one with some
resistance (one blue stripe),
and the remaining four have
no traits for resistance to
Blue Drug.
NSEI ANALYZING DIAGRAMS AND HISTOGRAMS
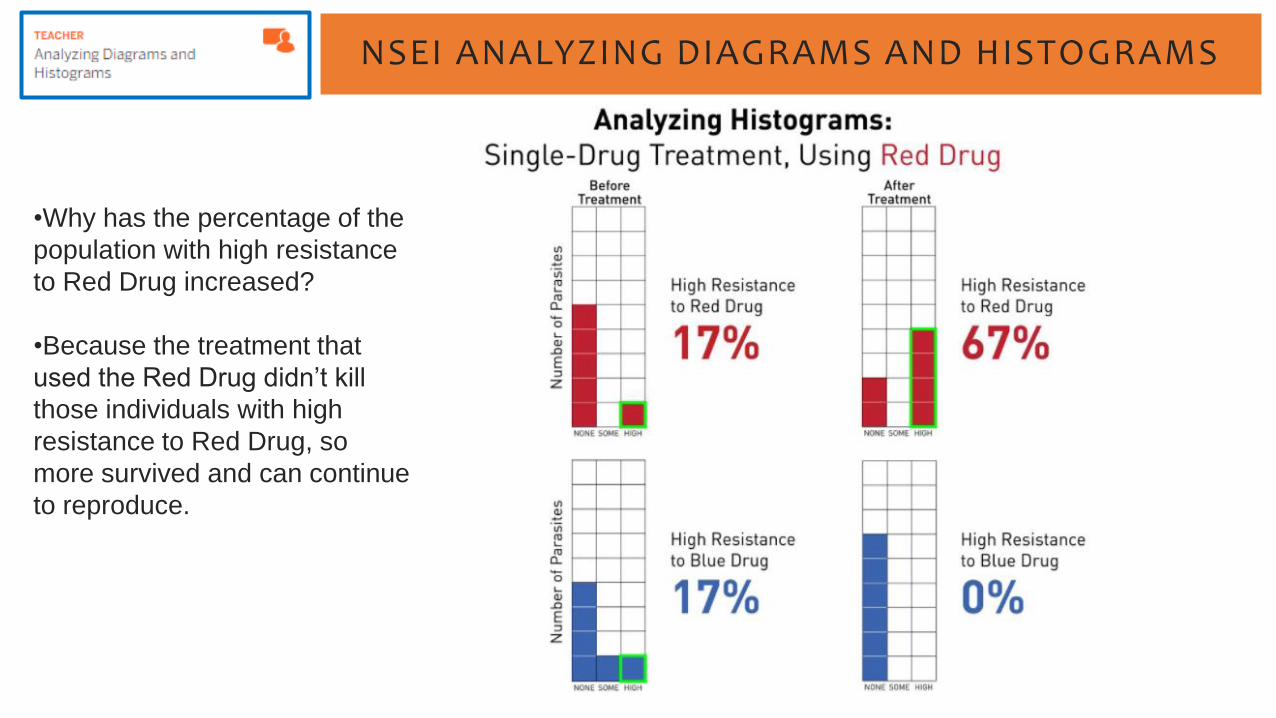
•Why has the percentage of the
population with high resistance
to Red Drug increased?
•Because the treatment that
used the Red Drug didn’t kill
those individuals with high
resistance to Red Drug, so
more survived and can continue
to reproduce.

NSEI ANALYZING DIAGRAMS AND HISTOGRAMS
•Why has the percentage of the
population with high resistance
to Blue Drug decreased?
•Because the treatment that
used Red Drug killed most of
those individuals with no
resistance to Red Drug. Even if
the individuals had a high
resistance to a different drug
(Blue), that did not help them in
the presence of Red Drug, and
they were killed.

NSEI ANALYZING DIAGRAMS AND HISTOGRAMS
•What do you expect to see if
you treat the same initial
population with the Blue Drug?
•The percentage of the
population with traits for
resistance to Blue Drug will
increase, but the percentage of
population with traits for
resistance to Red Drug will
decrease.
NSEI ANALYZING DIAGRAMS AND HISTOGRAMS
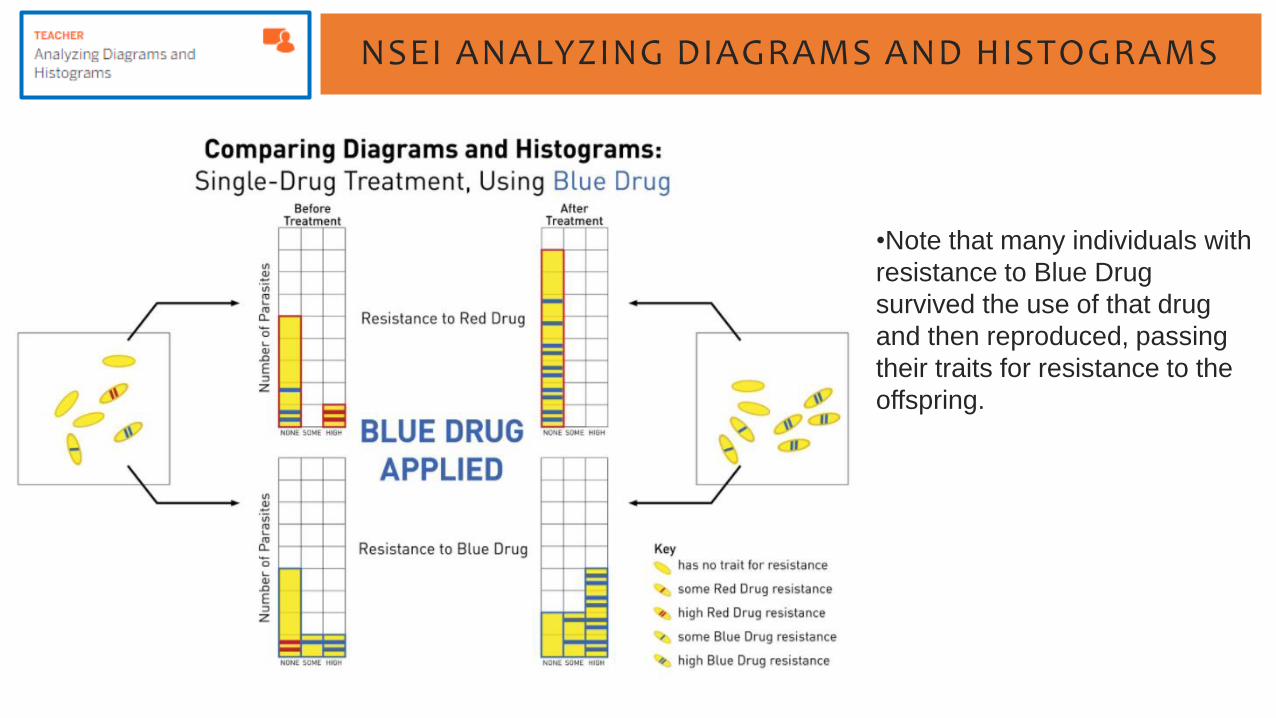
•Note that many individuals with
resistance to Blue Drug
survived the use of that drug
and then reproduced, passing
their traits for resistance to the
offspring.
NSEI ANALYZING DIAGRAMS AND HISTOGRAMS
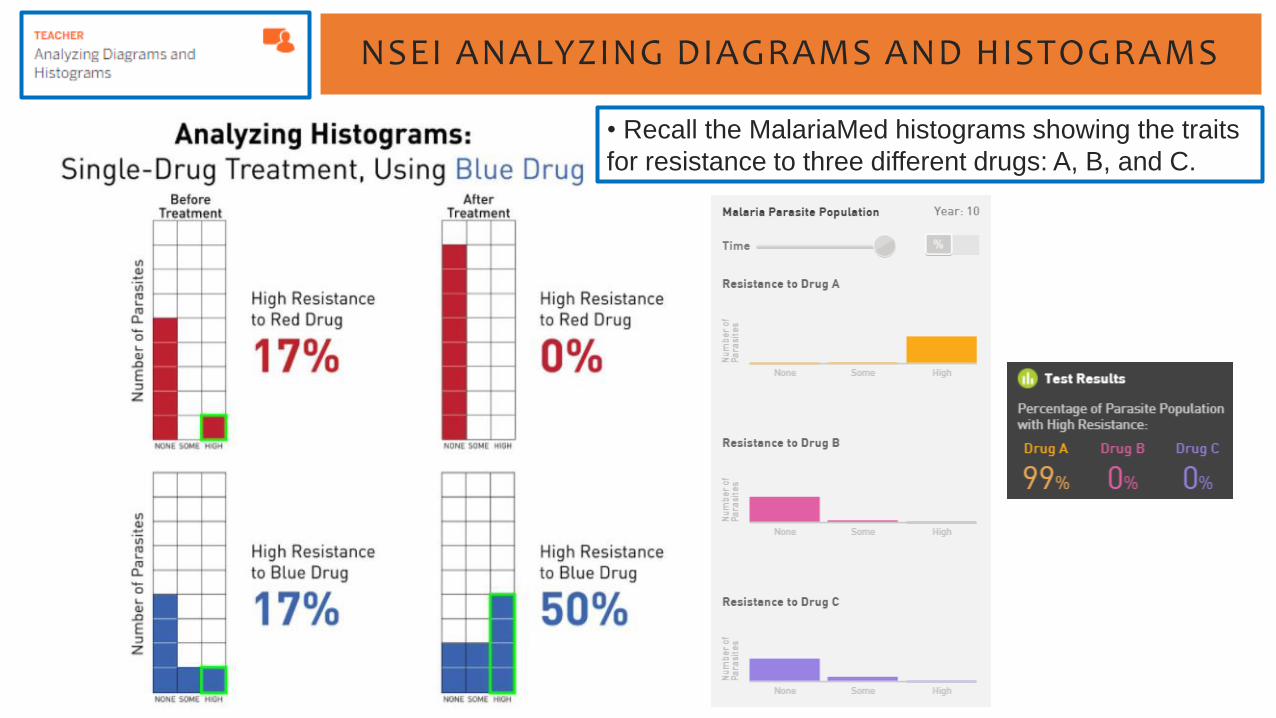
• Recall the MalariaMed histograms showing the traits
for resistance to three different drugs: A, B, and C.

NSEI ANALYZING DIAGRAMS AND HISTOGRAMS
• Recall the MalariaMed histograms showing the traits
for resistance to three different drugs: A, B, and C.

NSEI ANALYZING DIAGRAMS AND HISTOGRAMS
• Recall the MalariaMed histograms showing the traits
for resistance to three different drugs: A, B, and C.
NSEI 1.4.2 READING ANTIMALARIAL DRUG RESISTANCE
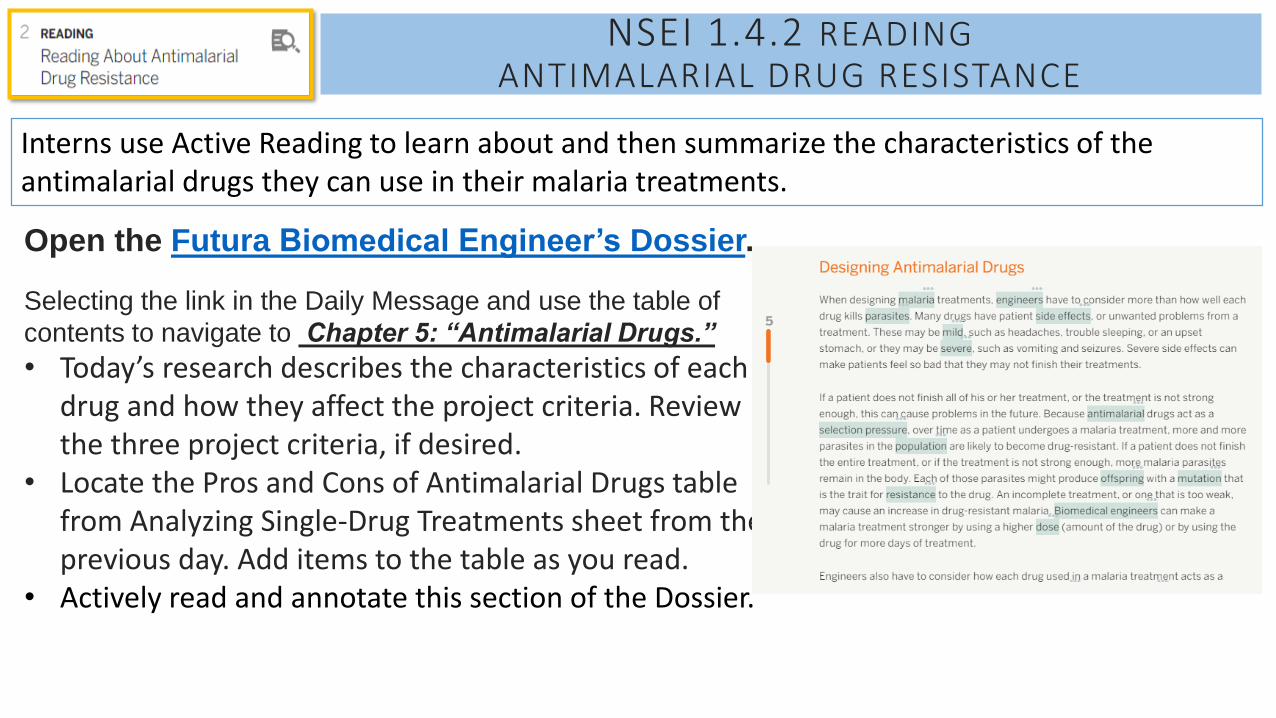
Interns use Active Reading to learn about and then summarize the characteristics of the antimalarial drugs they can use in their malaria treatments.
Open the Futura Biomedical Engineer’s Dossier.
Selecting the link in the Daily Message and use the table of
contents to navigate to Chapter 5: “Antimalarial Drugs.”
• Today’s research describes the characteristics of each drug and how they affect the project criteria. Review the three project criteria, if desired.
• Locate the Pros and Cons of Antimalarial Drugs table from Analyzing Single-Drug Treatments sheet from the previous day. Add items to the table as you read.
• Actively read and annotate this section of the Dossier.

NSEI 4.2 READING ANTIMALARIAL DRUG RESISTANCE
Key Points
• Different drugs are more or less effective at killing parasites than
others. More effective drugs will shift the distribution of traits
toward drug resistance more quickly.
• Different drugs cause different patient side effects, some of which
can interfere with an effective drug treatment if the side effects are
more serious. Review the meaning of the words mild, moderate,
and severe, as necessary.
• It is important to consider cost when designing malaria treatments so that it is accessible to those who need it most.
NSEI 4.2 INVESTIGATING MALARIAMED VARIABLES
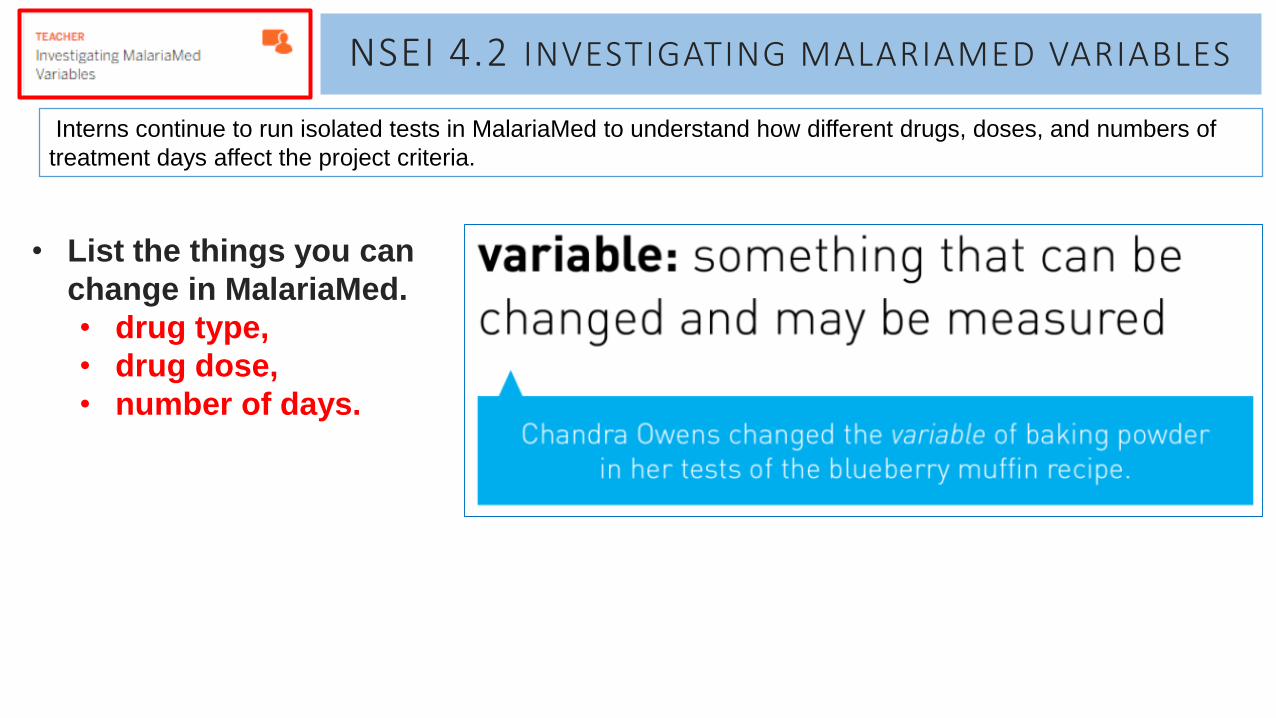
Interns continue to run isolated tests in MalariaMed to understand how different drugs, doses, and numbers of
treatment days affect the project criteria.
• List the things you can
change in MalariaMed.
• drug type,
• drug dose,
• number of days.
NSEI 4.2 INVESTIGATING MALARIAMED VARIABLES
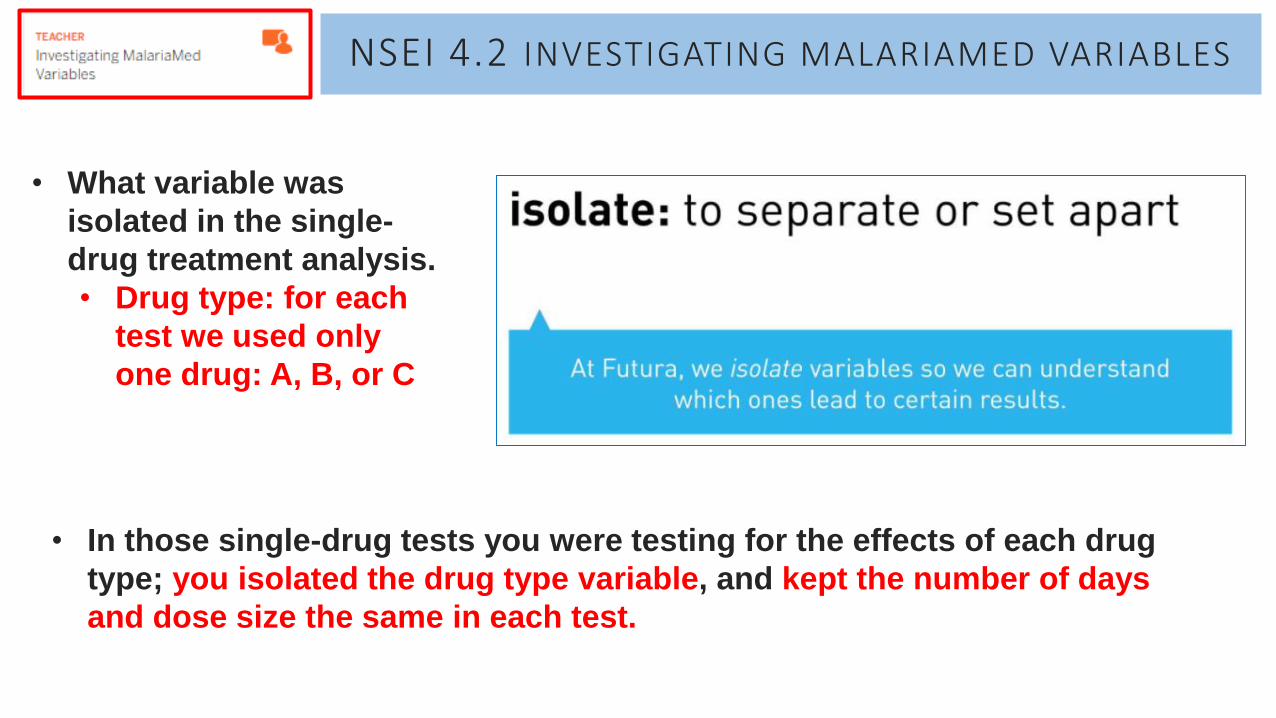
• What variable was
isolated in the single-
drug treatment analysis.
• Drug type: for each
test we used only
one drug: A, B, or C
• In those single-drug tests you were testing for the effects of each drug
type; you isolated the drug type variable, and kept the number of days
and dose size the same in each test.

NSEI 4.2 INVESTIGATING MALARIAMED VARIABLES
• When you did the single-drug treatments tests, you gathered data about how each drug type affected a malaria treatment, keeping dose size and number of days the same.
• Today, you will use MalariaMed to investigate these questions by isolating different variables: either number of days or dose size.
How do you think you could use
MalariaMed to figure out how dose size
might affect a single-drug treatment?
NSEI 4.2 INVESTIGATING MALARIAMED VARIABLES
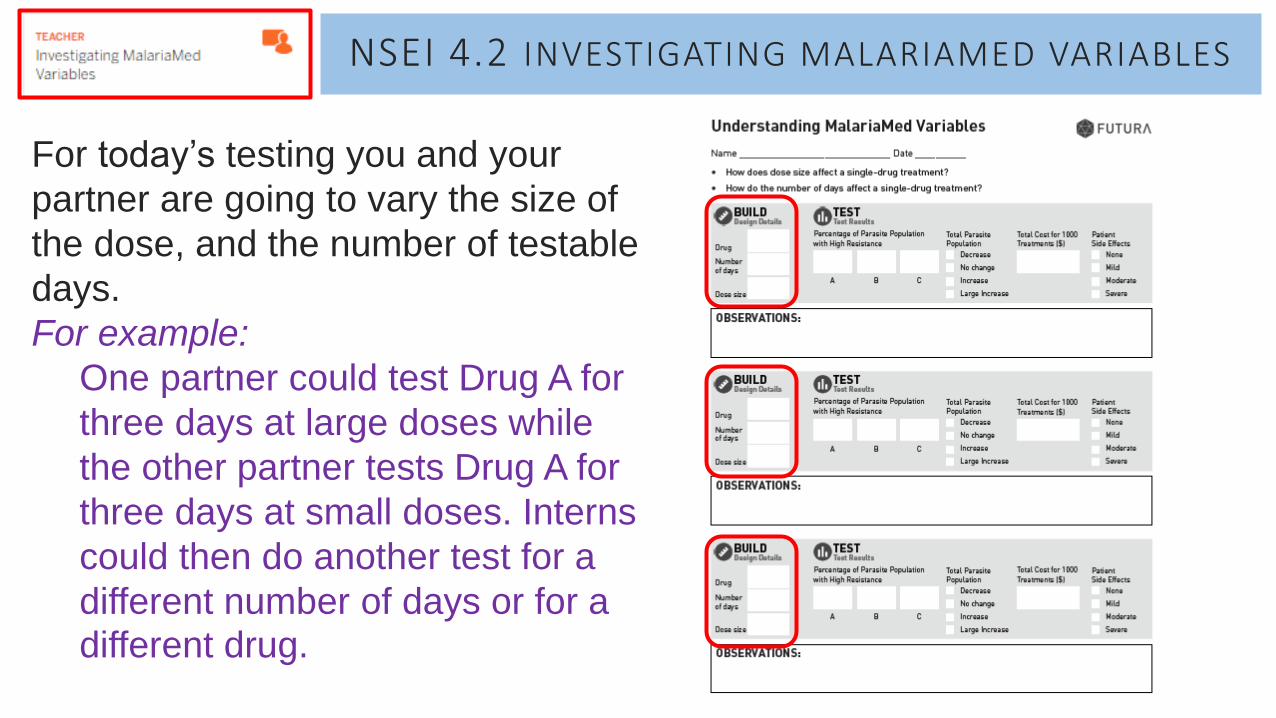
For today’s testing you and your
partner are going to vary the size of
the dose, and the number of testable
days.
For example:
One partner could test Drug A for
three days at large doses while
the other partner tests Drug A for
three days at small doses. Interns
could then do another test for a
different number of days or for a different drug.
NSEI 4.2 INVESTIGATING MALARIAMED VARIABLES
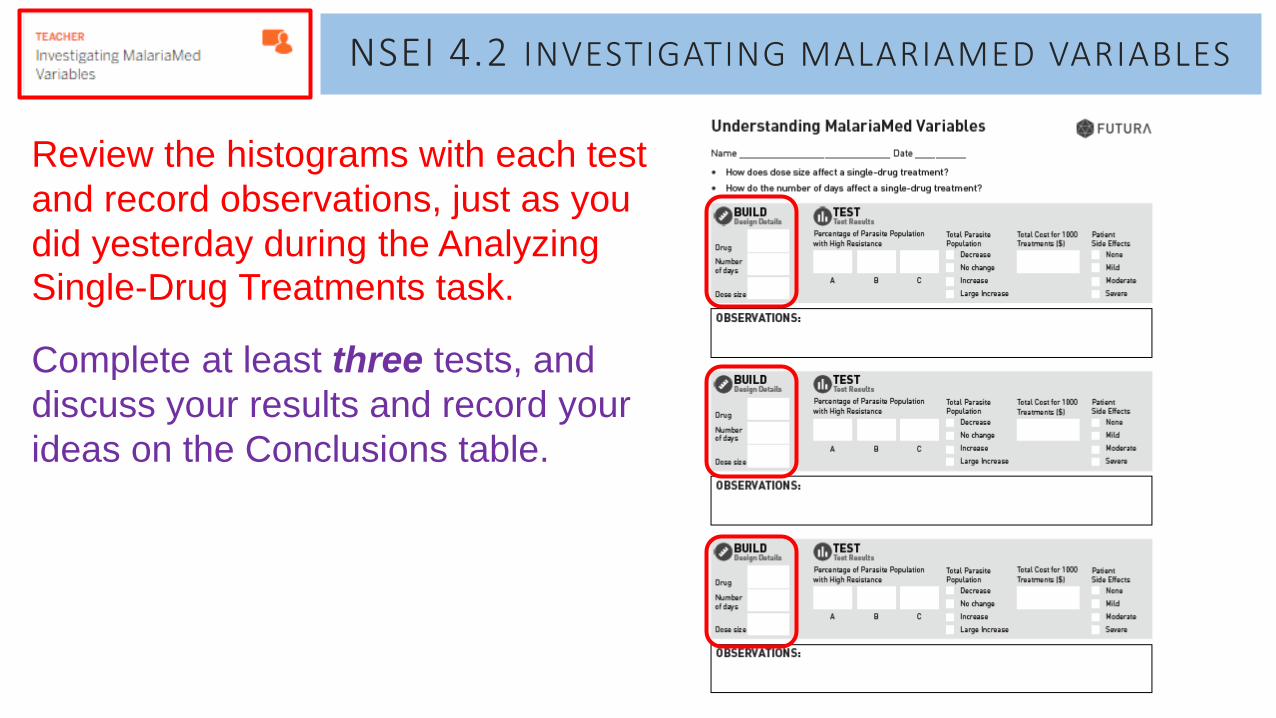
Review the histograms with each test
and record observations, just as you
did yesterday during the Analyzing Single-Drug Treatments task.
Complete at least three tests, and
discuss your results and record your
ideas on the Conclusions table.
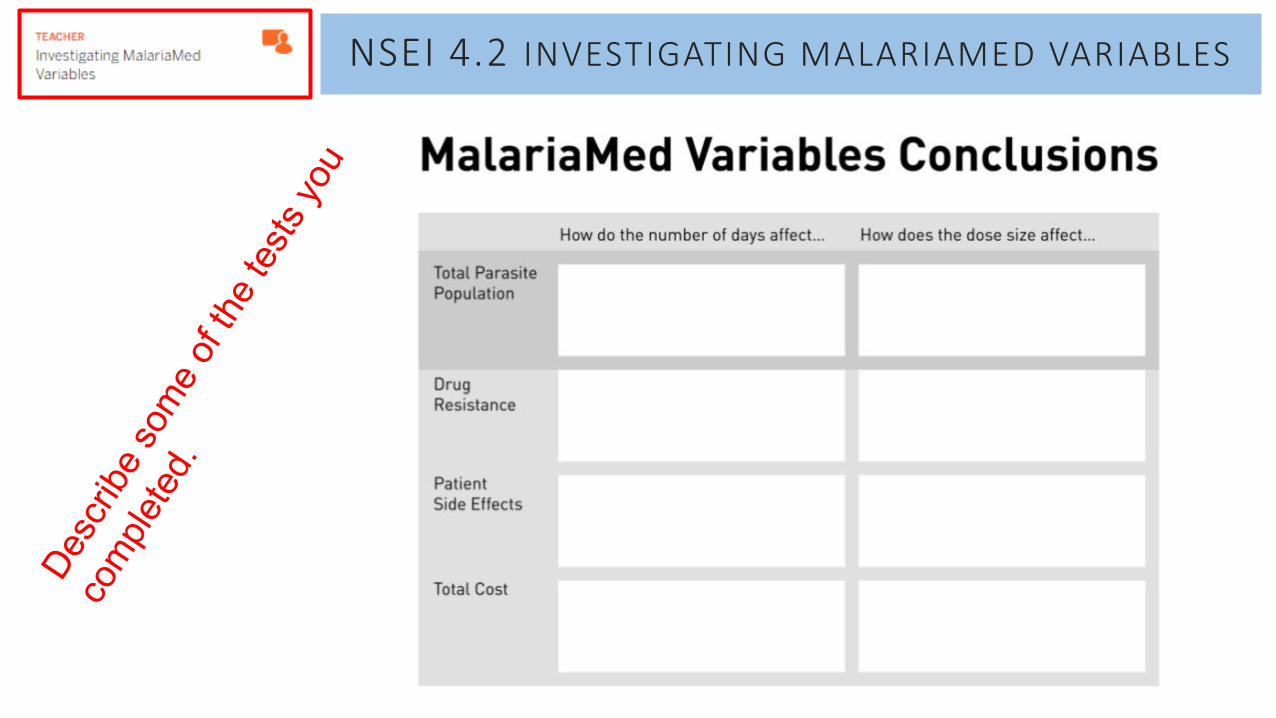
NSEI 4.2 INVESTIGATING MALARIAMED VARIABLES

NSEI 4.2 INVESTIGATING MALARIAMED VARIABLES
Summarize your conclusions for Total Parasite Population.
If you don’t use enough
days of the drug, too many
parasites can survive and
the population will increase.
If you use larger doses,
more parasites will die
(depends on drug) and the population will increase.
NSEI 4.2 INVESTIGATING MALARIAMED VARIABLES
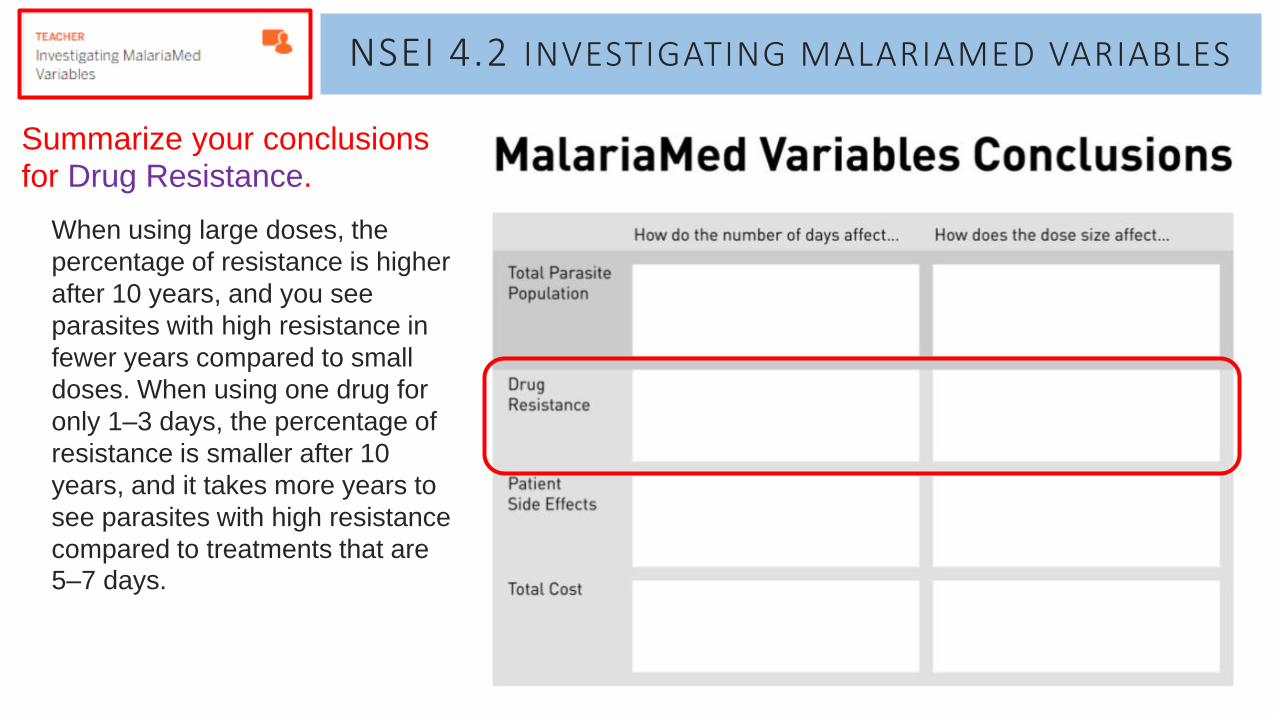
Summarize your conclusions for Drug Resistance.
When using large doses, the
percentage of resistance is higher
after 10 years, and you see
parasites with high resistance in
fewer years compared to small
doses. When using one drug for
only 1–3 days, the percentage of
resistance is smaller after 10
years, and it takes more years to
see parasites with high resistance
compared to treatments that are 5–7 days.
NSEI 4.2 INVESTIGATING MALARIAMED VARIABLES
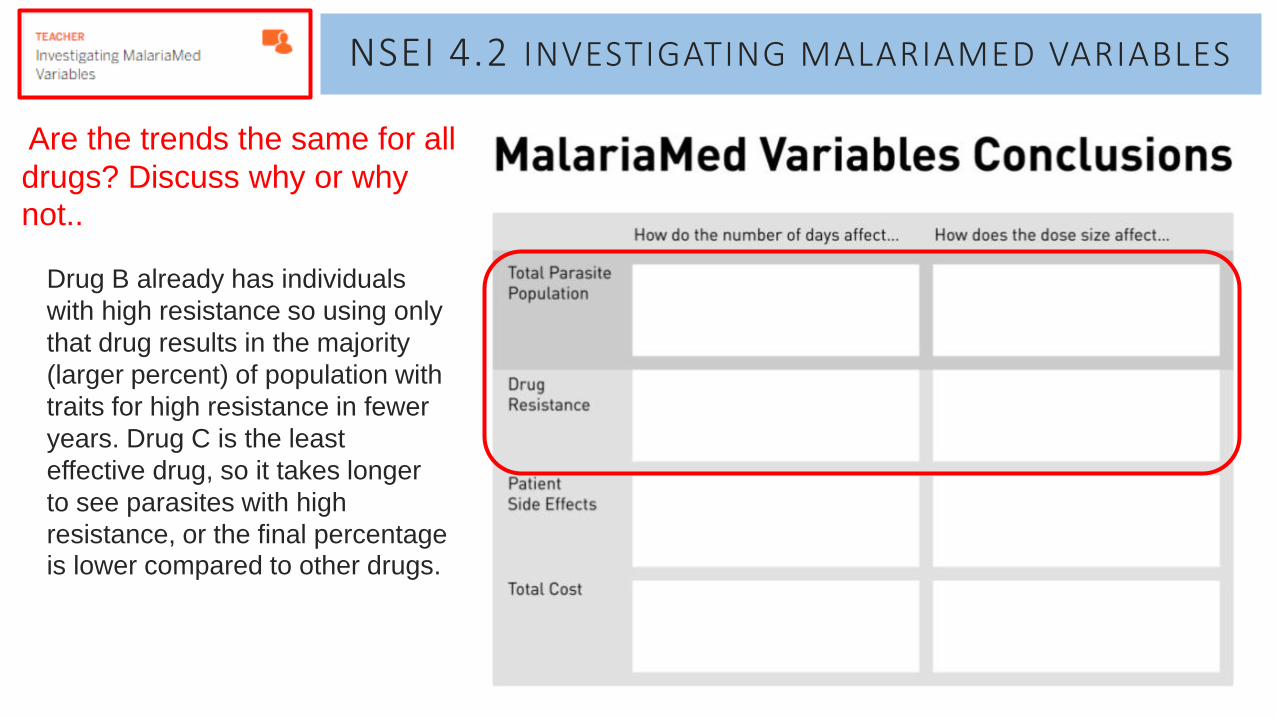
Are the trends the same for all
drugs? Discuss why or why not..
Drug B already has individuals
with high resistance so using only
that drug results in the majority
(larger percent) of population with
traits for high resistance in fewer
years. Drug C is the least
effective drug, so it takes longer
to see parasites with high
resistance, or the final percentage is lower compared to other drugs.

NSEI 4.2 INVESTIGATING MALARIAMED VARIABLES
Summarize your conclusions for Patient Side Effects.
In general, fewer days
of a drug result in lower
side effects, but it
depends on the drug.
Small doses of a drug
result in lower side effects.
NSEI 4.2 INVESTIGATING MALARIAMED VARIABLES
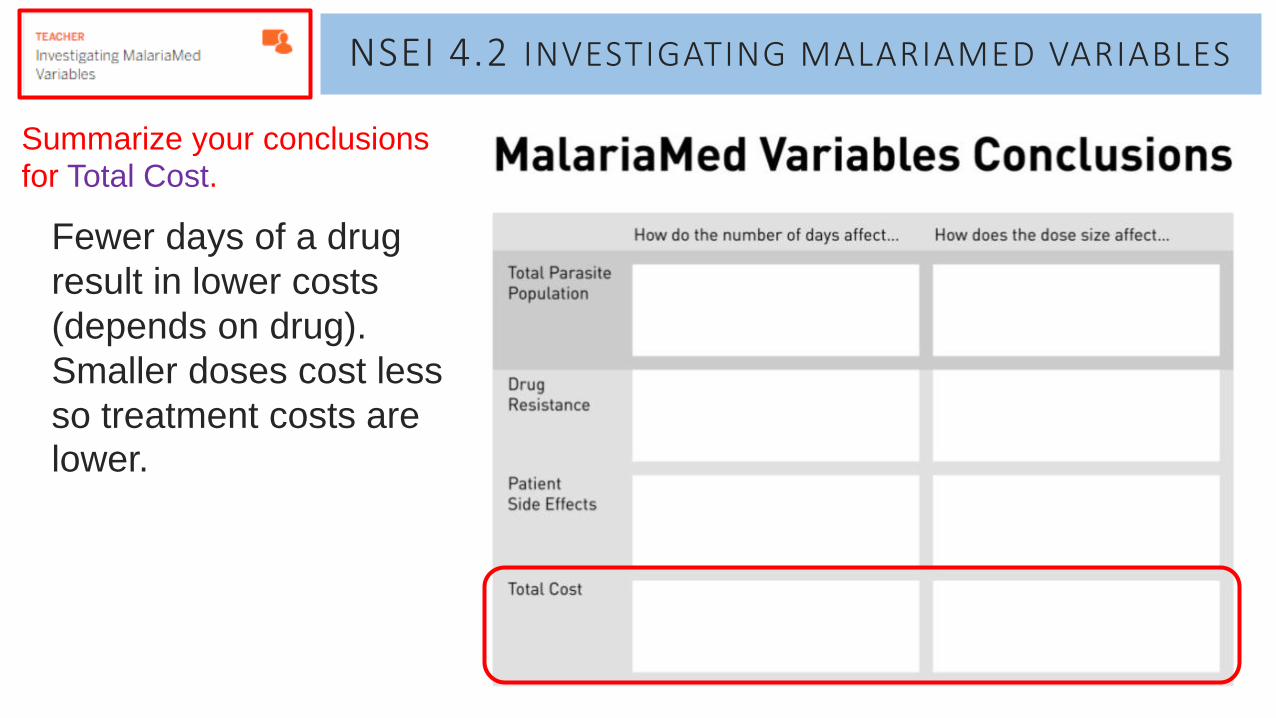
Summarize your conclusions for Total Cost.
Fewer days of a drug
result in lower costs
(depends on drug).
Smaller doses cost less
so treatment costs are lower.
NSEI 4.2 INVESTIGATING MALARIAMED VARIABLES
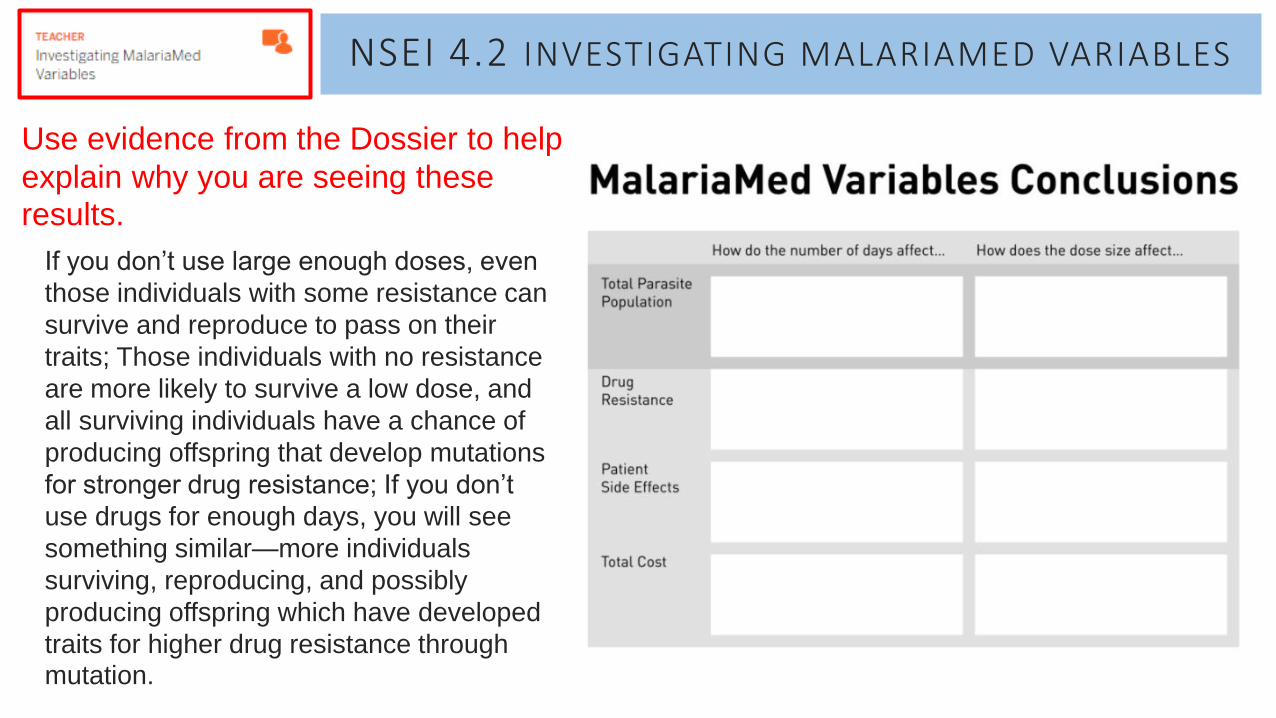
Use evidence from the Dossier to help
explain why you are seeing these results.
If you don’t use large enough doses, even
those individuals with some resistance can
survive and reproduce to pass on their
traits; Those individuals with no resistance
are more likely to survive a low dose, and
all surviving individuals have a chance of
producing offspring that develop mutations
for stronger drug resistance; If you don’t
use drugs for enough days, you will see
something similar—more individuals
surviving, reproducing, and possibly
producing offspring which have developed
traits for higher drug resistance through mutation.
NSEI 4.2 INVESTIGATING MALARIAMED VARIABLES
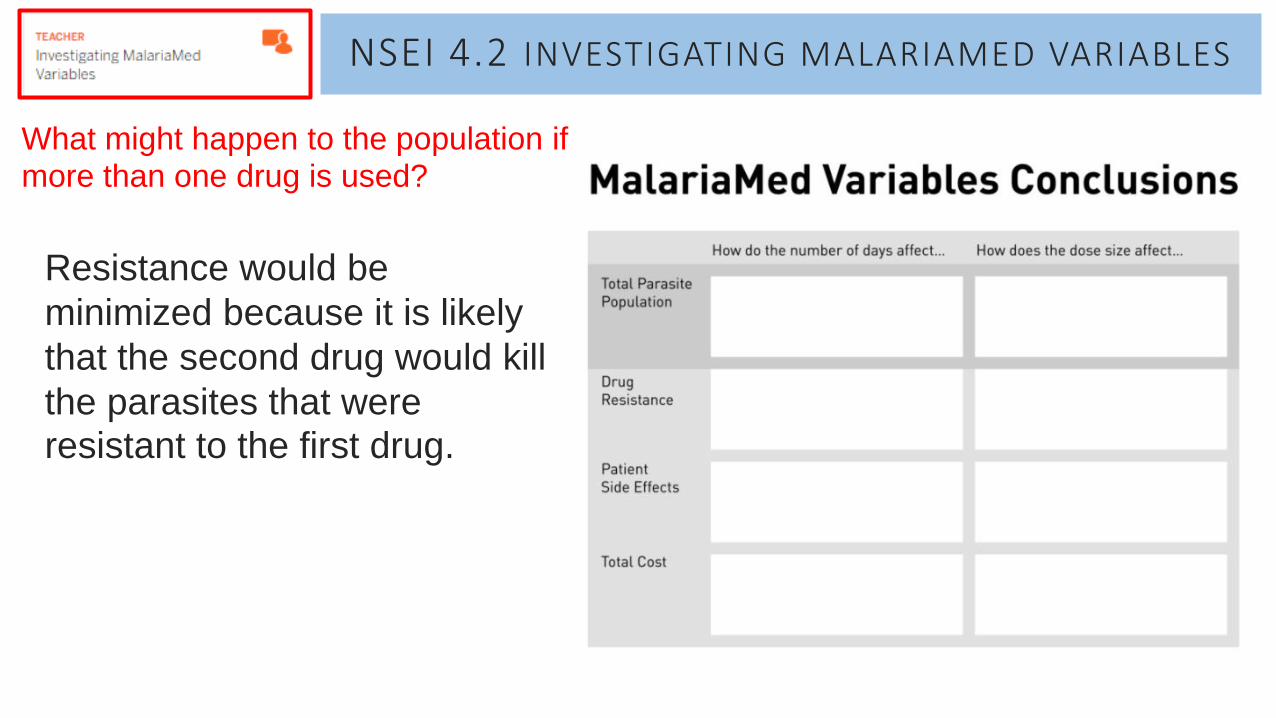
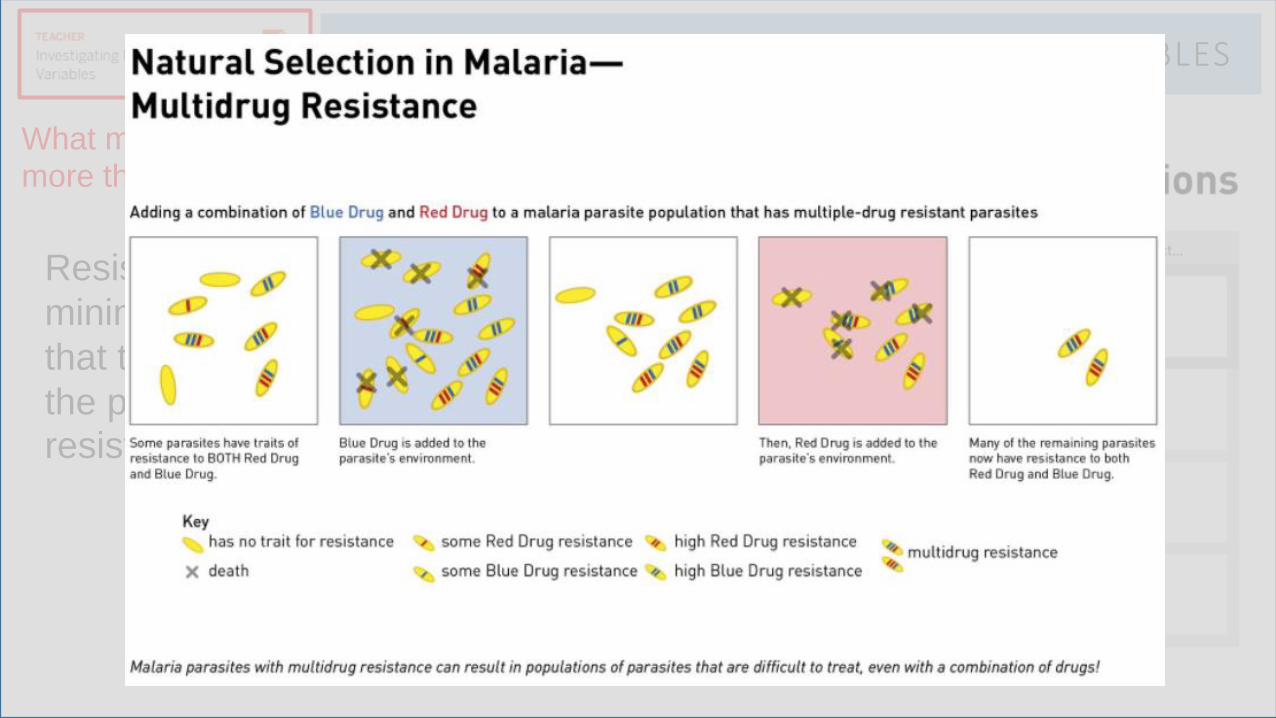
What might happen to the population if more than one drug is used?
Resistance would be
minimized because it is likely
that the second drug would kill
the parasites that were
resistant to the first drug.
NSEI 4.2 INVESTIGATING MALARIAMED VARIABLES
What might happen to the population if more than one drug is used?
Resistance would be
minimized because it is likely
that the second drug would kill
the parasites that were
resistant to the first drug.
NSEI 4.3 AFTER-HOURS WORK
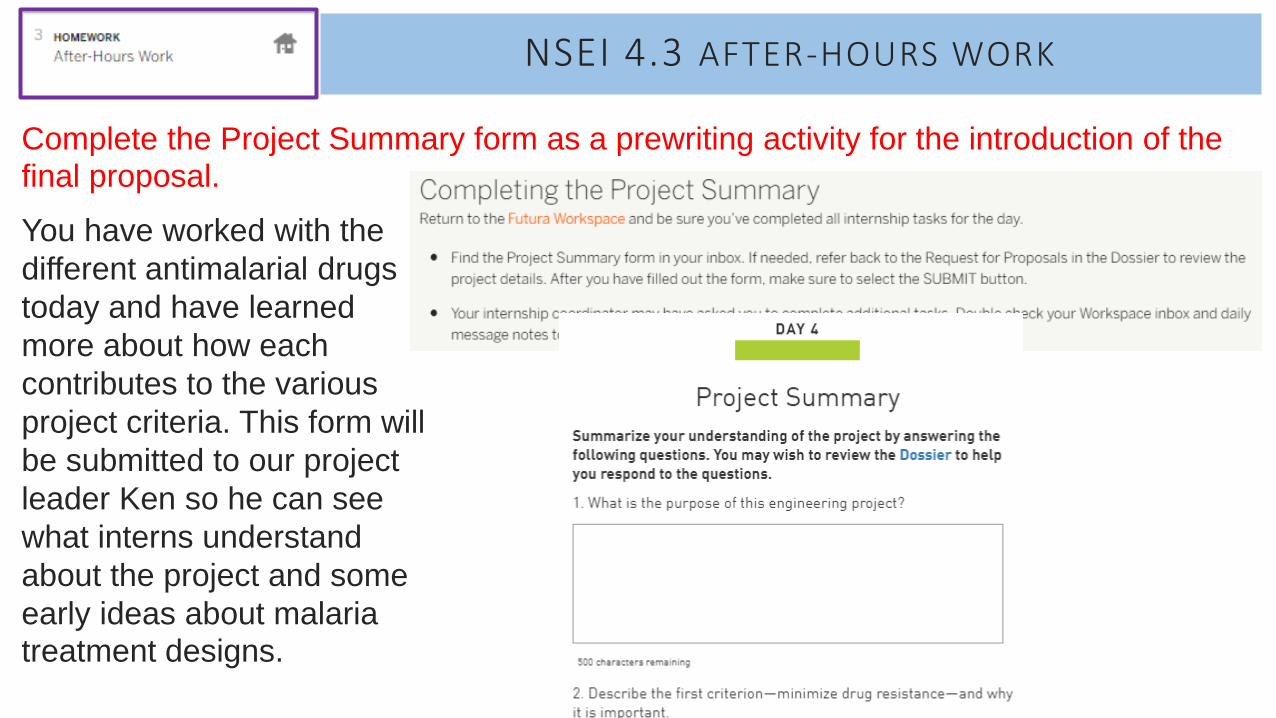
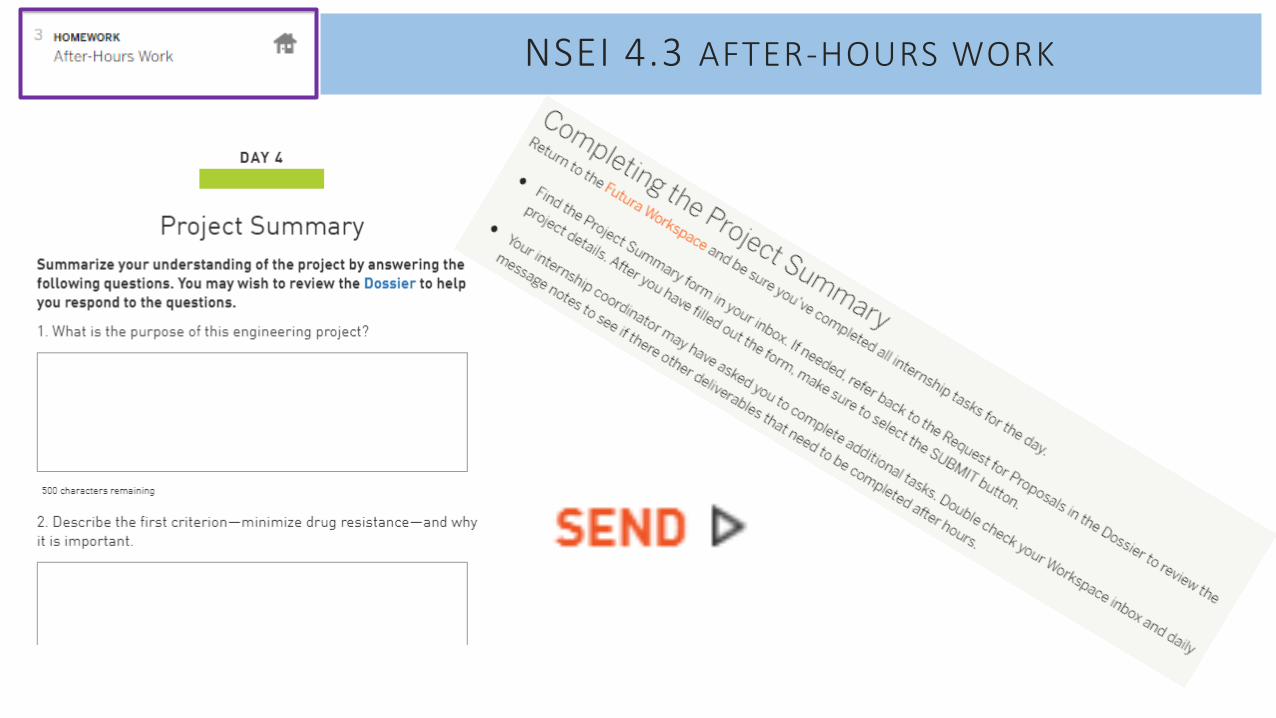
Complete the Project Summary form as a prewriting activity for the introduction of the final proposal.
You have worked with the
different antimalarial drugs
today and have learned
more about how each
contributes to the various
project criteria. This form will
be submitted to our project
leader Ken so he can see
what interns understand
about the project and some
early ideas about malaria treatment designs.
NSEI 4.3 AFTER-HOURS WORK