EXPERIMENTAL STUDY OF RADIO FREQUENCY INTERFERENCE DETECTION A LGORITHMS IN MICROWAVE RADIOMETRY
15
EXPERIMENTAL STUDY OF RADIO FREQUENCY INTERFERENCE DETECTION ALGORITHMS IN MICROWAVE RADIOMETRY José Miguel Tarongí Bauzá Giuseppe Forte Adriano Camps Carmona RSLab Universitat Politècnica de Catalunya
-
Upload
wanda-barry -
Category
Documents
-
view
23 -
download
0
description
EXPERIMENTAL STUDY OF RADIO FREQUENCY INTERFERENCE DETECTION A LGORITHMS IN MICROWAVE RADIOMETRY. José Miguel Tarongí Bauzá Giuseppe Forte Adriano Camps Carmona RSLab Universitat Politècnica de Catalunya. Introduction. - PowerPoint PPT Presentation
Transcript of EXPERIMENTAL STUDY OF RADIO FREQUENCY INTERFERENCE DETECTION A LGORITHMS IN MICROWAVE RADIOMETRY
EXPERIMENTAL STUDY OF RADIO FREQUENCY INTERFERENCE DETECTION ALGORITHMS IN MICROWAVE RADIOMETRY
José Miguel Tarongí BauzáGiuseppe Forte
Adriano Camps CarmonaRSLab
Universitat Politècnica de Catalunya

2
Introduction
Radio Frequency interference (RFI) present in radiometric measurements lead to erroneous retrieval of physical parameters.
Several RFI mitigation methods developed:– Time analysis
– Frequency analysis
– Statistical analysis
– Time-Frequency (T-F) analysis Short Time Fourier Transform (STFT) [1] Wavelets [2]
STFT combines information in T-F, useful if frequency components vary over time.
Spectrogram → image representation of the STFT. Image processing tools can detect RFI present in a spectrogram.[1]. Tarongi, J. M ; Camps, A.; “Radio Frequency Interference Detection Algorithm Based on Spectrogram Analysis”, IGARSS 2010, 2010, 2, 2499-2502.
[2] Camps, A.; Tarongí, J.M.; RFI Mitigation in Microwave Radiometry Using Wavelets. Algorithms 2009, 2, 1248-1262. c

3
2.69 2.692 2.694 2.696 2.698 2.7-68
-66
-64
-62
-60
Frequency [GHz]
Po
wer
[d
Bm
] (u
nca
l)
Time analysis
Frequency analysis
Spectrogram analysis
0 500 1000 1500 2000-65
-60
-55
-50
Sample
Po
wer
[d
Bm
] (u
nca
l)Introduction

4
Hardware Settings
RFI detector hardware– Microwave radiometer based on a spectrum analyzer architecture– Composed by:
L-band horn antenna: Γ ≤ -17dB @ 1.4 – 1.427GHz Chain of low noise amplifiers: 45dB Gain and 1.7dB Noise figure Spectrum analyzer able to perform Spectrograms
– Calibration and temperature control unnecessary Only used to detect RFI
– Measurements taken in the Remote Sensing lab from the UPC
RFI detector Schematic
Adriano Camps
No sé si pner la foto!!!

5
Algorithm description
Objective ―> Image processing tools applied to the spectrogram to detect RFI.
1st idea: use algorithms previously developed [1]– Pixels conforming the spectrogram obtained by the spectrum analyzer
have a Raileigh distribution
– Frequency response of the RFI detector hardware was not sufficiently flat
New algorithm developed– 2D wavelet-based filtering to detect most part of the RFI
– Frequency and time averaging to eliminate the residual RFI
[1]. Tarongi, J. M ; Camps, A.; “Radio Frequency Interference Detection Algorithm Based on Spectrogram Analysis”, IGARSS 2010, 2010, 2, 2499-2502.

6
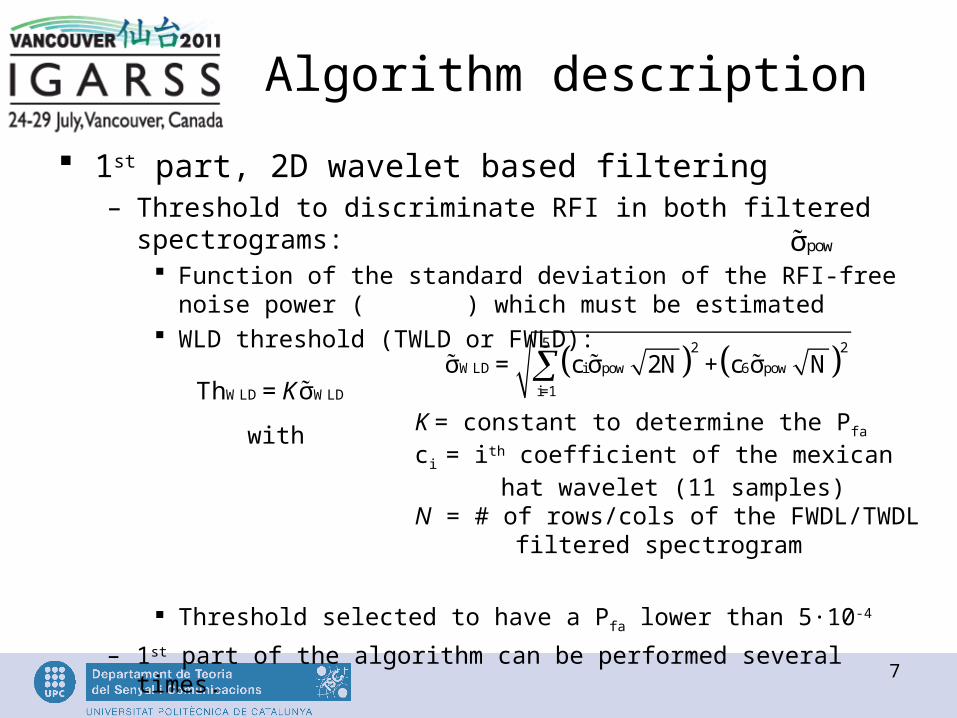
Algorithm description
1st part, 2D wavelet based filtering– Convolution with two Wavelet Line Detection (WLD) filters
– WLD filters: matrixes based on a Mexican hat wavelet
– Two different filters: Frequency WLD (FWLD): detects sinusoidal RFI. Time WLD (TWLD): detects impulse RFI.
– Values of these filters: FWLD: TR rows (15 ≤ TR ≤ 31), each one composed by the coefficient values of a Mexican hat wavelet of 11 samples TWLD: TC columns (15 ≤ TC ≤ 31), each one composed by the coefficient values of a Mexican hat wavelet of 11 samples
– RFI enhancement with the correlation of FWLD and TWLD with the spectrogram
Mexican Hat coefficient values
7
Algorithm description
1st part, 2D wavelet based filtering– Threshold to discriminate RFI in both filtered spectrograms:
Function of the standard deviation of the RFI-free noise power ( ) which must be estimated
WLD threshold (TWLD or FWLD):
Threshold selected to have a Pfa lower than 5·10-4
– 1st part of the algorithm can be performed several times.
powσ
WLD WLD Th = σK
with
5 2 2
WLD i pow 6 pow
i=1
σ = c σ 2N + c σ N
K = constant to determine the Pfa
ci = ith coefficient of the mexican hat wavelet (11 samples)N = # of rows/cols of the FWDL/TWDL filtered spectrogram

8
Algorithm description
2nd part, frequency and time averaging– After 2D wavelet filtering it still remains residual RFI, next pass:
Average of the frequency subbands Average of the time sweeps
– Spectrogram matrix is converted in two vectors.
– RFI is eliminated with threshold proportional to the standard deviation of both vectors
– Threshold selected to have a Pfa lower than 5·10-3

9
Algorithm description
Spectrogram
*TWLDfilter*
2D Convolution
FWLDfilter
FWLDthreshold
TWLDthreshold&
1st pass RFI mitigation result
Frequency subbands & Time sweeps average
Yes
Frequencythreshold
2nd pass RFI mitigation result
RFI cleaned signal power
∑
Any frequency subband or time sweep with relatively high power (6 times
above σfreq or σtime) value?
Timethreshold&
No
10
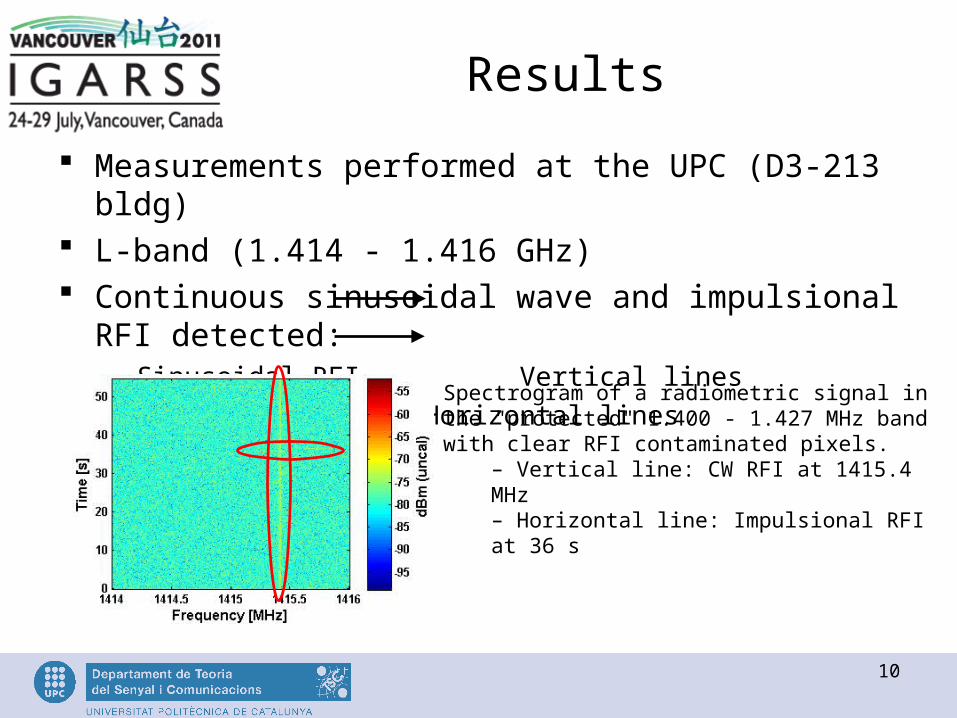
Results
Measurements performed at the UPC (D3-213 bldg) L-band (1.414 - 1.416 GHz) Continuous sinusoidal wave and impulsional RFI detected:
– Sinusoidal RFI Vertical lines
– ImpulseRFI Horizontal lines
Spectrogram of a radiometric signal in the "protected" 1.400 - 1.427 MHz band with clear RFI contaminated pixels.
– Vertical line: CW RFI at 1415.4 MHz– Horizontal line: Impulsional RFI at 36 s
11
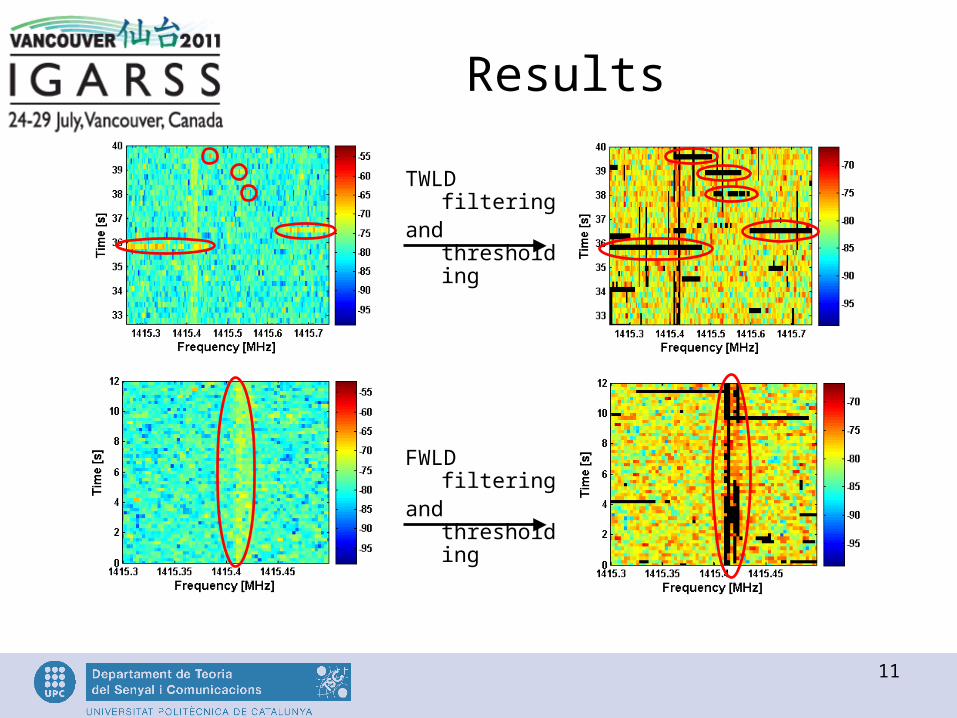
Results
TWLD filteringand thresholding
FWLD filteringand thresholding

12
threshold
Time averaged spectrogram
Frequency averaged spectrogram
threshold
Results
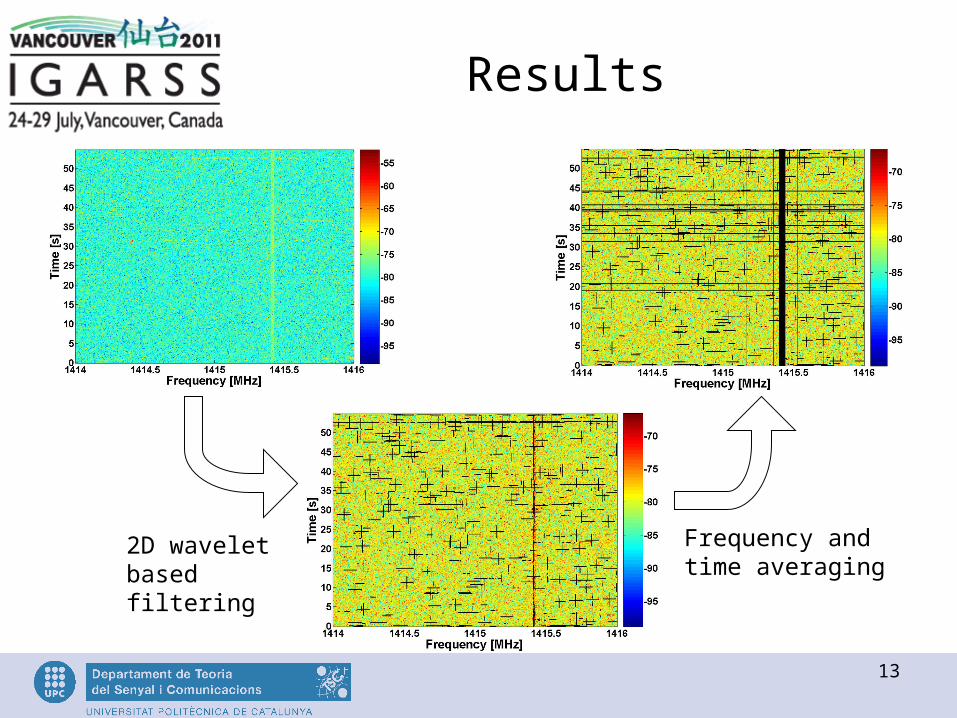
13
2D wavelet based filtering
Frequency and time averaging
Results
14
Conclusions
Best RFI algorithm is actually a combination of:– 2D image filtering of the spectrogram using line detection filters.
– Time and frequency analysis to the remaining radiometric signal
System equalization may be performed:– Avoid false alarms from the RFI detection algorithm
– Let the application of other RFI detection algorithms

THANKS FOR YOUR ATTENTION