Experimental and Analytical Study of Water Production of ...
113
Experimental and Analytical Study of Water Production of Solar Still A thesis submitted in partial fulfilment of the requirements for the degree of Master of Philosophy by Thamer Alheefi College of Engineering, Design and Physical Sciences Brunel University London May 2019
Transcript of Experimental and Analytical Study of Water Production of ...
Experimental and Analytical Study of
Water Production of Solar Still
A thesis submitted in partial fulfilment of the requirements for
the degree of Master of Philosophy
by
Thamer Alheefi
College of Engineering, Design and Physical Sciences
Brunel University London
May 2019

i
Abstract
Rapid population growth and industrialization have increased the demand on potable
water dramatically, and there are many rural areas and communities around the world which
suffer from the shortage of potable water. However, many of these communities inhabit
desert areas where the weather is hot and solar energy is plentiful. Therefore, the present
study suggests basin-type solar stills for desalination, which uses solar energy to evaporate
the saline water. The use of solar stills in large scale commercial systems is limited by the
low production rate of desalinated water. Therefore, the present study focuses on the effects
of different parameters on the thermal performance and productivity of a single basin double
slope solar still. It is well known that the performance of a solar still can vary from one
country to another due to the effect of meteorological conditions. The experiments of the
present study were conducted in Kuwait. A double slope solar still was designed and
fabricated, and the data were collected over a long period of time to achieve high accuracy.
The effects of several parameters on the performance of the examined solar still were
investigated. These parameters include the following: (1) type of energy storing materials,
(2) basin water depth, (3) the cooling of the solar still cover plate. The experimental data
were verified using a theoretical model. The investigated energy storage materials included
steel metal pieces in different shapes, gravel in two different sizes and encapsulated paraffin
wax as a phase change material.
This study has concluded that the basin water depth has a significant effect on the daily
water production and the water production rate. This rate increases as the water depth in the
basin decreases. A correlation was developed to express the relation between the daily water
production and the basin water depth. The study has also found that the performance of the
solar still with the energy storing materials depends on the material density and specific heat
capacity. A new dimensionless factor called “energy storing material factor (β)” was
introduced. It was found that the performance of the energy storing materials is proportional
to the values of β. For β < 1, the energy storing materials can improve the water productivity.
Among the studied energy storing materials, the phase change material has achieved the
highest total water production per square meter (about 53% improvements). This present
study contributes to improving the design of passive basin-type solar stills which can be
used for water production in many rural and desert areas which do not have access to
electricity. The study also discusses some ideas to enhance the water productivity of passive
solar stills, which is still a big limitation to the widespread use of solar stills.

ii
Acknowledgments
Firstly, I would like to express my sincere gratitude to my supervisor Prof. Ibrahim Esat
for his continuous support of my postgraduate study and research, his patience, motivation
and immense knowledge. His guidance has helped me throughout my research and the
writing of this thesis. I could not have imagined better support for my study.
Also, I would like to express my profound gratitude to my parents and to my family,
especially my wife for providing me with unfailing support and continuous encouragement
throughout my years of study and the process of research and writing this thesis at Brunel
University London. This accomplishment would not have been possible without them.
Thamer Alheefi
iii
Table of Contents Abstract ............................................................................................................................... i
Acknowledgments ............................................................................................................. ii
Abbreviations..................................................................................................................... v
Nomenclature .................................................................................................................... vi
Greek Letters ................................................................................................................... vii
List of Figures .................................................................................................................. vii
List of Tables .................................................................................................................... xi
1. Chapter One: Introduction ...................................................................... 1
1.1 Background ............................................................................................................. 1
1.2 Desalination Technologies ..................................................................................... 2
1.2.1 Solar Still Distillation (SD) ............................................................................. 3
1.2.2 Humidification-Dehumidification (HDH) ...................................................... 5
1.2.3 Membrane Distillation (MD) .......................................................................... 6
1.2.4 Multi Effect Distillation (MED) ...................................................................... 7
1.2.5 Multistage Flash Distillation (MSF) ............................................................... 7
1.2.6 Vapour Compression (VC) ............................................................................. 8
1.2.7 Crystallization Process .................................................................................... 8
1.2.8 Reverse Osmosis ............................................................................................. 8
1.2.9 Distillation: .................................................................................................... 10
1.3 Research Objectives ............................................................................................. 11
1.4 Organization of the Thesis .................................................................................... 12
2. Chapter Two: Literature Review .......................................................... 13
2.1 Introduction .......................................................................................................... 13
2.2 Effect of Energy Storing Materials ....................................................................... 15
2.2.1 Sensible Heat Energy Storing Materials ....................................................... 15
2.2.2 Phase Change Energy Storing Materials ....................................................... 20
2.3 Effect of Basin Water Depth ................................................................................ 22
2.4 Effect of Solar Still Cover .................................................................................... 23
2.5 Effect of Solar Still Cover Tilt Angle ................................................................... 25
2.6 Summary ............................................................................................................... 27
3. Chapter Three: Experimental Set-Up .................................................. 31

iv
3.1 Introduction .......................................................................................................... 31
3.2 Experimental System ............................................................................................ 31
3.3 Experimental Plan and Methodology ................................................................... 34
4. Chapter Four: Experimental Results and Discussions ....................... 37
4.1 Introduction .......................................................................................................... 37
4.2 The Effect of the Shape of Metallic Energy Storing Materials ............................ 39
4.3 Solar Still with Hollow and Solid Steel Pieces .................................................... 44
4.4 The Effect of External Cooling ............................................................................ 46
4.5 The Effect of a Combination of External Cooling and Solid Steel Rods ............. 48
4.6 The Effect of Water Depth ................................................................................... 50
4.7 The Effect of the Type of Energy Storing Material ............................................. 51
4.8 Summary ............................................................................................................... 53
5. Chapter Five: Empirical and Theoretical Study of Solar Still
Productivity ................................................................................................... 55
5.1 Introduction .......................................................................................................... 55
5.2 Empirical Study of Total Production (Y) ............................................................. 55
5.3 The Effect of Ambient Temperature .................................................................... 56
5.4 Energy Storing Materials ...................................................................................... 58
5.5 Heat Capacity of Energy Storing Materials .......................................................... 59
5.5.1 Energy Storing Factor (β) .............................................................................. 61
5.5.2 The Effect of The Shape of Energy Storing Materials .................................. 64
5.6 Theoretical Analysis ............................................................................................. 66
5.7 Summary ............................................................................................................... 71
6. Chapter Six: Conclusions and Future Work ....................................... 72
6.1 Conclusions .......................................................................................................... 72
6.2 Future Work .......................................................................................................... 74
REFERENCES .............................................................................................. 75
Appendix 1: On Balance Mtt-500 Mini Table Top Scale .......................... 88
Appendix 2: Derivation of Equation (5.8) .................................................. 89
Appendix 3: Figures – Experimental Setup ............................................... 90

v
Abbreviations
UN The United Nations
MSF Multi Stage Flash
PVC Polyvinyl Chloride
PUF Poly Urethane foam
STDEV.P Product standard deviation
Ec Electrical conductivity
TDS Total dissolved solids
Sa Salinity
IMechE Institution of Mechanical Engineers

vi
Nomenclature
A Area m2
M mass kg
M hourly distilled water production kg/h
G solar radiation intensity W/m2
D depth m
Y total water production l/m2
K thermal conductivity W/m K
A cover tilt angle degree
T Temperature oC
E Experiment number -
X Maximum production rate ml/ m2h
X Production rate ml/ m2h
to Start of production min
te End of production min
rxy Correlation Coefficient -
Rt Critical correlation Coefficient -
Q Energy J
C Specific heat capacity J/kg.K
QL Heat loss J
V Volume m3
H heat transfer coefficient W/m2K

vii
Greek Letters
α absolute relative temperature percentage
β Energy storing factor
ΔT Duration of production min
η Efficiency -
ρ Density kg/m3
ϒ specific vapour latent heat kJ/kg
List of Figures
FIGURE 1.1 AN IMMEDIATE ACTION NEEDS TO BE TAKEN TO FIND A SOLUTION FOR WATER
SHORTAGE GLOBALLY (WWW.UNWATER.ORG). ............................................................... 2
FIGURE 1.2 THE MAIN DESALINATION TECHNOLOGIES, (BELESSIOTIS, (2016). ....................... 3
FIGURE 1.3 SKETCH OF THE EVAPORATION/CONDENSATION INSIDE A SINGLE EFFECT SOLAR
STILL (BELESSIOTIS, 2016).............................................................................................. 4
FIGURE 1.4 SCHEMATIC DRAWING FOR THE HUMIDIFICATION-DEHUMIDIFICATION
DISTILLATION SYSTEM (KUCERA, 2014).......................................................................... 6
FIGURE 1.5 SCHEMATIC DRAWING FOR THE MEMBRANE DISTILLATION .................................. 7
FIGURE 1.6 SCHEMATIC DRAWING SHOWING THE MULTI-EFFECT DISTILLATION PROCESS (EL-
DESSOUKY AND ETTOUNEY, 2002) ................................................................................. 7
FIGURE 1.7 ADELAIDE DESALINATION PLANT (WWW.EN.WIKIPEDIA.ORG, 2014) ................... 9
FIGURE 2.1 NUMBER OF RESEARCH PAPERS ON SOLAR STILLS PUBLISHED BY
SCIENCEDIRECT.COM DURING THE PERIOD FROM 2004 TO 2016 .................................... 13
FIGURE 2.2 (A) SINGLE SLOPE ACTIVE SOLAR STILL THAT CONVERTS SOLAR ENERGY TO
THERMAL ENERGY AND HEATS UP WATER IN THE BASIN. (B) SINGLE SLOPE ACTIVE
SOLAR STILL THAT USES SOLAR PANEL TO CONVERT SOLAR ENERGY TO ELECTRIC
ENERGY (TIWARI ET AL., 2003A)................................................................................... 14

viii
FIGURE 2.3 SCHEMATIC DIAGRAM OF THE SINGLE SLOPE SOLAR STILL WITH SUSPENDED
BAFFLE PLATE (EL-SEBAII ET AL., 2000) ....................................................................... 16
FIGURE 2.4 EXPERIMENTAL SET-UP SHOWING JUTE CLOTH AS AN ENERGY STORING
MATERIAL (SAKTHIVEL ET AL., 2010). .......................................................................... 17
FIGURE 2.5 SCHEMATIC OF THE EXPERIMENTAL SETUP BY SAMUEL ET AL. (2016). .............. 18
FIGURE 2.6 EXPERIMENTAL SET-UP SHOWING SENSIBLE HEAT ENERGY STORING MATERIAL
(DESHMUKH AND THOMBRE, 2017) .............................................................................. 18
FIGURE 2.7 SCHEMATIC OF A FINNED LINER BASIN STILL (EL-SEBAII AND EL-NAGAR, 2017)
..................................................................................................................................... 19
FIGURE 2.8 BLUE METAL STONE IN VARIOUS SIZE (6, 12, 20 MM) (NITHYANANDAM ET AL.,
2017) ............................................................................................................................ 20
FIGURE 2.9 SOLAR STILL DESIGN WITH V-CORRUGATED ABSORBER INTEGRATED WITH PHASE
CHANGE MATERIAL (SHALABY ET AL., 2016) ................................................................ 21
FIGURE 2.10 VARIATION OF DAILY PRODUCTION Y AGAINST THE WATER DEPTH .................. 23
FIGURE 2.11 SOLAR STILL DAILY YIELD (L) BY USING THREE DIFFERENT MATERIALS (GLASS,
PVC AND COPPER) FOR COVER (TIWARI ET AL., 2009) ................................................. 24
FIGURE 2.12 VARIATION OF DAILY YIELD AGAINST THICKNESS OF GLASS COVER FOR ACTIVE
STILL AND PASSIVE STILL, (TIWARI ET AL., 2009) ......................................................... 25
FIGURE 2.13 THE SCHEMATIC DIAGRAM OF EXPERIMENTAL SET-UP (KHALIFA AND IBRAHIM,
2010) ............................................................................................................................ 26
FIGURE 2.14 VARIATION OF SOLAR STILL COVER TILT ANGLE IN EACH MONTH DURING A
YEAR (AL OTAIBI AND AL JANDAL, 2011) .................................................................... 27
FIGURE 2.15 SUN HOURS IN EVERY MONTH OF A YEAR ......................................................... 28
FIGURE 2.16 VARIATION OF AVERAGE MAXIMUM AND MINIMUM TEMPERATURE (OC) IN A
YEAR ............................................................................................................................. 28
FIGURE 2.17 VARIATION OF SEA WATER AVERAGE TEMPERATURE IN A YEAR ...................... 29
FIGURE 2.18 VARIATION OF AVERAGE PRECIPITATION (MM) IN A YEAR ............................... 29
FIGURE 2.19 NUMBER OF RAINY DAYS IN EVERY MONTH OF A YEAR .................................... 29
FIGURE 2.20 VARIATION OF AVERAGE HUMIDITY IN A MONTH (%) OF A YEAR ..................... 30
FIGURE 2.21 VARIATION OF AVERAGE MONTHLY WIND SPEED (M/S) DURING A YEAR ........... 30
FIGURE 3.1 SCHEMATIC DRAWING FOR THE EXPERIMENTAL SET-UP WITH THE LOCATIONS OF
TEMPERATURE MEASUREMENTS .................................................................................... 32
FIGURE 3.2 PHOTOGRAPH SHOWING THE TESTED DOUBLE SLOPE PASSIVE SOLAR STILL ....... 32

ix
FIGURE 3.3 (A) PHOTOGRAPH FOR THE 2.5 CM INSULATION THICKNESS AND (B) COMPOSITE
WALL CROSS SECTIONAL VIEW ...................................................................................... 33
FIGURE 3.4 THE SOLID AND HOLLOW STEEL RODS, A) TOP VIEW, B) SIDE VIEW AND C) THE
IMAGE OF SOLID AND HOLLOW STEEL RODS .................................................................. 35
FIGURE 3.5 THE LAYOUT OF THE WATER COOLER................................................................. 36
FIGURE 4.1 VARIATION OF THE AMBIENT TEMPERATURE DURING THREE CONSECUTIVE DAYS
AT DIFFERENT TIME OF THE DAY AT THE TEST SITE IN KUWAIT ..................................... 37
FIGURE 4.2 THE HOURLY MEASURED INTENSITY OF SOLAR RADIATION ................................ 38
FIGURE 4.3 THE CONFIGURATIONS AND SHAPE OF THE TESTED STEEL ENERGY STORING
MATERIAL ..................................................................................................................... 40
FIGURE 4.4 TEMPERATURE DISTRIBUTIONS INSIDE THE CONVENTIONAL SOLAR STILL
(WITHOUT MODIFICATIONS) .......................................................................................... 41
FIGURE 4.5 TEMPERATURE DISTRIBUTIONS INSIDE THE SOLAR STILL WITH SOLID ROUND
RODS ............................................................................................................................. 41
FIGURE 4.6 TEMPERATURE DISTRIBUTIONS INSIDE THE SOLAR STILL WITH HOLLOW ROUND
RODS ............................................................................................................................. 42
FIGURE 4.7 TEMPERATURE DISTRIBUTIONS INSIDE THE SOLAR STILL WITH SOLID SQUARE
RODS ............................................................................................................................. 42
FIGURE 4.8 THE CUMULATIVE WATER PRODUCTION CURVE FOR THE SOLAR STILL MODIFIED
WITH ROUND SOLID RODS, HOLLOW ROUND RODS AND SOLID SQUARE RODS COMPARED
WITH THE CONVENTIONAL SOLAR STILL. ....................................................................... 43
FIGURE 4.9 THE RATE OF WATER PRODUCTION FOR THE SOLAR STILL MODIFIED WITH ROUND
SOLID RODS, HOLLOW ROUND RODS AND SOLID SQUARE RODS COMPARED WITH THE
CONVENTIONAL SOLAR STILL. ....................................................................................... 44
FIGURE 4.10 THE TEMPERATURE DISTRIBUTION INSIDE A SOLAR STILL MODIFIED WITH A
COMBINATION OF SOLID AND HOLLOW ROUND STEEL RODS .......................................... 45
FIGURE 4.11 THE RATE OF WATER PRODUCTION FOR A SOLAR STILL MODIFIED WITH A
COMBINATION OF SOLID AND HOLLOW ROUND STEEL RODS COMPARED WITH THE
CONVENTIONAL SOLAR STILL ........................................................................................ 45
FIGURE 4.12 THE CUMULATIVE WATER PRODUCTION CURVE FOR A SOLAR STILL MODIFIED
WITH A COMBINATION OF SOLID AND HOLLOW ROUND STEEL RODS COMPARED WITH THE
CONVENTIONAL SOLAR STILL ........................................................................................ 46
FIGURE 4.13 THE TEMPERATURE DISTRIBUTION INSIDE A SOLAR STILL MODIFIED WITH AN
EXTERNAL COOLING ON THE OUTER SURFACE OF GLASS COVER PLATE ......................... 47
FIGURE 4.14 THE RATE OF WATER PRODUCTION FOR A SOLAR STILL MODIFIED WITH AN
EXTERNAL COOLING ON THE OUTER SURFACE OF GLASS COVER PLATE ......................... 47

x
FIGURE 4.15 THE CUMULATIVE WATER PRODUCTION CURVE FOR A SOLAR STILL MODIFIED
WITH AN EXTERNAL COOLING ON THE OUTER SURFACE OF GLASS COVER PLATE ........... 48
FIGURE 4.16 THE TEMPERATURE DISTRIBUTION INSIDE A SOLAR STILL MODIFIED WITH A
COMBINATION OF EXTERNAL COOLING AND SOLID RODS ............................................... 49
FIGURE 4.17 THE RATE OF WATER PRODUCTION FOR A SOLAR STILL MODIFIED WITH A
COMBINATION OF EXTERNAL COOLING AND SOLID STEEL RODS .................................... 49
FIGURE 4.18 THE CUMULATIVE WATER PRODUCTION CURVE FOR A SOLAR STILL MODIFIED
WITH A COMBINATION OF EXTERNAL COOLING AND SOLID STEEL RODS ........................ 50
FIGURE 4.19 VARIATION OF TOTAL DAILY PRODUCTION (L/M2) IN TERMS OF WATER DEPTH
(CM) .............................................................................................................................. 51
FIGURE 4.20 EFFECT OF THE TYPE OF ENERGY STORING MATERIAL ON THE RATE OF WATER
PRODUCTION COMPARED TO THE CONVENTIONAL SOLAR STILL WITH NO MODIFICATIONS
..................................................................................................................................... 52
FIGURE 4.21 EFFECT OF THE TYPE OF ENERGY STORING MATERIAL ON THE CUMULATIVE
WATER PRODUCTION CURVE COMPARED TO THE CONVENTIONAL SOLAR STILL WITH NO
MODIFICATIONS. ........................................................................................................... 53
FIGURE 5.1 THE DAILY WATER PRODUCTION AS A FUNCTION OF WATER DEPTH INSIDE THE
BASIN ............................................................................................................................ 56
FIGURE 5.2 VARIATION OF BASIN TEMPERATURE (T1), BASIN WATER TEMPERATURE (T2),
VAPOUR TEMPERATURE (T3), AMBIENT TEMPERATURE (T4) AND COVER TEMPERATURE
(T5) IN AUGUST IN KUWAIT .......................................................................................... 57
FIGURE 5.3 THE VARIATION OF DAILY WATER PRODUCTION AGAINST THE AMBIENT AVERAGE
TEMPERATURE .............................................................................................................. 58
FIGURE 5.4 A TYPICAL DOUBLE SOLAR STILL WITH NO ENERGY STORING MATERIALS USED IN
THE BASIN ..................................................................................................................... 59
FIGURE 5.5 DOUBLE SOLAR STILL WITH ENERGY STORING MATERIALS USED IN THE BASIN .. 60
FIGURE 5.6 WATER TEMPERATURE RISE FOR A MODIFIED SOLAR STILL USING ENERGY
STORING MATERIALS VERSUS WATER TEMPERATURE RISE FOR A SOLAR STILL WITHOUT
MODIFICATIONS ............................................................................................................ 62
FIGURE 5.7 VARIATION OF ENERGY STORING FACTOR, Β FOR STEEL, COPPER, ALUMINIUM,
STONE AND GLASS ......................................................................................................... 63
FIGURE 5.8 THE ENERGY FLOW INSIDE A DOUBLE SLOPE SOLAR STILL ................................. 66
FIGURE 5.9 THE MEASURED BASIN WATER TEMPERATURE VERSUS TIME COMPARED WITH THE
PREDICTION USING THE THEORETICAL MODEL ............................................................... 70
FIGURE 5.10 THE MEASURED GLASS TEMPERATURE VERSUS TIME COMPARED WITH THE
PREDICTION USING THE THEORETICAL MODEL ............................................................... 71

xi
FIGURE 5.11 THE MEASURED CUMULATIVE WATER PRODUCTION VERSUS TIME COMPARED
WITH THE PREDICTION USING THE THEORETICAL ........................................................... 71
List of Tables
TABLE 1.1 THE GENERAL TECHNICAL INFORMATION OF ADELAIDE DESALINATION PLANT,
(WWW.EN.WIKIPEDIA.ORG, 2014) ................................................................................... 9
TABLE 1.2 MAJOR OIL RESERVES IN THE MIDDLE EAST, (WWW.IMECHE.ORG, 2015) ........... 10
TABLE 5.1 MEASURED TOTAL PRODUCTION IN TERMS OF WATER DEPTH .............................. 55
TABLE 5.2 DAILY AMBIENT TEMPERATURE AGAINST DAILY WATER PRODUCTION ............... 57
TABLE 5.3 MAXIMUM WATER PRODUCTION RATE VERSUS THE DAILY AMBIENT AVERAGE
TEMPERATURE .............................................................................................................. 58
TABLE 5.4 DENSITY AND SPECIFIC HEAT CAPACITY VALUES ................................................ 63

1
1. Chapter One: Introduction
1.1 Background
Water is one of the most important factors for the lives of humans, animals and plants. In
the past, there was an impression that water resources are unlimited and the balance between
demand and supply always exists through the hydrological cycle in nature. In the last few
decades, it has been revealed that there is a significant imbalance between the supply and
demand for fresh water. Such findings have led to the conclusion that water resources are
extremely limited. It is well known that more than three quarters of the earth’s surface is
covered with water. However, the majority of this water is not drinkable. Oceans, which consist
of salt water, constitute about 97% of the earth’s water. The remaining 3%, which represents
fresh water, is reserved in icecaps and glaciers (68.7%), ground water (30.1%) and surface
water such as lakes and rivers (0.3%), (Manju and Sagar, 2017). This means that less than 1%
of the earth’s water is available for human use in the form of potable water.
Thus, it is expected that there will be an acute water shortage in the near future. This
shortage arises from the increased demand induced by population growth, urbanization and
industrialization. Some researchers (Rijsberman, 2006) reported that a water shortage occurs
when the water supply falls below 1000 m3 per person per year. Additionally, it was reported
by the United Nations that about 40% of the world population will face water shortage by 2030
(WAAP, 2015). Also, the World Health Organization (2010) reported that the demand will
exceed the supply by 56% by 2025. It is commonly known that water shortage is a multi-
dimensional problem that can lead to poverty, hunger, ecosystem degradation, desertification,
climate change and even the threat to world peace directly and indirectly.
Owing to the seriousness of the global water crisis, the United Nations has declared that
the 22nd of March of every year is the World Water Day since 1993. This is to highlight the
importance of water, to encourage the sustainable management of water resources and to
increase the public awareness of this issue worldwide. Since this date, the interest in the global
water crisis has increased dramatically, and noticeable improvements were detected in some
regions in the last twenty years. However, the United Nations has issued a shocking report in
2014, showing that 4000 children die every day (about 1.5 million/year) due to diseases such
as diarrhoea, dysentery and cholera caused by dirty water and unhygienic living conditions.
Moreover, the report indicates that the lack of access to water, sanitation and potable water is

2
extremely serious and needs immediate action so that a solution is reached globally. Error! R
eference source not found. illustrates that an appropriate action can prevent 20% of child
death.
Figure 1.1 An immediate action needs to be taken to find a solution for water shortage globally (www.unwater.org).
1.2 Desalination Technologies
Desalination can be defined as the process of removing dissolved salts and minerals from
saline water to produce potable water with the permissible salinity limit 500 – 1000 ppm, (Rao
and Mamatha, 2004). The objective of this section is present a summary of the existing
desalination techniques. Figure 1.2 summarizes the classifications of desalination techniques
based on the adopted desalination process, (Kucera, 2014) and Belessiotis, 2016). The figure
classifies the desalination methods into thermal and non-thermal processes. The conventional
thermal methods (commercially available) are usually driven by steam supplied from external
sources and include Multistage Flash evaporation (MSF), Multi-Effect Distillation (MED) and
Thermal Vapour Compression (TVC). The non-conventional thermal methods (not
commercially available) include Solar Distillation (SD), Membrane Distillation (MD) and
Humidification-Dehumidification (HDH) which are suitable for small capacities. The non-
conventional thermal methods are still under investigation by researchers. The conventional
(commercialized) non-thermal methods are driven by direct electric energy and include

3
Reverse Osmosis (RO), Electro-Dialysis Reversal (EDR) and Mechanical Vapour
Compression (MVC). The non-conventional non-thermal methods include crystallization
(freezing and hydrates) and ion exchange, which did not find a wide range of applications. A
brief description to each process is given below.
Figure 1.2 The main desalination technologies, (Belessiotis, (2016).
1.2.1 Solar Still Distillation (SD)
In its simplest form, solar stills are basins which are partially filled with saline water and
covered from the top side with a transparent cover; see Figure 1.3. The basins are thermally
insulated from each side except from the top transparent side. Basically, the operation of solar
stills is based on a distillation process. The incident solar radiation is absorbed by water in the
basin of the still; thus, the solar energy is used to evaporate the saline water. The created vapor
moves towards the top transparent cover by natural convection and condenses on the cold
interior surface of the transparent cover. The pure water vapour condenses on top and drips
down to the sides where it is collected and removed by gutters.

4
Because the created vapour is already mixed with the air inside the still, this process
includes humidification-dehumidification process occurring simultaneously in the same
device. The advantages of solar stills include simplicity, low cost, ease of maintenance and low
environmental impact, while the most significant disadvantage is the low efficiency and
productivity. Ahsan et al. (2014) designed and fabricated a solar still using local, available,
cheap and durable materials and provided the fabrication cost. The designed still occupied a
land area of 0.8 m2 and produced about 1.5 L/day. The total cost of fabricating this solar still
was estimated, based on their local currency, as RM 112 or ($35, USD). Recent reviews on this
technique were also given by Kaviti et al. (2016), Omara et al. (2017) and Shukla et al. (2017).
Figure 1.3 Sketch of the evaporation/condensation inside a single effect solar still (Belessiotis, 2016)
Solar stills have been studied by researchers extensively in terms of their advantages and
disadvantages compared to other techniques. The main points extracted from the published
literature can be summarized as follows:
Advantages:
• A Free energy source: Sunlight, as an available energy source, exists almost in all countries,
and it is a renewable energy. For example, the average daily solar radiation in India is 4–7
kWh/m2 compared to the global average of 2.5 kWh/m2. Therefore, despite its relatively high
capital cost, solar energy driven desalination is known to be more feasible than other methods
(Arjunan et al., 2009).
• Low maintenance cost: Solar stills are very simple and consist of no moving parts. Hence,
there is no need to have regular maintenance which can be very costly in remote areas.
Transparent cover
5
• A reliable system: Solar stills use sunlight to produce the potable water and there is no risk
of losing the energy source. Therefore, solar stills are known as a reliable water producer.
• Availability: Solar stills use a renewable energy source, which is available in most countries.
It represents a good option especially in remote areas where there is a shortage of electricity
and good quality water (Eltawil and Omara, 2014).
• Better water taste: the water produced by solar stills has better taste compared to the other
systems which boil the water to produce the drinking water. In solar stills the water is not
boiled.
• Neutral PH: Water production in solar stills is a chemical free process, which can produce
neutral PH water.
Disadvantages:
Solar stills, like any other devices, have some disadvantages that render this technology
very controversial in the field of fresh water production. Some of the disadvantages that were
claimed by researchers can be listed as follows:
• Bacteria and harmful chemicals: Solar stills do not boil the water and therefore, the bacteria
and harmful chemicals could contaminate the produced water.
• Bugs and insects: The area for the tilted glass cover could be an attractive area for insects
and bugs, which could reduce the efficiency of produced water in terms of quality and quantity.
• Low water production: One of the main problems associated with the use of solar stills, as
identified in many studies, is the productivity issue. A single solar still can be installed in one
square metre and it weighs about 30 kg. The produced water when it is in direct sun shine can
be about 6 litres per day in summer time and it could drop to half in winter time.
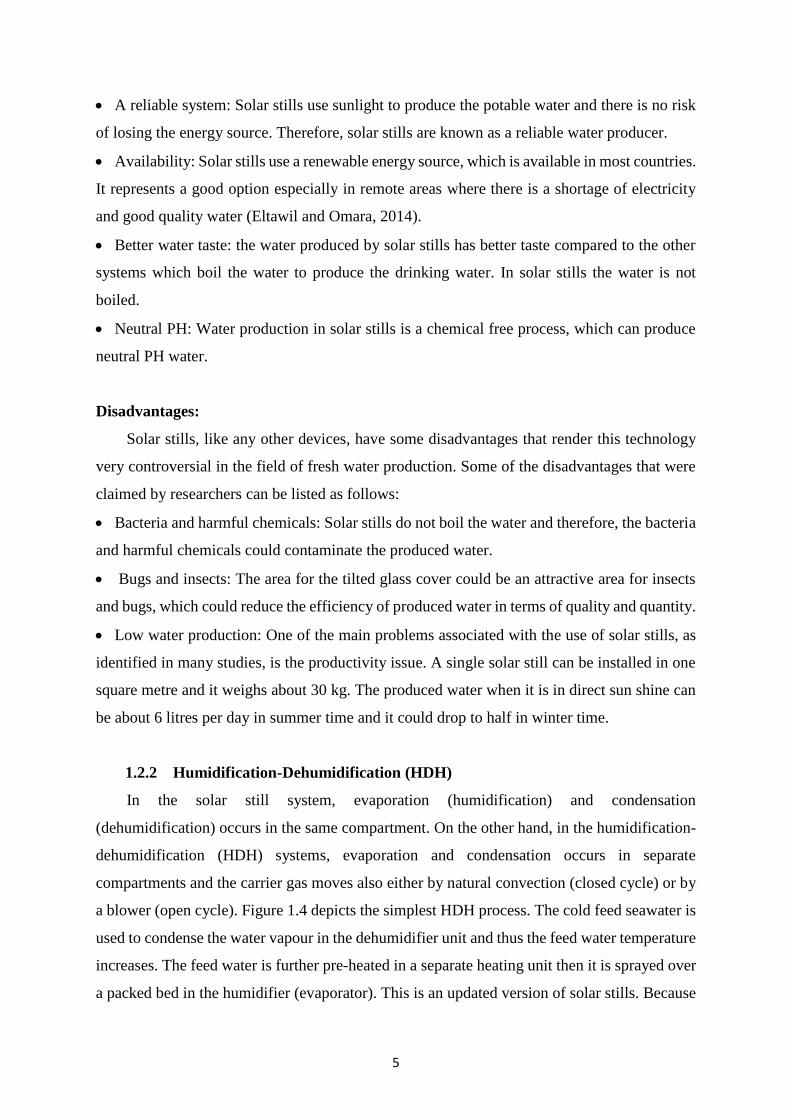
1.2.2 Humidification-Dehumidification (HDH)
In the solar still system, evaporation (humidification) and condensation
(dehumidification) occurs in the same compartment. On the other hand, in the humidification-
dehumidification (HDH) systems, evaporation and condensation occurs in separate
compartments and the carrier gas moves also either by natural convection (closed cycle) or by
a blower (open cycle). Figure 1.4 depicts the simplest HDH process. The cold feed seawater is
used to condense the water vapour in the dehumidifier unit and thus the feed water temperature
increases. The feed water is further pre-heated in a separate heating unit then it is sprayed over
a packed bed in the humidifier (evaporator). This is an updated version of solar stills. Because
6
some of the energy can be recovered in the dehumidifier and is used for preheating the feed
water, the performance is improved compared to solar stills. Thus, the HDH process is a low
to medium capacity method.
Figure 1.4 Schematic drawing for the humidification-dehumidification distillation system (Kucera, 2014)
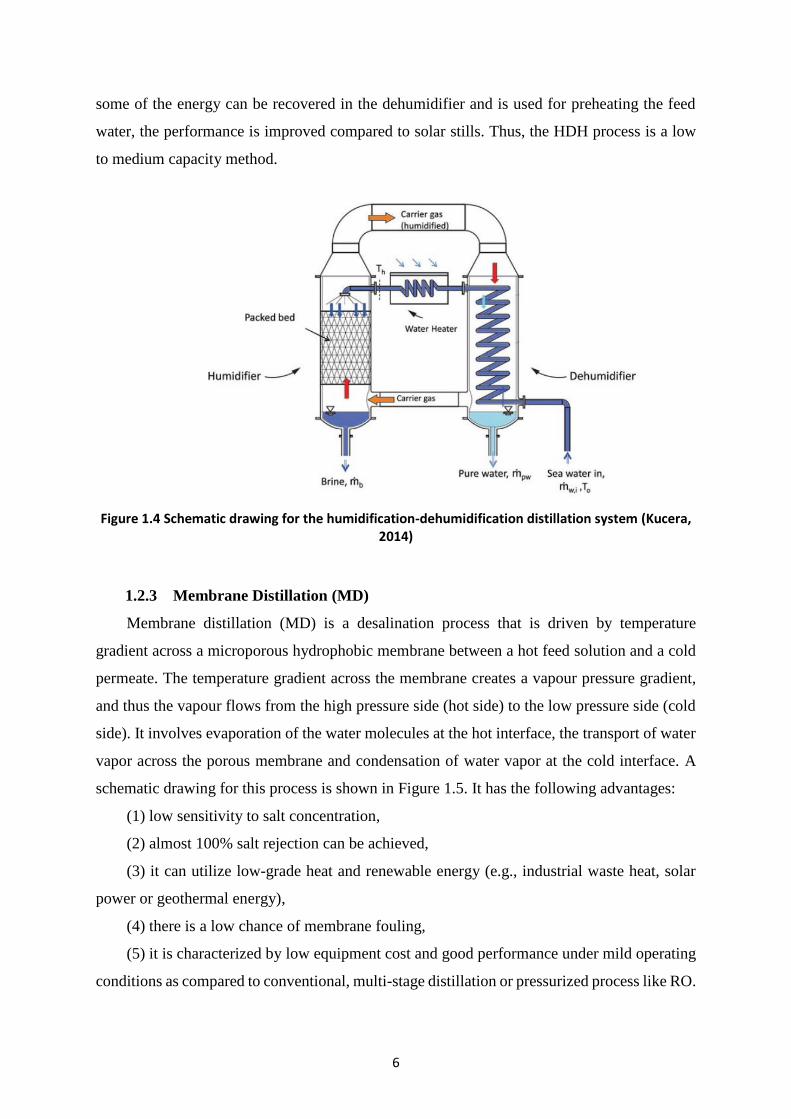
1.2.3 Membrane Distillation (MD)
Membrane distillation (MD) is a desalination process that is driven by temperature
gradient across a microporous hydrophobic membrane between a hot feed solution and a cold
permeate. The temperature gradient across the membrane creates a vapour pressure gradient,
and thus the vapour flows from the high pressure side (hot side) to the low pressure side (cold
side). It involves evaporation of the water molecules at the hot interface, the transport of water
vapor across the porous membrane and condensation of water vapor at the cold interface. A
schematic drawing for this process is shown in Figure 1.5. It has the following advantages:
(1) low sensitivity to salt concentration,
(2) almost 100% salt rejection can be achieved,
(3) it can utilize low-grade heat and renewable energy (e.g., industrial waste heat, solar
power or geothermal energy),
(4) there is a low chance of membrane fouling,
(5) it is characterized by low equipment cost and good performance under mild operating
conditions as compared to conventional, multi-stage distillation or pressurized process like RO.

7
More details about this technique can be found in Abu-Zeid et al. (2015) and González et
al. (2017) who have conducted an extensive review on this method.
Figure 1.5 Schematic drawing for the membrane distillation
1.2.4 Multi Effect Distillation (MED)
The feed seawater is evaporated in several stages called effects (see Figure 1.6). In the
first effect, the feed water is heated and partially evaporated by steam supplied from an external
source. Afterwards, the feed water passes through a series of consecutive chambers where it is
partially evaporated. The vapour created in the previous chamber is condensed in the next
chamber giving the latent heat of condensation to the incoming feed seawater.
Figure 1.6 Schematic drawing showing the multi-effect distillation process (El-Dessouky and Ettouney, 2002)
1.2.5 Multistage Flash Distillation (MSF)
The Multi Stage Flash (MSF) process consists of several elements, called stages. The hot
feed water heated by steam in the first stage enters a series of compartments, each at lower
pressure than the previous stage. The hot water expands (flashes) into each chamber releasing
vapor, which condenses to fresh water and exchange simultaneously the latent heat of
condensation with the incoming feed seawater.
Hy
dro
pho
bic
Mem
bra
ne
Hot feed
solution Cold
permeate
8
1.2.6 Vapour Compression (VC)
In this process, the heat required to vaporise the saline water is obtained from compressed
steam supplied from an external source, i.e. the steam temperature increases as the pressure
increases. The compression process could be done mechanically or thermally using steam
ejector.
1.2.7 Crystallization Process
This process comprises of the freezing of seawater and hydrate formation. Both processes,
despite their simplicity, have found no wide industrial applications. During the freezing
process, seawater crystallizes nearly to pure ice. Small crystals are not easily separated from
the ice brine slurry and almost half of the fresh water produced is used to wash out the salts
from the ice surface, considerably reducing the efficiency of the method and increasing product
cost. Hydrate formation is an alternative to produce pure crystals. Water combines with other
substances to form hydrate crystals. For desalination purposes, hydrocarbons like propane or
butane have been studied. During crystal formation, all impurities like the dissolved salts in
seawater are excluded and the crystals formed are pure hydrates. After hydrate formation, the
gas is released giving pure water. The process found no large-scale commercial applications
due to many problems arising during operation.
1.2.8 Reverse Osmosis
In this process, saline water is pushed at pressures higher than the osmotic pressure
(mechanical energy) through special semi-permeable membranes allowing water molecules to
pass selectively while blocking the dissolved salts.
Reverse osmosis and distillation processes constitute the most widely used techniques due
to their efficiency and economic viability. A brief illustration of these two technologies is
presented below.
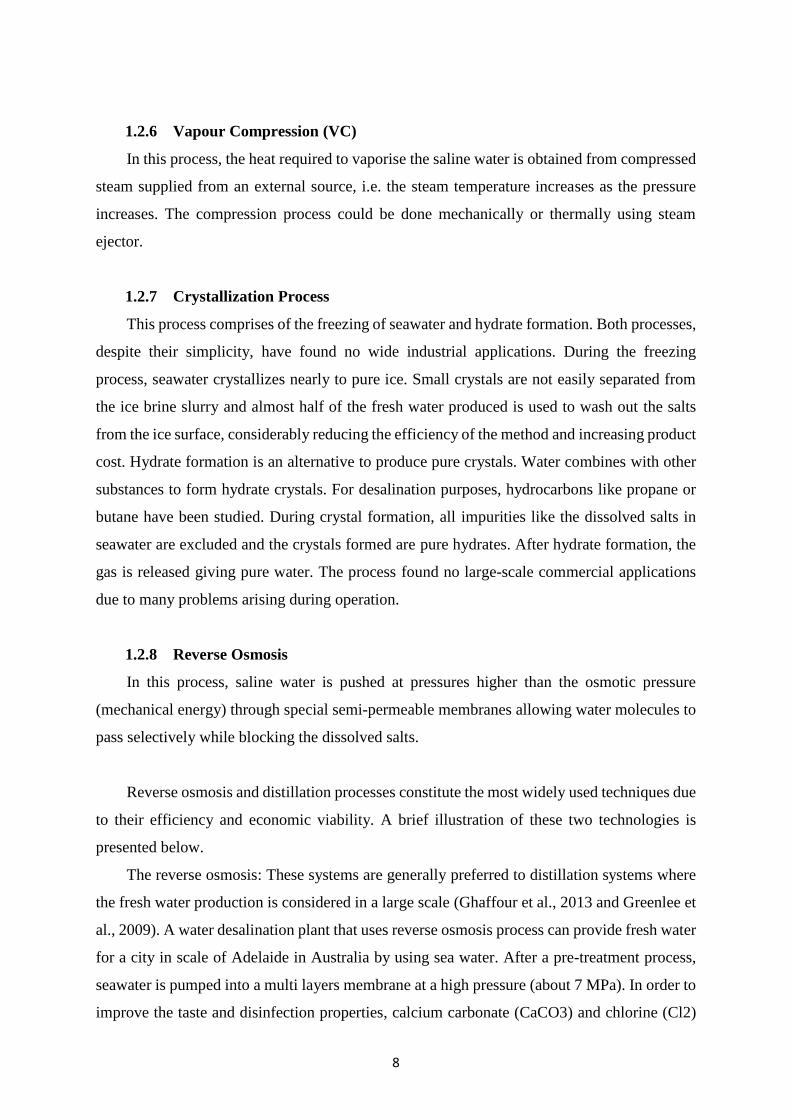
The reverse osmosis: These systems are generally preferred to distillation systems where
the fresh water production is considered in a large scale (Ghaffour et al., 2013 and Greenlee et
al., 2009). A water desalination plant that uses reverse osmosis process can provide fresh water
for a city in scale of Adelaide in Australia by using sea water. After a pre-treatment process,
seawater is pumped into a multi layers membrane at a high pressure (about 7 MPa). In order to
improve the taste and disinfection properties, calcium carbonate (CaCO3) and chlorine (Cl2)
9
are added to the water. In a typical water desalination plant that uses reverse osmosis
technology, similar to the Adelaide Desalination Plant in Australia in Error! Reference source n
ot found., about 40% of the saline water can be converted to potable water (en.wikipedia.org,
2014). This plant has been providing 3×10⁸ litres per day since 2012, which represents almost
50% of the city’s drinking water needs. Depending on the availability of energy and the ability
of affording the costs, a reverse osmosis plant can be a suitable solution to produce fresh water.
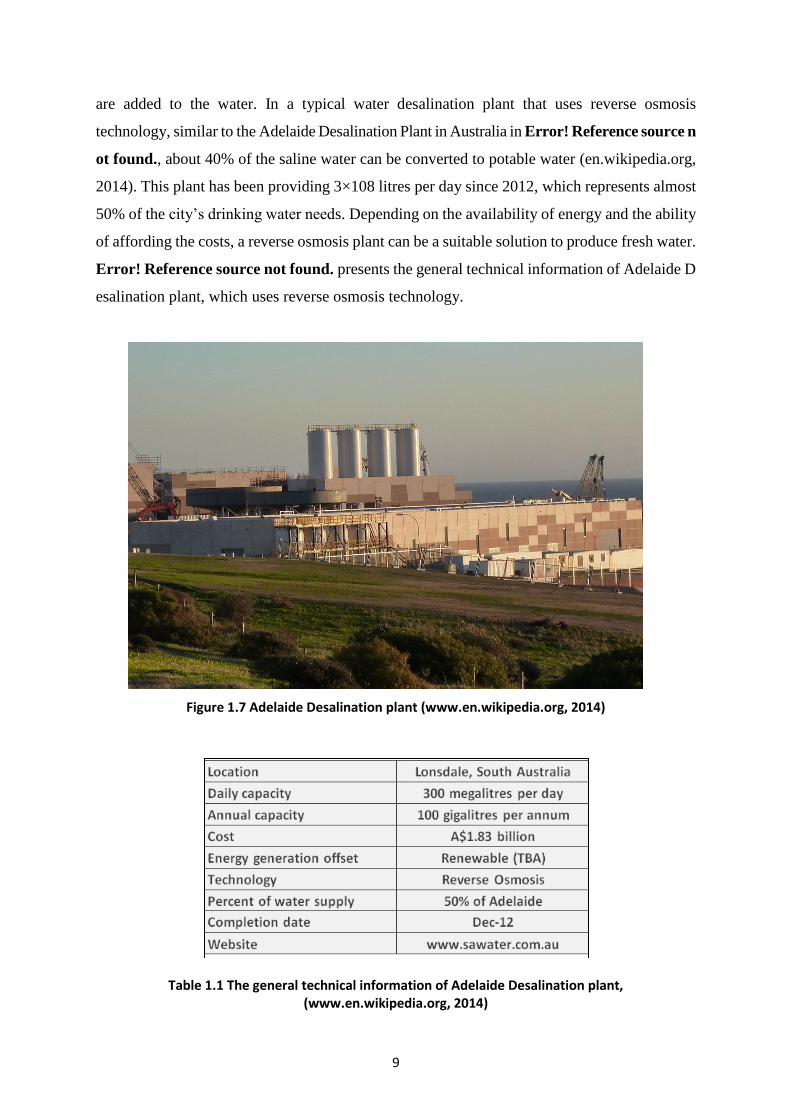
Error! Reference source not found. presents the general technical information of Adelaide D
esalination plant, which uses reverse osmosis technology.
Figure 1.7 Adelaide Desalination plant (www.en.wikipedia.org, 2014)
Table 1.1 The general technical information of Adelaide Desalination plant, (www.en.wikipedia.org, 2014)

10
It was reported that the price of desalinated seawater has been reduced to under
US$0.50/m3 at reverse osmosis plants. This price could be increased in some locations
depending on the location conditions and facilities. The price also depends on local government
policy and some subsidies may be contributed in calculating final price (Ghaffour et al., 2013).
1.2.9 Distillation:
After heating a liquid up to the evaporation phase, the process of capturing and cooling
the resultant hot vapour until it condenses is called distillation. Distillation has been used to
produce potable water for many years. It is a fundamental process in many water producing
systems. The source of the heat energy required for the distillation process could be electrical
energy or energy due to combustion of fossil fuels (oil or natural gas). Due to the cost of energy
and the availability of energy sources in the form of electricity or fuel, producing low cost fresh
water is not possible by using distillation in many remote areas (Ghaffour et al., 2015).
According to the literature, it is estimated that 8.78 million tons of oil per year is required to
produce one million m3/day of fresh water by desalination, which indicates that there is an
important need to find an alternative energy source for the desalination systems (Kalogirou,
2005). According to the report by the Institution of Mechanical Engineers (IMechE), there are
an estimated 1.3 trillion barrels of proven oil reserve left in the world’s major fields
(www.imeche.org, 2015). Considering such a huge rate of oil consumption, the present oil
reserves will be sufficient to last for 40 years only. Table 1.2 illustrates the major oil reserves
in the Middle East. It is estimated that two-thirds of the world’s remaining reserves are in the
Middle East.
Table 1.2 Major oil reserves in the Middle East, (www.imeche.org, 2015)
By 2040, the production levels may decrease down to 15 million barrels per day – around
20% of what is currently consumed. It is likely that by then that the world’s population will be
11
twice as large as it is now. Therefore, the demand for potable water will be increased
significantly in the future. It can be concluded that there is a real need to find an alternative
source of energy for the increasing demand of potable water. Theoretically, any kind of energy
can be considered as a heating source in potable water production. However, not many energy
sources are available to replace the existing energy sources.
In the last decades, researchers have focused on solar energy as a suitable alternative
energy source that has many benefits in terms of availability and cleanliness (Kannan et al.,
2014 and Omara et al., 2013). The process of producing potable water by using solar energy is
called solar desalination. The history and installation of solar desalination technology dates
back to 2000 years ago (Velmurugan and Sritha, 2011 and Samee et al., 2007). Solar
desalination was used to produce potable water from brackish water as well as salt. A number
of advantages and disadvantages were reported in the literature for solar desalination. The main
benefits of using solar energy are as follows (www.technologystudent.com, 2015):
1. Solar energy is free,
2. Solar energy does not cause pollution,
3. Solar energy can be used in remote areas,
4. Solar energy is not as limited as oil reserves.
There are also several disadvantages for solar energy, namely:
1. Solar energy is available on sunny days only,
2. Solar energy is available at day time,
3. Solar energy is not practically available in some countries,
4. Solar energy requires a large area of land to capture sunlight.
Having considered both advantages and disadvantages of solar energy, many researchers
have concluded that solar stills are suitable devices to produce potable water especially in
remote areas (Zerrouki et al., 2014; Malaeb et al., 2014; Sathyamurthy et al., 2014).
1.3 Research Objectives
As mentioned above, the future limitations in water resources have urged researchers to
enhance the performance of the existing treatment units. However, the existing desalination
technologies are energy intensive processes where the production of 1000 m3 of potable water
per day requires about 27.4 ton of fossil fuel per day (Methnani, 2007). These technologies

12
require the availability of energy sources (external steam or electricity). In fact, in rural and
remote areas, conventional energy sources (external steam or electricity) are not available.
Thus, there is the need for an alternative energy source for deriving small-scale desalination
systems suggested for these rural and remote areas. Due to the abundant availability of solar
energy, solar desalination systems are one of the options suggested for these areas.
Accordingly, the objective of the present study is to investigate the effect of different
parameters on the thermal performance of a double-slope solar still for water production in
rural or remote areas. The objectives of the present study are summarized as follows:
1. to study the effect of the type of energy storing material on the thermal performance of
solar stills. Three materials will be tested namely steel, gravel and phase change material
(PCM).
2. to study the effect of the geometrical shape of steel pieces, which are used as a sensible
heat energy storing material.
3. to study the effect of gravel size on the thermal performance of the solar still.
4. to compare the experimental results with a theoretical model.
1.4 Organization of the Thesis
The thesis is organised as follows. Chapter 2 reviews the previous studies on solar stills.
Chapter 3 describes the experimental system. Chapter 4 presents the results and discussions.
Chapter 5 presents the modelling and comparison with the experimental data. Chapter 6 gives
the conclusions and suggestions for future work.

13
2. Chapter Two: Literature Review
2.1 Introduction
As mentioned in chapter 1, conventional desalination systems consume large amounts of
fossil fuel. Thus, there is a need for either reducing the energy consumption in these
conventional systems or using an alternative renewable energy sources. Solar stills are one
option that uses solar energy for water desalination. According to the published literature, the
number of published journal papers on solar stills during the last ten years has increased
significantly; see Figure 2.1. Thus, research on solar stills is growing considerably. Based on
the source of energy used to evaporate the saline water, solar stills can be classified into passive
and active solar stills. In passive solar stills, water evaporation occurs naturally using direct
solar radiation and no external energy source is supplied to the basin. The basin is fed with
water every morning and there is no feed water circulation.
Figure 2.1 Number of research papers on solar stills published by sciencedirect.com during the period from 2004 to 2016
In active solar stills, water evaporation is assisted by an external energy source such as
solar collectors or solar panel or any waste heat, which is used to increase the water temperature
and thus increase the evaporation rate. The feed water is circulated at very low flow rates using
a circulation pump. Figure 2.2 illustrates an example on active solar stills assisted with a solar

14
collector (Figure 2.2a) or a solar panel that converts solar energy into electrical energy, which
is used to heat the water using an electric heater (Figure2.2b).
(a) (b)
Figure 2.2 (a) Single slope active solar still that converts solar energy to thermal energy and heats up water in the basin. (b) Single slope active solar still that uses solar panel to convert solar energy
to electric energy (Tiwari et al., 2003a).
The performance of solar stills is usually evaluated using thermal efficiency defined by
Eq. (2.1) below (Xiao et. al, 2013):
(2)
where m is the hourly distilled water production rate (kg/h), γ is the specific latent heat of
vaporization (kJ/kg), Aa is the total area of an absorber (m2) and G is the solar radiation intensity
over the area of Aa (W/m2). Note that, the value of m varies along the day depending on the
time, i.e. morning, afternoon, etc.
This chapter presents a review of the factors affecting the thermal performance of solar
stills. In section, 2.2, the effect of using energy storage materials is presented. Section 2.3
presents the effect of initial water depth on the daily productivity of solar stills. Section 2.4
presents the effect of transparent cover material while section 2.5 presents the effect of the tilt
angle. Finally, section 2.6 gives a summary to the chapter.
=GA
m
a.6.3
.
pump Electric Heater

15
2.2 Effect of Energy Storing Materials
Solar still is not so much attractive in the market due to its low productivity, soresearchers
have tried to improve the distillate output of solar stills. The productivity of solar still can be
enhanced by increasing the brine temperature in the basin (Xiao et al., 2013) and Voropoulos
et al., 2003). It was also found that the temperature of the brine depends on water free surface
temperature (Sivakumar and Sundaram, 2013). The use of energy storing materials can affect
the brine temperature and thus can make enhancements in the productivity of solar stills (El-
Sebaii et al., 2009). Energy storing materials store the excess energy during the sunshine hours
and release it during sunless hours in order to increase distillate production. These materials
can be divided into sensible heat materials (energy stored without phase change) and latent heat
materials (energy stored with phase change). Some of the most effective energy storing
materials is reviewed in this section.
2.2.1 Sensible Heat Energy Storing Materials
Akash et al. (1998) studied the effect of using different absorbing materials on enhancing
the productivity of a double slope solar still. They tested three types of absorbing materials,
namely; black absorbing rubber mat, black ink in water solution and black dye in water
solution. The results demonstrated that the productivity has increased by 60% with black dye,
45% with black ink and 38% with black rubber mat. El-Sebaii et al. (2000) investigated the
effect of using baffle suspended absorber plates on the performance of a single basin single
slope solar still; see Figure 2.3. The still basin was made of a galvanized iron sheet with an area
of 1 m2. A movable suspended absorber plate made of aluminium was provided inside the basin
water. Two plates were tested: a solid plate and a perforated plate, i.e. a plate with some vents.
The suspended absorber plate can be moved up and down and thus the mass ratio of the water
above and below the plate can be varied, i.e. the water height above and below the plate can
vary. The results demonstrated that the modified still with baffle plates operates at higher water
temperature compared to the conventional solar still. Thus, the daily productivity has increased
from 4.736 kg/m2 to 5.737 kg/m2 (increased by 21.1%). Additionally, they reported that when
the plate is perforated, the optimum position of the baffle plate should be in the middle of the
basin while the mass of water above the plate should be as low as possible in case of solid plate.
The reason for the improvement in productivity is mainly because of the increase in water free
surface temperature induced by the absorber plate. In fact, this plate divides the water in the
basin to upper and lower portions. The level of water column in upper portion plays a main

16
role in productivity enhancement. It was found out that the highest productivity can be achieved
for the lowest water column in upper portion.
Figure 2.3 Schematic diagram of the single slope solar still with suspended baffle plate (El-Sebaii et al., 2000)
Nafey et al. (2001) used black rubber and black gravel materials as energy storage
materials in order to enhance the productivity of a single slope solar still. They tested the effect
of rubber thickness (2 mm, 6 mm, 10 mm) and gravel size (7 - 12 mm, 12 - 20 mm, 20 - 30
mm). They concluded that the maximum enhancements occurred using black rubber with 10
mm thickness (20% enhancement) and using gravel which measure 20 – 30 mm (19%
enhancement). Naim et al. (2002) studied the improvement of productivity of solar still using
charcoal particles to work as an energy absorbing material. They designed and fabricated a
solar still made of Perspex with basin area 0.5 m2. A layer of charcoal particles of 20 mm
thickness was placed uniformly underneath the basin. The effect of charcoal particle size was
investigated (1.5, 5, 7 mm). The results showed that the coarse charcoal particles yielded the
best results in terms of productivity. The experimental results showed a 15% improvement in
solar still efficiency in comparison with conventional solar stills.
Sakthivel et al. (2010) studied experimentally the effect of using jute cloth as an energy
storing material on the performance of conventional solar still. The jute cloth was kept in the
middle of the still as well as at the surface of the side wall (see Figure 2.4). Most of the incident
solar energy is absorbed by the blackened surface of the basin through the saline water, portion
of energy is absorbed by the jute cloth. The jute cloth provides more evaporation surface and
as the heat capacity of the jute cloth is low, it can attain high temperatures. This leads to rapid
evaporation of water. The still has an effective basin area of 0.5 m2. The experimental results

17
showed that the productivity of the solar still was improved by 12% using Jute cloth and the
efficiency increased by 8% compared to the conventional solar still. This improvement is due
to the fact that the latent heat released from the glass cover (condensation) is used to evaporate
the water absorbed by the capillary action in the Jute cloth. Consequently, the water yield in
solar still increased and the temperature of the bottom of the glass cover decreased.
Figure 2.4 Experimental set-up showing Jute cloth as an energy storing material (Sakthivel et al., 2010).
Samuel et al. (2016) conducted an experimental study on improving the performance of a
single slope solar still using the following: (1) spherical balls filled with rock salt as sensible
heat storage material and (2) different sponge materials for better capillary action that enhances
the evaporation process. Their experimental setup is shown in Figure 2.5. The results
demonstrated that the daily yield was 3.7 kg/m2 with spherical ball salt energy storage whereas
for the single slope solar still with and without sponges, the value was 2.4 and 2.6 kg/m2,
respectively. It was found also that sponges need to be replaced every 14 days as rust and salt
from saline water gets accumulated on the pores, thus reducing the capillary effect.
Additionally, the cost of the produced water using the ball energy storage material was lower
compared to that with the sponge material.

18
Figure 2.5 Schematic of the experimental setup by Samuel et al. (2016).
Deshmukh and Thombre (2017) studied experimentally the effect of using sensible heat
storage materials on the performance of a single slope solar still (0.5 m2 basin area) as shown
in Figure 2.6. Sand and Servotherm medium oil (SM) were used as energy storing materials.
Three depths of the energy storage material were tested namely; 0.5 cm (4.1 kg), 1 cm (8.2 kg)
and 1.5 cm (12.3 kg). The water depth was kept fixed at 0.6 cm (3 kg) for all cases. The results
demonstrated that the overnight productivity for solar stills with energy storage materials
increased with increasing the mass of water and energy storing material compared to the base
case (without storage material). The daylight productivity decreased with increasing the mass
of water and energy storage material. Thus, they concluded that there is an optimum value for
the mass of the energy storing material. This optimum value was such that the heat capacity
equals 8.
Figure 2.6 Experimental set-up showing sensible heat energy storing material (Deshmukh and Thombre, 2017)
19
Panchal et al. (2017) investigate the effect of energy storage material on the productivity
of a single slope solar still. Marble pieces and sand stones were used as energy storage
materials, and the water depth in the basin was kept constant at 4 cm. The results indicated that
the productivity of the still with sand stone increased by 16% and the productivity of the still
with marble pieces increased by 8%, compared to the still without energy storage materials.
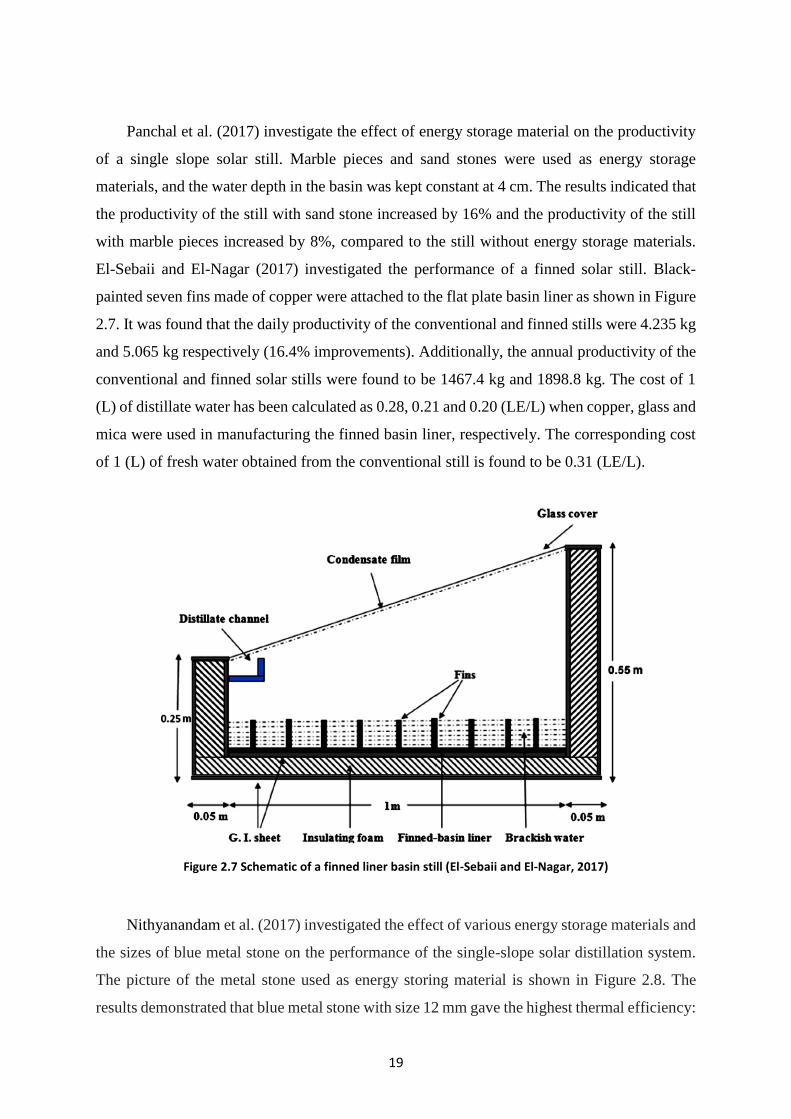
El-Sebaii and El-Nagar (2017) investigated the performance of a finned solar still. Black-
painted seven fins made of copper were attached to the flat plate basin liner as shown in Figure
2.7. It was found that the daily productivity of the conventional and finned stills were 4.235 kg
and 5.065 kg respectively (16.4% improvements). Additionally, the annual productivity of the
conventional and finned solar stills were found to be 1467.4 kg and 1898.8 kg. The cost of 1
(L) of distillate water has been calculated as 0.28, 0.21 and 0.20 (LE/L) when copper, glass and
mica were used in manufacturing the finned basin liner, respectively. The corresponding cost
of 1 (L) of fresh water obtained from the conventional still is found to be 0.31 (LE/L).
Figure 2.7 Schematic of a finned liner basin still (El-Sebaii and El-Nagar, 2017)
Nithyanandam et al. (2017) investigated the effect of various energy storage materials and
the sizes of blue metal stone on the performance of the single-slope solar distillation system.
The picture of the metal stone used as energy storing material is shown in Figure 2.8. The
results demonstrated that blue metal stone with size 12 mm gave the highest thermal efficiency:

20
34.9% compared to 29.84% for the solar still without blue metal stones, i.e. about 17%
improvement in the thermal efficiency.
Figure 2.8 blue metal stone in various size (6, 12, 20 mm) (Nithyanandam et al., 2017)
2.2.2 Phase Change Energy Storing Materials
Naim et al. (2002b) studied the improvement in the productivity of a solar still using phase
change energy storage material (PCM). The material used was a mixture of paraffin wax,
paraffin oil and water. It was found that the use of PCM material promoted the heat transfer
process and increased the still productivity noticeably by allowing distillation to take place at
night time. Shalaby et al. (2016) proposed a new design for a v-corrugated absorber solar still
with built-in phase change material (PCM) (see Figure 2.9). This design allowed for the
expansion of melting wax through a net of tubes extended inside the storage tank. The system
was tested with and without the PCM using different water masses. Adding a wick over the
corrugated plate using PCM is also investigated. Paraffin wax is chosen as a PCM due to its
medium storage, safety, reliability, uniform melting and moderate cost.
The experimental investigation showed that the solar still with the PCM beneath the
corrugated plate with less basin water mass achieves the best thermal performance among other
studied configurations. Using the PCM causes a little decrease in the daylight productivity with
a considerable increase in the still’s overnight productivity. The daily productivity of the still
with the PCM was 12% and 11.7% better than those for the v-corrugated still without the PCM
and with the PCM using wick, respectively. Cost analysis is also performed where the cost per
litre (CPL) for the still without PCM, with PCM and with PCM using a wick are estimated as
0.07182, 0.08369 and 0.09558 $/L, respectively

21
Figure 2.9 Solar still design with v-corrugated absorber integrated with phase change material (Shalaby et al., 2016)
Kabeel and Abdelgaeid (2016) investigated the improvement of the performance of a solar
still using a phase change material (PCM), which was paraffin wax. Two solar stills were
designed, constructed and tested; a solar still with PCM and a conventional solar still. The
experimental results indicated that the daily freshwater productivity for solar still with PCM is
higher than that of conventional solar still. The daily freshwater productivity approximately
reached 7.54 L/m2 a day for solar still with PCM, while its value is recorded 4.51 L/m2 day for
the conventional solar still. The results show that the daily freshwater productivity for solar
still with PCM is 67.18% higher than that of the conventional solar still. Also, the solar still
with PCM is superior in daily freshwater productivity (67%–68.8% improvement) compared
to a conventional solar still in the period from June to July 2015 under the ambient conditions
of Tanta city in Egypt. In this case study, the estimated cost of 1 L of distillate water reached
approximately 0.24 LE/L (0.03$/L) and 0.252 LE/L (0.032$/L) for solar still with PCM and
conventional solar still, respectively
Elfasakhany (2016) studied the effect of paraffin wax mixed with copper nano-particles
as energy storage material on the performance of a single slope solar still. They have tested
three cases. In case 1 a simple solar still without modification (base case) was tested. Case 2
had a solar still with paraffin wax as an energy storage material. In case 3, paraffin wax was

22
combined with copper nano-particles as energy storage materials. It was found that the paraffin
wax with copper nano-particles showed better energy storage performance compared to the
paraffin wax only. The total daily productivity has increased by 125% and 106% compared to
case 1 and case 2, respectively.
Sharsher et al. (2017) investigated experimentally the effect of graphite nanoparticles,
phase change material and film cooling on the performance of a single slope solar still. They
tested the following four modifications: modification A: flake graphite nano-particle (FGN)
mixed with water, modification B: flake graphite nano-particle (FGN) mixed with water and
encapsulated phase change material (paraffin wax), modification C: flake graphite nano-
particle (FGN) mixed with water and using film cooling on the glass cover (using water flowing
at low flow rate), modification D: flake graphite nano-particle (FGN) mixed with water and
encapsulated phase change material (paraffin wax) combined with film cooling on the glass
cover. Compared to the non-modified solar still, the results indicated that the productivity has
improved by 50.3% for modification (A), 65% for modification (B), 56.2% for modification
(C) and 73.8% for modification (D).
2.3 Effect of Basin Water Depth
The effect of brine depth on the productivity of a solar still has been studied widely in the
published literature by Srivastava and Agrawal (2013), Sathyamurthy et al. (2014),
Rajaseenivasan and Murugavel (2013a), Manokar et al. (2014) and Mamouri et al. (2014). They
agreed that as the water depth in the basin decreases, the productivity of the solar still increases.
In contrast, Taghvaeia et al. (2014) reported that the productivity of solar still improves by
increasing the water depth in the basin. They studied experimentally the effect of water depth
on the productivity of solar still. Khalifa and Hamood (2009) collected data from literature on
the effect of water depth on the productivity of solar still and used the least square method to
fit the data in the form given by Eq. (2.2) below.
(2.2)
where y is the still daily productivity in l/m2 and d is the basin water depth in cm. According to
this Equation, the solar still production is increased by reducing basin water depth. Also
Equation (2.2) indicates that the effect of water depth is insignificant for depths d > 40 cm.
Kandasamy et al. (2013) proposed correlations for the daily production y as a function of the
)(0458.0884.3 dey −=

23
water depth d and are expressed by Eq. (2.3) for single slope and Eq. (2.4) for double slope
solar stills, respectively.
(2.3)
(2.4)
Ahsan et al. (2014) have investigated experimentally the effect of water depth on the daily
water productivity and proposed the following correlation defined by Eq. (2.5). Error! R
eference source not found. 2.10 compares the daily water production predicted using Eqs.
(2.2) to (2.5). The figure indicates that there is agreement on the effect of water depth, where
the daily water productivity increases as the water depth decreases. Also, the figure shows that
some correlations predict small effect (Kandasamy et al. and Ahsan et al.), while some other
correlations (Sivakumar et al.) predict a strong effect.
(2.5)
Figure 2.10 Variation of daily production y against the water depth
2.4 Effect of Solar Still Cover
Different materials could be used for the solar still cover. Plastic transparent nylon sheets
are widely used in solar stills. Nylon sheets are cheaper in comparison to metal and glass sheets.
829.0,833.2 22.0 Rdy −=
869.0,885.5 2292.0 Rdy −=
dy 47.084.3 −=
0
1
2
3
4
5
6
7
0 20 40 60 80 100
Dai
ly p
rod
uct
ion
, y(l
/m²)
Water depth, d(cm)
Sivakumar et al.(single slope)
Kandasamy et al. (single slope)
Kandasamy et al. (double slope)
Ahsan et al. (single slope)

24
In Tiwari et al. (2009), the performance of solar still was studied by using glass, copper and
PVC sheets as still cover material. Figure 2.11 shows the daily yield for a solar still using the
three different cover materials (Glass, PVC and Copper).
Figure 2.11 Solar still daily yield (l) by using three different materials (Glass, PVC and Copper) for cover (Tiwari et al., 2009)
They have found that the performance of the solar still with a cover plate made of copper
was better than that made of glass and PVC, with PVC giving the lowest performance. The
high performance of copper was attributed to the high thermal conductivity of copper, which
results in higher overall top loss heat transfer coefficient.
Martin and Goswami (2005) studied the performance of a solar still with cover plate made
of copper, aluminium and steel. They found that the performance of the still with copper and
aluminium cover plates is much better than that of steel and it was attributed to the thermal
conductivity. Copper and aluminium have higher thermal conductivity in comparison with steel
(k=200Wm-1K-1 for aluminium, k=390 Wm-1K-1 for copper and k= 48 Wm-1K-1 for steel). In
terms of cost of materials, copper and aluminium are more expensive than steel; more than two
times the cost of galvanized steel (Manokar et al. 2014).
Apart from the cover material, the cover thickness is another parameter that can affect the
solar still productivity. Tiwari et al. (2009) studied the effect of glass cover thickness on solar
still daily yield for active and passive stills. They found that the daily yield is linearly related
to the thickness of the glass cover. Figure 2.12 shows the variation of daily yield against the

25
glass cover thickness in the range of 2mm to 6 mm. They concluded that the highest daily yield
was achieved for 2 mm glass cover thickness.
Figure 2.12 Variation of daily yield against thickness of glass cover for active still and passive still, (Tiwari et al., 2009)
2.5 Effect of Solar Still Cover Tilt Angle
The solar still cover tilt angle is another important factor which can affect the still
productivity as reported by Kamal (1988) and Aybar and Assefi (2009). It was revealed that
there is an optimum value for the tilt angle to achieve the best performance of solar stills. This
optimum value mainly depends on various parameters such as season, latitudes as and design
parameters. A wide range of optimum values was reported for tilt angles in experimental and
theoretical studies. The most reported tilt angle was 10o (Tiwari et al., 2003 and Velmurugan
and Srithar, 2007), and the second most reported tilt angle was 30o (Tiwari et al., 2003 and
Mathioulakis and Belessiotis, 2003). A low angle of 4o was reported in Porta et al. (1997) and
E1-Bahi and Inan (1999), and high angle value of 85o in Aybar and Assefi (2009). Other tilt
angles include 20o by Fatani et al (1994), Ghoneyem and Lleri (1997) and between 11o to 13.5o
by Kamal (1988), Farid and Hamad (1993) and Namprakai and Hirunlabh (2007). In some
studies, the tilt angle was equal to the test site latitude angle.
26
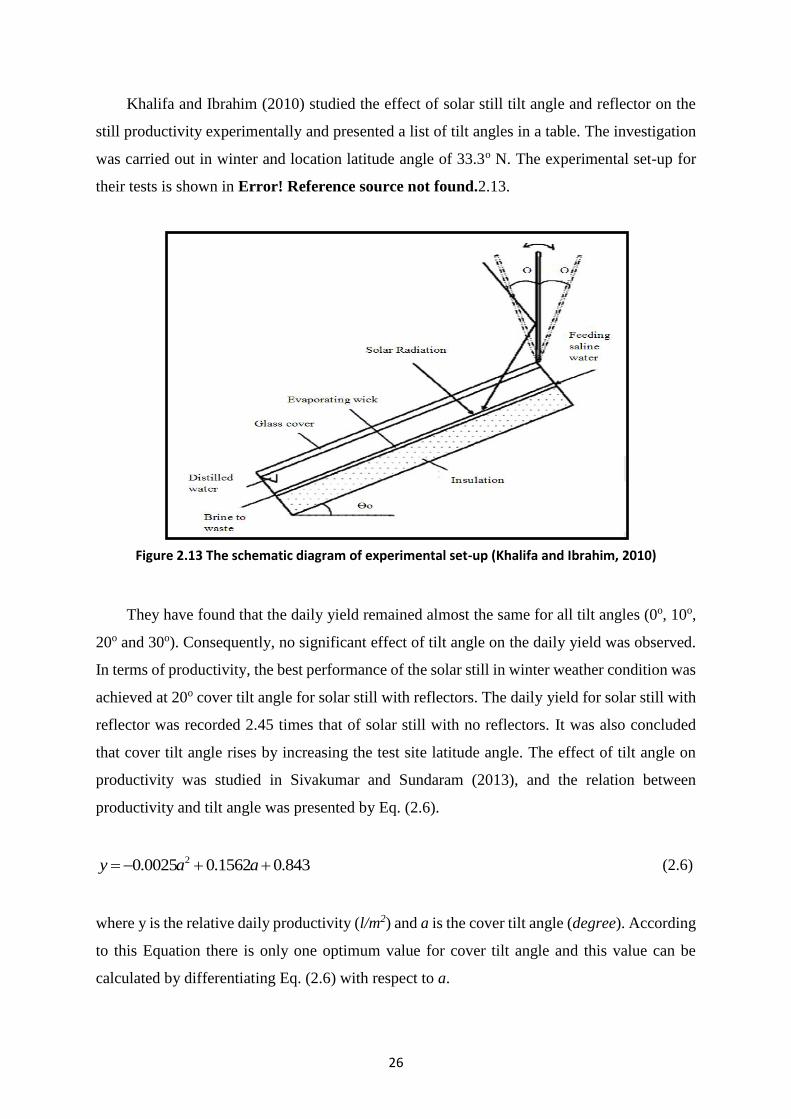
Khalifa and Ibrahim (2010) studied the effect of solar still tilt angle and reflector on the
still productivity experimentally and presented a list of tilt angles in a table. The investigation
was carried out in winter and location latitude angle of 33.3o N. The experimental set-up for
their tests is shown in Error! Reference source not found.2.13.
Figure 2.13 The schematic diagram of experimental set-up (Khalifa and Ibrahim, 2010)
They have found that the daily yield remained almost the same for all tilt angles (0o, 10o,
20o and 30o). Consequently, no significant effect of tilt angle on the daily yield was observed.
In terms of productivity, the best performance of the solar still in winter weather condition was
achieved at 20o cover tilt angle for solar still with reflectors. The daily yield for solar still with
reflector was recorded 2.45 times that of solar still with no reflectors. It was also concluded
that cover tilt angle rises by increasing the test site latitude angle. The effect of tilt angle on
productivity was studied in Sivakumar and Sundaram (2013), and the relation between
productivity and tilt angle was presented by Eq. (2.6).
(2.6)
where y is the relative daily productivity (l/m2) and a is the cover tilt angle (degree). According
to this Equation there is only one optimum value for cover tilt angle and this value can be
calculated by differentiating Eq. (2.6) with respect to a.
843.01562.00025.0 2 ++−= aay

27
(2.7)
By equating Eq. (2.7) to zero, the value of cover tilt angle which corresponds to maximum
value of productivity was calculated .
Otaibi and Al Jandal (2011) discussed the relation between solar still cover tilt angles and
the time of the year. They found that the optimum value of tilt angle depends on the time of the
year in Kuwait. Figure 2.14 shows the variation of the best tilt angle that corresponds to
absorbing the highest solar radiation and daily water productivity in each month.
Figure 2.14 Variation of solar still cover tilt angle in each month during a year (Al Otaibi and Al Jandal, 2011)
According to Figure 2.14, the optimum tilt angle during winter is much greater than that
in summer time. It is mainly because of variation of sun light angle in summer and winter.
2.6 Summary
The different parameters affecting the performance of solar stills are reviewed and
discussed in this chapter. These parameters included energy storing materials, water depth in
the basin, still cover plate material and tilt angle. The review indicated that a great deal of
research is still needed to increase the productivity of solar stills and thus transfer the process
from the laboratory scale into commercial applications. The focus of the present study is on
1562.0005.0 2 +−= ada
dy
oa 31

28
weather conditions in Kuwait, which have not been considered extensively by researchers.
Figures 2.15 to 2.22 indicate the variation of sun hours, average maximum and minimum
temperature in every month, water temperature, precipitation, number of rainy days, relative
humidity and wind speed during a year, respectively (weather and climate.com, 2015).
Figure 2.15 Sun hours in every month of a year
Figure 2.16 Variation of average maximum and minimum temperature (oC) in a year

29
Figure 2.17 Variation of sea water average temperature in a year
Figure 2.18 Variation of average precipitation (mm) in a year
Figure 2.19 Number of rainy days in every month of a year

30
Figure 2.20 Variation of average humidity in a month (%) of a year
Figure 2.21 variation of average monthly wind speed (m/s) during a year
The abundant sunny days in Kuwait constitute one of the main reasons why Kuwait has
recently built a 5 MW solar power plant. The main parameters that affect solar still productivity
are studied experimentally and analytically in the present study. The data were collected in
Kuwait for some time and a wide range of time slots were considered to capture any variation
in the measurement.

31
3. Chapter Three: Experimental Set-Up
3.1 Introduction
Based on the literature reviewed in chapter 2, there is a need to improve the thermal
performance of passive solar stills. Thus, the present study focuses on investigating
experimentally the effect of different parameters on the performance of a double slope passive
solar still. This chapter presents the description of the experimental and measurements system
used in the present study. Additionally, the experimental plan and methodology are also
presented.
3.2 Experimental System
The experimental set-up is installed at a personal workshop in Al Ahmadi, Kuwait
(latitude of 29.3667o N and longitude of 47.9667o E). Al Ahmadi is a city which has more than
250 sunny days in a year, and the daily solar insolation can reach more than 7 kWh/m2 (Al
Otaibi and Al Jandal, 2011). Hence, this city is one of the best locations that could be chosen
for solar energy experiments.
The experimental set-up consists of two parts; a) the double slop solar still cover and b)
the basin. Figure 3.1 shows the schematic drawing of the single basin double slope solar still
and Figure 3.2 shows a photograph for the investigated solar still. According to section 2.4,
different materials could be used for the solar still cover. Plastic nylon sheet, glass, copper,
aluminium and steel have been used in literature. Plastic transparent nylon sheets are widely
used in solar stills because of their low cost and availability even though their performance is
not as good as that of glass. In terms of the cost and performance of materials, it was decided
to use glass for cover instead of metals (copper, aluminium and steel) and transparent nylon
sheet. The basin was fabricated by using a galvanized steel sheet of 2 mm thickness. The
thickness of the steel sheet was selected so that the still can be durable and light. The basin was
1m long, 0.5 m wide and 0.5 m deep.

32
Figure 3.1 Schematic drawing for the experimental set-up with the locations of temperature measurements
Figure 3.2 Photograph showing the tested double slope passive solar still
The basin was painted black to improve the absorbability of solar energy. The supply pipe
was connected to the basin from the side wall, while a drain line was considered at the other
side wall of the basin. To control the water level inside the basin, a level sensor was inserted.
When the water level in the basin decreases below the required value, the level sensor sends an
0.5 m
0.5
m
300
Glass cover
Water level control sensor
Drain line
Supply/compensation
line
On/off
Pump
Ele
ctri
c s
ign
al
Tbasin Twater
Tvapour
Tglass
Tambient

33
electric signal to the water supply pump to make it run and compensate the evaporated amount
of water in the basin. K-type thermocouples were used to measure the basin temperature, the
water temperature, the vapour temperature, the glass cover temperature and the ambient
temperature (see Figure 3.1).
The basin was enclosed by a wooden box of 2 cm wall thickness so that there was a
clearance of 2.5 cm between the walls of the basin and the wooden box (see Figure 3.3a and
Figure 3.3b). This clearance was filled with PUF (poly Urethane foam) insulating material in
order to reduce the heat losses to the ambient. The thermal conductivity of the foam material
is 0.025 W/m2K. The wood sheets were attached to the insulation by an adhesive: flexible anti-
mould and waterproof silicone sealant. This kind of attachment results in uniform mechanical
and heat transfer properties on all basin area. A temperature selector switch was attached on
the side of outer basin to monitor the temperature at different parts of the still. The detailed
photographs of the different components of the still are summarized in appendix 3.
(a) (b)
Figure 3.3 (a) Photograph for the 2.5 cm insulation thickness and (b) composite wall cross sectional view
It was discussed in Tiwari et al. (2009) that the daily yield is proportional to the thickness
of the glass cover. It was reported that the daily water productivity decreases linearly as the
thickness of the glass cover increases. It was also found that the best performance of solar still
was achieved with a 2 mm thick glass. Since the 2 mm thick glass is not strong enough, a clear
glass sheet with 3 mm thickness was used to construct the double slope solar still cover used

34
in the present study. The angle of glass sheets with horizontal plane were considered 30o and
remained constant for all experiments. The selection of the tilt angle was based on the Kuwait
latitude, which is about 30o. The solar still cover was connected to the basin using flexible anti-
mould waterproof silicone sealant. This type of sealant is strong and can keep the parts together.
The experiments were carried out by placing the solar still in an open area, where the solar
radiation could hit the glass cover directly during the experiments.
3.3 Experimental Plan and Methodology
In the present study, two approaches were used to enhance the performance of solar stills;
namely, the use of energy storing materials and cooling the glass cover plate. The effect of
energy storing materials and glass cover temperature on the productivity of passive double
slope solar still were studied experimentally. The experiments were conducted first in a solar
still without any modifications, which was considered as a base case for comparison. The
following modifications were investigated:
1. Steel metal was used as the energy storing material. Three different shapes were tested.
The first shape was solid cylindrical rods cut in small pieces with each piece having
diameter 77.5 mm and length 50 mm. The second shape was hollow cylindrical rods cut
in small pieces with each piece having an inner diameter of 70 mm, 130 mm outer diameter
and 25 mm in length. The third shape has square cross-sectional area of 150 mm × 150
mm and 12 mm length. These dimensions were selected so that the mass is kept fixed at
about 2 kg. Figure 3.4 shows the dimensions of the solid and hollow steel rods.
(a)

35
(b)
(c)
Figure 3.4 The solid and hollow steel rods, a) top view, b) side view and c) the image of solid and hollow steel rods
2. The second modification includes the use of gravel of different sizes as energy storing
materials. Two sizes of gravel were used: 6.3 mm and 12.7 mm.
3. The third modification includes the use of copper tubes of 25.4 mm diameter and 120 mm
length filled with paraffin wax as energy storing material. The copper tubes were closed
at both ends.
4. The fourth modification includes cooling the glass cover using water flow to enhance the
condensation and thus the productivity of the solar still. Figure 3.5 shows the layout of the
water cooler on the solar still schematically.

36
Figure 3.5 The layout of the water cooler
In terms of accuracy of measurements, the experiments were carried out in three
consecutive days in order to minimize the effects of variation in weather conditions. The
measurements were carried out three times, and the average values were used in the
calculations. During the three consecutive days, the solar still’s location in the test site
remained constant and it was covered during the night to protect the glass surfaces from dust.
The solar still was cleaned at start of each day to make sure that the condition of the solar still
was identical during the measurement period. Therefore, it can be assumed that the design
parameters were kept constant during the measurement.

37
4. Chapter Four: Experimental Results and Discussions
4.1 Introduction
In this chapter the experimental results of the effect of energy storing materials on the
productivity of solar still were studied experimentally. According to chapter 2, the performance
of solar still can be affected by weather conditions (temperature, wind speed, relative humidity
and solar radiation intensity) and design parameters. In the present study, the ambient
temperature was measured on an hourly basis. The variation of the ambient temperature was
studied in three consecutive days. It was found that the variation of the ambient temperature
during these three consecutive days was less than 5% (see Figure 4.1). According to this Figure,
the high ambient temperature was recorded between hours 12 to 16 for the three consecutive
days.
Figure 4.1 Variation of the ambient temperature during three consecutive days at different time of the day at the test site in Kuwait
The results in Figure 4.1 indicate that the variation of the ambient temperature during the
three consecutive days is not significant and hence the effect of the temperature variation could
be considered negligible. Similar measurements were carried out for the temperature of the
basin, water, vapour and glass inner side and a similar conclusion was obtained, i.e. the
variation of the temperatures over the three consecutive days was not significant.
20
25
30
35
40
45
50
5 7 9 11 13 15 17 19 21
Tem
pe
ratu
re (
C)
Time (hr)
Day1
Day2
Day3

38
As presented in chapter 2 in Figs. 2.20 and 2.21, the variations of wind speed and relative
humidity in the test site during the measurements period (9:00 to 19:00) were considered
negligible at this time of the year. Solar radiation is another main factor which can affect the
solar still productivity significantly. The solar radiation was measured in the present study on
hourly basis using digital instrument SOLAR SURVEY 100 and the results are presented in
Figure 4.2. The instrument gives the incident solar radiation in W/m2. The maximum value was
recorded at hour 13. The measurements of the solar radiation in several days indicated that the
maximum deviation from the mean value was less than 9.5%. In other words, the variation in
solar radiation during the time of conducting the experiments could be negligible. This agrees
with the conclusion given by Taghvaei et al. (2014) who also measured the solar radiation and
reported variations of about 11%. It can be concluded that the variation of weather condition
during the test measurements are negligible in the present study.
Figure 4.2 The hourly measured intensity of solar radiation
This chapter presents the experimental results and discussion for the examined
experimental parameters. In what follows, the solar still with no modification is termed
conventional solar still, which was used as a bench mark for comparison with the solar still
with modification. In this study, “no modification” means no energy storing material or no
external cooling for the glass cover plate.

39
The chapter is organised as follows. In section 4.2, the effect of the shape of metallic
energy storing material is presented. Section 4.3 presents the effect of water depth. Section 4.4
presents the effect of water cooling on the glass cover. Section 4.5 presents the effect of gravel
as an energy storing material and its size. Section 4.6 presents the effect of using phase change
material as an energy storing material. Finally, section 4.7 gives concluding remarks.
4.2 The Effect of the Shape of Metallic Energy Storing Materials
Three geometrical shapes of steel pieces were used as energy storing material. The three
shapes are depicted schematically in Figure 4.3 and they are as follows: solid round rod, hollow
round rod and solid square rod. Although the shapes were different, the total mass of the energy
storing materials was kept fixed. The solar still was tested with no modifications as a base case
for comparison, i.e. a conventional solar still. The design parameters in terms of cleanliness,
location of the still and experimental set-up were kept unchanged during the measurements and
it is assumed that the variation of weather conditions is not significant during experiments. At
this stage the basin water depth was kept fixed at 10 cm and the water level was controlled by
the height sensor. Figure 4.4 shows the distribution of temperature in the conventional solar
still. According to this figure, the maximum temperatures for basin, water in the basin, vapour,
ambient and glass inner side do not appear at the same time, but they occur about hour 12:00 –
16:00. Moreover, the highest temperature was recorded for vapour inside the still as high as 60
oC. The temperature of water in the basin was slightly higher than the basin temperature; up to
12:00 and the difference became more pronounced after 12:00. Figures 4.5 - 4.6 demonstrate
the measured temperature versus time of the day for the solar still with solid round rods, hollow
round rods and solid square rods. These figures demonstrate that the measured temperature
distribution in the modified solar stills exhibited similar behaviour to that found in the
conventional solar still. The vapour temperature showed some variation between hours 8:00
and 16:00. The variation in the vapour temperature can be attributed to the variation in basin
temperature which affects the natural air circulation currents inside the solar still. As result, a
temperature gradient was formed inside the solar still. Also, it is observed that the vapour
temperature is the highest.

40
Top view
Side view
a. Solar still with solid round rods sitting on the bottom side of the basin
Top view
Side view
b. Solar still with hollow round rods sitting on the bottom side of the basin
Top view
Side view
c. Solar still with solid square rods sitting on the bottom side of the basin
Figure 4.3 The configurations and shape of the tested steel energy storing material

41
Figure 4.4 Temperature distributions inside the conventional solar still (without modifications)
Figure 4.5 Temperature distributions inside the solar still with solid round rods
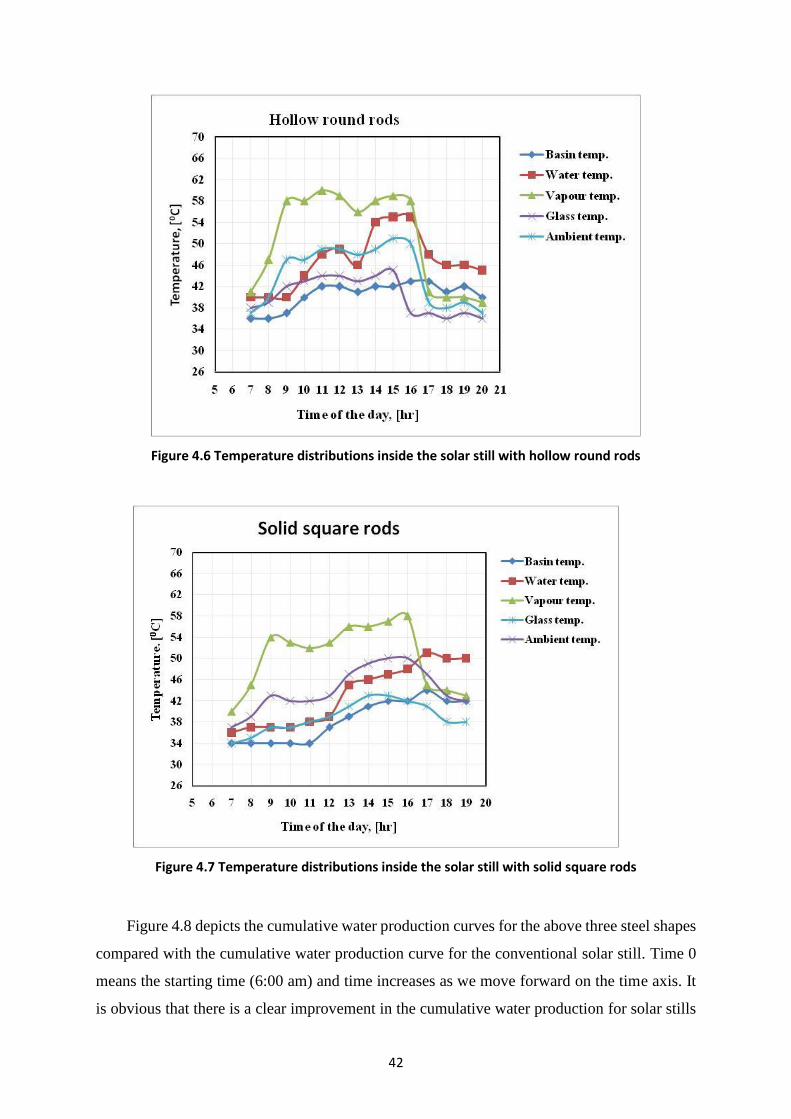
42
Figure 4.6 Temperature distributions inside the solar still with hollow round rods
Figure 4.7 Temperature distributions inside the solar still with solid square rods
Figure 4.8 depicts the cumulative water production curves for the above three steel shapes
compared with the cumulative water production curve for the conventional solar still. Time 0
means the starting time (6:00 am) and time increases as we move forward on the time axis. It
is obvious that there is a clear improvement in the cumulative water production for solar stills
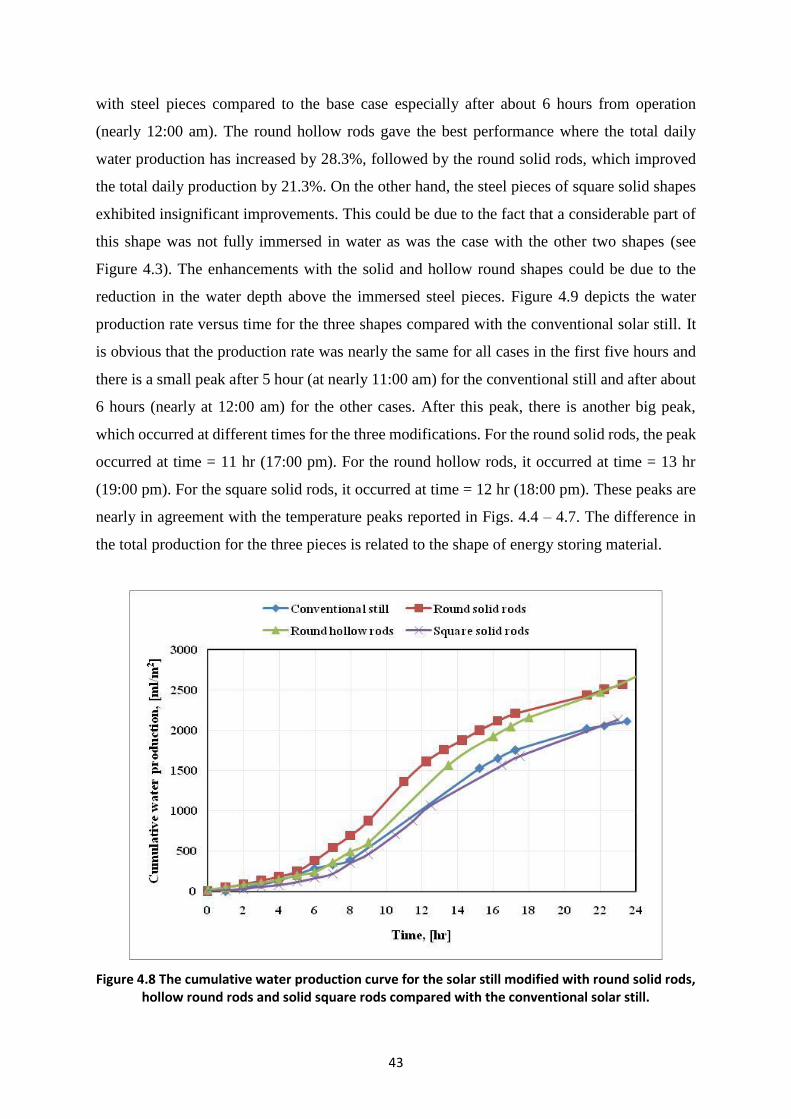
43
with steel pieces compared to the base case especially after about 6 hours from operation
(nearly 12:00 am). The round hollow rods gave the best performance where the total daily
water production has increased by 28.3%, followed by the round solid rods, which improved
the total daily production by 21.3%. On the other hand, the steel pieces of square solid shapes
exhibited insignificant improvements. This could be due to the fact that a considerable part of
this shape was not fully immersed in water as was the case with the other two shapes (see
Figure 4.3). The enhancements with the solid and hollow round shapes could be due to the
reduction in the water depth above the immersed steel pieces. Figure 4.9 depicts the water
production rate versus time for the three shapes compared with the conventional solar still. It
is obvious that the production rate was nearly the same for all cases in the first five hours and
there is a small peak after 5 hour (at nearly 11:00 am) for the conventional still and after about
6 hours (nearly at 12:00 am) for the other cases. After this peak, there is another big peak,
which occurred at different times for the three modifications. For the round solid rods, the peak
occurred at time = 11 hr (17:00 pm). For the round hollow rods, it occurred at time = 13 hr
(19:00 pm). For the square solid rods, it occurred at time = 12 hr (18:00 pm). These peaks are
nearly in agreement with the temperature peaks reported in Figs. 4.4 – 4.7. The difference in
the total production for the three pieces is related to the shape of energy storing material.
Figure 4.8 The cumulative water production curve for the solar still modified with round solid rods, hollow round rods and solid square rods compared with the conventional solar still.

44
Figure 4.9 The rate of water production for the solar still modified with round solid rods, hollow round rods and solid square rods compared with the conventional solar still.
4.3 Solar Still with Hollow and Solid Steel Pieces
In this section, the solar still was tested using a combination of hollow and solid section
steel rods together at the same time. Figure 4.10 presents the temperature distribution in the
still. The figure indicates that the highest and lowest temperatures were recorded for water in
the basin and the ambient respectively. The peak temperature occurs at the maximum ambient
temperature with some delay. Figures 4.11 and 4.12 present the variation of the rate of water
production and the cumulative production with time respectively. In comparison with the
conventional solar still with no modifications, no significant changes were observed in the total
water production. However, the peak value of production rate for the modified solar still was
10% lower, which occurs when the basin reaches its maximum temperature. The peak value of
the basin, water, glass and vapour temperature occurs when the ambient temperature reaches
close to its maximum value. Also, it was observed that the delay in water production at the
beginning was longer.

45
Figure 4.10 The temperature distribution inside a solar still modified with a combination of solid and hollow round steel rods
Figure 4.11 The rate of water production for a solar still modified with a combination of solid and hollow round steel rods compared with the conventional solar still
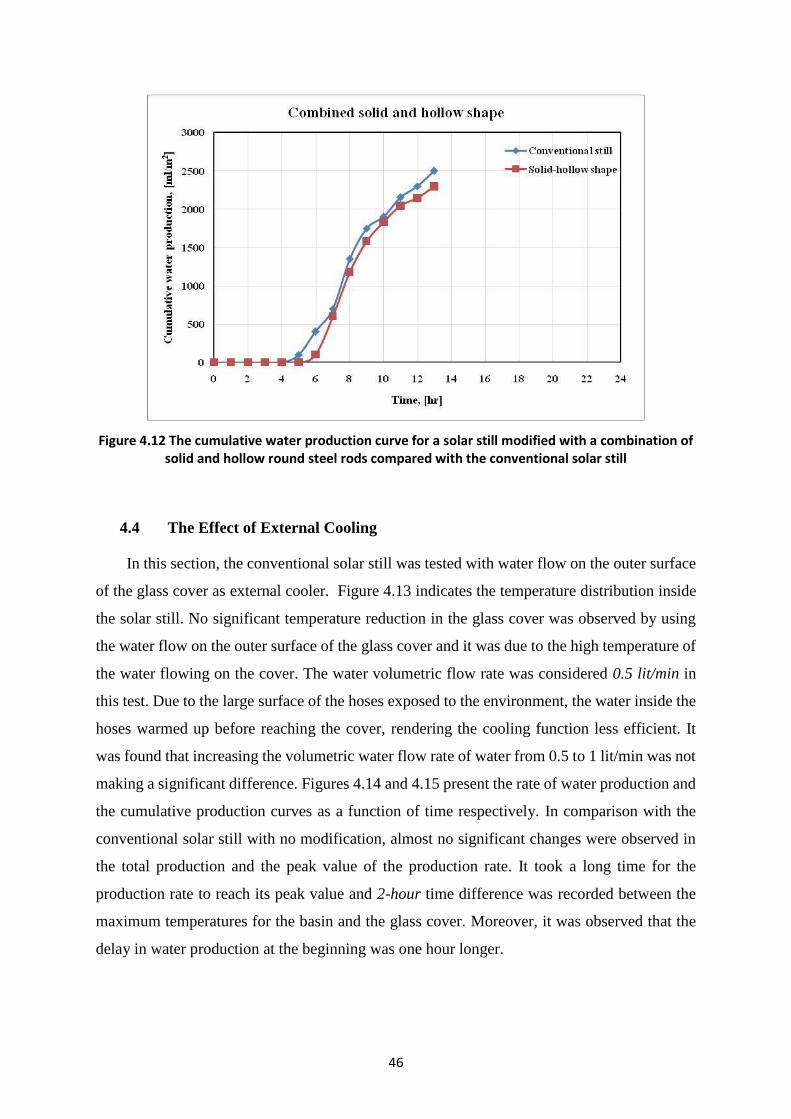
46
Figure 4.12 The cumulative water production curve for a solar still modified with a combination of solid and hollow round steel rods compared with the conventional solar still
4.4 The Effect of External Cooling
In this section, the conventional solar still was tested with water flow on the outer surface
of the glass cover as external cooler. Figure 4.13 indicates the temperature distribution inside
the solar still. No significant temperature reduction in the glass cover was observed by using
the water flow on the outer surface of the glass cover and it was due to the high temperature of
the water flowing on the cover. The water volumetric flow rate was considered 0.5 lit/min in
this test. Due to the large surface of the hoses exposed to the environment, the water inside the
hoses warmed up before reaching the cover, rendering the cooling function less efficient. It
was found that increasing the volumetric water flow rate of water from 0.5 to 1 lit/min was not
making a significant difference. Figures 4.14 and 4.15 present the rate of water production and
the cumulative production curves as a function of time respectively. In comparison with the
conventional solar still with no modification, almost no significant changes were observed in
the total production and the peak value of the production rate. It took a long time for the
production rate to reach its peak value and 2-hour time difference was recorded between the
maximum temperatures for the basin and the glass cover. Moreover, it was observed that the
delay in water production at the beginning was one hour longer.

47
Figure 4.13 The temperature distribution inside a solar still modified with an external cooling on the outer surface of glass cover plate
Figure 4.14 The rate of water production for a solar still modified with an external cooling on the outer surface of glass cover plate

48
Figure 4.15 The cumulative water production curve for a solar still modified with an external cooling on the outer surface of glass cover plate
4.5 The Effect of a Combination of External Cooling and Solid Steel Rods
In this section, the solar still was modified by a combination of external water cooling and
solid steel rods. The temperature distribution in the solar still was recorded and the results are
depicted Figure 4.16. According to this figure, the peak values of the basin temperature, the
water temperature, the vapour temperature and the glass temperature occur at the maximum
ambient temperature with some delay. The highest and lowest temperatures were recorded for
the water and ambient temperature, respectively. Figure 4.17 and 4.18 present the rate of water
production and the cumulative water production versus time respectively. The figures
demonstrate that there was a reduction in the total water production and the production rate. In
comparison with the conventional solar still with no modifications, the total water production
showed 17% reduction. The maximum production rate was also reduced by 17%.

49
Figure 4.16 The temperature distribution inside a solar still modified with a combination of external cooling and solid rods
Figure 4.17 The rate of water production for a solar still modified with a combination of external cooling and solid steel rods

50
Figure 4.18 The cumulative water production curve for a solar still modified with a combination of external cooling and solid steel rods
4.6 The Effect of Water Depth
The effect of the basin water depth on the total water production has been investigated
extensively in the literature. Some researchers proposed correlations for the prediction of the
total water production in terms of the basin water depth. However, these correlations may not
be general; they depend on the region in which the experiments were conducted, and they need
to be checked. In the present study, the water depth in a conventional solar still was varied from
5 cm to 25cm in 5 cm intervals. Figure 4.19 presents the variation of the total production in
terms of basin water depth. The figure demonstrates that the maximum daily production
depends on the water depth and it increases as the water depth decreases. The effect of water
depth can be explained as follows: as the water depth decreases the volumetric heat capacity
of the water in the basin decreases and thus the water temperature increases rapidly. The
increase in water temperature can increase the rate of water evaporation in the basin. Thus, the
production rate is expected to increase as the water depth decreases.
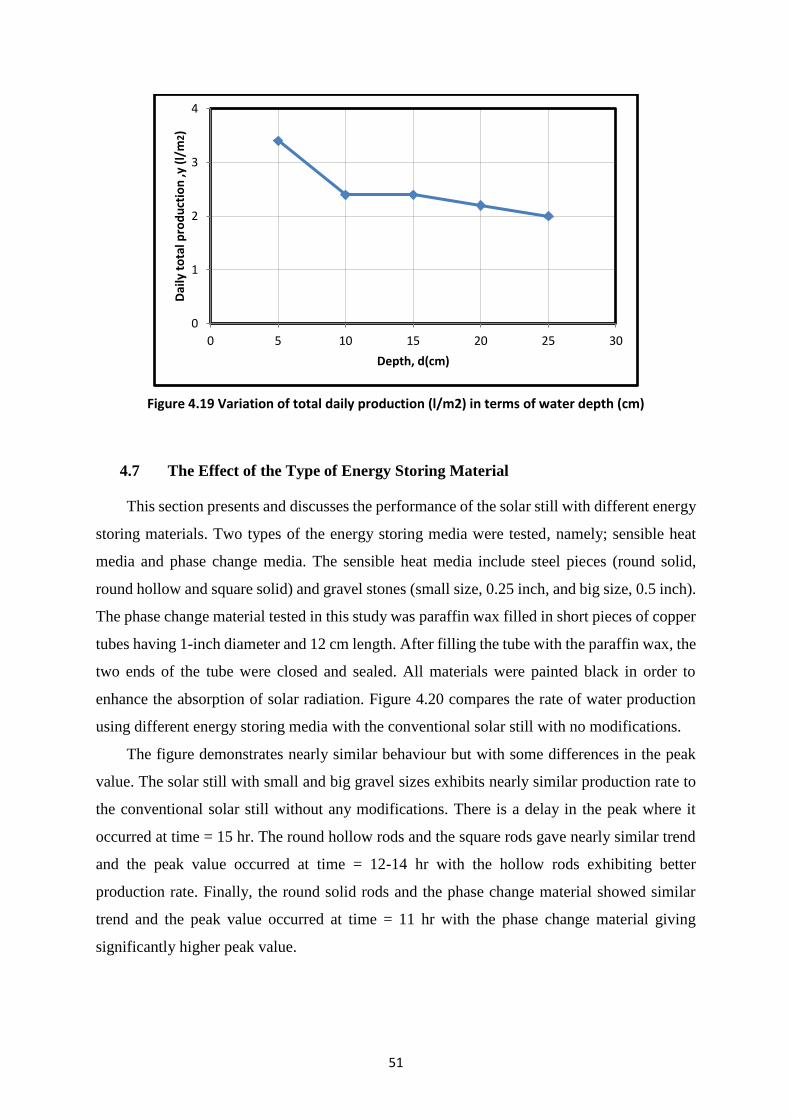
51
Figure 4.19 Variation of total daily production (l/m2) in terms of water depth (cm)
4.7 The Effect of the Type of Energy Storing Material
This section presents and discusses the performance of the solar still with different energy
storing materials. Two types of the energy storing media were tested, namely; sensible heat
media and phase change media. The sensible heat media include steel pieces (round solid,
round hollow and square solid) and gravel stones (small size, 0.25 inch, and big size, 0.5 inch).
The phase change material tested in this study was paraffin wax filled in short pieces of copper
tubes having 1-inch diameter and 12 cm length. After filling the tube with the paraffin wax, the
two ends of the tube were closed and sealed. All materials were painted black in order to
enhance the absorption of solar radiation. Figure 4.20 compares the rate of water production
using different energy storing media with the conventional solar still with no modifications.
The figure demonstrates nearly similar behaviour but with some differences in the peak
value. The solar still with small and big gravel sizes exhibits nearly similar production rate to
the conventional solar still without any modifications. There is a delay in the peak where it
occurred at time = 15 hr. The round hollow rods and the square rods gave nearly similar trend
and the peak value occurred at time = 12-14 hr with the hollow rods exhibiting better
production rate. Finally, the round solid rods and the phase change material showed similar
trend and the peak value occurred at time = 11 hr with the phase change material giving
significantly higher peak value.
0
1
2
3
4
0 5 10 15 20 25 30
Dai
ly t
ota
l pro
du
ctio
n ,y
(l/
m2)
Depth, d(cm)
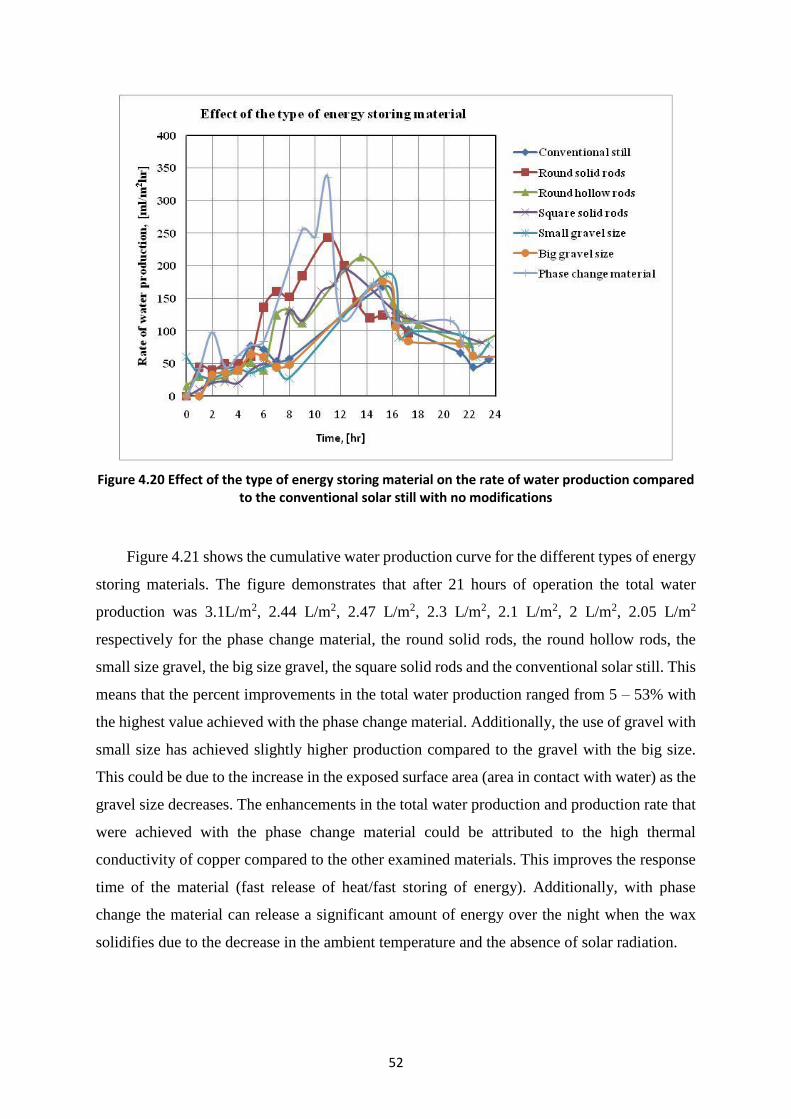
52
Figure 4.20 Effect of the type of energy storing material on the rate of water production compared to the conventional solar still with no modifications
Figure 4.21 shows the cumulative water production curve for the different types of energy
storing materials. The figure demonstrates that after 21 hours of operation the total water
production was 3.1L/m2, 2.44 L/m2, 2.47 L/m2, 2.3 L/m2, 2.1 L/m2, 2 L/m2, 2.05 L/m2
respectively for the phase change material, the round solid rods, the round hollow rods, the
small size gravel, the big size gravel, the square solid rods and the conventional solar still. This
means that the percent improvements in the total water production ranged from 5 – 53% with
the highest value achieved with the phase change material. Additionally, the use of gravel with
small size has achieved slightly higher production compared to the gravel with the big size.
This could be due to the increase in the exposed surface area (area in contact with water) as the
gravel size decreases. The enhancements in the total water production and production rate that
were achieved with the phase change material could be attributed to the high thermal
conductivity of copper compared to the other examined materials. This improves the response
time of the material (fast release of heat/fast storing of energy). Additionally, with phase
change the material can release a significant amount of energy over the night when the wax
solidifies due to the decrease in the ambient temperature and the absence of solar radiation.

53
Figure 4.21 Effect of the type of energy storing material on the cumulative water production curve compared to the conventional solar still with no modifications.
4.8 Summary
This chapter presents the effects of several parameters on the thermal performance and
total water production of a double slope basin-type solar still. The investigated parameters
include the following: (1) the geometrical shape of steel pieces that were used as energy storing
material, (2) the external cooling on the outer glass surface, (3) the combination of external
cooling and steel pieces, (4) the water depth and (5) the type of the energy storing material. It
was found that all the investigated parameters can affect the performance of solar stills. The
results have indicated the following conclusions:
(1) the round hollow steel pieces were the best among the investigated shapes.
(2) The external cooling of the glass cover plate is not very effective.
(3) The total water production increases significantly as the water depth decreases.
(4) Using gravel as energy storing material can improve the productivity of a solar still,
which is slightly lower than the productivity of solar stills with metallic energy storing
materials. If the cost is considered, gravel can be a good option and gravel with smaller size is
more favourable.

54
(5) Phase change materials can increase the production rate and the total daily water
production significantly compared to the other materials. It achieved about 53% improvements
in the total production.
It was also observed that water production starts when the temperature difference between
the basin and the glass cover plate reaches about 7oC. The production delay occurs because it
needs some time to build up the temperature difference between the basin and the cover, which
also depends on the heat capacity of the energy storing material used. The round solid rods can
absorb considerable amount of heat due to their mass; hence the temperature difference
between the basin and the cover can take longer to reach 7oC. It was observed that the
production delay was one hour longer for solar still with solid section rods. In comparison with
solid section rods, the hollow section rods had no impacts on the production delay when solar
still was used with hollow section rods only. It was concluded that the temperature difference
between the basin and the cover is an important factor in terms of water production delay.

55
5. Chapter Five: Empirical and Theoretical Study of Solar Still
Productivity
5.1 Introduction
Access to experimental equipment is not always available for the designers, and in many
cases the experiments are sophisticated, and the cost is very high. Therefore, using empirical
correlations and analytically derived formulas are strong tools for the design of any thermal
system. This chapter presents an empirical and theoretical study for the total water production
of the solar still. The effect of water depth and an example on the energy storing materials were
investigated.
5.2 Empirical Study of Total Production (Y)
Using empirical techniques not only saves time and costs but it also helps to better
understand the process and the relation between the main parameters. For example, as
presented in chapter 2, Kandasamy et al. (2013) proposed two correlations for the prediction
of the total water production (y) as a function of water depth (d) for a single slope (Eq. 2.3) and
double slope (Eq. 2.4) solar stills.
In the present study, five different values of water depth were investigated; see Table 5.1
for the depths and the corresponding total daily production. These values are plotted in Figure
5.1 and the best fit equation obtained using MS Excel is shown on the figure with the R2 value.
The data of the present study are correlated in the form given by Eq. 5.1 below. This equation
is nearly similar to Eq. 2.4 given by Kandasamy et al. (2003) except that the constant in the
front of the correlation is slightly smaller. In other words, the correlation of Kandasamy et al.
(2003) predicts values which are 13% higher than the values predicted using Eq. 5.1 given in
the present study.
3.0308.5 −= dy (5.1)
Depth, d(cm) 5 10 15 20 25
Total daily production,
y(L/m2) 3.4 2.4 2.4 2.2 2
Table 5.1 Measured total production in terms of water depth

56
Figure 5.1 The daily water production as a function of water depth inside the basin
5.3 The Effect of Ambient Temperature
The effect of the ambient temperature (Tav) on the daily production and production rate is
investigated in this section. Figure 5.2 shows the variation of temperatures of basin, basin
water, vapour, ambient and cover in August in Kuwait on the test site. The test was carried out
for a solar still with no modifications. It was observed that the maximum basin temperature,
cover and basin water temperatures occurred at about 1 pm when the ambient temperature was
at maximum value. The maximum ambient temperature also corresponds to maximum solar
radiation time. The highest recorded temperature for vapour was 67oC which occurred at about
1 pm. The highest recorded cover temperature was 59-60 oC between 1pm and 3pm. The basin
temperature and basin water temperature were found almost the same throughout the
experimental period. The daily water production as a function of the ambient average
temperature is presented in Table 5.2.

57
Figure 5.2 Variation of basin temperature (T1), basin water temperature (T2), vapour temperature (T3), ambient temperature (T4) and cover temperature (T5) in August in Kuwait
Daily ambient average temperature, [0C] 33.71 34.51 34.8 36.11 38.15
Daily water production, [ml/m2] 1900 1750 1800 2300 3200
Table 5.2 Daily ambient temperature against daily water production
Figure 5.3 shows the results summarized in Table 5.2 and the best fit equation was
obtained using Excel software. According to this figure, the daily water production increases
as the ambient temperature increases. Equation 5.2 indicates the linear correlation for the daily
water production in terms of the ambient average temperature.
(5.2)
where y is the daily water production and Tav is the ambient average temperature. This equation
shows a strong relation between the daily water production and the ambient average
temperature. When the maximum water production rate (Table 5.3) was plotted versus the
ambient temperature, a similar trend was obtained, and the best fit equation is given by Eq. 5.3
below.
0
10
20
30
40
50
60
70
80
6 7 8 9 10 11 12 13 14 15 16 17 18 19
Tem
pe
ratu
re (
oC
)
Time of the day (hour)
T1 T2 T3 T4 T5
3.948632.329 −= avTy
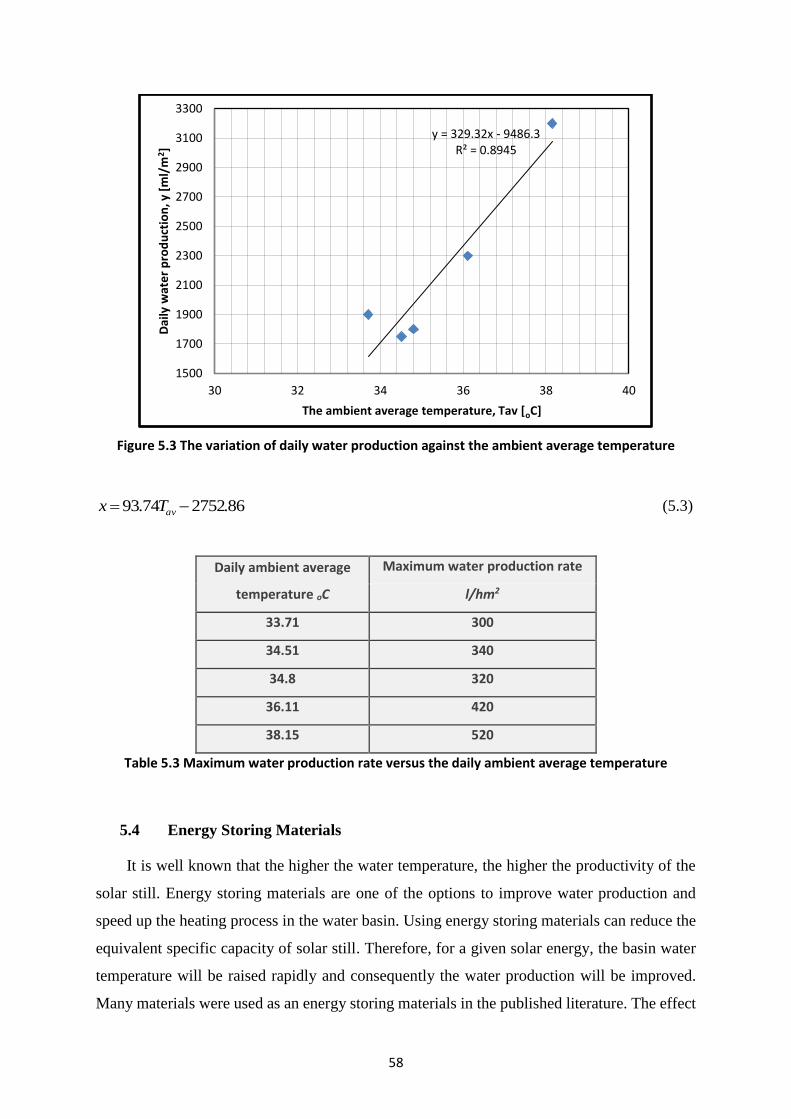
58
Figure 5.3 The variation of daily water production against the ambient average temperature
(5.3)
Daily ambient average
temperature oC
Maximum water production rate
l/hm2
33.71 300
34.51 340
34.8 320
36.11 420
38.15 520
Table 5.3 Maximum water production rate versus the daily ambient average temperature
5.4 Energy Storing Materials
It is well known that the higher the water temperature, the higher the productivity of the
solar still. Energy storing materials are one of the options to improve water production and
speed up the heating process in the water basin. Using energy storing materials can reduce the
equivalent specific capacity of solar still. Therefore, for a given solar energy, the basin water
temperature will be raised rapidly and consequently the water production will be improved.
Many materials were used as an energy storing materials in the published literature. The effect
y = 329.32x - 9486.3R² = 0.8945
1500
1700
1900
2100
2300
2500
2700
2900
3100
3300
30 32 34 36 38 40
Dai
ly w
ate
r p
rod
uct
ion
, y [
ml/
m2 ]
The ambient average temperature, Tav [oC]
86.275274.93 −= avTx
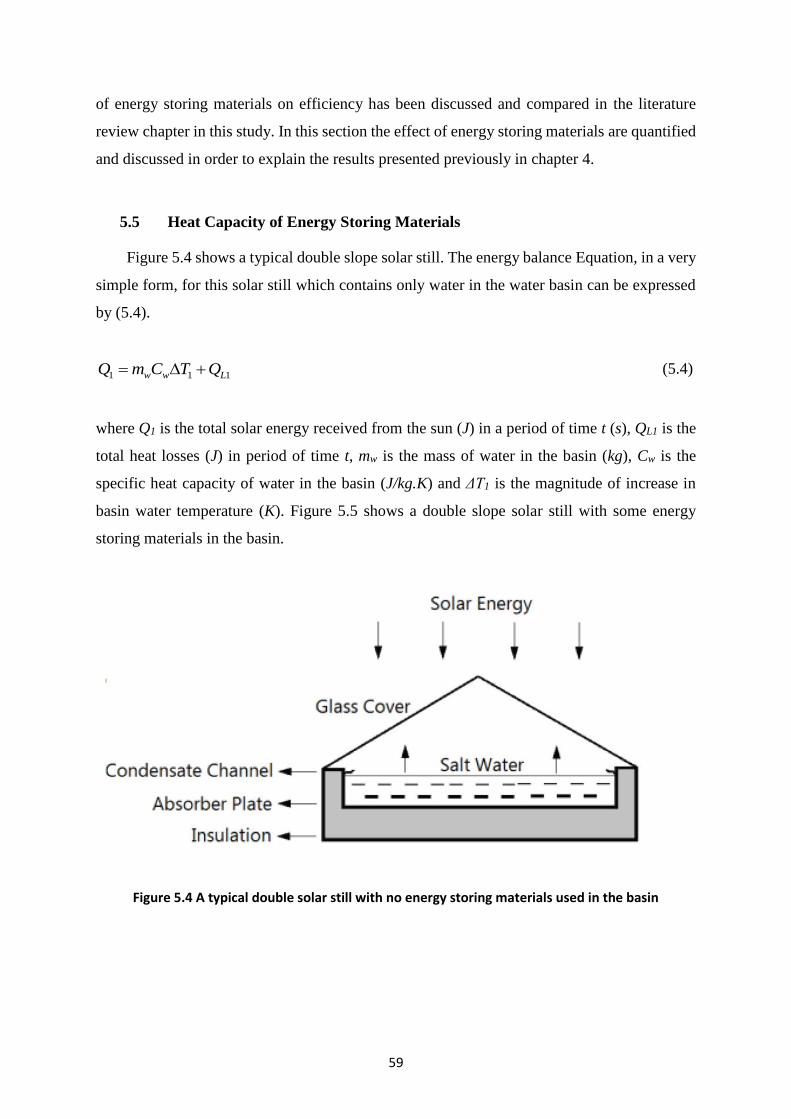
59
of energy storing materials on efficiency has been discussed and compared in the literature
review chapter in this study. In this section the effect of energy storing materials are quantified
and discussed in order to explain the results presented previously in chapter 4.
5.5 Heat Capacity of Energy Storing Materials
Figure 5.4 shows a typical double slope solar still. The energy balance Equation, in a very
simple form, for this solar still which contains only water in the water basin can be expressed
by (5.4).
111 Lww QTCmQ += (5.4)
where Q1 is the total solar energy received from the sun (J) in a period of time t (s), QL1 is the
total heat losses (J) in period of time t, mw is the mass of water in the basin (kg), Cw is the
specific heat capacity of water in the basin (J/kg.K) and ΔT1 is the magnitude of increase in
basin water temperature (K). Figure 5.5 shows a double slope solar still with some energy
storing materials in the basin.
Figure 5.4 A typical double solar still with no energy storing materials used in the basin

60
Figure 5.5 Double solar still with energy storing materials used in the basin
The energy balance equation for the double slope solar still with energy storing materials
can be expressed in form of Eq. 5.5.
2222 )( Lsswsw QTCmTCmmQ ++−= (5.5)
where Q2 is the total solar energy received from sun in period of time t when the solar still was
used by energy storing materials as in Figure 5.5. Similarly ms is the mass of energy storing
materials, ΔT2 is the magnitude of increase of basin water temperature, Cs is the specific heat
capacity of energy storing material and QL2 is the total heat loss from the solar still to
environment in the period of time t. the value of mw-ms presents the mass of basin water when
solar still is in use with energy storing material. Since the tests were carried out on consecutive
days, it can be assumed that the amount of solar energy on two consecutive days is almost the
same.
21 QQ =
(5.6)
The effect of temperature differences ΔT1 and ΔT2 on heat loss is not significant and
therefore it is a good assumption to consider the heat losses in two consecutive days are equal.
Energy storing
materials

61
21 LL QQ = (5.7)
By equating the Eq. (5.4) and (5.5) and removing QL1 and QL2 from both sides of the
equations and with further simplifications Eq. 5.8 below can be obtained. The derivation
calculation of Eq. 5.8 can be found in appendix 2.
vCm
CC
T
T
ww
wwss )(12
1 −+=
(5.8)
where ρs is the density of energy storing materials (kg/m3), ρw is the density of water (kg/m3)
and V is the volume of water replaced with energy storing material (m3). The left-hand side of
Eq. 5.8 expresses the temperature difference ratio which is a positive value but smaller than 1.
The only condition to have the temperature difference ratio less than 1 satisfying Eq. 5.8 is:
0)( −
vCm
CC
ww
wwss (5.9)
Further simplification to Eq. 5.9 results in Eq. 5.10 below.
wwss CC (5.10)
Equation 5.10 expresses the condition required for improving the performance of energy
storing materials. It is concluded that the only parameters which can affect the performance of
energy storing materials are density and specific heat capacity of energy storing materials.
5.5.1 Energy Storing Factor (β)
A new dimensionless parameter called Energy storing factor (β) can be defined using Eq.
5.11 below.
ww
ss
C
C
= (5.11)

62
According to the above equation, for values of β smaller than 1, the energy storing material
can cause an increase in temperature in comparison with the solar still without modification.
For values of β greater than 1, the material will not be effective for energy storing. The value
of β can be used to compare the performance of different energy storing materials in terms of
their effect on the temperature difference (ΔT2).
Equation 5.8 mentioned above expresses the relation between ΔT1 and ΔT2 in terms of ρ
and C for energy storing material and basin water and also V and can be rearranged as:
21 })(1{ TVCm
CCT
ww
wwss −
+=
(5.12)
The value of vCm
CC
ww
wwss )(1 −
+ in the above equation constant for a given solar still and
therefore it can be expressed as:
21 . TkT = (5.13)
where k is a constant that depends on the properties of the energy storing material, basin water
and the volume of basin water in the solar still. Figure 5.6 shows the variation of ΔT1 against
ΔT2 for Steel, Copper, Aluminium, stone and glass.
Figure 5.6 Water temperature rise for a modified solar still using energy storing materials versus water temperature rise for a solar still without modifications
0
5
10
15
20
25
0 2 4 6 8 10 12
ΔT
2,
K
ΔT1, K
steel
cupper
Aluminum
stone
glass

63
According to Figure 5.6, steel, copper, aluminium, stone and glass can increase the basin
water temperature in comparison with the basin water temperature in solar still without
modifications. Consequently, the water production can be improved by using those materials
as energy storing materials. Figure 5.7 shows the values of β for steel, copper, aluminium, stone
and glass, which were used as an energy storing material in many studies. According to this
figure, materials with the same value of energy storing factor have similar performance when
they are used as an energy storing material. Table 5.4 expresses the values of ρ and C for steel,
copper, aluminium, stone, glass and water. The results of Figure 5.7 are in a good agreement
with the literature. As the value of β decreases, the performance of the energy storing material
in the solar still improves.
Figure 5.7 Variation of Energy storing factor, β for steel, copper, aluminium, stone and glass
Material
Density
ρ (kg/m3)
Specific heat
capacity
C (J/kg.K)
steel 7700 450
copper 8940 385
Aluminium 2712 900
stone 2550 840
glass 2600 840
water 1000 4200
Table 5.4 Density and specific heat capacity values
0
0.1
0.2
0.3
0.4
0.5
0.6
0.7
0.8
0.9
steel cupper Aluminum stone glass
Ene
rgy
sto
rin
g fa
cto
r, β
Energy storing material

64
5.5.2 The Effect of The Shape of Energy Storing Materials
According to the experimental and analytical results in this study, the density and specific
heat capacity of energy storing materials are the two main factors which affect the value of
Energy storing factor β. It was also found that the value of β is proportional to the performance
of energy storing materials. Two different shapes of steel with the same mass were included in
the discussion given in this section. This could be due to the heat transfer performance for two
different shapes. The performance of the two round shape samples in this study can be
expressed by Eq. 5.14.
111 ThAQ = (5.14)
where Q1 is the rate of heat transfer which exposed to basin water from the solid shape (W), h
is the convective heat transfer coefficient (W/m2K) and ΔT1 is the temperature difference for
the solid shape in period of time t (s). Similarly, the performance of hollow shape can be
expressed by Eq. 5.15.
222 ThAQ = (5.15)
The samples were kept in a refrigerator to make sure the samples were started by the same
temperature at the beginning of water production. The final temperature at period of t is
assumed the same if the gradient of temperature in the basin is not considerable and therefore
it can be concluded that ΔT1=ΔT2. Equation (5.14) can be divided by Eq. (5.15) as follows.
111
222
1
2
TAh
TAh
Q
Q
= (5.16)
Further simplification results in Eq. (5.17).
11
22
1
2
Ah
Ah
Q
Q= (5.17)

65
The convective heat transfer coefficient is a function of material, surface roughness, colour
and size of materials. The two samples were the same materials and mass and surface roughness
and colour and therefore it is a good assumption to consider h1=h2. Simplifying Eq. (5.17)
results in Eq. (5.18).
1
2
1
2
A
A
Q
Q=
(5.18)
The ratio of the two areas in Eq. (5.18) can be calculated for hollow and solid shapes.
11
2
1
22
2
2
2
2
1
2
lRR
lRrR
A
A
+
+−= (5.19)
where R2, r2 and l2 are the external radius, internal radius and height in m, respectively for
hollow sample. Similarly, R1 and l1 are the radius and height in m, respectively for solid sample.
By considering the values for R2, r2, R1, l2 and l1 for solid and hollow samples it can be
concluded that.
11
2 Q
Q (5.20)
Or
12 QQ (5.21)
Equation (5.21) expresses that the rate of heat exposed to basin water is greater for the
hollow sample in comparison to solid sample. Therefore, the basin water temperature is raised
rapidly for hollow sample in comparison to solid sample. Consequently, the water production
started for the hollow sample earlier in comparison to solid sample. In other words, the time of
water production for solar still is longer in comparison to solid sample. It is concluded that the
shape of energy storing materials can affect their performances as well as density and specific
heat capacity of energy storing materials. It was also concluded the wetted area is an important
factor in relation to shape of energy storing materials. A larger wetted area can improve the
energy storing material performance.

66
5.6 Theoretical Analysis
In the sections above, simple analysis was conducted in order to quantify the effect of
shape and material of the energy storing media. In this section a full theoretical analysis is
conducted in order to predict the temperature distribution and productivity of a double slope
solar still. Figure 5.8 depicts a schematic drawing for the solar still that illustrates the flow of
energy through the different zones in the still. The total incident solar radiation on the glass
cover is not complexly absorbed by water. Instead, a fraction of this radiation is reflected to
the ambient, another fraction is absorbed by the glass cover and the rest can penetrate the glass
and reach the water inside the basin. These fractions depend on the material coefficients of
reflection (R), absorption (α) and transmittance (τ). These three processes occur wherever the
radiation hits any surface, i.e. water surface and the basin surface. Because the bottom surface
of the still is usually painted black, the reflection from this surface can be ignored. In what
follows, the analysis starts with an energy balance for each zone in the still. The current analysis
is based on the following assumptions:
1. There is no vapour leakage in the still,
2. There is no temperature gradient along the glass cover thickness and the water depth,
3. The level of water in the basin is constant,
4. The condensation on the inner surface of the glass cover is film-wise condensation.
Figure 5.8 The energy flow inside a double slope solar still

67
For the glass cover, the summation of the absorbed solar energy and the heat transfer from
the water inside the basin is balanced with the energy lost from the glass cover to the ambient.
This balance equation can be written as follows in terms of W/m2:
)()()()()( agtggwewgwcwgwrwg TThTThTThTThtI −=−+−+−+ (5.22)
where cgrgewcwrw qqqqq ,,,, are the radiation heat flux from water to glass, the convection heat
flux from water to glass, the evaporation heat flux, the radiation heat flux from the glass to the
ambient and the convection heat flux from the glass surface to the ambient. The energy equation
for the solar basin bottom plate is given by:
sw
bwsbgbb
A
AqqqtI ++=)( (5.23)
where sbgb qqq ,, are the heat flux from the basin liner to water, from the basin liner to the
ground and from the basin liner to the side walls of the still. The energy balance equation for
the water mass is given by:
ewcwrww
wwbw qqqdt
dTcmqtI +++=+)( (5.24)
The heat transfer coefficients required for the above equations are obtained from Dutt et
al. (1989) as follows.
gw
gweff
rwTT
TTh
−
−=
)( 44 (5.25)
where eff is the effective diffusivity, σ is the Stefan Boltzmann constant,
wT is the water
temperature. The effective diffusivity is given by:
111
1
−+
=
gw
eff
(5.26)
where w = 0.96 and
g = 0.88 are the emissivity of water and glass, respectively.

68
3/1
268900
)(884.0
−
−+−=
w
wgw
gwcwP
TPPTTh (5.27)
where wP and
gP are the vapour pressure estimated at the water and glass temperature,
respectively.
−=
w
wT
P5144
317.25exp (5.28)
−=
g
gT
P5144
317.25exp (5.29)
gw
gw
cwewTT
PPhh
−
−= 016273.0 (5.30)
The combined radiation and convection heat transfer coefficient from the glass cover to
the ambient depends on the wind speed (V) and is given by:
Vhtg 8.37.5 += (5.31)
Equations (5.22), (5.23) and (5.24) can be written in the following forms:
)()()( agtggwtwg TThTThtI −=−+ (5.32)
)()()( gwtww
wwwbww TThdt
dTcmTThtI −+=−+ (5.33)
)()()( abbwbwb TThTThtI −+−= (5.34)
The glass and basin temperature can be obtained from Eq. (5.32) and (5.34), respectively.
tgtw
atgwtwg
ghh
ThThtIT
+
++=
)( (5.35)
bw
abwwbb
hh
ThThtIT
+
++=
)( (5.36)
Substituting Tg and Tb into Eq. (5.33) and with some re-arrangements, the following
equation can be obtained:
)(tfaTdt
dTw
w =+ (5.37)

69
Solving this differential equation with the boundary conditions Tw = Tw0 at time t = 0 and
Tg = Tg0 at time t = 0, the water temperature can be obtained as follows:
( ) )exp()exp(1)(
0 atTata
tfT ww −+−−= (5.38)
Using Eq. (5.35), the glass temperature can be obtained. The hourly distillate output can
be obtained from the following equation:
3600)(
−=
fg
gwew
h
TThm (5.39)
where:
wwcm
Ua = ,
ww
aeff
cm
UTtItf
+=
)()()(
tgtw
twgw
bw
wbeff
hh
h
hh
h
+++
+= )(
tgtw
tgtw
cbrb
cbrb
ins
ins
w
hh
hh
hh
hh
k
L
h
U+
+
+
+++
=1
1
cbrb
cbrb
ins
insb
hh
hh
k
Lh
+
++
=1
The equations above were applied and solved for the conventional solar still with no
modifications in order to verify the experimental measurements. Figure 5.9 and Figure 5.10
depict the measured water and glass temperature versus time, respectively, compared with the
predictions using the equations above. It is obvious that the model predicts the trend very well
with some deviations from the measured values. These deviations may be arising from the
uncertainties in the empirical correlations that were used to predict the heat transfer coefficients
required for the model. However, when the cumulative water production was predicted and
compared with the measurements in Figure 5.11, the predicted values are in a good agreement
with the measured values. This figure was created using Eq. (5.39). This means that although
the model has some deviations in the predicted temperatures, the temperature difference
between water and glass is predicted very well. This explains the success of the model in

70
predicting the cumulative water production. The results of this analysis conducted in the
present study indicate that the measurement system is verified.
Figure 5.9 The measured basin water temperature versus time compared with the prediction using the theoretical model

71
Figure 5.10 The measured glass temperature versus time compared with the prediction using the theoretical model
Figure 5.11 The measured cumulative water production versus time compared with the prediction using the theoretical
5.7 Summary
In this chapter, the effect of water depth and ambient temperature on the thermal
performance and productivity of the solar still was correlated by fitting the experimental data
using the best fit equation. Additionally, the effect of energy storing materials was quantified
and it was found that the material density and heat capacity are the important factors. In the
end, a theoretical analysis was conducted only for one case, which is the conventional solar
still with no modifications. The results indicated that there is a reasonable agreement with the
predictions and the measurements. This can verify the experimental measurements system.
72
6. Chapter Six: Conclusions and Future Work
6.1 Conclusions
Solar stills have been studied analytically and experimentally in this thesis. It has
concluded that solar stills are one of the best solution for the problems of obtaining fresh water
in the world. The main achievements of this study are listed as follows:
1. Solar stills are the most available and affordable technique to prepare fresh water
particularly in remote or coastal areas in the Kuwaiti climate conditions.
The quality of water produced by solar still was tested in terms of main parameters (PH
value, electrical conductivity (Ec), total dissolved solids (TDS) and salinity (Sa). the study has
found that the main quality parameters are all within the WHO standard range.
2. The study has concluded that energy storing materials can increase the daily water
production in solar stills. The performance of energy storing materials is related to their
size, material and shape. A new dimensionless parameter called Energy storing factor (β)
is the main factor which can affect the performance of energy storing materials in terms of
increasing water production in solar stills.
ww
ss
C
C
=
Where ρs is the density of energy storing materials (kg/m3), ρw is the density of basin water
(kg/m3), Cs is the specific heat capacity of energy storing material (J/kg.K) and Cw is the
specific heat capacity of water in the basin (J/kg.K).
3. The study has found that for the values of β<1 the energy storing materials can improve
the water production and for values of β>1 using energy storing materials can cause a
reduction in water production.
4. The study has found that in addition to density and specific heat capacity of energy storing
materials, the shape of energy storing materials is an important factor which can affect the
water production in solar stills. It was found that greater wetted area for energy storing
materials corresponds to higher water production performance.

73
5. The study has found that daily water production is linearly depended on maximum
production rate. Higher maximum production rate is corresponding to higher daily water
production. A linear correlation was developed to express the relation between maximum
production rate and daily water production.
6. The study has found that the water depth (d) can influence water production (y)
significantly. The correlation below was developed using experimental measurements.
3031.03085.5 −= dy
7. The water production is proportional to ambient average temperature (Tav) linearly. A
linear correlation was developed using the experimental data.
8. Maximum production rate is proportional to average ambient temperature linearly. A linear
correlation was developed to express the relation between maximum production rate and
average ambient temperature. The calculated values for production using the correlation
were in a good agreement with measurements.
9. The round hollow steel pieces are the best among the investigated shapes. The external
cooling of the glass cover plate is not very effective.
10. The total water production increases significantly as the water depth decreases.
11. Using gravel as energy storing material can improve the productivity of a solar still, which
is slightly lower than the productivity of solar stills with metallic energy storing materials.
If the cost was considered, gravel could be a good option and gravel with smaller size is
more favourable.
12. Phase change materials can increase the production rate and total daily water production
significantly compared to the other materials. It achieved about 53% improvements in the
total production.

74
6.2 Future Work
For further improvements in the performance of double slope solar stills, the following
recommendations can be adopted for future work:
1. The test of a different design configurations
2. Testing a wide range of phase change materials to as energy storage materials.
3. Incorporation of photovoltaic and electric heaters to increase the evaporation rate.
4. The use of heat pump driven by renewable energy to work as a heat source and to supply
cooling to the external transparent cover plate
75
REFERENCES
Abbaszadehmosayebi, G., Ganippa, L. (2014a). “Determination of specific heat ratio and error
analysis for engine heat release calculations”. Applied Energy .Vol.122, pp, 143–150
Abbaszadehmosayebi, G. and Ganippa. L. (2014b). “Characterising Wiebe Equation for Heat
Release Analysis based on Combustion Burn Factor (Ci)”. Fuel. Vol. 119, pp. 301-307.
Abdullah. A. S. (2013). “Improving the performance of stepped solar still”. Desalination. Vol.
319, pp. 60-65.
Abdul-Wahab, S. A. and Al-Hatmi, Y.Y. (2013). “Performance evaluation of an inverted
absorber solar still integrated with a refrigeration cycle and an inverted absorber solar still”.
Energy for Sustainable Development. Vol. 17, No. 6, pp. 642-648.
Abu-Zeid M. A. E., Yaqin Zhang, Hang Dong, Lin Zhang, Huan-Lin Chen, Lian Hou, (2015),
A comprehensive review of vacuum membrane distillation technique, Desalination 356 (2015)
1–14
Ahsan, A., Islam, S. M. K., Fukuhara T., and Ghazali H.A. (2010). “Experimental study on
evaporation, condensation and production of a new tubular solar stil”. Desalination . Vol. 260,
No. 1-3, pp. 172-179.
Ahsan A., Rahman A., Shanableh, A., Daud, N. N. N., Mohammed, T. A., and Mabrouk,
A.N.A. (2013). “Life cycle cost analysis of a sustainable solar water distillation technique”.
Desalination and Water Treatment. Vol. 51, No. 40-42, pp. 7412-7419.
Ahsan, A., Imteaz, M., Thomas, U. A., Azmi, M., Rahman, A., and Daud, N. N. N. (2014).
“Parameters affecting the performance of a low cost solar still”. Applied Energy. Vol. 114, pp.
924-930.
Al Otaibi, A. and Al Jandal, S. (2011). “Solar photovoltaic power in the state of Kuwait”, 37th
IEEE Photovoltaic Specialists Conference (PVSC), IEEE.

76
Alaudeen, A., Johnson, K., Ganasundar, P., Abuthahir, A. S., and Srithar, K . (2014). “Study
on stepped type basin in a solar still”. Journal of King Saud University - Engineering Sciences
Vol. 26, No. 2, pp. 176-183.
Al-shorfa.com (2015) Al-Mashareq, Available at: http://al-
shorfa.com/en_GB/articles/meii/features/2013/11/01/feature-03; Accessed: 30.01.2015
Akash B. A., M. S. Mohsen, O. Osta, Y. Elayan, Experimental evaluation of a single-basin
solar still using different absorbing materials, Renewable Energy, vol. 14, pp. 307 – 310, 1998.
BILAL A. AKASH, MOUSA S. MOHSEN, OMAR OSTA, and YASER ELAYAN
Arjunan, T.V., Aybar, H. S., and Nedunchezhian, N. (2009). “Status of solar desalination in
India”. Renewable and Sustainable Energy Reviews. Vol. 13, No. 9, pp. 2408-2418.
Arunkumar, T., Denkenberger, D., Ahsan, A., and Jayaprakash, R. (2013). “The Augmentation
Of Distillate Yield By Using Concentrator Coupled Solar Still With Phase Change Material”.
Desalination. Vol. 314, pp. 189-192.
authors.library.caltech.edu (2016) “Overview of Electron Microscopy”, Available at:
http://authors.library.caltech.edu/5456/1/hrst.mit.edu/hrs/materials/public/ElectronMicroscop
e/EM_HistOverview.htm. Accessed on: 22.02.2016.
Aybar, H. S and Assefi, H. (2009). “Simulation of a Solar Still to Investigate Water Depth and
Glass Angle”. Desalination Water Treat. Vol. 7, pp. 35-40
Ayoub, G. M., Malaeb. L. and Saikaly, P.E. (2013). “Critical variables in the performance of a
productivity-enhanced solar still”. Solar Energy. Vol. 98, Part C, pp. 472-484.
Ayuthaya, R. P, N., Namprakai, P., and Ampun, W. (2013). “The thermal performance of an
ethanol solar still with fin plate to increase productivity”. Renewable Energy, Vol. 54, pp. 227-
234.
V. Belessiotis, S. Kalogirou, E. Delyannis, Thermal Solar Distillation, Methods and Systems,
Academic Press, Elsevier 2016.
77
Boubekria, M., Cheknane, A., and Ali, M. (2013). “Modeling and simulation of the continuous
production of an improved solar still coupled with a photovoltaic/thermal solar water heater
system”. Desalination. Vol. 331, pp. 6-15.
Deshmukh H. S. and S.B. Thombre, (2017), Solar distillation with single basin solar still
using sensible heat storage materials, Desalination 410 (2017) 91–98
E1-Bahi, A., and Inan, D. A.(1999). “Solar still with minimum inclination, coupled to an
outside condenser”. Desalination; Vol. 123, No. 1, pp.79-83.
El-Agouz, S. A. (2014). “Experimental investigation of stepped solar still with continuous
water circulation”. Energy Conversion and Management. Vol. 86, pp. 186-193.
El-Dessouky H. T. and Ettouney H. M., Fundamentals of salt water desalination, Elsevier
Science B. V., 2002.
Elfasakhany A., Performance assessment and productivity of a simple-type solar still integrated
with nanocomposite energy storage system, Applied Energy 183 (2016) 399–407.
El-Samadony, Y.A.F., and Kabeel, A. E. (2014). “Theoretical estimation of the optimum glass
cover water film cooling parameters combinations of a stepped solar still”. Energy, Vol. 68,
pp. 744-750.
El-Sebaii, A. A., Aboul-Enein, S., and El-Bialy, E. (2000). “Single Basin Solar Still With
Baffle Suspended Absorber”. Energy Conversion and Management. Vol. 41, No. 7, pp. 661-
675.
El-Sebaii, A. A., Al-Ghamdi, A. A., Al-Hazmi, F. S., and Faidah, A. S. (2009). “Thermal
performance of a single basin solar still with PCM as a storage medium”. Applied Energy, Vol.
86, No. 7-8, pp. 1187-1195.
El-Sebaii A. A., M. El-Naggar, Year round performance and cost analysis of a finned single
basin solar still Applied Thermal Engineering 110 (2017) 787–794.

78
Eltawil, M. A., and Omara. Z. M. “Enhancing the solar still performance using solar
photovoltaic, flat plate collector and hot air”. Desalination. Vol. 349, pp. 1-9.
en.wikipedia.org (2014) “Adelaide Desalination Plant”, Available at:
http://en.wikipedia.org/wiki/Adelaide_Desalination_Plant. Accessed: 23.11.2014
en.wikipedia.org (2015) “Transmission electron microscopy”, Available at:
http://en.wikipedia.org/wiki/Transmission_electron_microscopy, Accessed: 15.03.2015.
Esfahani, J. A., Rahbar, N., and Lavvaf, M. (2011). “Utilization of thermoelectric cooling in a
portable active solar still-An experimental study on winter days”. Desalination. Vol. 269. No.1-
3, pp. 198-205.
Farid, M. and Hamad, F. (1993). “Performance of a single-basin solar still”. Renew Energy,
Vol. 3, No.1, pp. 75-83.
Fatani, A. A., Zaki, G. M., and Al-Turki, A. (1994). “Improving the yield of simple basin solar
stills as assisted by passively cooled condensers”. Renew Energy, Vol. 4, No. 4, pp. 377-386.
forum.daffodilvarsity.edu.bd (2015) “Transmission Electron Microscope (TEM)”, Available
at: http://forum.daffodilvarsity.edu.bd/index.php?topic=9749.0, Available at: 15.03.2015.
Gao, C. J. and Chen, G. H. (2004). Handbook for desalination technology and engineering.
China: Chemical Industry Press.
Ghaffour, N., Missimer, T. M., and Amy, G. L. (2013). “Technical review and evaluation of
the economics of water desalination: Current and future challenges for better water supply
sustainability”. Desalination. Vol. 309, pp. 197-207.
Ghaffour, N., Bundschuh, J., Mahmoudi, H., and Goosen, M.F.A. (2015). “Renewable energy-
driven desalination technologies: A comprehensive review on challenges and potential
applications of integrated systems”. Desalination. Vol. 356, pp. 94-114.

79
Ghoneyem, A. and Lleri, A. (1997). “Software to analyze solar stills and an experimental study
on the effects of the cover”. Desalination. Vol. 114, No. 1, pp. 37-44.
González D., José Amigoa, Francisco Suáreza, Membrane distillation: Perspectives for
sustainable and improved Desalination, Renewable and Sustainable Energy Reviews 80 (2017)
238–259
Gorjian, S., Ghobadian, B., Hashjin, T.T., and Banakar, A. (2014). “Experimental
performance evaluation of a stand-alone point-focus parabolic solar still”. Desalination. Vol.
352, pp. 1-17.
Greenlee, L. F., Lawler, F. D., Freeman, B. D., Marrot, B., and Moulin. P. (2009). “Reverse
osmosis desalination: Water sources, technology, and today's challenges”. Water Research.
Vol. 43, No. 9, pp. 2317-2348.
Halima, H. B., Frikha, N. and Slama, R. B. (2014). “Numerical investigation of a simple solar
still coupled to a compression heat pump”. Desalination. Vol. 337, pp. 60-66.
Hoffman, A. R. (2008). Water security: a growing crisis and the link to energy. AIP
Conference Proceedings; pp. 55-63.
Kabeel, A. E., Omara, Z. M. and Essa. F. A. (2014). “Improving the performance of solar still
by using nanofluids and providing vacuum”. Energy Conversion and Management. Vol. 86,
pp. 268-274.
Kabeel, A. E., Hamed, A.M., and El-Agouz, S. A. (2010). “Cost analysis of different solar still
configurations”. Energy. Vol. 35, pp. 2901-2908.
Kabeel A.E., Mohamed Abdelgaied Improving the performance of solar still by using PCM
as a thermal storage medium under Egyptian conditions Desalination 383 (2016) 22–28.
Kalogirou, S. A. (2005). “Seawater desalination using renewable energy sources”. Progress
in Energy and Combustion Science. Vol. 31, No. 3, pp. 242-281.

80
Kamal, W. A. (1988). “A theoretical and experimental study of the basin-type solar still under
the arabian gulf climatic conditions”. Solar and Wind Technology. Vol. 5, No. 2, pp. 147-157.
Kandasamy, S., Vellingiri, M., Sengottain, S., and Balasundaram, J. (2013). “Performance
correlation for single-basin double-slope solar still”. International Journal of Energy and
Environmental Engineering. Vol. 4, No. 4, pp.1-6.
Kannan, R., Selvaganesan, C., Vignesh, M., Babu, B. R., Fuentes, M., Vivar, M., Skryabin, I.,
and Srithar, K. (2014). “Solar still with vapor adsorption basin: Performance analysis”.
Renewable Energy. Vol. 62, pp. 258-264.
Kaviti A.K., Akhilesh Yadav, Amit Shukla, Inclined solar still designs: A review Renewable
and Sustainable Energy, Reviews 54 (2016) 429–451.
Kaushal, A. And Varun. (2010). “Solar stills: A review”. Renewable and Sustainable Energy
Reviews. Vol. 14, No.1, pp. 446-453.
Khalifa, A. J. N., and Ibrahim, H. A. (2010). “Effect of inclination of the external reflector of
simple solar still in winter: An experimental investigation for different cover angles”.
Desalination. Vol. 264, No. 1-2, pp. 129-133
Khalifa A. J. N., Ahmad M. Hamood, Performance correlations for basin type solar stills,
Desalination 249 (2009) 24–28
J. Kucera, Desalination:Water from Water, Scrivener Publishing LLC and John Willey and
Sons Inc. 2014.
Kumar, S., and Tiwari, G. N. (2009). “Life cycle cost analysis of single slope hybrid (PV/T)
active solar still”. Applied Energy. Vol. 86, No. 10, pp. 1995-2004.
Maalej, A.Y. (1991). “Solar still performance”. Desalination, Vol. 82, pp. 197-205.
Madhlopa, A. (2014). “Modelling radiative heat transfer inside a basin type solar still”. Applied
Thermal Engineering. Vol. 73, No.1, pp. 707-711.

81
Madhlopa, A., and Clarke, J. A. (2013). “Computation of irradiance in a solar still by using a
refined algorithm”. Renewable Energy. Vol. 51, pp. 13-21.
Malaeb, L., Ayoub, G. M., and Al-Hindi, M. (2014). “The Effect of Cover Geometry on the
Productivity of a Modified Solar Still Desalination Unit”. Energy Procedia. Vol. 50, pp. 406-
413.
Malik, M. A. S., Tiwari, G. N., Kumar, A. and Sodha, M. S. (1982). Solar Distillation, Oxford,
U.K: Pergamon Press 1982.
Mamouri, S. J., Deramia, G. H., Ghiasib, M., Shafii, M.B and Shiee, Z. (2014). “Experimental
investigation of the effect of using thermosyphon heat pipes and vacuum glass on the
performance of solar still”. Energy. Vol. 75, pp. 501-507.
Manju S., Sagar N., (2017), Renewable energy integrated desalination: A sustainable solution
to overcome future fresh-water scarcity in India, Renewable and Sustainable Energy Reviews
73 (2017) 594–609
Manokar, A. M., Murugavel, K. K., and Esakkimuthu, G. (2014). “Different parameters
affecting the rate of evaporation and condensation on passive solar still – A review”. Renewable
and Sustainable Energy Reviews. Vol. 38, pp. 309-322.
Martin, C. L, and Goswami, D. Y. (2005). “Solar Energy Pocket Reference”. International
Solar Energy Society, pp. 1-96. Freiburg, Germany.
Mathioulakis, E., and Belessiotis, V. (2003). “Integration of solar still in a multi-source,
multiuse environment”. Solar Energy; Vol. 75, No. 5, pp. 403-411.
Mehanna, M., Saito, T., Yan. J., Hickner, M., Cao, X., Huang, X., and Logan, B. E. (2010).
“Using microbial desalination cells to reduce water salinity prior to reverse osmosis”. Energy
and Environmental Science, Vol. 3, pp. 1114-1120.

82
Methnani M. Influence of fuel costs on seawater desalination options. Desalination. 2007;
205(1-3):332-9.
Muftah, A. F., Alghoul, M. A., Fudholi, A., Abdul-Majeed, M.M., and Sopian. K. (2014).
“Factors affecting basin type solar still productivity: A detailed review”. Renewable and
Sustainable Energy Reviews. Vol. 32, pp. 430-447.
Murugavel, K. K., Chockalingam, Kn. K. S. K., and Srithar, K. (2008). “Progresses in
improving the effectiveness of the single basin passive solar still”. Desalination. Vol. 220. No.
1-3, pp. 677-686.
Murugavel, K. K., Anburaj, P., Hansen, S., and Elango, T. (2013). “Progresses in inclined type
solar stills”. Renewable and Sustainable Energy Reviews. Vol.20, pp. 364-377.
Nafey A. S., M. Abdelkader, A. Abdelmotalip, A.A. Mabrouk, Solar still productivity
enhancement, Energy Conversion and Management, 42, 1401 – 1408, 2001.
Naim M. M., M. A. Abd El Kawi, Non conventional solar still, Part 1: Nonconventional solar
stills with charcoal particles as absorbing medium, Desalination 153, 55 – 64, 2002a.
Naim M. M., M. A. Abd El Kawi, Non conventional solar still, Part 1: Nonconventional solar
stills with energy storage element, Desalination 153, 71 – 80, 2002b.
Naim, M. M., Mervat, A., and El Kawi, A. (2003). “Non-conventional solar stills Part1. Non-
conventional solar stills with charcoal particles as absorber medium. Desalination. Vol. 153,
No. 1-3, pp. 55-64.
Namprakai, P. and Hirunlabh, J. (2007). “Theoretical and experimental studies of an ethanol
basin solar stil”. Energy; Vol. 32, No. 12, pp. 2376-2384.
Nithyanandam C., G. Baskar and Nalin Kant Mohanty, Design and fabrication of the passive
solar still using blue metal stone, International Journal of Ambient Energy, 2017, Vol. 38, No.
2, 171–177.

83
Omara, Z. M., Eltawilb, M. A., and ElNashar, A. E. (2013). “A new hybrid desalination system
using wicks/solar still and evacuated solar water heater”. Desalination. Vol. 325, pp. 56-64.
Omara, Z. M., Kabeel, A. E., and Younes, M. M. (2014). “Enhancing the stepped solar still
performance using internal and external reflectors”. Energy Conversion and Management. Vol.
78, pp. 876-881.
Omaraa, Z. M., A.S. Abdullah, A.E. Kabeel, F.A. Essaa, The cooling techniques of the solar
stills' glass covers – A review, Renewable and Sustainable Energy Reviews 78 (2017) 176–
193
Panchal, H. N. (2015). “Enhancement of distillate output of double basin solar still with
vacuum tubes”. Journal of King Saud University - Engineering Sciences. Vol. 27, No. 2, pp.
170-175.
Panchala H. N. Sanjay Patel, An extensive review on different design and climatic parameters
to increase distillate output of solar still, Renewable and Sustainable Energy Reviews 69 (2017)
750–758.
Porta, M. A, Chargoy, N., and Fernandez, J. L. (1997). “Extreme operating conditions in
shallow solar stills”. Solar Energy. Vol. 61, No. 4, pp. 279-286.
Qiblawey, H. M., and Banat, F. (2008). “Solar thermal desalination technologies”.
Desalination. Vol. 220, pp.633-644.
Rahbar, N. and Esfahani, J. A. (2012). “Experimental study of a novel portable solar still by
utilizing the heatpipe and thermoelectric module”. Desalination. Vol. 284, pp. 55-61.
Rajaseenivasan, T., Elango, T., and Murugavel. K. K. (2013a.). “Comparative study of double
basin and single basin solar stills”. Desalination. Vol. 309, pp. 27-31.
Rajaseenivasan, T., Murugavel, K. K., Elango, T. And Hansen, S. R. (2013b.). “A review of
different methods to enhance the productivity of the multi-effect solar stil”. Renewable and
Sustainable Energy Reviews. Vol.17, pp. 248-259.
84
Rajaseenivasan, T. and Murugavel, K. K. (2013c). “Theoretical and experimental investigation
on double basin double slope solar still”. Desalination. Vol. 319, pp. 25-32.
Rijsberman FR. Water scarcity: Fact or fiction?. Agricultural Water Management. 2006;
80(1-3):5-22.
Rao SM, Mamatha P. Water quality in sustainable water management. Current science. 2004;
87(7):942-7.
Sadineni S. B., Hurt, R., Halford, C. K, and Boehm, R. F. (2008). “Theory and experimental
investigation of a weir-type inclined solar still”. Energy. Vol. 33, No. 1, pp. 71-80.
Sakthivel, M., Shanmugasundaram, S., and Alwarsamy, T. (2010). “An experimental study on
a Regenerative solar still with energy storage medium – jute cloth”. Desalination. Vol. 264,
No.1-2, pp. 24-31.
Samee, M. A., Mirza, U. K., Majeed, T., Ahmad, N. (2007). “Design and performance of a
simple and single basin solar still”. Renewable and Sustain-able Energy Reviews. Vol. 11, No.
3, pp. 543-549.
Sampathkumar, K., and Senthilkumar, P. (2012). “Utilization of solar water heater in a single
basin solar still-An experimental study”. Desalination. Vol. 297, No. 3, pp. 8-19.
Sampathkumar. K., Arjunan, T.V., Pitchandi, P., and Senthilkumar, P. (2010). “Active solar
distillation – a detailed review”. Renewable and Sustainable Energy Reviews. Vol.14, No. 6,
pp. 1503-1526.
Samuel D. G. H., P.K. Nagarajan, Ravishankar Sathyamurthy, S.A. El-Agouz, E. Kannan,
Improving the yield of fresh water in conventional solar still using low cost energy storage
material, Energy Conversion and Management 112 (2016) 125–134.
Sathyamurthy, R., Kennady, H. J., Nagarajan, P. K., and Ahsan, A. (2014). “Factors affecting
the performance of triangular pyramid solar still”. Desalination. Vol. 344, pp. 383-390.
85
Sathyamurthy R. P.K. Nagarajan, S.A. El-Agouz, V. Jaiganesh, P. Sathish Khanna,
Experimental investigation on a semi-circular trough-absorber solar still with baffles for fresh
water production, Energy Conversion and Management 97 (2015) 235–242.
Shalaby S. M., E. El-Bialy, A.A. El-Sebaii, An experimental investigation of a v-corrugated
absorber single-basin solar still using PCM, Desalination 398 (2016) 247–255.
Seametrics.com (2014) “5 Countries Most Threatened by Water Shortages”, Available at:
http://www.seametrics.com/blog/5-countries-most-threatened-by-water-shortages/. Available:
22.11.2014.
Sharshir S. W., Guilong Peng, Lirong Wu, F.A. Essa, A.E. Kabeel, Nuo Yang, The effects of
flake graphite nanoparticles, phase change material, and film cooling on the solar still
performance, Applied Energy 191 (2017) 358–366.
Shukla, A. Karunesh Kant, Atul Sharma, Solar still with latent heat energy storage: A review,
Innovative Food Science and Emerging Technologies 41 (2017) 34–46
Sivakumar, V. and Sundaram, E. G (2013). “Improvement techniques of solar still efficiency:
A review”. Renewable and Sustainable Energy Reviews, Vol. 28, pp. 246-264.
Srivastava, P. K and Agrawal, S. K. (2013a). “Winter and summer performance of single
sloped basin type solar still integrated with extended porous fins”. Desalination. Vol. 319, pp.
73-78.
Srivastava, P. K, and Agrawal, S.K. (2013b). “Experimental and theoretical analysis of single
sloped basin type solar still consisting of multiple low thermal inertia floating porous
absorbers”. Desalination. Vol. 311, pp. 198-205.
Suneesh, P.U., Jayaprakash, R., Arunkumar, T., and Denkenberger. D. (2014). “Effect of air
flow on “V” type solar still with cotton gauze cooling”. Desalination. Vol. 337, pp. 1-5.

86
Taghvaei, H., Taghvaei, H., Jafarpur, K., Estahbanati, K. R.M., Feilizadeh, M., Feilizadeh, M.,
and Ardekani, S. A (2014). “A thorough investigation of the effects of water depth on the
performance of active solar stills”. Desalination, Volume 347, 15 August 2014, Pages 77-85.
Tiwari, G. N., Singh, H. N and Tripathi, R. (2003a). “Present status of solar distillation”. Solar
Energy. Vol. 75, No. 5, pp. 367-373.
Tiwari, G. N., Shukla, S. K., and Singh, I. P. (2003b). “Computer modeling of passive/active
solar stills by using inner glass temperature”. Desalination. Vol. 154, No. 2, pp. 171-185.
Tiwari, G. N., Dimri, V., and Chel, A. (2009). “Parametric study of an active and passive solar
distillation system: Energy and exergy analysis”. Desalination. Vol. 242, No. 1-3, pp. 1-18.
unwater.org (2014) http://www.unwater.org/worldwaterday/about-world-water-day/world-
water-day-2014-water-and-energy/en/. Accessed: 19.11.2014
Velmurugan. V, and Srithar, K. (2007). “Solar stills integrated with a mini solar pond -
analytical simulation and experimental validation”. Desalination. Vol. 216, No. 1-3, pp. 232-
241.
Velmurugan. V, and Srithar, K. (2011). “Performance analysis of solar stills based on various
factors affecting the productivity- a review”. Renewable and Sustainable Energy Reviews. Vol.
15, No. 2, pp. 1294-1304.
Voropoulos, K., Mathioulakis, E., and Belessiotis, V. (2001). “Experimental investigation of a
solar still coupled with solar collectors”. Desalination. Vol. 138, No. 1-3, pp. 103-110.
Voropoulos, K., Mathioulakis, E., and Belessiotis, V. (2003). “Experimental investigation of
the behaviour of a solar still coupled with hot water storage tank”. Desalination. Vol. 156,
No.1-3 pp. 315-322.
WWAP (United Nations World Water Assessment Programme), Water for a sustainable
world. The United Nations World Water Development Report. Paris, UNESCO: 2015.

87
The World Health Organization, Water Facts & Water Stories from Across the Globe,
http://www.theworldwater.org/water_thefacts.php (2010).
Weather and climate.com (2015) “Weather and Climate Information”, Available at:
http://www.weather-and-climate.com. Accessed: 27.12.2015.
www. technologystudent.com (2015) “Advantages and Disadvantages of Solar Power”,
Available at: http://www.technologystudent.com/energy1/solar7.htm. Accessed: 11.01.2015
www.imeche.org (2015) “Promoting sustainable energy use and engineering sustainable
supply is vital to our economy and modern lifestyles”, Energy Theme, Available at:
http://www.imeche.org/knowledge/themes/energy/energy-supply/fossil-energy/when-will-oil-
run-out. Accessed: 11.01.2015.
www.sciencedirect.com (2015) “ScienceDirect”, Available at: http://www.sciencedirect.com/;
Accessed: 11.01.2015
Xiao, G., Wang, X., Ni, M., Wang, F., Zhu, W., Luo, Z., and Cen, K. (2013). “A review on
solar stills for brine desalination”. Applied Energy. Vol. 103, pp. 642-652.
Zeroual, M., Bouguettaia, H., Bechki, D., Boughali, S., Bouchekima, B., and Mahcene, H.
(2011). “Experimental investigation on a double-slope solar still with partially cooled
condenser in the region of Ouargla (Algeria)”. Energy Procedia. pp. 6:736-42.
Zerrouki, M., Settou, N., Marif, Y., Belhadj, M. M. (2014). “Simulation study of a capillary
film solar still coupled with a conventional solar still in south Algeria”. Energy Conversion
and Management. Vol. 85, pp. 112-119.
Ziabari, F. B., Sharaka, A. Z., Moghadam, H. and Tabrizi, F.F (2013). “Theoretical and
experimental study of cascade solar still”. Solar Energy . Vol. 90, pp. 205-211.

88
Appendix 1: On Balance Mtt-500 Mini Table Top Scale
On Balance MTT-500 Mini Table Top Scale
• Capacity: 500g / 17.64oz / 7716gn / 2500.0ct • Readability: 0.1g / 0.01oz / 0.1gn / 0.5ct • Sperarate Lid/ Bowl • 4 Modes: g, oz, gn, ct • Backlit Display • Auto Shut Off • Tare & calibration Facility • 2 x AAA Batteries (Included) • Weighing Platform Size: 69 x 69mm • Dimensions: 75 x 105 x 23mm • Weight: 150g
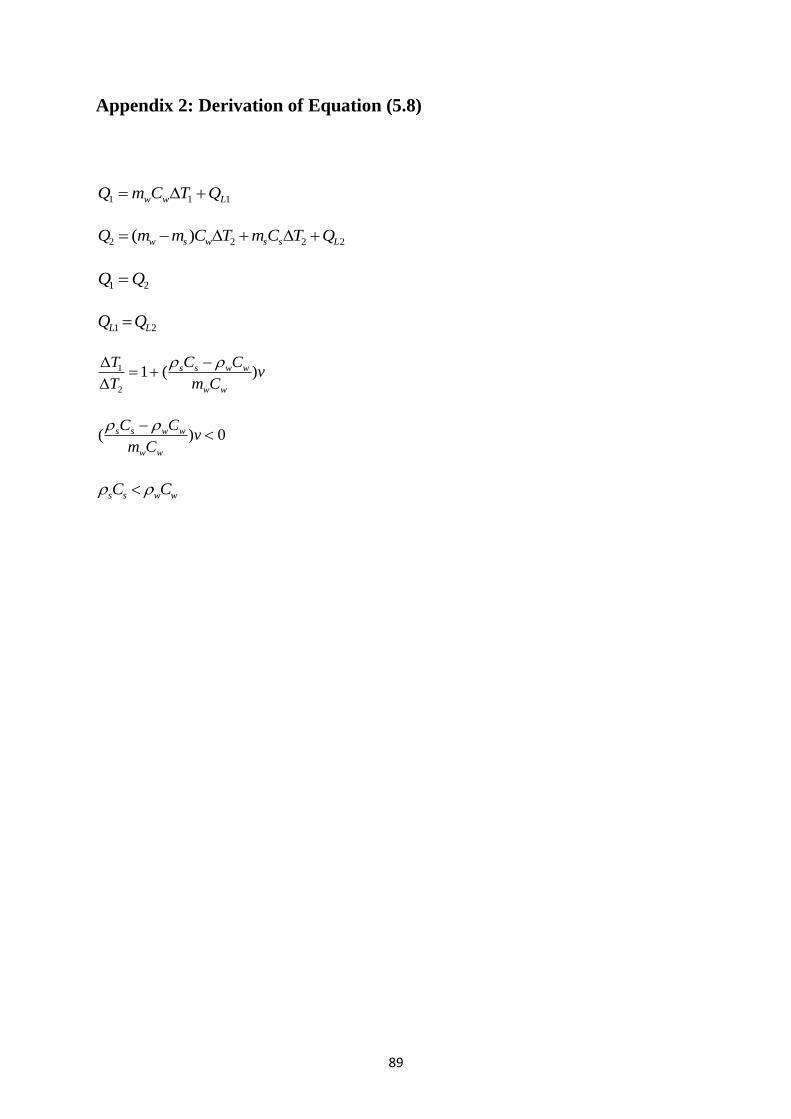
89
Appendix 2: Derivation of Equation (5.8)
111 Lww QTCmQ +=
2222 )( Lsswsw QTCmTCmmQ ++−=
21 QQ =
21 LL QQ =
vCm
CC
T
T
ww
wwss )(12
1 −+=
0)( −
vCm
CC
ww
wwss
wwss CC
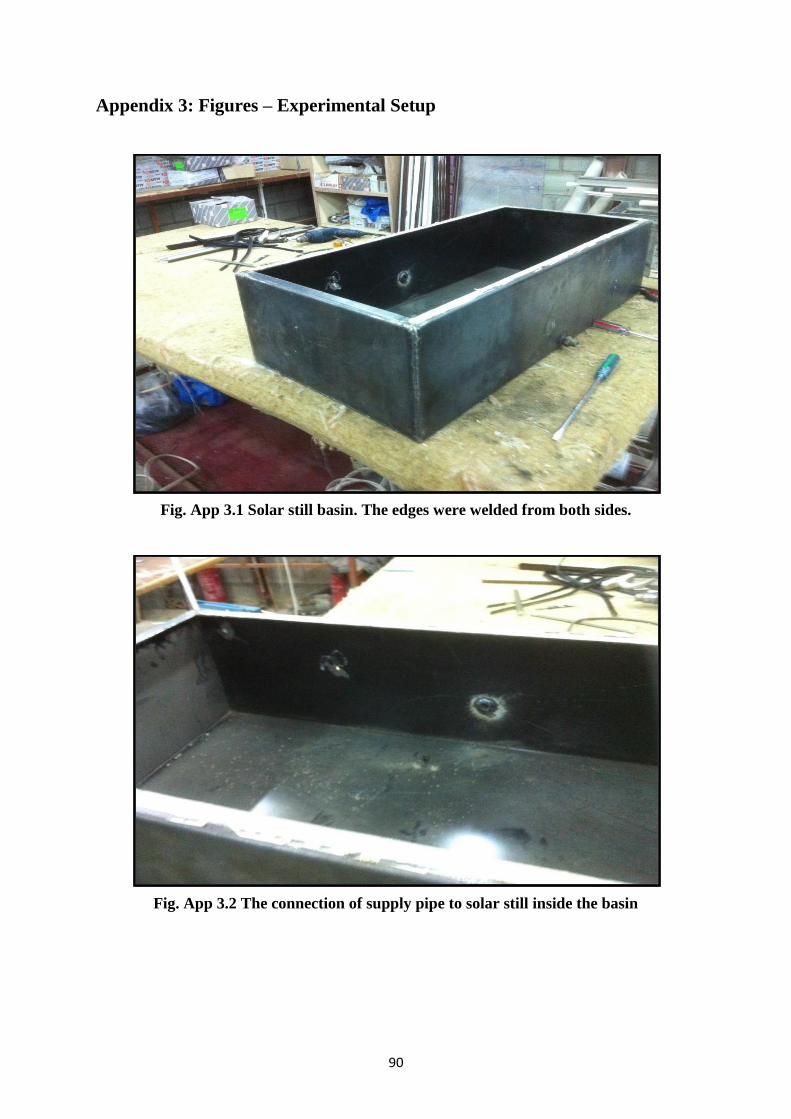
90
Appendix 3: Figures – Experimental Setup
Fig. App 3.1 Solar still basin. The edges were welded from both sides.
Fig. App 3.2 The connection of supply pipe to solar still inside the basin

91
Fig. App 3.3 The connection of level sensor.
Fig. App 3.4 The level sensor was connected to basin wall.

92
Fig. App 3.5 level sensor was connected to alarm circuit.
Fig. App 3.6 K-type thermocouple was connected to basin to record the temperature.

93
Fig. App 3.7 The connection of drain pipe to the side of basin.

94
Fig. App 3.8 Wood sheet attached on outer basin.
Fig. App 3.9 Wood sheet protects the insulation layer.

95
Fig. App 3.10 Temperature selector switch.
Fig. App 3.11 Electrical parts were tested on daily basis.

96
Fig. App 3.12 Glass sheets were used to construct double slope cover.
Fig. App 3.13 The solar still cover was built by using glass sheets at angle 35o.

97
Fig. App 3.14 Flexible anti mould, water proof silicone was used to connect the cover to
still main body.
Fig. App 3.15 Thermocouples were connected to cover glass to measure the temperature
of outer face of cover.

98
Fig. App 3.16 Control value was connected on the side basin.
Fig. App 3.17 The measurements were carried out where sun light could hit the solar
still cover directly.

99
Fig. App 3.18 Variation of water production rate during a day with no modification.
Fig. App 3.19 Variation of total daily water production during a day with no
modification.
0
50
100
150
200
250
300
350
5 10 15 20
Rat
e o
f P
rod
uct
ion
[m
L/h
]
Time of the day [hr]
0
200
400
600
800
1000
1200
1400
5 10 15 20
Tota
l dai
ly P
rod
uct
ion
[m
L]
Time [hr]
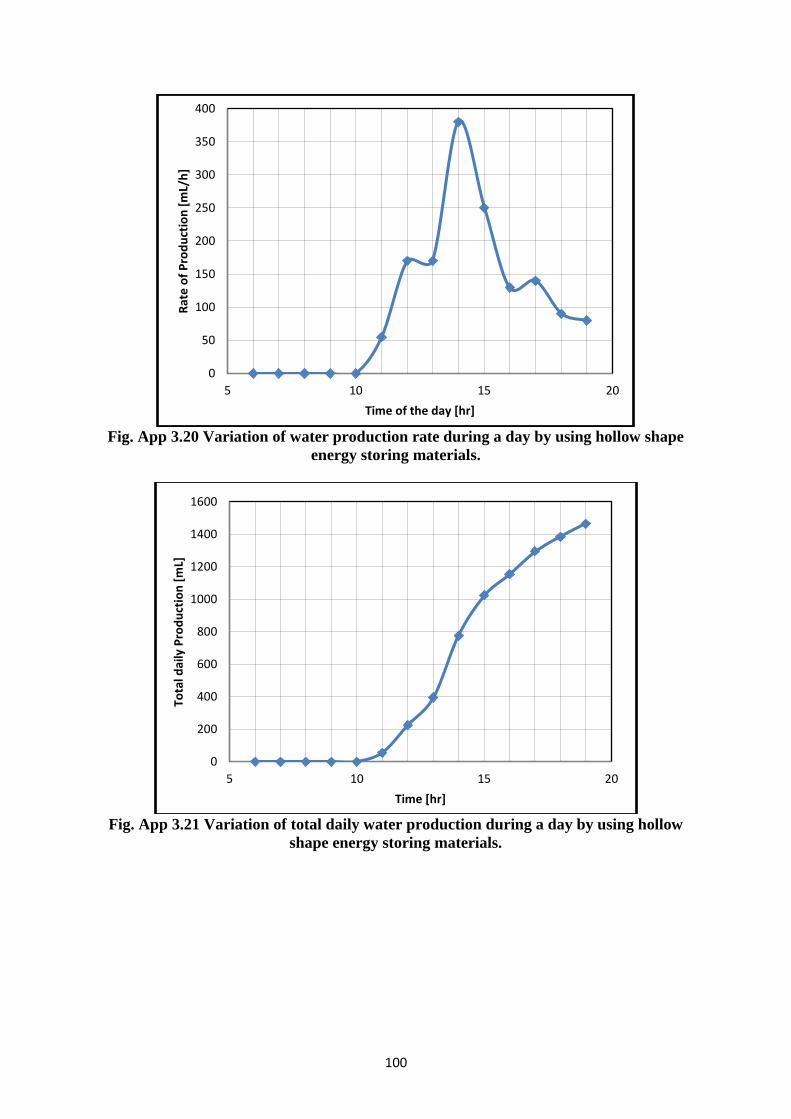
100
Fig. App 3.20 Variation of water production rate during a day by using hollow shape
energy storing materials.
Fig. App 3.21 Variation of total daily water production during a day by using hollow
shape energy storing materials.
0
50
100
150
200
250
300
350
400
5 10 15 20
Rat
e o
f P
rod
uct
ion
[m
L/h
]
Time of the day [hr]
0
200
400
600
800
1000
1200
1400
1600
5 10 15 20
Tota
l dai
ly P
rod
uct
ion
[m
L]
Time [hr]
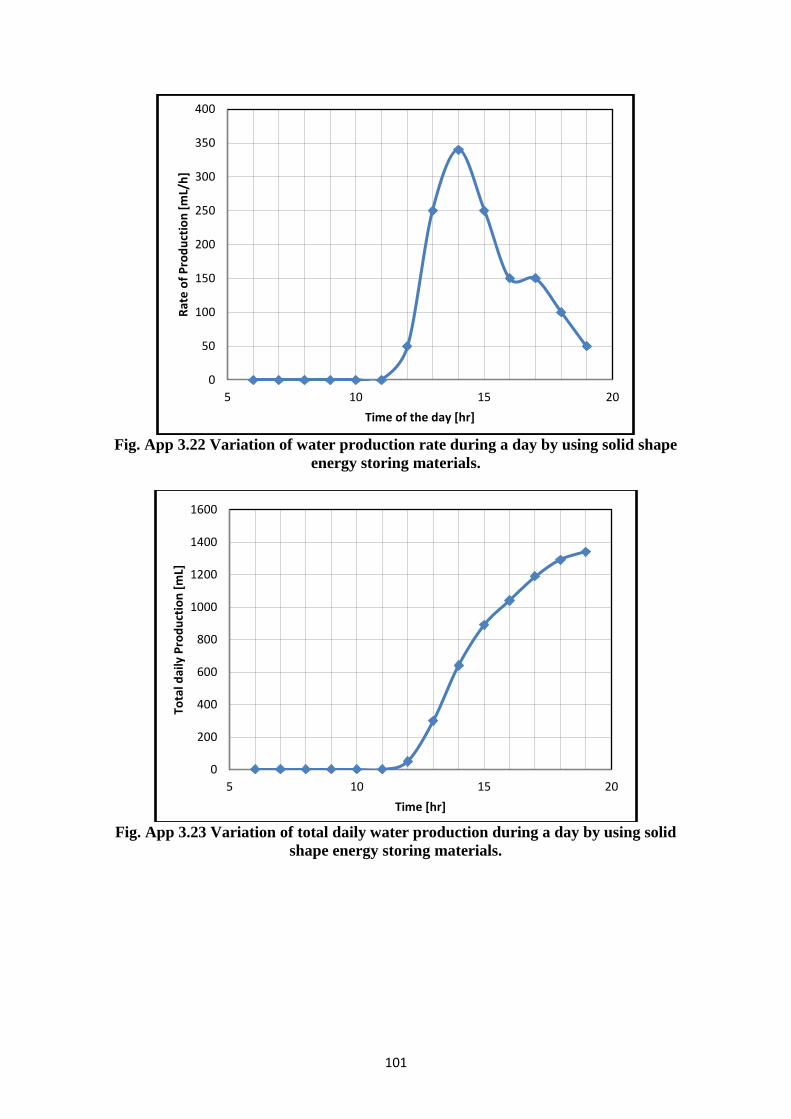
101
Fig. App 3.22 Variation of water production rate during a day by using solid shape
energy storing materials.
Fig. App 3.23 Variation of total daily water production during a day by using solid
shape energy storing materials.
0
50
100
150
200
250
300
350
400
5 10 15 20
Rat
e o
f P
rod
uct
ion
[m
L/h
]
Time of the day [hr]
0
200
400
600
800
1000
1200
1400
1600
5 10 15 20
Tota
l dai
ly P
rod
uct
ion
[m
L]
Time [hr]