
Experimental Analysis of high Reynolds Number structural ... · Experimental Analysis of High...
15
Experimental Analysis of High Reynolds Number Aero-Structural Dynamics in ETW J. Ballmann * RWTH Aachen University, Aachen, 52062, Germany A. Dafnis † , H. Korsch † , C. Buxel † , H.-G. Reimerdes † , K.-H. Brakhage ‡ , H. Olivier § C. Braun * , A. Baars * , A. Boucke * The paper reports about the aero-structural dynamical experiments with an elastic wing model which were conducted during the High Reynolds Number Aero-Structural Dynamics project by RWTH Aachen University in the cryogenic European Transonic Windtunnel, with funding from the German Research Foundation. The static and dynamic experi- ments have been performed in transonic flow at different windtunnel conditions concerning Reynolds number (up to 73 millions) and dynamic pressure (up to 0.13MPa). Starting with the description of the wing model, the measuring equipment and envelopes of the experiments, selected results of static and dynamic experiments are presented, partly in comparison with results obtained from numerical predictions during the preparation phase of the specimen and the experiments. For this the Computational Aero-Structural Dynam- ics package SOFIA of RWTH Aachen University was used. Results have been collected in a data base which will be made freely accessible to the aerodynamic and aeroelastic community in the near future. I. Introduction Transonic aeroelastic windtunnel testing with scaled wing models uses to be conducted hitherto in wind- tunnels at Reynolds numbers which are about one order of magnitude less than in real cruise flight of large passenger aircrafts [1]. Only very few aeroelastic windtunnel experiments with oscillating elastic wings have been performed, so far, in the transonic flow regime at flight Reynolds numbers of large transport aircrafts. For an airfoil in transonic flow with prescribed oscillation buffet has been examined at high Reynolds number in a cryogenic environment at NASA LaRC [2]. Besides the necessity for a thorough understanding of aeroelastic phenomena windtunnel experiments with elastic wings at high Reynolds numbers are necessary for validating methods of multidisciplinary airplane design and for realistic Computational Aero-Structural Dynamics (CASD) simulation of airplanes in flight. Normally data form aeroelastic experiments is declared confidential and not open for university research. Thus the objectives of the High Reynolds Number Aero-Structural Dynamics (HIRENASD) project, which was funded by the German Research Foundation (DFG) through the Collaborative Research Centre “Flow Modulation and Fluid-Structure Interaction at Airplane Wings” (SFB 401), are twofold. First, of course, to gain better aero-structural dynamics understanding and knowledge in the transonic regime up to real flight Reynolds numbers and, second, to obtain experimental data in a wide range of Reynolds numbers and aerodynamic loads for current and future aerodynamic and aeroelastic research. So-called Collaborative Research Centres like SFB 401 which are funded by DFG in Germany represent volon- tary associations of different university chairs for long term multidisciplinary research up to 4 subsequent research periods of 3 years each. In case of SFB 401 Chairs of Mathematics, Mechanics and Computational * Department of Mechanics (LFM), Templergraben 64, 52062 Aachen, Affiliate AIAA member. † Institute of Leight Weight Structures (ILB), W¨ ullnerstrasse 7, 52062 Aachen ‡ Institute of Geometry and Practical Mathematics (IGPM), Templergraben 55, 52062 Aachen § Shock Wave Laboratory (SWL), Schurzelterstraße 35, 52074 Aachen 1 of 15 American Institute of Aeronautics and Astronautics 46th AIAA Aerospace Sciences Meeting and Exhibit 7 - 10 January 2008, Reno, Nevada AIAA 2008-841 Copyright © 2008 by Prof. Dr.-Ing. Josef Ballmann. Published by the American Institute of Aeronautics and Astronautics, Inc., with permission.
Transcript of Experimental Analysis of high Reynolds Number structural ... · Experimental Analysis of High...
Experimental Analysis of High Reynolds Number
Aero-Structural Dynamics in ETW
J. Ballmann∗
RWTH Aachen University, Aachen, 52062, Germany
A. Dafnis†, H. Korsch†, C. Buxel†, H.-G. Reimerdes†,
K.-H. Brakhage‡, H. Olivier§
C. Braun∗, A. Baars∗, A. Boucke∗
The paper reports about the aero-structural dynamical experiments with an elastic wingmodel which were conducted during the High Reynolds Number Aero-Structural Dynamicsproject by RWTH Aachen University in the cryogenic European Transonic Windtunnel,with funding from the German Research Foundation. The static and dynamic experi-ments have been performed in transonic flow at different windtunnel conditions concerningReynolds number (up to 73 millions) and dynamic pressure (up to 0.13MPa). Startingwith the description of the wing model, the measuring equipment and envelopes of theexperiments, selected results of static and dynamic experiments are presented, partly incomparison with results obtained from numerical predictions during the preparation phaseof the specimen and the experiments. For this the Computational Aero-Structural Dynam-ics package SOFIA of RWTH Aachen University was used. Results have been collectedin a data base which will be made freely accessible to the aerodynamic and aeroelasticcommunity in the near future.
I. Introduction
Transonic aeroelastic windtunnel testing with scaled wing models uses to be conducted hitherto in wind-tunnels at Reynolds numbers which are about one order of magnitude less than in real cruise flight of largepassenger aircrafts [1]. Only very few aeroelastic windtunnel experiments with oscillating elastic wings havebeen performed, so far, in the transonic flow regime at flight Reynolds numbers of large transport aircrafts.For an airfoil in transonic flow with prescribed oscillation buffet has been examined at high Reynolds numberin a cryogenic environment at NASA LaRC [2].
Besides the necessity for a thorough understanding of aeroelastic phenomena windtunnel experiments withelastic wings at high Reynolds numbers are necessary for validating methods of multidisciplinary airplanedesign and for realistic Computational Aero-Structural Dynamics (CASD) simulation of airplanes in flight.Normally data form aeroelastic experiments is declared confidential and not open for university research.Thus the objectives of the High Reynolds Number Aero-Structural Dynamics (HIRENASD) project, whichwas funded by the German Research Foundation (DFG) through the Collaborative Research Centre “FlowModulation and Fluid-Structure Interaction at Airplane Wings” (SFB 401), are twofold. First, of course,to gain better aero-structural dynamics understanding and knowledge in the transonic regime up to realflight Reynolds numbers and, second, to obtain experimental data in a wide range of Reynolds numbers andaerodynamic loads for current and future aerodynamic and aeroelastic research.So-called Collaborative Research Centres like SFB 401 which are funded by DFG in Germany represent volon-tary associations of different university chairs for long term multidisciplinary research up to 4 subsequentresearch periods of 3 years each. In case of SFB 401 Chairs of Mathematics, Mechanics and Computational
∗Department of Mechanics (LFM), Templergraben 64, 52062 Aachen, Affiliate AIAA member.†Institute of Leight Weight Structures (ILB), Wullnerstrasse 7, 52062 Aachen‡Institute of Geometry and Practical Mathematics (IGPM), Templergraben 55, 52062 Aachen§Shock Wave Laboratory (SWL), Schurzelterstraße 35, 52074 Aachen
1 of 15
American Institute of Aeronautics and Astronautics
46th AIAA Aerospace Sciences Meeting and Exhibit7 - 10 January 2008, Reno, Nevada
AIAA 2008-841
Copyright © 2008 by Prof. Dr.-Ing. Josef Ballmann. Published by the American Institute of Aeronautics and Astronautics, Inc., with permission.

Figure 1. The European Transonic Windtunnel circuit.
Cruise envelope of presentand planned transport A/C
Take-offand landing
Envelope of HIRENASD tests
Figure 2. Test envelope of the European Transonic Windtunnel in com-parison with other European windtunnels.
Analysis of Technical Systems, Aerodynamics, Shock Waves, Aeronautics and Astronautics, Flight Dynam-ics and Light Weight Structures are cooperating. The very expensive experimental project HIRENASD isa special central project which has been initiated after 7 years of successful research work of SFB 401. Anoverview of this work is presented in [3]. The HIRENASD project has been conducted in strong cooperationof the four member chairs LFM, ILB, IGPM and SWL of the centre and included the layout of the modeland the experiments, the design of the model and vibration excitation mechanism, the design and construc-tion of a new windtunnel balance, the manufacturing of all this and equipment with 5 different measuringtechniques.The wing model corresponds to the SFB 401 clean wing reference configuration [4], which has a planform astypical for large passenger transport aircrafts, with 34o sweep angle and the supercritical wing profile BAC3-11 reported in AGARD-AR-303 [5], which has been arranged for cruise flight [3]. The complete windtunnelassembly has a span of 1.375m . The aerodynamic mean chord of the wing model is cref = 0.3445m. Thewindtunnel experiments in ETW include static and dynamic aeroelastic measurements at different wind-tunnel flow conditions, in total 51 conditions for steady polars and 135 conditions for dynamic tests. First,without vibration excitation, the pressure distribution, lift and drag polars were measured from negativeangles (α = −2o) to positive angles (maximum α = +5o) of incidence. After evaluation for the zero lift angleof incidence, excited vibration tests were performed at this angle. Chosen Mach numbers were Ma = 0.7,0.75, 0.8, 0.83, 0.85 and 0.88. The mentioned windtunnel conditions were at mainly 3 different values of q/E= 0.22 · 10−6, 0.34 · 10−6 and 0.48 · 10−6 which is the ratio of dynamic pressure and Youngs Modulus of thewing model, and for different Reynolds numbers up to 73 millions in one series of experiments with q/E =0.7 · 10−6. Vibrations were excited in the dynamic experiments at three different frequencies near resonance.The paper is organised as follows: In section II the windtunnel is shortly described, section III presents
2 of 15
American Institute of Aeronautics and Astronautics

Figure 3. Windtunnel model dimensions and its placement in the windtunnel (photograph).
a description of the windtunnel model and its instrumentation and in section IV static and dynamic testresults will be presented.
II. The European Transonic Windtunnel (ETW)
The European Transonic Windtunnel is a cryogenic facility with closed circuit, see figure 1. The fluid isnitrogen gas. Flow conditions can be chosen as follows: fluid temperatures from 110K to 313K and the totalpressure from 0.125MPa to 0.45MPa. The dimensions of the test section are height 2.0m, width 2.4m andlength 9.0m. The nozzle is adjustable, walls in the measuring section can be chosen slotted or closed and asecond throat is present behind the test-section. Controlled liquid nitrogen injection and gaseous nitrogenblow-off maintain temperature and pressure at the chosen level and a two-stage 50MW compressor providesMach numbers from Ma = 0.15 to Ma = 1.3. Mach number can be very quickly adjusted to a chosen value.This opportunity was indeed needed because of the enormous data flow that required a certain time for datastorage after each of the 186 experiments. During these pauses the Mach number was reduced to save liquidnitrogen and energy.Under the lowest temperature condition and static pressure around 0.4MPa, it is possible in ETW toachieve Reynolds numbers of up to 80 millions in half-model testing at transonic Mach numbers [6], with theaerodynamic mean chord as reference length, see figure 2. Special model material is needed for the elasticwing model to procure its toughness and elasticity under high aerodynamic loads at temperatures from 110Kto 310K [7]. One advantage of ETW is that the parameters Mach number, Reynolds number and dynamicpressure, or even more adequate, the ratio of dynamic pressure to Youngs modulus of the model material,which are influencing the aeroelastic behaviour of the wing [8, 9, 10], can be varied independently of eachother.
III. Windtunnel Model Assembly and Measuring Equipment
III.A. Windtunnel Model Assembly
The planform of the elastic wing model has the typical characteristics of a wing for a large passenger aircraftas mentioned in the introduction. The leading edge sweep angle is 34o, the span of the wing model fromroot to tip is 1285.71mm, and the chord decreases from its root value over three sections piecewise linearlyto the tip value. The wing model is untwisted such that the leading edge and the twice kinked trailing edge
3 of 15
American Institute of Aeronautics and Astronautics
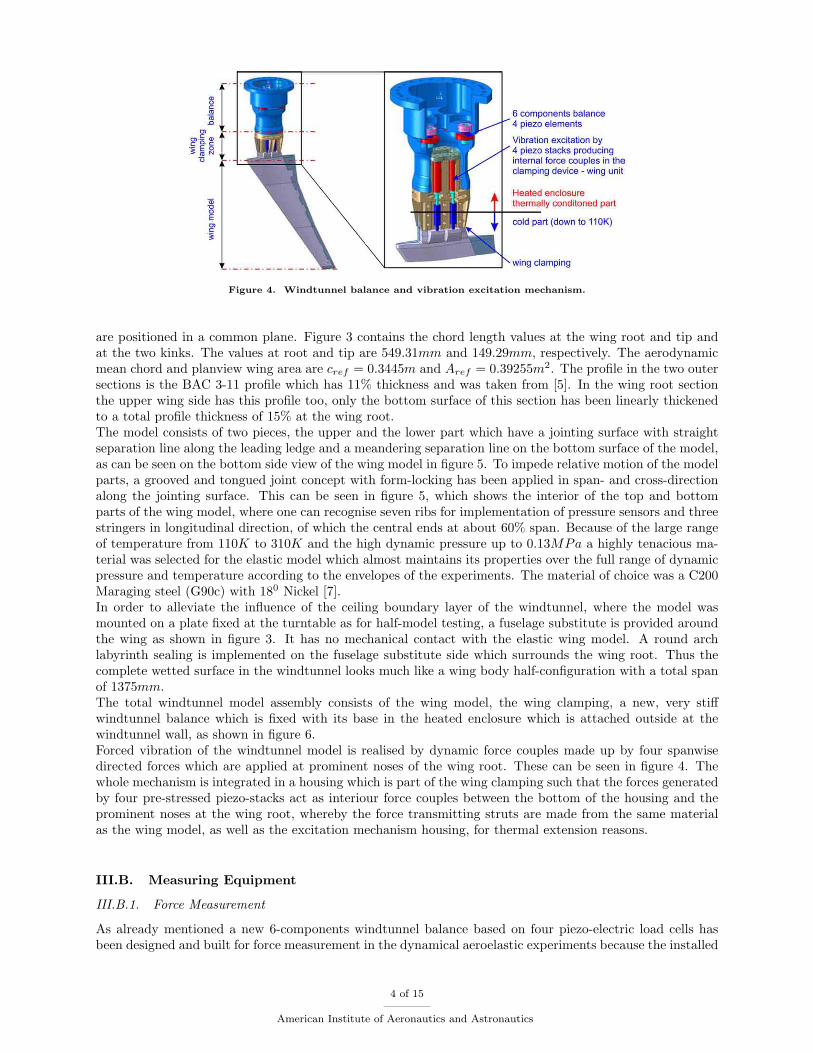
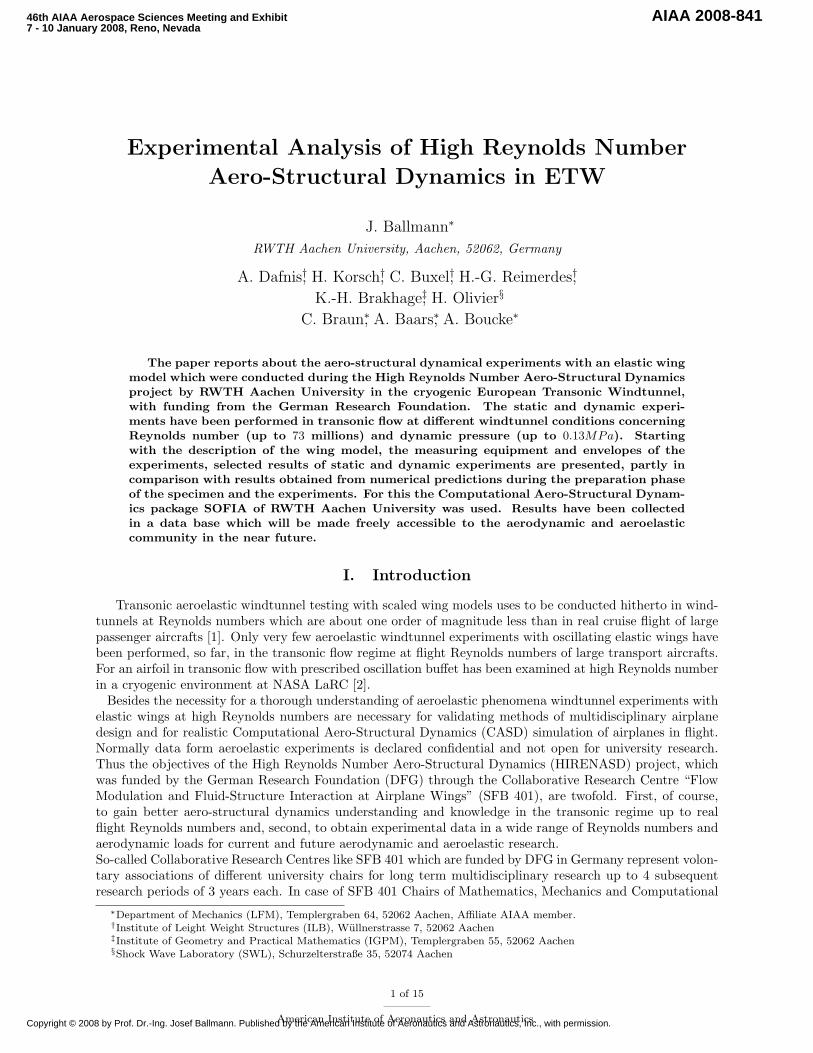
Figure 4. Windtunnel balance and vibration excitation mechanism.
are positioned in a common plane. Figure 3 contains the chord length values at the wing root and tip andat the two kinks. The values at root and tip are 549.31mm and 149.29mm, respectively. The aerodynamicmean chord and planview wing area are cref = 0.3445m and Aref = 0.39255m2. The profile in the two outersections is the BAC 3-11 profile which has 11% thickness and was taken from [5]. In the wing root sectionthe upper wing side has this profile too, only the bottom surface of this section has been linearly thickenedto a total profile thickness of 15% at the wing root.The model consists of two pieces, the upper and the lower part which have a jointing surface with straightseparation line along the leading ledge and a meandering separation line on the bottom surface of the model,as can be seen on the bottom side view of the wing model in figure 5. To impede relative motion of the modelparts, a grooved and tongued joint concept with form-locking has been applied in span- and cross-directionalong the jointing surface. This can be seen in figure 5, which shows the interior of the top and bottomparts of the wing model, where one can recognise seven ribs for implementation of pressure sensors and threestringers in longitudinal direction, of which the central ends at about 60% span. Because of the large rangeof temperature from 110K to 310K and the high dynamic pressure up to 0.13MPa a highly tenacious ma-terial was selected for the elastic model which almost maintains its properties over the full range of dynamicpressure and temperature according to the envelopes of the experiments. The material of choice was a C200Maraging steel (G90c) with 180 Nickel [7].In order to alleviate the influence of the ceiling boundary layer of the windtunnel, where the model wasmounted on a plate fixed at the turntable as for half-model testing, a fuselage substitute is provided aroundthe wing as shown in figure 3. It has no mechanical contact with the elastic wing model. A round archlabyrinth sealing is implemented on the fuselage substitute side which surrounds the wing root. Thus thecomplete wetted surface in the windtunnel looks much like a wing body half-configuration with a total spanof 1375mm.The total windtunnel model assembly consists of the wing model, the wing clamping, a new, very stiffwindtunnel balance which is fixed with its base in the heated enclosure which is attached outside at thewindtunnel wall, as shown in figure 6.Forced vibration of the windtunnel model is realised by dynamic force couples made up by four spanwisedirected forces which are applied at prominent noses of the wing root. These can be seen in figure 4. Thewhole mechanism is integrated in a housing which is part of the wing clamping such that the forces generatedby four pre-stressed piezo-stacks act as interiour force couples between the bottom of the housing and theprominent noses at the wing root, whereby the force transmitting struts are made from the same materialas the wing model, as well as the excitation mechanism housing, for thermal extension reasons.
III.B. Measuring Equipment
III.B.1. Force Measurement
As already mentioned a new 6-components windtunnel balance based on four piezo-electric load cells hasbeen designed and built for force measurement in the dynamical aeroelastic experiments because the installed
4 of 15
American Institute of Aeronautics and Astronautics

Figure 5. Inside view of the parts of the windtunnel wing.
Figure 6. Sketch of the placement of the total assembly in the wind-tunnel.
balance in ETW had been originally designed for precise measurement in stationary testing. It is by far notstiff enough for dynamic measurements. The new balance is very stiff, the frequencies of its lowest eigenmodesare beyond 800Hz whereas the highest planned excitation frequency in the HIRENASD experiments wasbelow 300Hz.
III.B.2. Pressure Sensors
The wing model had been equipped with 259 cryogenic miniature/ultraminiature pressure sensors (kulites)which were implemented in 7 span-wise cross sections. The relative span positions � of these 7 cross-sectionsare depicted in figure 7. Because of the space needed for the sensor implementation in the interiour of thewing the sensors and pressure holes on the bottom side of the wing model are shifted about 2mm towardsthe tip relative to the pressure holes of the top side. Unfortunatelly, not all but 205 sensors were measuringcorrectly. On the right hand side of figure 7 the numbers of sensors which were functioning during theexperiments are exemplarily presented for three measuring sections.
III.B.3. Strain Gauges and Acceleration Sensors
The windtunnel model assembly was equipped with 28 strain gauges of which 6 were placed in the wingclamping at the excitation force transmitters and the other 22 were distributed inside the wing model asshown in figure 8. For monitoring acceleration during the tests several acceleration sensors were placed inthe assembly, 11 from these accelerometers were implemented inside the model, all at the upper part of thewing model as shown in figure 9. Figure 10 shows a photograph of the full measurement implementation inthe wing model before the assemblage of the two model parts.
5 of 15
American Institute of Aeronautics and Astronautics

Figure 7. Model instrumentation with pressure sensors.
Figure 8. Positions of strain gauges inside of the wing model.Figure 9. Positions of accelerometers in-side of the wing model.
III.B.4. Deformation Measurement using Stereo Pattern Tracking (SPT)
An optical system (System picCOLOR) using ultra high speed cameras and frame grabbers was installed fordisplacement measurement by means of optical marker tracing. The markers were placed on the pressureside of the wing model, see left photograph of figure 3. A new high speed link for the frame transfer wasestablished by ETW using fibre optic cables. New high power flash lights with an operating frequency up to1kHz were designed in the project and installed by ETW for the model deformation system.
IV. Test Program and Conduction of Tests
IV.A. Static Tests
As mentioned in the introduction tests have been conducted for many windtunnel conditions, the mainconditions were those for Mach number Ma = 0.8, for which the test envelope is presented in figure 11. Thenumbering corresponds to the sequence of the performed test series. During each series the values of q/E andReynolds number are fixed. Series 1 to 4 were conducted with transition band fixed at 12% chord on the bodyside section and at 15% chord on the two outer sections of the suction side and continuously at 5% chord onthe pressure side. Thereafter, the transition bands were removed. Originally it was planned that more testsshould be made at total pressure ptot = 0.45MPa, but during the test runs it was decided to concentrate onthree lower levels, corresponding to q/E = 0.22 · 10−6, 0.34 · 10−6 and 0.48 · 10−6. With increasing values of
6 of 15
American Institute of Aeronautics and Astronautics

In-situ pressure sensors and accelerometers
Strain gauges
Figure 10. Model parts equipped with complete measurement implementation before assembling.
q/E the wing deformation increases and consequently the changes in the pressure distribution grow for fixedMach and Reynolds numbers. This can be analysed looking at the results of series 6, 10 and 5 or 11. ForReynolds number effects series 2, 10, 7 or 3, 5, 8 can be studied. Similar test polars as for Ma = 0.8 wereused for different Mach numbers to analyse the effect of Mach number changes.In each series, first the static polars were measured for all Mach numbers of the series at angles of attack
q/E-Variation(modelload)
Numberof testseries
Conditionfor design loads
Re-Variation
Figure 11. Windtunnel test envelope for Mach number Ma = 0.8.
from α = −2o to positive angles corresponding to the load limits admitted by ETW for the model assembly,e.g. α = +4.2o. The angle of incidence has been changed continuously with an angular velocity of about0.2 degrees per second. Data has been recorded with 4kHz in most static experiments, except the slowerSPT deformation measurement, for which an exemplary result is depicted in figure 12. It contains thechange of aerodynamic twist over the angle of incidence for three levels of q/E taken from the test series1, 2, 3 (symbols) in comparison to results from numerical simulations using SOFIA taken from [11]. The
7 of 15
American Institute of Aeronautics and Astronautics

Mounted model assembly with markers for high speedStereo Pattern Tracking (SPT)
Accuracy: 0.1mm
Figure 12. Aerodynamic twist from measurements using SPT for the different levels of q/E (= 0.22 ·10−6, 0.34 ·10−6, 0.48 ·10−6) compared with results from computations using the SOFIA package.
aerodynamic twist reached values between 0.7 and 1.2 degrees in the experiments which is mainly due towing bending in combination with sweep. During the static polar measurements perturbations have beenobserved which excited the wing model to small vibrations. The frequencies of these vibrations were recordedby the acceleration sensors in the wing model, and some of these sensor signals have been evaluated onlineto provide values for the vibration excitation near resonance in the dynamic tests following immediatelyafterwards in the same measurement series.
IV.B. Dynamic Tests
Dynamic tests were performed for three frequencies, the first and the second mode with frequencies around27Hz and 79Hz, which are bending dominated, and the first torsion dominated mode with frequency around265Hz. In each series, first dynamic tests were trials without wind and tests under wind followed thereafter.Two power levels were chosen for the excitation and controlled by the voltage applied to the piezo-electricexcitation stacks. For each excitation test a number of 40 blocks with 16 periods of vibration in each blockwas chosen, consisting of e.g. the sequence 2 blocks for noise recording, 13 blocks with 60% excitation voltage,6 blocks without excitation, 13 blocks with 90% excitation voltage and finally 6 blocks without excitation.In each vibration period 128 data were recorded from every of the more than 300 sensor signals. The conceptof 40 blocks for each vibration test has been maintained for the three tested frequencies, i.e. the test forthe lowest frequency has about 10 times the duration of the tests for the torsion dominated frequency (seefigure 13). More information about the dynamic qualification of the elastic wing model, including frequencyand mode shape analysis, can be found in [12].
V. Selected Results from the Experiments in ETW
V.A. Static Tests
V.A.1. Influence of q/E Variation on Lift and Pressure Distribution
One result for Ma = 0.8 and Re = 23.5 million, where the flow is already fully turbulent almost everywhere,is depicted for varied q/E in figure 15. It can be observed that the lift decreases with increasing q/E due tothe aerodynamic twist by deformation which diminishes the local angle of attack. This diminution increasesin span-wise direction. The pressure distribution for one root angle of attack is presented in figure 16.
8 of 15
American Institute of Aeronautics and Astronautics

Zeit
Wer
tHV
1
-5 0 5 10 15 20 25-200
0
200
400
600
800
1000
1200 Polar no. 270
Val
ueH
V1
Time
Figure 13. Voltage amplitudes at piezo stack no. 1 forexcitation frequency 29.1 Hz over the duration of theexperiment.
Zeit
Wer
tHV
1
-0.5 0 0.5 1 1.5 2 2.5 30
200
400
600
800
1000Polar 272
Time
Val
ueH
V1
Figure 14. Voltage amplitudes at piezo stack no. 1 forexcitation frequency 268.3 Hz over the duration of theexperiment.
Ma=0.80, Re=23.5 mio.
lift
pitching moment
Increasing q/E
!cL~0.02
Figure 15. Influence of varying q/E on lift force and pitching moment.
9 of 15
American Institute of Aeronautics and Astronautics

Ma=0.80Re=23.5 mio.alpha=3.0°
q/E=0.48e-06
q/E=0.22e-06
section 7 (!=0.95)
section 4 (!=0.59)
section 1 (!=0.14)
Figure 16. Influence of varying q/E on pressure distributions in three wing sections.
Re=23.5 mio., q/E=0.34e-06
Figure 17. Influence of varying Mach number on lift and drag.
10 of 15
American Institute of Aeronautics and Astronautics
1
7
!=0.14 !=0.95
Re=23.5 mio., q/E=0.34e-06
Figure 18. Influence of varying Mach number on pressure distribution in two wing sections, α = 2o.
Ma=0.80, q/E=0.48e-06
Increasing Re
!cL~0.02
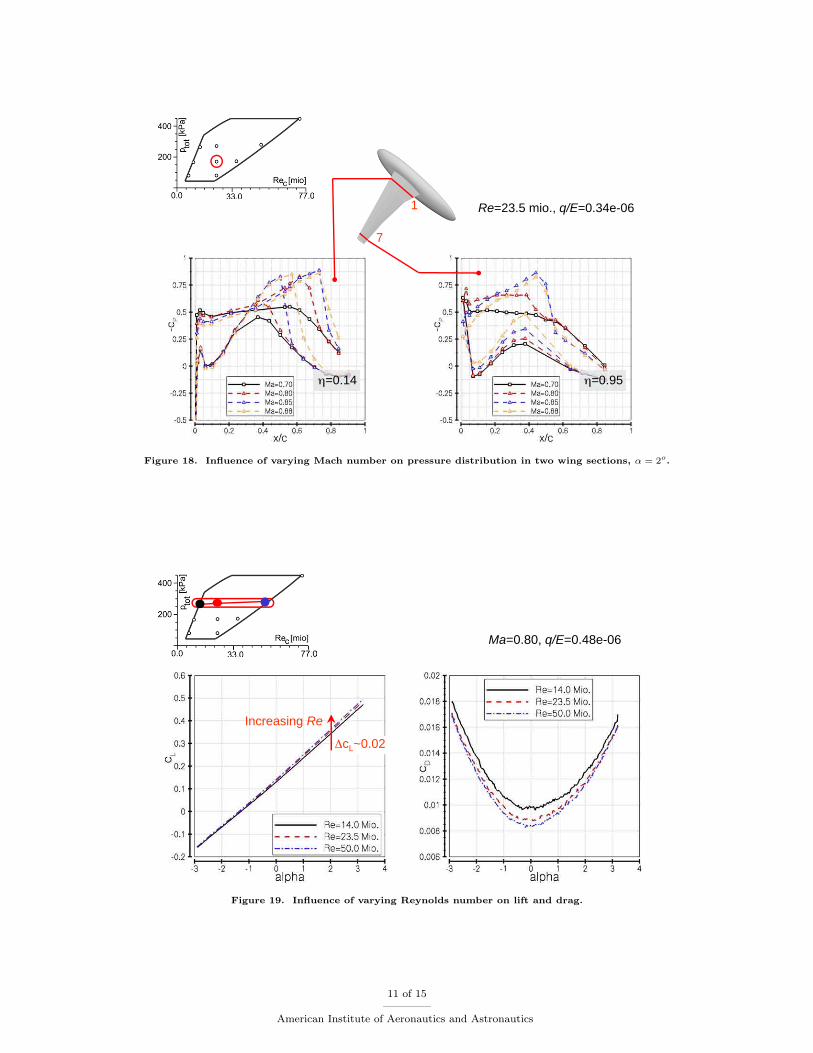
Figure 19. Influence of varying Reynolds number on lift and drag.
11 of 15
American Institute of Aeronautics and Astronautics

1
7
!=0.14 !=0.95
Ma=0.80, q/E=0.48e-06
Figure 20. Influence of varying Reynolds number on pressure distribution in two wing sections, α = 2o.
V.A.2. Influence of Mach Number Variation on Lift and Drag
Mach number varies around Ma = 0.8 for fixed q/E = 0.34 ·10−6 and Re = 23.5 million in figures 17 and 18,where lift over α and lift over drag polars are presented in the one and pressure distribution in two wingsections in the other figure for four Mach numbers at α = 2o root angle of incidence. As can be seen liftdeteroriates due to compressibility effects at Ma = 0.88. The changes of shock strength and position due tovariations of the Mach number can be seen very clearly in figure 18. For Ma = 0.7 no shock is present at all.
V.A.3. Influence of Varying Reynolds Number
Results are presented from polars of series 3, 5 and 8. Contrary to the lift decrease when increasing q/Ethe lift rises slightly with ascending Reynolds number and drag over α descends with increasing Reynoldsnumber as is shown in figure 19. Pressure distribution in wing sections 1 and 7 are presented in figure 20 forα = 2o. The lift contribution of the suction side seems to be a little higher for Re = 23.5 million than forRe = 50.0 million, where in both cases the flow is fully turbulent and no transition band is present. In caseof Re = 14.0 million transition bands are applied which may have some differing influence by themselves dueto their dimensions.
V.B. Dynamic Tests
Three experimental results are presented which belong to the series 5 with Re = 23.5 million and q/E = 0.48·10−6 at Ma = 0.8 and zero lift angle of attack which is α = −1.34o. The results presented in figures 21, 22and 23 belong to the first bending dominated mode which was excited with 29.1Hz, the second bendingdominated mode which was excited with 80.3Hz and the first torsion dominated mode which was excitedwith 268.3Hz.In all three figures the range of pressure values recorded in wing section 7 is presented in the right upperpicture. The picture in the upper left corner shows the respective mode shape. The pictures at the bottom ofthe figures present the pressure distributions in section 7 recorded over a small interval of time interval in the90% voltage excitation blocks which corresponds to only 4 periods in the fully excited state. The left pictureshows the original data record whilst the right one presents the filtered data. Filtering was executed by meansof Fourier analysis and inverse Fourier transformation using a small frequency band around the excitationfrequency. The original measuring data appear very noisy. Noise is mainly due to flow disturbances fromthe windtunnel or from the model itself which has to be analysed deeper in the ongoing evaluation. The
12 of 15
American Institute of Aeronautics and Astronautics

strongest influence of noise was detected for the lowest mode frequency. Pressure perturbances in the rearpart of the suction side of the wing have been analysed and were found to travel upstream from the trailingedge versus the shock which closes the supersonic range on the suction side of the wing. This phenomenon iswell known e.g. from blade vortex interaction at helicopter blades when the vortex passes the trailing edgeof the blade on its underside.
Ma= 0.80Re= 23.5 mio.q/E= 0.48alpha= -1.34°fE
= 29.1 Hz
section 7 (!=0.95)
Figure 21. Results for excitation of the first bending dominated mode near resonance for a time interval of about 4periods in the 90% excitation blocks.
Ma= 0.80Re= 23.5 mio.q/E= 0.48alpha= -1.34°fE
= 80.3 Hz
section 7 (!=0.95)
Figure 22. Results for excitation of the second bending dominated mode near resonance for a time interval of about 4periods in the 90% excitation blocks.
VI. Conclusion
Static and dynamic aeroelastic experiments with a dynamically excited elastic wing model have beenreported which were conducted in the European Transonic Windtunnel (ETW) at Reynolds numbers up toreal flight conditions of large passenger aircrafts in cruise. Those conditions can be provided in ETW usingcryogenic flow of nitrogen gas at high total pressure and correspondingly high dynamic pressure in transonic
13 of 15
American Institute of Aeronautics and Astronautics

Ma= 0.80Re= 23.5 mio.q/E= 0.48alpha= -1.34°fE
= 268.3 Hz
section 7 (!=0.95)
Figure 23. Results for excitation of the first torsion dominated mode near resonance for a time interval of about 4periods in the 90% excitation blocks.
flow. The aerodynamic loads on the HIRENASD model with its reference area Aref = 0.39255m2 exceededtwo tons. Therefore, safety of model and windtunnel required a stiff construction which is difficult to excitefor vibration amplitudes in the range of several percent of span. A piezoelectric mechanism was constructedto excite the whole wing by strong interior force couples in the wing clamping zone. To the knowledge ofthe authors it was the first time that aero-structural dynamic experiments under the described conditionshave been performed. So, the experiments reported in this paper are pioneering work in some sense. Onlya limited part of the obtained large amount of data has been evaluated up to now. For several reasonsevaluation is not as straight forward as it might be for aeroelastic experiments in traditional windtunnelswith well-known flow properties in all details and cheep and long measuring time intervals for each singleexperiment and a narrow band of aerodynamic loads. For the experiments presented in this paper theaerodynamic load parameter q/E varied from 0.22 · 10−6 to 0.7 · 10−6 and measuring time intervals had tobe chosen very short because of the high expenses to provide the intended flow conditions. Evaluation isstill in progress, and it will be published more about the results in the near future.
Acknowledgments
Authors are grateful to the German Research Foundation (DFG) for funding the HIRENASD project,Airbus Germany for contributing support for the development of the new windtunnel balance for dynamicforce measurements, DLR for advice concerning data aquisition and providing AMIS II for data recordingand ETW for providing windtunnel adaptations, for e.g. dynamic force measurements, and continuous adviceduring the preparation of the model and the measuring equipment.
References
1Cole, S.R., Noll, T.E., Perry, B. III: Transonic Dynamics Tunnel Aeroelastic Testing in Support of Aircraft Development.Journal of Aircraft, Vol. 40, No. 5, 2003.
2Bartels, R.E., Edwards, J.W.: Cryogenic Tunnel Pressure Measurements on a Supercritical Airfoil for Several Shock BuffetConditions. NASA TM-110272, 1997
3Ballmann J. (Ed.): Flow Modulation and Fluid-Structure Interaction at Airplane Wings. Notes On Numerical FluidMechanics And Multidisciplinary Design, Vol. 84, pp. 105-122, Springer, 2003
4Ozger, E., Schell, I., Jacob, D.: On the Structure and Attenuation of an Aircraft Wake. AIAA Journal of Aircraft, Vol.38, No. 5, pp. 878-887, 2001
5Moir, I.-R.M.: Measurements on a two-dimensional aerofoil with high-lift devices. AGARD-AR-303, Vol. II, 58-59, 19946Wright, M.C.N.: Half Model Testing at ETW. Technical Memorandum ETW/TM/2000028, 2000
14 of 15
American Institute of Aeronautics and Astronautics

7Wigley, D.A. (prep.): ETW Materials Guide Document, ETW/D/95005, 19968Ballmann, J., Dafnis, A.: Challenges of Nonsmooth Mechanics in Aero-Structural Dynamics, in C. C. Baniotopoulos (ed.),
Nonsmooth/Nonconvex Mechanics with Applications in Engineering, II. NNMAE 2006, Proc. Int. Conf. Tessaloniki, 06.-08.July 2006, pp. 307-314
9Ballmann, J., Dafnis, A., Brakhage, K.-H., Braun, C., Kampchen, M., Korsch, H., Reimerdes, H.-G., Olivier, H.: TheHIRENASD Elastic Wing Model and Aeroelastic Test Program in the European Transonic Windtunnel (ETW). DGLR AnnualCongress 2005, Paper DGLR-2005-064
10Braun, C., Boucke, A., Ballmann, J.: Numerical Prediction of Wing Deformation of a High Speed Transport AircraftType Wind Tunnel Model by Direct Aeroelastic Simulation. International Forum on Aeroelasticity and Structural Dynamics(IFASD) 2005, Munich, Germany, paper IF 147
11Reimer, L., Braun, C., Chen, B.H., Ballmann, J.: Computational Aeroelastic Design and Analysis of the HIRENASDWind Tunnel Wing Model and Tests. International Forum on Aeroelasticity and Structural Dynamics (IFASD) 2007, Stockholm,Sweden, paper IF 071
12Dafnis, A., Korsch, H., Buxel, C., Reimerdes, H.-G.: Dynamic Response of the HIRENASD Elastic Wing Model underWind-off and Wind-on Conditions. International Forum on Aeroelasticity and Structural Dynamics (IFASD) 2007, Stockholm,Sweden, paper IF 073
15 of 15
American Institute of Aeronautics and Astronautics


