Exel Composites in brief · EXEL COMPOSITES Annual Financial Report 2016 CEO Review | 3 CEO REVIEW...
60
Transcript of Exel Composites in brief · EXEL COMPOSITES Annual Financial Report 2016 CEO Review | 3 CEO REVIEW...

EXEL COMPOSITESAnnual Financial Report 2016
| 2
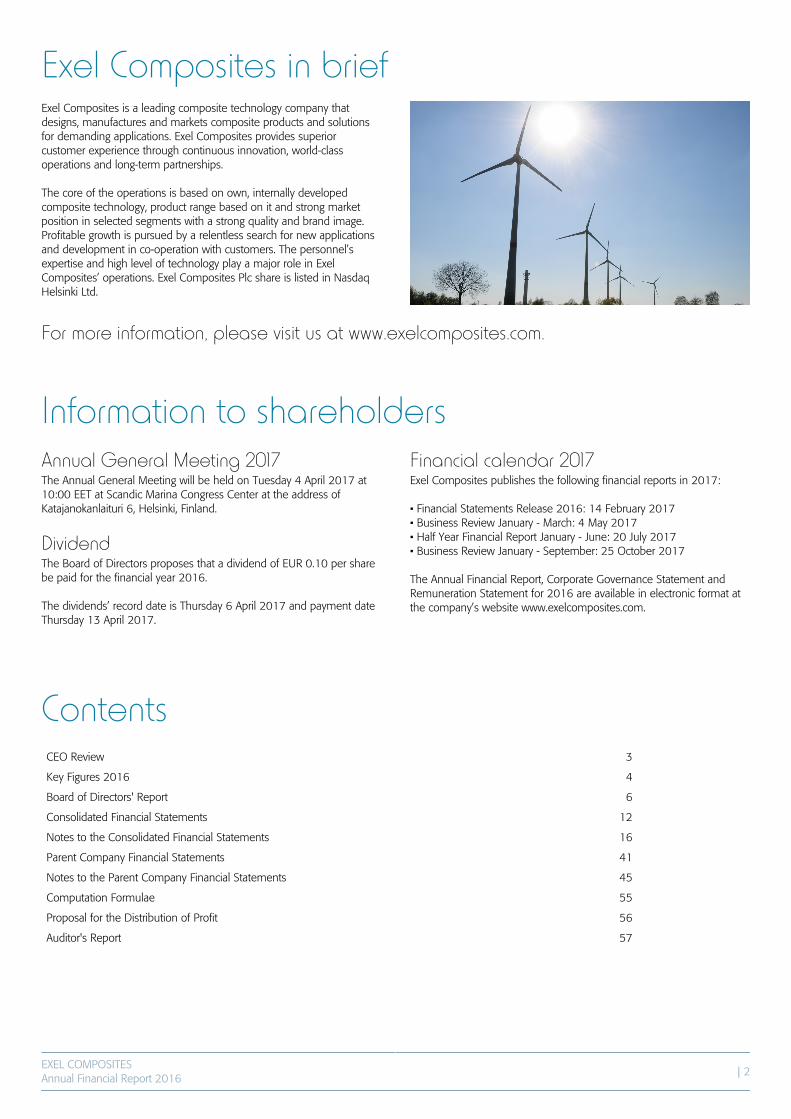
Exel Composites in briefExel Composites is a leading composite technology company thatdesigns, manufactures and markets composite products and solutionsfor demanding applications. Exel Composites provides superiorcustomer experience through continuous innovation, world-classoperations and long-term partnerships.
The core of the operations is based on own, internally developedcomposite technology, product range based on it and strong marketposition in selected segments with a strong quality and brand image.Profitable growth is pursued by a relentless search for new applicationsand development in co-operation with customers. The personnel’sexpertise and high level of technology play a major role in ExelComposites’ operations. Exel Composites Plc share is listed in NasdaqHelsinki Ltd.
For more information, please visit us at www.exelcomposites.com.
Information to shareholdersAnnual General Meeting 2017The Annual General Meeting will be held on Tuesday 4 April 2017 at10:00 EET at Scandic Marina Congress Center at the address ofKatajanokanlaituri 6, Helsinki, Finland.
DividendThe Board of Directors proposes that a dividend of EUR 0.10 per sharebe paid for the financial year 2016.
The dividends’ record date is Thursday 6 April 2017 and payment dateThursday 13 April 2017.
Financial calendar 2017Exel Composites publishes the following financial reports in 2017: • Financial Statements Release 2016: 14 February 2017• Business Review January - March: 4 May 2017• Half Year Financial Report January - June: 20 July 2017• Business Review January - September: 25 October 2017
The Annual Financial Report, Corporate Governance Statement andRemuneration Statement for 2016 are available in electronic format atthe company’s website www.exelcomposites.com.
ContentsCEO Review 3
Key Figures 2016 4
Board of Directors' Report 6
Consolidated Financial Statements 12
Notes to the Consolidated Financial Statements 16
Parent Company Financial Statements 41
Notes to the Parent Company Financial Statements 45
Computation Formulae 55
Proposal for the Distribution of Profit 56
Auditor's Report 57

EXEL COMPOSITESAnnual Financial Report 2016
CEO Review | 3
CEO REVIEW
2016 was a busy year for us at Exel Composites with a lot of actions.We have suffered from declining volumes and tough market conditions.At the same time, we have put a lot of focus and energy to newcustomer acquisition. The future is encouraging as we are in an industrywith many megatrends favoring us, be it for example urbanization,lighter and more robust construction solutions or energy efficiency. The market environment continued challenging throughout the year.Overall lower demand and toughened competition impacted some ofour key markets such as telecommunications, where sales to ExelComposites’ biggest customer dropped approximately by EUR 5 million.Additionally some end customer infrastructure projects were postponed.The new customer acquisition was not enough to compensate thedeclined volumes from some key customers, even though ‘OtherApplications’- customer industry grew by 6%. We have continuedfocused sales efforts specifically on customer industries where we seegrowth opportunities in the medium and longer term. New customerswere developed, among other, in energy, transportation andconstruction industries, where we expect volume to grow during comingyears. In general it is not found that Exel Composites’ market shares inkey customer industries would have changed compared to previousyear. In addition to better aligning our organization with the market demandand a focused approach to new business, we have continued to activelyadapt our operations to the prevailing market conditions. This involvesefficient capacity utilization and production optimization by poolingvolumes when possible and making efficiency improvements whenproduction runs are shorter and ramp up times need to be quicker.Additionally we have continued implementing the lean manufacturingprinciples further. However, these alone, were not enough and in thefirst quarter of the year we initiated additional cost savings measuresmainly impacting personnel costs. Due to these actions, our fixed coststructure has been brought to a lower level. Thus, the adjustedoperating profit in the second half of the year was at the same level asduring the same period last year, despite the fact that revenue volumewas lower and also our sales mix less favorable. To me this is a clearsign of success and demonstration of One-Exel team spirit. This willcontinue to be crucial also in the future as there is still room forimprovements.
In 2016 we have systematically continued implementing our strategy,making clear progress on our path towards being an agile, innovativeglobal composite company with world-class operations providingsuperior customer experience. This has involved work around all fivestrategic pillars – take good care of our stronghold customers, accelerategrowth in China, penetrate new applications, create a true globalfootprint and grow in new technologies. A significant milestone wasachieved in October 2016 when we announced in a separate stockexchange release the acquisition of a Chinese composites productioncompany.
The acquisition is an important step in the implementation of ourgrowth strategy and strengthens our position in China and in the APACarea. In China the megatrends are strongly driving growth andpresenting new business opportunities. In addition to expandingmanufacturing capacity, we are also expanding our local sales andproduct development network, our customer portfolio and the range ofapplications we offer to the local market. At the same, the acquisitiongives us the opportunity to improve our profitability in the Asia Pacific(APAC) region by significantly down-sizing the underperformingAustralian unit, reorganizing our operations in the region and improvingefficiency through synergies among the two Chinese units. Inconnection with the acquisition we were also able to cancel the Nanjingexpansion project. In addition, the project to expand operations inAustria that was initiated in 2015 is put on hold.
In 2017 we shall continue on our path, progressing the areas outlinedby our strategy, generating new growth and leveraging our strengthsfully. Our aim is to differentiate ourselves from our competitors byoffering a superior customer experience based on a clear valueproposition that brings competitiveness to a higher level. I am confidentand excited about the opportunities ahead for Exel and for thecomposites materials, and I am especially happy to share this journeywith all our employees and stakeholders. I would like to express mysincere thanks to all our employees for their commitment and hardwork in 2016. Also I want to thank our customers, business partnersand shareholders for your excellent collaboration and support during thetough times. I am very much looking forward to 2017! Riku KytömäkiPresident and CEO

EXEL COMPOSITESAnnual Financial Report 2016
Key Figures 2016 | 4
Key figures 2016
Revenue by customer industry, EUR million
Revenue, EUR million
Earnings per share, EUR
Revenue by region, EUR million
Adjusted operating profit, EUR million
Return on capital employed, %

EXEL COMPOSITESAnnual Financial Report 2016
| 5
CONSOLIDATED FINANCIAL STATEMENTS 2016
Contents
Board of Directors' ReportKey Indicators 2012-2016
Consolidated Financial StatementsConsolidated Comprehensive Income StatementConsolidated Statement of Financial PositionConsolidated Statement of Cash FlowsConsolidated Statement of Changes in Shareholders' Equity
Notes to the Consolited FinancialStatementsNote 1 Corporate informationNote 2 Basis of preparationNote 3 Changes in accounting policies and disclosuresNote 4 Significant accounting judgments, estimates andassumptionsNote 5 Summary of significant accounting policiesNote 6 Segment informationNote 7 Business combinationsNote 8 Exchange ratesNote 9 Other operating incomeNote 10 Other operating expensesNote 11 Employee benefit expensesNote 12 Research and development expenditureNote 13 Depreciation, amortization and impairmentNote 14 Financial incomeNote 15 Financial expensesNote 16 Income taxesNote 17 Deferred tax assets and deferred tax liabilitiesNote 18 Earnings per shareNote 19 Dividends per shareNote 20 Intangible assetsNote 21 Property, plant and equipmentNote 22 Other non-current assetsNote 23 InventoriesNote 24 Trade and other receivablesNote 25 Cash and cash equivalentsNote 26 Trade and other non-interest bearing liabilitiesNote 27 Interest bearing loans and borrowingsNote 28 Impairment testing of goodwill and intangibles withindefinite livesNote 29 Financial risk managementNote 30 Pension and other post-employment obligationsNote 31 Fair values of financial assets and liabilitiesNote 32 Contingent liabilitiesNote 33 Share capitalNote 34 Long-term compensationNote 35 Distributable funds on 31 December 2016Note 36 Cash flow from business operationsNote 37 Related-party transactionsNote 38 Events after the reporting period
611
1212131415
16
16161717
182323242424242525252526272828282930313131313233
33353637373838383940
Parent Company Financial StatementsParent Company Income StatementParent Company Balance SheetParent Company Cash Flow Statement
Notes to the Parent Company FinancialStatementsNote 1 Revenue by market areaNote 2 Personnel expensesNote 3 DepreciationNote 4 Other operating expensesNote 5 Finance income and expensesNote 6 AppropriationsNote 7 Direct taxesNote 8 Intangible and tangible assetsNote 9 Companies owned by Parent CompanyNote 10 ReceivablesNote 11 EquityNote 12 Non-current liabilitiesNote 13 Current liabilitiesNote 14 Contingent liabilitiesNote 15 Leasing, rental and other liabilitiesNote 16 Share ownershipNote 17 ShareholdersNote 18 Management interestsNote 19 Share issue and option programsNote 20 Share price and trading
Computation FormulaeProposal for the Distribution of ProfitAuditor's Report
41414244
45
4545454646464647494950505051525253535354
555657
EXEL COMPOSITESAnnual Financial Report 2016
Board of Directors' Report | 6
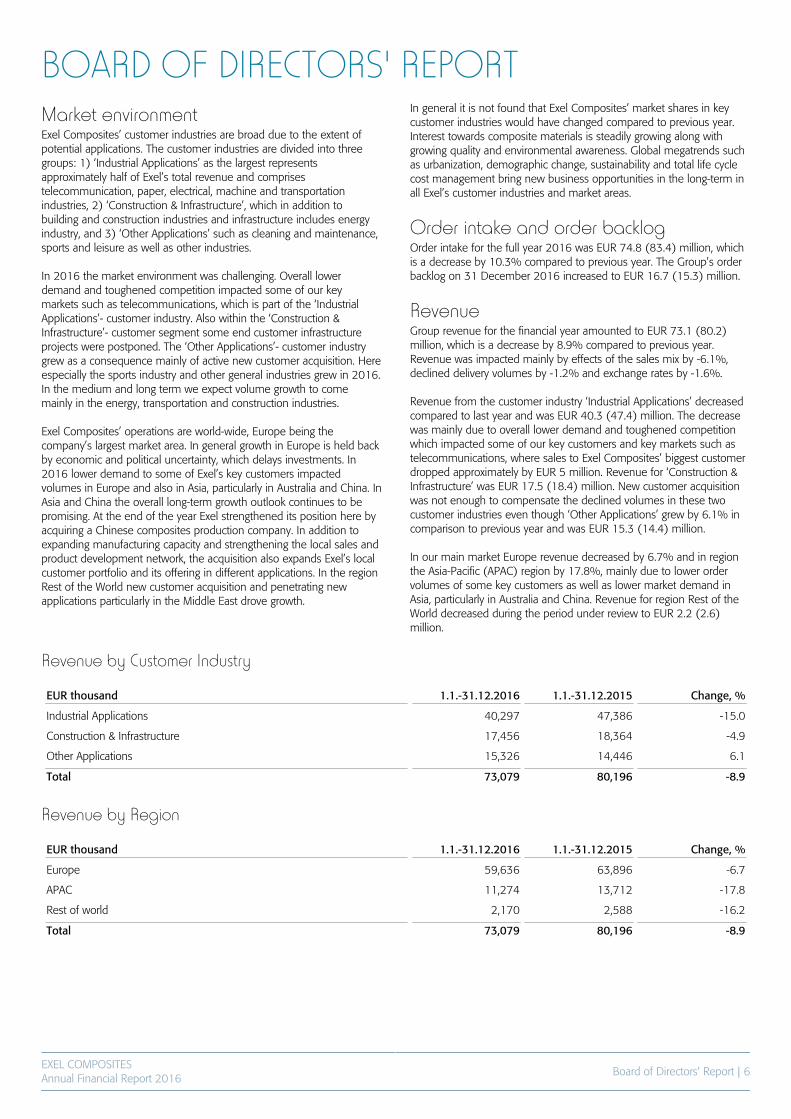
BOARD OF DIRECTORS' REPORTMarket environmentExel Composites’ customer industries are broad due to the extent ofpotential applications. The customer industries are divided into threegroups: 1) ‘Industrial Applications’ as the largest representsapproximately half of Exel’s total revenue and comprisestelecommunication, paper, electrical, machine and transportationindustries, 2) ‘Construction & Infrastructure’, which in addition tobuilding and construction industries and infrastructure includes energyindustry, and 3) ‘Other Applications’ such as cleaning and maintenance,sports and leisure as well as other industries. In 2016 the market environment was challenging. Overall lowerdemand and toughened competition impacted some of our keymarkets such as telecommunications, which is part of the ‘IndustrialApplications’- customer industry. Also within the ‘Construction &Infrastructure’- customer segment some end customer infrastructureprojects were postponed. The ‘Other Applications’- customer industrygrew as a consequence mainly of active new customer acquisition. Hereespecially the sports industry and other general industries grew in 2016.In the medium and long term we expect volume growth to comemainly in the energy, transportation and construction industries.
Exel Composites’ operations are world-wide, Europe being thecompany’s largest market area. In general growth in Europe is held backby economic and political uncertainty, which delays investments. In2016 lower demand to some of Exel’s key customers impactedvolumes in Europe and also in Asia, particularly in Australia and China. InAsia and China the overall long-term growth outlook continues to bepromising. At the end of the year Exel strengthened its position here byacquiring a Chinese composites production company. In addition toexpanding manufacturing capacity and strengthening the local sales andproduct development network, the acquisition also expands Exel’s localcustomer portfolio and its offering in different applications. In the regionRest of the World new customer acquisition and penetrating newapplications particularly in the Middle East drove growth.
In general it is not found that Exel Composites’ market shares in keycustomer industries would have changed compared to previous year.Interest towards composite materials is steadily growing along withgrowing quality and environmental awareness. Global megatrends suchas urbanization, demographic change, sustainability and total life cyclecost management bring new business opportunities in the long-term inall Exel’s customer industries and market areas.
Order intake and order backlogOrder intake for the full year 2016 was EUR 74.8 (83.4) million, whichis a decrease by 10.3% compared to previous year. The Group’s orderbacklog on 31 December 2016 increased to EUR 16.7 (15.3) million.
RevenueGroup revenue for the financial year amounted to EUR 73.1 (80.2)million, which is a decrease by 8.9% compared to previous year.Revenue was impacted mainly by effects of the sales mix by -6.1%,declined delivery volumes by -1.2% and exchange rates by -1.6%. Revenue from the customer industry ‘Industrial Applications’ decreasedcompared to last year and was EUR 40.3 (47.4) million. The decreasewas mainly due to overall lower demand and toughened competitionwhich impacted some of our key customers and key markets such astelecommunications, where sales to Exel Composites’ biggest customerdropped approximately by EUR 5 million. Revenue for ‘Construction &Infrastructure’ was EUR 17.5 (18.4) million. New customer acquisitionwas not enough to compensate the declined volumes in these twocustomer industries even though ‘Other Applications’ grew by 6.1% incomparison to previous year and was EUR 15.3 (14.4) million.
In our main market Europe revenue decreased by 6.7% and in regionthe Asia-Pacific (APAC) region by 17.8%, mainly due to lower ordervolumes of some key customers as well as lower market demand inAsia, particularly in Australia and China. Revenue for region Rest of theWorld decreased during the period under review to EUR 2.2 (2.6)million.
Revenue by Customer Industry
EUR thousand 1.1.-31.12.2016 1.1.-31.12.2015 Change, %
Industrial Applications 40,297 47,386 -15.0
Construction & Infrastructure 17,456 18,364 -4.9
Other Applications 15,326 14,446 6.1
Total 73,079 80,196 -8.9
Revenue by Region
EUR thousand 1.1.-31.12.2016 1.1.-31.12.2015 Change, %
Europe 59,636 63,896 -6.7
APAC 11,274 13,712 -17.8
Rest of world 2,170 2,588 -16.2
Total 73,079 80,196 -8.9
EXEL COMPOSITESAnnual Financial Report 2016
Board of Directors' Report | 7
Operating profitIn 2016 and compared to previous year, operating profit decreased toEUR 0.6 (4.4) million, 0.9% (5.5) of revenue. Adjusted operating profit(excluding material items affecting comparability, such as restructuringcosts, impairment losses and reversals, and costs related to planned orrealized business acquisitions or disposals) was EUR 2.6 (4.8) million,3.6% (5.9) of revenue. The impact on profitability of lower ordervolumes from some key customers and a less favorable sales mix wasreduced through cost saving measures that were initiated early in 2016and implemented throughout the year.
The downsizing of the underperforming Australian unit resulted in one-off expenses of EUR 1.5 million and costs related to the acquisition ofthe Chinese composites production company of EUR 0.5 million wererecorded in the group accounts.
The Group’s net financial expenses in 2016 were EUR 0.0 (0.2) million.The Group’s profit before taxes was EUR 0.7 (4.3) million and profitafter taxes EUR 0.2 (2.8) million.
Adjusted operating profit
EUR thousands 1.1. -31.12.2016 1.1. -31.12.2015
Operating profit 649 4,414
Restructuring costs 1,508 0
Impairment losses and reversals 0 0
Costs related to planned or realized business acquisitions and disposals 464 356
Sale of intangible and tangible assets 0 0
Expenses related to changes in legislation or legal proceedings 0 0
Adjusted operating profit 2,621 4,770
Financial positionNet cash flow from operating activities for 2016 was positive at EUR+3.1 (+3.4) million. Cash flow before financing, but after capitalexpenditure, amounted to EUR 0.0 (-1.0) million. The capitalexpenditure on fixed assets amounted to EUR 3.1 (4.3) million. Capitalexpenditure was financed with cash flow from business operations. Atthe end of the financial year, the Group’s liquid assets stood at EUR 6.9(7.9) million. Total depreciation, amortization and impairment of non-current assets during the financial year amounted to EUR 3.2 (2.9)million.
The Group’s consolidated total assets at the end of the financial yearwere EUR 53.1 (54.0) million. Interest bearing liabilities amounted toEUR 10.2 (8.5) million. Net interest bearing liabilities were EUR 3.3(0.6) million.
Equity at the end of 2016 was EUR 27.0 (30.7) million and equity ratio51.3% (57.1). The net gearing ratio was 12.2% (2.0). Fully diluted totalearnings per share were EUR 0.02 (0.24). Return on capital employedin 2016 was 1.7% (12.0). Return on equity was 0.7% (9.4). A write-offof intercompany receivables and subsidiary shares related to therestructuring of the Australian unit reduced the distributable earnings ofExel Composites by EUR 4.8 million.
The Company paid total dividends during the financial year of EUR 2.6(2.4) million. Dividend per share was EUR 0.22 (0.20).
Business development and strategyimplementationExel Composites aims to differentiate from its competitors by providinga superior customer experience that improves competitiveness and isbased on a clear value proposition. Exel’s strengths are its focus oncontinuous innovation and own internally developed compositetechnology, the high level of expertise of its employees and the
long-term partnerships. In addition being a globally local, world-wideplayer with a strong quality and brand image brings Exel competitiveedge. Exel’s strategy is based on five pillars: 1) protect and grow ourstronghold customers, 2) accelerating growth in China, 3) penetratingnew applications, 4) creating true global footprint and 5) growth in newtechnologies.
A significant strategic milestone was reached in October 2016 whenExel announced the acquisition of a Chinese composition productioncompany. The acquisition is an important step in the implementation ofExel’s growth strategy in China where megatrends such as urbanization,demographic change, as well as sustainability and total life cycle costmanagement are driving increased demand and business opportunities.In addition to expanding manufacturing capacity, Exel is expanding itslocal sales and product development network, its customer portfolio andthe range of applications to the local market. The closing of thetransaction is expected to take place during the first quarter of 2017.
The above mentioned acquisition also presented an opportunity toreorganize Exel Composites’ operations and improve profitability in theAPAC region. Increased production capacity in China is anticipated toadequately respond to the demand for advanced composites in theAPAC region that in the long term is expected to increase. Thereforeoperations in the underperforming Australian unit will be significantlydownsized. The restructuring of the Australian unit is expected toimprove Exel Composites EBIT by EUR 0.9 from 2018 onwards.
In connection to the acquisition the project to expand Exel Composites’Nanjing site in China shall be cancelled. The project to build newfacilities next to the present factory building was initiated in December2014. The profitability of Exel Composites’ Chinese business unit isexpected to improve through synergies with the acquired business.
EXEL COMPOSITESAnnual Financial Report 2016
Board of Directors' Report | 8
In 2016 we have purposefully continued executing operationalefficiency improvements across the Group for example by combiningcertain business units into one management entity. The operationalstability and flexibility to respond to fast changing demand achieved inthis way is expected to improve the combined profitability of the units.The restructurings are expected to bring growth opportunities for Exelthrough better service to customers in Central and Southern Europeamong other. The step-by-step implementation of a Group-wide ERP systemcontinues and is expected to be rolled out in all units during 2018.
Research and developmentResearch and development costs for the financial year totaled EUR 1.7(1.9) million, representing 2.4% (2.3) of revenue.
Risk managementAt Exel Composites risk management is a continuous process, which isintegrated with the daily decision making and continuous monitoring ofoperations as well as with preparation of half year financial reports,business reviews and annual financial statements. The Board of Directors governs the risk management of the Companythrough a risk management policy. In addition, the Board of Directorsmakes a risk assessment as part of the review and approval process ofeach set of half year financial reports, business reviews and annualfinancial statements. Risk factors are also considered in connection withany future guidance disclosed by the Company. The operative risk management, including risk monitoring, is part of thekey duties of the operative management. Risks are considered andevaluated in conjunction with each business decision. Additionally, theyare also monitored by the President & CEO and other groupmanagement on a monthly basis when the team reviews the businessdevelopment and any near and long-terms risks upon presentation ofthe business unit heads and controllers. Risks and uncertainties related to Exel Composites can be categorizedas strategic, operational, financial and hazard risks. Strategic risksWith respect to strategic risks, a significant portion of Exel Composites’revenues is generated from certain key clients and market segments.Whereas production capacity and cost structure of the Company isplanned for growing business volume, negative development of suchkey clients or market segments could lead to deterioration of ExelComposites’ profitability. This risk is mitigated by a close cooperationwith key clients. The development of key markets and consequentlybusiness volumes are actively followed and forecasted in order to beable to adjust our business and cost structures to the forecasts. Newproducts and applications are also continuously developed in order tolimit the dependency of any individual clients or market segments. Strategic risks also include risks related to acquisitions where therealized level of benefits and synergies may differ from the planned. Operational risksThe most significant operational risks relate to product development andsales as well as production. Exel Composites’ product range is verybroad and often customer customized, which adds complexity to theproduct development and production. Designing, producing and sellinga product that does not meet the requirements agreed with a clientcould potentially lead to substantial losses and damages. In addition,availability of skilled employees, protection of self-developed proprietarytechnology, fraud, availability and pricing of key raw
materials and health problems due to long-term exposure to chemicalsbelong to the most significant operational risks. Pre-emptivemanagement of operative risks through careful contracting as well asappropriate business processes and working instructions are in key rolesto prevent possible damages. Financial risksFinancial risks consist of currency, interest rate, liquidity and fundingrisks, as well as credit and other counter party risks. Currency andinterest rate risks are managed primarily by natural hedging or by usingderivative instruments. Credit insurance is in place to cover risks relatedto trade receivables. Hazard risksHazard risks, such as damages caused to property because of fire orchemical spill, as well as losses resulting from related businessinterruptions, are mainly covered by insurance policies. This type of risksare also regularly audited by third parties that provide recommendationsfor improvement to reduce risk probability.
Major near-term risks and uncertaintiesExel Composites’ most significant near-term business risk relates to thefact that a significant portion of revenue is generated from certain keyclients and market segments, the continued negative development ofwhich could deteriorate the company’s profitability. Furthermore, a rapidincrease of raw material prices could on the short term negativelyimpact the company’s profitability, even if in the longer term it wouldimprove the competitiveness of composite materials. The Company has recently announced an acquisition and furthercontinues the screening process of potential acquisition targets. Theacquisition prices may be based on such benefits and synergies that willnot materialize as planned.
Organization and personnelAt the end of December 2016, Exel Composites employed 455 (494)people, of whom 206 (213) in Finland and 249 (281) in othercountries. The average number of employees during the financial yearwas 479 (498).
Incentive programsExel Composites’ performance-based incentive program covers allemployees. Office employees receive a monthly salary and an annualbonus tied to the achievement of annually established goalsemphasizing growth and profitability. Production employees are alsoeligible for incentive compensation. Their annual bonus is mainly basedon productivity. The Group has long-term incentive programs for the President and CEOand the Group Management Team and selected key employees of theCompany. The aim of the programs is to combine the objectives of theshareholders and the executives in order to increase the value of theCompany, to commit the executives to the Company and to offer theexecutives a competitive reward program. The Board of Directors makesthe decision on the program annually. In February 2016 the Board of Directors of Exel Composites approved anew incentive program for the executives of the Company. The programis based on long-term monetary incentive program and is targeted atapproximately 20 executives for the earning period 2016-2018. ThePresident and CEO and the members of the Group Management Teamare included in the target group of the new incentive program. The cost of the programs will be accounted for as operating expensesduring the duration of the programs.
EXEL COMPOSITESAnnual Financial Report 2016
Board of Directors' Report | 9
Environment, health and safetyEnvironment, health and safety are high priority at Exel Composites.Environmental issues are managed using ISO 14001 standard as aguideline in all the units of the Group and the company plays a leadingrole in industry associations such as EuCIA (European CompositesIndustry Association). In 2016 we continued with preventative reporting and follow-up onoccupational health and safety, and target to further reduce, amongothers, the number of lost time incidents. The work to expand theOHSAS 18001 certification (Occupational Health and SafetyAssessment Series) in the company continued in 2016. During theyear, the business units in Belgium and the United Kingdom got theirOHSAS 18001 certificates.
Share and share performanceExel Composites’ share is listed on Nasdaq Helsinki Ltd in the Industrialssector. At the end of December 2016, Exel Composites’ share capital was EUR2,141,431.74 and the number of shares was 11,896,843 each havingthe counter-book value of EUR 0.18. There were no changes in theshare capital during the financial year. There is only one class of sharesand all shares are freely assignable under Finnish law. Exel Composites did not hold any of its own shares during the periodunder review. At the end of December 2016 the share price closed at EUR 5.02.During the financial year, the average share price was EUR 5.05, thehighest share price EUR 6.85 and the lowest share price EUR 4.71. A total of 3,080,024 shares were traded at Nasdaq Helsinki Ltd., whichrepresents 25.9% of the average number of shares. On 31 December2016 Exel Composites’ market capitalization was EUR 59.7 (77.7)million. Total shareholder return (TSR) in 2016 was -22.2% (-20.5).
Shareholders and disclosuresExel Composites had a total of 3,034 shareholders on 31 December2016. On 31 December 2016, 0.38% of the shares and votes of theCompany were owned or controlled, directly or indirectly by thePresident and CEO and the members of the Board of Directors. According to the Company’s shareholder register held by EuroclearFinland Oy, at the end of 2016 Exel Composites’ two largestshareholders were nominee registers managed by SkandinaviskaEnskilda Banken AB (19.6%) and Nordea Bank Finland Plc (14.5%). During the financial year Exel Composites received one flaggingnotification in accordance with the Finnish Securities Market Act Chapter9 Section 5 regarding changes in shareholdings.
On 2 November 2016 Exel Composites received a flagging notificationaccording to which the direct holding of SEB Investment ManagementAB exceeds 5% of the voting rights and share capital in Exel CompositesPlc. According to the notification, on 2 November SEB’s fund companyin Luxembourg turned into a branch of SEB’s Swedish fund company,SEB Investment Management AB. This means holdings that werepreviously disclosed to financial supervisory authorities separately for
each fund company, will hereinafter be disclosed solely by SEBInvestment Management AB. Thus, the change in shareholding was aconsequence of the new branch structure, and not the result of activeinvestment decisions. On 2 November 2016 the total holding of SEBInvestment Management AB amounted to 1,020,300 sharesrepresenting 8.58% of the shares and voting rights of Exel Composites. Information on the company’s shareholders is available on thecorporate website at www.exelcomposites.com.
Significant related-party transactionsNo significant related-party transactions were conducted by the Group,the permanent insiders or the company's managers in 2016.
Corporate Governance StatementExel Composites issues a Corporate Governance Statement for thefinancial year 2016 prepared in accordance to the Finnish CorporateGovernance Code issued by the Securities Market Association, effectiveas of 1 January 2016. The Corporate Governance Statement is issuedseparately from the Board of Directors’ Report. Further informationconcerning corporate governance matters is available at ExelComposites’ website at www.exelcomposites.com.
Decisions of the AGM 2016 The Annual General Meeting of Exel Composites Plc held on 17 March2016 approved the Board’s proposal to distribute a dividend of EUR0.22 per share for the financial year 2015. The dividend was paid on30 March 2016. The Annual General Meeting authorized the Board of Directors torepurchase the Company’s own shares by using unrestricted equity. Themaximum amount to be acquired is 600,000 shares. The authorizationis valid until 30 June 2017. Additional information on the AGM 2016 is available on the company’swebsite at www.exelcomposites.com.
Board of Directors and AuditorsOn 17 March 2016 the Annual General Meeting re-elected HeikkiHiltunen, Matti Hyytiäinen and Reima Kerttula as members of the Boardof Directors. Petri Helsky and Jouko Peussa were elected as newmembers of the Board of Directors. The Annual General Meetingelected Reima Kerttula as Chairman and Matti Hyytiäinen as the ViceChairman of the Board of Directors. The Annual General Meeting of Exel Composites has elected aShareholders’ Nomination Board, which nominates candidates to theAnnual General Meeting for election as Board members and proposesthe fees to be paid to the Board members. The Nomination Boardcomprised persons nominated by the four largest shareholders as of 3October 2016 as well as the Chairman of the Board of Directors actingas expert member. In 2016, the Shareholders’ Nomination Boardcomprised of Claes Murander (Lannebo Fonder AB), Ted Roberts(Nordea Asset Management) as chairman, Kalle Saariaho (OP FundManagement Company), Tuomas Virtala (Danske Invest Finland), andReima Kerttula, Chairman of the Board of Directors, as expert member.
Ernst & Young, Authorized Public Accountants, with Juha Hilmola, APA,as principal auditor, were elected to serve as company auditor in theAGM in 2016.
EXEL COMPOSITESAnnual Financial Report 2016
Board of Directors' Report | 10
The fees paid in 2016 to the external auditor for auditing Exel Groupcompanies totaled EUR 149 (190) thousand, while the fees paid fornon-audit services totaled EUR 71 (123) thousand.
Group Management TeamAt the end of the financial year the Group Management Team of ExelComposites consisted of the following persons: Riku Kytömäki(President and CEO), Mikko Kettunen (CFO), Callum Gough (SVPOperations), Tiina Hiltunen (SVP Human Resources), Kari Loukola (SVPSales and Marketing), Ilkka Silvanto (SVP Strategic Projects and LegalMatters, until 31 December 2016) and Kim Sjödahl (SVP R&D andTechnology). There were no changes to group management during thefinancial year.
Events after the review periodThe project to expand operations in Austria that was initiated in 2015 isput on hold.
Outlook for 2017Exel Composites estimates that revenue with current company structure(i.e. without the Chinese company acquisition) will increase fromprevious year level and adjusted operating profit will be higher thanprevious year level. In 2016, Exel Composites’ revenue was EUR 73.1million and adjusted operating profit was EUR 2.6 million.
Board proposal for dividend distributionExel Composites’ financial goals include distributing dividends minimum40% of the profit for the financial year as permitted by the financialstructure and growth opportunities.
On 31 December 2016 Exel Composites Plc’s distributable fundstotaled EUR 10.4 million, of which loss for the financial periodaccounted for EUR 765 thousand.
The Board has decided to propose to the Annual General Meeting thata dividend of EUR 0.10 (EUR 0.22) per share.
As a basis for its proposal, the Board of Directors has made anassessment of the Group’s financial position and ability to meet itscommitments, as well as the Group’s outlook and investmentrequirements. The Board considers the proposed dividend well-balanced given the prospects, the capital requirements and the risks ofthe Group’s business activities.
The Board of Directors has decided to propose the record date fordividends to be 6 April 2017. If the Annual General Meeting approvesthe Board’s proposal, it is estimated that the dividend will be paid on 13April 2017.
EXEL COMPOSITESAnnual Financial Report 2016
Key indicators 2012-2016 | 11
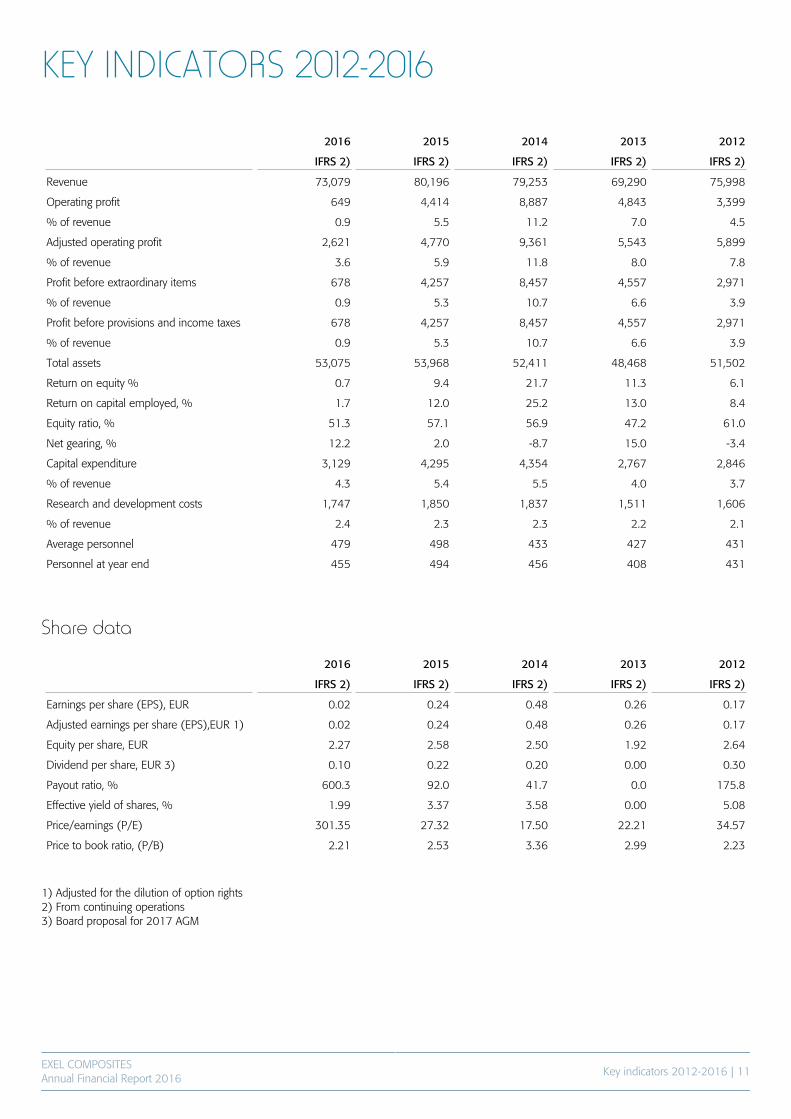
KEY INDICATORS 2012-2016
2016 2015 2014 2013 2012
IFRS 2) IFRS 2) IFRS 2) IFRS 2) IFRS 2)
Revenue 73,079 80,196 79,253 69,290 75,998
Operating profit 649 4,414 8,887 4,843 3,399
% of revenue 0.9 5.5 11.2 7.0 4.5
Adjusted operating profit 2,621 4,770 9,361 5,543 5,899
% of revenue 3.6 5.9 11.8 8.0 7.8
Profit before extraordinary items 678 4,257 8,457 4,557 2,971
% of revenue 0.9 5.3 10.7 6.6 3.9
Profit before provisions and income taxes 678 4,257 8,457 4,557 2,971
% of revenue 0.9 5.3 10.7 6.6 3.9
Total assets 53,075 53,968 52,411 48,468 51,502
Return on equity % 0.7 9.4 21.7 11.3 6.1
Return on capital employed, % 1.7 12.0 25.2 13.0 8.4
Equity ratio, % 51.3 57.1 56.9 47.2 61.0
Net gearing, % 12.2 2.0 -8.7 15.0 -3.4
Capital expenditure 3,129 4,295 4,354 2,767 2,846
% of revenue 4.3 5.4 5.5 4.0 3.7
Research and development costs 1,747 1,850 1,837 1,511 1,606
% of revenue 2.4 2.3 2.3 2.2 2.1
Average personnel 479 498 433 427 431
Personnel at year end 455 494 456 408 431
Share data
2016 2015 2014 2013 2012
IFRS 2) IFRS 2) IFRS 2) IFRS 2) IFRS 2)
Earnings per share (EPS), EUR 0.02 0.24 0.48 0.26 0.17
Adjusted earnings per share (EPS),EUR 1) 0.02 0.24 0.48 0.26 0.17
Equity per share, EUR 2.27 2.58 2.50 1.92 2.64
Dividend per share, EUR 3) 0.10 0.22 0.20 0.00 0.30
Payout ratio, % 600.3 92.0 41.7 0.0 175.8
Effective yield of shares, % 1.99 3.37 3.58 0.00 5.08
Price/earnings (P/E) 301.35 27.32 17.50 22.21 34.57
Price to book ratio, (P/B) 2.21 2.53 3.36 2.99 2.23
1) Adjusted for the dilution of option rights2) From continuing operations3) Board proposal for 2017 AGM

EXEL COMPOSITESAnnual Financial Report 2016
Consolidated Financial Statements | 12
CONSOLIDATED COMPREHENSIVE INCOMESTATEMENTFor the year ended 31 December 2016
EUR thousands Notes 1.1. -31.12.2016 1.1. -31.12.2015
Revenue 6 73,079 80,196
Other operating income 9 376 553
Increase (+) / Decrease (-) in inventories of finished goods and work inprogress
-256 -23
Materials and services -28,742 -29,979
Employee benefit expenses 11 -22,952 -25,280
Depreciation 13 -3,015 -2,894
Amortization 13 -228 -9
Other operating expenses 10,12 -17,613 -18,151
Operating profit 649 4,414
Financial income 14 423 599
Financial expenses 15 -394 -757
Profit before tax 678 4,257
Income taxes 16 -480 -1,413
Profit/loss for the period 198 2,844
Other comprehensive income to be reclassified to profit or loss insubsequent periods:
Exchange differences on translating foreign operations 16 -1,244 492
Income tax relating to components of other comprehensive income 0 0
Other comprehensive income to be reclassified to profit or loss insubsequent periods, net of tax:
-1,244 492
Items that will not be reclassified to profit or loss:
Defined benefit plan actuarial gains (+) / losses (-), net of tax 16 -40 51
Total comprehensive income -1,086 3,387
Profit/loss attributable to:
Equity holders of the parent company 198 2,844
Comprehensive income attributable to:
Equity holders of the parent company -1,086 3,387
Total earnings per share, basic and diluted, EUR 18 0.02 0.24
EXEL COMPOSITESAnnual Financial Report 2016
Consolidated Financial Statements| 13
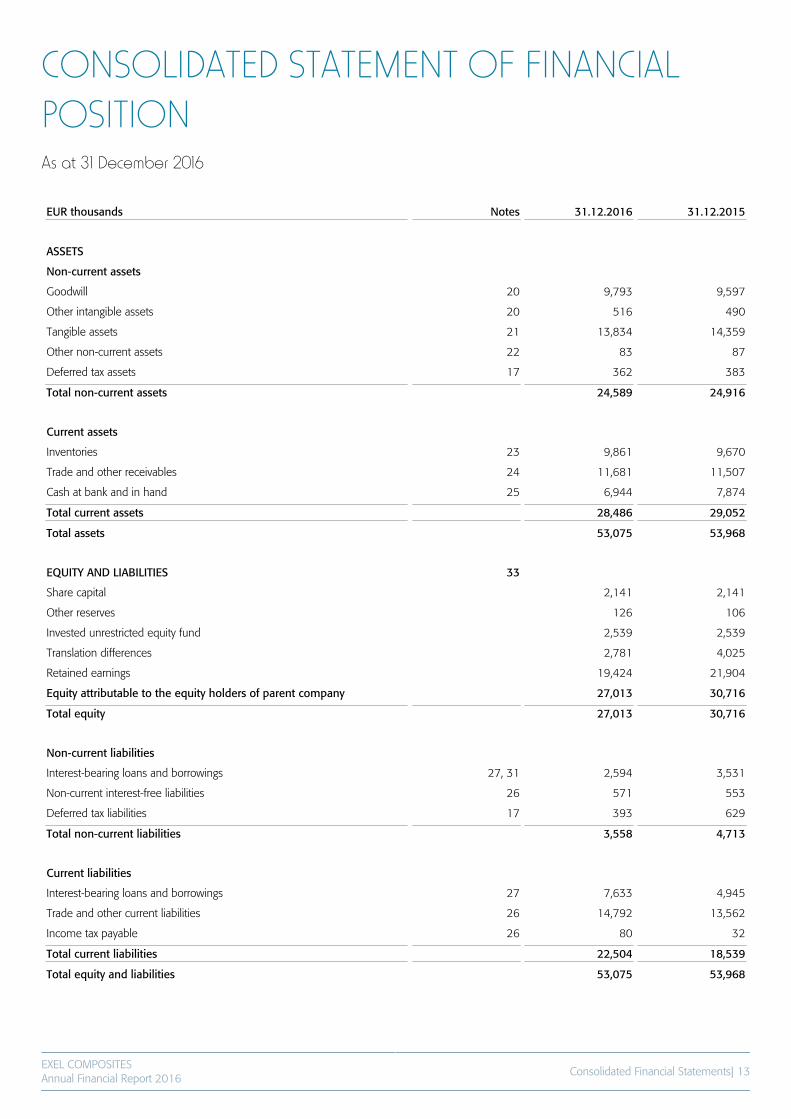
CONSOLIDATED STATEMENT OF FINANCIALPOSITIONAs at 31 December 2016
EUR thousands Notes 31.12.2016 31.12.2015
ASSETS
Non-current assets
Goodwill 20 9,793 9,597
Other intangible assets 20 516 490
Tangible assets 21 13,834 14,359
Other non-current assets 22 83 87
Deferred tax assets 17 362 383
Total non-current assets 24,589 24,916
Current assets
Inventories 23 9,861 9,670
Trade and other receivables 24 11,681 11,507
Cash at bank and in hand 25 6,944 7,874
Total current assets 28,486 29,052
Total assets 53,075 53,968
EQUITY AND LIABILITIES 33
Share capital 2,141 2,141
Other reserves 126 106
Invested unrestricted equity fund 2,539 2,539
Translation differences 2,781 4,025
Retained earnings 19,424 21,904
Equity attributable to the equity holders of parent company 27,013 30,716
Total equity 27,013 30,716
Non-current liabilities
Interest-bearing loans and borrowings 27, 31 2,594 3,531
Non-current interest-free liabilities 26 571 553
Deferred tax liabilities 17 393 629
Total non-current liabilities 3,558 4,713
Current liabilities
Interest-bearing loans and borrowings 27 7,633 4,945
Trade and other current liabilities 26 14,792 13,562
Income tax payable 26 80 32
Total current liabilities 22,504 18,539
Total equity and liabilities 53,075 53,968

EXEL COMPOSITESAnnual Financial Report 2016
Consolidated Financial Statements| 14
CONSOLIDATED STATEMENT OF CASH FLOWSFor the year ended 31 December 2016
EUR thousands Notes 1.1.-31.12.2016 1.1.-31.12.2015
Cash flow from operating activities
Profit for the period 198 2,844
Non-cash adjustments to reconcile profit to net cash flow 36 2,539 5,207
Change in working capital 998 -2,271
Cash flow generated by operations 3,735 5,780
Interest paid -97 -80
Interest received 10 52
Other financial items -131 -218
Income taxes paid -388 -2,149
Net cash flow from operating activities 3,129 3,385
Cash flow from investing activities
Purchase of non-current assets -3,129 -4,295
Proceeds from sale of non-current assets 0 0
Net cash flow from investing activities -3,129 -4,295
Cash flow before financing activities 0 -910
Cash flow from financing activities
Proceeds from long-term borrowings 0 0
Repayments of long-term borrowings -1,000 -1,000
Change in short-term loans 2,687 3,945
Repayments of finance lease liabilities 0 0
Additional capital repayment 0 0
Dividends paid -2,617 -2,379
Net cash flow from financing activities -930 566
Change in liquid funds -930 -344
Liquid funds at the beginning of period 7,874 8,218
Liquid funds at the end of period 6,944 7,874
EXEL COMPOSITESAnnual Financial Report 2016
Consolidated Financial Statements| 15
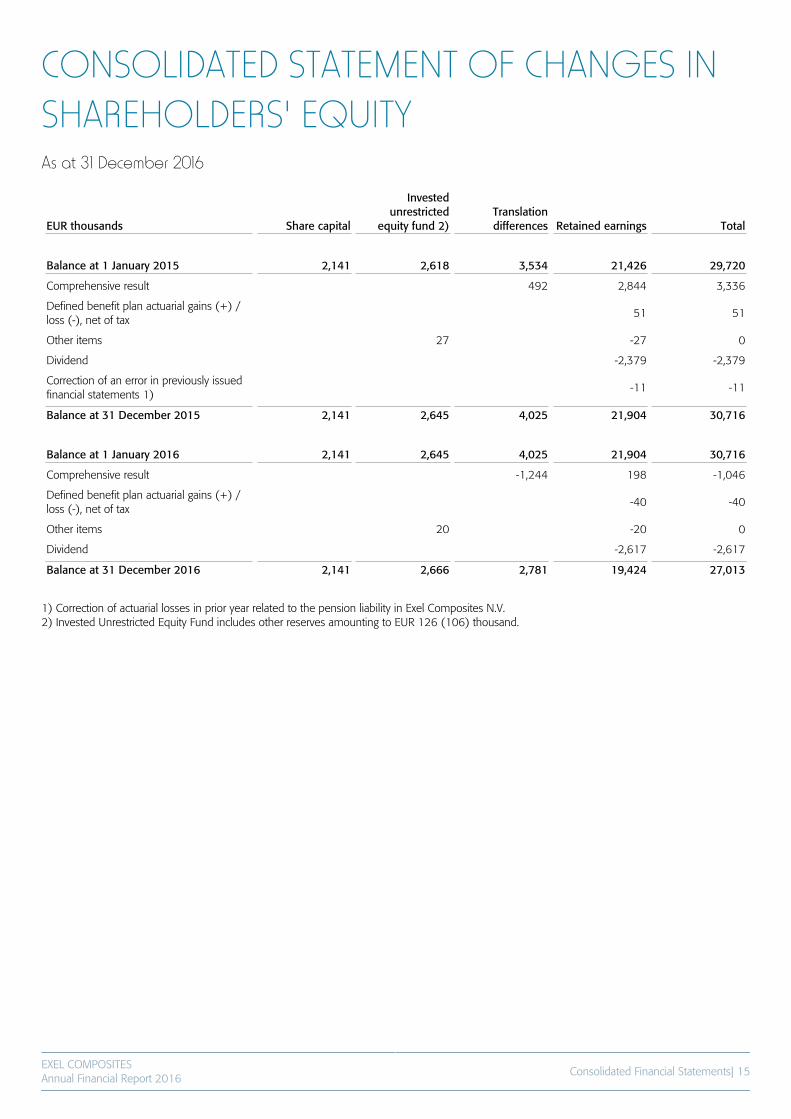
CONSOLIDATED STATEMENT OF CHANGES INSHAREHOLDERS' EQUITYAs at 31 December 2016
EUR thousands Share capital
Investedunrestricted
equity fund 2)Translationdifferences Retained earnings Total
Balance at 1 January 2015 2,141 2,618 3,534 21,426 29,720
Comprehensive result 492 2,844 3,336
Defined benefit plan actuarial gains (+) /loss (-), net of tax
51 51
Other items 27 -27 0
Dividend -2,379 -2,379
Correction of an error in previously issuedfinancial statements 1)
-11 -11
Balance at 31 December 2015 2,141 2,645 4,025 21,904 30,716
Balance at 1 January 2016 2,141 2,645 4,025 21,904 30,716
Comprehensive result -1,244 198 -1,046
Defined benefit plan actuarial gains (+) /loss (-), net of tax
-40 -40
Other items 20 -20 0
Dividend -2,617 -2,617
Balance at 31 December 2016 2,141 2,666 2,781 19,424 27,013
1) Correction of actuarial losses in prior year related to the pension liability in Exel Composites N.V.2) Invested Unrestricted Equity Fund includes other reserves amounting to EUR 126 (106) thousand.
EXEL COMPOSITESAnnual Financial Report 2016
Notes to the Consolidated Financial Statements | 16
NOTES TO THE CONSOLIDATED FINANCIALSTATEMENTS(All figures in EUR thousands unless otherwise stated)
The consolidated financial statements of Exel Composites Plc for the year ended 31 December 2016 were authorized for issue in accordance with aresolution of the Board of Directors on 13 February 2017. Final decision to adopt or reject the financial statements is made by shareholders in AnnualGeneral Meeting on 4 April 2017.
NOTE 1 CORPORATE INFORMATIONExel Composites is a leading composite technology company thatdesigns, manufactures and markets composite products and solutionsfor demanding applications. Exel Composites provides superiorcustomer experience through continuous innovation, world-classoperations and long-term partnerships.
The core of the operations is based on proprietary, internally developedcomposite technology, product range based on it and a strong marketposition in selected segments with a strong quality and brand image.Profitable growth is pursued by a relentless search for new applications
and development in co-operation with customers. The personnel'sexpertise and high level of technology play a major role in ExelComposites’ operations.
The Group’s factories are located in Australia, Austria, Belgium, China,Finland, Germany and the United Kingdom. Exel Composites share islisted in the Small Cap segment of the Nasdaq Helsinki Ltd. in theIndustrials sector. Exel Composites Plc is domiciled in Mäntyharju,Finland and its registered address is Uutelantie 24 B, 52700Mäntyharju, Finland.
NOTE 2 BASIS OF PREPARATIONThe consolidated financial statements have been prepared on ahistorical cost basis, with the exception of available-for-sale investmentsecurities and certain other financial assets and financial liabilities thathave been measured at fair value. The consolidated financial statements are presented in euros and allvalues are rounded to the nearest thousand except where otherwiseindicated.
Statement of ComplianceThe consolidated financial statements of Exel Composites have beenprepared in compliance with International Financial Reporting Standards(IFRS), applying IAS and IFRS standards, as well as SIC and IFRICinterpretations, valid on 31 December 2016. The notes to theconsolidated financial statements are also in compliance with theFinnish Accounting and Companies Acts.
Basis of ConsolidationExel Composites’ consolidated financial statements include the accountsof the parent company Exel Composites Plc and its subsidiaries as at 31December each year. Subsidiaries are viewed as companies in which itowns, directly or indirectly, over 50 per cent of the voting rights or inwhich it is in a position to govern the financial and operating policies ofthe entity. Subsidiaries are fully consolidated from the date that ExelComposites acquired control and are no longer consolidated from thedate that control ceases. Where necessary, the accounting principles ofsubsidiaries have been changed to ensure consistency with theaccounting principles of the Group. The financial statements of thesubsidiaries are prepared for the same reporting period as the parentcompany, using consistent accounting policies.
Acquisitions of companies are accounted for using the purchasemethod. The cost of an acquisition is measured at fair value over theassets given up, shares issued or liabilities incurred or assumed at thedate of acquisition. The excess acquisition cost over the fair value of netassets acquired is recognized as goodwill. All intra-group balances, income and expenses, unrealized gains andlosses and dividends resulting from intra-group transactions areeliminated in full. If the Group loses control over a subsidiary, it:
• Derecognizes the assets and liabilities of the subsidiary;• Derecognizes the carrying amount of non-controlling interest;• Derecognizes the cumulative translation differences, recorded inequity;• Recognizes the fair value of the consideration received;• Recognizes the fair value of any investment retained;• Recognizes any surplus or deficit in profit or loss: and• Reclassifies the parent’s share of components previously recognized inother comprehensive income to profit or loss. When compiling the opening IFRS balance sheet, Exel Composites hasapplied the exemption provided by IFRS 1 related to businesscombinations. This means that the assets and liabilities of subsidiarieshave not been assessed retroactively at their market value. Instead, theyhave been included in the balance sheet on the transition date in anamount in accordance with earlier financial accounting practice. TheGroup has no affiliated companies or joint ventures.
Non-controlling interest is deducted from shareholders’ equity andpresented as a separate item in the balance sheet. Similarly, it ispresented as a separate item in the consolidated financial statements.The share of losses attributable to the holders of non-controlling interestwas debited to non-controlling interest in the consolidated balancesheet up to the full value of the non-controlling interest prior to 1January 2010. The Group had no non-controlling interests in 2016 and2015.
EXEL COMPOSITESAnnual Financial Report 2016
Notes to the Consolidated Financial Statements | 17
NOTE 3 CHANGES IN ACCOUNTING POLICIES ANS DISCLOSURESThe accounting policies adopted are consistent with those of theprevious financial year.
The standards and standard amendments that are issued, but noteffective, up to the date of issuance of the Group’s financial statementsare listed below. The Group intends to adopt these standards andamendments, if applicable, when they become effective. Based onpreliminary analysis, the standards are not expected to materially impacton the Group’s financial statements.
New standards• IFRS 9 Financial Instruments• IFRS 15 Revenue from Contracts with Customers• IFRS 16 Leases
Amendments to standards• IFRS 10 and IAS 28 Sale or Contribution of Assets between an Investorand its Associate or Joint Venture• IAS 12 Recognition of Deferred Tax Assets for Unrealised Losses• IFRS 2 Classification and Measurement of Share-based PaymentTransactions• IFRS 4 Applying IFRS 9 Financial Instruments with IFRS 4 InsuranceContracts
IFRS 15 Revenue from Contracts with CustomersIFRS 15 Revenue from Contracts with Customers will be effective for thereporting periods beginning on 1 January 2018 or later. The newstandard defines a five-step model to recognize revenue based on
contracts with customers. IFRS 15 will replace the current standards IAS18 and IAS 11 as well as their interpretations.
Based on preliminary analysis the new standard is not expected to havea material impact on the Group’s current revenue recognition. Customercan benefit from each composite product sold by the Group on its ownor together with other resources readily available to the customer. Soldgoods and their prices have been identified in customer contracts,deliveries are based on the customer’s purchase orders and eachsupplied quantity is invoiced separately. There is no significant financingcomponent included in the transaction prices. Some of the customercontracts include a variable consideration in the form of volume basedrebate. The effect of the variable consideration on the transaction priceis taken into account in revenue recognition. The performanceobligation is satisfied when the goods have been delivered to thecustomer according to the agreed delivery terms. In most cases thishappens when the goods leave the factory.
IFRS 16 LeasesIFRS 16 Leases will be effective for the reporting periods beginning on 1January 2019 or later, if approved by the European Union. According tothe new standard, the lessee will recognize assets and liabilities for therights and obligations created by leases.
When adapting IFRS 16, the portion of the lease payments currentlyincluded in other operating expenses in the consolidated incomestatement will be transferred to depreciations and amortizations and theportion of interest to the financial expenses. Also balance sheet totalswill be affected, leading to some changes in key financial indicators. TheGroup is currently assessing the impact of IFRS 16.
NOTE 4 SIGNIFICANT ACCOUNTING JUDGEMENTS, ESTIMATES AND ASSUMPTIONSThe preparation of the Group’s consolidated financial statements mayrequire the use of judgments, estimates and assumptions that affect thereported amounts of assets and liabilities and the disclosure ofcontingent assets and liabilities at the end of the reported period andthe reported amounts of revenues and expenses during the reportingperiod. Although these estimates are based on management’s bestknowledge of current events and actions, actual results may ultimatelydiffer from those estimates. The preparation of impairment testsrequires the use of estimates.
JudgmentsThe Group has entered into commercial property leases. The Group hasdetermined, based on an evaluation of the terms and conditions of thearrangements, that it retains all the significant risks and rewards ofownership of these properties and so accounts for the contracts asfinancial leases.
Estimates and assumptionsThe key assumptions concerning the future and other key sources ofestimation uncertainty at the balance sheet date, that have a significantrisk of causing a material adjustment to the carrying amounts of assetsand liabilities within the next financial year are discussed below. Impairment of non-financial assetsThe Group assesses whether there are any indicators of impairment forall non-financial assets at each reporting date. Goodwill and other
times when such indicators exist. Other non-financial assets are testedfor impairment when there are indicators that the carrying amounts maynot be recoverable.
When calculations of impairment of non-financial assets are undertaken,management must estimate the expected future cash flows from theasset or cash-generating unit and choose a suitable discount rate inorder to calculate the present value of those cash flows. Further details,including sensitivity analysis of key assumptions, are given in Note 28.
Deferred tax assetsDeferred tax assets are recognized for all unused tax losses to the extentthat it is probable that taxable profit will be available against which thelosses can be utilized. Significant management judgment is required todetermine the amount of deferred tax assets that can be recognized,based on the likely timing and level of future taxable profits togetherwith the future tax planning strategies. Further details are given in Note17. Pension and other post-employment benefitsThe cost of defined benefit pension plans is determined using actuarialvaluations. The actuarial valuation involves making assumptions aboutdiscount rates, expected rates of return on assets, future salaryincreases, mortality rates and future pension increases. Due to the long-term nature of these plans, such estimates are subject to significantuncertainty.
EXEL COMPOSITESAnnual Financial Report 2016
Notes to the Consolidated Financial Statements | 18
Determining the fair value of assets in business combinationsIn major corporate mergers the Group has employed the services of anoutside advisor in assessing the fair value of tangible assets. For tangibleassets comparisons have been made with the market prices of similarassets and an estimate made about impairment caused by
the acquired asset’s age, wear and other related factors. Thedetermination of the fair value of tangible assets is based on estimatesof cash flows related to the asset.
NOTE 5 SUMMARY OF SIGNIFICANT ACCOUNTING POLICIES
Business combinations and goodwillBusiness combinations from 1 January 2009Business combinations are accounted for using the acquisition method.The cost of an acquisition is measured as the aggregate of theconsideration transferred, measured at acquisition date fair value andthe amount of any non-controlling interest in the acquiree. For eachbusiness combination, the acquirer measures the non-controllinginterest in the acquiree either at fair value or at the proportionate shareof the acquiree’s identifiable net assets. Acquisitions costs incurred areexpensed. When the Group acquires a business, it assesses the assets andliabilities assumed for appropriate classification and designation inaccordance with the contractual terms, economic circumstances andpertinent conditions at the acquisition date. Goodwill is initially measured at cost being the excess of theconsideration transferred over the Group’s net identifiable assetsacquired and liabilities assumed. If the consideration is lower than thefair value of the net assets of the subsidiary acquired, the difference isrecognized in profit or loss. After initial recognition, goodwill is measured at cost less anyaccumulated impairment losses. For the purpose of impairment testing,goodwill acquired is allocated to each of the Group’s cash generatingunits.
Business combinations prior to 31 December 2008In comparison to the above mentioned requirements, the followingdifferences applied: Business combinations were accounted for using the purchase method.Transaction costs directly attributable to the acquisition formed part ofthe acquisition costs. The non-controlling interest (formerly known asminority interest) was measured at the proportionate share of theacquiree’s identifiable assets. The Group does not have any associates or joint ventures.
Non-current assets held for sale and discontinuedoperationsNon-current assets and disposal groups classified as held for sale aremeasured at the lower of carrying amount and fair value less costs tosell. Non-current assets and disposal groups are classified as held forsale if their carrying amounts will be recovered through a saletransaction rather than through continuing use. This condition isregarded as met only when the sale is highly probable and the asset ordisposal group is available for immediate sale in its present condition.Management must be committed to the sale, which should be expectedto qualify for recognition as a completed sale within one year from thedate of classification. Property, plant and equipment and intangible assets once classified asheld for sale are not depreciated or amortized.
Revenue recognitionRevenue is recognized to the extent that it is probable that theeconomic benefits will flow to the Group and the revenue can bereliably measured. Sales of products are recognized as income once therisk and benefits related to ownership of the sold products have beentransferred to the buyer and the Group no longer has the possession of,or control over, the products. Sales of services are recognized as incomeonce the service has been rendered. Revenue arising from projectslasting over 12 months and having a material impact on the Group’sfinancial position and performance is recognized in accordance with IASstandard 11. Revenue comprises the invoiced value for the sale of goods andservices net of indirect taxes, sales adjustment and exchange ratedifferences. Distribution costs for products to be sold are included in theincome statement as other operating expenses. Interest income isrecognized using the effective interest rate method and dividendincome when the right to the dividend has been created.
Foreign currency translationThe Group’s consolidated financial statements are presented in euros,which is also the parent company’s functional currency. Each entity inthe Group determines its own functional currency and items included inthe financial statements of each entity are measured using thatfunctional currency. The Group has elected to recycle the gain or lossthat arises from the direct method of consolidation, which is themethod the Group uses to complete its consolidation. The income statements of independent foreign subsidiaries aretranslated into euros at the average exchange rates for the financial yearand the assets and liabilities are translated at the exchange rate of thebalance sheet date. Exchange differences arising on the translation arerecognized in other comprehensive income. When a foreign operation issold, the component of other comprehensive income relating to thatparticular foreign operation is recognized in the income statement. Any goodwill arising from the acquisition of a foreign entity subsequentto 1 January 2005 and any fair value adjustments to the carryingamounts of assets and liabilities are treated as assets and liabilities ofthe foreign entity and translated at the closing rate. Transactions in foreign currencies are initially recorded by the Groupentities at their respective functional currency rates prevailing at the dateof the transaction. Monetary assets and liabilities denominated in foreigncurrencies are retranslated at the functional currency spot rate ofexchange ruling at the reporting date.
Non-monetary items measured at fair value in a foreign currency aretranslated using the exchange rates at the date when the fair value isdetermined. Other non-monetary items that are measured in the termsof historical cost in the foreign currency are translated using theexchange rates at the dates of the initial transaction.
Foreign currency exchange gains and losses related to businessoperations and translating monetary items have been entered in theincome statement. Foreign exchange differences from businessoperations are included in other items above profit for the year. Foreignexchange differences from foreign currency loans and cash at bank areincluded in financial items.

EXEL COMPOSITESAnnual Financial Report 2016
Notes to the Consolidated Financial Statements | 19
Intangible assetsIntangible assets acquired separately are measured on initial recognitionat cost. The cost of intangible assets acquired in a business combinationis its fair value at the date of acquisition. Following initial recognition,intangible assets are carried at cost less any accumulated amortizationand any accumulated impairment losses. Internally generated intangibleassets, excluding capitalized development costs, are not capitalized andexpenditure is reflected in the income statement in the year in whichthe expenditure is incurred. The useful life of intangible assets is either finite or indefinite. Intangible assets with finite lives are amortized over the useful life andassessed for impairment whenever there is indication that the intangibleasset may be impaired. Intangible assets are amortized on a straight-line basis over theirestimated useful lives as follows: • Development costs 3-5 years• Other long-term costs 3-8 years• Other intangible assets 3-8 years• Customer relationships 10 years
Intangible assets with indefinite useful lives are not amortized but aretested for impairment annually, either individually or at the cashgenerating unit level.
Research and developmentResearch costs are expensed as incurred. Costs incurred fromdevelopment projects, which are often connected with the design andtesting of new or advanced products, are recorded in the balance sheetas intangible assets from the time that the product can be technicallyachieved, it can be utilized commercially, and the product is expected tocreate a comparable financial benefit. Other development costs arerecorded as expenses. Capitalized development costs are amortized ona straight-line basis beginning from the commercial production of theproduct during the period they are effective, yet no longer than fiveyears. There were no capitalized development costs during 2016 and2015.
Computer softwareCosts associated with the development and maintenance of computersoftware are generally recorded as expenses. Costs that improve orexpand the performance of computer software to the extent that theperformance is higher than originally is considered as a property itemimprovement and is added to the original acquisition cost of thesoftware. Activated computer software development costs are expensedand amortized on a straight-line basis during the period they arefinancially effective.
Other intangible assetsThe acquisition costs of patents, trademarks and licenses are capitalizedin intangible assets and depreciated on a straight-line basis during theiruseful lives.
Property, plant and equipmentProperty, plant and equipment is stated in the balance sheet at historicalcost less accumulated straight-line depreciation according to theexpected useful life, benefits received, and any impairment losses.
Planned depreciation is calculated on a straight-line basis to write off theacquisition cost of each fixed asset up to its residual value over theasset’s expected useful life. Land areas are not depreciated. For othertangible fixed assets, depreciation is calculated according to thefollowing expected useful lives: • Buildings 5-20 years• Machinery 5-15 years• Equipment 3-5 years
If the book value of an asset item exceeds the estimated amountrecoverable in the future, its book value is adjusted immediately tocorrespond with the amount recoverable in the future. Routine maintenance and repair expenditure is recognized as anexpense. Expenditure on significant modernization and improvementprojects are recognized in the balance sheet if they are likely to increasethe future economic benefits embodied in the specific asset to whichthey relate. Modernization and improvement projects are depreciatedon a straight-line basis over their expected useful lives. Depreciation on tangible fixed assets is discontinued when a tangiblefixed asset meets the criteria of “held-for-sale” according to IFRS 5 ”Non-current Assets Held for Sale and Discontinued Operations”. Gains or losses on disposal or decommissioning of tangible fixed assetsare calculated as the difference of the net proceeds obtained and thebalance sheet value. Capital gains and losses are included in theincome statement in the item operating profit.
Government grantsGovernment grants are recognized where there is reasonable assurancethat the grant will be received and all attaching conditions will becomplied with. When the grant relates to an expense item, it isrecognized as an income over the period necessary to match the granton a systematic basis to the costs that it is intended to compensate.Where the grant relates to an asset, it is recognized as deferred incomeand released to the income statement over the expected useful life ofthe relevant asset by equal annual installments.
Borrowing costsBorrowing costs directly attributable to the acquisition, construction orproduction of an asset that necessarily takes a substantial period of timeto get ready for its intended use or sale are capitalized as part of thecost of the respective assets. All other borrowing costs are expensed inthe period they occur. Borrowing costs consist of interest and othercosts that an entity occurs in connection with the borrowing of funds.For the years ending 31 December 2016 and 2015, the Group had noassets where the borrowing costs would have been capitalized.
Financial assetsFinancial assets are classified within the scope of IAS 39 as financialassets at fair value through profit or loss, loans and receivables, held-to-maturity investments, available-for-sale investments, or as derivativesdesignated as hedging instruments in an effective hedge, as appropriate.The Group determines the classification of its financial assets at initialrecognition.
All financial assets are recognized initially at fair value plus, in the case ofinvestments not at fair value through profit or loss, directly attributabletransaction costs.
EXEL COMPOSITESAnnual Financial Report 2016
Notes to the Consolidated Financial Statements | 20
The Group’s financial assets include cash and short-term deposits, tradeand other receivables, quoted and unquoted financial instruments, andderivative financial instruments. “Financial assets at fair value through profit or loss” is divided into twosubcategories: held-for-trading assets and designated items. The latterincludes any financial asset that is designated on initial recognition asone to be measured at fair value with fair value changes in profit or loss.Held-for-trading financial assets have primarily been acquired for thepurpose of generating profits from changes in market prices over theshort term. Derivatives that do not meet the criteria for hedgeaccounting have been classified as being held for trading. Held-for-trading financial assets and those maturing within 12 months areincluded in current assets. The items in this group are measured at fairvalue. The fair value of all the investments in this group has beendetermined on the basis of price quotations in well-functioning markets.Both realized and unrealized gains and losses due to changes in fairvalue are recorded in the income statement in the financial period inwhich they were incurred. Loans and receivables are non-derivative financial assets with fixed ordeterminable payments, originated or acquired, that are not quoted inan active market, not held for trading, and not designated on initialrecognition as assets at fair value through profit or loss or as held-for-sale. Loans and receivables are measured at amortized cost. They areincluded in the statement of financial position under trade receivablesand other receivables as either current or non-current assets accordingto their nature; they are considered non-current assets if they matureafter more than 12 months. The losses arising from impairment arerecognized in the income statement in finance costs. “Held-to-maturity financial assets” include non-derivative financial assetswith fixed or determinable payments and fixed maturities when theGroup has the positive intention and ability to hold them to maturity.After initial measurement held-to-maturity investments are measured atamortized cost using the effective interest method, less impairment. TheGroup did not have any held-to-maturity investments during the yearsended 31 December 2016 and 2015. “Available-for-sale investments” include equity and debt securities.Equity investments classified as available-for-sale are those, which areneither classified as held for trading nor designated at fair value throughprofit or loss. Debt securities in this category are those which areintended to be held for an indefinite period of time and which may besold in response to needs for liquidity or in response to changes in themarket conditions. After initial measurement, available-for-saleinvestments are subsequently measured at fair value with unrealizedgains or losses recognized as other comprehensive income in theavailable-for-sale reserve until the investment is derecognized, at whichtime the cumulative gain or loss is recognized in other operatingincome, or determined to be impaired, at which time the cumulativeloss Is recognized in the income statement in finance costs andremoved from the available-for-sale reserve. A financial asset is derecognized when:• The rights to receive cash flows from the asset have expired• The Group has transferred its rights to receive cash flows from theasset or has assumed an obligation to pay received cash flows in fullwithout material delay to a third party under a pass-througharrangement.
Cash and short-term depositsCash and short-term deposits in the statement of financial positioncomprise cash at banks and in hand and short-term deposits with anoriginal maturity of three months and less. Credit accounts connectedwith Group accounts are included in current interest-bearing liabilitiesand are presented as net amounts, as the Group has a legal contractualright of set-off to make payment or otherwise eliminate the amountowed to creditors either in whole or in part. Cash and cash equivalents are recorded at the original amount in thestatement of financial position.
Financial liabilitiesFinancial liabilities within the scope of IAS 39 are classified as financialliabilities at fair value through profit or loss, loans and borrowings, or asderivatives designated as hedging instruments in an effective hedge, asappropriate. The Group determines the classification of its financialliabilities at initial recognition. All financial liabilities are initiallyrecognized at fair value and in the case of loans and borrowings, plusdirectly attributable transaction costs. The Group’s financial liabilitiesinclude trade and other payables, bank overdrafts, loans and borrowingsand derivative financial instruments.
Finance lease liabilities are initially recognized at fair value. All financialliabilities, excluding derivative liabilities, are later valued at amortizedcost using the effective interest rate method. Financial liabilities areincluded in non-current and current liabilities, and they may be eitherinterest-bearing or non-interest-bearing.
Derivative financial instruments and hedgingDerivative contracts are recorded initially as an acquisition cost equal totheir fair value. Following their acquisition derivative contracts are valuedaccording to their fair value.
Profits and losses that are generated from the valuation of fair value arerecorded according to the intended use of the derivative contract. TheGroup does not apply hedge accounting as described by IAS 39. As aresult, all value changes are recognized in profit or loss. The Group hasentered into interest rate swap agreements to convert non-currentfloating rate financial liabilities to fixed interest rates. Derivative financialinstruments are presented in Section 31 of the Notes. Derivatives arerecorded in the balance sheet as accrued expenses and deferredincome.
Hedges for net investments in foreign units are recorded in the sameway as cash-flow hedges. A hedge on a foreign subsidiary’s equity isrecorded in shareholders’ equity in the same way as the exchange ratedifference in shareholders’ equity. The Group did not hedge its netforeign investments exposure during 2016 or 2015.
Impairment of non-financial assetsAt each reporting date, the Group evaluates whether there areindications of impairment in any asset item. If impairment is indicated,the recoverable amount of the asset is estimated. An asset’s recoverableamount is the higher of an asset’s or cash-generating unit’s (CGU) fairvalue less costs to sell and its value in use and is determined for anindividual asset, unless asset does not generate cash inflows that arelargely independent of those from other assets or group of assets.Where the carrying amount of an asset or CGU exceeds its recoverableamount, the asset is considered impaired and is written down to itsrecoverable amount.
EXEL COMPOSITESAnnual Financial Report 2016
Notes to the Consolidated Financial Statements | 21
In addition, the recoverable amount is assessed annually for thefollowing items regardless of whether there are indications ofimpairment: goodwill; intangible assets that have an unlimitedeconomic lifespan; and assets under construction. Impairment losses of continuing operations are recognized immediatelyin the income statement in those expense categories consistent withthe function of the impaired asset.
Impairment of financial assetsThe Group assesses on each reporting date whether there is anyobjective evidence that a financial asset or group of financial assets isimpaired. A financial asset is deemed to be impaired if, and only if,there is objective evidence of impairment as a result of one or moreevents that has occurred after the initial recognition of the asset and thatloss event has an impact on the estimated future cash flows of thefinancial asset that can be reliably estimated.
Lease agreementsLease agreements concerning tangible assets in which the Group holdsa material share of the risks and benefits of ownership are classified asfinancial lease agreements. A financial lease agreement is entered in thebalance sheet at either the fair value of the leased asset on the startingdate of the lease agreement or the current value of the minimum rents,whichever is lower. Lease payments are divided into financing costs andinstallment payment of the liability so that the interest rate of theremaining liability remains unchanged. The corresponding rentalobligations, net of finance charges, are included in interest-bearingliabilities. The financing cost calculated with the effective interest rate isrecorded in the income statement as a financial expense. Tangible fixedassets acquired under financial lease agreements are depreciated overtheir economic lifetime or the period of lease, whichever is shorter. Lease agreements in which the risks and benefits of ownership areretained by the lessor are treated as other lease agreements(operational leasing). Rents paid on other lease agreements areexpensed in even installments in the income statement over theduration of the rental period. Assets leased by the Group in which the risks and benefits of ownershipare transferred to the lessee are treated as financial leasing andrecorded in the balance sheet as a receivable according to presentvalue. Financial income from financial lease agreements is determinedso that the remaining net investment provides the same incomepercentage over the duration of the rental period. Assets leased by the Group other than through financial leasing areincluded in the balance sheet as tangible fixed assets and aredepreciated according to their estimated useful economic life in thesame way as tangible fixed assets used by the Group. Leasing income isrecorded in the income statement in even installments over theduration of the rental period.
InventoriesInventories are valued in the balance sheet either at the acquisition costor at the net realizable value, whichever is lower. The acquisition cost isdetermined using the weighted average price method. The acquisitioncost of finished and incomplete products comprises raw materials, directcosts of labor, other direct costs and the appropriate portion of thevariable general costs of manufacture and fixed overhead at the ordinaryrate of operations, but it does not include borrowing costs. The netrealizable value is the estimated selling price in ordinary businessoperations less the estimated expenditure on product completion andsales.
Trade receivablesTrade receivables are recorded in the balance sheet at their originalinvoice amount. An impairment of trade receivables is recognized when there is justifiedevidence that the Group will not receive all of benefits on the originalterms. Indications of the impairment of trade receivables include thesignificant financial difficulties of the debtor, the likelihood of bankruptcy,failure to make payments, or a major delay in receiving the paying. Thecurrent cash flow of all trade receivables, which are more than 90 daysoverdue are considered as zero. The amount of the impairmentrecorded in the income statement is determined according to thedifference between the carrying value of the receivable and theestimated current cash flow discounted by the effective interest rate. Ifthe amount of the impairment loss decreases in any later financialperiod, and the decrease can be objectively seen to be related to eventssubsequent to the recognition of the impairment, the recognized loss iscancelled through profit or loss.
Share capitalOrdinary shares are included in shareholders’ equity. Expenses incurreddirectly from new share issues are recorded in shareholders’ equity as areduction of received payments.
TaxesGroup taxes consist of taxes based on Group companies’ results for thefinancial year, adjustments to taxes related to previous years and thechange in deferred income taxes.
The tax expenses on the income statement are formed from the taxbased on the taxable income for the financial year and deferred taxes.The tax expenses are recorded in the income statement except for theitems recorded directly into shareholders’ equity, when the tax impact isrecorded also as an equivalent part of shareholders’ equity. The taxesfor the financial year are calculated from the taxable income accordingto the valid tax rate in each country. Taxes are adjusted by the possibletaxes related to previous financial years.
Deferred taxes are calculated for all temporary differences betweenaccounting and taxation using the tax rates valid at the closing date. Thelargest temporary differences arise from the depreciation of tangibleassets, valuations in the fair value in the balance sheets of acquiredcompanies at the time of acquisition, revaluations of certain non-currentreserves, reservations for pension schemes and post-retirementbenefits, unused tax losses, and differences in net wealth between fairvalue and taxable value in connection with acquisitions.
Deferred tax assets have been recorded to the extent that it is probablethat taxable profit will be available against which the temporarydifference can be utilized will materialize in the future. Deferred incometax is determined using tax rates that have been enacted or substantiallyenacted by the balance sheet date.
Revenues, expenses and assets are recognized net of the amount ofsales tax except:• Where the sales tax incurred on a purchase of assets or services is notrecoverable from the taxation authority• Receivables and payables that are stated with the amount of sales taxincluded.
EXEL COMPOSITESAnnual Financial Report 2016
Notes to the Consolidated Financial Statements | 22
Pensions and other post-employment benefitsThe Group’s pension schemes comply with each country’s localregulations and practices. Some of the pension schemes in the Groupapply defined benefit pension schemes where the pension benefits,disability benefits and employment termination benefits are defined.Pension benefits are based generally on the period of employment andsalary over a fixed period for each employee. Pension contributions arefunded through payments to insurance companies. In addition, theGroup has defined-contribution plans. In defined benefit pension plans, the present value of future pensionpayments on the closing date is presented less the fair value of theplan-related assets on the closing date. Pension liabilities are calculatedby independent actuaries. The pension liability is determined accordingto the projected unit credit method: the pension liability is discounted tothe present value of estimated future cash flows using the interest ratewhich is equal to the interest rate of government or corporate bondswith maturities corresponding to the maturity of the pension liability.Pension costs are recorded in the income statement as an expense withcosts periodised over the employees’ time of service based on actuarialcalculations carried out annually. Actuarial gains and losses arerecognized in full as a component of other comprehensive income. In defined-contribution schemes, pension contributions are paid toinsurance companies, after which the Group no longer has otherpayment obligations. The Group’s contributions to defined-contributionschemes are entered in the financial period to which the paymentsrelate.
Long-term compensationThe Group has long-term incentive programs for the President and CEOand the Group Management Team and selected key employees of theCompany. The aim of the programs is to combine the objectives of theshareholders and the executives in order to increase the value of theCompany, to commit the executives to the Company and to offer theexecutives a competitive reward program based on holding theCompany’s shares. The Board of Directors makes the decision on theprogram annually. The cost of the programs will be accounted for as operating expensesduring the duration of the programs.
ProvisionsA provision is recognized in the balance sheet when the Group has alegal or actual obligation on the basis of a prior event, thematerialization of the payment obligation is probable and the size of theobligation can be reliably estimated and requires a financial payment orcauses a financial loss. If compensation for a share of the obligation canbe received from a third party, the compensation is recorded as aseparate asset item, but only when it is practically certain that saidcompensation will be received.
The right of personnel to annual leave and leave based on a long periodof service are recognized when the right is created. The recordedprovision corresponds to the obligations regarding the annual leave andleave based on a long period of service based on work performed bythe reporting date.
The Group recognizes a provision against loss-making agreements if thebenefits of an agreement are expected to be smaller than theunavoidable costs required to fulfill the obligations of the agreement.
The Group recognizes a provision for significant projects covering therepair or replacement costs during the guarantee period.
A provision for restructuring is recognized when the Group has prepareda detailed and formal restructuring plan and restructuring has eithercommenced or the plan has been announced publicly. The provisionsare valued at their present value of costs required to cover theobligation.
DividendsDividends paid by the Group are recognized for the financial year inwhich the shareholders have approved payment of the dividend.
Earnings per shareThe undiluted earnings per share is calculated by dividing the profit forthe period belonging to the shareholders of the parent company by theweighted average of shares in issue, not including shares purchased bythe Company itself and that are presented as own shares. The weightedaverage number of shares used to calculate the diluted earnings pershare takes into account the diluting effect of outstanding stock optionsduring the period. This effect is calculated by the number of shares thatcould have been acquired at market price with the value of thesubscription rights to usable stock options, which defines the ”freeelement”; ”free shares” are added to the number of released shares,but the result for the financial year is not adjusted.
EXEL COMPOSITESAnnual Financial Report 2016
Notes to the Consolidated Financial Statements | 23
NOTE 6 SEGMENT INFORMATION
Segment information is presented according to the Group’s operatingsegment and geographical distribution. Operating segments are basedon the Group’s internal organizational structure and internal financialreporting.
Operating segments consist of asset groups and businesses whose risksand profitability relative to products or services differ from otherbusiness segments. In geographical information products or services areproduced in a certain financial environment the risks and profitability ofwhich differ from the financial environments’ risks and profitability ofother geographical locations.
Operating segmentsThe Group has one operating segment, Exel Composites.
Geographical informationThe Group’s geographical information is given for Europe, APAC (AsiaPacific) and Rest of world. Revenue of geographical distribution arepresented according to the customers, while assets are presentedaccording to the location of the assets.
Revenue outside the Group according to location of customers
2016 2015
Europe 59,636 63,896
APAC 11,274 13,712
Rest of world 2,170 2,588
Total 79,079 80,196
Revenue from the biggest customer amounted to EUR 11,940 (17,293) thousand.
Total assets according to geographic location
2016 2015
Europe 31,335 30,212
APAC 14,719 15,190
Rest of world 0 0
Total 46,054 45,402
Capital expenditure according to geographic location
2016 2015
Europe 2,452 3,607
APAC 676 688
Rest of world 0 0
Total 3,129 4,295
NOTE 7 BUSINESS COMBINATIONSThe Group did no acquisitions in 2016 or 2015.
EXEL COMPOSITESAnnual Financial Report 2016
Notes to the Consolidated Financial Statements | 24
NOTE 8 EXCHANGE RATESThe income statements of subsidiaries, whose measurement andreporting currency is not the euro, are translated into the Groupreporting currency using the average exchange rate, whereas the assetsand liabilities of the subsidiaries are translated using the exchange rateson the reporting date. The reporting date exchange rates are based on
exchange rates published by the European Central Bank for the closingdate. The average exchange rate is calculated as an average of eachmonth’s average rates from the European Central Bank. Key exchangerates for Exel Composites Group applied in the accounts are:
Country Currency2016
Average rate2015
Average rate
2016Balance sheet
rate
2015Balance sheet
rate
Australia AUD 1.48862 1.47650 1.45960 1.49900
UK GBP 0.81888 0.72602 0.85618 0.73799
China RMB 7.34947 6.97319 7.32020 7.09100
Sweden SEK 9.46745 9.35401 9.55250 9.18780
USA USD 1.10658 1.10963 1.05410 1.09260
NOTE 9 OTHER OPERATING INCOME
2016 2015
Rental incomes 19 20
Other operating incomes 357 533
Total 376 553
Other operating income includes Exel Sports licensing income of EUR 300 (207) thousand and government grants of EUR 3 (324) thousand.
NOTE 10 OTHER OPERATING EXPENSES
2016 2015
Rental expenses 2,026 1,239
Other operating expenses 15,587 16,913
Total 17,613 18,151
The fees paid in 2016 to the external auditor for auditing Exel Group companies totaled EUR 149 (190) thousand, while the fees paid for non-auditservices totaled EUR 71 (123) thousand.
NOTE 11 EMPLOYEE BENEFIT EXPENSES
2016 2015
Wages and salaries 18,816 20,837
Pension costs – defined contribution schemes 2,101 2,339
Pension costs – defined benefit schemes 2 14
Other employee benefits 2,033 2,090
Total 22,952 25,280
2016 2015
Average number of personnel 479 498
EXEL COMPOSITESAnnual Financial Report 2016
Notes to the Consolidated Financial Statements | 25
NOTE 12 RESEARCH AND DEVELOPMENT EXPENDITUREThe income statement includes research and development costsentered as costs amounting to EUR 1,747 (1,850) thousand in 2016.These costs are included in the income statement under EmployeeBenefit Expenses and Other Operating Expenses.
NOTE 13 DEPRECIATION, AMORTIZATION AND IMPAIRMENT
Depreciation of assets
2016 2015
Intangible assets 199 293
Tangible assets
Buildings 255 283
Machinery and equipment 2,561 2,317
Total 3,015 2,894
Impairment and write-down of assets
2016 2015
Intangible assets 0 0
Goodwill 0 0
Tangible assets
Land 9 9
Buildings 119 0
Machinery and equipment 101 0
Total 228 9
NOTE 14 FINANCIAL INCOME
2016 2015
Interest income on loans and receivables 10 52
Dividend income 2 1
Foreign exchange gains 400 501
Change in fair value of financial assets recognized at fair value through profit or loss (fromderivatives)
10 4
Other finance income 2 41
Total finance income 423 599
NOTE 15 FINANCIAL EXPENSES
2016 2015
Interest expenses on debts and borrowings 99 77
Interest expenses under finance leases 0 0
Foreign exchange losses 237 571
Change in fair value of financial assets recognized at fair value through profit or loss (fromderivatives)
0 0
Other finance expenses 58 109
Total finance expenses 394 757
Exchange differences for sales (exchange rate loss EUR 1 thousand) and purchases (exchange rate loss EUR 1 thousand) are entered in the incomestatement in the appropriate sales and purchase accounts.
EXEL COMPOSITESAnnual Financial Report 2016
Notes to the Consolidated Financial Statements | 26
NOTE 16 INCOME TAXESThe income tax entered as an expense consisted mainly of the followingcomponents for the years ended 31 December 2016 and 2015:
2016 2015
Income tax based on taxable income for the financial year 663 1,273
Income taxes from previous financial periods -20 146
Deferred taxes -163 -6
Total income taxes reported in the income statement 480 1,413
Income tax recognized in other comprehensive income 2016
Before tax Tax effect After tax
Exchange differences on translating foreign operations -1,244 0 -1,244
Defined benefit plan actuarial gains (+) / losses (-) -61 21 -40
Total -1,305 21 -1,284
Income tax recognized in other comprehensive income 2015
Before tax Tax effect After tax
Exchange differences on translating foreign operations 492 0 492
Defined benefit plan actuarial gains (+) / losses (-) 78 -26 51
Total 570 -26 543
A reconciliation between tax expense and the product of accountingprofit multiplied by Finland’s domestic tax rate for the years ended 31December 2016 and 2015 is as follows:
Income tax reconciliation
2016 2015
Accounting profit before tax 678 4,257
Tax calculated at domestic tax rate 20.0% in 2016 and in 2015 136 851
Difference between the domestic and foreign tax rates -47 -3
Expenses not deductible for tax purposes 483 10
Other -92 555
Tax charge 480 1,413
Effective tax rate 70.8 33.2
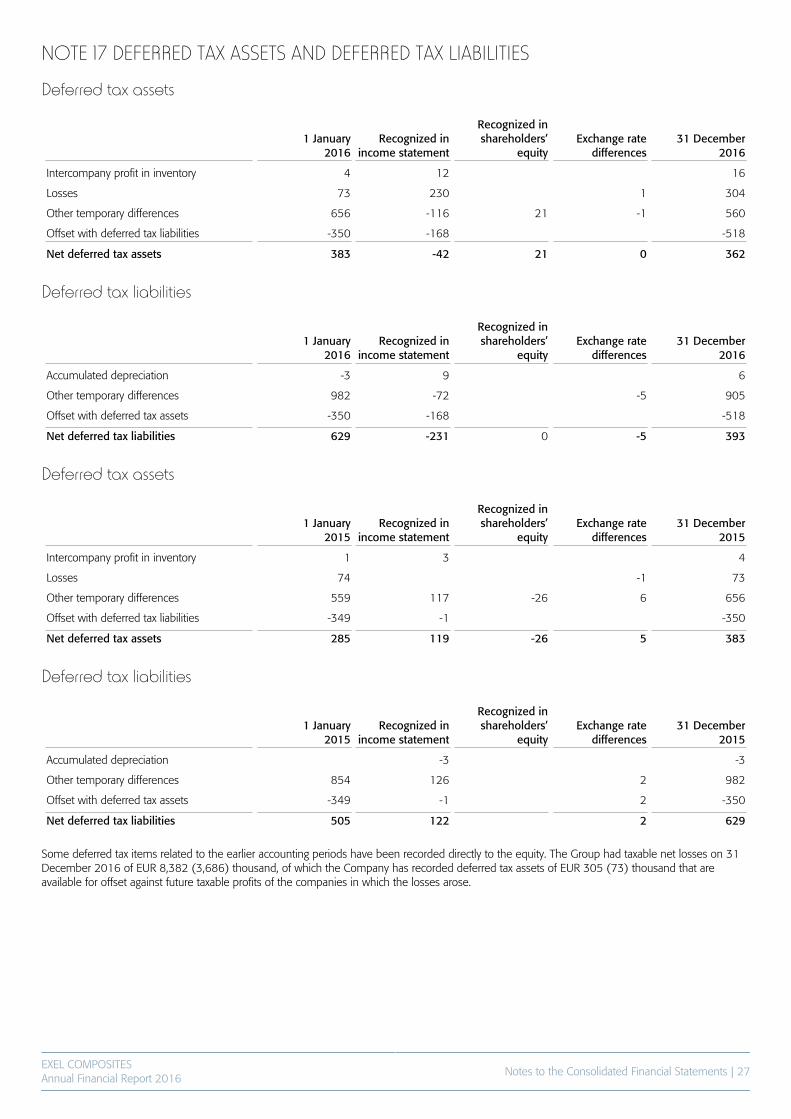
EXEL COMPOSITESAnnual Financial Report 2016
Notes to the Consolidated Financial Statements | 27
NOTE 17 DEFERRED TAX ASSETS AND DEFERRED TAX LIABILITIES
Deferred tax assets
1 January2016
Recognized inincome statement
Recognized inshareholders’
equityExchange rate
differences31 December
2016
Intercompany profit in inventory 4 12 16
Losses 73 230 1 304
Other temporary differences 656 -116 21 -1 560
Offset with deferred tax liabilities -350 -168 -518
Net deferred tax assets 383 -42 21 0 362
Deferred tax liabilities
1 January2016
Recognized inincome statement
Recognized inshareholders’
equityExchange rate
differences31 December
2016
Accumulated depreciation -3 9 6
Other temporary differences 982 -72 -5 905
Offset with deferred tax assets -350 -168 -518
Net deferred tax liabilities 629 -231 0 -5 393
Deferred tax assets
1 January2015
Recognized inincome statement
Recognized inshareholders’
equityExchange rate
differences31 December
2015
Intercompany profit in inventory 1 3 4
Losses 74 -1 73
Other temporary differences 559 117 -26 6 656
Offset with deferred tax liabilities -349 -1 -350
Net deferred tax assets 285 119 -26 5 383
Deferred tax liabilities
1 January2015
Recognized inincome statement
Recognized inshareholders’
equityExchange rate
differences31 December
2015
Accumulated depreciation -3 -3
Other temporary differences 854 126 2 982
Offset with deferred tax assets -349 -1 2 -350
Net deferred tax liabilities 505 122 2 629
Some deferred tax items related to the earlier accounting periods have been recorded directly to the equity. The Group had taxable net losses on 31December 2016 of EUR 8,382 (3,686) thousand, of which the Company has recorded deferred tax assets of EUR 305 (73) thousand that areavailable for offset against future taxable profits of the companies in which the losses arose.
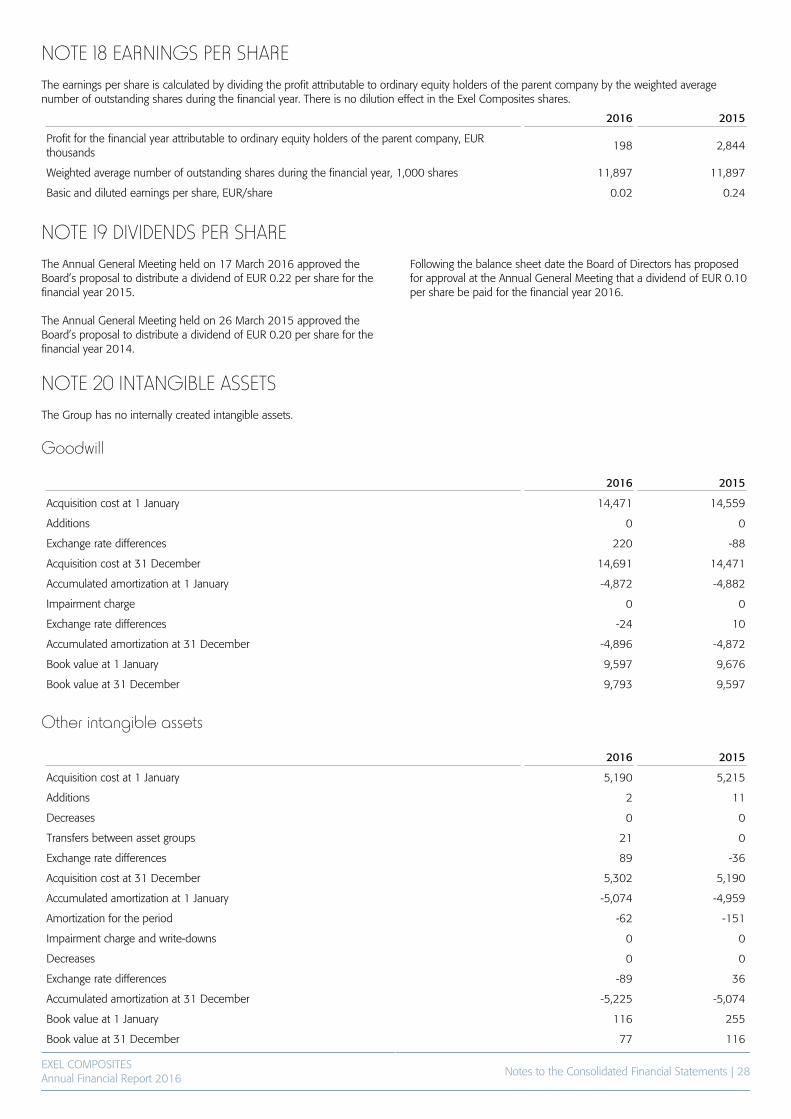
EXEL COMPOSITESAnnual Financial Report 2016
Notes to the Consolidated Financial Statements | 28
NOTE 18 EARNINGS PER SHAREThe earnings per share is calculated by dividing the profit attributable to ordinary equity holders of the parent company by the weighted averagenumber of outstanding shares during the financial year. There is no dilution effect in the Exel Composites shares.
2016 2015
Profit for the financial year attributable to ordinary equity holders of the parent company, EURthousands
198 2,844
Weighted average number of outstanding shares during the financial year, 1,000 shares 11,897 11,897
Basic and diluted earnings per share, EUR/share 0.02 0.24
NOTE 19 DIVIDENDS PER SHAREThe Annual General Meeting held on 17 March 2016 approved theBoard’s proposal to distribute a dividend of EUR 0.22 per share for thefinancial year 2015.
The Annual General Meeting held on 26 March 2015 approved theBoard’s proposal to distribute a dividend of EUR 0.20 per share for thefinancial year 2014.
Following the balance sheet date the Board of Directors has proposedfor approval at the Annual General Meeting that a dividend of EUR 0.10per share be paid for the financial year 2016.
NOTE 20 INTANGIBLE ASSETSThe Group has no internally created intangible assets.
Goodwill
2016 2015
Acquisition cost at 1 January 14,471 14,559
Additions 0 0
Exchange rate differences 220 -88
Acquisition cost at 31 December 14,691 14,471
Accumulated amortization at 1 January -4,872 -4,882
Impairment charge 0 0
Exchange rate differences -24 10
Accumulated amortization at 31 December -4,896 -4,872
Book value at 1 January 9,597 9,676
Book value at 31 December 9,793 9,597
Other intangible assets
2016 2015
Acquisition cost at 1 January 5,190 5,215
Additions 2 11
Decreases 0 0
Transfers between asset groups 21 0
Exchange rate differences 89 -36
Acquisition cost at 31 December 5,302 5,190
Accumulated amortization at 1 January -5,074 -4,959
Amortization for the period -62 -151
Impairment charge and write-downs 0 0
Decreases 0 0
Exchange rate differences -89 36
Accumulated amortization at 31 December -5,225 -5,074
Book value at 1 January 116 255
Book value at 31 December 77 116
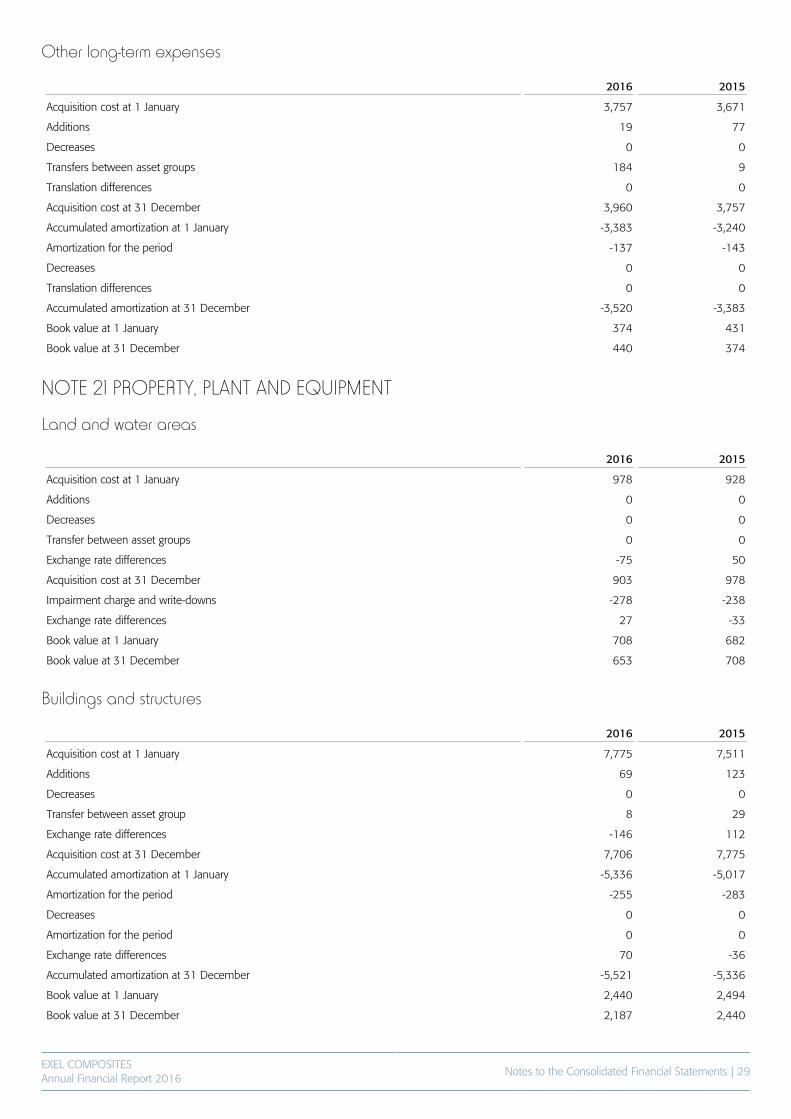
EXEL COMPOSITESAnnual Financial Report 2016
Notes to the Consolidated Financial Statements | 29
Other long-term expenses
2016 2015
Acquisition cost at 1 January 3,757 3,671
Additions 19 77
Decreases 0 0
Transfers between asset groups 184 9
Translation differences 0 0
Acquisition cost at 31 December 3,960 3,757
Accumulated amortization at 1 January -3,383 -3,240
Amortization for the period -137 -143
Decreases 0 0
Translation differences 0 0
Accumulated amortization at 31 December -3,520 -3,383
Book value at 1 January 374 431
Book value at 31 December 440 374
NOTE 21 PROPERTY, PLANT AND EQUIPMENT
Land and water areas
2016 2015
Acquisition cost at 1 January 978 928
Additions 0 0
Decreases 0 0
Transfer between asset groups 0 0
Exchange rate differences -75 50
Acquisition cost at 31 December 903 978
Impairment charge and write-downs -278 -238
Exchange rate differences 27 -33
Book value at 1 January 708 682
Book value at 31 December 653 708
Buildings and structures
2016 2015
Acquisition cost at 1 January 7,775 7,511
Additions 69 123
Decreases 0 0
Transfer between asset group 8 29
Exchange rate differences -146 112
Acquisition cost at 31 December 7,706 7,775
Accumulated amortization at 1 January -5,336 -5,017
Amortization for the period -255 -283
Decreases 0 0
Amortization for the period 0 0
Exchange rate differences 70 -36
Accumulated amortization at 31 December -5,521 -5,336
Book value at 1 January 2,440 2,494
Book value at 31 December 2,187 2,440
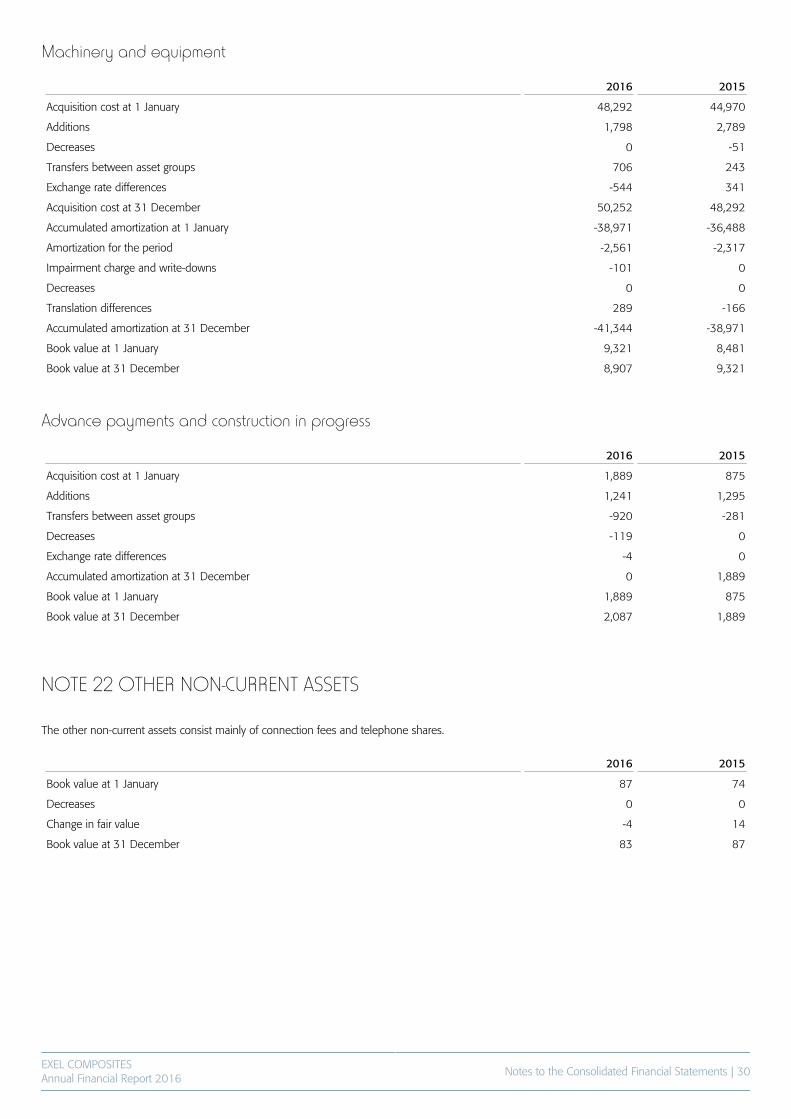
EXEL COMPOSITESAnnual Financial Report 2016
Notes to the Consolidated Financial Statements | 30
Machinery and equipment
2016 2015
Acquisition cost at 1 January 48,292 44,970
Additions 1,798 2,789
Decreases 0 -51
Transfers between asset groups 706 243
Exchange rate differences -544 341
Acquisition cost at 31 December 50,252 48,292
Accumulated amortization at 1 January -38,971 -36,488
Amortization for the period -2,561 -2,317
Impairment charge and write-downs -101 0
Decreases 0 0
Translation differences 289 -166
Accumulated amortization at 31 December -41,344 -38,971
Book value at 1 January 9,321 8,481
Book value at 31 December 8,907 9,321
Advance payments and construction in progress
2016 2015
Acquisition cost at 1 January 1,889 875
Additions 1,241 1,295
Transfers between asset groups -920 -281
Decreases -119 0
Exchange rate differences -4 0
Accumulated amortization at 31 December 0 1,889
Book value at 1 January 1,889 875
Book value at 31 December 2,087 1,889
NOTE 22 OTHER NON-CURRENT ASSETS
The other non-current assets consist mainly of connection fees and telephone shares.
2016 2015
Book value at 1 January 87 74
Decreases 0 0
Change in fair value -4 14
Book value at 31 December 83 87
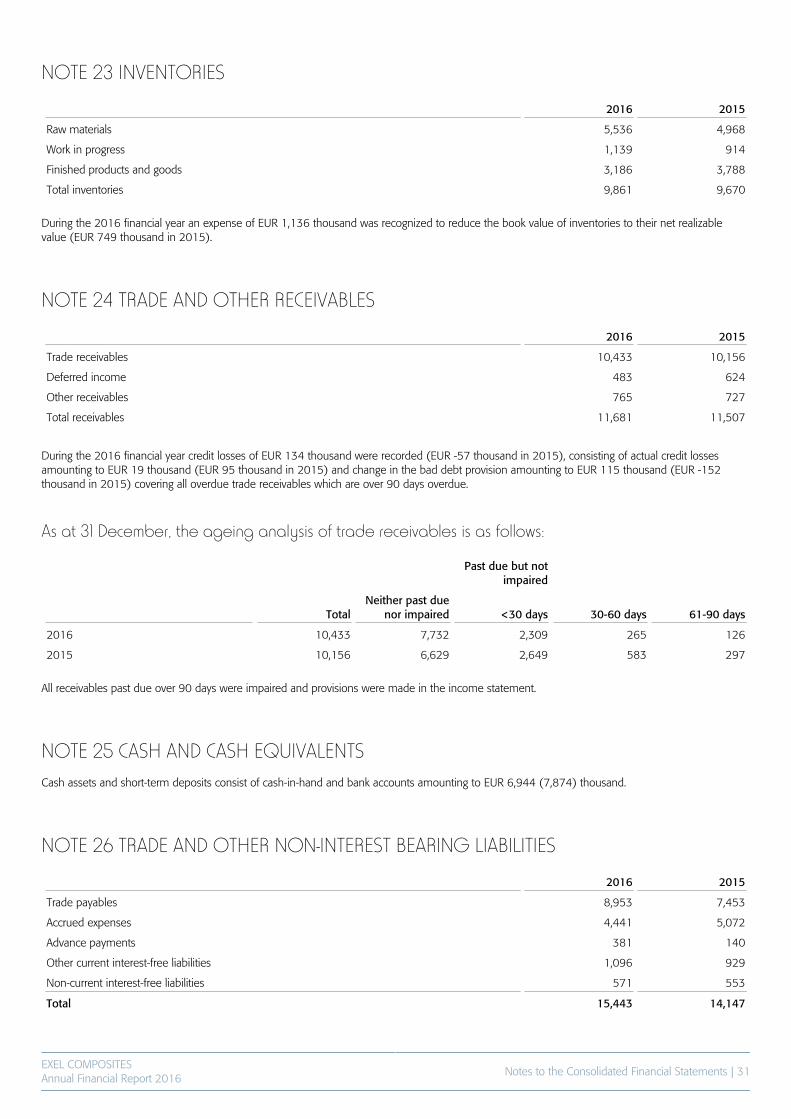
EXEL COMPOSITESAnnual Financial Report 2016
Notes to the Consolidated Financial Statements | 31
NOTE 23 INVENTORIES
2016 2015
Raw materials 5,536 4,968
Work in progress 1,139 914
Finished products and goods 3,186 3,788
Total inventories 9,861 9,670
During the 2016 financial year an expense of EUR 1,136 thousand was recognized to reduce the book value of inventories to their net realizablevalue (EUR 749 thousand in 2015).
NOTE 24 TRADE AND OTHER RECEIVABLES
2016 2015
Trade receivables 10,433 10,156
Deferred income 483 624
Other receivables 765 727
Total receivables 11,681 11,507
During the 2016 financial year credit losses of EUR 134 thousand were recorded (EUR -57 thousand in 2015), consisting of actual credit lossesamounting to EUR 19 thousand (EUR 95 thousand in 2015) and change in the bad debt provision amounting to EUR 115 thousand (EUR -152thousand in 2015) covering all overdue trade receivables which are over 90 days overdue.
As at 31 December, the ageing analysis of trade receivables is as follows:
Past due but notimpaired
TotalNeither past due
nor impaired <30 days 30-60 days 61-90 days
2016 10,433 7,732 2,309 265 126
2015 10,156 6,629 2,649 583 297
All receivables past due over 90 days were impaired and provisions were made in the income statement.
NOTE 25 CASH AND CASH EQUIVALENTSCash assets and short-term deposits consist of cash-in-hand and bank accounts amounting to EUR 6,944 (7,874) thousand.
NOTE 26 TRADE AND OTHER NON-INTEREST BEARING LIABILITIES
2016 2015
Trade payables 8,953 7,453
Accrued expenses 4,441 5,072
Advance payments 381 140
Other current interest-free liabilities 1,096 929
Non-current interest-free liabilities 571 553
Total 15,443 14,147
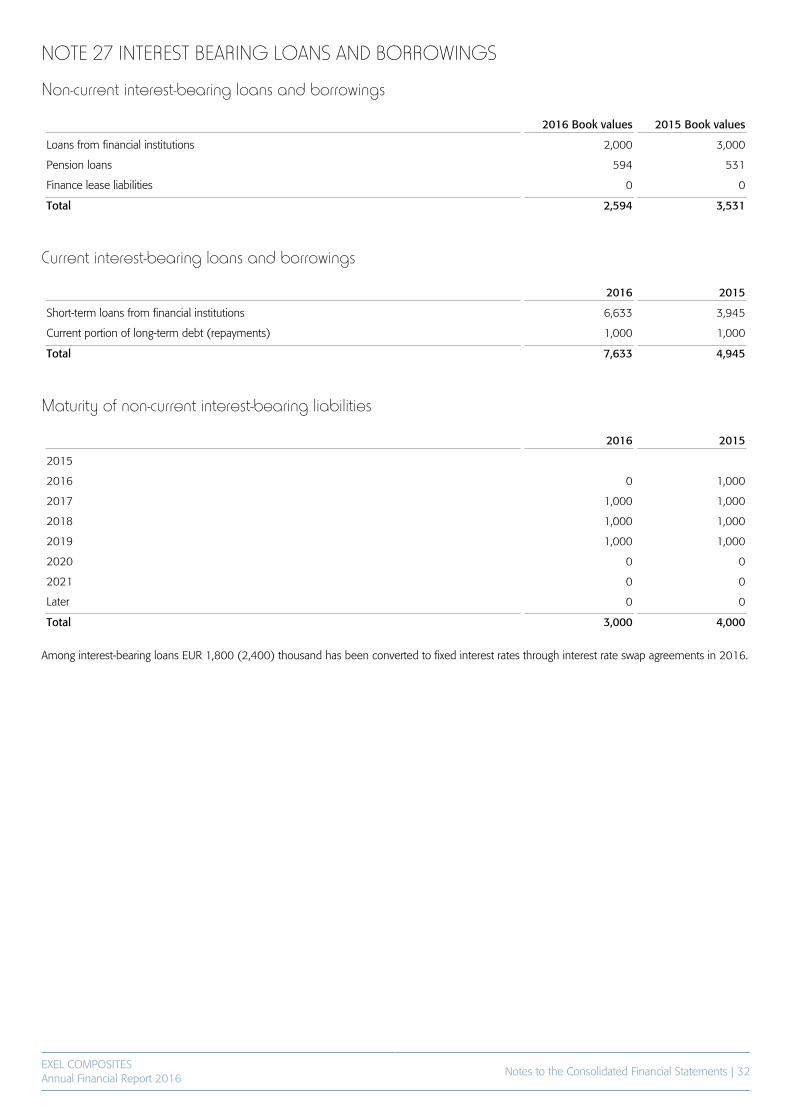
EXEL COMPOSITESAnnual Financial Report 2016
Notes to the Consolidated Financial Statements | 32
NOTE 27 INTEREST BEARING LOANS AND BORROWINGS
Non-current interest-bearing loans and borrowings
2016 Book values 2015 Book values
Loans from financial institutions 2,000 3,000
Pension loans 594 531
Finance lease liabilities 0 0
Total 2,594 3,531
Current interest-bearing loans and borrowings
2016 2015
Short-term loans from financial institutions 6,633 3,945
Current portion of long-term debt (repayments) 1,000 1,000
Total 7,633 4,945
Maturity of non-current interest-bearing liabilities
2016 2015
2015
2016 0 1,000
2017 1,000 1,000
2018 1,000 1,000
2019 1,000 1,000
2020 0 0
2021 0 0
Later 0 0
Total 3,000 4,000
Among interest-bearing loans EUR 1,800 (2,400) thousand has been converted to fixed interest rates through interest rate swap agreements in 2016.
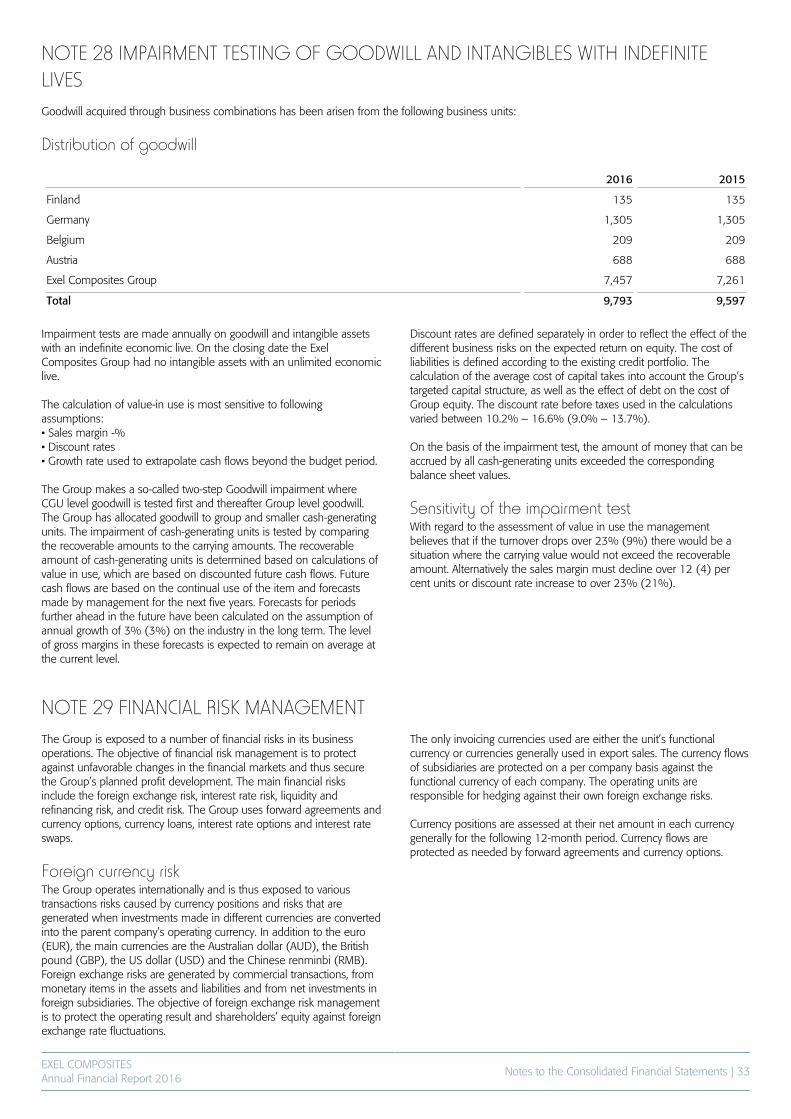
EXEL COMPOSITESAnnual Financial Report 2016
Notes to the Consolidated Financial Statements | 33
NOTE 28 IMPAIRMENT TESTING OF GOODWILL AND INTANGIBLES WITH INDEFINITELIVESGoodwill acquired through business combinations has been arisen from the following business units:
Distribution of goodwill
2016 2015
Finland 135 135
Germany 1,305 1,305
Belgium 209 209
Austria 688 688
Exel Composites Group 7,457 7,261
Total 9,793 9,597
Impairment tests are made annually on goodwill and intangible assetswith an indefinite economic live. On the closing date the ExelComposites Group had no intangible assets with an unlimited economiclive.
The calculation of value-in use is most sensitive to followingassumptions:• Sales margin -%• Discount rates• Growth rate used to extrapolate cash flows beyond the budget period.
The Group makes a so-called two-step Goodwill impairment whereCGU level goodwill is tested first and thereafter Group level goodwill.The Group has allocated goodwill to group and smaller cash-generatingunits. The impairment of cash-generating units is tested by comparingthe recoverable amounts to the carrying amounts. The recoverableamount of cash-generating units is determined based on calculations ofvalue in use, which are based on discounted future cash flows. Futurecash flows are based on the continual use of the item and forecastsmade by management for the next five years. Forecasts for periodsfurther ahead in the future have been calculated on the assumption ofannual growth of 3% (3%) on the industry in the long term. The levelof gross margins in these forecasts is expected to remain on average atthe current level.
Discount rates are defined separately in order to reflect the effect of thedifferent business risks on the expected return on equity. The cost ofliabilities is defined according to the existing credit portfolio. Thecalculation of the average cost of capital takes into account the Group’stargeted capital structure, as well as the effect of debt on the cost ofGroup equity. The discount rate before taxes used in the calculationsvaried between 10.2% – 16.6% (9.0% – 13.7%).
On the basis of the impairment test, the amount of money that can beaccrued by all cash-generating units exceeded the correspondingbalance sheet values.
Sensitivity of the impairment testWith regard to the assessment of value in use the managementbelieves that if the turnover drops over 23% (9%) there would be asituation where the carrying value would not exceed the recoverableamount. Alternatively the sales margin must decline over 12 (4) percent units or discount rate increase to over 23% (21%).
NOTE 29 FINANCIAL RISK MANAGEMENTThe Group is exposed to a number of financial risks in its businessoperations. The objective of financial risk management is to protectagainst unfavorable changes in the financial markets and thus securethe Group’s planned profit development. The main financial risksinclude the foreign exchange risk, interest rate risk, liquidity andrefinancing risk, and credit risk. The Group uses forward agreements andcurrency options, currency loans, interest rate options and interest rateswaps.
Foreign currency riskThe Group operates internationally and is thus exposed to varioustransactions risks caused by currency positions and risks that aregenerated when investments made in different currencies are convertedinto the parent company’s operating currency. In addition to the euro(EUR), the main currencies are the Australian dollar (AUD), the Britishpound (GBP), the US dollar (USD) and the Chinese renminbi (RMB).Foreign exchange risks are generated by commercial transactions, frommonetary items in the assets and liabilities and from net investments inforeign subsidiaries. The objective of foreign exchange risk managementis to protect the operating result and shareholders’ equity against foreignexchange rate fluctuations.
The only invoicing currencies used are either the unit’s functionalcurrency or currencies generally used in export sales. The currency flowsof subsidiaries are protected on a per company basis against thefunctional currency of each company. The operating units areresponsible for hedging against their own foreign exchange risks.
Currency positions are assessed at their net amount in each currencygenerally for the following 12-month period. Currency flows areprotected as needed by forward agreements and currency options.
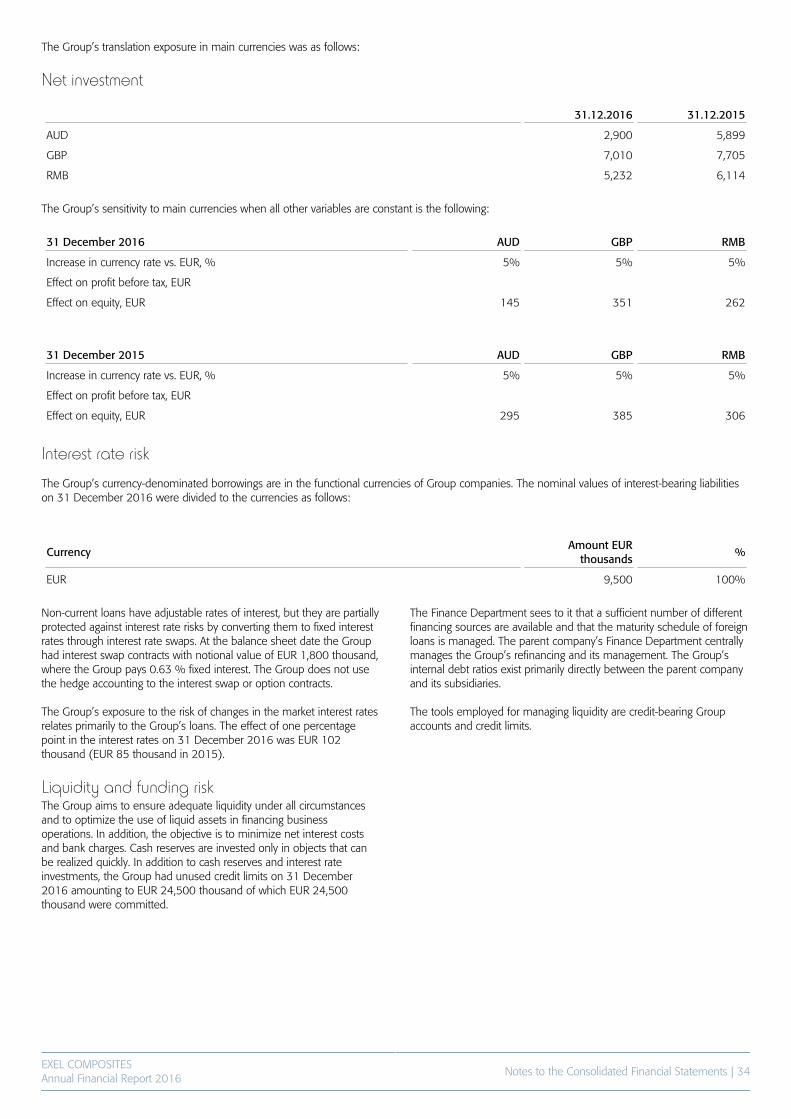
EXEL COMPOSITESAnnual Financial Report 2016
Notes to the Consolidated Financial Statements | 34
The Group’s translation exposure in main currencies was as follows:
Net investment
31.12.2016 31.12.2015
AUD 2,900 5,899
GBP 7,010 7,705
RMB 5,232 6,114
The Group’s sensitivity to main currencies when all other variables are constant is the following:
31 December 2016 AUD GBP RMB
Increase in currency rate vs. EUR, % 5% 5% 5%
Effect on profit before tax, EUR
Effect on equity, EUR 145 351 262
31 December 2015 AUD GBP RMB
Increase in currency rate vs. EUR, % 5% 5% 5%
Effect on profit before tax, EUR
Effect on equity, EUR 295 385 306
Interest rate risk
The Group’s currency-denominated borrowings are in the functional currencies of Group companies. The nominal values of interest-bearing liabilitieson 31 December 2016 were divided to the currencies as follows:
CurrencyAmount EUR
thousands%
EUR 9,500 100%
Non-current loans have adjustable rates of interest, but they are partiallyprotected against interest rate risks by converting them to fixed interestrates through interest rate swaps. At the balance sheet date the Grouphad interest swap contracts with notional value of EUR 1,800 thousand,where the Group pays 0.63 % fixed interest. The Group does not usethe hedge accounting to the interest swap or option contracts.
The Group’s exposure to the risk of changes in the market interest ratesrelates primarily to the Group’s loans. The effect of one percentagepoint in the interest rates on 31 December 2016 was EUR 102thousand (EUR 85 thousand in 2015).
Liquidity and funding riskThe Group aims to ensure adequate liquidity under all circumstancesand to optimize the use of liquid assets in financing businessoperations. In addition, the objective is to minimize net interest costsand bank charges. Cash reserves are invested only in objects that canbe realized quickly. In addition to cash reserves and interest rateinvestments, the Group had unused credit limits on 31 December2016 amounting to EUR 24,500 thousand of which EUR 24,500thousand were committed.
The Finance Department sees to it that a sufficient number of differentfinancing sources are available and that the maturity schedule of foreignloans is managed. The parent company’s Finance Department centrallymanages the Group’s refinancing and its management. The Group’sinternal debt ratios exist primarily directly between the parent companyand its subsidiaries.
The tools employed for managing liquidity are credit-bearing Groupaccounts and credit limits.
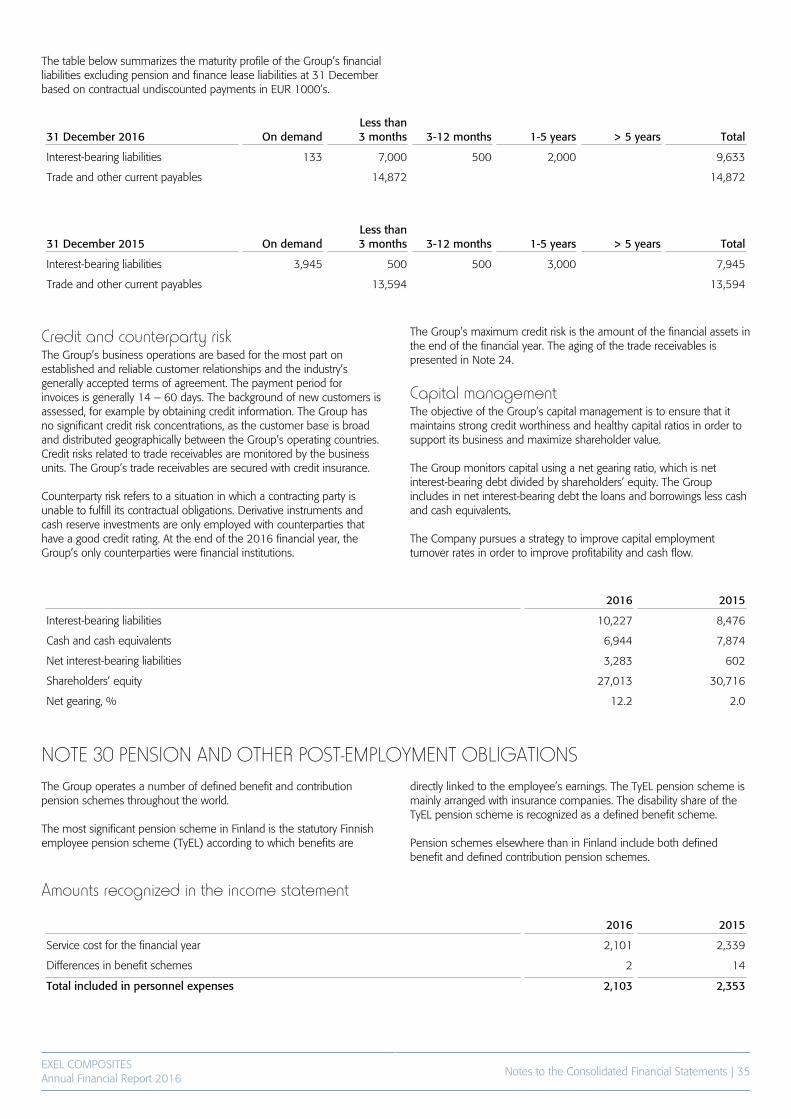
EXEL COMPOSITESAnnual Financial Report 2016
Notes to the Consolidated Financial Statements | 35
The table below summarizes the maturity profile of the Group’s financialliabilities excluding pension and finance lease liabilities at 31 Decemberbased on contractual undiscounted payments in EUR 1000’s.
31 December 2016 On demandLess than3 months 3-12 months 1-5 years > 5 years Total
Interest-bearing liabilities 133 7,000 500 2,000 9,633
Trade and other current payables 14,872 14,872
31 December 2015 On demandLess than3 months 3-12 months 1-5 years > 5 years Total
Interest-bearing liabilities 3,945 500 500 3,000 7,945
Trade and other current payables 13,594 13,594
Credit and counterparty riskThe Group’s business operations are based for the most part onestablished and reliable customer relationships and the industry’sgenerally accepted terms of agreement. The payment period forinvoices is generally 14 – 60 days. The background of new customers isassessed, for example by obtaining credit information. The Group hasno significant credit risk concentrations, as the customer base is broadand distributed geographically between the Group’s operating countries.Credit risks related to trade receivables are monitored by the businessunits. The Group’s trade receivables are secured with credit insurance.
Counterparty risk refers to a situation in which a contracting party isunable to fulfill its contractual obligations. Derivative instruments andcash reserve investments are only employed with counterparties thathave a good credit rating. At the end of the 2016 financial year, theGroup’s only counterparties were financial institutions.
The Group’s maximum credit risk is the amount of the financial assets inthe end of the financial year. The aging of the trade receivables ispresented in Note 24.
Capital managementThe objective of the Group’s capital management is to ensure that itmaintains strong credit worthiness and healthy capital ratios in order tosupport its business and maximize shareholder value.
The Group monitors capital using a net gearing ratio, which is netinterest-bearing debt divided by shareholders’ equity. The Groupincludes in net interest-bearing debt the loans and borrowings less cashand cash equivalents.
The Company pursues a strategy to improve capital employmentturnover rates in order to improve profitability and cash flow.
2016 2015
Interest-bearing liabilities 10,227 8,476
Cash and cash equivalents 6,944 7,874
Net interest-bearing liabilities 3,283 602
Shareholders’ equity 27,013 30,716
Net gearing, % 12.2 2.0
NOTE 30 PENSION AND OTHER POST-EMPLOYMENT OBLIGATIONSThe Group operates a number of defined benefit and contributionpension schemes throughout the world.
The most significant pension scheme in Finland is the statutory Finnishemployee pension scheme (TyEL) according to which benefits are
directly linked to the employee’s earnings. The TyEL pension scheme ismainly arranged with insurance companies. The disability share of theTyEL pension scheme is recognized as a defined benefit scheme.
Pension schemes elsewhere than in Finland include both definedbenefit and defined contribution pension schemes.
Amounts recognized in the income statement
2016 2015
Service cost for the financial year 2,101 2,339
Differences in benefit schemes 2 14
Total included in personnel expenses 2,103 2,353
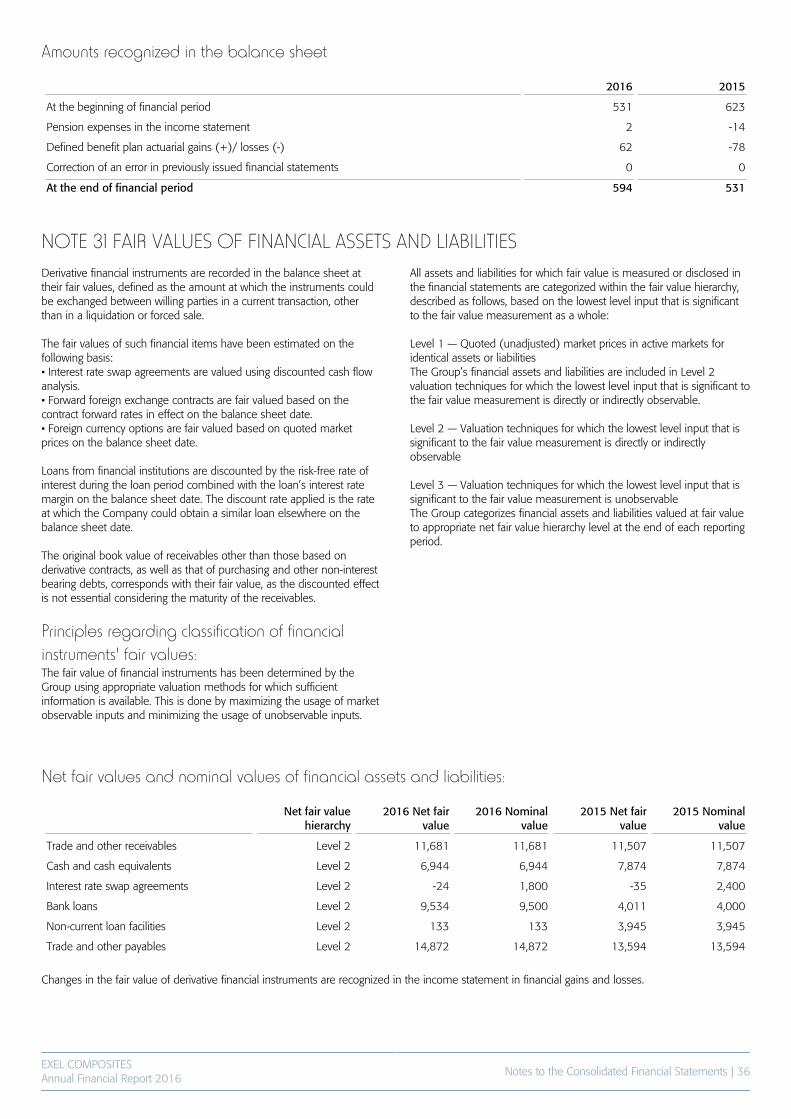
EXEL COMPOSITESAnnual Financial Report 2016
Notes to the Consolidated Financial Statements | 36
Amounts recognized in the balance sheet
2016 2015
At the beginning of financial period 531 623
Pension expenses in the income statement 2 -14
Defined benefit plan actuarial gains (+)/ losses (-) 62 -78
Correction of an error in previously issued financial statements 0 0
At the end of financial period 594 531
NOTE 31 FAIR VALUES OF FINANCIAL ASSETS AND LIABILITIESDerivative financial instruments are recorded in the balance sheet attheir fair values, defined as the amount at which the instruments couldbe exchanged between willing parties in a current transaction, otherthan in a liquidation or forced sale.
The fair values of such financial items have been estimated on thefollowing basis:• Interest rate swap agreements are valued using discounted cash flowanalysis.• Forward foreign exchange contracts are fair valued based on thecontract forward rates in effect on the balance sheet date.• Foreign currency options are fair valued based on quoted marketprices on the balance sheet date.
Loans from financial institutions are discounted by the risk-free rate ofinterest during the loan period combined with the loan’s interest ratemargin on the balance sheet date. The discount rate applied is the rateat which the Company could obtain a similar loan elsewhere on thebalance sheet date.
The original book value of receivables other than those based onderivative contracts, as well as that of purchasing and other non-interestbearing debts, corresponds with their fair value, as the discounted effectis not essential considering the maturity of the receivables.
Principles regarding classification of financialinstruments' fair values:The fair value of financial instruments has been determined by theGroup using appropriate valuation methods for which sufficientinformation is available. This is done by maximizing the usage of marketobservable inputs and minimizing the usage of unobservable inputs.
All assets and liabilities for which fair value is measured or disclosed inthe financial statements are categorized within the fair value hierarchy,described as follows, based on the lowest level input that is significantto the fair value measurement as a whole:
Level 1 — Quoted (unadjusted) market prices in active markets foridentical assets or liabilitiesThe Group’s financial assets and liabilities are included in Level 2valuation techniques for which the lowest level input that is significant tothe fair value measurement is directly or indirectly observable.
Level 2 — Valuation techniques for which the lowest level input that issignificant to the fair value measurement is directly or indirectlyobservable
Level 3 — Valuation techniques for which the lowest level input that issignificant to the fair value measurement is unobservableThe Group categorizes financial assets and liabilities valued at fair valueto appropriate net fair value hierarchy level at the end of each reportingperiod.
Net fair values and nominal values of financial assets and liabilities:
Net fair valuehierarchy
2016 Net fairvalue
2016 Nominalvalue
2015 Net fairvalue
2015 Nominalvalue
Trade and other receivables Level 2 11,681 11,681 11,507 11,507
Cash and cash equivalents Level 2 6,944 6,944 7,874 7,874
Interest rate swap agreements Level 2 -24 1,800 -35 2,400
Bank loans Level 2 9,534 9,500 4,011 4,000
Non-current loan facilities Level 2 133 133 3,945 3,945
Trade and other payables Level 2 14,872 14,872 13,594 13,594
Changes in the fair value of derivative financial instruments are recognized in the income statement in financial gains and losses.

EXEL COMPOSITESAnnual Financial Report 2016
Notes to the Consolidated Financial Statements | 37
NOTE 32 CONTINGENT LIABILITIES
2016 2015
Commitments on own behalf
Mortgages 2,783 2,783
Floating charges 12,500 12,500
Operating leases
Not later than one year 774 1,040
1-5 years 456 904
Other liabilities 312 312
NOTE 33 SHARE CAPITAL
Number of shares(1,000)
Sharecapital
Investedunrestrictedequity fund Total
1 January 2015 11,897 2,141 2,539 4,681
31 December 2015 11,897 2,141 2,539 4,681
31 December 2016 11,897 2,141 2,539 4,681
Under the articles of association of the Company, the authorized sharecapital may not be less than EUR 1,750,000 and more than EUR7,000,000. All released shares have been paid for in full. On 17 March 2016 the Annual General Meeting authorized the Boardof Directors to acquire the Company’s own shares on the followingsterms:
The maximum number of shares to berepurchasedBy virtue of the authorization the Board of Directors is entitled to decideon the repurchase of a maximum of 600,000 Company’sown shares.The authorization shall also contain an entitlement for the Company toaccept its own shares as pledge. The number of shares that can beacquired or held as pledges by the Company on the basis of thisauthorization shall not exceed one tenth (1/10) of all outstandingshares of the Company.
Directed repurchase and consideration for ashareOwn shares may be repurchased in deviation from the proportion to theholdings of the shareholders with unrestricted equity through trading ofthe securities on regulated market organized by Nasdaq Helsinki Ltd atthe market price of the time of the repurchase provided thattheCompany has a weighty financial reason thereto.
The shares shall be acquired and paid in accordance with the Rules ofNasdaq Helsinki Ltd and Euroclear Finland Ltd.
Retaining, cancelling and conveyance of thesharesShares may be repurchased to be used as consideration in possibleacquisitions or in other arrangements that are part of the Company’sbusiness, to finance investments, as part of the Company’s incentiveprogram or to be retained, otherwise conveyed or cancelled by theCompany.
Other terms and period of validityThe Board of Directors shall decide on other terms of the sharerepurchase.
On 17 March 2016 the Annual General Meeting authorized the Boardof Directors to repurchase a maximum of 600,000 own shares. Theauthorization also contained an entitlement for the Company to acceptits own shares as pledge. The number of shares that could be acquiredor held as pledges by the Company on the basis of this authorizationcould not exceed one tenth (1/10) of all outstanding shares of theCompany. The share repurchase authorization shall be valid until 30June 2017.
On 26 March 2015 the Annual General Meeting authorized the Boardof Directors to repurchase a maximum of 600,000 own shares. Theauthorization also contained an entitlement for the Company to acceptits own shares as pledge. The number of shares that could be acquiredor held as pledges by the Company on the basis of this authorizationcould not exceed one tenth (1/10) of all outstanding shares of theCompany. The authorization was valid until 30 June 2016.
These authorizations have not been exercised during the year.

EXEL COMPOSITESAnnual Financial Report 2016
Notes to the Consolidated Financial Statements | 38
NOTE 34 LONG-TERM COMPENSATION
The Group has long-term incentive programs for the President and CEOand the Group Management Team and selected key employees of theCompany. The aim of the programs is to combine the objectives of theshareholders and the executives in order to increase the value of theCompany, to commit the executives to the Company and to offer theexecutives a competitive reward program. The Board of Directors makesthe decision on the program annually.
The 2013 program, the earning period of which ended in 2015, wasbased on a long-term monetary incentive program and was targeted at20 executives for the earning period 2013 – 2015. The President andCEO and the members of the Group Management Team were includedin the target group of the 2013 program. The potential long-termmonetary performance reward from the program was based on theGroup’s cumulative Economic Profit and on the Group’s TotalShareholder Return (TSR). The potential maximum reward to be paidon the basis of the earning period 2013 – 2015 was EUR 1 million.The final monetary reward paid in 2016 based on the program wasEUR 455 thousand excluding social security costs.
On 31 December 2016 the Group had threelong-term incentive programs:The 2014 program is based on a long-term monetary incentive programand is targeted at approximately 20 executives for the earning period2014 – 2016. The President and CEO and the members of the GroupManagement Team are included in the target group of the 2014program. The potential long-term monetary performance reward isbased on the Group’s cumulative Economic Profit and on the Group’sTotal Shareholder Return (TSR). The potential reward will be paid in2017. The maximum reward to be paid will be EUR 1 million. EUR 159thousand of related accrued costs were released in 2016.
The 2015 program is based on a long-term monetary incentive programand is targeted at approximately 25 executives for the earning period2015 – 2017. The President and CEO and the members of the GroupManagement Team are included in the target group of the 2015incentive program. The potential long-term monetary performancereward is based on the Group’s cumulative Economic Profit and on theGroup’s Total Shareholder Return (TSR). The potential reward will bepaid in 2018. The maximum reward to be paid will be EUR 1.5 million.EUR 156 thousand of related accrued costs were released in 2016.
The 2016 program is based on a long-term monetary incentive programand is targeted at approximately 20 executives for the earning period2016 – 2018. The President and CEO and the members of the GroupManagement Team are included in the target group of the 2016incentive program. The potential long-term monetary performancereward is based on the Group’s cumulative Economic Profit and on theGroup’s Total Shareholder Return (TSR). The potential reward will bepaid in 2019. The maximum reward to be paid will be EUR 1 million. In2016 no related costs were recorded.
No reward will be paid to an executive based on the 2014, 2015 and2016 programs described above, if his or her employement or servicewith the Company ends before the reward payment unless theexecutive is leaving the Company due to retirement or unless the Boarddecides otherwise.
The cost of the programs will be accounted for as operating expensesduring the duration of the programs.
NOTE 35 DISTRIBUTABLE FUNDS ON 31 DECEMBER 2016The parent company’s distributable funds on 31 December 2016 were EUR 10,413 thousand.
NOTE 36 CASH FLOW FROM BUSINESS OPERATIONS
Non-cash adjustments to the result for the financial year
2016 2015
Depreciation, impairment charges and write-offs 3,244 2,903
Taxes 480 1,413
Financial expenses 394 756
Financial income -423 -599
Other adjustments -1,156 734
Total 2,539 5,207
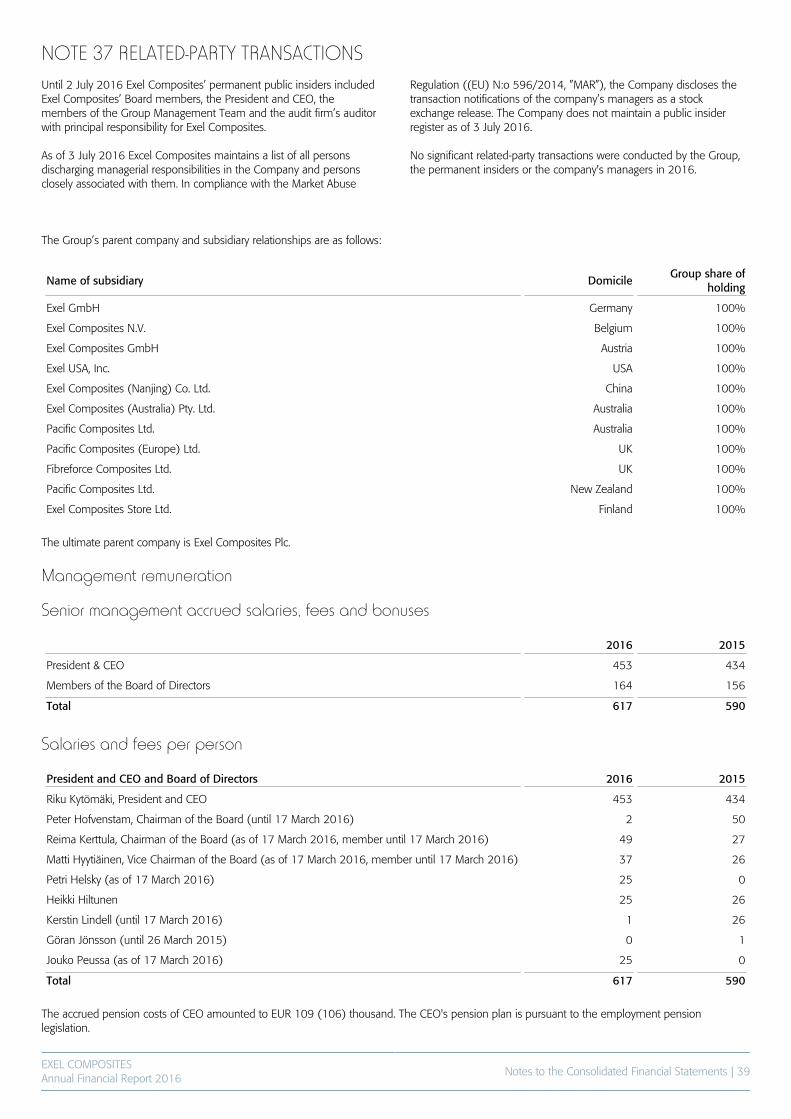
EXEL COMPOSITESAnnual Financial Report 2016
Notes to the Consolidated Financial Statements | 39
NOTE 37 RELATED-PARTY TRANSACTIONSUntil 2 July 2016 Exel Composites’ permanent public insiders includedExel Composites’ Board members, the President and CEO, themembers of the Group Management Team and the audit firm’s auditorwith principal responsibility for Exel Composites.
As of 3 July 2016 Excel Composites maintains a list of all personsdischarging managerial responsibilities in the Company and personsclosely associated with them. In compliance with the Market Abuse
Regulation ((EU) N:o 596/2014, ”MAR”), the Company discloses thetransaction notifications of the company’s managers as a stockexchange release. The Company does not maintain a public insiderregister as of 3 July 2016.
No significant related-party transactions were conducted by the Group,the permanent insiders or the company's managers in 2016.
The Group’s parent company and subsidiary relationships are as follows:
Name of subsidiary DomicileGroup share of
holding
Exel GmbH Germany 100%
Exel Composites N.V. Belgium 100%
Exel Composites GmbH Austria 100%
Exel USA, Inc. USA 100%
Exel Composites (Nanjing) Co. Ltd. China 100%
Exel Composites (Australia) Pty. Ltd. Australia 100%
Pacific Composites Ltd. Australia 100%
Pacific Composites (Europe) Ltd. UK 100%
Fibreforce Composites Ltd. UK 100%
Pacific Composites Ltd. New Zealand 100%
Exel Composites Store Ltd. Finland 100%
The ultimate parent company is Exel Composites Plc.
Management remuneration
Senior management accrued salaries, fees and bonuses
2016 2015
President & CEO 453 434
Members of the Board of Directors 164 156
Total 617 590
Salaries and fees per person
President and CEO and Board of Directors 2016 2015
Riku Kytömäki, President and CEO 453 434
Peter Hofvenstam, Chairman of the Board (until 17 March 2016) 2 50
Reima Kerttula, Chairman of the Board (as of 17 March 2016, member until 17 March 2016) 49 27
Matti Hyytiäinen, Vice Chairman of the Board (as of 17 March 2016, member until 17 March 2016) 37 26
Petri Helsky (as of 17 March 2016) 25 0
Heikki Hiltunen 25 26
Kerstin Lindell (until 17 March 2016) 1 26
Göran Jönsson (until 26 March 2015) 0 1
Jouko Peussa (as of 17 March 2016) 25 0
Total 617 590
The accrued pension costs of CEO amounted to EUR 109 (106) thousand. The CEO's pension plan is pursuant to the employment pensionlegislation.

EXEL COMPOSITESAnnual Financial Report 2016
Notes to the Consolidated Financial Statements | 40
The holdings of the senior management on 31 December 2016
Number of shares and votes 2016 2015
Riku Kytömäki 30,000 13,550
Peter Hofvenstam (until 17 March 2016) 7,755
Reima Kerttula 5,970 3,685
Matti Hyytiäinen 2,487 773
Petri Helsky 1,142 0
Heikki Hiltunen 4,827 3,685
Kerstin Lindell (until 17 March 2016) 1,839
Jouko Peussa 1,142 0
Number of shares and votes total 45,568 34,937
NOTE 38 EVENTS AFTER THE REPORTING PERIODThe project to expand operations in Austria that was initiated in 2015 is put on hold.

EXEL COMPOSITESAnnual Financial Report 2016
Parent Company Income Statement | 41
PARENT COMPANY INCOME STATEMENTEUR Notes 1.1. -31.12.2016 1.1. -31.12.2015
Revenue 1 34,392,412.27 38,159,384.87
Increase (+) / Decrease (-) in inventories of finished goods and work inprogress
196,618.33 -484,553.36
Other operating income 336,446.76 557,369.74
Materials and services
Materials and supplies
Purchases during financial period 11,944,650.08 11,742,260.91
Increase (-) or decrease (+) in inventories -357,420.38 407,563.60
-11,587,229.70 -12,149,824.51
External services -594,786.21 -794,574.26
Personnel expenses 2
Wages and salaries 9,067,848.26 10,344,907.74
Pension costs 1,596,868.09 1,818,594.57
Other personnel expenses 570,935.10 521,118.55
-11,235,651.45 -12,684,620.86
Depreciation and write-down 3
Planned depreciation -1,598,592.24 -1,460,559.29
Other operating expenses 4 -7,388,232.85 -7,484,880.75
Operating profit 2,520,984.91 3,657,741.58
Financial income and expenses 5
Other interest and financial income 341,555.79 471,128.22
Interest paid and other financial expenses -3,198,340.39 -662,737.03
-2,856,784.60 -191,608.81
Profit (-loss) before appropriations -335,799.69 3,466,132.77
Appropriations 6 -40,510.39 -25,011.77
Profit (-loss) before taxes -376,310.08 3,441,121.00
Direct taxes 7 -388,670.25 -817,541.16
Profit (-loss) for the period -764,980.33 2,623,579.84
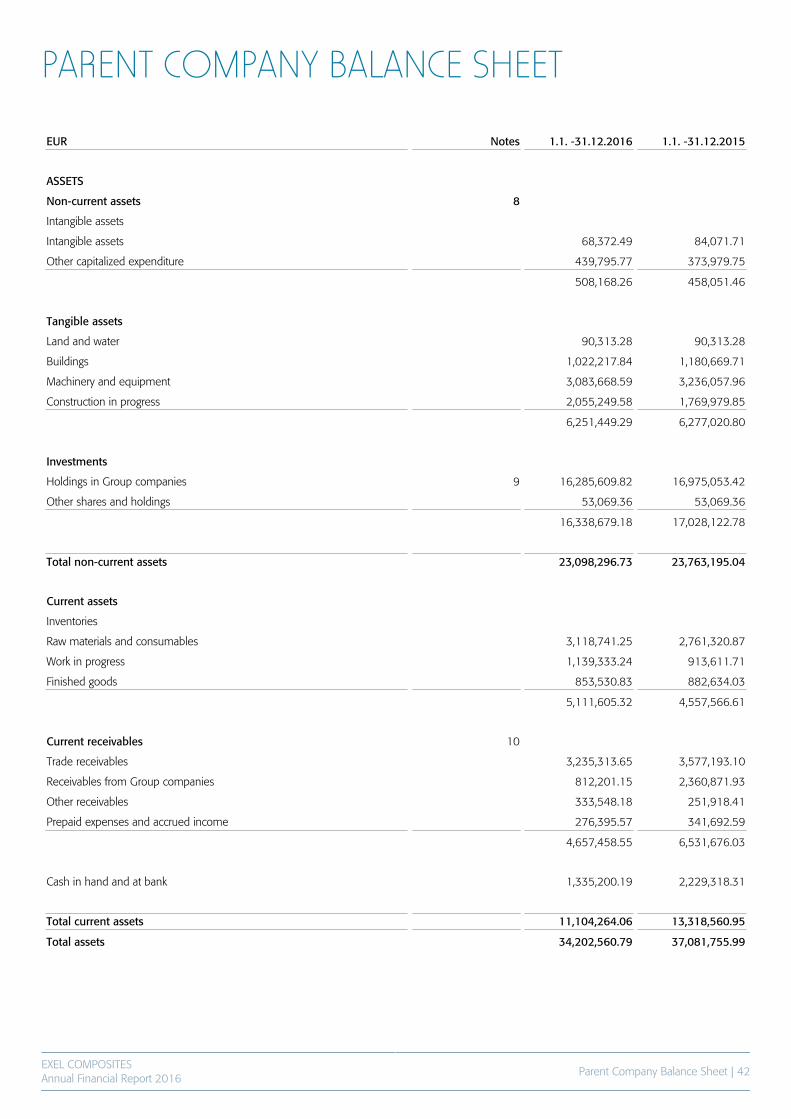
EXEL COMPOSITESAnnual Financial Report 2016
Parent Company Balance Sheet | 42
PARENT COMPANY BALANCE SHEET
EUR Notes 1.1. -31.12.2016 1.1. -31.12.2015
ASSETS
Non-current assets 8
Intangible assets
Intangible assets 68,372.49 84,071.71
Other capitalized expenditure 439,795.77 373,979.75
508,168.26 458,051.46
Tangible assets
Land and water 90,313.28 90,313.28
Buildings 1,022,217.84 1,180,669.71
Machinery and equipment 3,083,668.59 3,236,057.96
Construction in progress 2,055,249.58 1,769,979.85
6,251,449.29 6,277,020.80
Investments
Holdings in Group companies 9 16,285,609.82 16,975,053.42
Other shares and holdings 53,069.36 53,069.36
16,338,679.18 17,028,122.78
Total non-current assets 23,098,296.73 23,763,195.04
Current assets
Inventories
Raw materials and consumables 3,118,741.25 2,761,320.87
Work in progress 1,139,333.24 913,611.71
Finished goods 853,530.83 882,634.03
5,111,605.32 4,557,566.61
Current receivables 10
Trade receivables 3,235,313.65 3,577,193.10
Receivables from Group companies 812,201.15 2,360,871.93
Other receivables 333,548.18 251,918.41
Prepaid expenses and accrued income 276,395.57 341,692.59
4,657,458.55 6,531,676.03
Cash in hand and at bank 1,335,200.19 2,229,318.31
Total current assets 11,104,264.06 13,318,560.95
Total assets 34,202,560.79 37,081,755.99
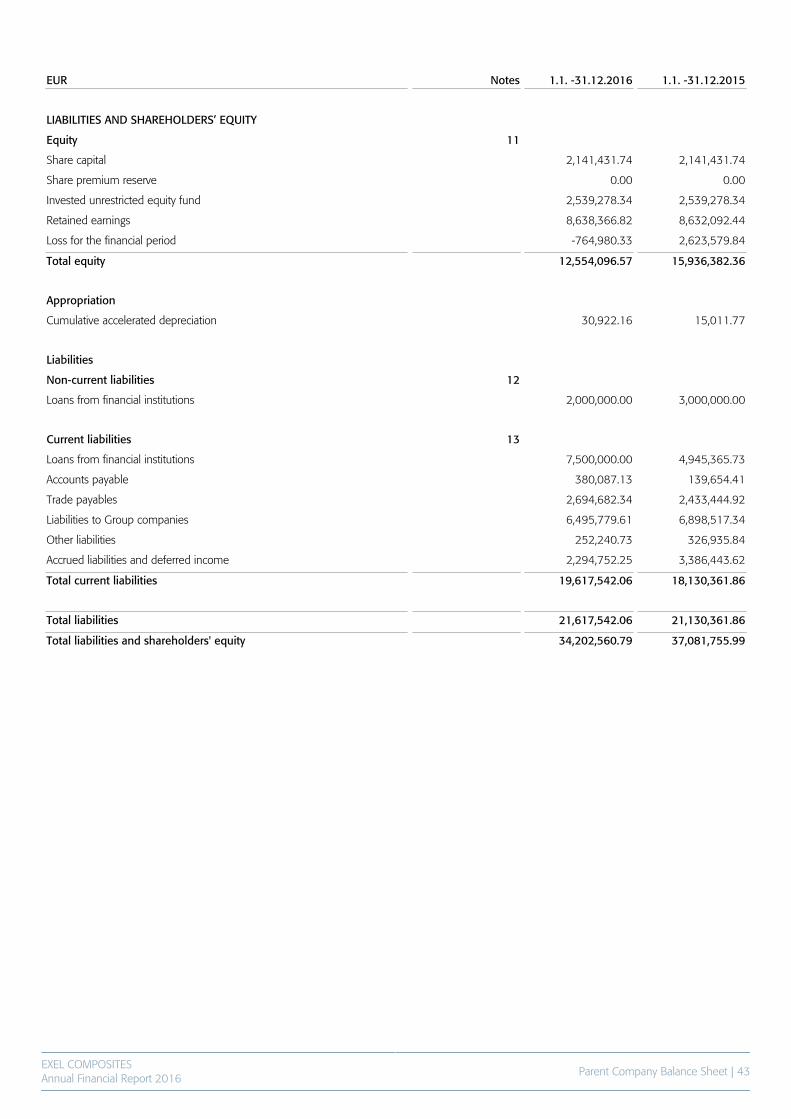
EXEL COMPOSITESAnnual Financial Report 2016
Parent Company Balance Sheet | 43
EUR Notes 1.1. -31.12.2016 1.1. -31.12.2015
LIABILITIES AND SHAREHOLDERS’ EQUITY
Equity 11
Share capital 2,141,431.74 2,141,431.74
Share premium reserve 0.00 0.00
Invested unrestricted equity fund 2,539,278.34 2,539,278.34
Retained earnings 8,638,366.82 8,632,092.44
Loss for the financial period -764,980.33 2,623,579.84
Total equity 12,554,096.57 15,936,382.36
Appropriation
Cumulative accelerated depreciation 30,922.16 15,011.77
Liabilities
Non-current liabilities 12
Loans from financial institutions 2,000,000.00 3,000,000.00
Current liabilities 13
Loans from financial institutions 7,500,000.00 4,945,365.73
Accounts payable 380,087.13 139,654.41
Trade payables 2,694,682.34 2,433,444.92
Liabilities to Group companies 6,495,779.61 6,898,517.34
Other liabilities 252,240.73 326,935.84
Accrued liabilities and deferred income 2,294,752.25 3,386,443.62
Total current liabilities 19,617,542.06 18,130,361.86
Total liabilities 21,617,542.06 21,130,361.86
Total liabilities and shareholders' equity 34,202,560.79 37,081,755.99
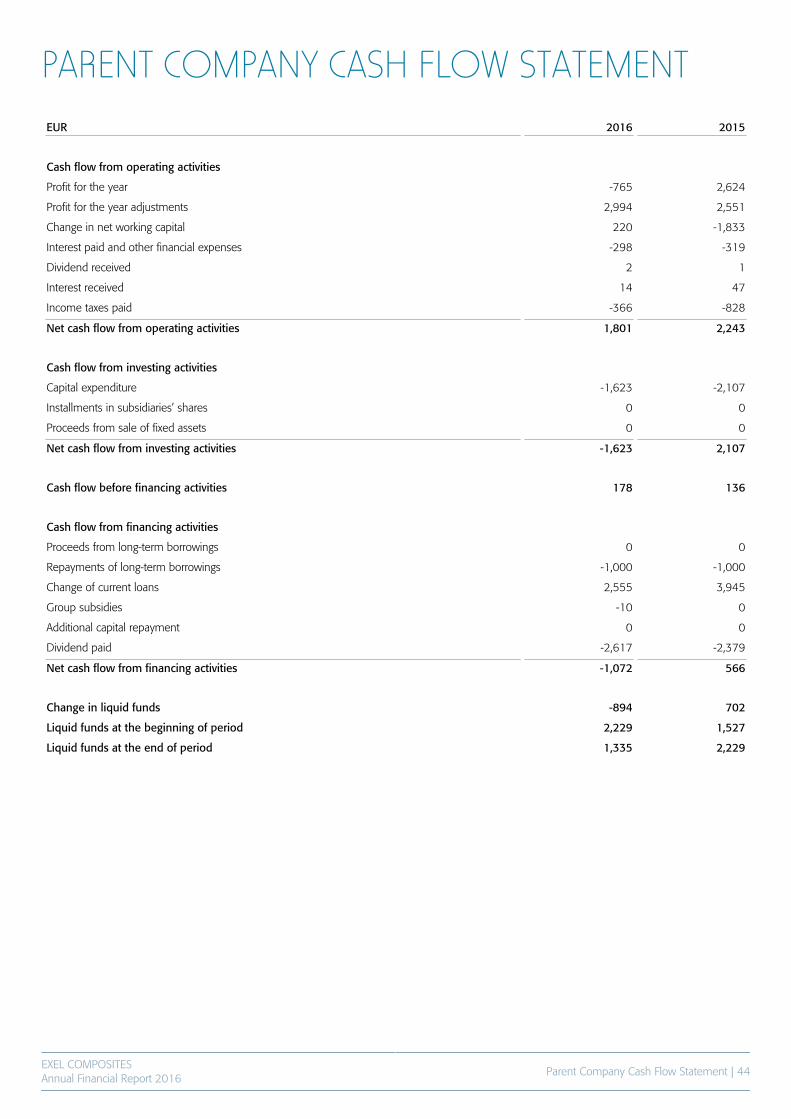
EXEL COMPOSITESAnnual Financial Report 2016
Parent Company Cash Flow Statement | 44
PARENT COMPANY CASH FLOW STATEMENTEUR 2016 2015
Cash flow from operating activities
Profit for the year -765 2,624
Profit for the year adjustments 2,994 2,551
Change in net working capital 220 -1,833
Interest paid and other financial expenses -298 -319
Dividend received 2 1
Interest received 14 47
Income taxes paid -366 -828
Net cash flow from operating activities 1,801 2,243
Cash flow from investing activities
Capital expenditure -1,623 -2,107
Installments in subsidiaries’ shares 0 0
Proceeds from sale of fixed assets 0 0
Net cash flow from investing activities -1,623 2,107
Cash flow before financing activities 178 136
Cash flow from financing activities
Proceeds from long-term borrowings 0 0
Repayments of long-term borrowings -1,000 -1,000
Change of current loans 2,555 3,945
Group subsidies -10 0
Additional capital repayment 0 0
Dividend paid -2,617 -2,379
Net cash flow from financing activities -1,072 566
Change in liquid funds -894 702
Liquid funds at the beginning of period 2,229 1,527
Liquid funds at the end of period 1,335 2,229

EXEL COMPOSITESAnnual Financial Report 2016
Notes to the Parent Company Financial Statements | 45
NOTES TO THE PARENT COMPANY FINANCIALSTATEMENTS(All figures in EUR thousands unless otherwise stated)
NOTE 1 REVENUE BY MARKET AREA
2016 2015
Europe 30,755 33,874
APAC 1,801 1,892
Rest of world 1,836 2,393
Total 34,392 38,159
NOTE 2 PERSONNEL EXPENSES
Paid
2016 2015
President and CEO 453 434
Members of the Board 164 156
Total 617 590
Average personnel employed
2016 2015
Office employees 82 87
Production employees 128 129
Total 210 216
NOTE 3 DEPRECIATIONFixed assets have been entered in the balance sheet at cost after deduction of planned depreciation. Planned depreciation is calculated on the basis ofeconomic life, as a straight-line depreciation on the original cost.
Planned depreciation periods
Buildings 5-20 yearsMachinery and equipment 3-8 yearsOther capitalized expenditure 3-8 yearsGoodwill 10 yearsIntangible rights 3-5 years
Planned depreciation, amortization and impairment
2016 2015
Intangible rights 39 36
Other capitalized expenditure 137 143
Buildings 193 215
Machinery and equipment 1,230 1,066
Write-downs of non-current assets 0 0
Total 1,599 1,461
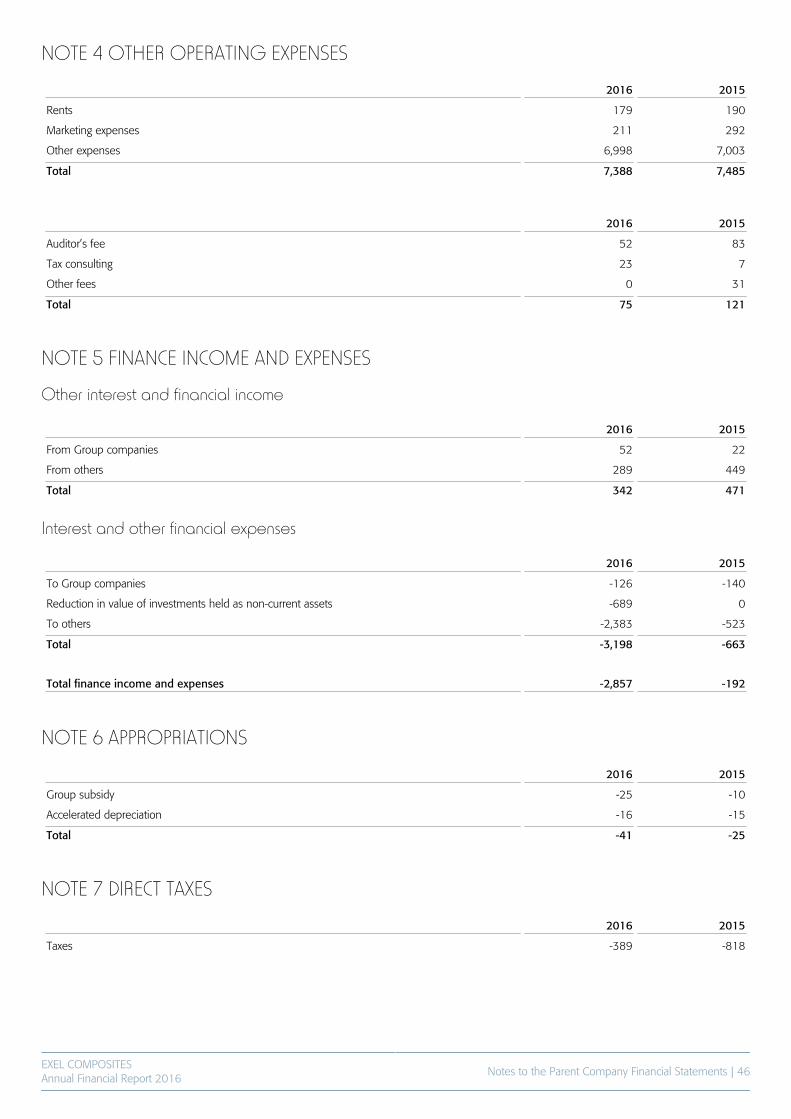
EXEL COMPOSITESAnnual Financial Report 2016
Notes to the Parent Company Financial Statements | 46
NOTE 4 OTHER OPERATING EXPENSES
2016 2015
Rents 179 190
Marketing expenses 211 292
Other expenses 6,998 7,003
Total 7,388 7,485
2016 2015
Auditor’s fee 52 83
Tax consulting 23 7
Other fees 0 31
Total 75 121
NOTE 5 FINANCE INCOME AND EXPENSES
Other interest and financial income
2016 2015
From Group companies 52 22
From others 289 449
Total 342 471
Interest and other financial expenses
2016 2015
To Group companies -126 -140
Reduction in value of investments held as non-current assets -689 0
To others -2,383 -523
Total -3,198 -663
Total finance income and expenses -2,857 -192
NOTE 6 APPROPRIATIONS
2016 2015
Group subsidy -25 -10
Accelerated depreciation -16 -15
Total -41 -25
NOTE 7 DIRECT TAXES
2016 2015
Taxes -389 -818
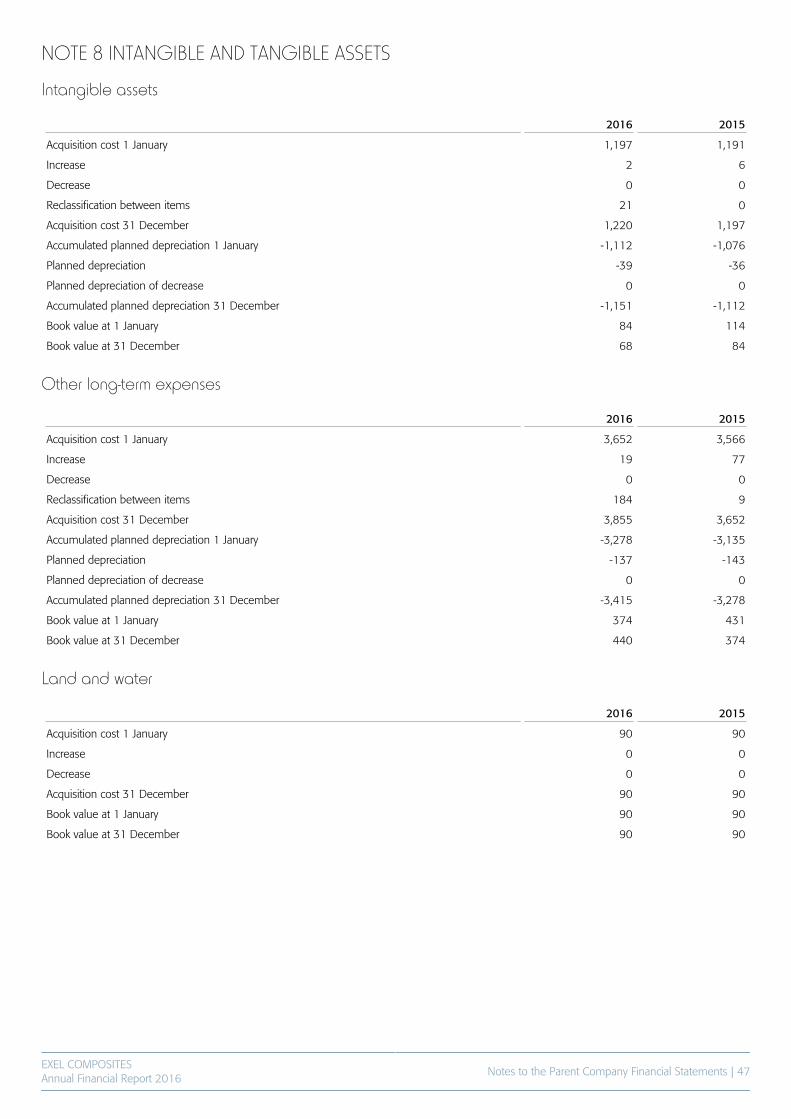
EXEL COMPOSITESAnnual Financial Report 2016
Notes to the Parent Company Financial Statements | 47
NOTE 8 INTANGIBLE AND TANGIBLE ASSETS
Intangible assets
2016 2015
Acquisition cost 1 January 1,197 1,191
Increase 2 6
Decrease 0 0
Reclassification between items 21 0
Acquisition cost 31 December 1,220 1,197
Accumulated planned depreciation 1 January -1,112 -1,076
Planned depreciation -39 -36
Planned depreciation of decrease 0 0
Accumulated planned depreciation 31 December -1,151 -1,112
Book value at 1 January 84 114
Book value at 31 December 68 84
Other long-term expenses
2016 2015
Acquisition cost 1 January 3,652 3,566
Increase 19 77
Decrease 0 0
Reclassification between items 184 9
Acquisition cost 31 December 3,855 3,652
Accumulated planned depreciation 1 January -3,278 -3,135
Planned depreciation -137 -143
Planned depreciation of decrease 0 0
Accumulated planned depreciation 31 December -3,415 -3,278
Book value at 1 January 374 431
Book value at 31 December 440 374
Land and water
2016 2015
Acquisition cost 1 January 90 90
Increase 0 0
Decrease 0 0
Acquisition cost 31 December 90 90
Book value at 1 January 90 90
Book value at 31 December 90 90
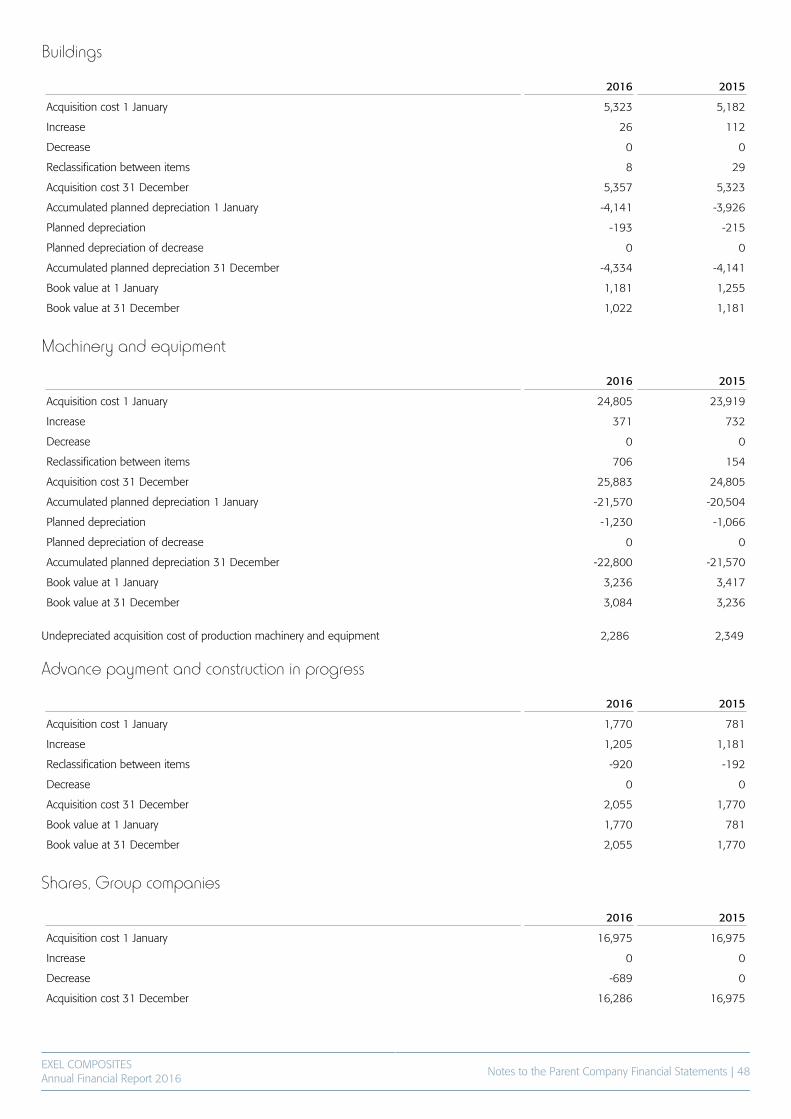
EXEL COMPOSITESAnnual Financial Report 2016
Notes to the Parent Company Financial Statements | 48
Buildings
2016 2015
Acquisition cost 1 January 5,323 5,182
Increase 26 112
Decrease 0 0
Reclassification between items 8 29
Acquisition cost 31 December 5,357 5,323
Accumulated planned depreciation 1 January -4,141 -3,926
Planned depreciation -193 -215
Planned depreciation of decrease 0 0
Accumulated planned depreciation 31 December -4,334 -4,141
Book value at 1 January 1,181 1,255
Book value at 31 December 1,022 1,181
Machinery and equipment
2016 2015
Acquisition cost 1 January 24,805 23,919
Increase 371 732
Decrease 0 0
Reclassification between items 706 154
Acquisition cost 31 December 25,883 24,805
Accumulated planned depreciation 1 January -21,570 -20,504
Planned depreciation -1,230 -1,066
Planned depreciation of decrease 0 0
Accumulated planned depreciation 31 December -22,800 -21,570
Book value at 1 January 3,236 3,417
Book value at 31 December 3,084 3,236
Undepreciated acquisition cost of production machinery and equipment 2,286 2,349
Advance payment and construction in progress
2016 2015
Acquisition cost 1 January 1,770 781
Increase 1,205 1,181
Reclassification between items -920 -192
Decrease 0 0
Acquisition cost 31 December 2,055 1,770
Book value at 1 January 1,770 781
Book value at 31 December 2,055 1,770
Shares, Group companies
2016 2015
Acquisition cost 1 January 16,975 16,975
Increase 0 0
Decrease -689 0
Acquisition cost 31 December 16,286 16,975
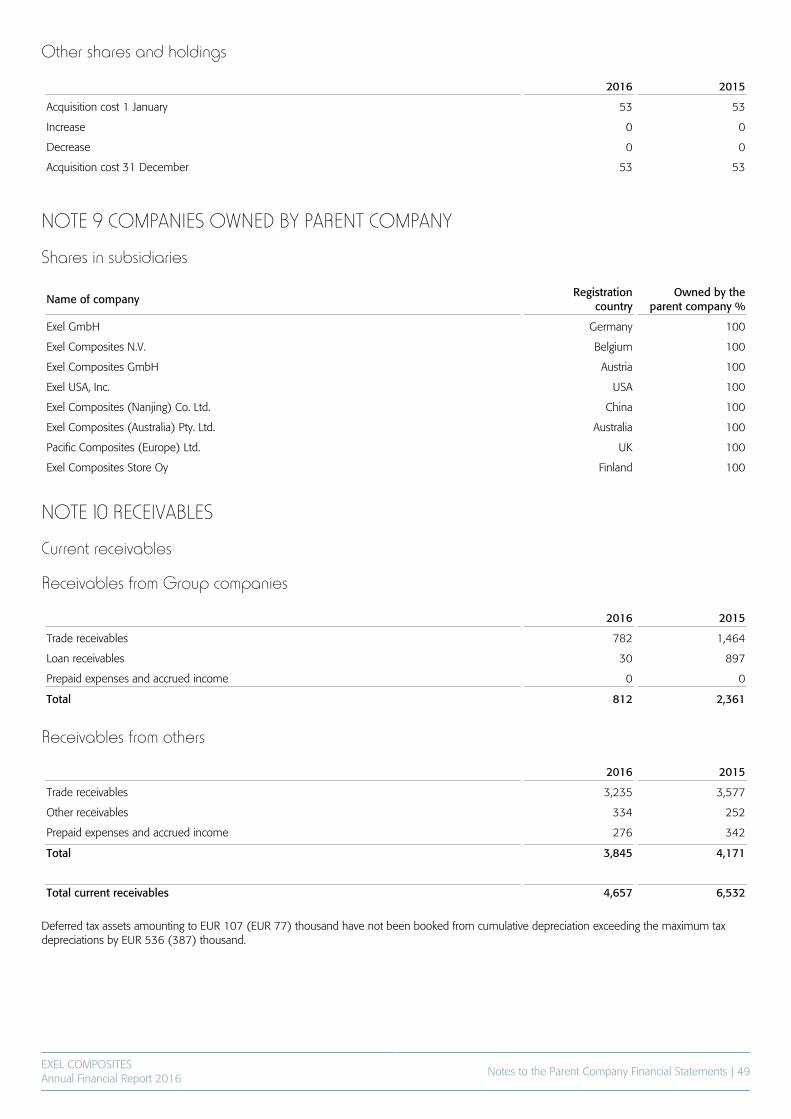
EXEL COMPOSITESAnnual Financial Report 2016
Notes to the Parent Company Financial Statements | 49
Other shares and holdings
2016 2015
Acquisition cost 1 January 53 53
Increase 0 0
Decrease 0 0
Acquisition cost 31 December 53 53
NOTE 9 COMPANIES OWNED BY PARENT COMPANY
Shares in subsidiaries
Name of companyRegistration
countryOwned by the
parent company %
Exel GmbH Germany 100
Exel Composites N.V. Belgium 100
Exel Composites GmbH Austria 100
Exel USA, Inc. USA 100
Exel Composites (Nanjing) Co. Ltd. China 100
Exel Composites (Australia) Pty. Ltd. Australia 100
Pacific Composites (Europe) Ltd. UK 100
Exel Composites Store Oy Finland 100
NOTE 10 RECEIVABLES
Current receivables
Receivables from Group companies
2016 2015
Trade receivables 782 1,464
Loan receivables 30 897
Prepaid expenses and accrued income 0 0
Total 812 2,361
Receivables from others
2016 2015
Trade receivables 3,235 3,577
Other receivables 334 252
Prepaid expenses and accrued income 276 342
Total 3,845 4,171
Total current receivables 4,657 6,532
Deferred tax assets amounting to EUR 107 (EUR 77) thousand have not been booked from cumulative depreciation exceeding the maximum taxdepreciations by EUR 536 (387) thousand.
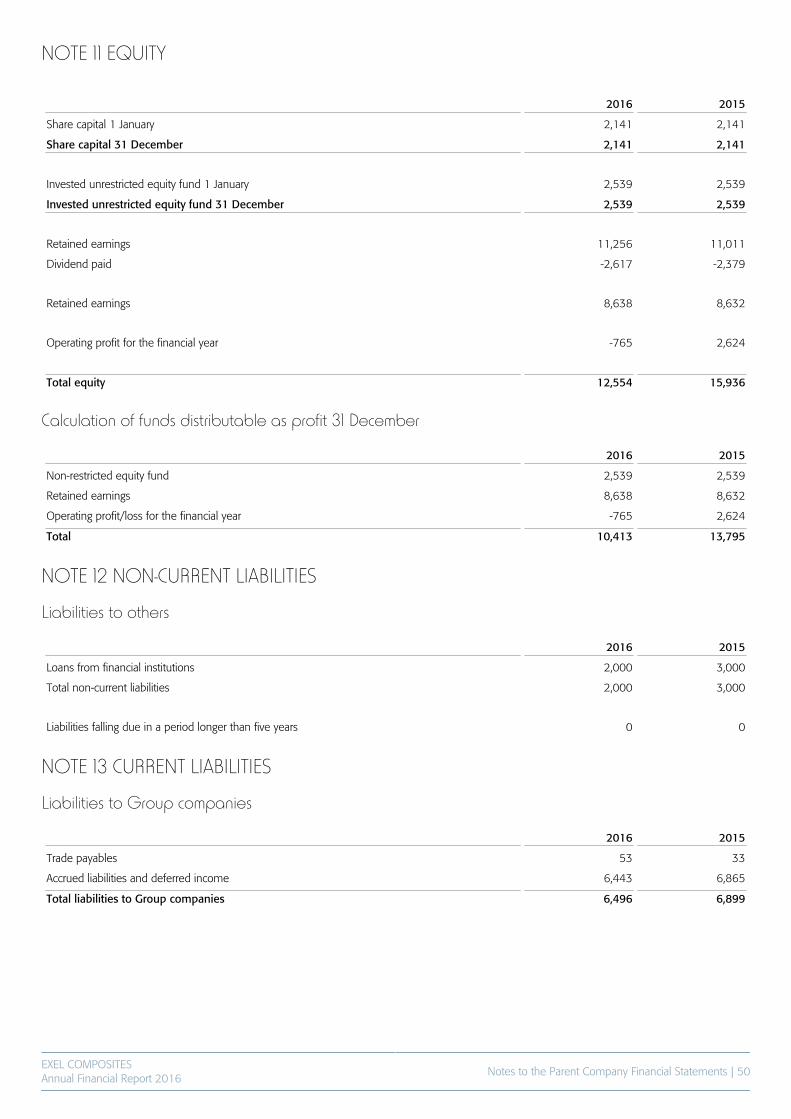
EXEL COMPOSITESAnnual Financial Report 2016
Notes to the Parent Company Financial Statements | 50
NOTE 11 EQUITY
2016 2015
Share capital 1 January 2,141 2,141
Share capital 31 December 2,141 2,141
Invested unrestricted equity fund 1 January 2,539 2,539
Invested unrestricted equity fund 31 December 2,539 2,539
Retained earnings 11,256 11,011
Dividend paid -2,617 -2,379
Retained earnings 8,638 8,632
Operating profit for the financial year -765 2,624
Total equity 12,554 15,936
Calculation of funds distributable as profit 31 December
2016 2015
Non-restricted equity fund 2,539 2,539
Retained earnings 8,638 8,632
Operating profit/loss for the financial year -765 2,624
Total 10,413 13,795
NOTE 12 NON-CURRENT LIABILITIES
Liabilities to others
2016 2015
Loans from financial institutions 2,000 3,000
Total non-current liabilities 2,000 3,000
Liabilities falling due in a period longer than five years 0 0
NOTE 13 CURRENT LIABILITIES
Liabilities to Group companies
2016 2015
Trade payables 53 33
Accrued liabilities and deferred income 6,443 6,865
Total liabilities to Group companies 6,496 6,899
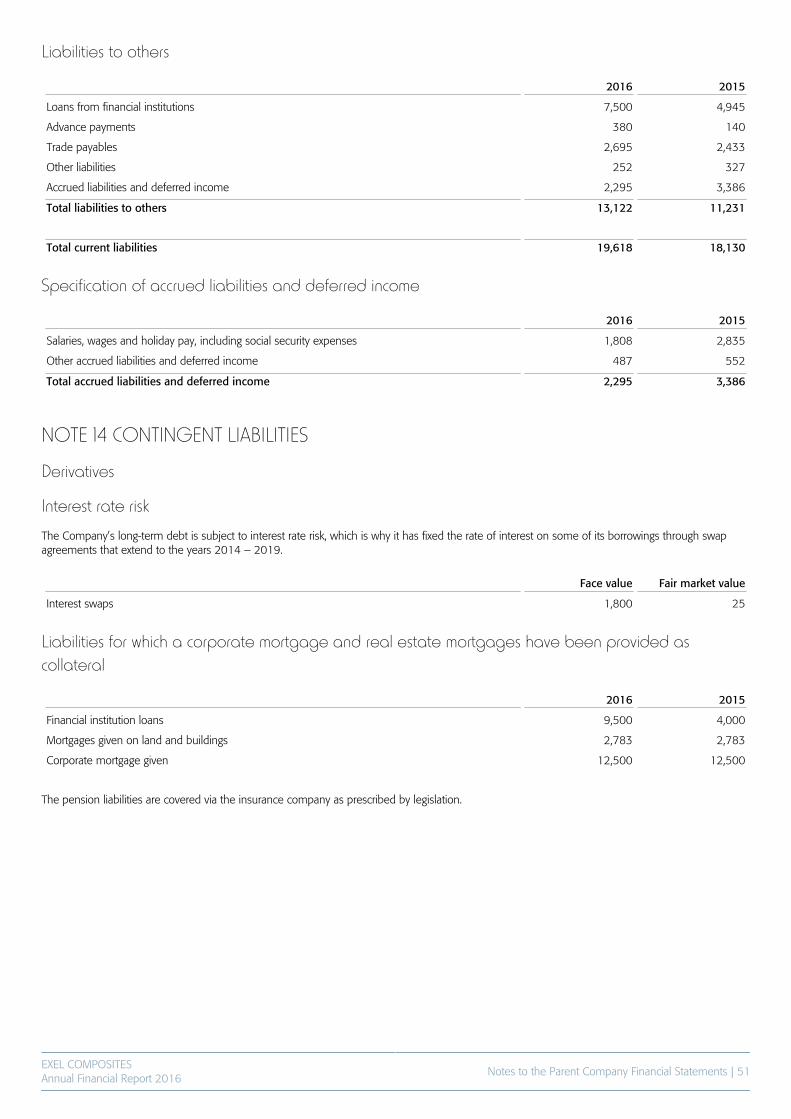
EXEL COMPOSITESAnnual Financial Report 2016
Notes to the Parent Company Financial Statements | 51
Liabilities to others
2016 2015
Loans from financial institutions 7,500 4,945
Advance payments 380 140
Trade payables 2,695 2,433
Other liabilities 252 327
Accrued liabilities and deferred income 2,295 3,386
Total liabilities to others 13,122 11,231
Total current liabilities 19,618 18,130
Specification of accrued liabilities and deferred income
2016 2015
Salaries, wages and holiday pay, including social security expenses 1,808 2,835
Other accrued liabilities and deferred income 487 552
Total accrued liabilities and deferred income 2,295 3,386
NOTE 14 CONTINGENT LIABILITIES
Derivatives
Interest rate risk
The Company’s long-term debt is subject to interest rate risk, which is why it has fixed the rate of interest on some of its borrowings through swapagreements that extend to the years 2014 – 2019.
Face value Fair market value
Interest swaps 1,800 25
Liabilities for which a corporate mortgage and real estate mortgages have been provided ascollateral
2016 2015
Financial institution loans 9,500 4,000
Mortgages given on land and buildings 2,783 2,783
Corporate mortgage given 12,500 12,500
The pension liabilities are covered via the insurance company as prescribed by legislation.
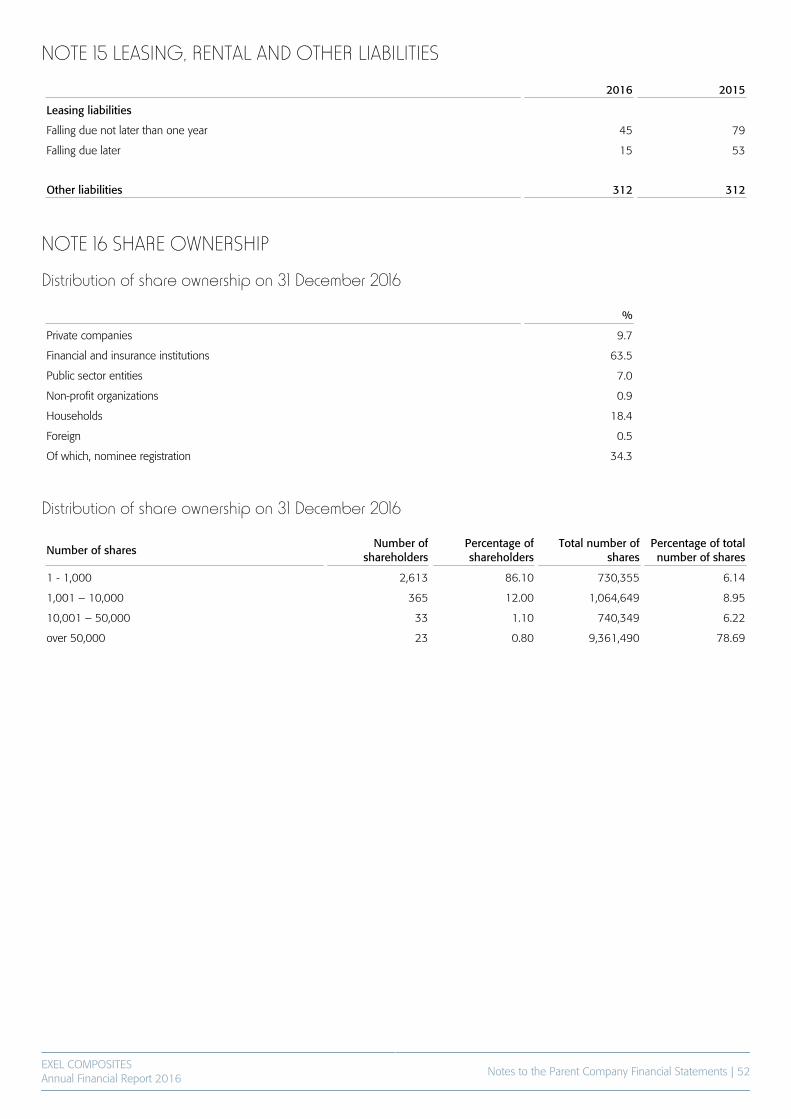
EXEL COMPOSITESAnnual Financial Report 2016
Notes to the Parent Company Financial Statements | 52
NOTE 15 LEASING, RENTAL AND OTHER LIABILITIES
2016 2015
Leasing liabilities
Falling due not later than one year 45 79
Falling due later 15 53
Other liabilities 312 312
NOTE 16 SHARE OWNERSHIP
Distribution of share ownership on 31 December 2016
%
Private companies 9.7
Financial and insurance institutions 63.5
Public sector entities 7.0
Non-profit organizations 0.9
Households 18.4
Foreign 0.5
Of which, nominee registration 34.3
Distribution of share ownership on 31 December 2016
Number of sharesNumber of
shareholdersPercentage ofshareholders
Total number ofshares
Percentage of totalnumber of shares
1 - 1,000 2,613 86.10 730,355 6.14
1,001 – 10,000 365 12.00 1,064,649 8.95
10,001 – 50,000 33 1.10 740,349 6.22
over 50,000 23 0.80 9,361,490 78.69
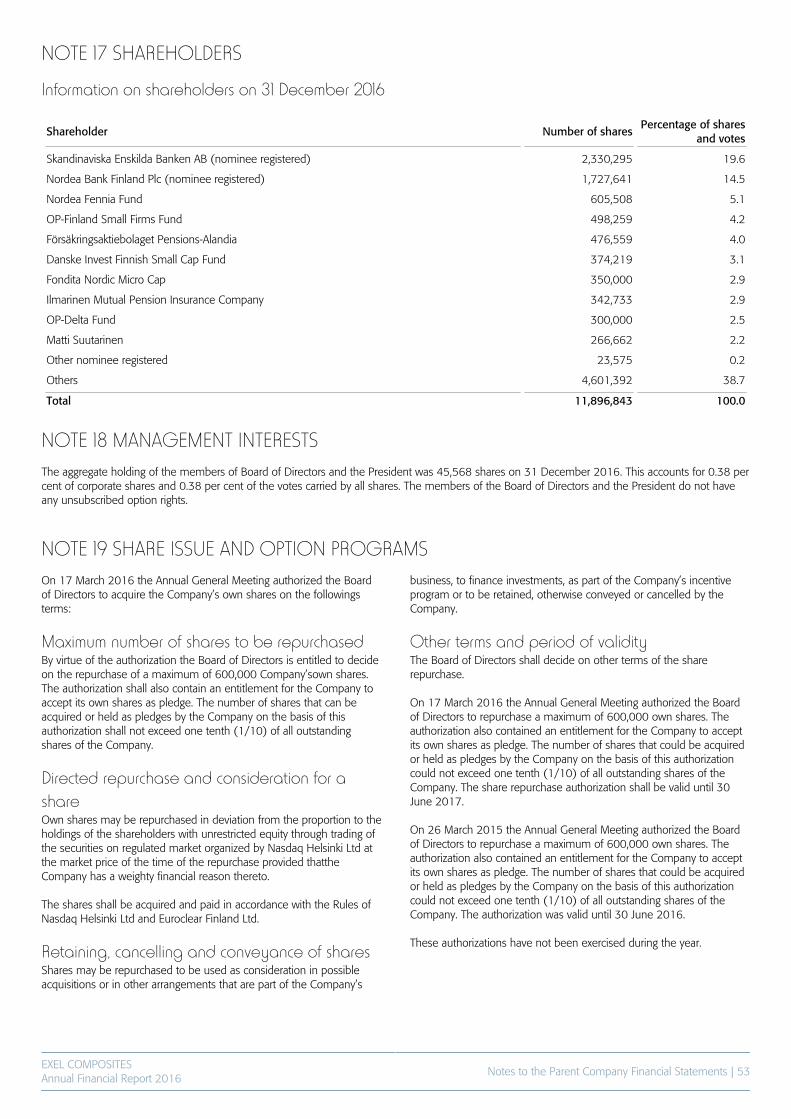
EXEL COMPOSITESAnnual Financial Report 2016
Notes to the Parent Company Financial Statements | 53
NOTE 17 SHAREHOLDERS
Information on shareholders on 31 December 2016
Shareholder Number of sharesPercentage of shares
and votes
Skandinaviska Enskilda Banken AB (nominee registered) 2,330,295 19.6
Nordea Bank Finland Plc (nominee registered) 1,727,641 14.5
Nordea Fennia Fund 605,508 5.1
OP-Finland Small Firms Fund 498,259 4.2
Försäkringsaktiebolaget Pensions-Alandia 476,559 4.0
Danske Invest Finnish Small Cap Fund 374,219 3.1
Fondita Nordic Micro Cap 350,000 2.9
Ilmarinen Mutual Pension Insurance Company 342,733 2.9
OP-Delta Fund 300,000 2.5
Matti Suutarinen 266,662 2.2
Other nominee registered 23,575 0.2
Others 4,601,392 38.7
Total 11,896,843 100.0
NOTE 18 MANAGEMENT INTERESTSThe aggregate holding of the members of Board of Directors and the President was 45,568 shares on 31 December 2016. This accounts for 0.38 percent of corporate shares and 0.38 per cent of the votes carried by all shares. The members of the Board of Directors and the President do not haveany unsubscribed option rights.
NOTE 19 SHARE ISSUE AND OPTION PROGRAMSOn 17 March 2016 the Annual General Meeting authorized the Boardof Directors to acquire the Company’s own shares on the followingsterms:
Maximum number of shares to be repurchasedBy virtue of the authorization the Board of Directors is entitled to decideon the repurchase of a maximum of 600,000 Company’sown shares.The authorization shall also contain an entitlement for the Company toaccept its own shares as pledge. The number of shares that can beacquired or held as pledges by the Company on the basis of thisauthorization shall not exceed one tenth (1/10) of all outstandingshares of the Company.
Directed repurchase and consideration for ashareOwn shares may be repurchased in deviation from the proportion to theholdings of the shareholders with unrestricted equity through trading ofthe securities on regulated market organized by Nasdaq Helsinki Ltd atthe market price of the time of the repurchase provided thattheCompany has a weighty financial reason thereto. The shares shall be acquired and paid in accordance with the Rules ofNasdaq Helsinki Ltd and Euroclear Finland Ltd.
Retaining, cancelling and conveyance of sharesShares may be repurchased to be used as consideration in possibleacquisitions or in other arrangements that are part of the Company’s
business, to finance investments, as part of the Company’s incentiveprogram or to be retained, otherwise conveyed or cancelled by theCompany.
Other terms and period of validityThe Board of Directors shall decide on other terms of the sharerepurchase. On 17 March 2016 the Annual General Meeting authorized the Boardof Directors to repurchase a maximum of 600,000 own shares. Theauthorization also contained an entitlement for the Company to acceptits own shares as pledge. The number of shares that could be acquiredor held as pledges by the Company on the basis of this authorizationcould not exceed one tenth (1/10) of all outstanding shares of theCompany. The share repurchase authorization shall be valid until 30June 2017. On 26 March 2015 the Annual General Meeting authorized the Boardof Directors to repurchase a maximum of 600,000 own shares. Theauthorization also contained an entitlement for the Company to acceptits own shares as pledge. The number of shares that could be acquiredor held as pledges by the Company on the basis of this authorizationcould not exceed one tenth (1/10) of all outstanding shares of theCompany. The authorization was valid until 30 June 2016.
These authorizations have not been exercised during the year.
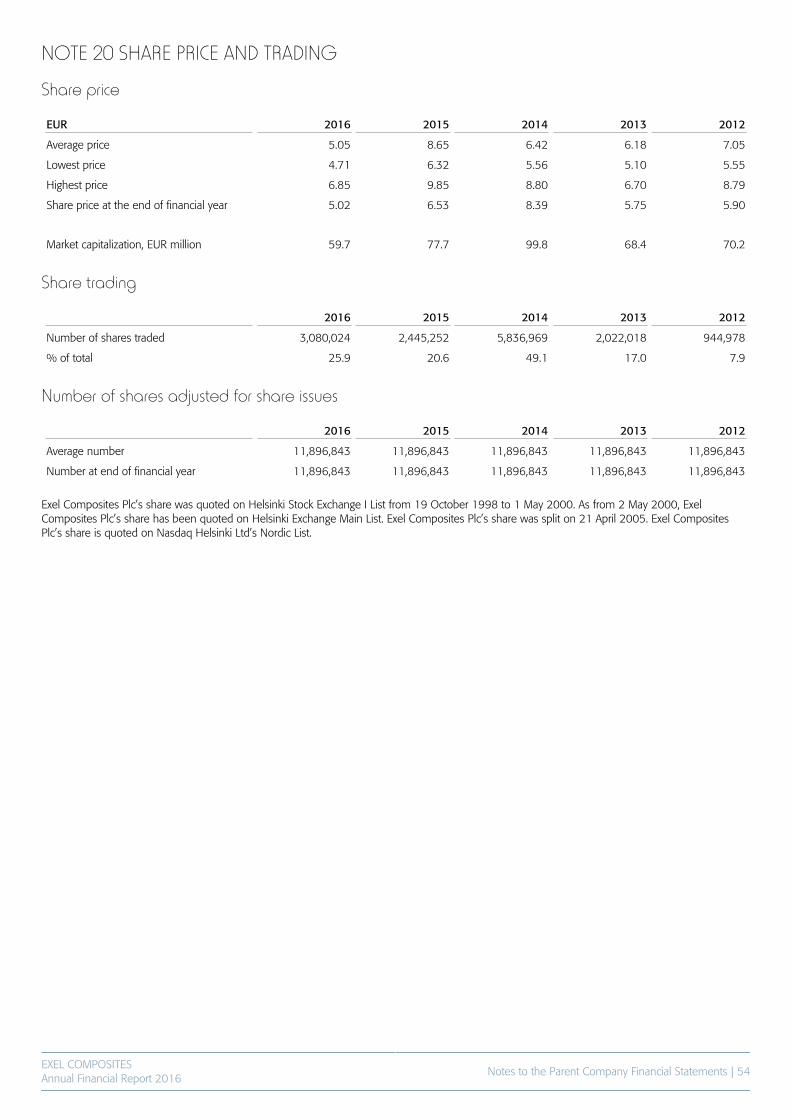
EXEL COMPOSITESAnnual Financial Report 2016
Notes to the Parent Company Financial Statements | 54
NOTE 20 SHARE PRICE AND TRADING
Share price
EUR 2016 2015 2014 2013 2012
Average price 5.05 8.65 6.42 6.18 7.05
Lowest price 4.71 6.32 5.56 5.10 5.55
Highest price 6.85 9.85 8.80 6.70 8.79
Share price at the end of financial year 5.02 6.53 8.39 5.75 5.90
Market capitalization, EUR million 59.7 77.7 99.8 68.4 70.2
Share trading
2016 2015 2014 2013 2012
Number of shares traded 3,080,024 2,445,252 5,836,969 2,022,018 944,978
% of total 25.9 20.6 49.1 17.0 7.9
Number of shares adjusted for share issues
2016 2015 2014 2013 2012
Average number 11,896,843 11,896,843 11,896,843 11,896,843 11,896,843
Number at end of financial year 11,896,843 11,896,843 11,896,843 11,896,843 11,896,843
Exel Composites Plc’s share was quoted on Helsinki Stock Exchange I List from 19 October 1998 to 1 May 2000. As from 2 May 2000, ExelComposites Plc’s share has been quoted on Helsinki Exchange Main List. Exel Composites Plc’s share was split on 21 April 2005. Exel CompositesPlc’s share is quoted on Nasdaq Helsinki Ltd’s Nordic List.
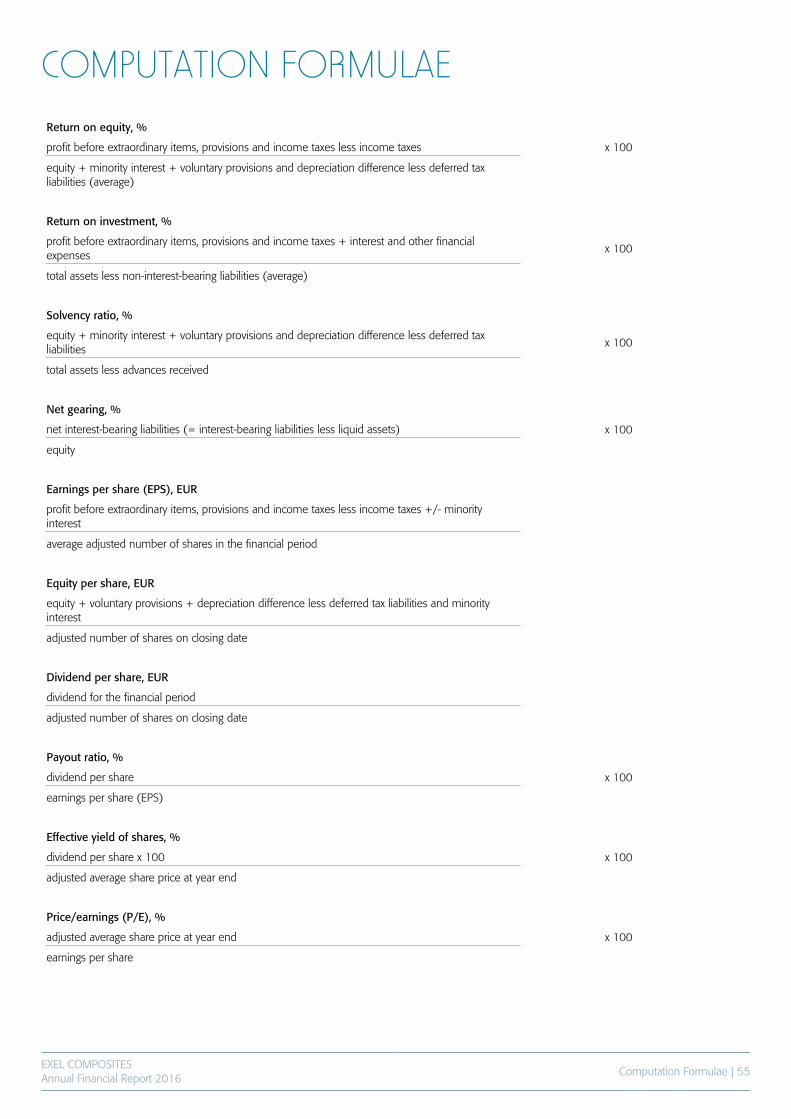
EXEL COMPOSITESAnnual Financial Report 2016
Computation Formulae | 55
COMPUTATION FORMULAEReturn on equity, %
profit before extraordinary items, provisions and income taxes less income taxes x 100
equity + minority interest + voluntary provisions and depreciation difference less deferred taxliabilities (average)
Return on investment, %
profit before extraordinary items, provisions and income taxes + interest and other financialexpenses
x 100
total assets less non-interest-bearing liabilities (average)
Solvency ratio, %
equity + minority interest + voluntary provisions and depreciation difference less deferred taxliabilities
x 100
total assets less advances received
Net gearing, %
net interest-bearing liabilities (= interest-bearing liabilities less liquid assets) x 100
equity
Earnings per share (EPS), EUR
profit before extraordinary items, provisions and income taxes less income taxes +/- minorityinterest
average adjusted number of shares in the financial period
Equity per share, EUR
equity + voluntary provisions + depreciation difference less deferred tax liabilities and minorityinterest
adjusted number of shares on closing date
Dividend per share, EUR
dividend for the financial period
adjusted number of shares on closing date
Payout ratio, %
dividend per share x 100
earnings per share (EPS)
Effective yield of shares, %
dividend per share x 100 x 100
adjusted average share price at year end
Price/earnings (P/E), %
adjusted average share price at year end x 100
earnings per share
EXEL COMPOSITESAnnual Financial Report 2016
Proposal for Distrubution of Profit | 56
PROPOSAL FOR DISTRUBUTION OF PROFITExel Composites Plc’s distributable funds are EUR 10,412,664.83 of which loss for the financial period accounts for EUR 764,980.33.
The Board proposes that the profit funds be distributed as follows:
- a dividend of EUR 0.10 per share 1,189,684.30
- carried over as equity, EUR 9,222,980.53
10,412,664.83
Vantaa, 13 February 2017
Reima Kerttula
Chairman
Matti Hyytiäinen Heikki Hiltunen
Vice Chairman
Petri Helsky Jouko Peussa
Riku Kytömäki
President and CEO
Our auditor’s report has been issued today.
Vantaa, 13 February 2017
Ernst & YoungAuthorized Public Accountants
Juha HilmolaAuthorized Public Accountant
EXEL COMPOSITESAnnual Financial Report 2016
Auditor's Report| 57
AUDITOR'S REPORT(Translation of the Finnish original)
To the Annual General Meeting of Exel Composites Oyj
Report on the Audit of FinancialStatementsOpinionWe have audited the financial statements of Exel Composites Oyj(business identity code 1067292-7) for the year ended 31 December,2016. The financial statements comprise the consolidated statement ofcomprehensive income, statement of financial position, statement ofcash flows, statement of changes in equity and notes, including asummary of significant accounting policies, as well as the parentcompany’s income statement, balance sheet, statement of cash flowsand notes to the financial statements. In our opinion• the consolidated financial statements give a true and fair view of thegroup’s financial position as well as its financial performance and itscash flows in accordance with International Financial ReportingStandards (IFRS) as adopted by the EU,• the financial statements give a true and fair view of the parentcompany’s financial performance and financial position in accordancewith the laws and regulations governing the preparation of financialstatements in Finland and comply with statutory requirements.
Basis for OpinionWe conducted our audit in accordance with good auditing practice inFinland. Our responsibilities under good auditing practice are furtherdescribed in the Auditor’s Responsibilities for the Audit of FinancialStatements section of our report. We are independent of the parent company and of the groupcompanies in accordance with the ethical requirements that areapplicable in Finland and are relevant to our audit, and we have fulfilledour other ethical responsibilities in accordance with these requirements. We believe that the audit evidence we have obtained is sufficient andappropriate to provide a basis for our opinion.
Key Audit MattersKey audit matters are those matters that, in our professional judgment,were of most significance in our audit of the financial statements of thecurrent period. These matters were addressed in the context of ouraudit of the financial statements as a whole, and in forming our opinionthereon, and we do not provide a separate opinion on thesematters.sekä laatiessamme siitä annettavaa lausuntoa, emmekä annanäistä seikoista erillistä lausuntoa. We have fulfilled the responsibilities described in the Auditor’sresponsibilities for the audit of the financial statements section of ourreport, including in relation to these matters. Accordingly, our auditincluded the performance of procedures designed to respond to ourassessment of the risks of material misstatement of the financialstatements. The results of our audit procedures, including theprocedures performed to address the matters below, provide the basisfor our audit opinion on the accompanying financial statements.
We have also addressed the risk of management override of internalcontrols. This includes consideration of whether there was evidence ofmanagement bias that represented a risk of material misstatement dueto fraud.
Inventory valuationThe value of inventories at 31 December 2016 was 9,9 m€ comprising19% of total assets. The determination of cost of inventory requires themanagement to estimate the appropriate allocation of fixed and variableproduction costs. In addition, the valuation of inventory requires themanagement to estimate whether estimated selling price is less thanproduction cost. Our audit procedures to address the risk of material misstatementrelating to inventory valuation included, among others: • Substantive audit procedures to evaluate the allocation of fixed andvariable production costs and to evaluate whether carrying value ofinventory exceeds net realizable value• Comparing the inventory obsolescence provision to accountingprinciples applied by the group• Assessing the methods applied in determining obsolescence provision• Considering the appropriateness of the disclosures in respect ofinventory. Accounting principles and disclosures on inventory valuation areincluded in Note 5 and Note 23. Goodwill impairment testingGoodwill amounted to 9,8 m€ as of 31 December 2016 comprising19% of total assets and 36% of equity. Procedures over management’sannual impairment testing were significant to our audit because of thecomplexity of the estimation process and significant estimates andassumptions, which are impacted by future events in marketenvironment and economy, applied by the management. Our audit procedures to address the risk of material misstatementrelating to the impairment testing included, among others: • Involving valuation specialists to assist us in evaluating theassumptions and methodologies applied by the management as well ascomparing management’s assumptions to external sources and industryaverages, especially in relation to weighted average cost of capital• Evaluating the key assumptions, such as projected growth in revenuesas well as operating profit margin• Comparing the results of the impairment testing to marketcapitalization of the company• Considering the appropriateness of disclosures in respect ofimpairment testing.
Accounting principles and disclosures on goodwill impairment testingare included in Note 5 and Note 28.
EXEL COMPOSITESAnnual Financial Report 2016
Auditor's Report | 58
RevenuesRevenue recognition was considered significant to our audit especially inrelation to appropriate timing of revenue recognition. Due to volume oftransactions small individual misstatements can in aggregate be materialto the financial statements. Our audit procedures to address the risk of material misstatementrelating to timing of revenue recognition included, among others: • Testing of controls addressing timing of revenue recognition, includinggeneral controls over most significant IT applications• Comparing sales transactions recorded at year end to documentationsupporting revenue recognition• Obtaining external confirmations on accounts receivables to test theexistence of accounts receivable• Considering the appropriateness of the disclosures in respect ofrevenue recognition. Accounting principles on revenue recognition are included in Note 5.
Responsibilities of the Board of Directors and theManaging Director for the Financial StatementsThe Board of Directors and the Managing Director are responsible forthe preparation of consolidated financial statements that give a true andfair view in accordance with International Financial Reporting Standards(IFRS) as adopted by the EU, and of financial statements that give a trueand fair view in accordance with the laws and regulations governing thepreparation of financial statements in Finland an comply with statutoryrequirements. The Board of Directors and the Managing Director arealso responsible for such internal control as they determine is necessaryto enable the preparation of financial statements that are free frommaterial misstatement, whether due to fraud or error. In preparing the financial statements, the Board of Directors and theManaging Director are responsible for assessing the parent company’sand the group’s ability to continue as going concern, disclosing, asapplicable, matters relating to going concern and using the goingconcern basis of accounting. The financial statements are preparedusing the going concern basis of accounting unless there is an intentionto liquidate the parent company or the group or cease operations, orthere is no realistic alternative but to do so.
Auditor’s Responsibilities for the Audit of FinancialStatementsOur objectives are to obtain reasonable assurance on whether thefinancial statements as a whole are free from material misstatement,whether due to fraud or error, and to issue an auditor’s report thatincludes our opinion. Reasonable assurance is a high level of assurance,but is not a guarantee that an audit conducted in accordance with goodauditing practice will always detect a material misstatement when itexists. Misstatements can arise from fraud or error and are consideredmaterial if, individually or in aggregate, they could reasonably beexpected to influence the economic decisions of users taken on thebasis of the financial statements. As part of an audit in accordance with good auditing practice, weexercise professional judgment and maintain professional skepticismthroughout the audit. We also:
• Identify and assess the risks of material misstatement of the financialstatements, whether due to fraud or error, design and perform auditprocedures responsive to those risks, and obtain audit evidence that issufficient and appropriate to provide a basis for our opinion. The risk ofnot detecting a material misstatement resulting from fraud is higher thanfor one resulting from error, as fraud may involve collusion, forgery,intentional omissions, misrepresentations, or the override of internalcontrol.• Obtain an understanding of internal control relevant to the audit inorder to design audit procedures that are appropriate in thecircumstances, but not for the purpose of expressing an opinion on theeffectiveness of the parent company’s or the group’s internal control.• Evaluate the appropriateness of accounting policies used and thereasonableness of accounting estimates and related disclosures madeby management.• Conclude on the appropriateness of the Board of Directors’ and theManaging Director’s use of the going concern basis of accounting andbased on the audit evidence obtained, whether a material uncertaintyexists related to events or conditions that may cast significant doubt onthe parent company’s or the group’s ability to continue as a goingconcern. If we conclude that a material uncertainty exists, we arerequired to draw attention in our auditor’s report to the relateddisclosures in the financial statements or, if such disclosures areinadequate, to modify our opinion. Our conclusions are based on theaudit evidence obtained up to the date of our auditor’s report. However,future events or conditions may cause the company to cease tocontinue as a going concern.• Evaluate the overall presentation, structure and content of the financialstatements, including the disclosures, and whether the financialstatements represent the underlying transactions and events so that thefinancial statements give a true and fair view.• Obtain sufficient appropriate audit evidence regarding the financialinformation of the entities or business activities within the group toexpress an opinion on the consolidated financial statements. We areresponsible for the direction, supervision and performance of the groupaudit. We remain solely responsible for our audit opinion.
We communicate with those charged with governance regarding,among other matters, the planned scope and timing of the audit andsignificant audit findings, including any significant deficiencies in internalcontrol that we identify during our audit.
We also provide those charged with governance with a statement thatwe have complied with relevant ethical requirements regardingindependence, and communicate with them all relationships and othermatters that may reasonably be thought to bear on our independence,and where applicable, related safeguards.
From the matters communicated with those charged with governance,we determine those matters that were of most significance in the auditof the financial statements of the current period and are therefore thekey audit matters. We describe these matters in our auditor’s reportunless law or regulation precludes public disclosure about the matter orwhen, in extremely rare circumstances, we determine that a mattershould not be communicated in our report because the adverseconsequences of doing so would reasonably be expected to outweighthe public interest benefits of such communication

EXEL COMPOSITESAnnual Financial Report 2016
Auditor's Report | 59
Other Reporting RequirementsOther informationThe Board of Directors and the Managing Director are responsible forthe other information. The other information comprises informationincluded in the report of the Board of Directors and in the AnnualReport, but does not include the financial statements and our reportthereon. We obtained the report of the Board of Directors prior to thedate of the auditor’s report, and the Annual Report is expected to bemade available to us after the date of the auditor’s report. Our opinion on the financial statements does not cover the otherinformation. In connection with our audit of the financial statements, ourresponsibility is to read the other information identified above and, indoing so, consider whether the other information is materiallyinconsistent with the financial statements or our knowledge obtained inthe audit, or otherwise appears to be materially misstated. With respectto report of the Board of Directors, our responsibility also includesconsidering whether the report of the Board of Directors has beenprepared in accordance with the applicable laws and regulations. In our opinion, the information in the report of the Board of Directors isconsistent with the information in the information in the financialstatements and the report of the Board of Directors has been preparedin accordance with the applicable laws and regulations. If, based on the work we have performed, we conclude that there is amaterial misstatement in of the information included in the report of theBoard of Directors, we are required to report this fact. We have nothingto report in this regard.
Opinions based on the decision of the Board ofDirectorsWe support that the financial statements should be adopted. Theproposal by the Board of Directors regarding the use of the profit shownin the balance sheet is in compliance with the Limited LiabilityCompanies Act. We support that the members of the Board of Directorsof the parent company and the Managing Director should be dischargedfrom liability for the financial period audited by us. Helsinki February 13, 2017
Ernst & Young OyAuthorized Public Accountant Firm
Juha HilmolaAuthorized Public Accountant
Exel Composites in briefExel Composites is a leading composite technology company that designs, manufactures and markets composite products and solutions fordemanding applications. Exel Composites provides superior customer experience through continuous innovation, world-class operations and long-termpartnerships. The core of the operations is based on own, internally developed composite technology, product range based on it and strong market position inselected segments with a strong quality and brand image. Profitable growth is pursued by a relentless search for new applications and development inco-operation with customers. The personnel’s expertise and high level of technology play a major role in Exel Composites’ operations. Exel CompositesPlc share is listed in Nasdaq Helsinki Ltd.
www.exelcomposites.com