Evolution of Mexican Financial Markets€¦ · North-to-South FAQ & Onboarding Reference Guide 3....
34
The Evolution of Mexican Financial Markets Joe Kogan Head of Emerging Markets Strategy Scotia Capital Presentation prepared for MexDer – CME Launch July 28, 2011
Transcript of Evolution of Mexican Financial Markets€¦ · North-to-South FAQ & Onboarding Reference Guide 3....

The Evolution of Mexican Financial Markets
Joe KoganHead of Emerging Markets StrategyScotia Capital
Presentation prepared for MexDer – CME Launch
July 28, 2011

Contents
2
1. Introduction
2. Fixed Income
3. FX
4. Equity
5. Mexder
6. Scotiabank

CME Group / MexDer Partnership
In March 2010, CME Group and Bolsa Mexicana de Valores announced a new strategicpartnership.
April 4, 2011South-to-North Order Routing successfully launched
August 1, 2011North-to-South Order Routing to launch
Benefits• No withholding taxes when trading in MexDer
• No local presence required in Mexico
• Remote Membership
• Omnibus Accounts: Rule 30.7 (CFTC) segregation
One for Proprietary Trading
One for Customer Trading
• With the CME Group – MexDer order routing agreement MexDer products will be available in more than 100,000 CME Globex ® screens.
3
Customers
• CFTF Approved Products
• Remote Membership
• Co-location
• DMA
• Collaterals accepted in the U.S.
• Give Ups
FIA standard agreement

CME Group / MexDer Global Partnership Page
For more information on CME Group’s partnership with MexDer, plus Order Routing Agreements and upcoming events, visit the MexDer Partnership Page at www.cmegroup.com/mexder. Available resources include:
1. List of MexDer Clearing Members
2. North-to-South FAQ & Onboarding Reference Guide
3. Client Impact Assessment Document
4. MexDer / CME Group Partnership Brochure
5. Presentation on Mexican Bond Markets and IPC Futures
4

Mexican Sovereign Bonds: Total AmountOutstanding of Mbonos and Cetes
1999-2011 (July)
5
Mexican Sovereign Bonds: OutstandingAmount and Holders
Mexican Sovereign Bonds: Holdings by Local Investors
2007-2011 (July)
Source: Banxico
Fixed Income
Source: Banxico
Pension and Mutual Funds represent a solid, stable and a long term investment in the local markets, holding about 33% of the total amount outstanding
0
50,000
100,000
150,000
200,000
250,000
300,000
1999 1999 2000 2001 2002 2003 2004 2004 2005 2006 2007 2008 2009 2009 2010 2011
U.S
. m
illion
s
Total Local Investors Foreign Investors Total Outstanding Amount
0
10,000
20,000
30,000
40,000
50,000
60,000
70,000
80,000
2007 2008 2009 2009 2010 2011
US
mil
lio
n
Banking System Pension Funds Mutual Funds Insurance Co. Other Local Investors

Mexican Sovereign Bonds: Foreign Investors
Foreign Investment in Mexican Cetes and Mbonos
6Source: Banxico
Foreign holders of Mbonos are mainly Central Banks, Insurance Companies, and Sovereign Funds. As a consequence we expect lower foreign outflows during high volatility periods.
2%
18%
33%
0%
5%
10%
15%
20%
25%
30%
35%
2009 2010 Jul-11
Cetes: Foreign Investment 2009 - 2011
Mbonds: Foreign Investment2009 - 2011
23%
31%
36%
15%
20%
25%
30%
35%
40%
2009 2010 Jul-11
Fixed Income

Mexico Budget Balance (%GDP)
7
Benchmark rate and Macroeconomics
Mexico CPI 1979-2011 (Annual Rate)
M Bono 10 Yr
5
6
7
8
9
10
11
12
Jul-01 Mar-02 Nov-02 Jul-03 Mar-04 Nov-04 Jul-05 Mar-06 Nov-06 Jul-07 Mar-08 Nov-08 Jul-09 Mar-10 Nov-10
%
Investment Grade forMexico
BanxicoTightening
Mexican PresidentialElections
Lehman Bankruptcy/Comerci derivatives
default
WGTB Index: Inclusion Mbonos
Subprime Mortgagescontagion
0.0
20.0
40.0
60.0
80.0
100.0
120.0
140.0
160.0
180.0
200.0
Jan-70 Jan-75 Jan-80 Jan-85 Jan-90 Jan-95 Jan-00 Jan-05 Jan-10
2000-2011
0.0
2.0
4.0
6.0
8.0
10.0
12.0
Jan-00 Nov-01 Sep-03 Jul-05 May-07 Mar-09 Jan-11
-0.54%
-0.21%
-2.17%
-2.68%
0.09%
-0.10% -0.07%
0.04%
-3%
-3%
-2%
-2%
-1%
-1%
0%
1%
2003 2004 2005 2006 2007 2008 2009 2010
Fixed Income

8
Spreads between Mexican and US interest rates have been tightening due to solid fundamentalsin Mexico.
MEXICO – USA: BenchmarksRates /Spreads
Source: Bloomberg
USA – MEXICO: FED FUNDS TARGET RATE VS BANXICO OFFICIAL OVERNIGHT RAT
2005-2011
USA – MEXICO BOND YIELD SPREAD 10 YR2001-2011 (July)*
* US Generic Govt 10 Yr Yield vs GMXN10YR Index. Source:Bloomberg
0.00
1.00
2.00
3.00
4.00
5.00
6.00
7.00
8.00
9.00
10.00
Oct-05 Jun-06 Feb-07 Oct-07 Jun-08 Feb-09 Oct-09 Jun-10 Feb-11150
250
350
450
550
650
750
2001 2002 2003 2004 2006 2007 2009 20102011
Fixed Income

9
MEXICO – Government Securities AuctionCalendar 2011
Quarterly
Instrument Bn Pesos
Cetes $25
MBonos $30 *
Udibonos $6
Source: SHCP * Syndicated
*Not includes Syndicated Auctions
The Government schedules auctions 1 month in advance of each quarter.
Primary Auction Issue Program (average data)
Fixed Income

10
Daily Market Volumes
• Bid ask spread is 1-3 bps, depends on volatily in Market
• Typical sizes are MNX$ 10-100 mm. Larger sizes would entail much larger bid-ask spread.
• Most liquid 10Y: June 20 and June 21
• Most liquid 20Y: May 29
• Most liquid overall: Dec 24
• Functioning repo market for domestic players
• No on-the-run premium as there is in US Treasuries
• 7 Market Makers approved by the Financial Authorities. They must comply with liquidity and volume standards on a monthly basis
• Qtr. Issuance schedule, sometimes new series, sometimes add to existing series.
• Security lending is available; Short selling is allowed to/through the Market Makers and/or Mexder
• Central counterparty “Indeval” clears, deposits and custodies all securities.
• Securities settlement within 96 hours
• Trade between 8:00 am and 3:00pm EST
• 4.9% withholding tax if double taxation treaty; 10% otherwise and 30% for tax havens
• No taxes in FX, Equity, and derivatives.
Up to90 days
From90 days to
1 Yr
From 1 Yr to3 Yr
From 3 Yr to5Yr
From 5Yr to10 Yr
From 10 Yrto 20 Yr
More than20 Yr
Cetes 759 1,045 0 0 0 0 0
Mbonos 234 713 1,072 1,097 2,031 3,285 820
Udibonos 0 0 26 9 71 23 34
Sources: Banxico as of Dic. 2010.
Average Daily Volume US Million
Mbonos Market
Fixed Income

USA – MEXICO Bond Curves*
11
Mexico - USA : Nominal and Swap Curves
USA Libor Curve– MEXICO TIIE Curves *
*Source: Bloomberg as of Jul, 6, 2011
The Mexican term structure offers many opportunities for trading, with tenors ranging from 1 day to 30 years.
0
1
2
3
4
5
6
7
8
9
1month
3months
6months
1 yr 2 yr 3 yr 5 yr 7 yr 10 yr 15 yr 20 yr 30 yr0
1
2
3
4
5
6
7
8
9
3months
6months
9months
1 yr 2 yr 3 yr 4 yr 5 yr 8 yr 10 yr 15 yr 20 yr 30 yr
Fixed Income

Mexder: Fixed Income Contracts
Bond Futures28-day TIIE
Futures Contracts
91-day Cetes
Futures ContractsInterest Rate
Swaps 2 yr / 10 yr
Ticker Symbol M3/M5/M10/M20/M30 TE28 CE91 SW2 /10 + Month
and Mat. Yr.
Quotation Price Interest Rate Interest Rate Interest Rate
Size 100 $100,000 MXN 10,000 Cetes ( $100,000 MXP) $1 Million MXN
Tick $0.025 MXN // $0.00208 USD* One bp (0.01) One bp (0.01) 0.5 bp
Notional Value $100,000 MXN// $8.333 USD* 100,000 MxN 100,000 MxN 1000,000 MxN
Maturity Months Quarterly, up to 3 years Monthly up to 10 yr
Monthly up to 12 months. Months and quarterly, up to 24 quarters
Monthly andQuarterly
Settlement Physical Delivery Differentials Differentials Physical Deliveryand Differentials
Trading Hours 8:30 – 15:00 hrs. EST
8:30 – 15:00 hrs. EST
8:30 – 15:00 hrs. EST
8:30 – 15:00 hrs. EST
Bloomberg(MMDD) DWA (CMDTY) CT DOA (CMDTY) CT GMA (CMDTY) CT SWTA (CMDTY) CT
R.30 – ReutersMXN/FUTEX1 0#B10: 0#T11: 0#CTE: 0#SW2 and
0#SW10
Worth mentioning is the fact that MBonos Futures are very liquid and trade at tight spreads.
MEXDER and its clearing firm ASIGNA already have a 2 and 10 years swap that can be “delivered/received” once the future expires directly using ASIGNA as a counterparty.
12
Fixed Income

Latin American FX Markets Turnover
Currency distribution of global foreign exchange market turnover
1. Mexico is positioned as the 13th most traded currency in the world.
2. It is the third most traded currency of the emerging economies, just below the Hong Kong dollar and the Korean won.
3. That makes the MXN the most traded currency in Latin America
Global FX Market Turnover
Note:
The graphics show the percentage shares of
average turnover in April of 2010. The sum of the
percentage shares of all the currencies add up to a total of 200%, instead of
100% because two currencies are involved in
each transaction.
Sources: Triennial Central Bank Survey, Bank for International Settlements
Emerging Markets
FX
13
0
10
20
30
40
50
60
70
80
90
US Dollar Euro JapaneseYen
Poundsterling
Australiandollar
Swissfranc
Canadiandollar
HongKongdollar
Swedishkrona
NewZelanddollar
Koreanwon
Singaporedollar
Norwegiankrone
Mexicanpeso
Othercurrencies
0
0.2
0.4
0.6
0.8
1
1.2
1.4
Mexican peso Brazilian real Chilean peso Colombian peso Argentine peso Peruvian nuevo sol

Total volume of the MXN market
The greatest amounts traded in the MXN market come fromforeign investors, who account for 95% of the volume in
swaps and 76% in cash and forward contracts.
Source: Central Bank of Mexico, millions of dollars, daily basis.
14
FX
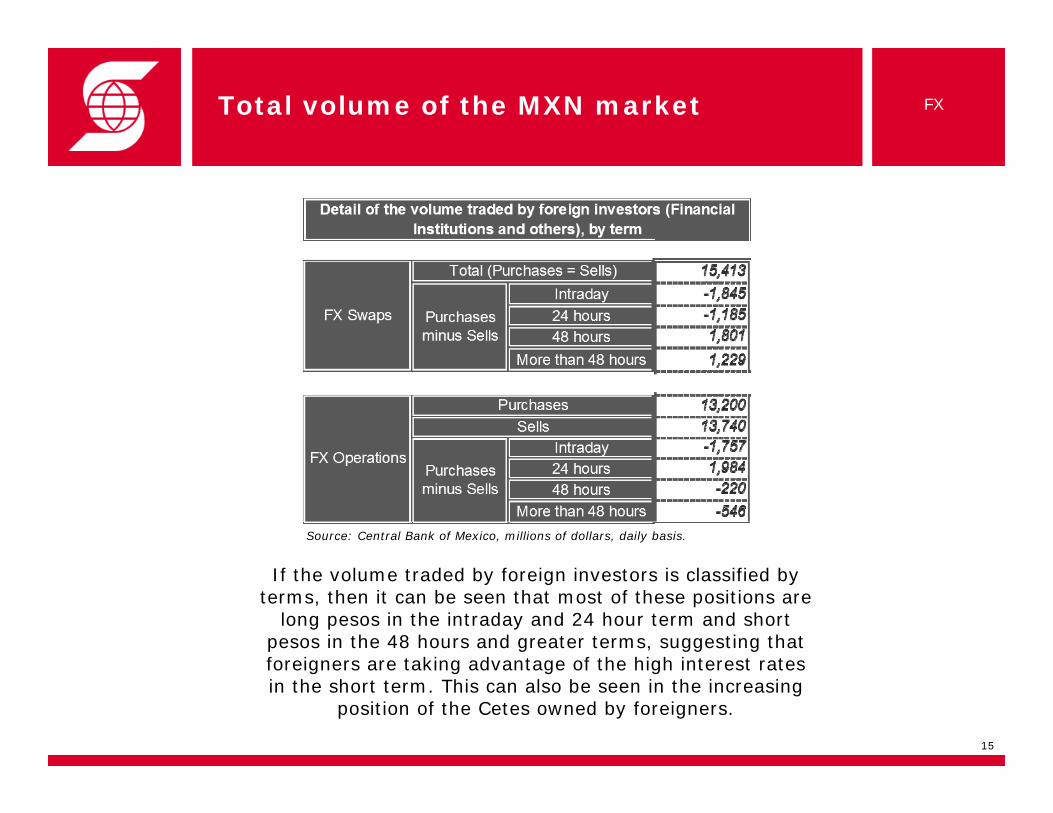
Total volume of the MXN market
Source: Central Bank of Mexico, millions of dollars, daily basis.
If the volume traded by foreign investors is classified by terms, then it can be seen that most of these positions are
long pesos in the intraday and 24 hour term and short pesos in the 48 hours and greater terms, suggesting thatforeigners are taking advantage of the high interest ratesin the short term. This can also be seen in the increasing
position of the Cetes owned by foreigners.
15
FX

Central Bank’s monetary policy
How the Central Bank of Mexico intervenes in the FX market:• The Central Bank issues put options that can be exercised at the last day’s FIX, if this is not
greater than the average of the last 20 days’ FIX rate.
• The Central Bank auctions US$ 600 million by the end of each month, giving investors the opportunity to exercise the options throughout the next month.
• In this way, the Central Bank follows a less aggressive monetary policy than other countries in Latin America. Its policies bear some resemblance to those of Colombia.
0%
5%
10%
15%
20%
25%
30%
35%
Perú Chile Brasil Colombia México
16
International Reserves USD
Perú 46,352,600,000
Chile 34,208,100,000
Brasil 333,000,000,000
Colombia 30,420,000,000
México 129,203,000,000
International Reserves as a Percentage of the GDP
FX

MXN: Operating Factors
MXN: Operating Factors
• No Withholding Tax
• Settlement within 48hours most common; also quoted are intra-day and 24 hour settlement
• There is a very liquid futures market: OTC forward, CME Mexican Peso contract and Mexder USD contract
• Many brokers and matching systems available to trade Mexican Peso.
• Many foreign and local participants
• 24 hours trading
• Settlement should done by SWIFT
• Full delivery
MXN: Drivers
Factors that influence the MXN performance:
• High liquidity in the international economy
• Oil prices
• Economic fundamentals
• No direct intervention of the Central Bank in the FX Market
• Change in investors’ risk perception, which contributes to the daily volatility
17
FX

Mexder: Currency derivatives
MXN/USDFutures
MXN/EUROFutures
MXN/USDOptions
Ticker Symbol DA Euro DA
Quotation / Style Price Price European
Size $10,000 USD $10,000 EUROS $10,000 USD
Tick $0.0001 MXN $0.0001 MXN $0.001 MXN
Maturity Months Monthly, up to 3 years Monthly, up to 1 year Quarterly, up to 1 year
Settlement Physical delivery Non delivery, Differentials Physical delivery
Trading Hours 8:30 – 15:00 hrs. EST 8:30 – 15:00 hrs. EST 8:30 – 15:00 hrs. EST
Bloomberg (MMDD) DSA (CRNCY) CT BEA (CRCNY) CT MXX (CRCNY) OMON
R.30 – ReutersMXN/FUTEX1 0#MXP: 0 # EURO: 0 # DA:XD
Large Volume and High Open Interest are found in MXN/USD Futures.
18
FX

Returns on Emerging Market Indices
• The IPC is the benchmark equity index of the Mexican Stock Exchange (Mexbol): a capitalization-weighted index composed of the country’s 35 most liquid stocks
• Total market capitalization of the index was US$410 billion as of July 19, 2011
• Index members trade on the Mexbol between 9:30am and 4:00pm EST
• The index has posted a +17% CAGR over the prior 16 year period; the return on the MSCI index for Mexico was 12.6%.
19
Sources: Bloomberg
Ticker MSCI country indices16 YR CAGR
MEXICO 12.6%
RUSSIA 18.1%
INDIA 12.4%
BRAZIL 11.9%
CHINA 1.2%
Equity
MSCI EM vs MSCI MexicoYOY Returns
MSCI Emergent Markets MSCI Mexico
-90%
-70%
-50%
-30%
-10%
10%
30%
50%
70%
90%
110%
2001 2002 2003 2004 2005 2006 2007 2008 2009 2010 2011

IPC: Industries
20
• Members represent 17 different industries
• The largest five index members represent 56% of the index
• The main industry groups by market capitalization are Telecoms (28%), Retail (19%) and Mining (14%).
Sources: Bloomberg
Equity
Engineering & Construction
Telecommunications
Banks
Beverages
Retail
Mining
Real Estate Pharmaceuticals
Food
Building Materials
Chemicals
Diversified Financial Services
Forest Products & Paper
Holding Companies-Divers
Machinery-Diversified
Home Builders
Media

IPC: Traded Volume
• The top three stocks trade 48% of the total volume (AMX, GMEXICO and WALMEX) in the IPyC. The top ten stocks represent 76% of the index volume.
• In the LTM the index recorded an average daily trading volume of US$417 Million
21Sources: Bloomberg
2010: FIX 4.2
Aug.11: v4.4 protocol
Equity
0
100
200
300
400
500
600
700
800
2002 2003 2004 2005 2006 2007 2008 2009 2010 2011
•Fully
electr
onic
tradin
g: FIX
proto
col, D
MA, rob
ots
•Sophis
ticate
d playe
rs
Daily Trading Volume (US$M)

Size of the Equity Local Market
• There are more than thirty brokerage houses in the country, including small and large firms. Fifteen of them (Scotia Capital included) account for ~80% of the traded volume.
• The International Quoting System (SIC in Spanish) trades more than 300 ETF’s and more than 280 foreign stocks.
• Among the holders of Mexican equities are foreign institutional investors such as US big pension funds, mutual funds, etc.
• The Naftrac, a local ETF which mirrors the performance of the IPC, is the most traded stock with a YTD ADTV of US$180 million.
22
Sources: Bloomberg
117
4738
3023 19 16
10 9 9
0
20
40
60
80
100
120
AmericanMovil
GroupoMexico
Walmex Cemex Gfnorte Televisa FEMSA GroupoLab
Corp GEO ALFA
Equity

Pension Funds: Equity Holdings
• Afores (Mexican pension funds) managed MXN1.46 trillion in June 2011
• As of June 2011, 18.1% of assets under management were invested in equities vs. 11.1% in November 2008.
23
87.6% 87.8%
86.7%86.1%
84.8%85.1%
85.8%85.1%
84.1%
83.3%
82.1% 82.3%82.0%
87.6%
89.1%
89.5%
89.3% 88.5%
87.7%
88.0%
87.0%
86.5%85.7%
86.0%
85.6%
84.7%84.6%
85.5%
82.7%82.9%
81.9%81.9%
% in Debt
11.5%12.0%
13.0% 13.3%13.9% 14.0%
15.3% 15.2%14.5% 14.2%
14.9%
15.9%16.7%
18.1% 17.7%18.0%18.1%17.9%
17.1%17.3%
14.9%15.4%
14.4%14.3%13.5%
12.2%12.3%
10.7%10.5%10.9%
12.4%12.4%
Nov-08
Dec-08
Jan-09
Feb-09
Mar-09
Apr-09
May-09
Jun-09
Jul-09
Aug-09
Sep-09
Oct-09
Nov-09
Dec-09
Jan-10
Feb-10
Mar-10
Apr-10
May-10
Jun-10
Jul-10
Aug-10
Sep-10
Oct-10
Nov-10
Dec-10
Jan-11
Feb-11
Mar-11
Apr-11
May-11
Jun-11
% in Equity
Equity

24
Mexican ADR
Sources: Bloomberg
Ticker Short Name Shares per ADR
AMX US AMÉRICA MÓVIL 20
TMX TELMEX 20
CX US CEMEX 10
TV US GRUPO TELEVISA 5
FMX US FEMSA 10
ICA US EMPRESAS ICA 4
HXM US HOMEX 6
PAC US GAP 10
ASR US ASUR 10
OMAB US OMA 8
KOF US COCA COLA 10
SIM US GRUPO SIMEC 3
MIXT US MAXCOM 7
VITRY US VITRO 3
GMK US GRUMA 4
IBA US BACHOCO 12
Equity

Operative Factors
• Security lending is available
• Short selling is allowed to/through the Market Makers and/or Mexder
• Central counterparty “Indeval” clears, deposits and custodies all securities.
• Securities settlement in 72 hours
• Omnibus account allows non-disclosure of customer name
• Foreign investors settle stocks through Euroclear, Clearstream or DTC vs Indeval in Mexico.
• Foreigners and local customers must trade in local market through Mexican Brokerage Houses.
• Fully electronic exchange
• Electronic access should be negotiated with a Mexican Brokerage House
• Specific rules govern electronic access to the Exchange
• CBNV (The Mexican Sec) performs extensive audits to verify compliance with these rules
• Market makers exist for the less liquid stocks
25
Equity

Mexder: IPC
IPC
Futures
IPC
Options
Ticker Symbol IPC IP
Quotation/Style IPC points European
Size IPC*10 IPC x $10 MXN
Tick 5 points 1 point
Maturity Months Quarterly, up to 1 year Quarterly, up to 1 year
Trading Hours 8:30 – 15:00 hrs. EST 8:30 – 15:00 hrs. EST
Bloomberg (MMDD) ISA (INDEX) CT ISA (INDEX) OMON
R.30 – ReutersMXN/FUTEX1 0#IPC: 0#IPC:XD
Futures and Options for IPC and some individual stocks and Traccs.
IPC non action letter was issued by the CFTC.
The IPC futures and Options are the most active.
26
Equity

Mexder
MexDer, The Mexican Derivatives Exchange was launched in December 1998. It is fully electronic, and provides listings for financial futures and options on Mexican securities and indices.
In recent years, Mexder had the following important achievements:
MEXDERMarket Makers.
IPC contracts No actions letter.
Fix Connectivity
Remote Trading Membership
No Withholding tax
Order Routing Agreement with CME Group.
Non customer disclosure Omnibus accounts.
IRS Full Delivery Futures Available (Dodd-Frank Regulation).
Regulation Segregation between House trading and Customer trading (30.7)
Give ups.27
Dic99
Ago00
Abr01
Dic01
Ago02
Abr03
Dic03
Ago04
Abr05
Dic05
Dic07
Ago06
Abr07
Ago08
Ago10
Abr09
Dic09
Abr11
0
5
10
15
20
25
30
35
40
45
50
Vo
lum
e O
pera
do
/ V
olu
me T
rad
ed
0
5
10
15
20
25
30
35
40
45
50
55
60
Ineré
s A
bie
rto
/ O
pen
In
tere
st

Clearing House
28
• Asigna is the counterparty for all transactions performed on the market. It is evaluated and rated each year by three leading international rating agencies.
• Asigna is the best counterparty in Mexico.
Local Rating Global Rating
Fitch Rating AAA (mex)
Standard & Poor’s mxAAA/mxA-1+ local currency
BBB/A-3 foreign currency BBB/A-2 local currency
Moody’s AAA.MX A1
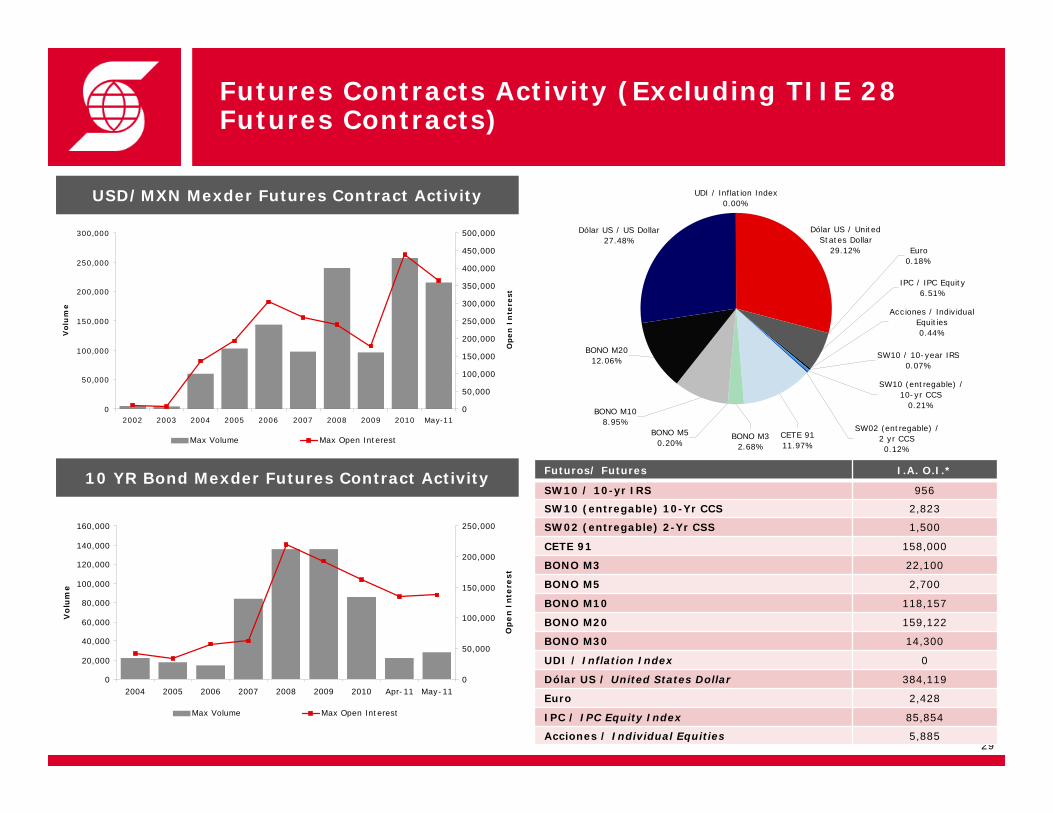
USD/MXN Mexder Futures Contract Activity
Futures Contracts Activity (Excluding TIIE 28 Futures Contracts)
10 YR Bond Mexder Futures Contract Activity
29
0
50,000
100,000
150,000
200,000
250,000
300,000
2002 2003 2004 2005 2006 2007 2008 2009 2010 May-11
Volu
me
0
50,000
100,000
150,000
200,000
250,000
300,000
350,000
400,000
450,000
500,000
Open
In
tere
st
Max Volume Max Open Interest
0
20,000
40,000
60,000
80,000
100,000
120,000
140,000
160,000
2004 2005 2006 2007 2008 2009 2010 Apr-11 May-11
Vo
lum
e
0
50,000
100,000
150,000
200,000
250,000
Op
en
Inte
rest
Max Volume Max Open Interest
UDI / Inflation Index0.00%
Dólar US / US Dollar27.48%
Acciones / Individual Equities0.44%
CETE 9111.97%
SW10 (entregable) / 10-yr CCS
0.21%
BONO M32.68%
BONO M50.20%
BONO M108.95%
SW10 / 10-year IRS0.07%
Euro0.18%
IPC / IPC Equity6.51%
SW02 (entregable) / 2 yr CCS0.12%
BONO M2012.06%
Dólar US / United States Dollar
29.12%
Futuros/ Futures I.A. O.I.*
SW10 / 10-yr IRS 956
SW10 (entregable) 10-Yr CCS 2,823
SW02 (entregable) 2-Yr CSS 1,500
CETE 91 158,000
BONO M3 22,100
BONO M5 2,700
BONO M10 118,157
BONO M20 159,122
BONO M30 14,300
UDI / Inflation Index 0
Dólar US / United States Dollar 384,119
Euro 2,428
IPC / IPC Equity Index 85,854
Acciones / Individual Equities 5,885

Why Scotia for MexDer?
• Scotia Capital, the corporate and investment banking, and capital markets, businesses of the Scotiabank Group, is a full service clearing and execution provider in Mexico for all Futures and Options products listed on the Mexican Derivatives Exchange (MexDer).
• As one of the most technologically advanced clearing members in Mexico, Scotia provides its clients with access to a wide range of services including Direct Electronic Access to the Mexican derivatives market through our broker, Scotia Derivados, and STP solution.
Some Clearing Services:
A committed team of professionals focused on customized solutions for our clients.
Excellent execution and B/O systems.
On-line information and end-of the day reports via internet.
Opening an account takes a short time.
Competitive Commissions.
Effective, fast and safe client acceptance methodology.
Compliance and Anti Money Laundering Culture
Local Flavor and Research Reports.
WE WILL BE GLAD TO ATTEND TO YOUR NEEDS AS YOUR CLEARING MEMBER IN MEXDER.
30

Scotiabank Group: Products, Services and Credit Ratings
BANK• Personal, Commerical and Corporate Banking• Wealth and Cash Management Services
INVESTMENT BANK (SCOTIA CAPITAL)• Equities• Custody Services• Technical and Fundamental Research• Corporate Finance ( Active in IPO Deals)• Money Market• Capital Markets• OTC Derivatives• Equity Derivatives• Securities Lending / Borrowing
31
SCOTIABANK Long Term CREDIT RATING:The Bank of Nova Scotia (Scotiabank)is AA-.Scotiabank Inverlat Mexico MA AAA.
SCOTIABANK Short Term CREDIT RATING:The Bank of Nova Scotia (Scotiabank)is A-1+.Scotiabank Inverlat Mexico A-3
*Not all services are available in all jurisdictions.

Scotia Capital Mexico Contacts
Head Markets, Scotia Capital Mexico
Carlos Kretschmer+52 55 [email protected]
Derivatives Sales (Mexder)
Guillermo Camou+52 55 [email protected]
Lorena Pichardo+52 55 [email protected]
Angélica Aguilar+52 55 [email protected]
Fixed Income Sales
Jorge González+52 55 [email protected]
José González Funes+52 55 [email protected]
Equity Sales
Bond Snodgrass+52 55 [email protected]
Fixed Income and Derivatives Trading
Carlos HernándezHead Fixed Income and Derivatives +52 55 [email protected]
Alejandro MoralesFixed Income+52 55 [email protected]
Miguel MartínezFixed Income Derivatives+52 55 [email protected]
Equity and Derivatives Trading
Gabriel VegaHead Equity+52 55 [email protected]
FX Trading
Lorena Nuñez Director Head FXome+52 55 [email protected]
FX Sales
Manuel RosalesFX+52 55 9179.51 [email protected]
FX Sales
Emerging Markets Strategy
Joe Kogan, Head of [email protected]
Araceli [email protected]
Leonor [email protected]
Rebeca Lizá[email protected]
Equity Research
Marcos Durá[email protected]
Rodrigo EchagarayRetail+52.55.9179.5236rodrigo_echagaray@scotiacapital.com
Andrés [email protected]
32

Scotia Capital Emerging Markets NY Contacts
Emerging Markets Sales
Tarik [email protected]
Ralph [email protected]
Percy [email protected]
Wendy [email protected]
Emerging Markets Trading
Bill [email protected]
Ryan [email protected]
Drew [email protected]
Fredrik [email protected]
Patrick O’[email protected]
Emerging Markets Strategy
Joe Kogan, Head of [email protected]
33

Disclaimer
This publication has been prepared for Institutional Investors by Fixed Income Strategists of Scotia Capital (USA) Inc. (“Scotia Capital”). Fixed Income Strategists are employees of Scotia Capital’s Fixed Income Credit Sales & Trading Desk and support the trading desk through the preparation of market commentary, including specific trading ideas, and other materials, both written and verbal, which may or may not be made publicly available, and which may or may not be made publicly available at the same time it is made available to the Fixed Income Credit Sales & Trading Desk. Fixed Income Strategists are not research analysts, and this report was not reviewed by the Research Departments of Scotia Capital. Fixed Income Strategist publications are not research reports and the views expressed by Fixed Income Strategists in this and other reports may differ from the views expressed by other departments, including the Research Department, of Scotia Capital. The securities laws and regulations, and the policies of Scotia Capital that are applicable to Research Analysts may not be applicable to Fixed Income Strategists.
This publication is provided to you for informational purposes only. Prices shown in this publication are indicative and Scotia Capital is not offering to buy or sell, or soliciting offers to buy or sell any financial instrument. Scotia Capital may engage in transactions in a manner inconsistent with the views discussed herein. Scotia Capital may have positions, or be in the process of acquiring or disposing of positions, referred to in this publication. Other than the disclosures related to Scotia Capital, the information contained in this publication has been obtained from sources that Scotia Capital knows to be reliable, however we do not represent or warrant that such information is accurate and complete. The views expressed herein are the views of the Fixed Income Strategists of Scotia Capital and are subject to change, and Scotia Capital has no obligation to update its opinions or information in this publication. Scotia Capital and any of its officers, directors and employees, including any persons involved in the preparation or issuance of this document, may from time to time act as managers, co-managers or underwriters of a public offering or act as principals or agents, deal in, own or act as market-makers or advisors, brokers or commercial and/or investment bankers in relation to the securities or related derivatives which are the subject of this publication.
Neither Scotia Capital nor any of its officers, directors, partners, or employees accepts any liability for any direct or consequential loss arising from this publication or its contents. The securities discussed in this publication may not be suitable for all investors. Scotia Capital recommends that investors independently evaluate each issuer and security discussed in this publication, and consult with any advisors they deem necessary prior to making any investment. 34