Globalization and Mexican Labor Markets - Federal … and to track the time path of relative wages....
20
61 Globalization and Mexican Labor Markets Raymond Robertson M ore than nearly any other phenomenon, globalization has had a pro- found effect on the Mexican economy. Mexican labor markets have been particularly affected. Globalization integrates labor markets through trade, capital flows, and migration. Recent studies that mainly focus on Mexico’s manufacturing sector suggest that North American economic integration (particu- larly Mexico’s integration with the United States since the North American Free Trade Agreement) has had potentially positive implications for Mexican workers. Rising trade has coincided with rising Mexican wages (relative to U.S. wages) and falling wage inequality within Mexico. In terms of North American integration, the perceived competition between Mexican and U.S. workers may not be as accurate as popularly believed. Recent research suggests that Mexican and U.S. workers are complements rather than substitutes. Growing economic integration suggests that North America could and probably should be thought of as a unified market in terms of production. As is increasingly understood, however, the net gains from integration may overshadow important losses for many workers. These losses explain persistent popular opposition to NAFTA and economic integration. The gains have been slow to arrive in many of Mexico’s rural areas, affecting political support for candidates (López Córdoba 2006). Rising U.S. border enforcement also may hide NAFTA’s benefits because the wages of Mexican workers decline when enforce- ment increases. Further, while integration may bring technology, increased de- mand, and trade, it also increases Mexican susceptibility to U.S. economic fluc- tuations. Mexican manufacturing employment closely followed the drop in U.S. manufacturing employment during the 2001 U.S. recession. Three main policy recommendations emerge from these studies. First, Mexico
Transcript of Globalization and Mexican Labor Markets - Federal … and to track the time path of relative wages....

61
Globalization and Mexican Labor MarketsRaymond Robertson
More than nearly any other phenomenon, globalization has had a pro-found effect on the Mexican economy. Mexican labor markets have been particularly affected. Globalization integrates labor markets through
trade, capital flows, and migration. Recent studies that mainly focus on Mexico’s manufacturing sector suggest that North American economic integration (particu-larly Mexico’s integration with the United States since the North American Free Trade Agreement) has had potentially positive implications for Mexican workers. Rising trade has coincided with rising Mexican wages (relative to U.S. wages) and falling wage inequality within Mexico.
In terms of North American integration, the perceived competition between Mexican and U.S. workers may not be as accurate as popularly believed. Recent research suggests that Mexican and U.S. workers are complements rather than substitutes. Growing economic integration suggests that North America could and probably should be thought of as a unified market in terms of production.
As is increasingly understood, however, the net gains from integration may overshadow important losses for many workers. These losses explain persistent popular opposition to NAFTA and economic integration. The gains have been slow to arrive in many of Mexico’s rural areas, affecting political support for candidates (López Córdoba 2006). Rising U.S. border enforcement also may hide NAFTA’s benefits because the wages of Mexican workers decline when enforce-ment increases. Further, while integration may bring technology, increased de-mand, and trade, it also increases Mexican susceptibility to U.S. economic fluc-tuations. Mexican manufacturing employment closely followed the drop in U.S. manufacturing employment during the 2001 U.S. recession.
Three main policy recommendations emerge from these studies. First, Mexico
62 RaymondRobertson
would continue to benefit, on net, from increased economic integration. Second, to the extent possible, Mexico should work to reduce migration restrictions into the United States. Third, the Mexican government should continue to direct ad-justment assistance to rural and less economically active areas. Recent research has shown that workers in these areas are especially susceptible to shocks and that workers in more economically dynamic regions suffer much less from adjust-ment and job loss.
North American Economic Integration
Despite their differences in development status, the U.S. and Mexican econo-mies are closely integrated. Robertson, Kumar, and Dutkowsky (2006) analyze matched product-level prices and find strong cointegrating relationships in these narrowly defined goods markets. Factor markets are also closely integrated. Rob-ertson (2000) demonstrated that Mexican and U.S. labor markets are closely inte-grated because wage shocks in the United States affect Mexican wages. Consis-tent with economic integration, these effects are strongest along Mexico’s border region.
One goal of NAFTA was to deepen existing integration by fostering trade and capital flows. How successful it has been at these goals has been the subject of much debate. NAFTA studies are complicated by the December 1994 peso crisis. Nevertheless, there seems to be a distinct change in both the level and trend of imports, exports, and capital flows after NAFTA went into force on January 1, 1994.
Figures 1A and 1B are from Robertson (2005a). Figure 1A shows that Mexico’s share of U.S. goods exports (the fraction of all U.S. goods exports that go to Mexi-co) rises relatively steadily until the peso crisis. The sharp devaluation of the peso increased the Mexican price of U.S. exports, and, as a result, U.S. goods exports to Mexico fell sharply. The fall did not last long, however. During the recovery, the U.S. share of Mexican exports resumed its rise. The estimated rate of growth, however, was statistically higher in the post-NAFTA period than before NAFTA.
Figure 1B presents the results for Mexico’s share of U.S. imports (the fraction of all U.S. imports that come from Mexico). Like exports in Figure 1A, the Mexican share of U.S. imports rises prior to NAFTA. The peso crisis significantly affected this trend. The December 1994 crisis made Mexican exports cheaper for U.S. con-sumers, and imports rose. During the recovery period, however, there was a clear increase in the level of Mexico’s share of U.S. imports. Furthermore, the rate of increase of this share was higher after NAFTA than before NAFTA.
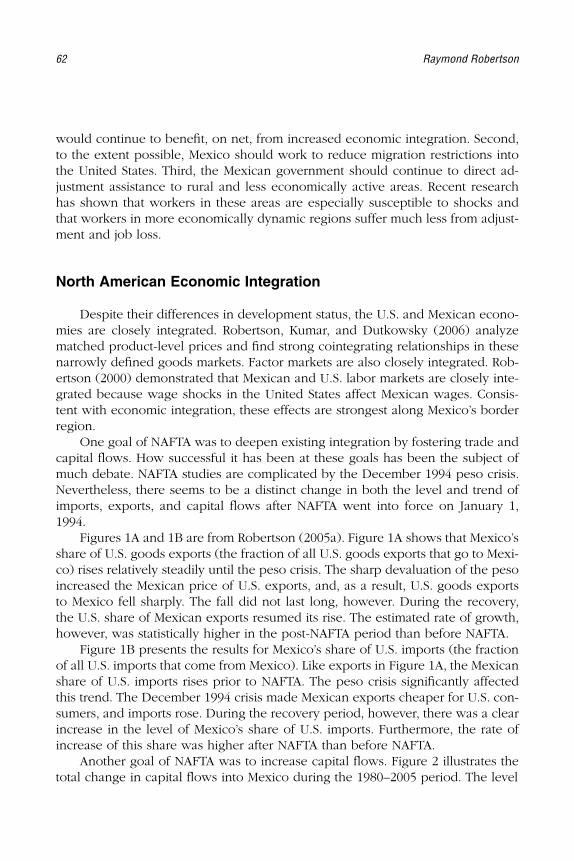
Another goal of NAFTA was to increase capital flows. Figure 2 illustrates the total change in capital flows into Mexico during the 1980–2005 period. The level
GlobalizationandMexicanLaborMarkets 63
Figure 1A
Mexico’s Share of U.S. Goods Exports
SOURCE: Robertson (2005a).
Mexico share of U.S. exports Fitted values
’85 ’87 ’89 ’91 ’93 ’95 ’97 ’99 ’01 ’03
.04
.08
.12
.16
Figure 1B
Mexico’s Share of U.S. Goods Imports
SOURCE: Robertson (2005a).
Mexico share of U.S. imports Fitted values
’85 ’87 ’89 ’91 ’93 ’95 ’97 ’99 ’01 ’03
.04
.08
.12
.16
64 RaymondRobertson
and trend of flows into Mexico are higher after January 1, 1994. Several other reforms, such as capital account liberalization starting in 1989, facilitated these flows. The point is not that NAFTA per se explains this increase, only that flows into Mexico are higher in the NAFTA period.
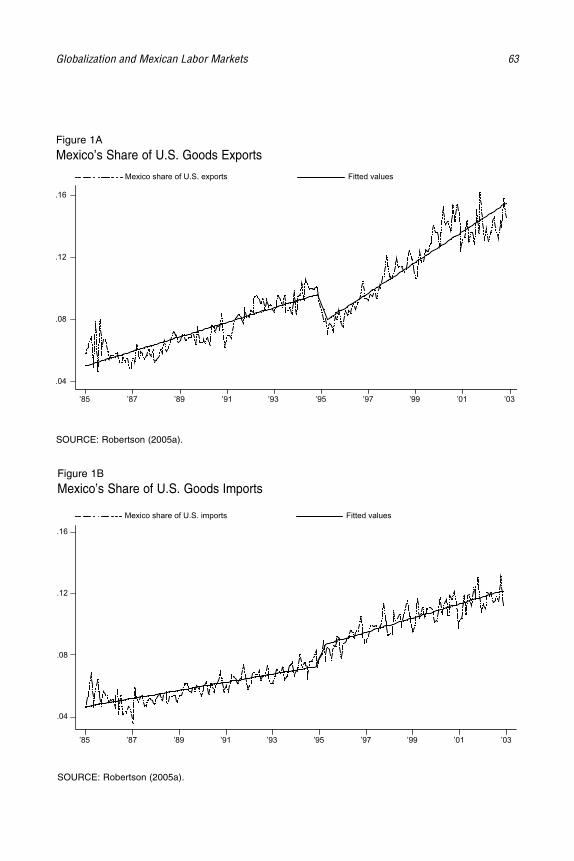
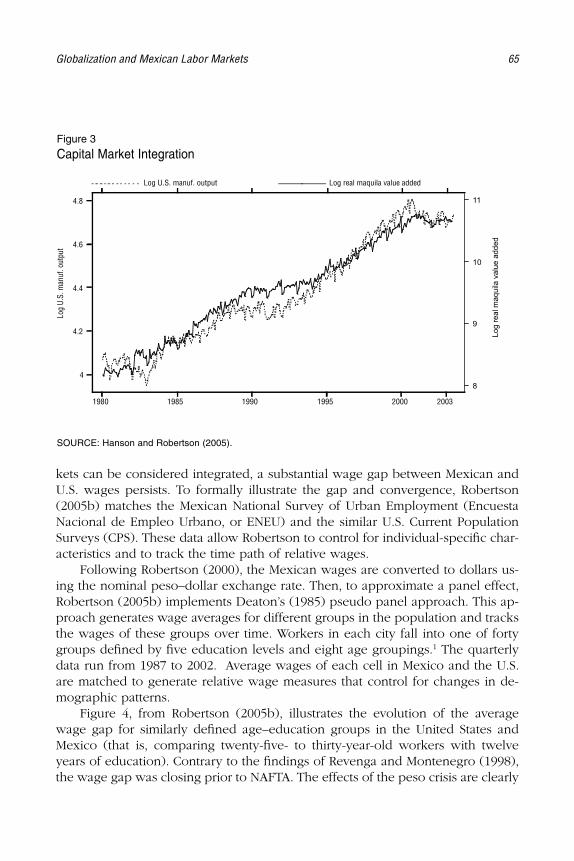
Another measure of capital flows is maquiladora investment. The key feature of maquiladoras in this paper is their close relationship with U.S. manufacturing. By definition, maquilas are designed to be closely related to U.S. manufacturing. Figure 3 illustrates this relationship. The growth in maquiladora value added and U.S. manufacturing output follow very closely together.
Labor Market Implications of Integration in Mexico
Absolute Wage ConvergenceRevenga and Montenegro (1998) match industry-level data between Mexico
and the United States and find that trade liberalization in Mexico lowered Mexi-can wages relative to their industrial U.S. counterparts between 1984 and 1990. Hanson (2004) analyzes the Mexican population census in 1990 and 2000 and finds little, if any, evidence of wage convergence between the United States and Mexico. These results are not consistent with rising trade and foreign direct in-vestment (FDI) contributing to rising wages in Mexico. Although the labor mar-
Figure 2
Total Foreign Direct Investment Flows into Mexico
1980 1985 1990 1995 2000 2005
87,205
1.4e+07
Tho
usan
ds o
f U.S
. dol
lars
SOURCE: Banco de México, Series SE37 (“pasivos Inversión extranjera Directa”).
GlobalizationandMexicanLaborMarkets 65
kets can be considered integrated, a substantial wage gap between Mexican and U.S. wages persists. To formally illustrate the gap and convergence, Robertson (2005b) matches the Mexican National Survey of Urban Employment (Encuesta Nacional de Empleo Urbano, or ENEU) and the similar U.S. Current Population Surveys (CPS). These data allow Robertson to control for individual-specific char-acteristics and to track the time path of relative wages.
Following Robertson (2000), the Mexican wages are converted to dollars us-ing the nominal peso–dollar exchange rate. Then, to approximate a panel effect, Robertson (2005b) implements Deaton’s (1985) pseudo panel approach. This ap-proach generates wage averages for different groups in the population and tracks the wages of these groups over time. Workers in each city fall into one of forty groups defined by five education levels and eight age groupings.1 The quarterly data run from 1987 to 2002. Average wages of each cell in Mexico and the U.S. are matched to generate relative wage measures that control for changes in de-mographic patterns.
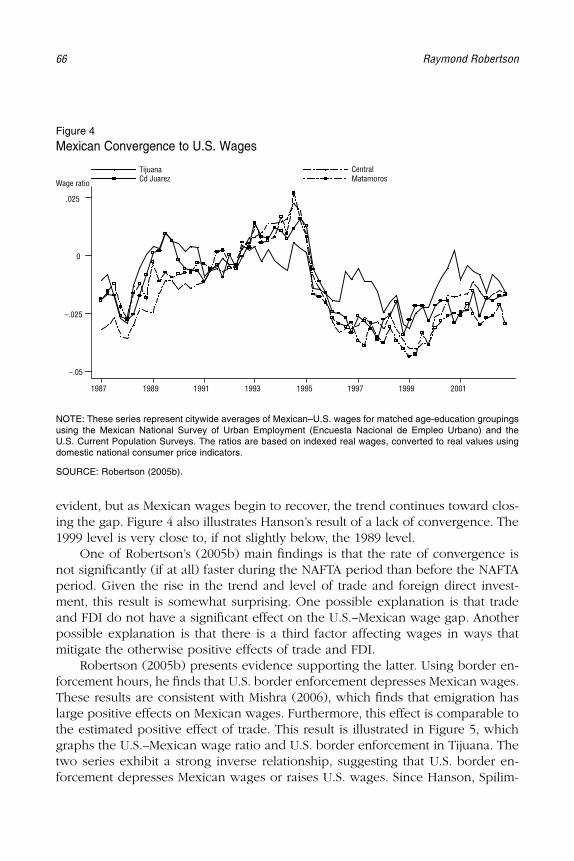
Figure 4, from Robertson (2005b), illustrates the evolution of the average wage gap for similarly defined age–education groups in the United States and Mexico (that is, comparing twenty-five- to thirty-year-old workers with twelve years of education). Contrary to the findings of Revenga and Montenegro (1998), the wage gap was closing prior to NAFTA. The effects of the peso crisis are clearly
Figure 3
Capital Market Integration
Log U.S. manuf. output Log real maquila value added
1980 1985 1990 1995 2000 2003
4
4.2
4.4
4.6
4.8
8
9
10
11
Log
U.S.
man
uf. o
utpu
t
Log
real
maq
uila
val
ue a
dded
SOURCE: Hanson and Robertson (2005).
66 RaymondRobertson
evident, but as Mexican wages begin to recover, the trend continues toward clos-ing the gap. Figure 4 also illustrates Hanson’s result of a lack of convergence. The 1999 level is very close to, if not slightly below, the 1989 level.
One of Robertson’s (2005b) main findings is that the rate of convergence is not significantly (if at all) faster during the NAFTA period than before the NAFTA period. Given the rise in the trend and level of trade and foreign direct invest-ment, this result is somewhat surprising. One possible explanation is that trade and FDI do not have a significant effect on the U.S.–Mexican wage gap. Another possible explanation is that there is a third factor affecting wages in ways that mitigate the otherwise positive effects of trade and FDI.
Robertson (2005b) presents evidence supporting the latter. Using border en-forcement hours, he finds that U.S. border enforcement depresses Mexican wages. These results are consistent with Mishra (2006), which finds that emigration has large positive effects on Mexican wages. Furthermore, this effect is comparable to the estimated positive effect of trade. This result is illustrated in Figure 5, which graphs the U.S.–Mexican wage ratio and U.S. border enforcement in Tijuana. The two series exhibit a strong inverse relationship, suggesting that U.S. border en-forcement depresses Mexican wages or raises U.S. wages. Since Hanson, Spilim-
Figure 4
Mexican Convergence to U.S. Wages
Tijuana Central Cd Juarez Matamoros
1987 1989 1991 1993 1995 1997 1999 2001
–.05
–.025
0
.025
Wage ratio
NOTE: These series represent citywide averages of Mexican–U.S. wages for matched age-education groupings using the Mexican National Survey of Urban Employment (Encuesta Nacional de Empleo Urbano) and the U.S. Current Population Surveys. The ratios are based on indexed real wages, converted to real values using domestic national consumer price indicators.
SOURCE: Robertson (2005b).

GlobalizationandMexicanLaborMarkets 67
bergo, and Robertson (2002) find that changes in U.S. border enforcement do not affect U.S. wages, the more plausible explanation seems to be that U.S. border enforcement depresses Mexican wages.
Relative WagesThe effect of globalization on relative wages in developing countries has
been a topic of much debate. In particular, Mexico was one of the first countries to have a documented rise in wage inequality following trade liberalization. Since then, several other papers have shown that a similar phenomenon occurred in other developing countries (see Wood 1997 and the excellent survey by Goldberg and Pavcnik 2007).
The literature contains several possible explanations for rising wage inequal-ity, including, but not limited to, changes in industry-specific wage premiums (Revenga 1997; Cragg and Epelbaum 1996; Feliciano 2001), FDI (Feenstra and Hanson 1997), changes in tariffs that favored skilled workers (Hanson and Har-rison 1999), changes in exchange rates that induced quality upgrading (Verhoo-gen 2007), skill-biased technological change (Cañonero and Werner 2002), and changes in relative output prices (Robertson 2004). These explanations are not mutually exclusive, and all could have played a role in rising wage inequality after
Figure 5
Mexican Wages and U.S. Border Enforcement
Tiju
ana–
U.S.
wag
e ra
tio
Bord
er e
nfor
cem
ent (
San
Dieg
o)
Tijuana–U.S. wage ratio Border enforcement (San Diego)
1986 1988 1990 1992 1994 1996 1998 2000 2002
–.03
–.01
.01
120,000
240,000
360,000
480,000
600,000
NOTE: Enforcement is measured in line-watch hours. The wage ratio is the citywide average of the indexed wage ratio of matched age–education groups using Mexican Encuesta Nacional de Empleo Urbano and U.S. Current Population Survey data.
SOURCE: Robertson (2005b).

68 RaymondRobertson
Mexico joined the General Agreement on Tariffs and Trade (GATT) in 1986.After NAFTA, however, wage inequality falls (Airola and Juhn 2001; Robert-
son 2004; López-Acevedo 2006). The fall emerges in consumption surveys, house-hold surveys, the Mexican Industrial Census, and the Monthly Industrial Survey (Encuesta Industrial Mensual, or EIM).
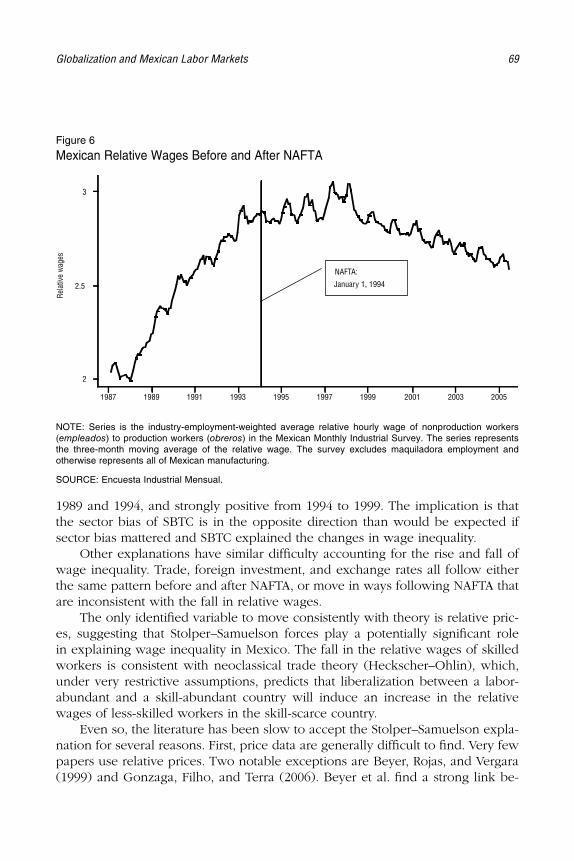
These papers illustrate that wage inequality falls through 2001, but the trend continues through 2005. To illustrate the recent evolution in the wage inequality trend, we draw from EIM. For the 1994–2005 period, aggregated data for 205 in-dustries are available on the Internet.2 The survey is designed to cover 80 percent of Mexican manufacturing production and is based on the Mexican Industrial Census, which is taken every five years. For the period in this paper, the survey covers about 6,000 establishments.3 The survey excludes firms in the maquiladora industry, basic petrochemicals, petroleum refining, and firms with fifteen or fewer employees (microindustria). Variables include employment, hours, and wages for production (obreros) and nonproduction (empleados) workers, as well as the value of production and sales. Figure 6 shows the change in the employment-weighted, within-industry ratio of average nonproduction to production worker wages. The relative wage of skilled workers continued rising during the crisis, consistent with Verhoogen (2007). Once the recovery began, however, the rela-tive wage of skilled workers (as a measure of inequality) started to fall.
While the extent of technological change in Mexico may be debatable, Caño-nero and Werner (2002) argue that skill-biased technological change (SBTC) is relevant for Mexico in the GATT period. Haskel and Slaughter (1998) argue that it is the sector bias of SBTC, rather than simply SBTC itself, that explains changes in relative wages.4 To evaluate the degree of sector bias of SBTC, I use Mexican Industrial Census data and the methodological approach described by Haskel and Slaughter for industries indexed by k:
(1) ∆Sk=a0+a1∆log(ws/wu)k+a2∆(K/Y )k+εk ,
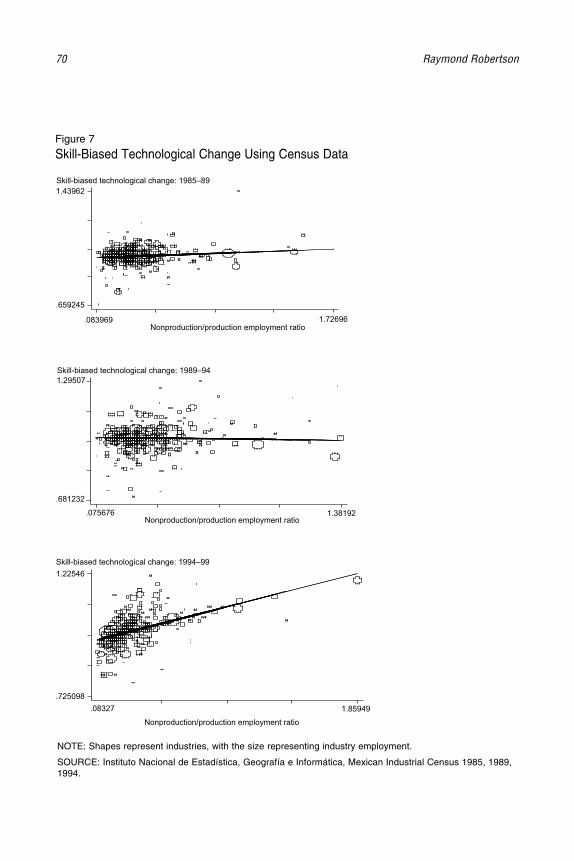
in which ∆Sk is the change in the nonproduction employment share in the total wage bill, wi (i = s,u) represents the wage of each worker type, K is capital, Y is real value-added output, and the final term is the error. Haskel and Slaughter suggest that SBTC in sector k can be represented by positive values of a0+εk. The estimates are positive, suggesting that all industries in all periods experienced SBTC (consistent with Cañonero and Werner). To evaluate the sector bias, Haskel and Slaughter assume that technology does not affect prices and regress their estimates of SBTC on the initial value of the nonproduction–production employ-ment ratio.
The results, shown in Figure 7, suggest that the relationship between skill intensity and SBTC is weakly positive between 1985 and 1989, negative between
GlobalizationandMexicanLaborMarkets 69
1989 and 1994, and strongly positive from 1994 to 1999. The implication is that the sector bias of SBTC is in the opposite direction than would be expected if sector bias mattered and SBTC explained the changes in wage inequality.
Other explanations have similar difficulty accounting for the rise and fall of wage inequality. Trade, foreign investment, and exchange rates all follow either the same pattern before and after NAFTA, or move in ways following NAFTA that are inconsistent with the fall in relative wages.
The only identified variable to move consistently with theory is relative pric-es, suggesting that Stolper–Samuelson forces play a potentially significant role in explaining wage inequality in Mexico. The fall in the relative wages of skilled workers is consistent with neoclassical trade theory (Heckscher–Ohlin), which, under very restrictive assumptions, predicts that liberalization between a labor-abundant and a skill-abundant country will induce an increase in the relative wages of less-skilled workers in the skill-scarce country.
Even so, the literature has been slow to accept the Stolper–Samuelson expla-nation for several reasons. First, price data are generally difficult to find. Very few papers use relative prices. Two notable exceptions are Beyer, Rojas, and Vergara (1999) and Gonzaga, Filho, and Terra (2006). Beyer et al. find a strong link be-
Figure 6
Mexican Relative Wages Before and After NAFTA
Rela
tive
wag
es
1987 1989 1991 1993 1995 1997 1999 2001 2003 2005
2
2.5
3
NAFTA:
January 1, 1994
NOTE: Series is the industry-employment-weighted average relative hourly wage of nonproduction workers (empleados) to production workers (obreros) in the Mexican Monthly Industrial Survey. The series represents the three-month moving average of the relative wage. The survey excludes maquiladora employment and otherwise represents all of Mexican manufacturing.
SOURCE: Encuesta Industrial Mensual.
70 RaymondRobertson
Figure 7
Skill-Biased Technological Change Using Census Data
NOTE: Shapes represent industries, with the size representing industry employment.
SOURCE: Instituto Nacional de Estadística, Geografía e Informática, Mexican Industrial Census 1985, 1989, 1994.
Skill-biased technological change: 1985–89
Nonproduction/production employment ratio1.72696
..659245
1.43962
.083969
Skill-biased technological change: 1989–94
Nonproduction/production employment ratio.075676 1.38192
.681232
1.29507
Skill-biased technological change: 1994–99
Nonproduction/production employment ratio
1.85949
..725098
1.22546
.08327

GlobalizationandMexicanLaborMarkets 71
tween changes in relative prices and wage inequality in Chile, and Gonzaga et al. find a link between changes in relative wages and wage inequality in Brazil. Second, the literature tends to find few examples of significant between-industry shifts. The intuition behind the theorem suggests, although does not strictly re-quire, that trade liberalization in a labor-abundant country will induce a shift to-ward less-skill-intensive industries. As resources move toward less-skill-intensive industries, the demand for unskilled workers increases, raising the relative wage of skilled workers.
Robertson (2004) shows that about 42 percent of the increase in demand for skill over the 1987–94 period is explained by between-industry shifts, and about 32 percent of the fall in demand for skill over the 1994–98 period was due to between-industry shifts.5 One possible reason that the between-industry shifts are less than half of the total change (leaving more than half to be explained by within-industry shifts) is the shift toward the maquiladora sector. Figure 8 shows the rise in the ratio of maquila employment to the rest of Mexican manufacturing (using an index for both series). The data clearly show that maquiladora employ-ment has been rising faster than employment in nonmaquila manufacturing.
This move would be consistent with an increasing demand for skill if maqui-
Figure 8
Maquila Employment Growth Relative to Nonmaquila Manufacturing Employment
Maq
uila
em
ploy
men
t sha
reIn
dex,
199
4 =
1
1994 1996 1998 2000 2002 2004
1
1.25
1.5
1.75
2
2.25
NOTE: The maquiladora employment series represents total maquiladora employment as measured by Mexico’s national statistics institute, Instituto Nacional de Estadística, Geografía e Informática (INEGI). The nonmaquila employment series is total employment in the Mexican Monthly Industrial Survey (EIM). Both series are normalized to 1 in 1994. The line in this graph is the ratio of the two indexed series.
SOURCES: INEGI; EIM.
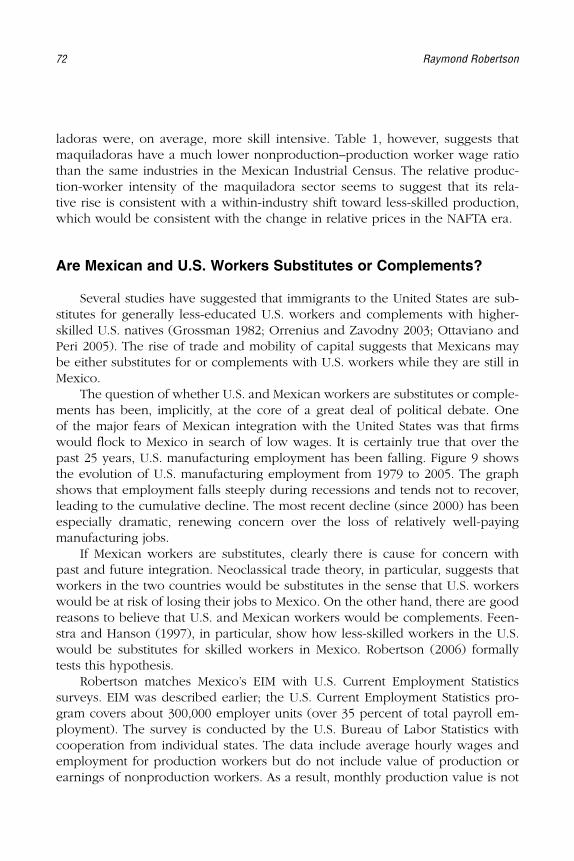
72 RaymondRobertson
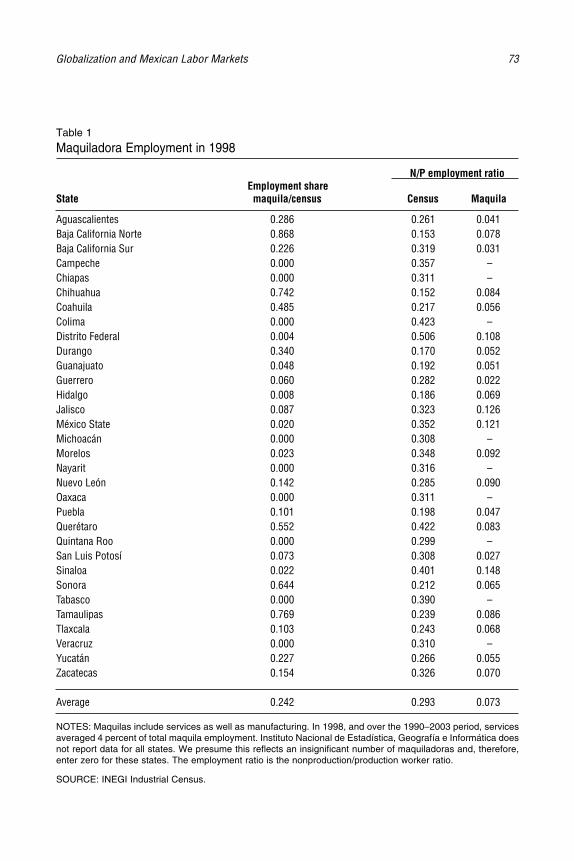
ladoras were, on average, more skill intensive. Table 1, however, suggests that maquiladoras have a much lower nonproduction–production worker wage ratio than the same industries in the Mexican Industrial Census. The relative produc-tion-worker intensity of the maquiladora sector seems to suggest that its rela-tive rise is consistent with a within-industry shift toward less-skilled production, which would be consistent with the change in relative prices in the NAFTA era.
Are Mexican and U.S. Workers Substitutes or Complements?
Several studies have suggested that immigrants to the United States are sub-stitutes for generally less-educated U.S. workers and complements with higher-skilled U.S. natives (Grossman 1982; Orrenius and Zavodny 2003; Ottaviano and Peri 2005). The rise of trade and mobility of capital suggests that Mexicans may be either substitutes for or complements with U.S. workers while they are still in Mexico.
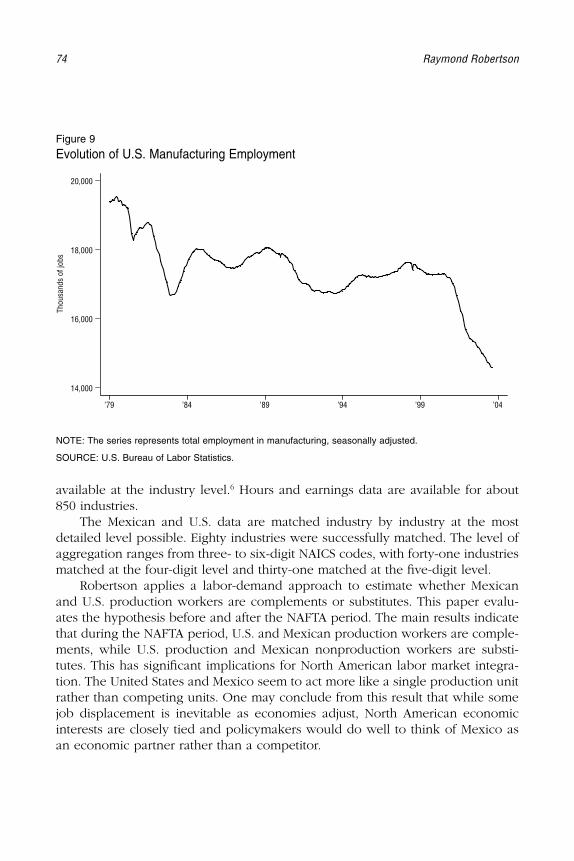
The question of whether U.S. and Mexican workers are substitutes or comple-ments has been, implicitly, at the core of a great deal of political debate. One of the major fears of Mexican integration with the United States was that firms would flock to Mexico in search of low wages. It is certainly true that over the past 25 years, U.S. manufacturing employment has been falling. Figure 9 shows the evolution of U.S. manufacturing employment from 1979 to 2005. The graph shows that employment falls steeply during recessions and tends not to recover, leading to the cumulative decline. The most recent decline (since 2000) has been especially dramatic, renewing concern over the loss of relatively well-paying manufacturing jobs.
If Mexican workers are substitutes, clearly there is cause for concern with past and future integration. Neoclassical trade theory, in particular, suggests that workers in the two countries would be substitutes in the sense that U.S. workers would be at risk of losing their jobs to Mexico. On the other hand, there are good reasons to believe that U.S. and Mexican workers would be complements. Feen-stra and Hanson (1997), in particular, show how less-skilled workers in the U.S. would be substitutes for skilled workers in Mexico. Robertson (2006) formally tests this hypothesis.
Robertson matches Mexico’s EIM with U.S. Current Employment Statistics surveys. EIM was described earlier; the U.S. Current Employment Statistics pro-gram covers about 300,000 employer units (over 35 percent of total payroll em-ployment). The survey is conducted by the U.S. Bureau of Labor Statistics with cooperation from individual states. The data include average hourly wages and employment for production workers but do not include value of production or earnings of nonproduction workers. As a result, monthly production value is not
GlobalizationandMexicanLaborMarkets 73
Table 1
Maquiladora Employment in 1998
N/Pemploymentratio EmploymentshareState maquila/census CensusMaquila
Aguascalientes 0.286 0.261 0.041Baja California Norte 0.868 0.153 0.078Baja California Sur 0.226 0.319 0.031Campeche 0.000 0.357 –Chiapas 0.000 0.311 –Chihuahua 0.742 0.152 0.084Coahuila 0.485 0.217 0.056Colima 0.000 0.423 –Distrito Federal 0.004 0.506 0.108Durango 0.340 0.170 0.052Guanajuato 0.048 0.192 0.051Guerrero 0.060 0.282 0.022Hidalgo 0.008 0.186 0.069Jalisco 0.087 0.323 0.126México State 0.020 0.352 0.121Michoacán 0.000 0.308 –Morelos 0.023 0.348 0.092Nayarit 0.000 0.316 –Nuevo León 0.142 0.285 0.090Oaxaca 0.000 0.311 –Puebla 0.101 0.198 0.047Querétaro 0.552 0.422 0.083Quintana Roo 0.000 0.299 –San Luis Potosí 0.073 0.308 0.027Sinaloa 0.022 0.401 0.148Sonora 0.644 0.212 0.065Tabasco 0.000 0.390 –Tamaulipas 0.769 0.239 0.086Tlaxcala 0.103 0.243 0.068Veracruz 0.000 0.310 –Yucatán 0.227 0.266 0.055Zacatecas 0.154 0.326 0.070
Average 0.242 0.293 0.073
NOTES: Maquilas include services as well as manufacturing. In 1998, and over the 1990–2003 period, services averaged 4 percent of total maquila employment. Instituto Nacional de Estadística, Geografía e Informática does not report data for all states. We presume this reflects an insignificant number of maquiladoras and, therefore, enter zero for these states. The employment ratio is the nonproduction/production worker ratio.
SOURCE: INEGI Industrial Census.
74 RaymondRobertson
available at the industry level.6 Hours and earnings data are available for about 850 industries.
The Mexican and U.S. data are matched industry by industry at the most detailed level possible. Eighty industries were successfully matched. The level of aggregation ranges from three- to six-digit NAICS codes, with forty-one industries matched at the four-digit level and thirty-one matched at the five-digit level.
Robertson applies a labor-demand approach to estimate whether Mexican and U.S. production workers are complements or substitutes. This paper evalu-ates the hypothesis before and after the NAFTA period. The main results indicate that during the NAFTA period, U.S. and Mexican production workers are comple-ments, while U.S. production and Mexican nonproduction workers are substi-tutes. This has significant implications for North American labor market integra-tion. The United States and Mexico seem to act more like a single production unit rather than competing units. One may conclude from this result that while some job displacement is inevitable as economies adjust, North American economic interests are closely tied and policymakers would do well to think of Mexico as an economic partner rather than a competitor.
Figure 9
Evolution of U.S. Manufacturing Employment
Thou
sand
s of
jobs
’79 ’84 ’89 ’94 ’99 ’04
14,000
16,000
18,000
20,000
NOTE: The series represents total employment in manufacturing, seasonally adjusted.
SOURCE: U.S. Bureau of Labor Statistics.

GlobalizationandMexicanLaborMarkets 75
Some Economic Concerns
U.S. Economic OutlookThe finding that U.S. and Mexican production workers are complements
brings good and bad news (in the normative sense). First, the degree of inte-gration with the U.S. ties Mexico’s fate to U.S. manufacturing. To some extent, this may help Mexico as competition from China increases. However, the recent decline in U.S. manufacturing employment can be closely linked to the decline in Mexican nonmaquila manufacturing employment. U.S. manufacturing employ-ment has been falling for twenty-five years, and few economists predict the de-cline to reverse over the medium run.
Furthermore, the United States is facing several potentially serious economic challenges. Since 1980, the U.S. trade deficit has been rising, and as Figure 10 shows, the growth in U.S. federal debt is closely related to the U.S. trade deficit. The United States now has ratios of debt to gross domestic product greater than those of Turkey, Argentina, Mexico, and Brazil, all countries that have experi-enced debt-related crises.
Several prominent macroeconomists have suggested that a correction in the U.S. trade deficit, which they consider inevitable, could come in the next five to ten years. Several scenarios apply. The United States could experience a gradual
Figure 10
U.S. Trade Balance and Public Debt
U.S.
trad
e ba
lanc
e: w
orld
(in
mill
ions
of d
olla
rs)
U.S.
pub
lic d
ebt (
in d
olla
rs)
US. trade balance: world U.S. public debt
1955 1960 1965 1970 1975 1980 1985 1990 1995 2000 2004
–650,814
9,188.5
–7.6e+12
–2.7e+11
SOURCES: U.S. Census Bureau, Foreign Trade Division; U.S. Department of the Treasury.
76 RaymondRobertson
depreciation of the dollar and, therefore, a gradual fall in consumer imports. To the extent that Mexico is integrated into the U.S. production chain, however, this depreciation could potentially help Mexico by increasing the demand for U.S. finished-good exports. If so, this could increase demand for Mexican exports to the United States, which would be helpful during a time of otherwise falling U.S. imports. The more integrated Mexico is in the U.S. production chain, the more positive (or less negative) will be the effects of a gradual or sudden depreciation of the dollar.
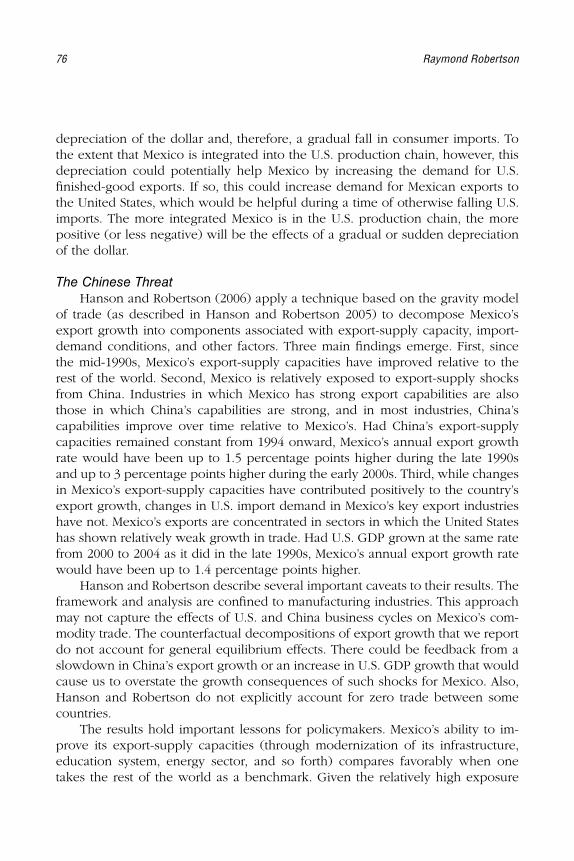
The Chinese ThreatHanson and Robertson (2006) apply a technique based on the gravity model
of trade (as described in Hanson and Robertson 2005) to decompose Mexico’s export growth into components associated with export-supply capacity, import-demand conditions, and other factors. Three main findings emerge. First, since the mid-1990s, Mexico’s export-supply capacities have improved relative to the rest of the world. Second, Mexico is relatively exposed to export-supply shocks from China. Industries in which Mexico has strong export capabilities are also those in which China’s capabilities are strong, and in most industries, China’s capabilities improve over time relative to Mexico’s. Had China’s export-supply capacities remained constant from 1994 onward, Mexico’s annual export growth rate would have been up to 1.5 percentage points higher during the late 1990s and up to 3 percentage points higher during the early 2000s. Third, while changes in Mexico’s export-supply capacities have contributed positively to the country’s export growth, changes in U.S. import demand in Mexico’s key export industries have not. Mexico’s exports are concentrated in sectors in which the United States has shown relatively weak growth in trade. Had U.S. GDP grown at the same rate from 2000 to 2004 as it did in the late 1990s, Mexico’s annual export growth rate would have been up to 1.4 percentage points higher.
Hanson and Robertson describe several important caveats to their results. The framework and analysis are confined to manufacturing industries. This approach may not capture the effects of U.S. and China business cycles on Mexico’s com-modity trade. The counterfactual decompositions of export growth that we report do not account for general equilibrium effects. There could be feedback from a slowdown in China’s export growth or an increase in U.S. GDP growth that would cause us to overstate the growth consequences of such shocks for Mexico. Also, Hanson and Robertson do not explicitly account for zero trade between some countries.
The results hold important lessons for policymakers. Mexico’s ability to im-prove its export-supply capacities (through modernization of its infrastructure, education system, energy sector, and so forth) compares favorably when one takes the rest of the world as a benchmark. Given the relatively high exposure

GlobalizationandMexicanLaborMarkets 77
of Mexico to export competition from China, however, the country’s improving export-supply capacities may come as small consolation. Mexico is vulnerable to export-supply shocks in China and, given slowly changing patterns of industrial specialization, is likely to remain so for the medium run. During the early 2000s, China’s impact on Mexico was roughly twice that of the U.S. economic slowdown. If the U.S. economy continues to expand, there is scope for Mexico to recover some of the export growth it enjoyed in the 1990s.
The regression results suggest that for Mexico to continue to expand its export-supply capacity in the country’s key export industries, it would need to expand the supply of labor, increase electricity production, reduce borrowing costs, and/or expand telecommunications infrastructure. Among the sample of countries that also export goods in Mexico’s primary export industries, growth in these factors is positively correlated with increases in export-supply capacity.
Conclusion
The question of integration remains especially salient for Mexico. Engage-ment with the global economy even has political implications. For Mexico, en-gagement in the global economy means integration with the United States. The contraction of the U.S. economy has traditionally hurt the Mexican economy, and integration brings risks. These risks, however, must be weighted against alterna-tive policies (less integration, in this case) that seem less promising than deepen-ing integration with the United States.
Notes1 Theeducationlevelsaredividedintothefollowingcategories:0–6years,7–9years,10years,
11–12years,andmorethan12years.Theagegroupsarefiveyearsapartstartingat15,exceptforthelastgroup.Thelastgroupincludesworkers50–65inthefirstyear.
2 SeeBanco de Información Económicaatwww.inegi.gob.mx.3 Overthesampleperiod,thesurveycoversbetween5,587and6,884establishments.4 Xu(2001)findsthattheelasticityofsubstitutionmayaffecttheseresults.5 Oneproblemwiththissimplecalculationisthatitabstractsfrombusiness-cycleeffects.Rob-
ertsonandDutkowsky(2002)confirmthatnonproductionworkershavehigheradjustmentcoststhanproductionworkersinMexico.Thisfindingimpliesthattheaggregatenonproduction–pro-ductionworkerratiowillhaveabusiness-cyclecomponent.Therelativeemploymentofskilledworkers,however,risesoverthesampleperiod.Thisisconsistentwitharisingsupplyofskilledworkersandafallintherelativepriceofskill-intensivegoods.
6 TheBoardofGovernorsoftheFederalReserveSystemreleasesmonthlyproductionindexesattheindustrylevel.Theseindexesarenotusuallydirectmeasuresofoutput.Instead,formuchofmanufacturing,theoutputindexesareconstructedfunctionsoftheCurrentEmploymentStatis-ticsemploymentdata.

78 RaymondRobertson
ReferencesAirola,J.,andC.Juhn(2001),“IncomeandConsumptionInequalityinPostReformMexico”(Paperpresentedatthe2001LatinAmericanandCaribbeanEconomicSocietyMeetings).
Beyer,H.,P.Rojas,andR.Vergara(1999),“TradeLiberalizationandWageInequality,”Journal of Development Economics59(June):103–23.
Cañonero,G.,andA.Werner(2002),“SalariosRelativosyLiberacióndelComercioenMéxico,”El Trimestre Económico69,no.273(January–March):123–42.
Cragg,M.,andM.Epelbaum(1996),“WhyHasWageDispersionGrowninMexico?IsIttheIncidenceofReformsortheGrowingDemandforSkills?”Journal of Development Economics51(October):99–116.
Deaton,Angus(1985),“PanelDatafromTimeSeriesofCross-Sections,”Journal of Economet-rics30(October–November):109–26.
Feenstra,R.C.,andG.H.Hanson(1997),“ForeignDirectInvestmentandRelativeWages:Evi-dencefromMexico’sMaquiladoras,”Journal of International Economics42(May):371–93.
Feliciano,Zadia(2001),“WorkersandTradeLiberalization:TheImpactofTradeReformsonWagesandEmployment,”Industrial and Labor Relations Review55(October):95–115.
Goldberg,PinelopiKoujianou,andNinaPavcnik(2007),“DistributionalEffectsofGlobalizationinDevelopingCountries,”Journal of Economic Literature 45(March):39–82.
Gonzaga,Gustavo,NaércioMenezesFilho,andCristinaTerra(2006),“TradeLiberalizationandtheEvolutionofSkillEarningsDifferentialsinBrazil,”Journal of International Economics68,(March):345–67.
Grossman,JeanB.(1982),“TheSubstitutabilityofNativesandImmigrantsinProduction,”Review of Economics and Statistics64(November):596–603.
Hanson,Gordon(2004),“WhatHasHappenedtoWagesinMexicoSinceNAFTA?”inFTAA and Beyond: Prospects for Integration in the Americas,ed.AntoniEstevadeordal,DaniRodrik,AlanTaylor,andAndresVelasco(Cambridge,Mass.:HarvardUniversityPress).
Hanson,Gordon,andAnnHarrison(1999),“Trade,Technology,andWageInequalityinMex-ico,”Industrial and Labor Relations Review52(January,pt.2):271–88.

GlobalizationandMexicanLaborMarkets 79
Hanson,Gordon,andRaymondRobertson(2005),“BoomsandBustsinMexicanExports:AGravityFrameworkforEvaluatingSupplyandDemandFactors”(UniversityofCalifornia,SanDiego,October,unpublishedpaper).
———(2006),“TheRecentEvolutionofMexico’sManufacturingExports”(UniversityofCalifor-nia,SanDiego,October,unpublishedpaper).
Hanson,Gordon,AntonioSpilimbergo,andRaymondRobertson(2002),“DoesBorderEnforce-mentProtectU.S.WorkersfromIllegalImmigration?”Review of Economics and Statistics84(February):73–92.
Haskel,J.,andM.J.Slaughter(1998),“DoestheSectorBiasofSkill-BiasedTechnicalChangeExplainChangingWageInequality?”NBERWorkingPaperSeries,no.6565(Cambridge,Mass.:NationalBureauofEconomicResearch,May).
López-Acevedo,Gladys(2006),“Mexico:TwoDecadesoftheEvolutionofEducationandInequality,”WorldBankPolicyResearchWorkingPaperno.3919(May).
López-Córdoba,Ernesto(2006),“Globalización,Economía,yElecciones,”Enfoque de Reforma,no.648(August20).
Mishra,Prachi(2006),“EmigrationandWagesinSourceCountries:EvidencefromMexico,”InternationalMonetaryFundWorkingPaperno.86(June).
Orrenius,PiaM.,andMadelineZavodny(2003),“DoesImmigrationAffectWages?ALookatOccupation-LevelEvidence,”FederalReserveBankofDallasWorkingPaperno.0302(revisedMarch2006).
Ottaviano,GianmarcoI.P.,andGiovanniPeri(2005),“RethinkingtheGainsfromImmigration:TheoryandEvidencefromtheU.S.,”NBERWorkingPaperSeries,no.11672(Cambridge,Mass.:NationalBureauofEconomicResearch,October).
Revenga,Ana(1997),“EmploymentandWageEffectsofTradeLiberalization:TheCaseofMexicanManufacturing,”Journal of Labor Economics15(July,pt.2):S20–43.
Revenga,Ana,andClaudioMontenegro(1998),“NorthAmericanIntegrationandFactorPriceEqualization:IsThereEvidenceofWageConvergenceBetweenMexicoandtheUnitedStates?”inImports, Exports, and the American Worker,ed.SusanCollins(Washington,D.C.:BrookingsInstitutionPress),305–34.

80 RaymondRobertson
Robertson,Raymond(2000),“WageShocksandNorthAmericanLaborMarketIntegration,”American Economic Review90(September):742–64.
———(2004),“RelativePricesandWageInequality:EvidencefromMexico,”Journal of Inter-national Economics64(December):387–409.
———(2005a),“DefiningNorthAmericanEconomicIntegration,”inNorth American Agrifood Market Integration: Situation and Perspectives(January,proceedingsoftheNorthAmericanAgrifoodMarketIntegrationWorkshop),ed.K.M.Huff,K.D.Meilke,R.D.Knutson,R.F.Ochoa,J.Rude,andA.Yunez-Naude(Winnipeg,Manitoba:FriesenPrinters).
———(2005b),“HasNAFTAIncreasedLaborMarketIntegrationBetweentheUnitedStatesandMexico?”The World Bank Economic Review19(December):425–48.
———(2006),“AreMexicanandU.S.WorkersComplementsorSubstitutes?”(MacalesterCol-lege,unpublishedpaper).
Robertson,Raymond,andDonaldH.Dutkowsky(2002),“LaborAdjustmentCostsinaDestina-tionCountry:TheCaseofMexico,”Journal of Development Economics67(February):29–54.
Robertson,Raymond,AnilKumar,andDonaldDutkowsky(2006),“PurchasingPowerParityandAggregationBiasforaDevelopingCountry:TheCaseofMexico”(MacalesterCollege,August,unpublishedpaper).
Verhoogen,Eric(2007),“Trade,QualityUpgradingandWageInequalityintheMexicanManu-facturingSector:TheoryandEvidencefromanExchange-RateShock,”WorkingPaper,Colum-biaUniversity(NewYork:February).
Wood,A.(1997),“OpennessandWageInequalityinDevelopingCountries:TheLatinAmericanChallengetoEastAsianConventionalWisdom,”World Bank Economic Review11(January):33–57.
Xu,Bin(2001),“FactorBias,SectorBias,andtheEffectsofTechnicalProgressonRelativeFactorPrices,”Journal of International Economics54(June):5–25.