EVIDENCE AND EVALUATION: THE NATIONAL MINIMUM DRINKING … · · 2016-07-07EVIDENCE AND...
53
EVIDENCE AND EVALUATION: THE NATIONAL MINIMUM DRINKING AGE ACT OF 1984 1 Darren Grant Department of Economics and International Business Sam Houston State University Huntsville, TX 77341-2118 [email protected] Abstract: When considering federal legislation to encourage states to raise the drinking age to twenty-one, public officials faced a common problem: assessing the efficacy of a proposed policy change from diverse evidence that is deficient in quality and quantity. This paper shows how the political system yielded an assessment that was substantially more optimistic than merited by the evidence available at the time. This outcome was shaped less by political inadequacies than by the failure of academia to provide the requisite intellectual background and by the absence of the requisite human capital within the federal agency that oversees traffic safety. JEL Codes: I18, K14, N42 Keywords: drunk driving; traffic safety legislation; policy analysis 1 This research was sponsored by a grant from Choose Responsibility. A companion paper, Grant (2011), documents how academic findings on the effects of three major laws–the minimum legal drinking age, zero tolerance laws, and .08 per se laws–become much less favorable over time and explains this evolution in terms of changes in study design and an “early adopter effect.” I appreciate the helpful comments of Craig Depken, Michael Livermore, Christian Raschke, Hui-Chen Wang, and seminar participants at Sam Houston State University; the useful feedback from participants at the meetings of the Public Choice Society, the Southern Economic Association, and the Association of Public Policy and Management; the research assistance of Kristin Boykin; and the cooperation of several interviewees.
Transcript of EVIDENCE AND EVALUATION: THE NATIONAL MINIMUM DRINKING … · · 2016-07-07EVIDENCE AND...

EVIDENCE AND EVALUATION: THE NATIONAL MINIMUM DRINKING AGE ACT OF 19841
Darren Grant Department of Economics and International Business
Sam Houston State University Huntsville, TX 77341-2118
Abstract: When considering federal legislation to encourage states to raise the drinking
age to twenty-one, public officials faced a common problem: assessing the efficacy of a proposed policy change from diverse evidence that is deficient in quality and quantity. This paper shows how the political system yielded an assessment that was substantially more optimistic than merited by the evidence available at the time. This outcome was shaped less by political inadequacies than by the failure of academia to provide the requisite intellectual background and by the absence of the requisite human capital within the federal agency that oversees traffic safety.
JEL Codes: I18, K14, N42 Keywords: drunk driving; traffic safety legislation; policy analysis
1 This research was sponsored by a grant from Choose Responsibility. A companion paper, Grant (2011), documents how academic findings on the effects of three major laws–the minimum legal drinking age, zero tolerance laws, and .08 per se laws–become much less favorable over time and explains this evolution in terms of changes in study design and an “early adopter effect.” I appreciate the helpful comments of Craig Depken, Michael Livermore, Christian Raschke, Hui-Chen Wang, and seminar participants at Sam Houston State University; the useful feedback from participants at the meetings of the Public Choice Society, the Southern Economic Association, and the Association of Public Policy and Management; the research assistance of Kristin Boykin; and the cooperation of several interviewees.

ACRONYMS USED IN THE PAPER
AAA: American Automobile Association BAC: Blood Alcohol Concentration CPSC: Consumer Product Safety Commission DWI: Driving While Intoxicated (drunk driving) GAO: General Accounting Office, a federal government “watchdog” agency IIHS: The Insurance Institute for Highway Safety, an industry research and lobbying group MADD: Mothers Against Drunk Driving, a group that lobbies for the enactment of various drunk
driving countermeasures MLDA: Minimum Legal Drinking Age NHTSA: The National Highway Traffic Safety Administration, the federal agency with primary
responsibility for traffic safety NIAAA: National Institute on Alcohol Abuse and Alcoholism NMDAA: National Minimum Drinking Age Act, which strongly encouraged states to raise the
drinking age to 21 NSC: National Safety Council NTSB: National Transportation Safety Board, a federal agency that investigates vehicle
accidents, plane crashes, etc., and makes safety recommendations TSCS: Time-series cross-section, data that contains variation over time across a number of
cross-sectional units, such as states
1
In general the influence of the public, whether directly or through political institutions, has been pernicious to traffic safety. It comes and goes, filling in the troughs between peaks of more exciting events; it seizes on issues without concern for the relevance or tractability of the problems; it proposes “solutions” which are at best naïve and at worst absurd, and above all it demands action even where action may be only a waste of money. –Frank Haight (1985) Although it is hard to challenge Haight’s characterization of…the political process in the area of traffic safety, his proposed solution of entrusting the issue to low-profile agencies…seems wishful and unrealistic. His viewpoint neglects the fact that the recognition of any condition as a social problem is a political matter. It is not helpful for underdogs in the political game to pick up their chips, denounce the rules…and look elsewhere, when the political game is the only game in town. Even the experts are forced to play it, often as mere adjutants to parties with less sophistication but greater involvement and determination. –H. Laurence Ross (1992, p. 174)
A primary motivation for undertaking economic analysis is to inform public policy.
Economists’ penchant for highlighting the policy implications of their results is so widespread it
has caused one respected economist to warn against its overuse.1 Our federalist system, in
which the states, “laboratories of democracy,” experiment with alternative solutions to social
problems, is predicated to some extent on accurate assessments of these experiments, to
ensure the most promising solutions thrive. Economists and other policy analysts fill this role.
Yet it is a nearly fruitless quest to peruse the pages of academia for insight into just how
the results of formal policy analyses are integrated into policymaking. The subject appears to
fall in a no-man’s-land between the topical research itself, on the one hand, and general
theories of the policy process, on the other. This latter literature acknowledges the difficulties 1 See slide 16 of Daniel Hamermesh’s slide presentation, “How to Publish in a Top Journal: I Wish I Knew!” at https://www.wiwi.hu-berlin.de/professuren/vwl/wtm2/hamermeshslides.

2
getting policymakers to care about policy analysis (Shulock, 1999), the frequent dissonance
between the technocratic merit of a proposed policy and its political feasibility (Majone, 1989;
Stone, 2001), and the role of learning in policy formation and diffusion (Keikkila and Gerlak,
2013; Meseguer, 2005), but does not examine the evaluative process in detail.2 The closest
work we could find touches on other aspects of the intersection between analysis and policy.3
Policy is often governed by political actors, instead of technical experts, because it is
necessary to trade off competing interests, “recognize a condition as a social problem,” or
consider non-technical factors such as the social acceptance of a new law. In assessing the
state of knowledge, these actors frequently face a daunting task. The relative and absolute
merits of any given policy are generally uncertain, because of differences across studies in
research design, data, and the interpretation of the evidence, while the often-compressed time
scales of policymaking heighten deficiencies in the quality and quantity of the evidence
available at the point of decision.
Understanding how this difficult problem is solved, and the impediments to doing so,
would increase our understanding of the evaluative process, improve the quality of its
2 Formal evidence on policies’ likely effects plays little role in multiple theories of the policy process; see Sabatier (2007) and the papers introduced by Schlager and Weible (2013). Similarly, learning appears regularly in Berry and Berry’s (2007) overview of the policy diffusion literature, but the role of formal analysis in that learning goes mostly unexplored. 3 This includes techniques employed directly by policymakers, such as benefit-cost analysis (Boardman, Wining, and Waters, 1993; Hahn, 2000); policies governed by technical experts, such as the Federal Reserve (Blinder, 1997); Henig’s (2008) comparison of how two fora, academia and the media, resolve differences in research findings on the effectiveness of charter schools; Tanenbaum’s (2009) examination of how Pay for Performance came to be implemented in Medicare despite little concrete evidence on its effectiveness; and a recent symposium exploring how research can best be synthesized for policymakers’ use (Robinson and Hammitt, 2015; Rhomberg, 2015).

3
outcomes, and help dispel a certain fatalism that hovers over the existing literature, which
treats this problem as intractable rather than as a consequence of intellectual, institutional, and
political arrangements that can be ameliorated. This takes on additional relevance with
President Obama’s recent Executive Order 13563, which requires Federal agencies to conduct
evidence-based reviews of “existing significant rules” to determine their effectiveness and
economy (see Haskins and Margolis, 2014).
The form of such an inquiry must be shaped by three key impediments to its execution.
First, many relevant “variables,” such as political forces or institutional characteristics, cannot
be quantified, prohibiting a purely statistical approach. Second, variation across policies in the
technical issues, political constituencies, and institutions involved heightens the relevance of
context and prevents a broad, deductive approach centered around a priori theorizing. Third,
the unusual combination of statistical, political, organizational, and policy-specific technical
knowledge that must be invoked precludes an analytical approach that fits cleanly into a well-
defined academic field. These impediments necessitate a multifaceted, narrative approach that
induces general principles from specific situations.
Using this approach, this paper investigates how evidence on the effects of raising the
minimum legal drinking age (MLDA), “one of the most thoroughly evaluated social
interventions of our time,” (Ross, 1992) was evaluated in the prologue to the 1984 passage of
the National Minimum Drinking Age Act (NMDAA), which provided strong and ultimately
successful incentives for all states to raise their MLDA to 21. We examine how well the federal
government assessed the extant evidence on the effects of the raised MLDA, how well it
assessed the limitations of that evidence, how underlying intellectual and institutional factors
4
influenced these assessments, and how this process might be improved.
While rare in economics, the narrative approach is firmly established in a sizeable
literature on the political economy of regulation, and indeed has been employed by Mashaw
and Harfst (1990) to explain the standard-setting behavior of one of our major actors, the
National Highway Traffic Safety Administration (NHTSA). Still, anyone using this approach must
take pains to show that its results generalize. There are three ways to do so, all of which apply
here. First, there is nothing unique about the NMDAA that distinguishes it from a broad class of
related policy issues. For example, the legal and political environment facing NHTSA closely
resembles that of analogous agencies such as the Consumer Product Safety Commission (CPSC)
and the Occupational Safety and Health Administration (Mashaw and Harfst, 1990; Breyer,
1982). Second, our findings generalize empirically, explaining events related to subsequent
drunk driving laws quite well. Third, much of the behavior described here is explained using
fundamental principles, comparative advantage especially, that should also apply elsewhere.
Ultimately, ours is a story not of one actor, but three: the political system, academia,
and NHTSA. Observed outcomes derive from the interplay of these actors, each pursuing
imperfectly-aligned interests while facing unique constraints. Section I describes the social and
political context of the NMDAA and retrospectively looks at how this legislation has affected
traffic fatalities. Section II then examines how the political system evaluated, at the point of
decision, the available evidence and its weaknesses. Section III relates these outcomes to
enduring intellectual and institutional factors that, we show, are not unique to this case. This is
our first step towards generalizing this narrative’s results. The second step occurs in Section IV,
where we look beyond the NMDAA and present suggestions for reform. Section V concludes.
5
Section I. The Setting.
A Brief History of the National Minimum Drinking Age Act. Legislation to curtail drunk driving
and youth drinking began in the late 1970s, a reversal of the increased permissiveness earlier
that decade, when many states lowered their drinking ages. From 1976-1980, thirteen states
raised their drinking ages, generally by one year. Between 1981 and 1983, twelve more states
raised their drinking ages, thirty-four states adopted per se blood alcohol concentration (BAC)
limits, and eleven adopted administrative license revocation. Activity crested between 1984
and 1986, with the passage of hundreds of state laws, as documented in Table 1.
This activity was associated with three concomitant social changes, each also
documented in Table 1. The first was an increased social awareness of the dangers of drunk
driving: media coverage of the issue, almost wholly absent during the 1970s, grew rapidly after
1981. Hundreds of stories appeared in major newspapers, and dozens of stories in magazines,
during the next quadrennium. Coverage in other media increased as well:
I can see it from my experiences of ten, twelve years ago as Secretary, when if I could get one TV camera to come to a hearing or a meeting about drunk driving, I thought we were very fortunate. They might stay as long as ten minutes. Our first hearing in Oklahoma City [of the Presidential Commission on Drunk Driving] we had four television cameras, twelve radio stations, and eight or nine newspaper people there. Two of the cameras stayed half a day and two stayed all day long. (John Volpe, former Secretary of the Department of Transportation and then-Chairman of the Presidential Commission on Drunk Driving, H1, 1983, p. 273.)4 This awareness translated into action: hundreds of organizations were founded whose
purpose was to curtail drunk driving. The best known of these, Mothers Against Drunk Driving 4 This quote, like many others to follow, comes from the transcript of a Congressional hearing or Congressional debate. These events are each listed in the chronology in the Appendix, labeled H0-H6, and cited within the text using that appellation.

6
(MADD), played a key role in lobbying for the NMDAA and subsequent legislation, including .08
per se BAC limits, open container laws, and zero tolerance laws, and is still active today.
These two social changes contributed to the third, in attitudes. The public became
much less accepting of driving after drinking:
The American public is far less tolerant of drunk driving that they were ten years ago. It’s no longer funny for Johnny Carson to joke about the issue. (Judith Stone, Director, Federal Affairs, National Safety Council, H5, June 1988, p. 24.) For…decades, the enormous toll of death and injury that occurred in the United States was regarded as accidental in almost a cosmic sense. The statistical toll of road accidents was collected and reported with an air of fatalism similar to attitudes toward earthquakes, tornadoes, or other natural disasters. At the same time, the…paradigm of responsibility began and ended with the personal fault of the parties to the accident. The public perception now in the United States…is that the manner in which…laws are drafted and enforced can have important effects on highway deaths and injuries (Zimring, 1988).
While most legislative activity occurred at the state level, the issue also received federal
attention, partly from concern about youth driving across state lines to take advantage of a
lower MLDA. Transportation bills offered financial incentives to the states to adopt various
drunk driving countermeasures, including but not limited to higher drinking ages. President
Reagan appointed a highly-visible Presidential Commission on Drunk Driving, which held
nationwide hearings and ultimately issued dozens of recommendations on the issue. Both
NHTSA and the National Transportation Safety Board (NTSB) weighed in with written reports
and testimony before Congressional subcommittees, which held several hearings on the
problems of drunk driving and teenage drinking. The Appendix contains an extensive
chronology of the activity surrounding the passage of the NMDAA.
In 1983 and 1984 these forces built to a fever pitch and provided the impetus for strong
federal action. A Gallup Poll taken in early 1983 established the popularity of raising the
7
drinking age, and multiple bills or amendments to mandate or encourage this were proffered in
Congress. In November, 1983, the Presidential Commission on Drunk Driving, following in the
footsteps of MADD, the National Safety Council (NSC), the Insurance Institute for Highway
Safety (IIHS), and the NTSB, formally recommended establishing a national drinking age of
twenty-one in order to improve traffic safety. President Reagan signaled his support in June,
1984; the NMDAA was law one month later. Challenges to the law’s constitutionality were
exhausted by 1987; the last two states raised their MLDAs to 21 the next year.
Evidence on the Effects of the Minimum Legal Drinking Age: Then and Now. The country’s
enthusiasm for a raised MLDA was matched by its supporters’ optimism about its expected
effect on traffic safety:
Nearly every state that has raised the drinking age to twenty-one has produced a significant drop in the (sic) teenage driving fatalities. In the state of New Jersey...the rate dropped by twenty-six percent; Illinois, it has fallen twenty-three percent; in Michigan, thirty-one percent. (President Ronald Reagan, Remarks on Signing HR 4616 into Law, July 17, 1984.)
This optimism, however, contrasted with the incompleteness of the evidence on how the
drinking age affects traffic safety—the law’s raison d’être.
The complete academic literature through 2009, forty years in length, is illustrated in
Figure 1, taken from Grant (2011).5 On this “bubble plot,” the horizontal axis represents the
5 This includes all studies published in an academic book or refereed journal that estimate the effect of the raised MLDA on the affected population (generally 18-20 year olds), omitting regression discontinuity analyses that cover only one edge of this age range, along with a few panel analyses that go far beyond this range. For further discussion, see Grant (2011). While regression discontinuity analyses find larger effects than panel estimates of similar vintage, this should be expected. Compared to 18-20 year olds as a whole, drinking involvement in fatal
8
publication date, which is generally a couple of years after the data terminate, and the vertical
axis represents the estimated percentage effect on fatalities involving affected drivers, with
insignificant estimates set to zero. The diagonal line separates studies of lowered drinking ages,
in the first part of the literature, from subsequent studies of raised MLDAs. The volume of each
bubble represents the number of academic citations in Google Scholar as of June 2009, with a
minimum bubble size so that uncited studies are not eliminated. (Later studies have less time
in which to be cited, of course.) Bubbles ringed in black circles are supported by external
funding, generally from the National Institute on Alcohol Abuse and Alcoholism (NIAAA).
The color of the bubble represents the study design. Red represents cross-section
regression, and blue quasi-experimental designs, which generally compare the change in
fatalities in one, or a few, law-adopting states with the change in control states that do not
adopt the law. (Occasionally alternative control groups are used instead, based on age or time
of day, while the pre-existing trend is sometimes modeled using an ARMA process.) The spatial
and temporal dimensions are combined in pooled time-series cross-section (TSCS) regressions,
in purple, which include control variables but not state and year fixed effects, and panel
regressions, in white, which do include these fixed effects. Panel designs are preferred: they
combine the before-after quality of quasi-experimental analyses with the breadth of data and
explicit inclusion of control variables that are found in pooled TSCS regressions.
The variation in findings is tremendous in both the raised-MLDA and lowered-MLDA
components of this literature, with estimated effects spanning more than thirty percentage
accidents is much higher along the 20-21 year old “border” along which the discontinuity is estimated. At this point it is unclear how to reconcile the two sets of estimates.
9
points. Some of this is relatively unsystematic, stemming from differences in the dependent
variable (crashes or fatalities, scaling by population or miles travelled, etc.), the states and
control groups used in quasi-experimental analyses, and the control variables included in
regression analyses.
But some is systematic. This variation stems from the following evolutionary process.
Early studies, dominated by quasi-experimental methods, yield highly variable yet relatively
favorable conclusions. As the number of law-adopting states and post-law years grow, these
are supplanted by pooled TSCS and, eventually, panel regressions, which are less variable and
much less favorable. This can be seen for studies of lowered drinking ages and, more strikingly,
studies of raised drinking ages, where the number of law-adopting states and post law-
adoption years becomes large, permitting extensive use of panel methods. The two panel
analyses of lowered MLDAs, Cook and Tauchen (1984) and Weinstein (1987), find traffic
fatalities among the affected ages increase by six or seven percent. Early panel analyses of
raised MLDAs, discussed below, find a fatality reduction of about 12%, but later studies again
average six or seven percent (Dee, 1999; Eisenberg, 2003; Young and Likens, 2000; Young and
Beilinska-Kwapisz, 2006; Polnicki et al., 2007; and Miron and Tetelbaum, 2009).
This trend in findings stems partly, but not wholly, from the evolution in methods. As
documented by Grant (2011) for three Congressionally-incentivized drunk driving laws and by
Miron and Tetelbaum (2009) for the MLDA specifically, fatality changes associated with new
laws are consistently larger in those states that adopt them earliest, without being spurred to
do so by Congress, even when the estimation method is kept the same. This too causes
estimates of these laws’ effects to trend toward zero over time.

10
Figure 2 summarizes Miron and Tetelbaum’s results. The top pane estimates the
percentage change in youth traffic fatalities generated by raising each state’s MLDA to twenty-
one, taken from a sequence of individual state time-series regressions, plotted against the year
that state raised its MLDA. (These regressions each cover the same span of years and include
the same control variables. States maintaining an MLDA of 21 since 1975 are excluded.) The
bottom pane contains a cumulative estimate, from all states adopting this MLDA up to that
point in time. Over the time period in the figure, this falls from 10% to less than 5%.
Overall, the literature converges to reasonable extent. This is, in part, a natural
consequence of the ethos of academia, which is organized as an “independent, collective,
cumulative, open-ended enterprise of knowledge creation and testing” (Henig, 2008, p. 232).
Over the decades, one could observe the slow resolution of conflicts in the MLDA literature
over measurement (Williams et al., 1983 vs. Males, 1986; Hammond, 1973 vs. Zylman, 1974),
specification (Garber, 1988), and execution (General Accounting Office, or GAO, 1987). But it
took decades to achieve. Policymakers contemplating action in 1984 did not have this luxury.
The evidence to be evaluated at that time was highly disparate in method, sample, and result.
Section II. The Evaluation of the Evidence in Four Congressional Hearings.
We examine how the political theatre evaluated the evidence on this issue through the
lens of four Congressional subcommittee hearings surrounding the passage of the NMDAA. In
each, a range of witnesses spoke extensively about the evidence on the effects of a raised
MLDA. Far more studies are discussed in these hearings than on the floors of the House and
11
Senate, while the positions argued by the same individual or organization varied little across
time. Collectively, therefore, these hearings provide a reasonably detailed and comprehensive
record of the various perspectives on the evidence, the way these perspectives were presented
and examined, and the participants’ political and technical skills.
The first hearing was held in October, 1983, by the House Subcommittee on Commerce,
Transportation, and Tourism, shortly after the introduction of bill to directly establish an MLDA
of 21 nationwide. This well-attended hearing, held when there was increasing momentum for
federal action but ambiguity about the form that action might take, featured an exhaustive
witness list and active participation from committee members.
The next two, held by the Senate Subcommittees on Surface Transportation and Drug
and Alcohol Abuse in June, 1984, were pro forma, as legislative and executive support for the
NMDAA was already established. No members other than the chair attended. Each witness
read a prepared statement, but there were few questions.
The last hearing occurred in September, 1986, before the Subcommittee of
Investigations and Oversight, House Committee on Public Works and Transportation, to discuss
a draft report prepared by the GAO that assessed the evidence on the effects of the raised
MLDA. This hearing’s existence testifies to prior hastiness evaluating the evidence:
Congress did take an action in 1984, admittedly without…full committee exploration of the issue, but just on the basis of data at hand, and Congress acted. All right. Now we are trying to come back and analyze the benefits of that action. (Rep. James Oberstar, D-MN, H4, 1986, p. 200.)
No other hearing focused on the MLDA as did these four. However, we also reviewed several
others that were peripherally related to the issue, along with the relevant Congressional
debate, all of which are listed in the chronology in the Appendix.
12
Despite this variety of purpose, each hearing’s format was similar. Witnesses appeared
in homogenous groups (government agencies, industry representatives, etc.), read a prepared
statement and answered questions. Most witnesses, except perhaps a handful of academics,
had a material or governmental interest in the hearing’s outcome. Along with NHTSA and the
NTSB, the higher drinking age was favored by the insurer-funded IIHS, elite safety organizations
such as the NSC, and grassroots advocates such as MADD.6 All have extensive experience with
policymaking; most also have some analytical skill. NHTSA manages the data used in many
traffic safety analyses, the NSC edits the well-regarded Journal of Safety Research, and the IIHS
regularly publishes solid quasi-experimental analyses of traffic safety laws in academic journals.
The opposition, on the other hand, consisted mostly of groups representing students, bars, and
restaurants, such as the United States Students Association, the National Restaurant
Association, and the Wisconsin Tavern League. They possessed less policymaking experience
and little analytical skill. Thus, in contrast to academia, the evidence on the effects of the
MLDA was assessed in an adversarial, political environment under significant time pressure,
between two sides that were mismatched in technical skill and political experience.
Any hope that this competition would result in median-voter-style moderation is quickly
dispelled by a review of the evidence cited. On both sides, this was a highly selective subset of
the whole. Consider, for example, the work of one influential researcher, Alexander Wagenaar.
Wagenaar (1981) found that in the year after Michigan raised its drinking age from 18 to 21, in
6 The NTSB’s advocacy was unusual, as its mission is investigating the causes of particular accidents in detail, not assessing the merits of traffic safety legislation. The MLDA is the only such law it has forcefully advocated. While NHTSA consistently argued that raising the MLDA dramatically improved traffic safety, prior to June, 1984, it also argued that the decision to do so should be left to the states, consistent with the views of the President at that time.
13
1978, crashes involving 18-20 year old drivers whom police reported had been drinking fell by
31%. Because police-reported drinking can be unreliable, a common “three-factor surrogate”
was also analyzed; it fell by 18%. There was little change in control groups. Later Wagenaar
(1983) found that after Maine raised its drinking age from 18 to 20, in 1977, crashes by affected
drivers with police-reported drinking rose slightly, while the three-factor surrogate fell by 19%.
Witnesses supporting a raised MLDA repeatedly cited only the largest number, a 31%
reduction, while their opponents only cited the increase in police-reported drinking crashes
after the MLDA rose in Maine. (The mean finding of each study was used in forming Figure 1.)
A review of all the evidence cited in these hearings, reflected in the bubble plots in
Figure 3, confirms this selectivity. As before, each bubble represents a study, but its color now
indicates the authors’ affiliation, while its area is proportional to the number of entities citing it;
studies ultimately published in refereed journals are circumscribed in black. As before, the
horizontal axis is the year of release or publication; the vertical axis is the percentage change in
fatalities involving affected drivers. (All studies are identified in the note to the figure.)
The top plot in the figure depicts the evidence cited by three high-profile raised-MLDA
advocates—MADD, the IIHS, and the AAA—across the three hearings held prior to July, 1984.
The weighted or unweighted means or medians of this evidence all indicate a fatality reduction
of at least 20%. In contrast, raised-MLDA opponents, having few supportive studies to cite,
instead referred to the experiences of states where MLDA increases were not associated with
fatality changes at all. These assessments were intransigent even after the NMDAA became law
(H4, 1986, pp. 51, 174, 186):
Allan Williams, VP for Research, IIHS: There is no question that raising the alcohol purchasing age results in fewer alcohol-related motor vehicle crash
14
deaths and injuries in this high-risk group. It reduces them by 10-20%, and it does so year after year…If anything, too much research has been done on this topic. Michael Birkley, Board Member, National Licensed Beverage Association: Despite the frequently recurring theme in popular accounts of selected studies, we have found no consistently reliable basis for the conclusion that raising the legal drinking age has, can, or is even likely to save lives among the affected age group in any jurisdiction. In our opinion, none of the so-called drinking age impact studies conducted to date are capable of supporting such a conclusion. These excesses were not temporized by testimony from government agencies. In fact,
these agencies were unreservedly supportive of the raised MLDA’s effects, and cited evidence
that was even more favorable than that cited by advocates. The middle plot in Figure 3
illustrates the evidence cited by five government entities, identified in the note to the table, in
these same three hearings. This time, the weighted or unweighted means or medians always
exceed 25%. These numbers resemble those quoted in President Reagan’s signing statement,
but vastly exceed the best estimate that could have been obtained at the time.
That estimate comes from the GAO, which, in 1986, conducted a systematic literature
review and evaluation, the subject of the fourth hearing listed above. The evidence cited
therein, fourteen mostly quasi-experimental studies of fatal or injury crashes meeting
reasonable methodological standards, is listed in the bottom plot in Figure 3. With three (not
unusual) exceptions, identified in the plot, each study was produced by 1984. The mean and
median effect of a raised MLDA across these fourteen studies is a more modest 13%.
More or less, the 20-25% figure put forward by raised-MLDA advocates was adopted by
Congress. The wide-ranging, relatively philosophical Congressional debate did not focus on the
empirical evidence. Most claims of the NMDAA’s effects devolved to an influential IIHS study of
nine MLDA-raising states (Williams et al., 1983, well-represented in Figure 3), which found an
15
average fatality reduction of 28%. These claims were rarely disputed.
Citations of this figure collapsed shortly afterwards, however, when five new studies,
each analyzing several law-changing states, supplanted the single-state studies that had
predominated. Saffer and Grossman (1987), Hoxie and Skinner (1987), DuMouchel, Williams,
and Zador (1987), Arnold (1985), and Hoskin, Yalung-Mathews, and Carraro (1986) found that
raised MLDAs reduced fatalities by 8%, 11%, 13%, 13%, and 15%, respectively.7 Twenty years
later, as Figure 1 shows, large-scale panel estimates were about half this size.
Evaluating the Evidence’s Limitations. Quantifying the mean effects implied by the evidence is
necessary, but not sufficient, because it takes each study’s estimates (or those deemed
methodologically sound) at face value. Given the potential weaknesses of this evidence,
evaluators should also try to identify the sign and rough magnitude of any bias in the estimates.
This is particularly important for the quasi-experimental studies that dominated the
early MLDA literature, because of two acknowledged limitations in study design. As no controls
are present, other factors that could influence outcomes are not explicitly accounted for. And
the short sample period, generally four or five pre-law years and one or two post-law years,
complicates attempts to account for pre-existing trends.
The results to date of studies increasing (sic) the drinking age have generally been favorable. However, these laws have been in place for only a short time. During that time, other factors which could produce a reduction in accidents have been present…the question of whether increasing the legal age of purchase will reduce accidents remains to be proven when longer experience with these
7 These findings suggest single-state studies utilized states where the estimated impact
of the raised MLDA was relatively large. Certainly the distribution of studies across states in 1984 was not uniform. Of nineteen MLDA-raising states, three—IL, MI, and ME—were studied thrice each, while eight others—MD, NJ, RI, GA, OH, TX, CT, and NE—had never been studied.
16
higher age laws generates sufficient data for a more definitive analysis of impact, from which the effect of transient economic factors can be eliminated. (Alcohol and Highway Safety: A Review of the State of Knowledge, 1984, p. 49.)
Any bias thereby engendered is likely to be favorable. A longstanding theme in social
science, a product of the law and economics literature, emphasizes that estimates of a law’s
effect on social outcomes are influenced by the circumstances of its adoption (see Andenaes,
1975, and Siegelman, 2002). They will be favorably biased for laws inspired by changes in social
attitudes, adopted as part of a package of broader reforms, or passed because of a temporary
flare-up in an undesirable behavior. As the substantial social changes documented above
coincided with the adoption of early laws raising the drinking age, this theme is potentially
significant, as some contemporaneous observers recognized:
Most research published to date is based on faulty premises such as assuming a direct cause and effect relationship between drinking age and crashes without taking into account other variables…[such as] changes in DWI enforcement and increased public education…and covering only short time periods which are inadequate for determining whether changes occurring after a lowering or raising of the drinking age are indicative of long-term effects. (Ronald Sarasin, Director of Government Relations, National Restaurant Association, H2, 1984, pp. 44-46.)
A corollary to this theme emphasizes how public support helps make laws effective:
I have read over most of the papers I have written on this general subject during the past thirty years. In nearly every one of them, I state that the weakest link in attacking this problem has been public support. What we perceive as low-level action against the drunken driver is probably a direct result of lack of public support. We can inform and we can enforce and as a result change behavior through fear for a while. But when we fail to change attitudes, regression is bound to occur (Borkenstein, 1985). [A late-1980s decline in media attention is] one of the reasons I suspect we are seeing a slow-down in the progress, because research continues to show that the most effective laws are those that have a combination of enforcement and repeated publicity. (Brian O’Neill, IIHS, H5, Aug., 1988, p. 36.)
17
Thus, even if a law’s effect in voluntarily-adopting states is known with accuracy, the effect will
be smaller in states that adopt it because of Congressional incentives like those in the NMDAA:
[Lack of enforcement] points up some of the concern that I have…Particularly in the South and the West—there is a resentment of federally imposed standards of that type, and therefore it tends to be discounted at the enforcement level and in the courts. (Jim Burnett, NTSB Chairman, H1, 1983, p. 236.) And sometime, a federal mandate is…more highly resented than any other single factor concerning a law. And in some states the governor’s [highway safety] representative, for example, may not even mention that a requirement is a federal law for fear of raising a red flag. (John Hanna, Deputy Commissioner, Virginia Department of Motor Vehicles, H5, Aug., 1988, p. 48.) Retrospectively, this theme and its corollary imply early-MLDA-raising states will yield
more favorable estimates than late-adopting states do, fostering the trends found in Figures 1
and 2. Prospectively—from the perspective of a policymaker in 1984—they imply that the early
evidence under consideration would overstate the effect of laws “imposed” on states by the
NMDAA. This concept was not just theoretical, but experiential, appearing in the lowered-
MLDA literature, which culminated in 1984,8 and elsewhere:
In the field of alcohol control, there have been many examples of programs and control strategies which ultimately have proved ineffective, even when first advocated and employed they seemed to show great promise. (American Automobile Association, or AAA, H0, 1982, pp. 671-672.) This theme was acknowledged in two ways in the testimony we reviewed: explicitly, as
in some of the quotes above, or implicitly, through a tempered or judicious assessment of the
effects implied by the assembled evidence:
8 One might expect the long term effect of raising the drinking age from 18 to 21 to be equal and opposite that of moving in the reverse direction. Nevertheless, evidence on the effects of lowered MLDAs was almost wholly absent from the hearings reviewed, though the best of this evidence (Cook and Tauchen, 1984) spanned more states and years than any raised MLDA study could then muster. It is unclear why this was the case.

18
It seems…clear that establishing a 21-year minimum nationwide drinking age would have a salutary impact on drunk driving statistics, although the extent of the prospective improvement is far from certain. (Sen. Charles Mathias, R-MD, Senate Debate on the NMDAA, 1984, p. S8226.) I suspect that you have had some testimony about the overwhelming evidence statistically about this, and I suspect that I am hindered by my 35 years as a researcher when I say that the research is not as overwhelming as we would like it to be. (Morris Chafetz, former director of the NIAAA and member, Presidential Commission on Drunk Driving, H2, 1984, p. 71.)
Such judiciousness, however, was rare. Acknowledgement of potential biases or of the
social science theme articulated above was nearly absent from government agencies and
raised-MLDA advocates, while their opponents criticized the evidence so broadly that their
valid criticisms were more easily overlooked. In the end, these criticisms could not overcome
the general legitimacy of the techniques utilized and the absence of a broad academic
consensus on this issue (see below). In Congressional debate the validity of the evidence
supporting the raised MLDA was not questioned.
Thus optimism prevailed both in amalgamating the estimates of the MLDA’s effect and
in determining the confidence that could be placed in those estimates. Though not central to
the theme of this paper, it is possible this optimism affected the passage of the NMDAA, by
influencing President Reagan’s decision to switch from opposition to support. While the only
roll call vote on the NMDAA had a veto-proof majority (81-16 in the Senate), legislative progress
on the NMDAA did not proceed until immediately after President Reagan changed his position
on the issue. Though the decision to adopt the NMDAA was not based primarily on economic
efficiency, the cost-benefit calculus could have been similarly affected.9
9 The influential and very optimistic study Williams et al. (1983) estimated that a
national MLDA of 21 would have saved 1,250 lives annually during the late 1970s. Using the
19
Section III. Intellectual and Institutional Underpinnings.
It would be too facile, and wrong, to ascribe the outcomes in Section II merely to an
adversarial system headed by political actors. Democracies themselves, after all, are
adversarial systems headed by political actors. Such an explanation neglects the powerful
intellectual and institutional underpinnings that undermine the effectiveness of this system. To
maximize the generality of the ensuing discussion, these underpinnings are developed from
first principles, applied to the NMDAA, and then shown to extend beyond this particular event.
Intellectual Underpinnings. Imagine a new policy intended to address a social problem, which is
implemented in a small number of jurisdictions. Soon, interest naturally arises as to this
policy’s effectiveness, though the outcomes data available for analysis is limited. Because the
amount of post-law outcomes data increases over time, analyses of the policy’s effect occur
earlier than is socially optimal, as in Barzel’s (1968) theory of patents, where technological
progress reduces the cost of making a given discovery over time. But, as in Barzel (1968),
studies appear as soon as they yield positive net benefits to the parties conducting them. In a
world of policy advocacy, this could be quite early. Department of Transportation’s current Value of Statistical Life (VSL), $9.1 million, yields a total annual benefit of over $1 billion, equal to $875 for each 18-20 year old alive in 1984. This clearly exceeds the mean value to those individuals of being able to drink legally.
But this calculus changes dramatically after accounting for three facts: 1) secular trends in auto safety had lowered fatalities by 25% by 1984, 2) three-quarters of fatalities involving 18-20 year old drinking drivers involved internalized costs (driver or passenger fatalities), and 3) contemporaneous estimates of VSL were, in real terms, at most half of today’s values (partly because safety is a normal good). Adjusting for these yields a benefit (reduction in external costs) of $80 per 18-20 year old. Basing them on a more realistic estimate of the MLDA’s effect on fatalities would lower it still, perhaps making the costs of the NMDAA exceed the benefits.

20
With little post-policy data available, these studies may only be able to use crude
analytical methods; in general, both limitations inhibit these studies’ accuracy. If the policy
seems sufficiently promising, however, it will diffuse across the country, increasing the breadth
and span of post-policy data available for analysis and facilitating the use of improved methods.
Generally the accuracy of these later studies improves, and this continues going forward,
probably at a diminishing rate. Ideally, the literature eventually reaches a reasonable degree of
convergence in method and result.
This process adequately describes the evolution of the raised-MLDA literature in Figure
1. But it is incomplete, because it omits the essential fact that evaluation of studies in any
scientific field is conducted within a body of assumptions, techniques, etc., that are generally
accepted by the experts working in that field—namely, a paradigm. But there need not be only
one. Where the convergence of academia is slow, and answers are needed quickly,
specialization according to comparative advantage suggests the emergence of two paradigms,
one geared to the urgent needs of policy, the other to “pure knowledge.” This appears to be
the case in several policy-related areas (Dror, 1971; Henig, 2008, Ch. 8).
Certainly it is true in traffic safety, where two paradigms use different research designs
suited for these disparate objectives. Early studies of new state laws typically employ the
quasi-experimental methods described above. Conducted mostly by—for lack of a more
precise term—“program evaluators” with strong links to policymaking, these are often found in
well-regarded safety journals such as the Journal of Safety Research or Accident Analysis and
Prevention. In contrast, late studies, typically large-scale, retrospective panel regressions of
laws’ long-run effects, are conducted by academic social scientists (particularly economists) and
21
published in the Journal of Health Economics, among others. This second group of analysts is
less closely linked to policymaking; their primary audience is other academics, and their focus
accuracy in estimation rather than immediate policy influence. (The transition period in
between contains both types of studies, along with pooled TSCS analyses published in both
types of journals.) While obviously generalizations, these statements also adequately describe
the MLDA literature in Figure 1, and explain a subtle divide between policymaking and
academia that is depicted in that figure and in Figure 3 (which identifies published studies with
a black ring). The most influential studies in the policy process are not frequently cited by
academics, while many influential quasi-experimental studies were never published.
Being geared to different purposes, these paradigms are segmented, to a reasonable
degree, and coexist more than they compete. Drunk driving studies in safety journals rarely
highlight the potential biases in their estimates, while those in economics journals rarely
acknowledge that their panel estimators work best only when the policy in question has long
been settled. This segmentation is perpetuated by cultural and philosophical differences
between the two fields, which “seem to be too many…to permit cooperation” (Dror, 1971,
Chapter 6, and p. 34; see also Bogenschneider and Corbett, 2010), and by a substantial
temporal divide in their studies of any given issue, clearly visible in both the raised-MLDA and
lowered-MLDA literatures in Figure 1.
This is not pre-ordained or universal. Quasi-experimental and traditional regression
methods are vigorously compared, for example, in highly visible literatures on the employment
effects of the minimum wage and job training programs (Card and Krueger, 1997; Heckman,
LaLonde, and Smith, 1999; and many others). It is, rather, a matter of practice. There is no

22
question that quasi-experimental traffic safety studies focus on estimating short run effects, for
which the technique was designed (Robson et al., 2001; Campbell and Ross, 1968), or that
panel techniques’ comparative advantage lies in estimating long-run effects using nationwide
data. Safety journals clearly consider quasi-experimental methods adequate to the task, while
economics journals strongly prefer panel estimates instead.
Most importantly, there has been little comparison within traffic safety of the relative
efficacy of these techniques. The closest paper we could find, a theoretical, multi-technique
critique by Garber (1988), has been virtually ignored. Some literature reviews (Shults et al.,
2001; Wagenaar and Toomey 2002) do identify higher-quality and lower-quality studies, but
this is based primarily on the execution of a given study design. The relative merits of these
designs are not compared in these reviews, in NHTSA’s occasional compendium Alcohol and
Highway Safety, or in GAO reports. Thus, in practice, these two techniques are generally used
in different spheres for different purposes, and accepted within that sphere as valid for the
purpose for which it is used.
Because the scientific competence of a study is determined within a given paradigm,
this segmentation complicates the already-challenging task facing political actors assessing the
evidence, who now must weigh paradigms in addition to assessing the studies themselves. This
is not much facilitated by the presence of experts, who tend to hail from one paradigm or the
other, but not both. This was certainly true for the NMDAA. NHTSA, the NSC, and the GAO all
utilized the quasi-experimental paradigm, and never acknowledged that a judicious assessment
of the evidence might be merited—even when asked (H4, 1986, p. 13-14):
Rep. Nancy Johnson (R-CT): How do you take into account whether or not, for example, there has been a strong movement within a state among high school
23
students to focus on this problem? GAO Official: That is the beauty of the control group. Rep. Johnson: In your control group, you have states that have not changed their policy…but do you have all of those same groups that are springing up throughout the Nation, the teenage groups, the MADD parents and so forth? GAO Official: [Without directly answering the question, simply notes that some control groups are age-based, such as 21-25 year olds, while others are geographical, such as a neighboring state.] In consequence, the assessment criteria used by the political system shifts away from
scientific competence toward something very different: credibility.
Factual conclusions are not easily separable from considerations having to do with the plausibility of [the researcher’s] assumptions and his selection of the evidence or choice of methodology. And because there seems to be no objective way of checking the conclusions of analysis, the credibility of the expert becomes as important as his competence (Majone, 1989, p. 4).
This shift reinforces the bifurcation between these two paradigms, as one is more directly
linked to policymaking than the other. Its practitioners are more familiar with this adversarial
process, more likely to have alternate sources of credibility (Innvaer et al., 2002).
Increasingly, public debates about regulatory decisions [and other modern policy issues] resemble adversary proceedings in a court of law, but with an important difference—the lack of generally accepted rules of evidence. Some participants are able to take advantage of the relative informality of the process, but to scientists even codified adversary procedures seem inappropriate and alien to their tradition. In science the issue is not a witness’s credibility but his specific competence…and this is not reliably established by an adversary debate (Majone, 1989, p. 4). This was also true for the NMDAA. Several supporters of a raised drinking age, including
NHTSA, the NTSB, and the NSC, have institutional credibility before Congress, as does the IIHS,
which interacts with policymakers on a wide range of traffic safety issues. Technical prowess
only reinforces this other source of credibility. Thus, there was no imperative for NHTSA to

24
publish three in-house MLDA studies from the early 1980s, discussed below, or for the NTSB’s
support of a raised MLDA to be based on a formal evidence review. (In fact, its widely-repeated
calculations of lives saved, used to support its recommendation, were erroneous: Males, 1986.)
This contrasted with academic witnesses, who possessed competence but no alternate source
of credibility, and raised MLDA opponents, who generally lacked both. This imbalance further
limited the self-correcting properties of an adversarial system.
In studies of drunk driving legislation this intellectual segmentation persists unabated.
Grant (2011) shows that the literatures on two subsequent laws, both recipients of the kinds of
incentives employed by the NMDAA, follow patterns in study design and result that closely
resemble Figure 1. In both cases strong, quasi-experimental findings for early-adopting states
are, much later, supplanted by notably smaller estimates from panel regressions conducted by
academic social scientists. The most recent of these literatures, concerning “zero tolerance”
laws that lower the per se illegal BAC to .01 or .02 for drivers under twenty-one, played out
quite recently, culminating in several panel analyses published between 2005 and 2010.
Institutional Underpinnings. The political actors who must ultimately assess the evidence often
possess limited technical knowledge. One possible remedy is to locate this knowledge in an
agency overseen by those political actors. Here that agency would be NHTSA, founded in 1966
to address both vehicle and behavioral factors. The former took precedence in the agency’s
early years, consistent with the spirit of the times (Gusfield, 1988), but from the 1980s forward
behavioral factors, particularly drunk driving and restraint use, have received increasing
attention (see H6, 2002).
25
The existence of such agencies ameliorates this knowledge problem, but introduces a
principal-agent problem in its place. In the early 1980s, interest in the effects of higher drinking
ages heightened NHTSA’s roles as arbiter and facilitator of research. In both roles it is intended
to act as an agent for the public and, by extension, Congress, discerning as accurately as
possible how a raised MLDA would affect traffic safety. In light of the previous discussion, this
would require incorporating insights, results, and techniques from both analytical paradigms.
But its behavior may deviate from this ideal, either because the agency has private objectives
that deviate from those of the public, as emphasized by public choice theory, or because it
faces constraints that prevent it from pursuing the public interest in the intended fashion, as
emphasized by theories of public administration (Wilson, 1989).
On the vehicle factors side, the constraints and their consequences are well
documented (Mashaw and Harfst, 1990). Caught between the industry and consumer groups,
hemmed in by procedural and legal limitations, and stymied by informational inadequacies, the
agency has become a poster child for regulatory ineffectiveness among academics and
politicians alike.10 In response, the agency retreated to less effective but more defensible
regulatory ground, which emphasizes recalls rather than standard setting.
The essence of the problem is that, in the words of Mashaw and Harfst (p. 226), NHTSA
“[has] a political job without a political mandate.” This was no different on the behavioral
factors side, where the agency had already been stung twice, in mandating motorcycle helmet
use and attempting to mandate the installation of “detachable passive restraints,” moves 10 Academics include Breyer (1982), Wilson (1989), Mashaw and Harfst (1990), Pecht et al. (2005), and Cavasos (2007). Politicians include the Subcommittee on Commerce, Trade, and Consumer Protection, House Committee on Energy and Commerce (“NHTSA Oversight: The Road Ahead,” March 11, 2010); also see Stout, Ivory, and Ruiz (2014).

26
ultimately undermined by a lack of popular support and perceived rationality (Mashaw and
Harfst, Ch. 10 and 11).
By the early 1980s, then, the beleaguered agency well understood the need to be seen
as effective and in tune with the public, and to avoid initiatives that could be legally or
procedurally undermined or that presented a conflict with stakeholders, such as advocacy
groups or the alcohol industry. Aggressive measures to deter underage drinking (the NMDAA),
drunk driving (such as .08 laws), or both (zero tolerance laws) fit these requirements well. They
were in tune with the spirit of the times, a “hardening of public attitudes about the dangers of
driving after drinking…due in part to scientific demonstrations linking elevated blood alcohol
with automobile crashes” (Zimring, 1988, pp. 379, 381). They were also immune from
procedural or judicial challenge and were strongly supported by drunk driving advocacy groups
such as MADD (Ross, 1992):
Much of the effectiveness of the citizen’s movement is due to its alliance with the traffic safety establishment. State and federal officials have found the movement useful for demonstrating popular support for statutes and other measures proposed by the safety agencies, while the programs endorsed by the movement have been rendered rational and politically sophisticated in the process. The NHTSA has explicitly recognized the value of this constituency and has taken steps to enlarge and strengthen it (p. 177).
In contrast, the alternative approach, which views drunk driving less as the result of individual
choice and more as the “understandable, predictable product of social institutions” (Ross, 1992,
p. 170), was, for NHTSA, less tenable. It conflicted with the conservative emphasis on individual
responsibility that characterized the 1980s and 1990s (Reinarman, 1988), generated political
controversy (Ross, 1992, p. 182-3), and antagonized the alcohol industry (which preferred to
focus on the drinker rather than the alcohol being drunk). Accordingly, deterrence-based
27
countermeasures were well represented in NHTSA’s 1984 publication Alcohol and Highway
Safety, and dominated its plans for reducing drunk driving in the 1990s and beyond.11
But this did not occur in an intellectual vacuum, and could not, given NHTSA’s need for
its initiatives to be perceived as rational. Furthermore, as emphasized by Majone (1989, p.
102), “policy actors have incentives to invest resources in restructuring the channels through
which information is collected, evaluated, and disseminated.” Such restructuring had, indeed,
already occurred on the vehicle-factors side during the 1970s (Mashaw and Harfst, 1990, pp.
177-9). Here, then, the intellectual expression of the aforementioned principal-agent problem
would be for NHTSA‘s research strategy to be shaped to stress this type of deterrence. Such a
strategy would emphasize the quasi-experimental studies that yielded the strongest findings
supporting drunk driving laws and raised drinking ages, and would deemphasize the cautionary
social science theme articulated above.
This was the case in NHTSA’s three studies of raised MLDAs: Maxwell (1981), Klein
(1981), and Arnold (1985, later updated by Womble, 1989), each of which used sound quasi-
experimental designs to estimate short run effects in early-adopting states. Their effect sizes, a
9-15% reduction in fatalities, were typical of the time, and well-supported in two studies
though not the third, which interpreted its findings very favorably.12 None addressed any
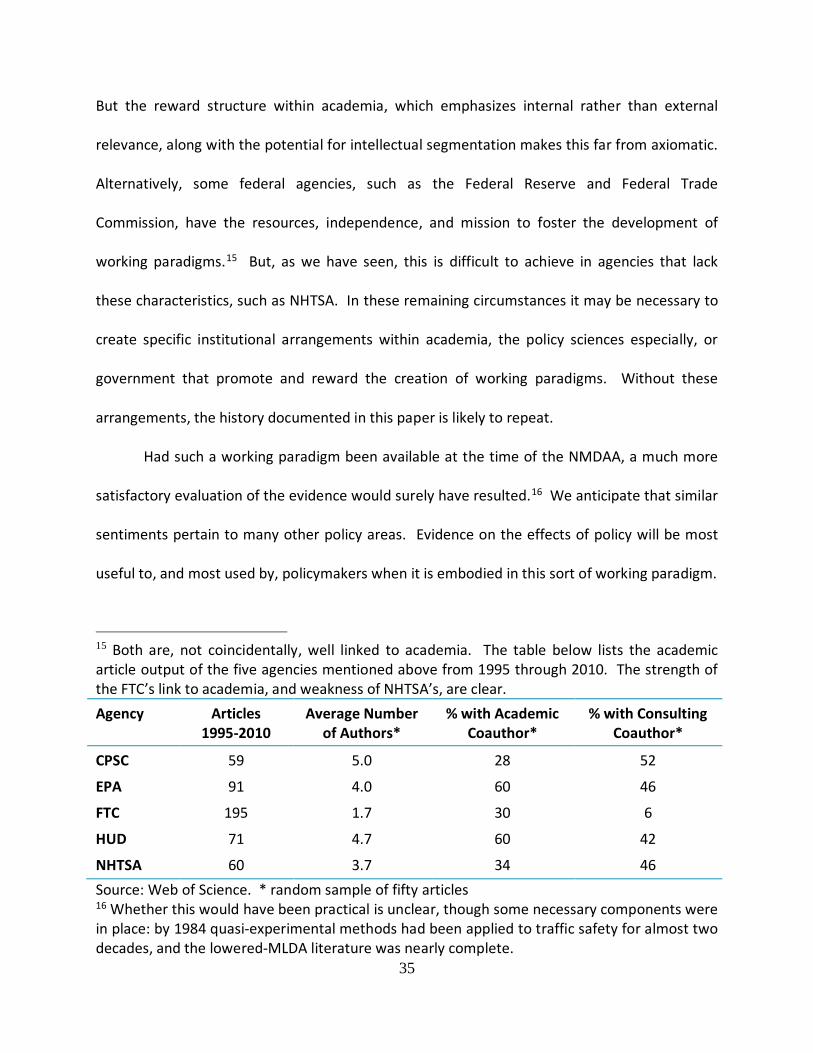
11 See NHTSA (1990). By 2001, Alcohol and Highway Safety could find no drunk driving
countermeasures rendered ineffective by the evidence; most had “strong evidence favoring their effectiveness,” and most were deterrence-based. In a closing criticism, the contractors writing the report note (p. 155) that other types of countermeasures, “focusing on technology, the vehicle, the highway environment, and the more effective control of alcohol consumption…have either been insufficiently developed, insufficiently evaluated, or both.”
12 Klein focuses on fatalities from single-vehicle accidents involving male drivers. He finds that, after Maine’s MLDA was raised from 18 to 20, daytime and nighttime fatalities involving 18-
28
potential biases in the estimates.
After the mid-1980s, however, NHTSA performed very few subsequent studies in this
area, preferring instead to rely almost exclusively on contractors, though a grant would be the
typical mechanism for procuring this type of research (analyzing publicly available data with
straightforward statistical methods to study a topic of general interest).13 Of NHTSA’s 21
analogous alcohol impaired-driving Behavioral Safety Research Reports, 18 were produced
under contract. This change did not reverse this trend, however, and probably was not
intended to. Instead, it institutionalized it.
Contracting allows the sponsoring agency to shape the project’s scope and design (see
Henig, 2008, p. 234). Thus, NHTSA’s contracted research in this area uses quasi-experimental
designs almost exclusively, in marked contrast to analogous studies funded by NIAAA grants
(see Figure 1). Its most recent (2001, 2006) versions of Alcohol and Highway Safety, both
produced by contractors, contain few regression-based evaluations of drunk driving legislation
in their literature reviews, do not mention potential biases with any estimation method, and year-olds fell, in about the same proportion, while daytime and nighttime fatalities involving 19-year-olds were both unchanged. Because daytime accidents are treated as a control group, this suggests the law had no effect. But Klein focused instead on a different finding: a 15% reduction in fatalities involving 18-year-old and 19-year-old male drivers in all nighttime accidents, not just those involving a single vehicle; no control group estimate was obtained. This generous interpretation was adopted by the GAO and thus included in Figure 3. 13 This conclusion comes from interviews with five knowledge-producing federal agencies with health or safety-related orientations: the Consumer Product Safety Commission (CPSC), the Environmental Protection Agency (EPA), the Department of Housing and Urban Development (HUD), the Federal Trade Commission (FTC), and the Agency for Healthcare Research and Quality (AHRQ). In each interview, which typically lasted half an hour, a medium-to-high level research administrator (or their representative) articulated that agency’s “strategy” for producing knowledge and gave a basic rationale for using that strategy. In contrast, we were unable to speak or correspond with the administrator in charge of NHTSA’s behavioral factors research or a member of the agency’s communication office, after multiple attempts.
29
omit regression from discussions of research design (found in the 2001 edition, pp. 99-100).
Furthermore, contracting makes NHTSA more susceptible to political influences, by
limiting the in-house human capital available to evaluate the evidence.
Where management decisions are based substantially on technical judgments…there must be sufficient technical competence within the Government so that outside technical advice does not become technical decisionmaking (sic). (Report to the President on Government Contracting for Research and Development, Bureau of the Budget, May 1962, pp. 9-10.)
In interviews we conducted with an independent traffic safety policy advocate and a former
high-level NHTSA administrator, both bemoaned the “lack of an independent research
capability within the agency,” particularly on the behavioral factors side, and described its
origins and consequences as mostly or wholly political, noting that its absence benefits
stakeholders that gain from deterrence-oriented policies. The production of knowledge via
contracting perfectly suits NHTSA’s objectives in this area of policy.
The evidence suggests this state of affairs has achieved stasis. Political oversight is
unlikely to change the status quo. Our discussions with staff on two oversight committees,
representing both parties and both houses of Congress, confirm their indifference with the
technical issues raised here; so does the content of recent Congressional hearings.14 When
Congress needs a more objective evaluation of the evidence, it must turn to the GAO. It had
done so prior to the events described here, and, as we will see, did for subsequent drunk
driving legislation as well.
14 The evaluation of behavioral safety initiatives was mentioned only once in one recent hearing (“Assessing the Effectiveness of the NHTSA’s Highway Traffic Safety Programs,” Subcommittee on Highways and Transit, House Committee on Transportation and Infrastructure, July 16, 2008, p. 35) and not at all in another recent, high-profile hearing (“NHTSA Oversight: The Road Ahead,” Subcommittee on Commerce, Trade, and Consumer Protection, House Committee on Energy and Commerce, March 11, 2010).
30
Section IV. Generalizations and Prescriptions.
In the end, the three fundamental actors in this narrative—NHTSA, Congress, and
academia—formed a perverse set of complements, each reinforcing each other’s weaknesses.
Adversarial Congressional hearings support intellectual segmentation, which, in turn, weakens
the evaluative process, de-emphasizing competence in favor of credibility. Such segmentation
both supports and is supported by NHTSA’s focus on one intellectual paradigm to the exclusion
of the other, a practice that weakens its ability to help Congress sort out competing claims
about the effectiveness of proposed policies. This interaction should give pause to those
inclined to focus solely on the limitations of the political system.
This point comes into sharper relief if we consider how NHTSA and academia have
evaluated the evidence on the MLDA in the decades following. NHTSA’s most recent direct
statement on the effect of the raised MLDA, found in its March 2005 Traffic Safety Facts
Research Note, relies on a single source: Arnold (1985), an unpublished, in-house study of the
experiences of thirteen states that were early adopters of higher MLDAs. The estimated effect
on fatalities was 13%. Academics, on the other hand, have produced only one comprehensive
review of the literature (Wagenaar and Toomey, 2002, extended in 2005). This drew mild
methodological distinctions, eliminating studies with very poor execution or cross-sectional
designs, and showed only that the remaining estimates were roughly split between
insignificance and significance in the expected direction. This supported the effectiveness of
the raised MLDA but left the size of the effect ambiguous. Overall, the political system, via the
GAO report, assessed the evidence more satisfactorily than NHTSA and academia have done
31
since; via the hearings discussed above, it also gave a more complete expression—however
limited—of its weaknesses.
This point is reinforced by considering the next initiative to receive similar Congressional
incentives, .08 Laws. The scenario that unfolded closely resembled that presaging the NMDAA.
NHTSA first advocated their adoption in 1992, when there was virtually no evidence on their
effectiveness. Though only 3% of traffic fatalities involve drivers with BACs of .08 or .09, who
would be affected by such a law, double-digit fatality reductions are found in most of the
evidence cited in NHTSA’s “Presidential Initiative for Making .08 BAC the National Legal Limit”
and “Setting Limits, Saving Lives.” These and Alcohol and Highway Safety (2001) omitted the
more conservative results of economists’ two regression analyses (Chaloupka, Saffer, and
Grossman, 1993; Dee, 2000). After identifying numerous methodological problems with several
studies of the issue, including some sponsored or produced by NHTSA, a 1999 GAO report
determined that “the evidence does not conclusively establish that .08 BAC laws, by
themselves, result in reductions in the number and severity of alcohol-related crashes” and that
“NHTSA’s position—that this evidence [on the effectiveness of .08 laws] was conclusive—was
overstated.” Academics have not yet published a comprehensive review of this literature, but
Grant (2011) demonstrates that it exhibits the same patterns in study design and result as those
in Figure 1, with panel studies supplanting other research designs and estimates falling as the
literature progresses (this time, nearly to zero—see Young and Beilinska-Kwapisz, 2006;
Freeman, 2007; Polnicki et al., 2007). The primary difference between this and the NMDAA:
this time, Congress requested the GAO report before it acted. The political system was the only
one to learn from its mistakes.

32
Two themes run through these collective experiences. The first is the enduring
relevance of the intellectual and institutional factors that we have emphasized. The second is
the relative impotence of academia. In the short run, it produced fewer studies of the raised
MLDA and .08 laws than federal and state governments did. (See Figure 3 and the two
aforementioned GAO reports.) In the medium term, it has not summarized the evidence on
these laws’ effects any more precisely than the GAO did. (The one review capable of doing so,
Shults et al., 2001, was not produced by academics, but by the Centers for Disease Control and
Prevention.) In the long run, as mentioned above, it has not bridged the intellectual
segmentation separating paradigms, across these two literatures and a subsequent literature
on zero tolerance laws. This relative ineffectiveness occurs despite having greater reservoirs of
technical knowledge than government does, and a near-absence of political or time constraints.
This belies the lament that policy analysis is destined to be underappreciated by a recalcitrant
political system. It suggests that, in articulating reforms, academia should turn its eye inward.
Reform. In order to delineate these reforms, we must first ask just what function academia
should serve in evaluating the effects of proposed policies. Given the presence of other policy
actors, the answer should accord with the principle of comparative advantage. In this area of
policy, at least, it is clear that academics are not needed to conduct straightforward
implementations of established methods, or to summarize the evidence after applying a mild
methodological screen for good practices. Instead, academia’s comparative advantage lies in
developing analytic techniques and determining their adequacy for the task at hand: the
creation and clash of paradigms.

33
But the intellectual segmentation documented above makes clear that this statement
alone is an inadequate response to the question we have posed. The existence of broad,
general, traditional research paradigms offers limited comfort to policymakers who must
evaluate a limited amount of conflicting, imperfect evidence within a compressed time frame.
Except for randomized, controlled experiments, which are clearly not feasible here, virtually
every evaluation method has pitfalls and potential biases. And the implementation of any given
method can affect findings as much as the type of method that is employed. Viewed in this
light, intellectual segmentation was a reflection of the broader problem that neither paradigm
was, for the purposes of traffic safety policy, sufficiently developed.
To clarify this remark it is useful to distinguish between a paradigm in the usual sense of
the word, a traditional research paradigm, and what we will call a “working paradigm” that has
been adapted to the needs of a more narrowly defined policy area such as traffic safety or
drunk driving. The latter requires, in addition to the theoretical structure and empirical
techniques of the traditional research paradigm, practical knowledge as to how these
techniques are best applied to the issue at hand and how they can go awry (large errors, biases,
unanticipated consequences, etc.). To the degree that experience permits, a working paradigm
systematizes the implementation of methods from the broader paradigm to a particular class of
practical policy issues and characterizes the limits of the evidence thereby produced.
In the broader, traditional sense, the program evaluation and social science regression
paradigms are well established and have vigorously competed, as noted above. But in the
narrower sense, working versions of each paradigm, for the purposes of drunk driving policy,
are relatively undeveloped even now—thirty years after the NMDAA and almost fifty since
34
quasi-experimental methods were first applied to traffic safety (Campbell and Ross, 1968).
These would identify best practices for estimating laws’ short run effects in early adopting
states and approximate how much these estimates will overstate the long run effect of policy.
Accomplishing this would require, among other things, comparing various estimators’ short run
and long run effect sizes; examining the mean and variance of quasi-experimental estimates
obtained with various control groups (based on geography, age, or alcohol involvement); and
determining the suitability of various regression specifications for forming early estimates of
laws’ effects. Except for the studies underlying Figures 1 and 2, these issues have to date
received little attention in the academic literature on drunk driving, and none in literature
reviews or Alcohol and Highway Safety. Certainly the body of evidence and degree of
consensus do not yet constitute a working paradigm.
Addressing these issues would substantially bridge the segmentation separating the
social science and program evaluation paradigms, forcing the quasi-experimental paradigm to
pay more attention to bias and the regression paradigm to pay more attention to immediacy.
Potentially, a single, unified working paradigm would emerge that integrated the benefits of
each approach and allowed policymakers much firmer ground on which to evaluate the
evidence. (Ironically, this helps explain why working paradigms like this can be slow to develop:
they increase competition between the broader paradigms, which, like increased competition
anywhere, can make all “sellers” worse off.)
How can working paradigms be created? Various arrangements are possible, though
the involvement of academia is likely to be essential. Academics have studied some issues,
such as the minimum wage, sufficiently that a working paradigm can be said to have resulted.
35
But the reward structure within academia, which emphasizes internal rather than external
relevance, along with the potential for intellectual segmentation makes this far from axiomatic.
Alternatively, some federal agencies, such as the Federal Reserve and Federal Trade
Commission, have the resources, independence, and mission to foster the development of
working paradigms.15 But, as we have seen, this is difficult to achieve in agencies that lack
these characteristics, such as NHTSA. In these remaining circumstances it may be necessary to
create specific institutional arrangements within academia, the policy sciences especially, or
government that promote and reward the creation of working paradigms. Without these
arrangements, the history documented in this paper is likely to repeat.
Had such a working paradigm been available at the time of the NMDAA, a much more
satisfactory evaluation of the evidence would surely have resulted.16 We anticipate that similar
sentiments pertain to many other policy areas. Evidence on the effects of policy will be most
useful to, and most used by, policymakers when it is embodied in this sort of working paradigm.
15 Both are, not coincidentally, well linked to academia. The table below lists the academic article output of the five agencies mentioned above from 1995 through 2010. The strength of the FTC’s link to academia, and weakness of NHTSA’s, are clear. Agency Articles
1995-2010 Average Number
of Authors* % with Academic
Coauthor* % with Consulting
Coauthor*
CPSC 59 5.0 28 52
EPA 91 4.0 60 46
FTC 195 1.7 30 6
HUD 71 4.7 60 42
NHTSA 60 3.7 34 46 Source: Web of Science. * random sample of fifty articles 16 Whether this would have been practical is unclear, though some necessary components were in place: by 1984 quasi-experimental methods had been applied to traffic safety for almost two decades, and the lowered-MLDA literature was nearly complete.

36
Section V. Conclusion.
Early evidence on a new policy often suffers from deficiencies in quantity and quality
that make it difficult to evaluate. For non-experts to do so accurately in an adversarial,
politicized environment is a daunting task. It would be ingenuous to expect the political system
to do so ideally, and this paper confirms that, for the NMDAA at least, it did not. Raised MLDA
opponents were, in this theater, outmatched by advocates, fostering an overly optimistic
assessment of the evidence that was available at the time.
On the other hand, it is equally ingenuous to assume that other mechanisms will be
superior. For the NMDAA, they were not. Academia, segmented into distinct paradigms, had
no effective means of meshing and reconciling their conclusions, particularly on the time scales
required by policymakers. Neither did the bureaucracy, NHTSA. Overly wedded to deterrence,
it lacked the necessary quantity and diversity of in-house human capital. Given these facts, it is
surprising that the political system evaluated the evidence as well as it did.
While the lessons learned here do not apply without exception to other areas of policy,
it is clear that they are also not unique to this case. Certainly the adversarial nature of
policymaking generalizes broadly. Similarly, there is evidence of segmentation in many fields of
economics (Onder and Tervio, 2015). Meanwhile, the independence of federal agencies varies
broadly, with some, such as the CPSC, resembling NHTSA quite closely, while others, such as the
FAA or FDA (Carpenter, 2010) far more independent. It depends on the circumstances.
Policy analysis does not emerge from our narrative as an art destined to be
underappreciated by a political system that cannot assimilate it into policy formation. Rather,

37
policy analysts should accommodate the imperatives of policymakers. Assessing conflicting
evidence in the light of two broad, conflicting paradigms, as the political system was asked to
do for the NMDAA, is a lot to ask of anyone. Drawing distinctions between study designs,
assessing likely biases, and developing methods to mitigate these biases—on the time scales
required by policymakers—need not be the responsibility of government. The development of
such working paradigms can, and probably often should, be the responsibility of academics who
desire policy impact. Unfortunately, it has here been shirked in the name of intellectual
segmentation. We have met the enemy, and he is us.

Table 1. Social Activity Aimed at Reducing Drunk Driving (constructed from Howland, 1988), and Drunk Driving Attitudes (from Greenfield and Room, 1997). COUNTS PERCENTAGE IN AGREEMENT
Year Number of Drunk Driving
Groups Founded
Volume of Newspaper Coverage of
Drunk Driving
Volume of Periodical
Coverage of Drunk Driving
“Legislative Changes to
Reduce Drunk Driving”
It is OK to drink before
driving.
It is OK to drink a lot before driving. (Asked of heavy
drinkers.)
1978-1981 36 37 22 32% 8%
1981 17 13 44
1982 109 81 35 47
1983 117 169 50 129
1984 103 162 42 108 18% 5%
1985 89 76 36 223
1986 45 9 178
Note: Newspapers include the New York Times, the Washington Post, the Los Angeles Times, and The Wall Street Journal. Periodical volume comes from the Magazine Index. The attitudinal questions were phrased: “A person should feel free to drink one or two drinks, or more, when going to drive a car,” and “A person should feel free to drink enough to feel the effects, or more, when going to drive a car.”

Figure 1. Bubble Plot of Academic Studies of the MLDA (from Grant, 2011).
Note: Black-ringed bubbles are supported by external funding. The year is the year of publication. The estimate of magnitude is the percentage change in the fatality or crash-involvement measure. The volume of the bubble is proportional to the number of citations it received in Google Scholar as of June 2009.
-40
-30
-20
-10
0
10
20
30
1970 1975 1980 1985 1990 1995 2000 2005 2010
Estim
ate
of M
agni
tude
Year
Evolution of Findings: Minimum Legal Drinking Age
Pooled Panel Quasi-Experimental Cross Section
LOWER MLDA HIGHER MLDA

Figure 2. MLDA Effects vs. Time of Adoption (based on the findings of Miron and Tetelbaum, 2009). The top graph contains individual state estimates; the bottom graph cumulative estimates.
-0.5
-0.4
-0.3
-0.2
-0.1
0
0.1
0.2
0.3
0.4
0.5Ja
n-78
Jul-7
8Ja
n-79
Jul-7
9Ja
n-80
Jul-8
0Ja
n-81
Jul-8
1Ja
n-82
Jul-8
2Ja
n-83
Jul-8
3Ja
n-84
Jul-8
4Ja
n-85
Jul-8
5Ja
n-86
Jul-8
6Ja
n-87
Jul-8
7Ja
n-88
Jul-8
8
Estim
ates
of M
LDA
Effe
ct o
n Lo
g Fa
talit
ies
of 1
8-20
Yea
r Old
s (+/
-2 S
tand
ard
Devi
atio
ns,
with
qua
drat
ic tr
endl
ine)
Date of Adoption of MLDA of 21
-0.2
-0.15
-0.1
-0.05
0
0.05
Jan-
78
Aug-
78
Mar
-79
Oct
-79
May
-80
Dec-
80
Jul-8
1
Feb-
82
Sep-
82
Apr-
83
Nov
-83
Jun-
84
Jan-
85
Aug-
85
Mar
-86
Oct
-86
May
-87
Dec-
87
Jul-8
8Estim
ates
of M
LDA
Effe
ct o
n Lo
g Fa
talit
ies
of 1
8-20
Yea
r Old
s (+/
-2 st
anda
rd
devi
atio
ns w
ith q
uadr
atic
tren
d lin
e)
Date of Adoption of MLDA of 21

Figure 3. Evidence Cited across Four Hearings on the Effect of a Raised MLDA on Crashes. Top: Evidence Cited by Three Raised-MLDA Advocates, 1983-1984.
Middle: Evidence Cited by Five Government Organizations, 1983-1984.
-45
-30
-15
0
1978 1980 1982 1984 1986 1988Estim
ated
Fat
ality
/ C
rash
Re
duct
ion,
in P
erce
nt
YearAdvocates Academics Raw Statistics Government
-45
-30
-15
0
1978 1980 1982 1984 1986 1988Estim
ated
Fat
ality
/ C
rash
Re
duct
ion,
in P
erce
nt
YearAdvocates Academics Raw Statistics Government

Bottom: Evidence Cited by the GAO, 1986-7.
Note: The advocates are MADD, the American Automobile Association, and the IIHS. The government organizations are NHTSA, the NTSB, the NSC, the National Association of Governor’s Highway Safety Representatives, and the Presidential Commission on Drunk Driving. The area of each bubble is proportional to the number of organizations citing that study in the hearings indicated. Bubble colors indicate the affiliation of the authors of each study; “raw statistics” indicates the organization simply cited the change in crashes or fatalities after the adoption of a law, without referring to any formal study. Bubbles ringed in black indicate studies published in a refereed journal. For such studies, the horizontal axis indicates the publication year; for the others it is the year the study was completed. Studies cited in all three graphs: Williams et al. (1983), Klein (1981), Maxwell (1981), and Wagenaar (1981). Additional studies cited in the top graph: Hingson et al. (1986), Cook and Tauchen (1984), Lillis et al. (1987), and Dunham and Detmer (1983). Additional studies cited in the middle graph: Schroeder and Meyer (1983) and Lynn (1981). Additional studies cited in the bottom graph: Schroeder and Meyer (1983), Saffer and Grossman (1987), Lillis et al. (1987), Florida Department of Community Affairs (1983), Emery (1983), Hingson et al. (1983), Hoskin et al. (1986), Wagenaar (1983), Arnold (1985), and DuMouchel et al. (1986).
-45
-30
-15
0
1978 1980 1982 1984 1986 1988
Estim
ated
Fat
ality
/ C
rash
Re
duct
ion,
in P
erce
nt
YearAdvocates Academics Raw Statistics Government
Unavailablein 1984
REFERENCES Andenaes, J. General prevention revisited: research and policy implications. Journal of Criminal Law
and Criminology 66,3:338-365, 1975. Arnold, R. Effect of raising the legal drinking age on driver involvement in fatal crashes: the experience
of thirteen states. Report DOT HS 806-902, National Highway Traffic Safety Administration, 1985.
Asch, P. and Levy, D.T. Young driver fatalities: the roles of drinking age and drinking experience.
Southern Economic Journal 57:512-520, 1990. Barzel, Y. Optimal timing of innovation. Review of Economics and Statistics 50:348-355, 1968. Berry, F., and Berry, W. Innovation and diffusion models in policy research. In Sabatier, P., ed.,
Theories of the Policy Process. Cambridge, Mass.: Westview Press, 2007. Boardman, A., Vining, A., and Waters, W.G. Costs and benefits through bureaucratic lenses: example of
a highway project. Journal of Policy Analysis and Management 12:532-555, 1993. Borkenstein, R.F. Historical perspective: North American traditional and experimental response. Journal
of Studies on Alcohol 10 (Supplement):3-12, 1985. Breyer, S. Regulation and its Reform. Cambridge, Mass.: Harvard University Press, 1982. Campbell, D., and Ross, H.L. The Connecticut crackdown on speeding: time series data in quasi-
experimental analysis. Law and Society Review 3:33-53, 1968. Card, D., and Krueger, A. Myth and Measurement: The New Economics of the Minimum Wage.
Princeton University Press, 1997. Carpenter, D. Reputation and Power: Organizational Image and Pharmaceutical Regulation at the FDA.
Princeton University Press, 2010. Cavasos, D. Capturing the regulatory rule-making process: how historical antecedents of U.S. regulatory
agencies impact industry conditions. International Journal of Organizational Analysis 15:231-250, 2007.
Chaloupka, F.J., Saffer, H. and Grossman, M. Alcohol-control policies and motor-vehicle fatalities.
Journal of Legal Studies 22:161-186, 1993. Cook, P.J. and Tauchen, G. The effect of minimum drinking age legislation on youthful auto fatalities,
1970-1977. Journal of Legal Studies 13:169-190, 1984. Dee, T.S. Does setting limits save lives? The case of 0.08 BAC laws. Working Paper, 2000 (later
published in the Journal of Policy Analysis and Management 20:111-128, 2001).
----. State alcohol policies, teen drinking and traffic fatalities. Journal of Public Economics 72:289-315, 1999.
Dror, Y. Design for Policy Sciences. New York: Elsevier, 1971. DuMouchel, W., Williams, A.F., and Zador, P. Raising the alcohol purchase age: its effect on fatal motor
vehicle crashes in twenty-six states. Journal of Legal Studies 16:249-266, 1987. Dunham, N.C., and Detmer, D.E. Traffic accidents and the legal drinking age in Wisconsin. Wisconsin
Medical Journal 82: 11-13, 1983. Eisenberg, D. Evaluating the effectiveness of policies related to drunk driving. Journal of Policy Analysis
and Management 22:249-274, 2003. Emery, J. Young drinking drivers involved in fatal crashes: statewide problem identification for F.Y. 184
highway safety plan. Des Moines: Iowa Governor’s Highway Safety Office, 1983. Florida Department of Community Affairs. Relation of the legal drinking age to young drivers’
involvement in traffic accidents. Tallahassee: Florida Bureau of Highway Safety, 1983. Garber, S. Minimum legal drinking ages and highway safety: a methodological critique, in John Graham,
Ed., Preventing Automobile Injury: New Findings from Evaluation Research. Dover, Mass.: Auburn House, 1988.
Government Accountability Office. Highway safety: effectiveness of state .08 blood alcohol laws.
Washington, D.C., 1999. ----. Drinking age laws: an evaluation synthesis of their impact on highway safety. Washington, D.C.,
1987. Grant, D. Policy analysis and policy adoption: a study of three national drunk driving initiatives.
Manuscript, Sam Houston State University, 2011. Greenfield, T., and Room, R. Situational norms for drinking and drunkenness: trends in the U.S. adult
population, 1979-1990. Addiction 92,1:33-47 (1997). Gusfield, J. The control of drinking-driving in the United States: a period of transition? In M.D.
Laurence, J.R. Snortum, and F.E. Zimring, eds., Social Control of the Drinking Driver. Chicago: University of Chicago Press, 1988.
Hahn, R. The impact of economics on environmental policy. Journal of Environmental Economics and
Management 39:375-399 (2000). Haight, F. Road safety: a perspective and a new strategy. Journal of Safety Research 16,3:91-98, 1985. Hammond, R.L. Legal drinking at 18 or 21—does it make any difference? Journal of Alcohol and Drug
Education 18:9-14, 1973.
Haskins, R., and G. Margolis. Show Me the Evidence. Washington, D.C.: Brookings Institution, 2014. Heckman, J., LaLonde, R., and Smith, J. The economics and econometrics of active labor market
Programs. In O. Ashenfelter and D. Card, eds., Handbook of Labor Economics, Volume III. Amsterdam: Elsevier, 1999.
Henig, J. Spin Cycle—How research Is Used in Policy Debates: The Case of Charter Schools. New
York: Russell Sage Foundation, 2008. Heikkila, T., and Gerlak, A. Building a conceptual approach to collective learning: lessons for public
policy scholars. Policy Studies Journal 41:484-512, 2013. Hingson, R.W., Scotch, N., Mangione, T., Meyers, A., Glantz, L., Heeren, T., Lin, N., Mucatel, M. and
Pierce, G. Impact of legislation raising the legal drinking age in Massachusetts from 18 to 20. American Journal of Public Health 73: 163-170, 1983.
Hoskin, A.F., Yalung-Mathews, D. and Carraro, B.A. Effect of raising the legal minimum drinking age
on fatal crashes in 10 states. Journal of Safety Research 17:117-121, 1986. Howland, J. Social norms and drunk driving countermeasures, in John Graham, Ed., Preventing
Automobile Injury: New Findings from Evaluation Research. Dover, Mass.: Auburn House, 1988. Hoxie, P. and Skinner, D. A statistical analysis of the effects of a uniform minimum drinking age.
Manuscript, Transportation Systems Center, 1987. Innvaer, S., Vist, G., Trommald, M., and Oxman, A. Health policy-makers’ perceptions of their use of
evidence: a systematic review. Journal of Health Services Research and Policy 7:239-244, 2002. Klein, T. The effect of raising the minimum legal drinking age on traffic accidents in the state of Maine.
Report DOT HS 806-149, National Highway Traffic Safety Administration, 1981. Lillis, R.P., Williams, T.P. and Williford, W.R. Impact of the 19-year-old drinking Age in New York. In:
Holder, H.D. (Ed.) Advances in Substance Abuse: Behavioral and Biological Research, Supplement 1: Control Issues in Alcohol Abuse Prevention: Strategies for States and Communities. Greenwich, CT: JAI Press, 1987, pp. 133-146.
Lynn, C. The effects of lowering the legal drinking age in Virginia. Charlottesville, VA: Virginia
Highway and Transportation Research Council, 1981. Majone, G. Evidence, Argument, and Persuasion in the Policy Process. New Haven, CT: Yale
University Press, 1989. Males, M. The minimum purchase age for alcohol and young-driver fatal crashes: A long-term view.
Journal of Legal Studies 15:181-591, 1994. Mashaw, J., and Harfst, D. The Struggle for Auto Safety. Cambridge, MA: Harvard University Press,
1990.

Maxwell, D. Impact analysis of the raised legal drinking age in Illinois. Report DOT HS 806-115, National Highway Traffic Safety Administration, 1981.
Meseguer, C. Policy learning, policy diffusion, and the making of a new order. The Annals of the
American Academy of Political and Social Science 598:67-82, 2005. Miron, J., and Tetelbaum, E. Does the minimum legal drinking age save lives? Economic Inquiry 47:
317-336, 2009. Munger, M. Public policy formation: does better information produce better policy? International
Journal of Public Policy 1:343-354, 2006. National Highway Traffic Safety Administration. Highway safety priority plan: moving America into the
21st century. 1990. Onder, A., and Tervio, M. Is economics a house divided? Analysis of citation networks. Economic
Inquiry 53:1491-1505, 2015. Pecht, M., Ramakrishnan, A., Fazio, J., and Nash, C. The role of the U.S. National Highway Traffic
Safety Administration in automotive electronics reliability and safety assessment. IEEE Transactions on Components and Packaging Technologies, 28,3:571-579, 2005.
Reinarman, C. The social construction of an alcohol problem: the case of Mothers Against Drunk Drivers
and social control in the 1980s. Theory and Society, 17,1:91-120, 1988. Rhomberg, L. Hypothesis-based weight of evidence: an approach to assessing causation and its
application to regulatory toxicology. Risk Analysis 35:1114-1124 (2015). Robinson, L., and Hammitt, J. Introduction to the special series on research synthesis: a cross-
disciplinary approach. Risk Analysis 35:963-970 (2015). Ross, H.L. Confronting Drunk Driving: Social Policy for Saving Lives. New Haven: Yale University
Press, 1992. Sabatier, P., ed. Theories of the Policy Process. Boulder, Colorado: Westview Press, 2007. Saffer, H., and Grossman, M. Beer taxes, the legal drinking age, and youth motor vehicle fatalities.
Journal of Legal Studies 16:351-374, 1987. Schlager, E., and Weible, C. New theories of the policy process. Policy Studies Journal 41:389-396,
2013. Schroeder, J., and Meyer, E.D. Influence of passing the legal drinking age in Illinois. Springfield, IL:
Illinois Department of Transportation, 1983. Shults, R.A., Elder, R.W., Sleet, D.A., Nichols, J.L., Alao, M.O., Carande-Kulis, V.G., Zaza, S., Sosin,
D.M., Thompson, R.S. Reviews of evidence regarding interventions to reduce alcohol-impaired driving. American Journal of Preventive Medicine. 21: 66-84, 2001.

Siegelman, P. James Heckman as a ‘law and society’ scholar: an appreciation. Law and Social Inquiry 27,1:11-21, 2002.
Stone, Deborah. Policy Paradox: The Art of Political Decision Making. New York: Norton, 2001. Stout, D., D. Ivory, and R. Ruiz. Regulator slow to respond to deadly vehicle defects. New York Times,
Sept. 14, 2014. Tanenbaum, S. Pay for performance in Medicare: evidentiary irony and the politics of value. Journal of
Health Politics, Policy, and Law 34:717-746, 2009. Wagenaar, A. Effects of an increase in the legal minimum drinking age. Journal of Public Health 2:206-
225, 1981. ----. Raising the legal drinking age In Maine: impact on traffic accidents among young drivers.
International Journal of the Addictions 18:65-377, 1983. ----, and Toomey, T.L. Effects of minimum drinking age laws: review and analysis of the literature from
1960 to 2000. Journal of Studies on Alcohol. March Supplement: 206-25, 2002. Weinstein, B.G. Costs and benefits of establishing a national purchasing age of 21. In: Holder, H.D. (Ed.)
Advances in Substance Abuse: Behavioral and Biological Research, Supplement 1: Control Issues in Alcohol Abuse and Prevention: Strategies for States and Communities. Greenwich, CT: JAI Press, 1987, pp. 105-118.
Williams, A.F., Zador, P.L., Harris, S.S., Karpf, R.S. The effect of raising the legal minimum drinking
age on involvement in fatal crashes. Journal of Legal Studies 4:169-179, 1983. Wilson, J. Q. Bureaucracy: What Government Agencies Do and Why They Do It. New York: Basic
Books, 1989. Womble, K.B. The impact of minimum drinking age laws on fatal crash involvements: An update of the
NHTSA analysis. Journal of Traffic Safety Education 37:4-5, 1989. Young, D.J. and Likens, T.W. Alcohol regulation and auto fatalities. International Review of Law and
Economics 20: 107-126, 2000. Young, D.J. and Beilinska-Kwapisz, A. Alcohol prices, consumption, and traffic fatalities. Southern
Economic Journal 72:690-703, 2006. Zimring, F. Law, society, and the drinking driver: Some concluding reflections. In M.D. Laurence, J.R.
Snortum, and F.E. Zimring, eds., Social Control of the Drinking Driver. Chicago: University of Chicago Press, 1988.
Zylman, R. Fatal crashes among Michigan youth following reduction of legal drinking age. Quarterly
Journal of Studies on Alcohol 35:283-286, 1974.
Appendix: A Chronology of the Minimum Drinking-Age Issue (excerpted almost verbatim from Appendix IV of GAO, 1987, with minor edits and additions;
hearings or Congressional debate referenced in the text of this paper are italicized)
Jan. 5, 1933. Ratification of the 21st amendment repealed prohibition and granted the states substantial power to regulate the purchase and possession of liquor within a state. Sept. 9, 1966. Enactment of the Highway Safety Act of 1966 (Public Law 89-564) provided the first major impetus for federal involvement in drinking and driving by requiring the Department of Transportation (DOT) to establish uniform safety standards for state highway safety programs and to provide funds to carry out such programs. June 1967. The DOT issued its “Alcohol in Relation to Highway Safety Standard,” to broaden the scope and number of activities directed at reducing alcohol-related accidents. 1970. NHTSA established a special office of alcohol countermeasures and the alcohol safety action program in 1970-71. July 1971. Ratification of the 26th amendment, extending the right to vote to 18-year-olds, helped prompt 29 states to lower their minimum drinking ages in the early 1970’s. 1973. NHTSA agreed by contract with the University of Michigan Highway Safety Research Institute to scientifically analyze the effects of lowering the legal drinking age from 21 to 18 on youths involved in crashes. The report showed a 10%-26% increase in crash involvement between 1968 and 1971. Jan. 2, 1974. Enactment of the Emergency Highway Energy Conservation Act (Public Law 93-239) temporarily established a nationwide speed limit of 55 miles per hour. The law relied on crossover sanctions to encourage the states to conform to the act. One year later the Federal-Aid Highway Amendments Act of 1974 made this speed limit permanent. 1976. From this year on, no state lowered its drinking age, partly because of empirical evidence that suggested a link between lowering the drinking age and increased traffic fatalities. Between 1976 and 1980, thirteen states raised their drinking ages by at least one year. April 14, 1982. The president appointed a 32-member commission to study the national problem of drunk driving. April 27, 1982. H.R. 6170 was introduced by members of the Congress from New Jersey and Maryland and others to encourage the states to strengthen programs to control drunk driving. April 29, 1982. [H0] The House Subcommittee on Surface Transportation held hearings on H.R. 6170; the legislation was generally supported by both the beverage and insurance industries. May 12, 1982. H.R. 6170 was incorporated into H.R. 6211, which became the Surface Transportation Assistance Act of 1982. July 22, 1982. The National Transportation Safety Board recommended a national minimum drinking age of 21. Sept. 29,1982. The House of Representatives unanimously approved H.R. 6170.
Oct. 1, 1982. The Senate unanimously approved its counterpart bill to H.R. 6170, and the bill was sent to the president. Oct. 25, 1982. Enactment of H.R. 6170 as Public Law 97-364 provided for a two-tier incentive grant program to improve traffic safety. The Congress mandated that the secretary of the Department of Transportation would consider a state minimum drinking age of 21 as one criterion to be met for supplemental grants. Nov. 30, 1982. House and Senate resolutions were introduced on the legal minimum age for drinking and the purchase of alcohol. Dec. 13, 1982. The Presidential Commission on Drunk Driving recommended a uniform minimum drinking age of 21 in an interim report intended to allow state legislatures time to consider this recommendation early in their 1983 sessions. Jan. 6, 1983. The Surface Transportation Assistance Act of 1982 contained a small section strongly encouraging the states to raise the minimum drinking age to 21. On the day the law was enacted, House Concurrent Resolution 23 was introduced, expressing the sense of the Congress that all states should establish a minimum drinking age of 21. Jan. 27, 1983. A Gallup poll showed that 77 percent of Americans supported a uniform drinking age of 21 for all states. April 7, 1983. H.R. 2441 was introduced by a member of the Congress from Illinois to prohibit the use of federal highway funds by states whose minimum drinking age was lower than 21. April 20-21, 1983. Senators from Missouri, Oregon, and Rhode Island introduced S. 1108, the Highway Safety Act of 1983, which provided more incentive grants to states for efforts to deter drunk driving. The bill was never voted out of committee. A member of the Congress from California introduced H.R. 2693, a counterpart bill to S. 1108. May 6, 1983. A Senator from Pennsylvania introduced Concurrent Resolution 32 to express the sentiment of the Congress that all states should establish a minimum drinking age of 21. Sept. 13, 1983. Members of the Congress introduced H.R. 3870, a bill to prohibit the sale of alcoholic beverages to persons under 21 years of age under certain conditions. Oct. 1983. A Senator from Indiana introduced S. 1948 as a counterpart to H.R. 3870. Oct. 4 and 19, 1983. [H1] The House Subcommittee on Commerce, Transportation, and Tourism held hearings on H.R. 3870. Nov. 1983. The Presidential Commission on Drunk Driving issued its final report, keeping the recommendation for a uniform minimum drinking age of 21 for the purchase and public possession of all alcoholic beverages. Jan. 1984. The president publicly rejected the support of the Presidential Commission on Drunk Driving for a uniform minimum drinking age of 21. Jan. 24, 1984. Members of Congress introduced H.R. 4616, a bill to amend the Surface Transportation Assistance Act of 1982 by increasing appropriations for highway safety.

Feb. 7, 1984. Several senators introduced S. 2263, the Uniform Minimum Drinking Age Act, to amend the Surface Transportation Assistance Act of 1982 by reducing the amount of federal highway aid for states that do not enact a legal minimum drinking age of 21. Feb. 22, 1984. Members of the Congress introduced H.R. 4892, a counterpart to S. 2263. Feb. and March 1984. The House Subcommittee on Surface Transportation held hearings on surface transportation issues, including a discussion of the drinking-age issue. April 5, 1984. Members of Congress introduced H.R. 5383, a bill to reduce a state’s apportionment for federal aid for highways in specific fiscal years for states with drinking ages below 21. April 25, 1984. A member of the Congress from California introduced H.R. 5504, the Surface Transportation and Uniform Relocation Assistance Act of 1984. April 30, 1984. The House passed H.R. 4616 by voice vote. May 24, 1984. Senators from New Jersey and Rhode Island introduced S. 2719 as a revision of S. 2263, a counterpart to H.R. 5383, and an attachment to H.R. 4616, the Child Safety Restraint Act. June 7, 1984. The House approved H.R. 5383 as an amendment to H.R. 5504, which would reduce federal highway funds by 5 percent in fiscal year 1987 and 10 percent in fiscal year 1988 for states not enacting a minimum drinking age of 21. June 13, 1984. The administration reversed its position on the minimum drinking-age issue through support of H.R. 4616 from the secretary of the Department of Transportation. June 14, 1984. [H2] The Senate Subcommittee on Surface Transportation held hearings on measures to combat drunk driving. June 19, 1984. [H3] The Senate Subcommittee on Alcoholism and Drug Abuse held hearings on a national minimum drinking age. June 26, 1984. The Senate passed S. 1948 by a vote of 81-16, as an attachment to H.R. 4616. The Senate then passed its version of H.R. 4616 by a voice vote. June 27, 1984. The House cleared the Senate version of H.R. 4616, including H.R. 5383. July 6, 1984. The Senate version of H.R. 4616 was approved and sent to the president. July 17, 1984. The Child Safety Restraint Act (H.R. 4616), which included legislation for a national minimum drinking age of 21, was signed into law (Public Law 98-363) amending the Surface Transportation Assistance Act of 1982. This act was strongly lobbied for by the Mothers Against Drunk Driving, the Parent Teachers Association, the National Safety Council, the National Council on Alcoholism, and the insurance industry. Sept. 21, 1984. South Dakota brought an action against the secretary of the Department of Transportation in the U.S. District Court for the District of South Dakota, asking the court to declare the uniform national drinking age sanction of the Surface Transportation Assistance Act of 1982 unconstitutional, on the grounds that it violated the 10th and 21st amendments of the U.S. constitution. May 3, 1985. The U.S. District Court issued a memorandum opinion and judgment dismissing the South Dakota case against the national drinking-age legislation.
May 16, 1985. Members of the Congress from Louisiana and Vermont introduced H.R. 2537 to apportion federal highway funds withheld from states for falling to establish a minimum drinking age of 21 if certain alcohol-related traffic fatalities are significantly reduced. June 3, 1985. A member of the Congress from Louisiana introduced H.R. 2645 to repeal the national minimum drinking-age law. June 26, 1985. South Dakota appealed the District Court’s decision to the Court of Appeals for the Eighth Circuit, contending again that the 10th and 21st amendments were violated by the national drinking-age legislation. Nine other non-complying states supported South Dakota’s appeal. July 11, 1985. Senators from Missouri and New Jersey introduced S. 1428, to make permanent the withholding of 10 percent of the apportionment from the Highway Trust Fund to states that have not adopted the national minimum drinking age. Sept. 27, 1985. NHTSA and the Federal Highway Administration issued a notice of proposed rulemaking to implement section 6 of Public Law 98-363, which refers to the withholding of federal-aid highway funds. Oct. 21, 1985. The Chair of the House Subcommittee of Investigations and Oversight, Committee on Public Works and Transportation, asks the GAO to review “existing evaluation[s] of drinking age laws to determine the extent to which they provide empirical support for federal and state initiatives to change the legal drinking age.” Nov. 12, 1985. S.1428 was amended to S. 1730, the Consolidated Budget Reconciliation Act. Dec. 20, 1985. S. 1730 was folded into H.R. 3128, the Budget Reconciliation Act, which did not pass but was carried over into the next year. April 7, 1986. The president signed the Budget Reconciliation Act, which made permanent the withholding of 10 percent of federal highway funds from states not complying with a uniform drinking age. May 21, 1986. The court of appeals for the eighth circuit affirmed the district court’s dismissal of South Dakota’s complaint challenging the constitutionality of the national drinking-age legislation. Sept. 16, 1986. [H4] Relying on an early draft of the GAO report, the House Subcommittee of Investigations and Oversight, Committee on Public Works and Transportation, conducts hearings to assess evidence on the efficacy of minimum drinking age laws. March, 1987. The GAO issues its final report, “Drinking-Age Laws: An Evaluation Synthesis of Their Impact on Highway Safety.” This report finds that “raising the drinking age has a direct effect on reducing alcohol-related traffic accidents among youths affected by the laws.” June 23, 1987. The U.S. Supreme Court affirms the constitutionality of the uniform national minimum drinking age in South Dakota v. Dole. June 29 and Aug. 2, 1988. [H5] The Senate Committee on Environment and Public Works, followed by the Subcommittee on the Consumer, Committee on Commerce, Science, and Transportation, hold hearings on the Drunk Driving Prevention Act of 1988, which is ultimately tabled in the Senate after being opposed by the Reagan Administration. Feb. 27, June 27, 2002. [H6] The Senate Subcommittee on Transportation and Related Agencies, followed by the House Subcommittee on Highways and Transportation, hold hearings on various traffic safety related issues.