
Evidence and Anecdote - policyoptions.irpp.org · Changing Diversity Single and Multiple Ethnic...
59
MULTICULTURALISM IN CANADA Evidence and Anecdote ANDREW GRIFFITH
Transcript of Evidence and Anecdote - policyoptions.irpp.org · Changing Diversity Single and Multiple Ethnic...
MULTICULTURALISM IN CANADAEvidence and Anecdote
ANDREW GRIFFITH
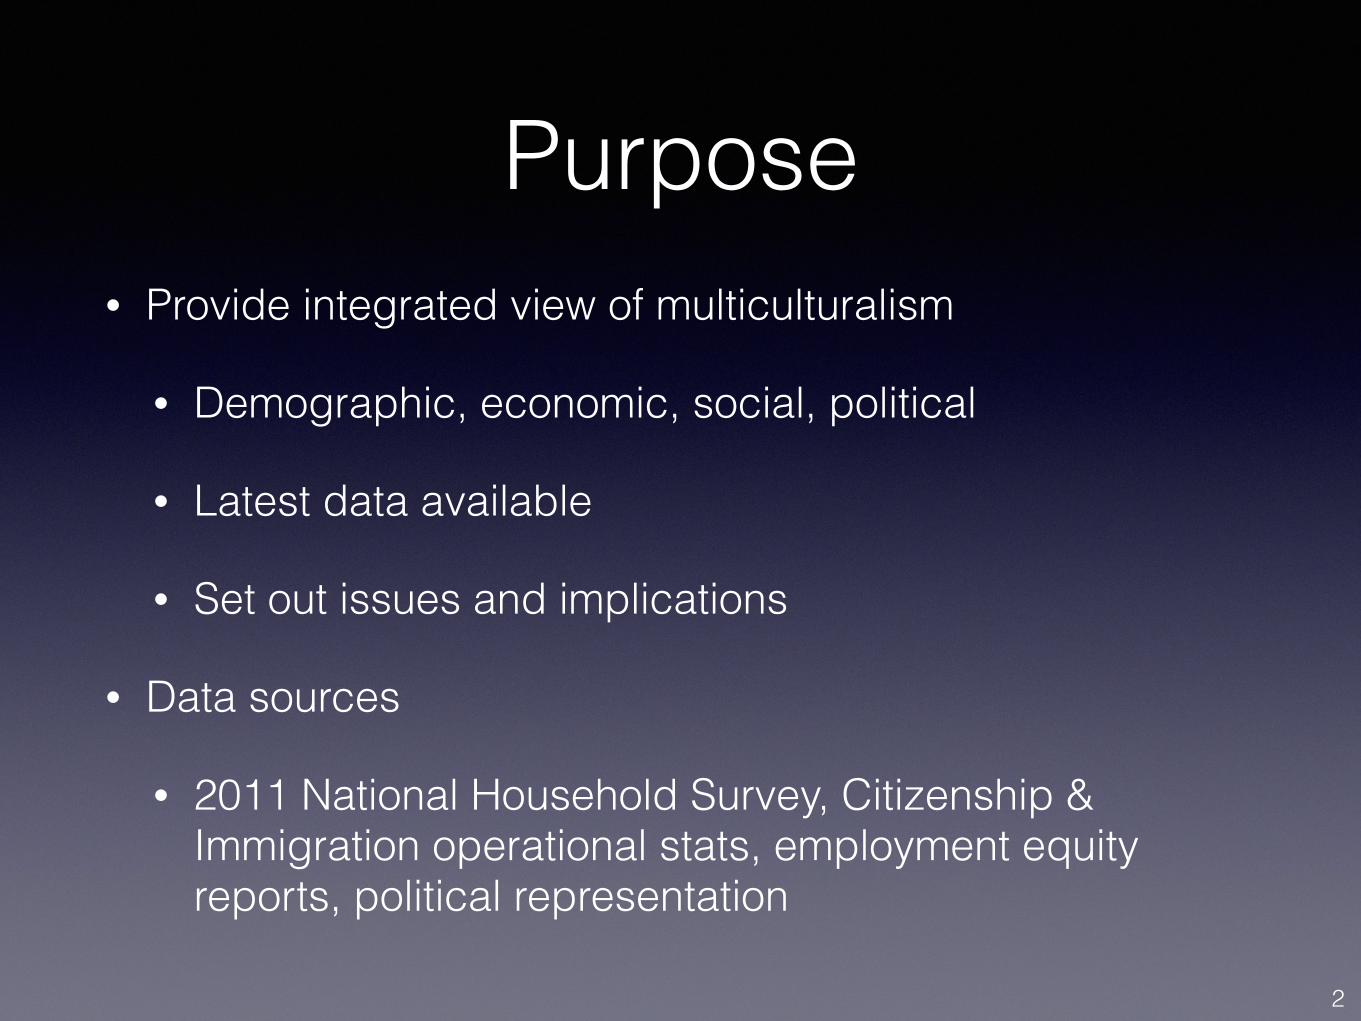
Purpose• Provide integrated view of multiculturalism
• Demographic, economic, social, political
• Latest data available
• Set out issues and implications
• Data sources
• 2011 National Household Survey, Citizenship & Immigration operational stats, employment equity reports, political representation
2
Diversity within Diversity
3
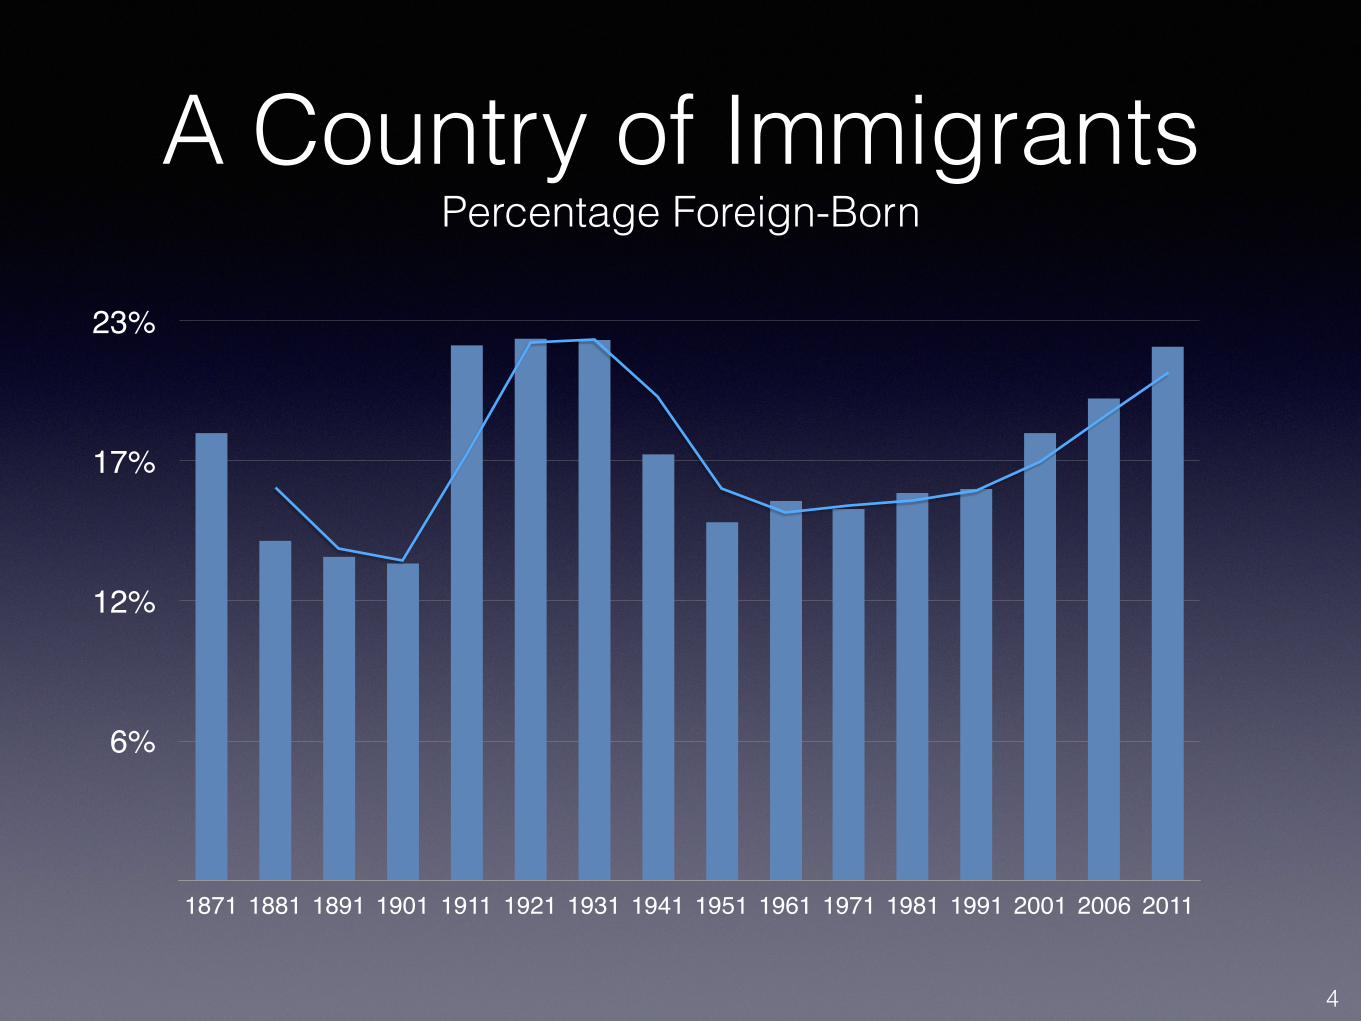
A Country of Immigrants Percentage Foreign-Born
6%
12%
17%
23%
1871 1881 1891 1901 1911 1921 1931 1941 1951 1961 1971 1981 1991 2001 2006 2011
4
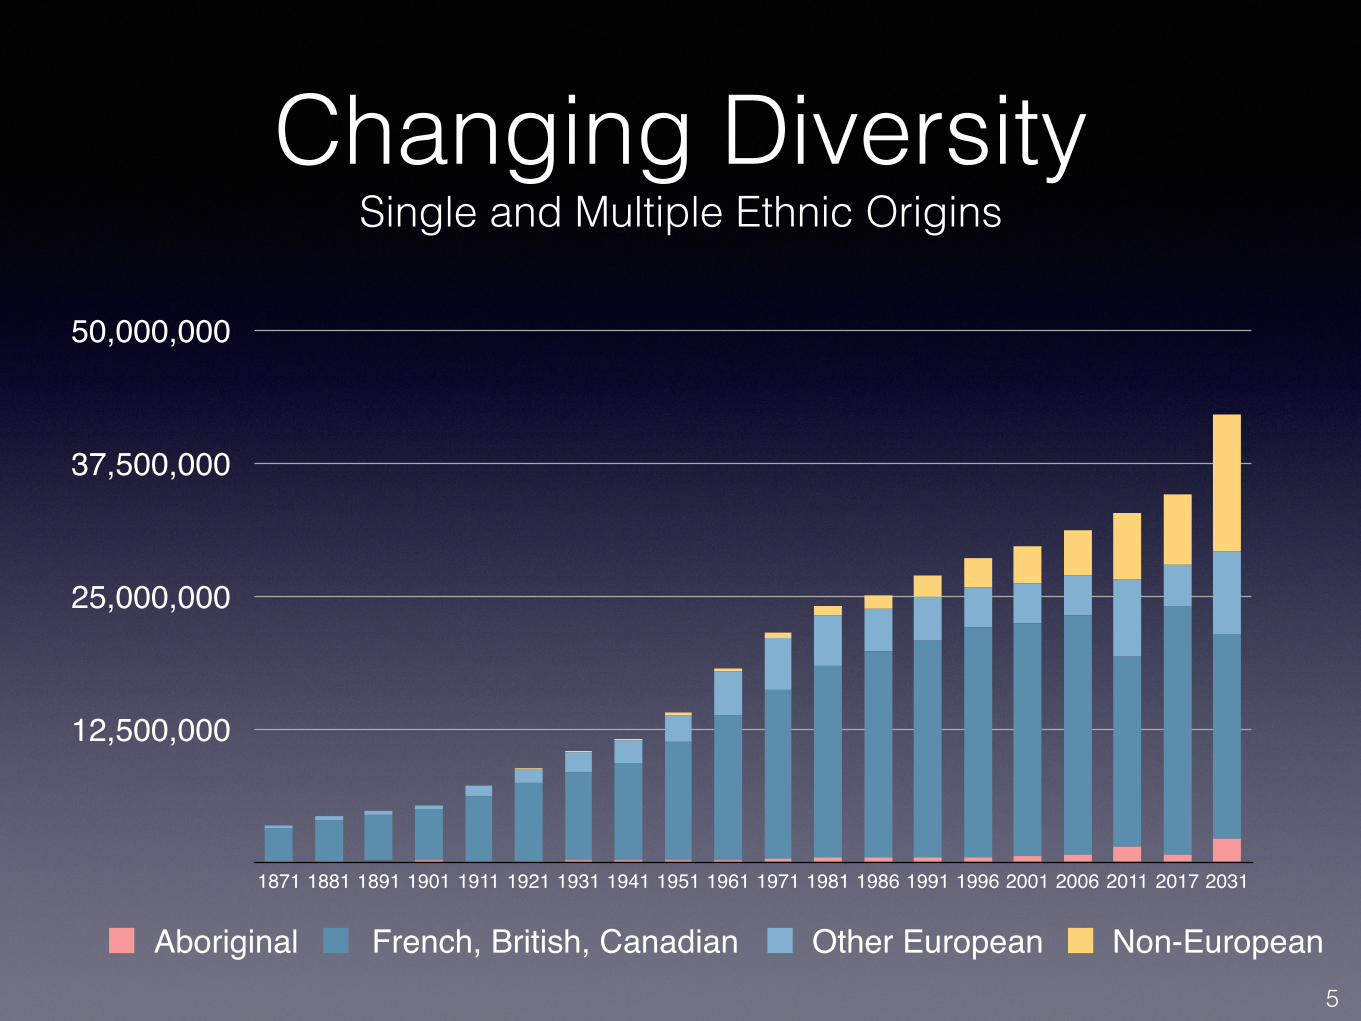
Changing Diversity Single and Multiple Ethnic Origins
12,500,000
25,000,000
37,500,000
50,000,000
1871 1881 1891 1901 1911 1921 1931 1941 1951 1961 1971 1981 1986 1991 1996 2001 2006 2011 2017 2031
Aboriginal French, British, Canadian Other European Non-European5
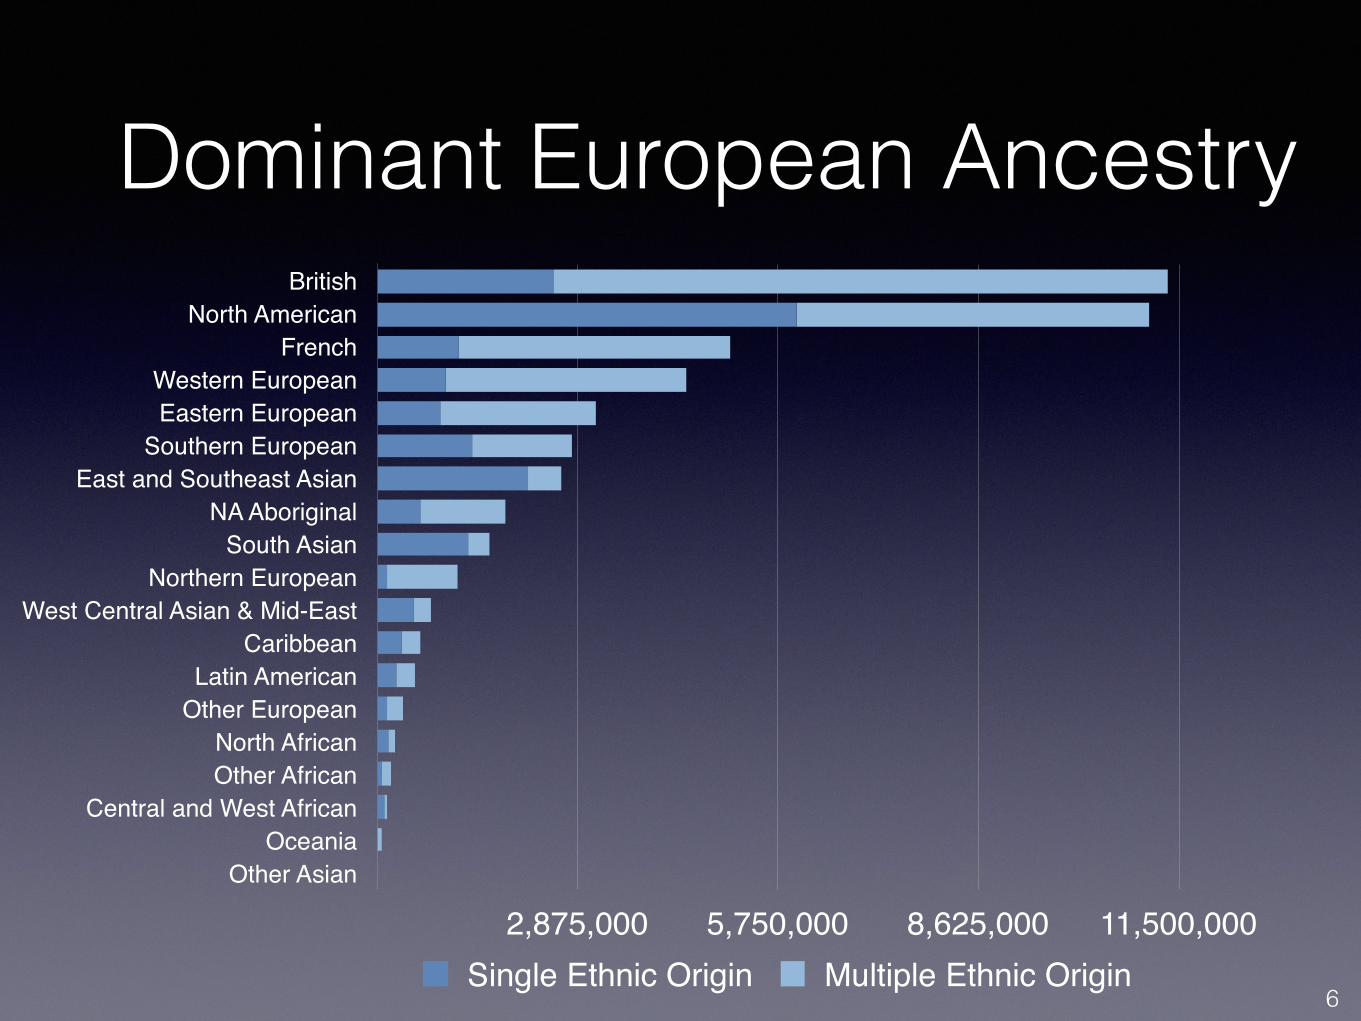
Dominant European AncestryBritish
North AmericanFrench
Western EuropeanEastern European
Southern EuropeanEast and Southeast Asian
NA AboriginalSouth Asian
Northern EuropeanWest Central Asian & Mid-East
CaribbeanLatin American
Other EuropeanNorth AfricanOther African
Central and West AfricanOceania
Other Asian
2,875,000 5,750,000 8,625,000 11,500,000Single Ethnic Origin Multiple Ethnic Origin
6
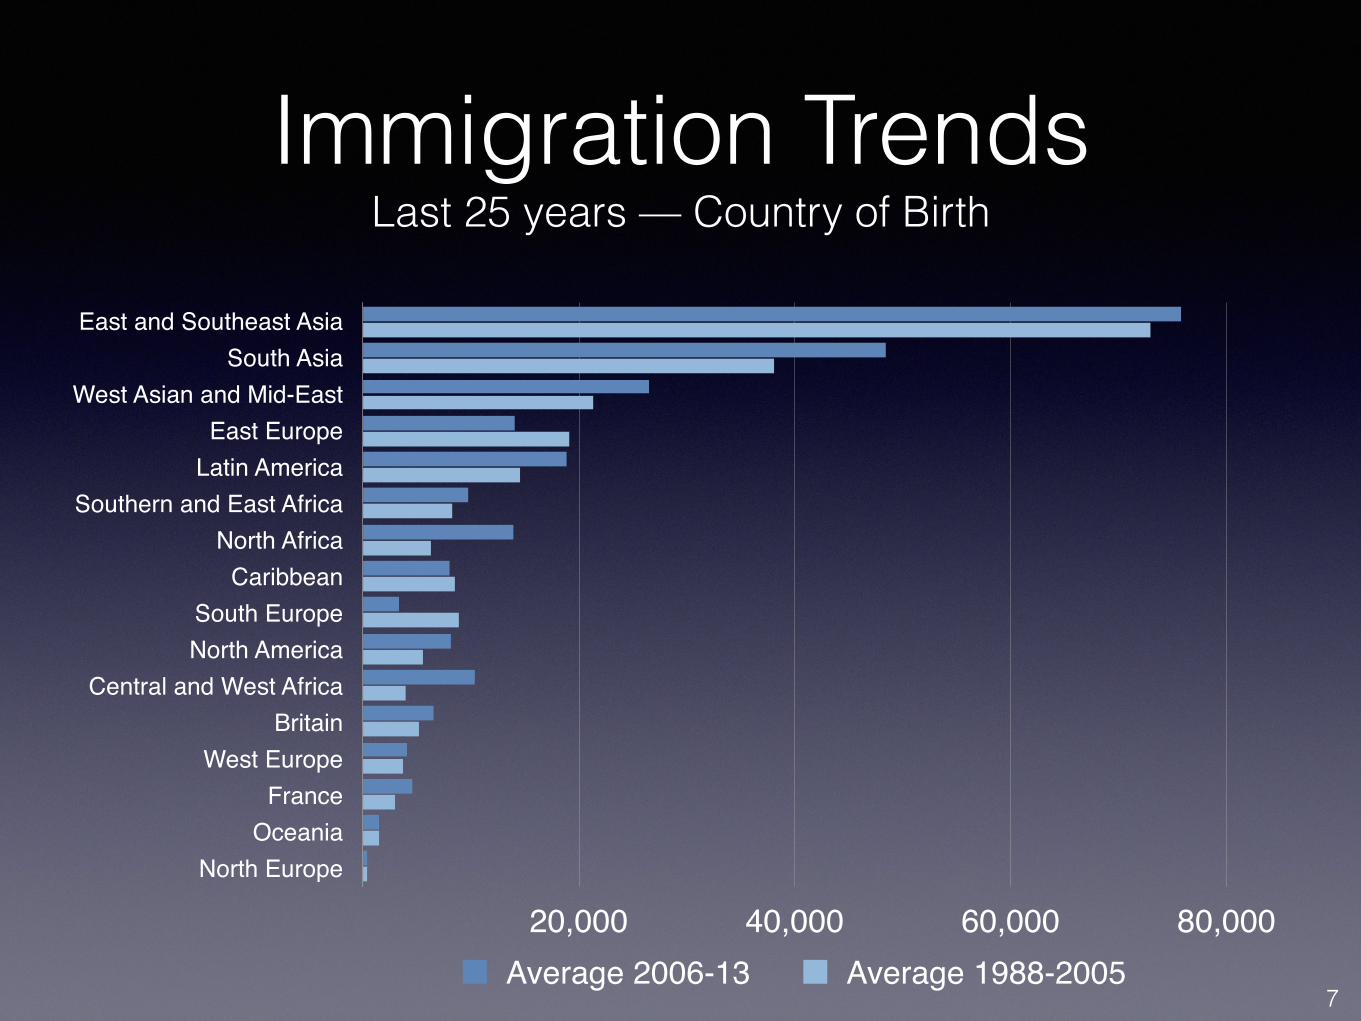
Immigration Trends Last 25 years — Country of Birth
East and Southeast AsiaSouth Asia
West Asian and Mid-EastEast Europe
Latin AmericaSouthern and East Africa
North AfricaCaribbean
South EuropeNorth America
Central and West AfricaBritain
West EuropeFrance
OceaniaNorth Europe
20,000 40,000 60,000 80,000Average 2006-13 Average 1988-2005
7
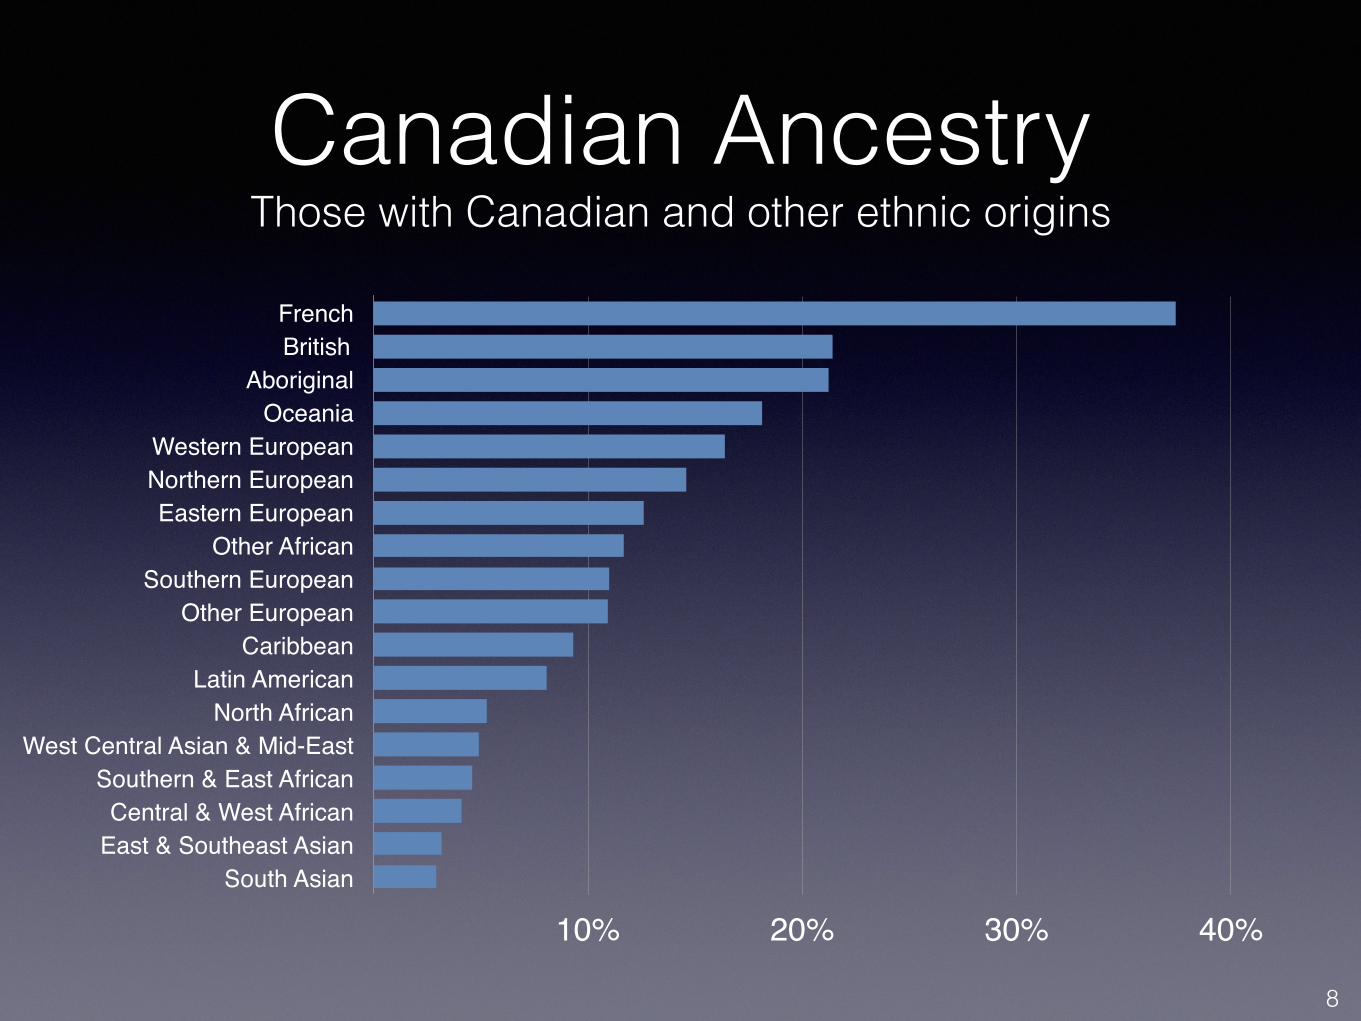
Canadian Ancestry Those with Canadian and other ethnic origins
FrenchBritish
AboriginalOceania
Western EuropeanNorthern EuropeanEastern European
Other AfricanSouthern European
Other EuropeanCaribbean
Latin AmericanNorth African
West Central Asian & Mid-EastSouthern & East African
Central & West AfricanEast & Southeast Asian
South Asian
10% 20% 30% 40%
8
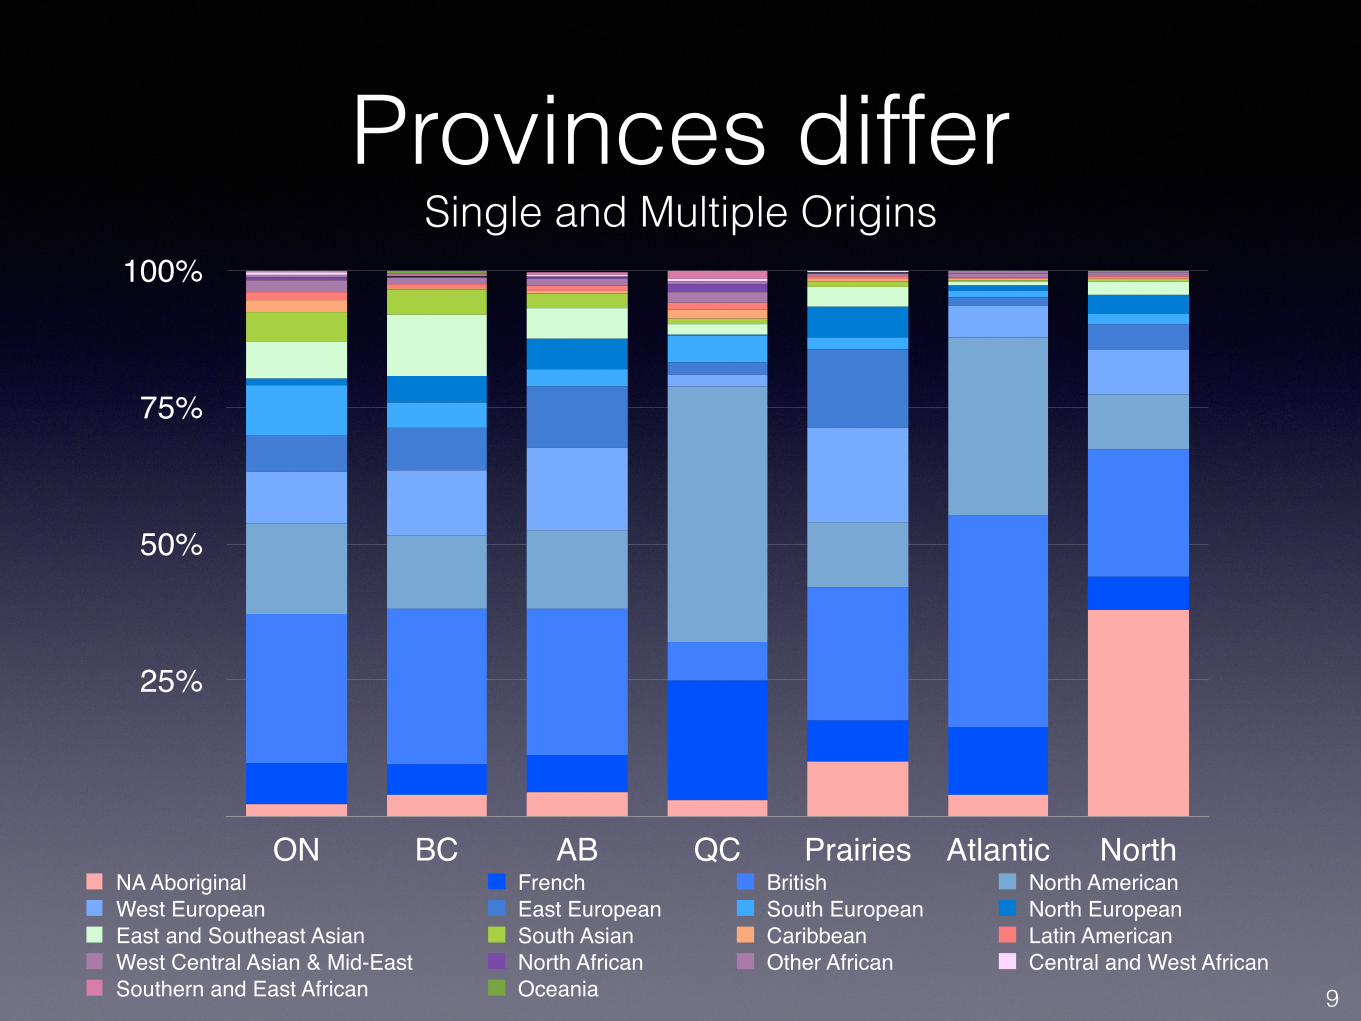
Provinces differ Single and Multiple Origins
25%
50%
75%
100%
ON BC AB QC Prairies Atlantic NorthNA Aboriginal French British North AmericanWest European East European South European North EuropeanEast and Southeast Asian South Asian Caribbean Latin AmericanWest Central Asian & Mid-East North African Other African Central and West AfricanSouthern and East African Oceania 9
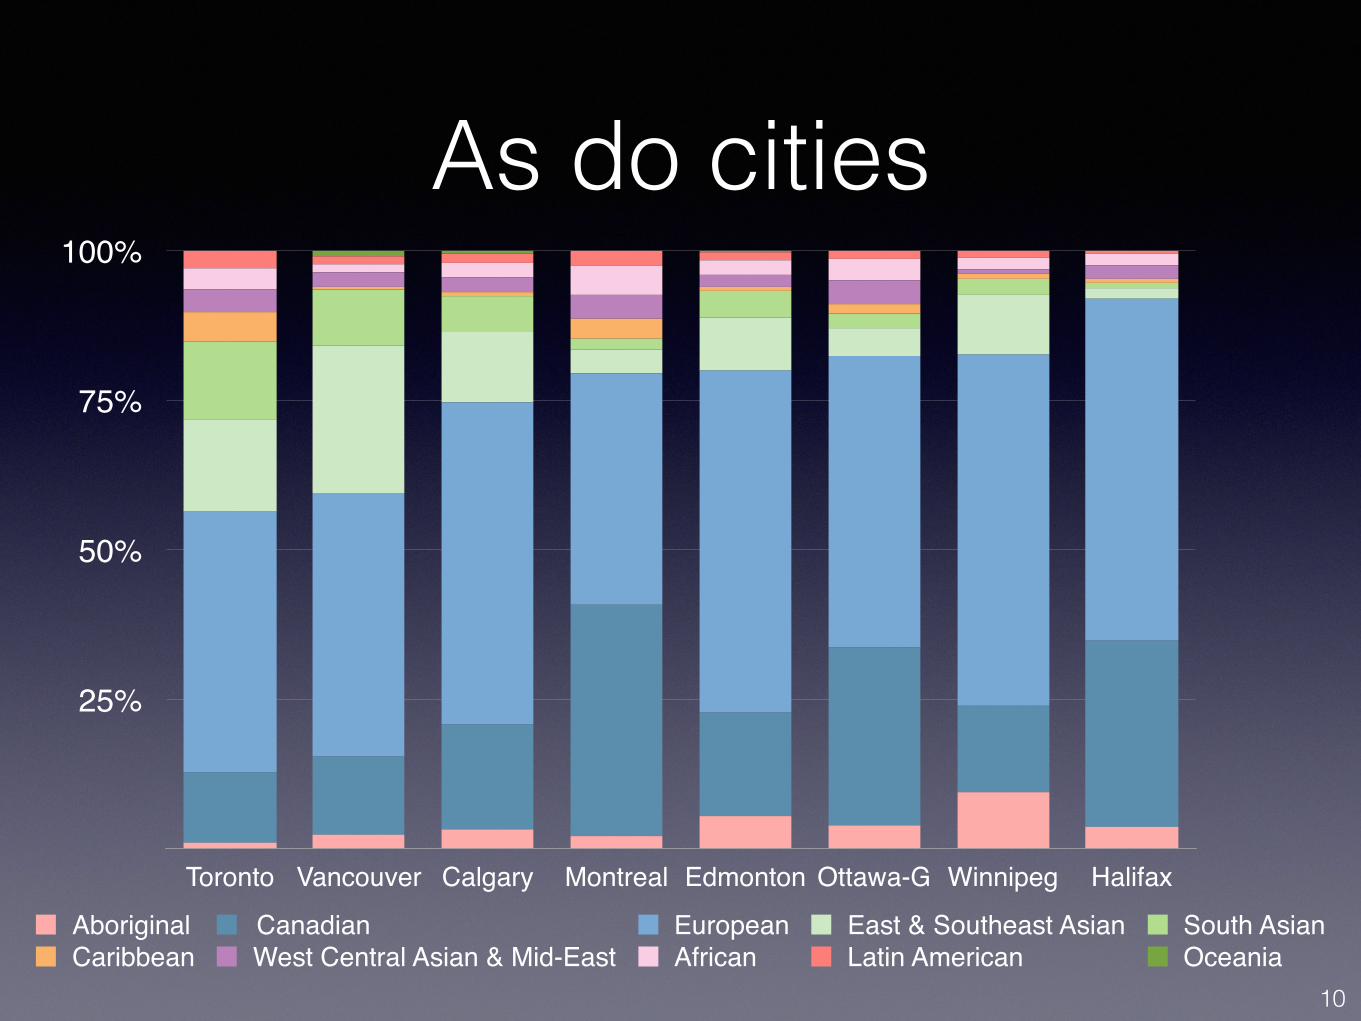
As do cities
25%
50%
75%
100%
Toronto Vancouver Calgary Montreal Edmonton Ottawa-G Winnipeg Halifax
Aboriginal Canadian European East & Southeast Asian South AsianCaribbean West Central Asian & Mid-East African Latin American Oceania
10
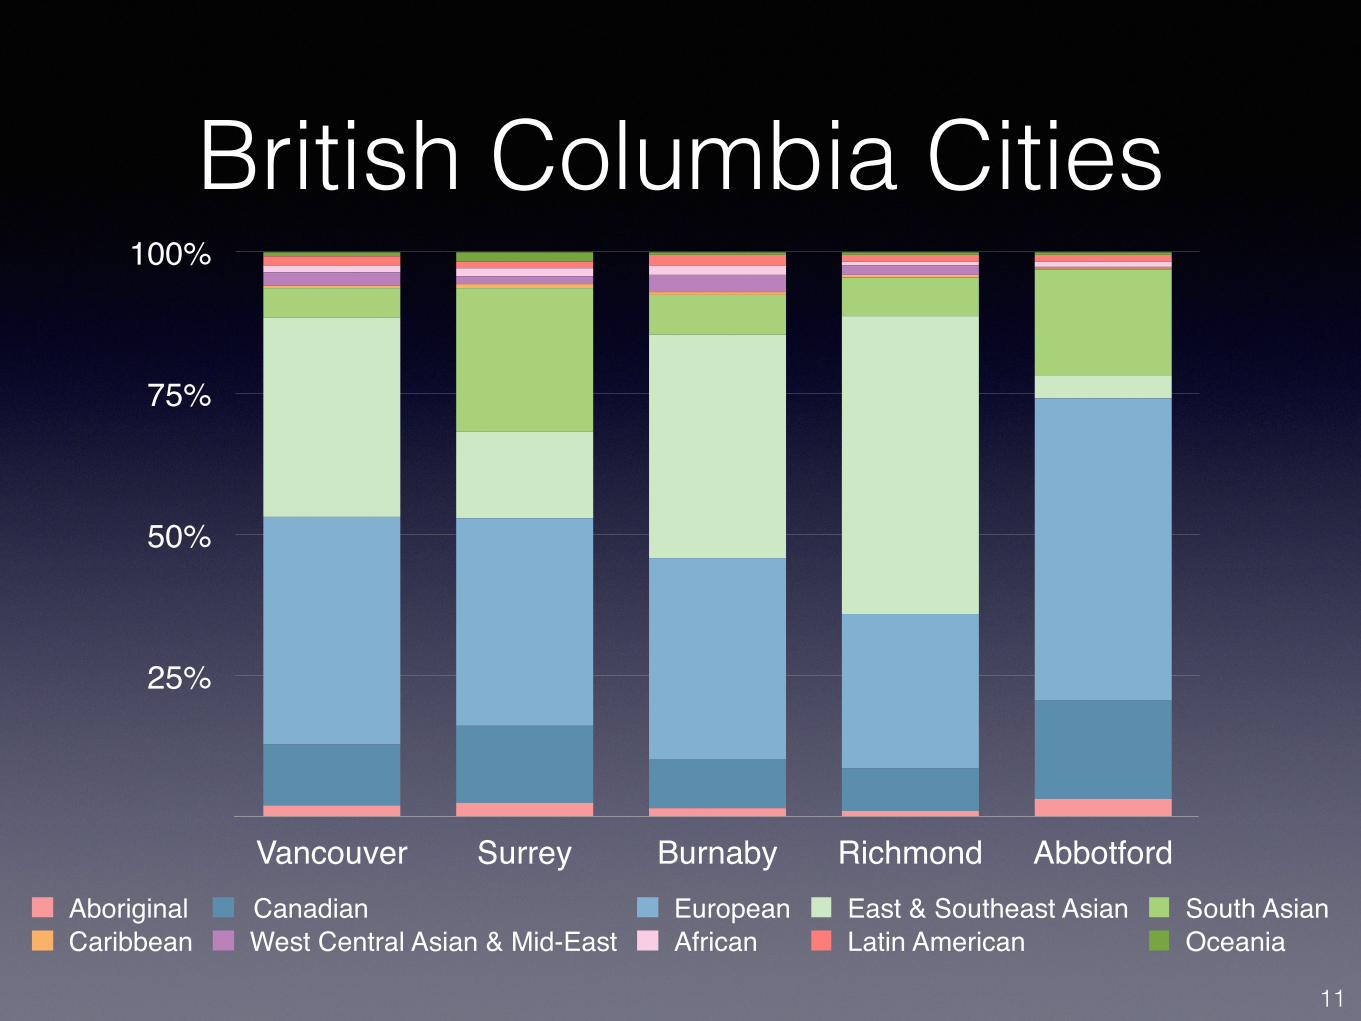
British Columbia Cities
25%
50%
75%
100%
Vancouver Surrey Burnaby Richmond AbbotfordAboriginal Canadian European East & Southeast Asian South AsianCaribbean West Central Asian & Mid-East African Latin American Oceania
11
25%
50%
75%
100%
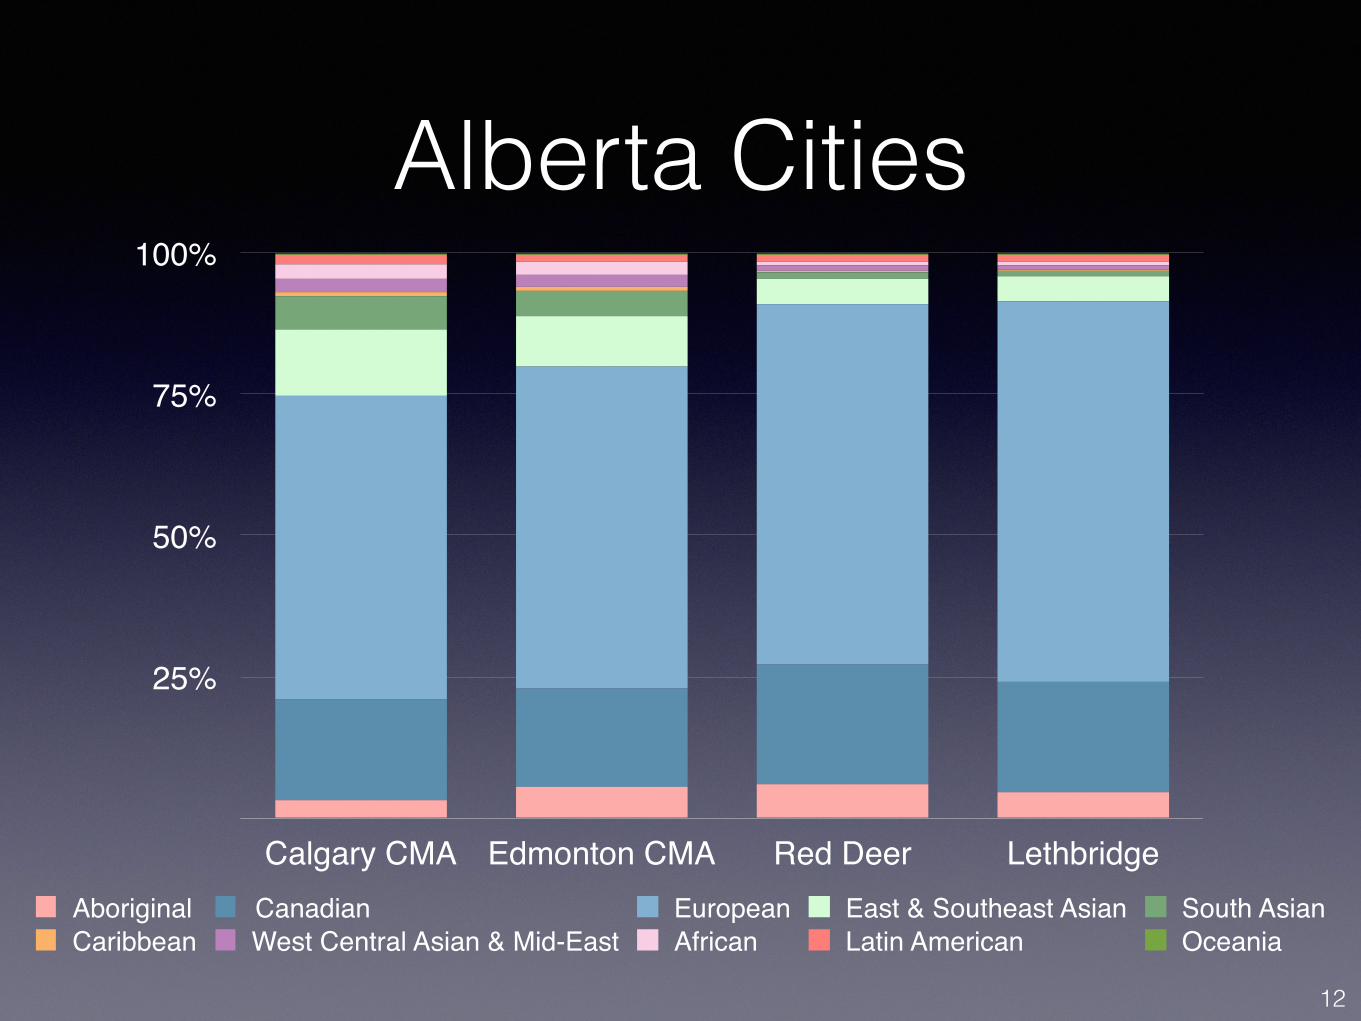
Calgary CMA Edmonton CMA Red Deer LethbridgeAboriginal Canadian European East & Southeast Asian South AsianCaribbean West Central Asian & Mid-East African Latin American Oceania
12
Alberta Cities
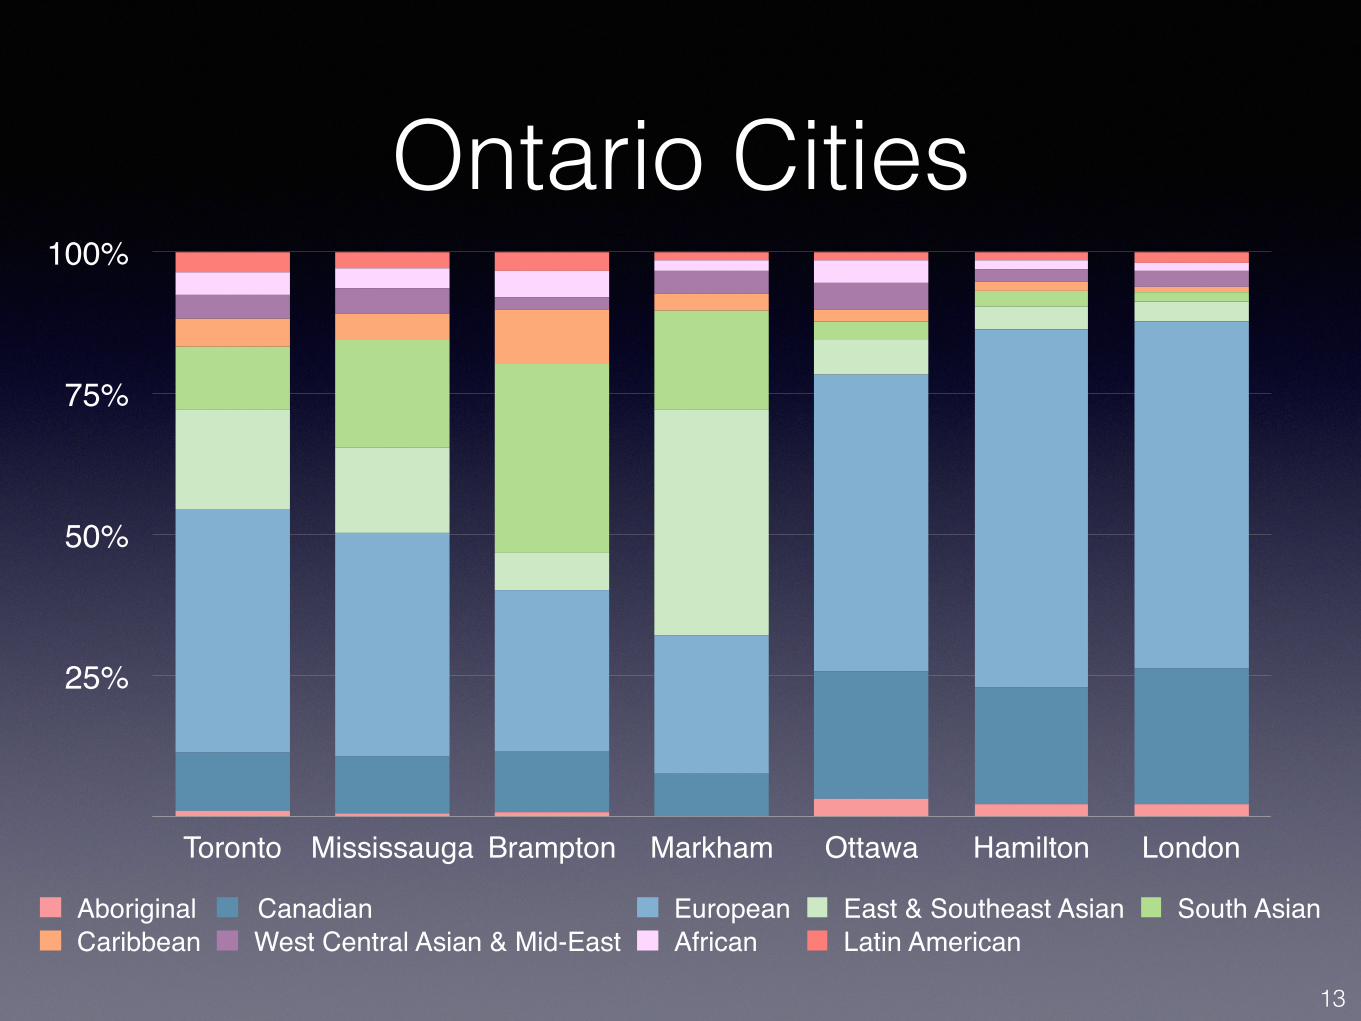
Ontario Cities
25%
50%
75%
100%
Toronto Mississauga Brampton Markham Ottawa Hamilton London
Aboriginal Canadian European East & Southeast Asian South AsianCaribbean West Central Asian & Mid-East African Latin American
13
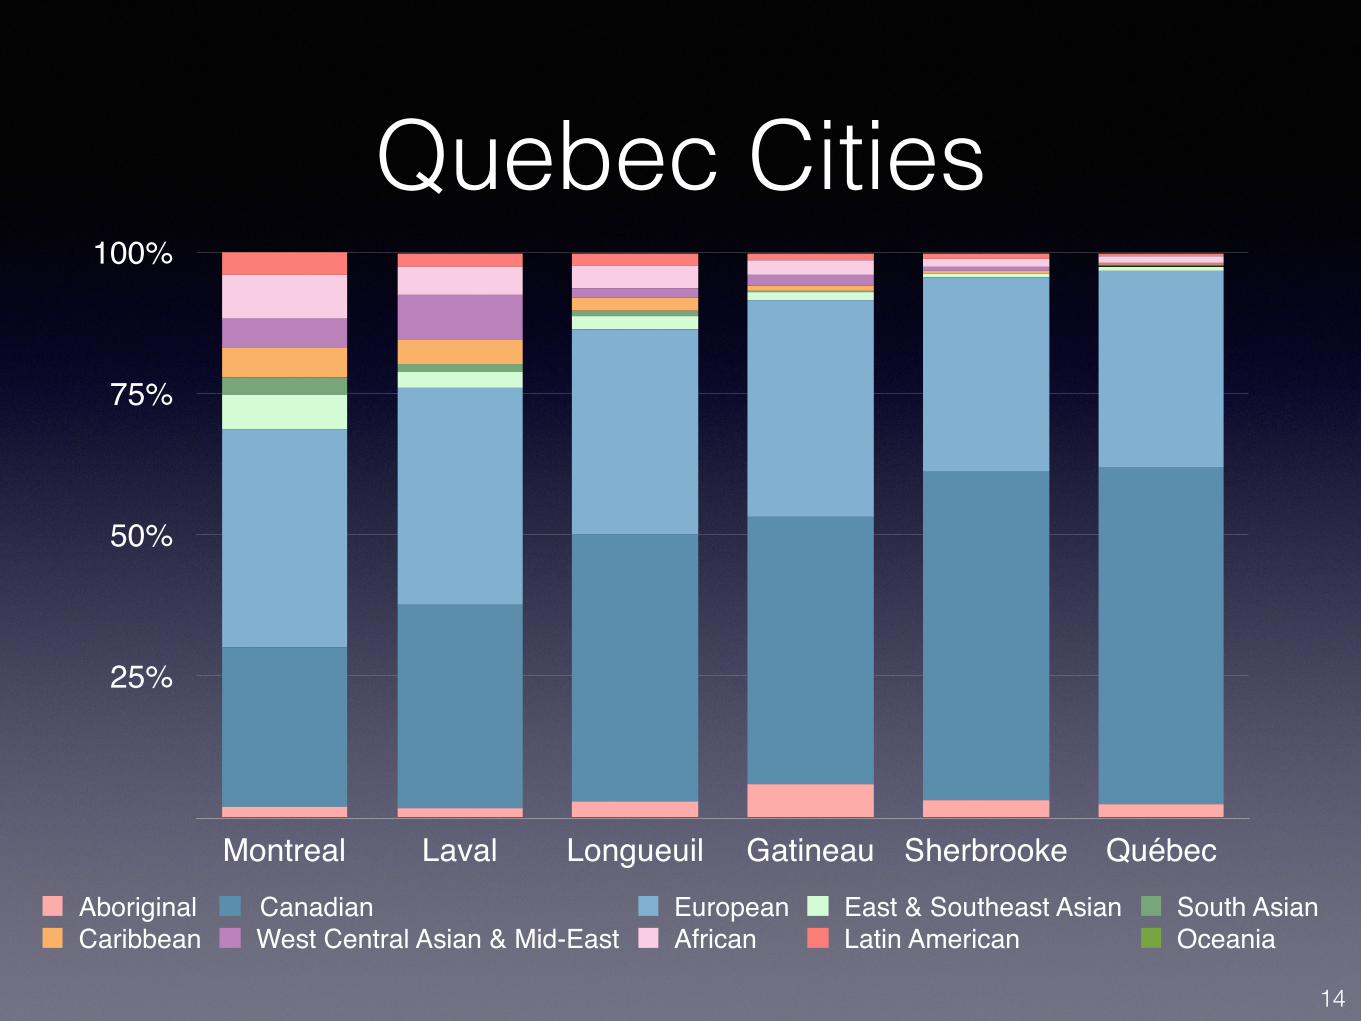
25%
50%
75%
100%
Montreal Laval Longueuil Gatineau Sherbrooke QuébecAboriginal Canadian European East & Southeast Asian South AsianCaribbean West Central Asian & Mid-East African Latin American Oceania
14
Quebec Cities
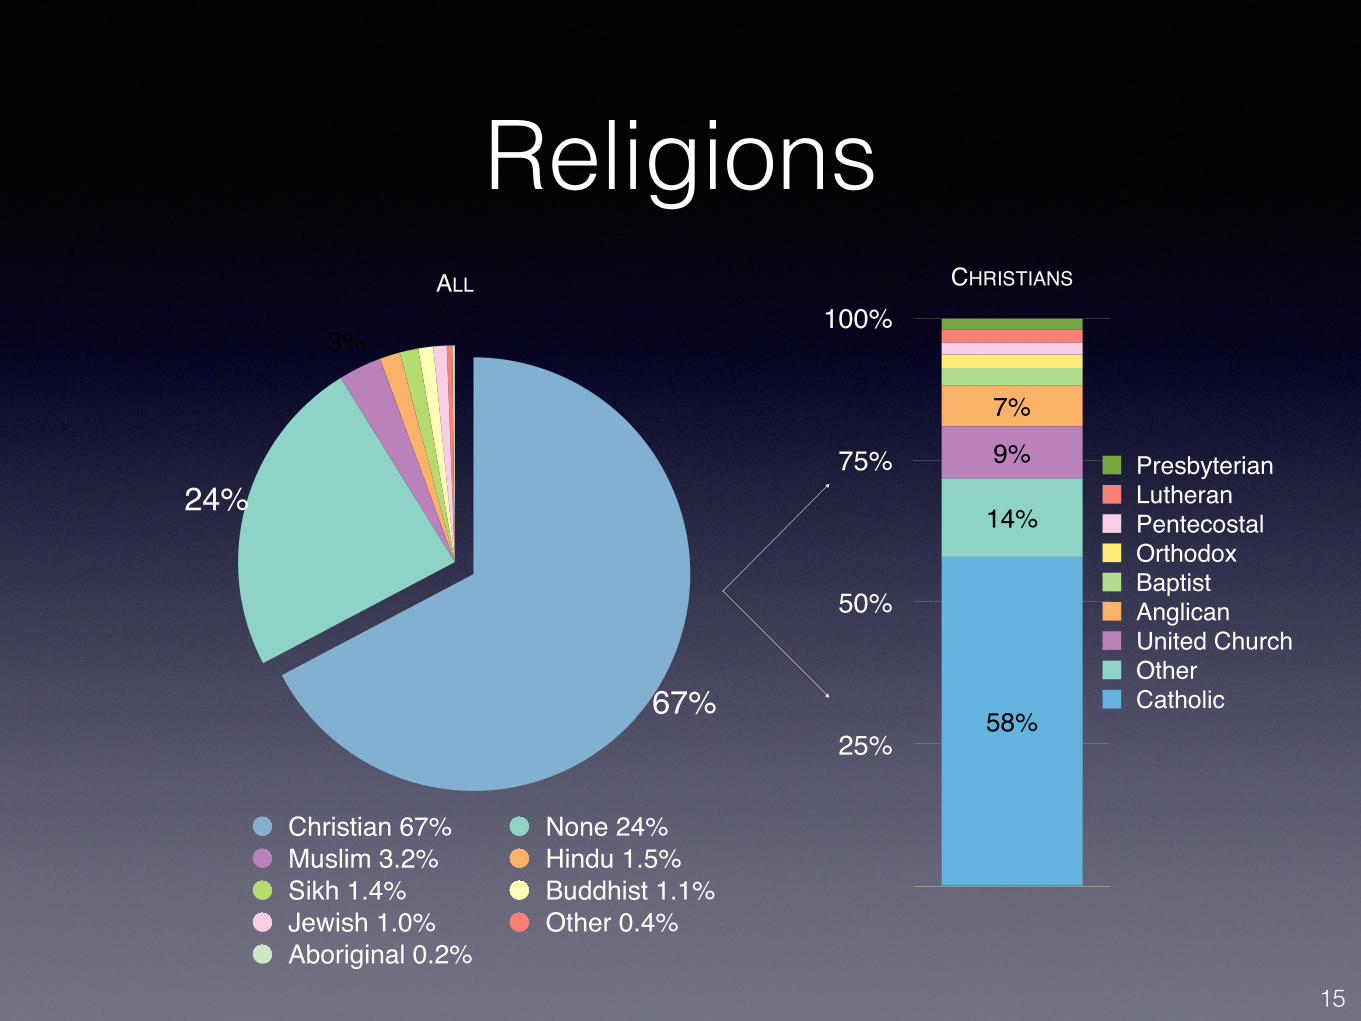
ReligionsALL
3%
24%
67%
Christian 67% None 24%Muslim 3.2% Hindu 1.5%Sikh 1.4% Buddhist 1.1%Jewish 1.0% Other 0.4%Aboriginal 0.2%
CHRISTIANS
25%
50%
75%
100%
7%
9%
14%
58%CatholicOtherUnited ChurchAnglicanBaptistOrthodoxPentecostalLutheranPresbyterian
15
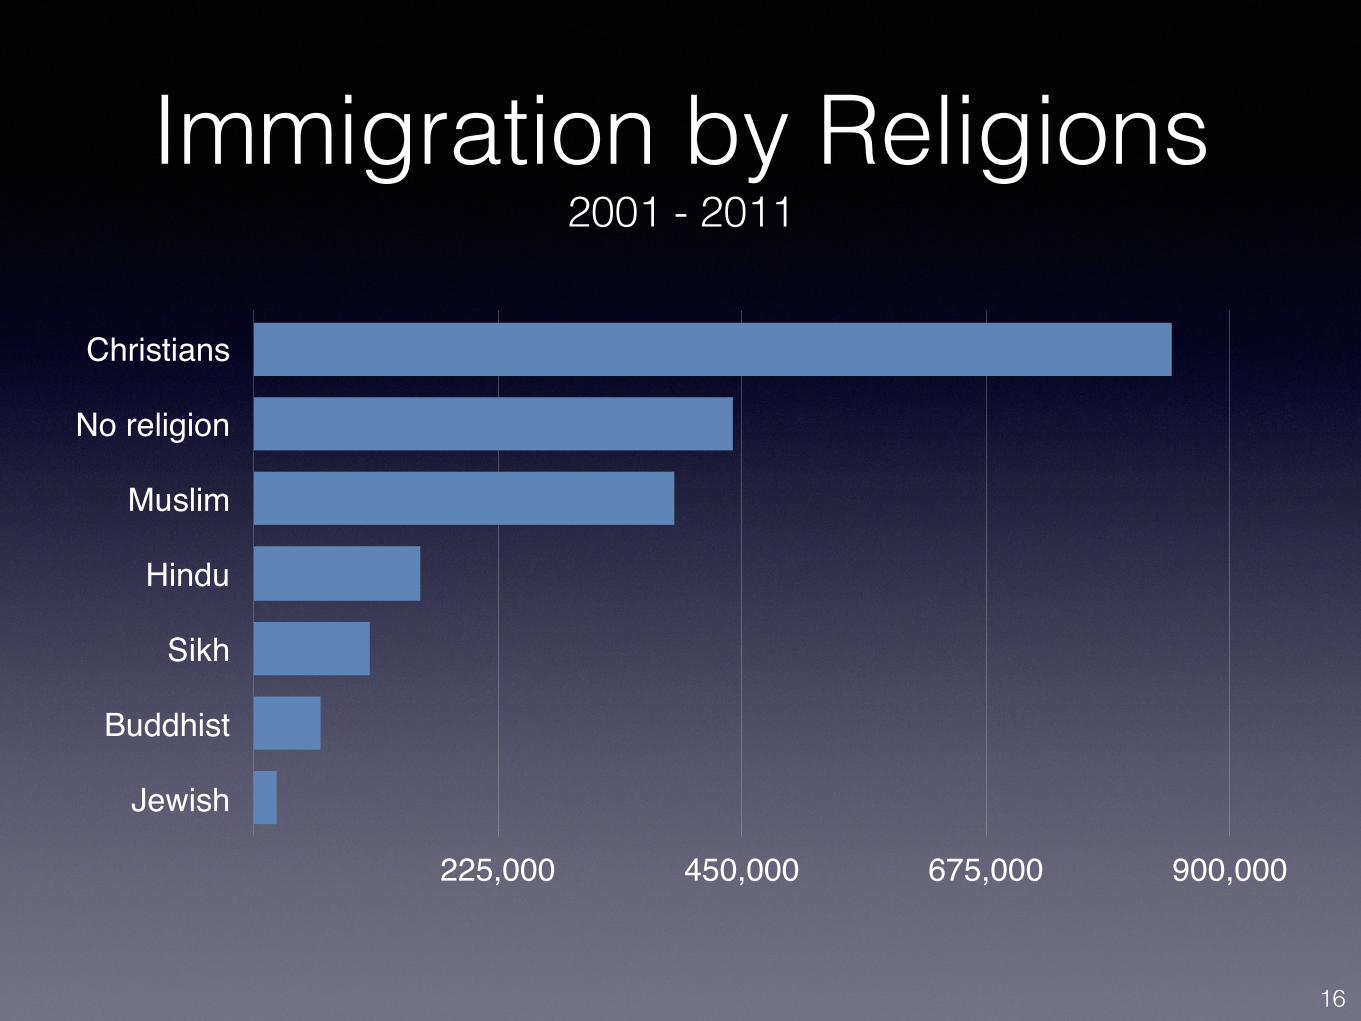
Immigration by Religions 2001 - 2011
16
Christians
No religion
Muslim
Hindu
Sikh
Buddhist
Jewish
225,000 450,000 675,000 900,000
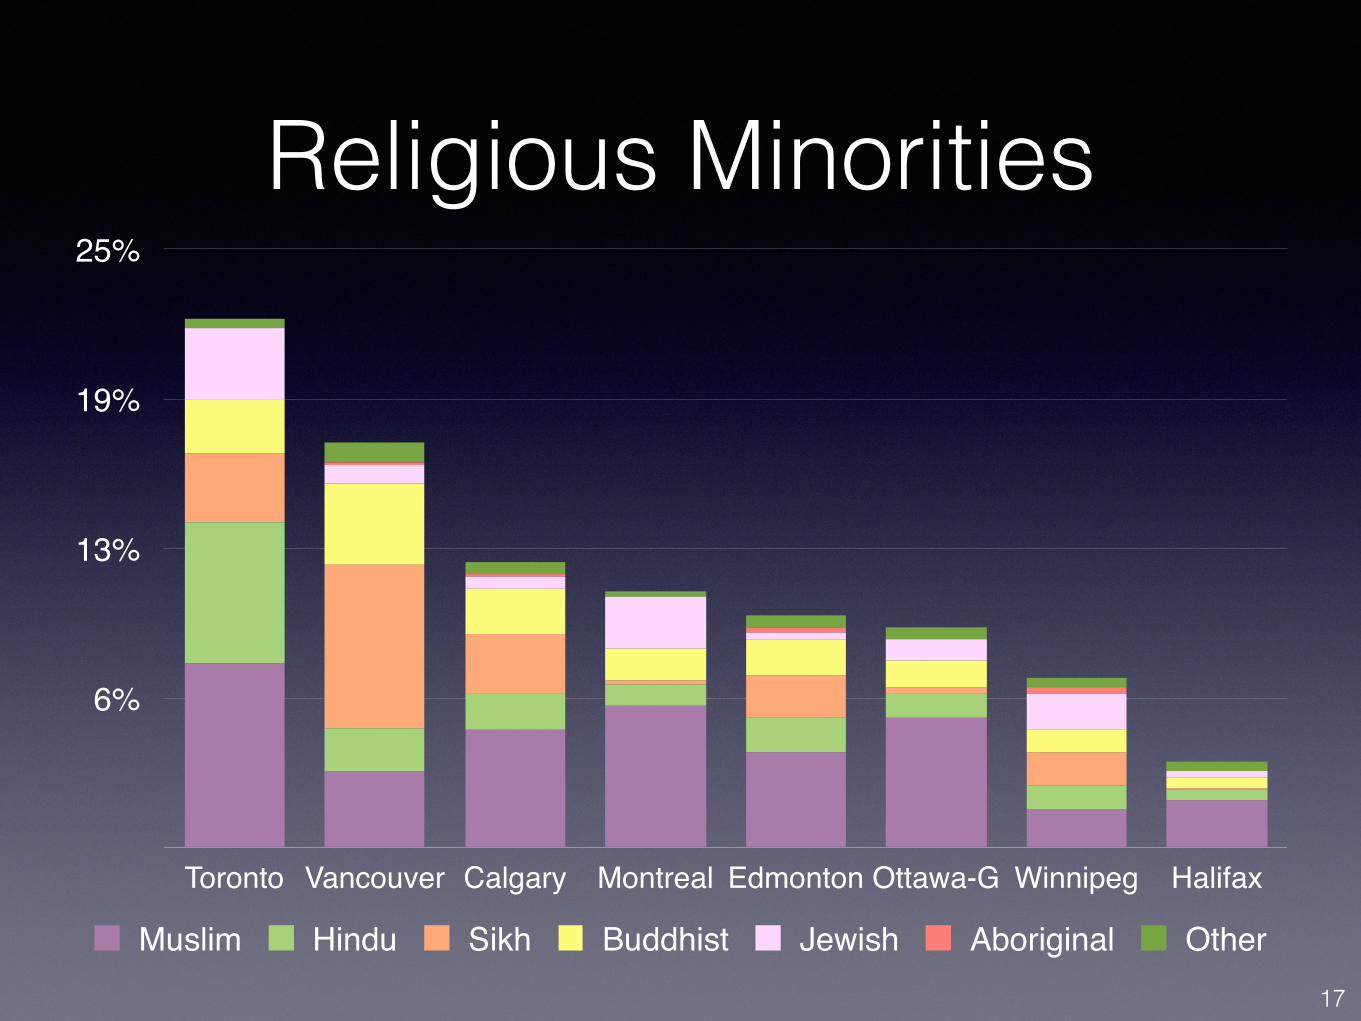
Religious Minorities
6%
13%
19%
25%
Toronto Vancouver Calgary Montreal Edmonton Ottawa-G Winnipeg Halifax
Muslim Hindu Sikh Buddhist Jewish Aboriginal Other17
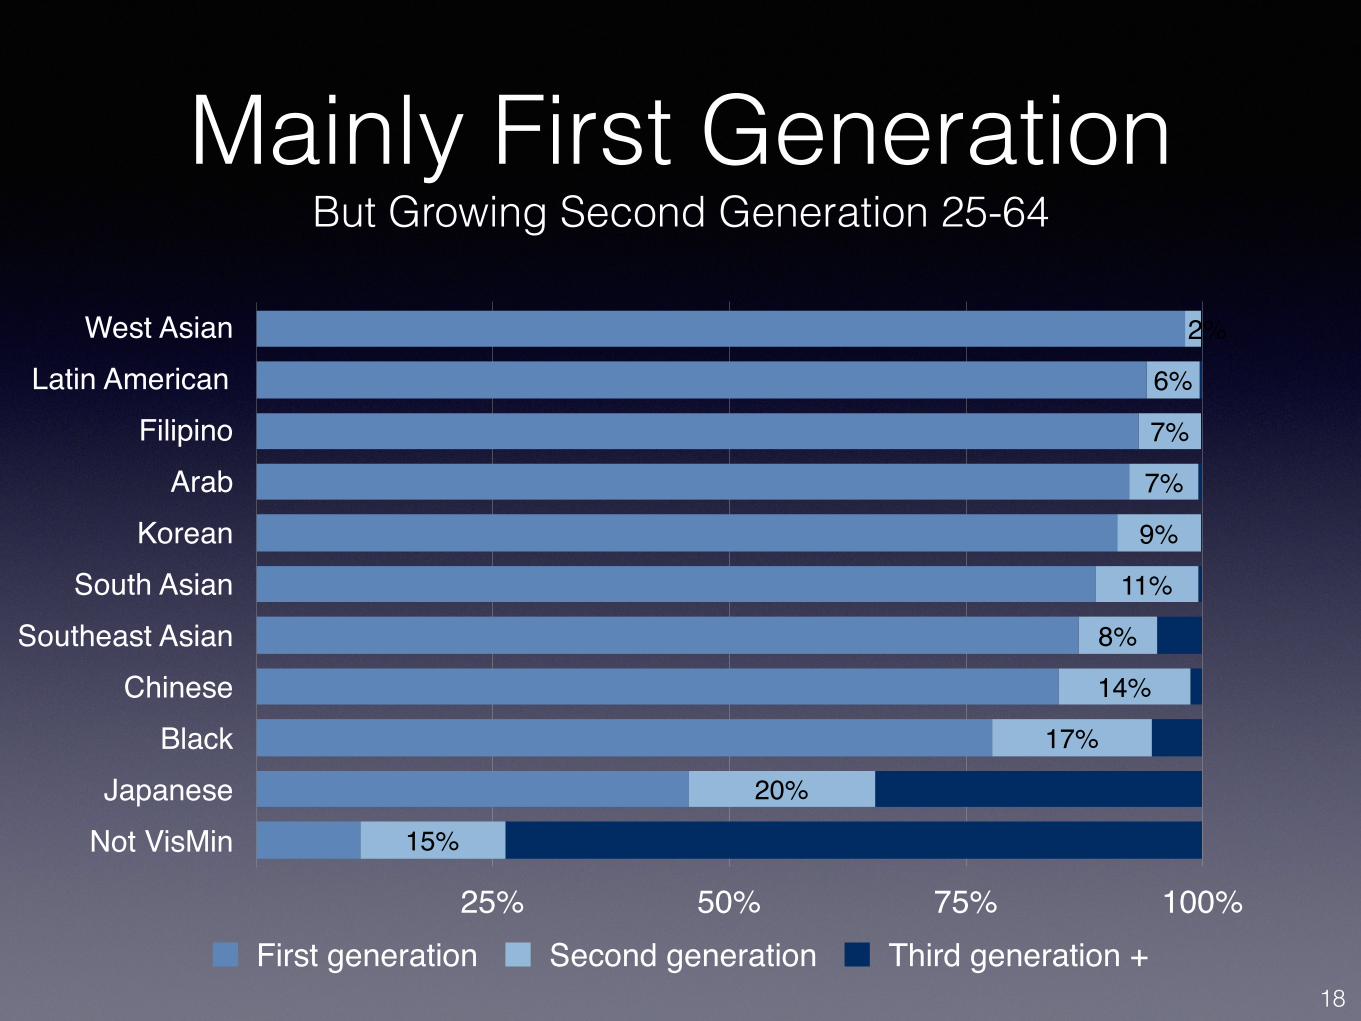
Mainly First Generation But Growing Second Generation 25-64
West AsianLatin American
FilipinoArab
KoreanSouth Asian
Southeast AsianChinese
BlackJapanese
Not VisMin
25% 50% 75% 100%
15%
20%
17%
14%
8%
11%
9%
7%
7%
6%
2%
First generation Second generation Third generation +18
Persistence of Economic Difference
But Second Generation Making Progress
19
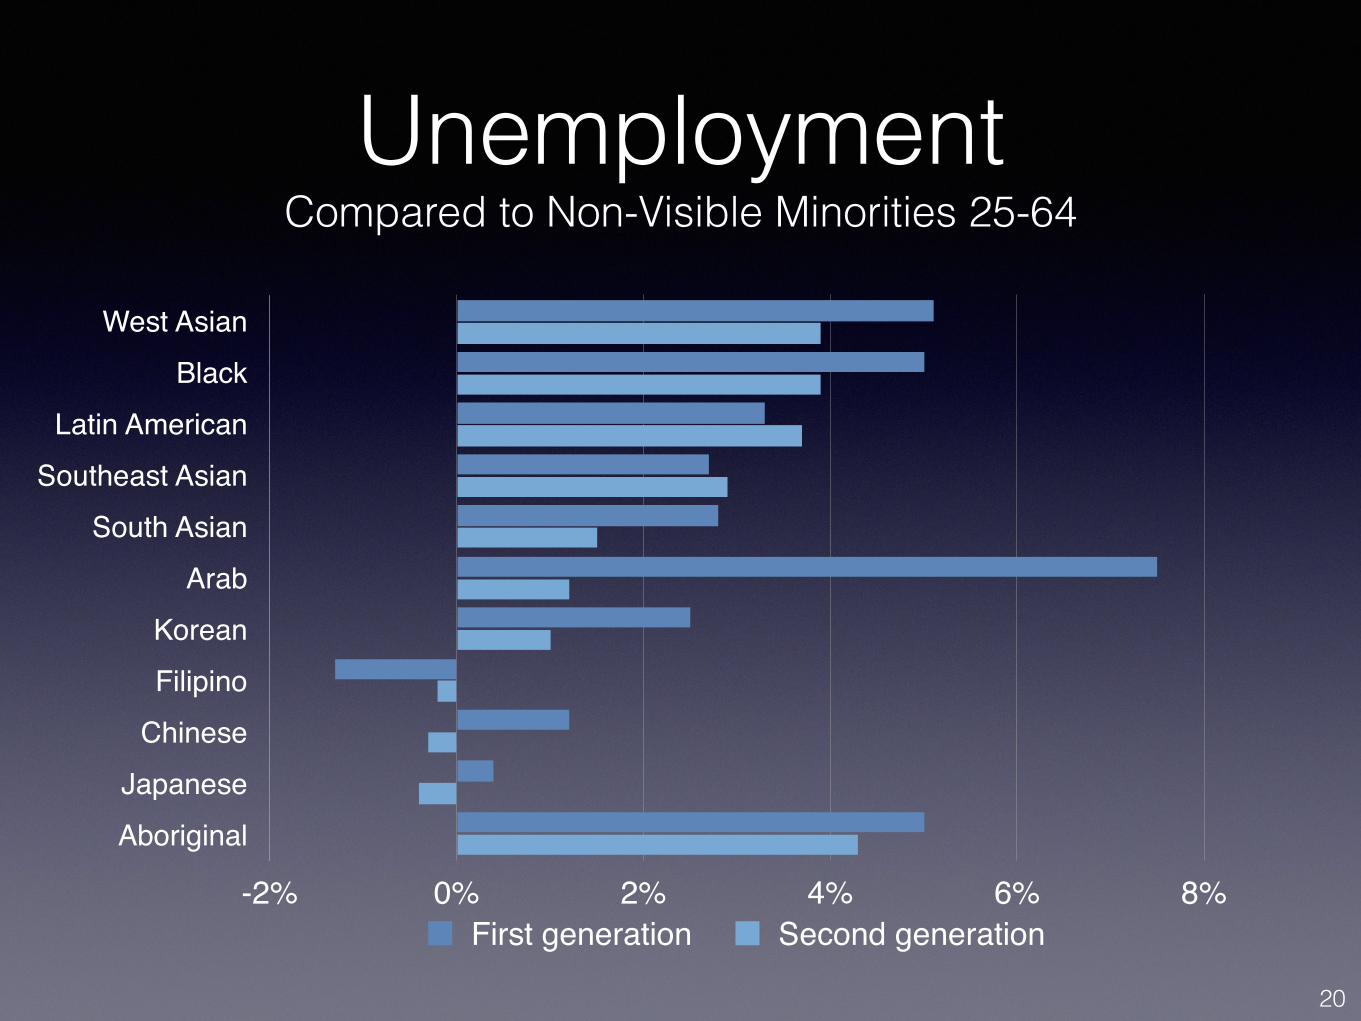
Unemployment Compared to Non-Visible Minorities 25-64
West AsianBlack
Latin AmericanSoutheast Asian
South AsianArab
KoreanFilipino
ChineseJapaneseAboriginal
-2% 0% 2% 4% 6% 8%First generation Second generation
20
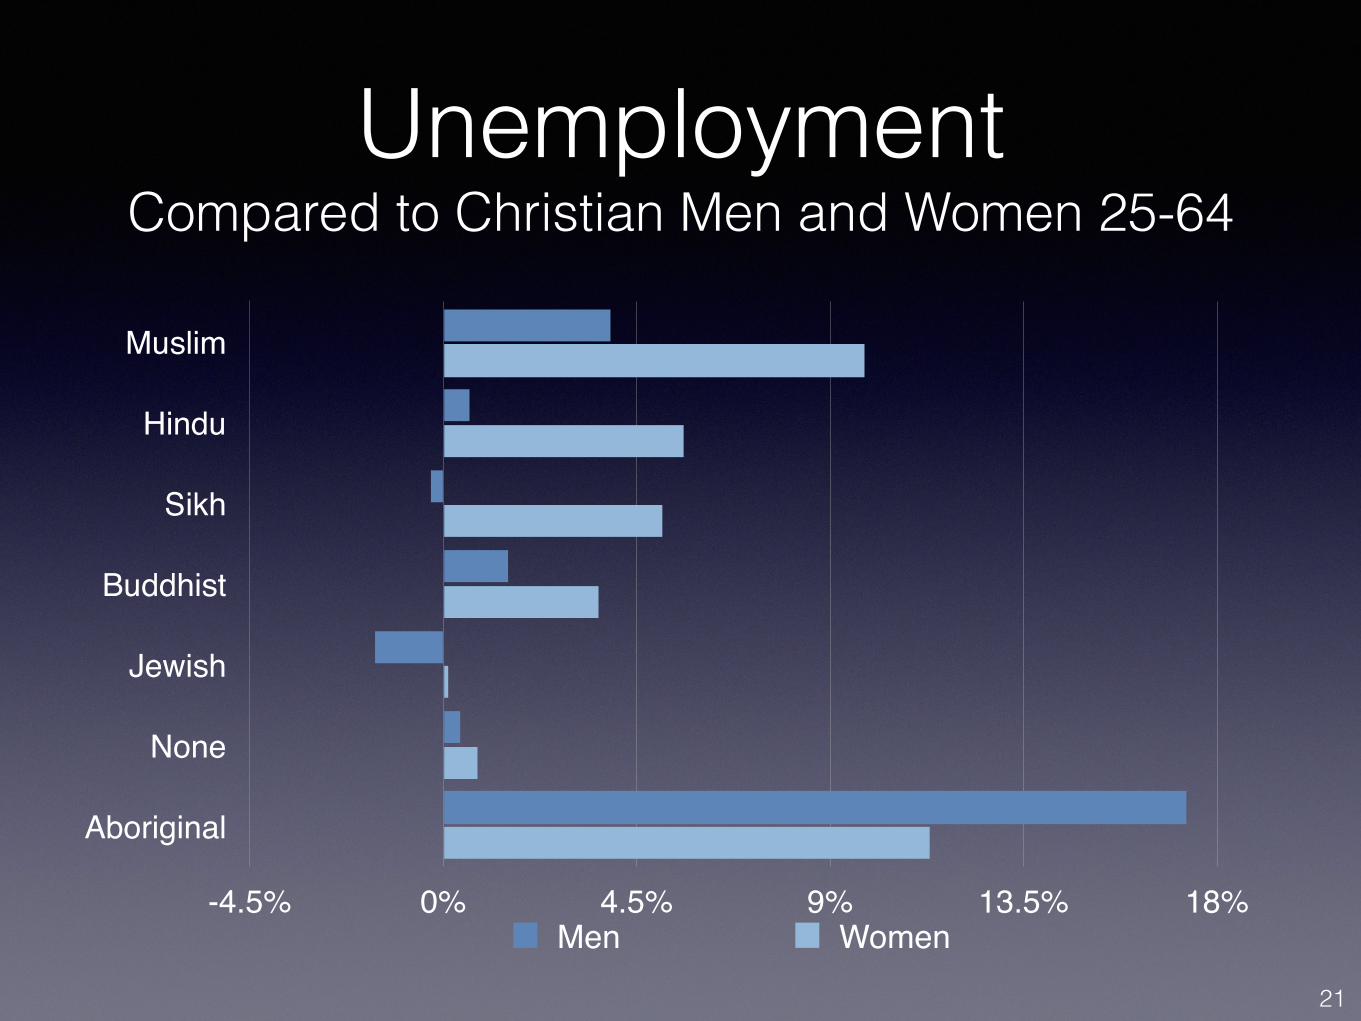
Unemployment Compared to Christian Men and Women 25-64
Muslim
Hindu
Sikh
Buddhist
Jewish
None
Aboriginal
-4.5% 0% 4.5% 9% 13.5% 18%Men Women
21
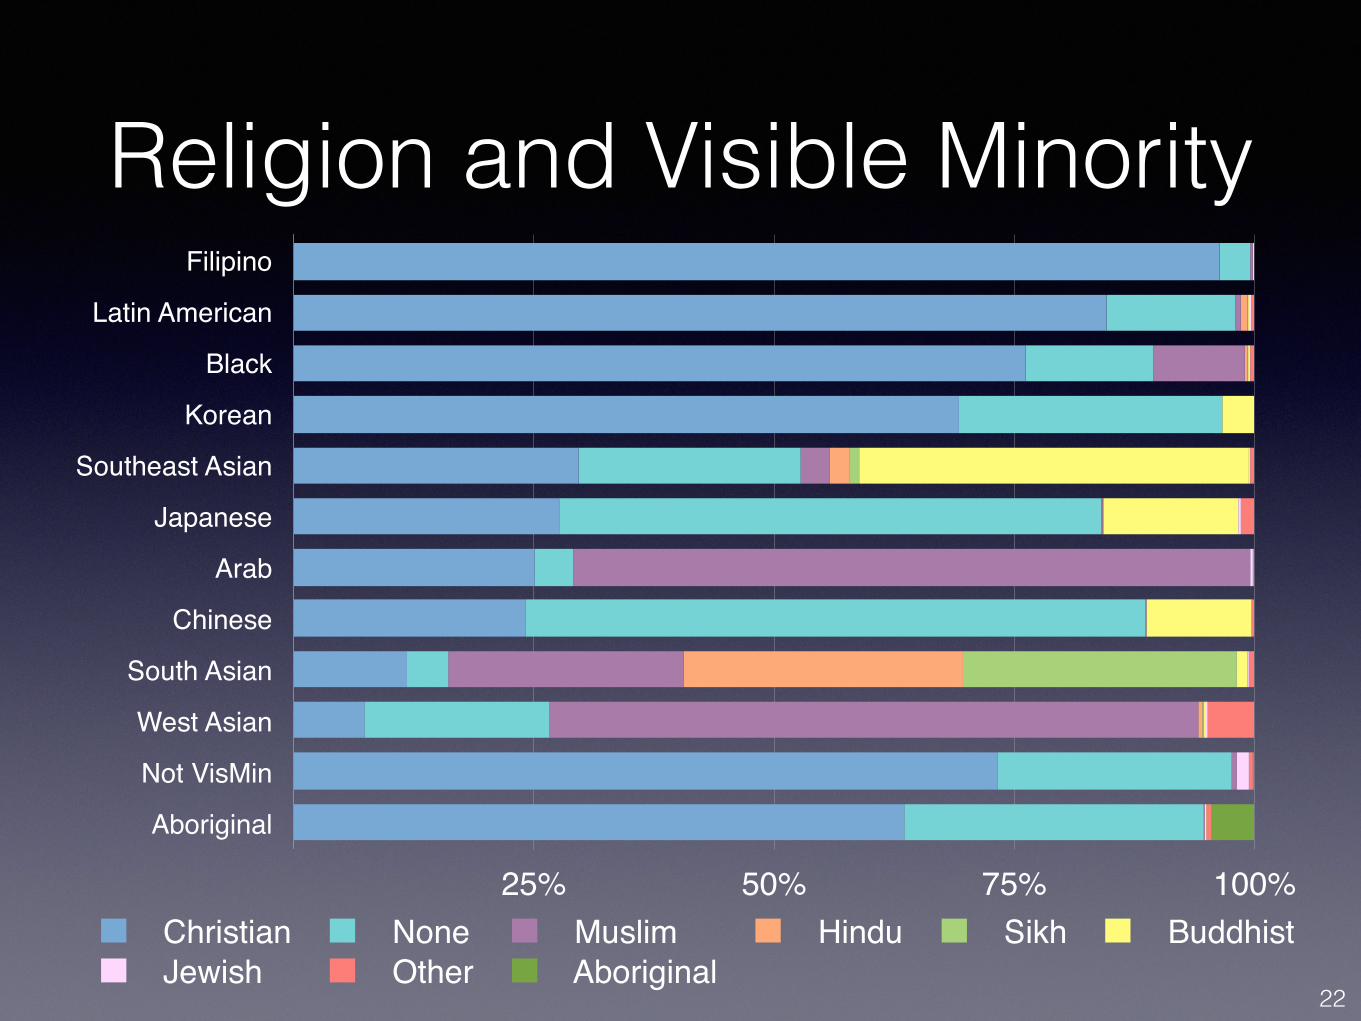
Religion and Visible Minority Filipino
Latin American
Black
Korean
Southeast Asian
Japanese
Arab
Chinese
South Asian
West Asian
Not VisMin
Aboriginal
25% 50% 75% 100% Christian None Muslim Hindu Sikh Buddhist Jewish Other Aboriginal
22
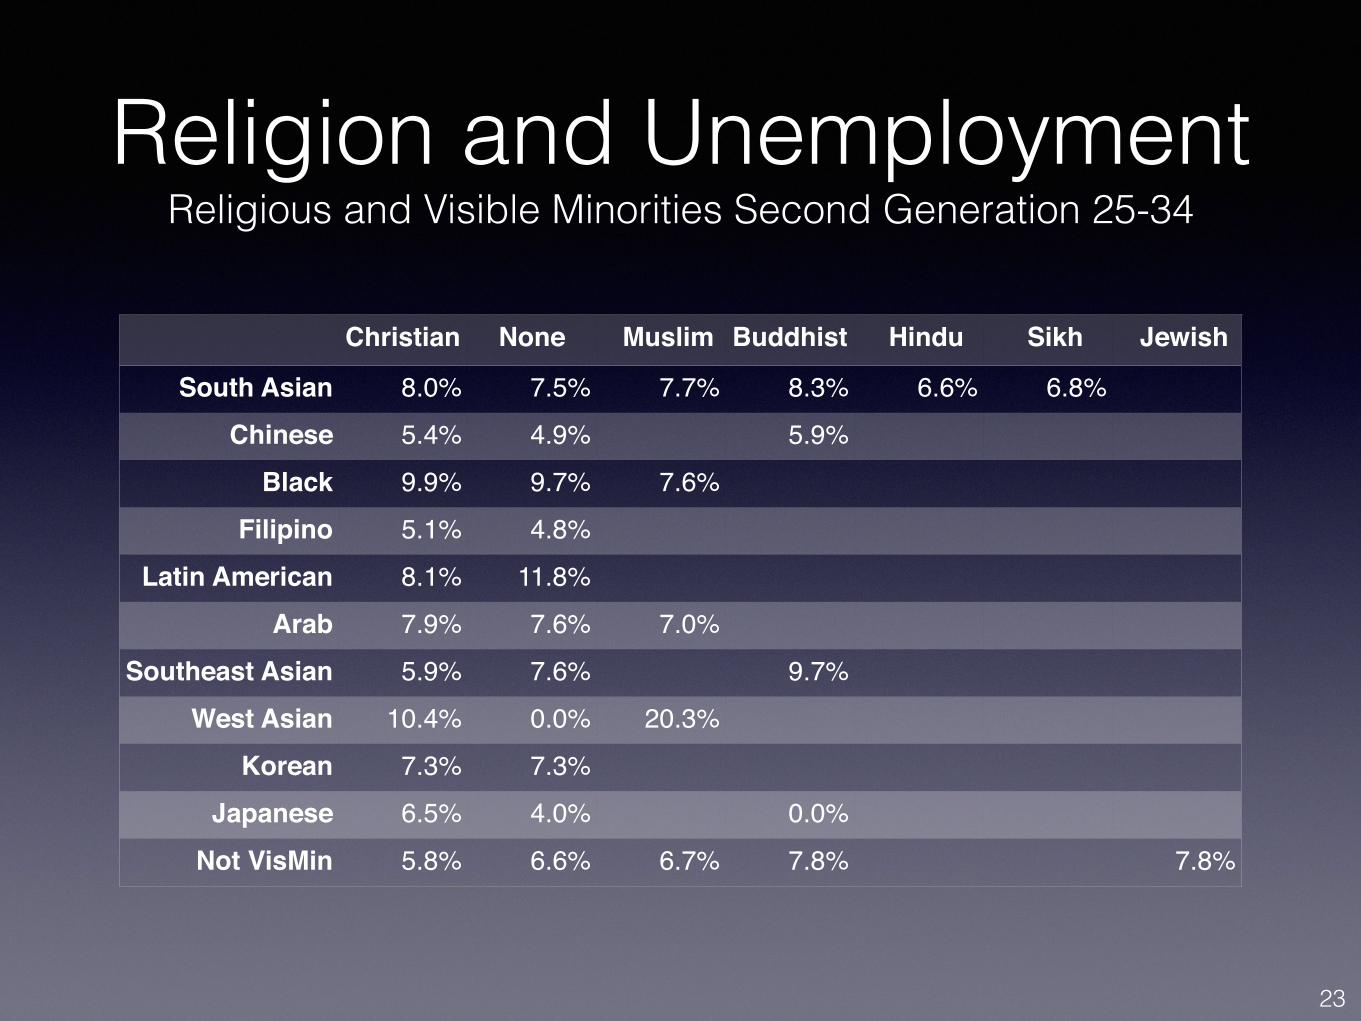
Religion and Unemployment Religious and Visible Minorities Second Generation 25-34
Christian None Muslim Buddhist Hindu Sikh Jewish
South Asian 8.0% 7.5% 7.7% 8.3% 6.6% 6.8%Chinese 5.4% 4.9% 5.9%
Black 9.9% 9.7% 7.6%Filipino 5.1% 4.8%
Latin American 8.1% 11.8%Arab 7.9% 7.6% 7.0%
Southeast Asian 5.9% 7.6% 9.7%West Asian 10.4% 0.0% 20.3%
Korean 7.3% 7.3%Japanese 6.5% 4.0% 0.0%
Not VisMin 5.8% 6.6% 6.7% 7.8% 7.8%
23
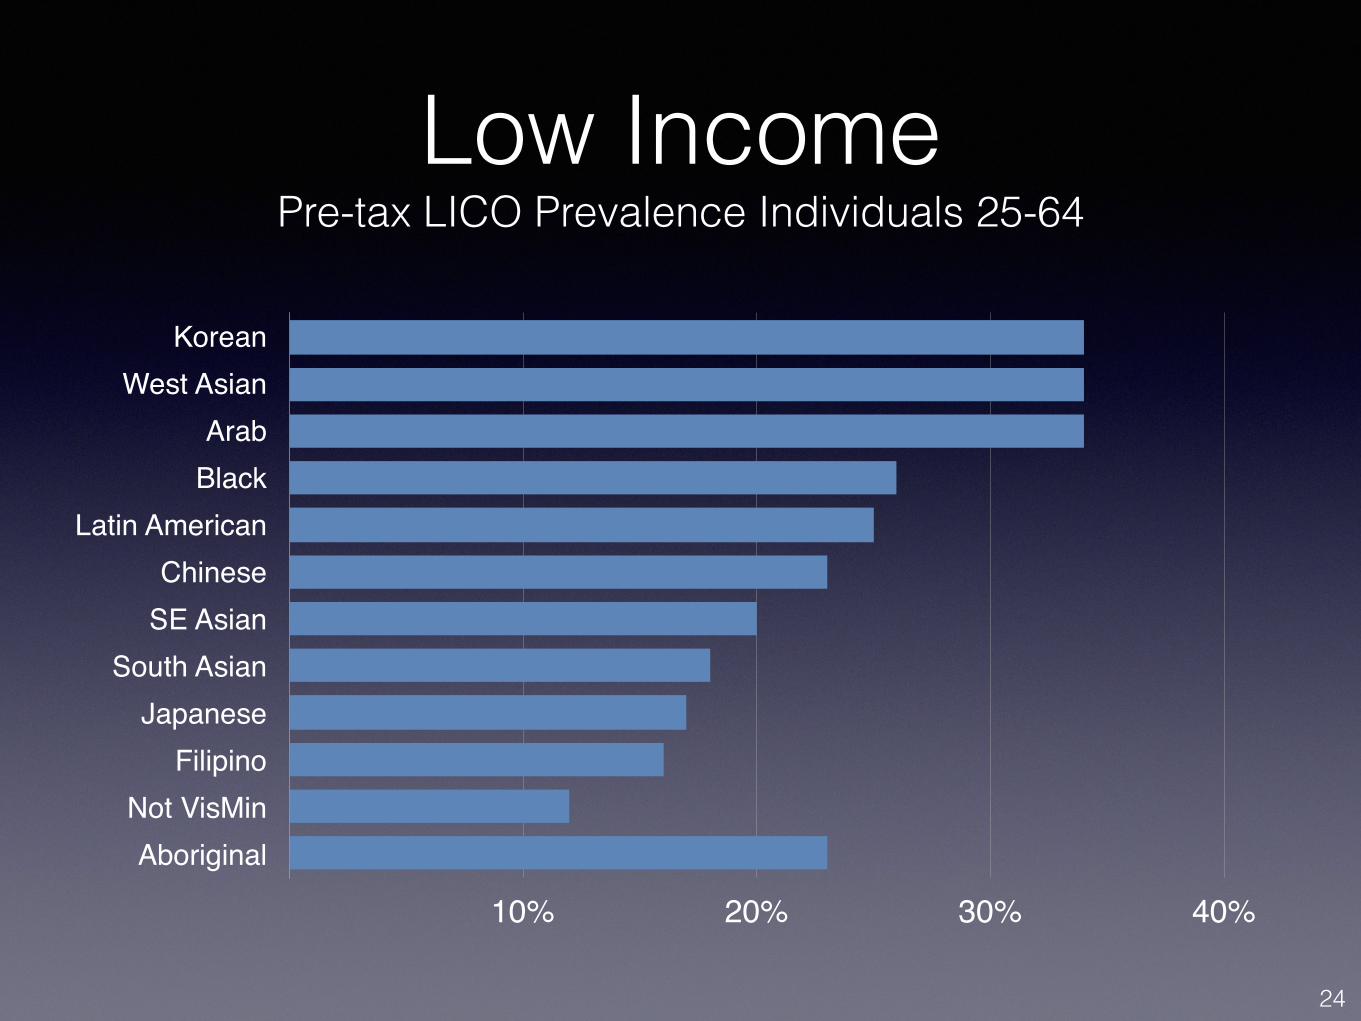
Low Income Pre-tax LICO Prevalence Individuals 25-64
KoreanWest Asian
ArabBlack
Latin AmericanChinese
SE AsianSouth Asian
JapaneseFilipino
Not VisMinAboriginal
10% 20% 30% 40%
24
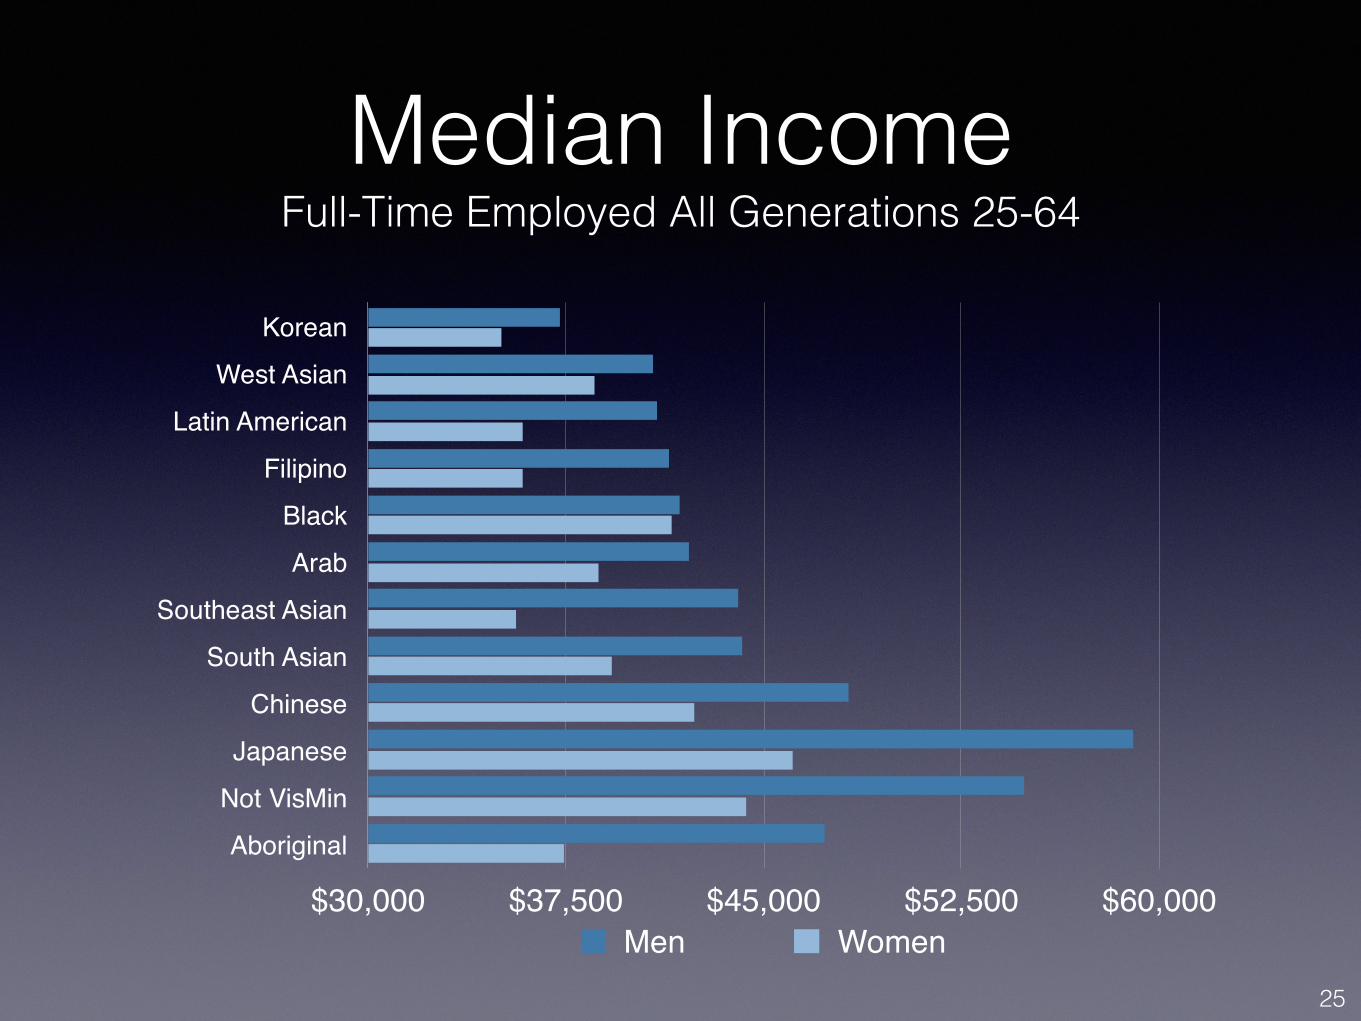
Median Income Full-Time Employed All Generations 25-64
Korean West Asian
Latin American Filipino
Black Arab
Southeast Asian South Asian
Chinese Japanese Not VisMin
Aboriginal
$30,000 $37,500 $45,000 $52,500 $60,000Men Women
25
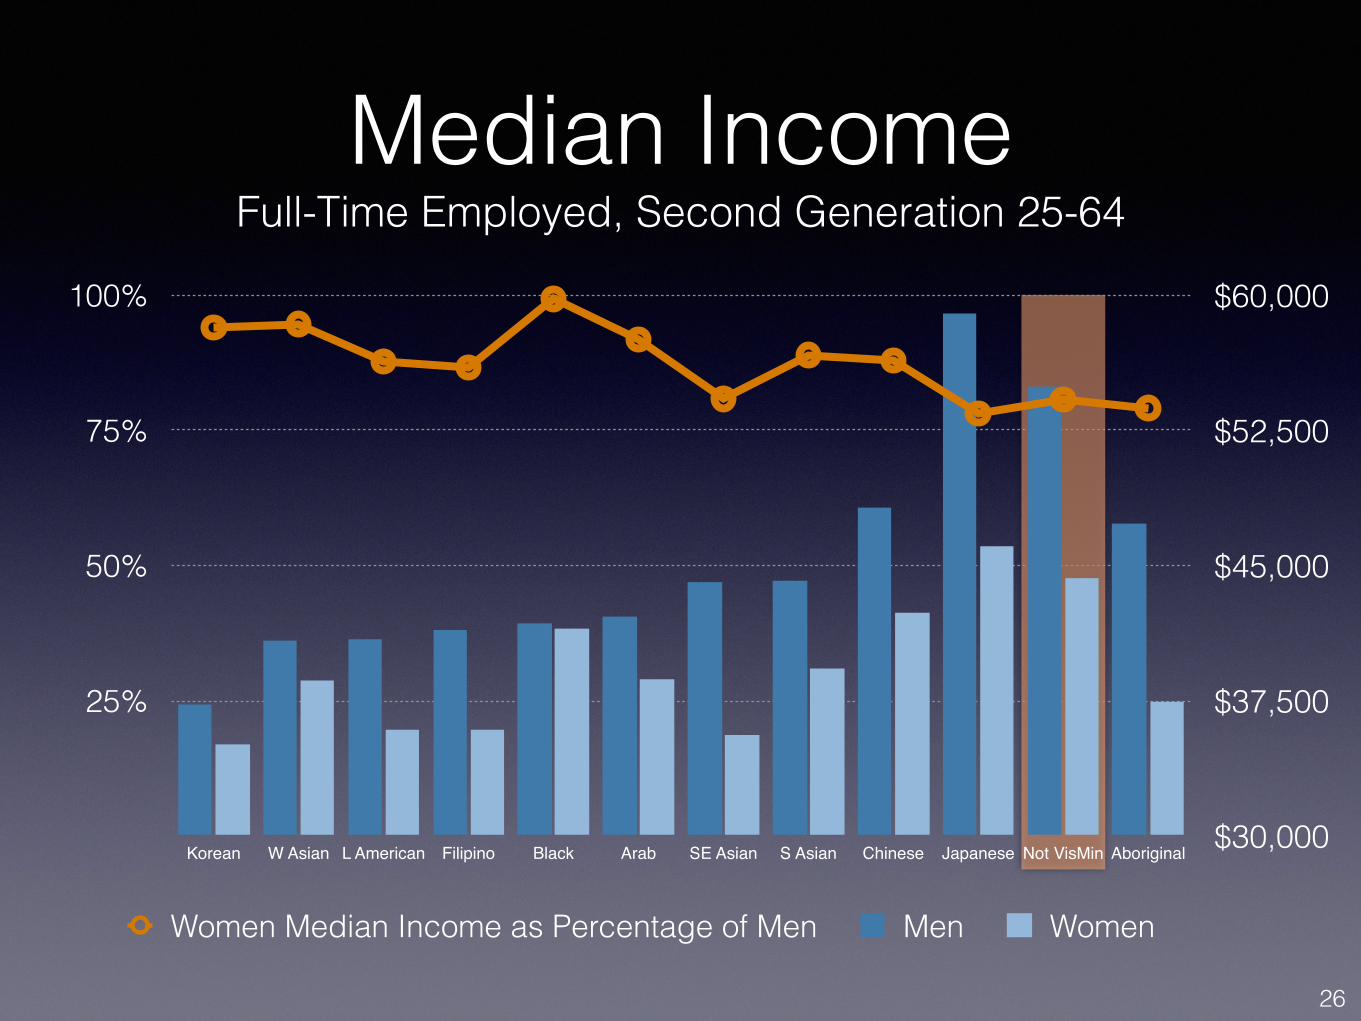
$30,000
$37,500
$45,000
$52,500
$60,000
25%
50%
75%
100%
Korean W Asian L American Filipino Black Arab SE Asian S Asian Chinese Japanese Not VisMin Aboriginal
Women Median Income as Percentage of Men Men Women
Median Income Full-Time Employed, Second Generation 25-64
26
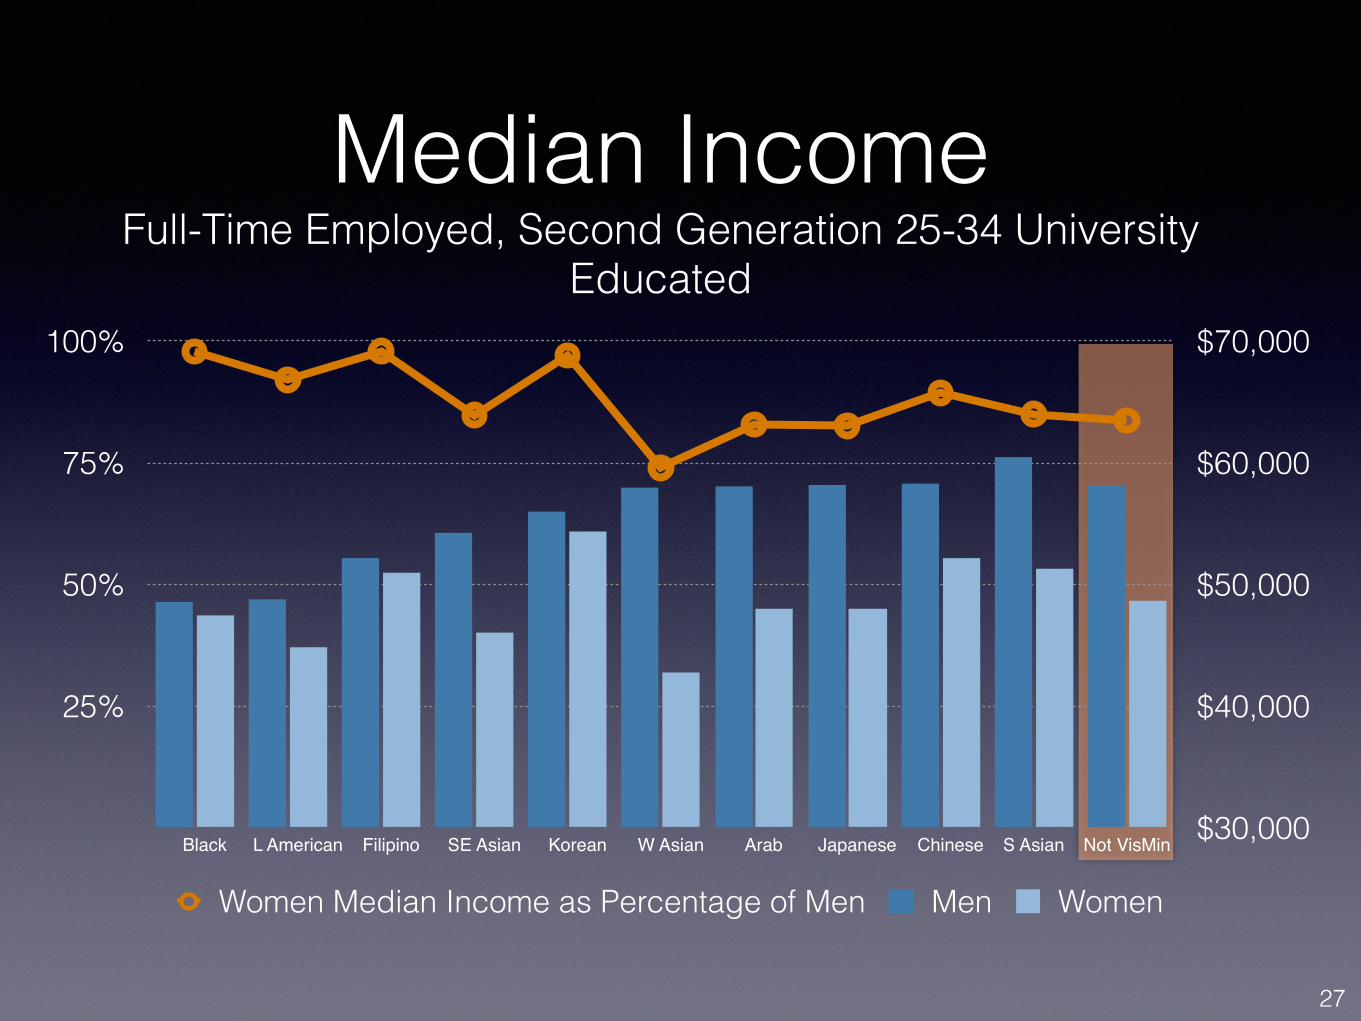
Median Income Full-Time Employed, Second Generation 25-34 University
Educated
$30,000
$40,000
$50,000
$60,000
$70,000
25%
50%
75%
100%
Black L American Filipino SE Asian Korean W Asian Arab Japanese Chinese S Asian Not VisMin
Women Median Income as Percentage of Men Men Women
27
Varied Social Picture
28

Education 25-64
Korean Arab
Chinese West Asian
Japanese Filipino
South Asian Latin American
Southeast Asian Black
Not VisMinAboriginal
25% 50% 75% 100%No certificate, diploma or degree High school diploma or equivalentPost-Secondary University Bachelors or Higher
29
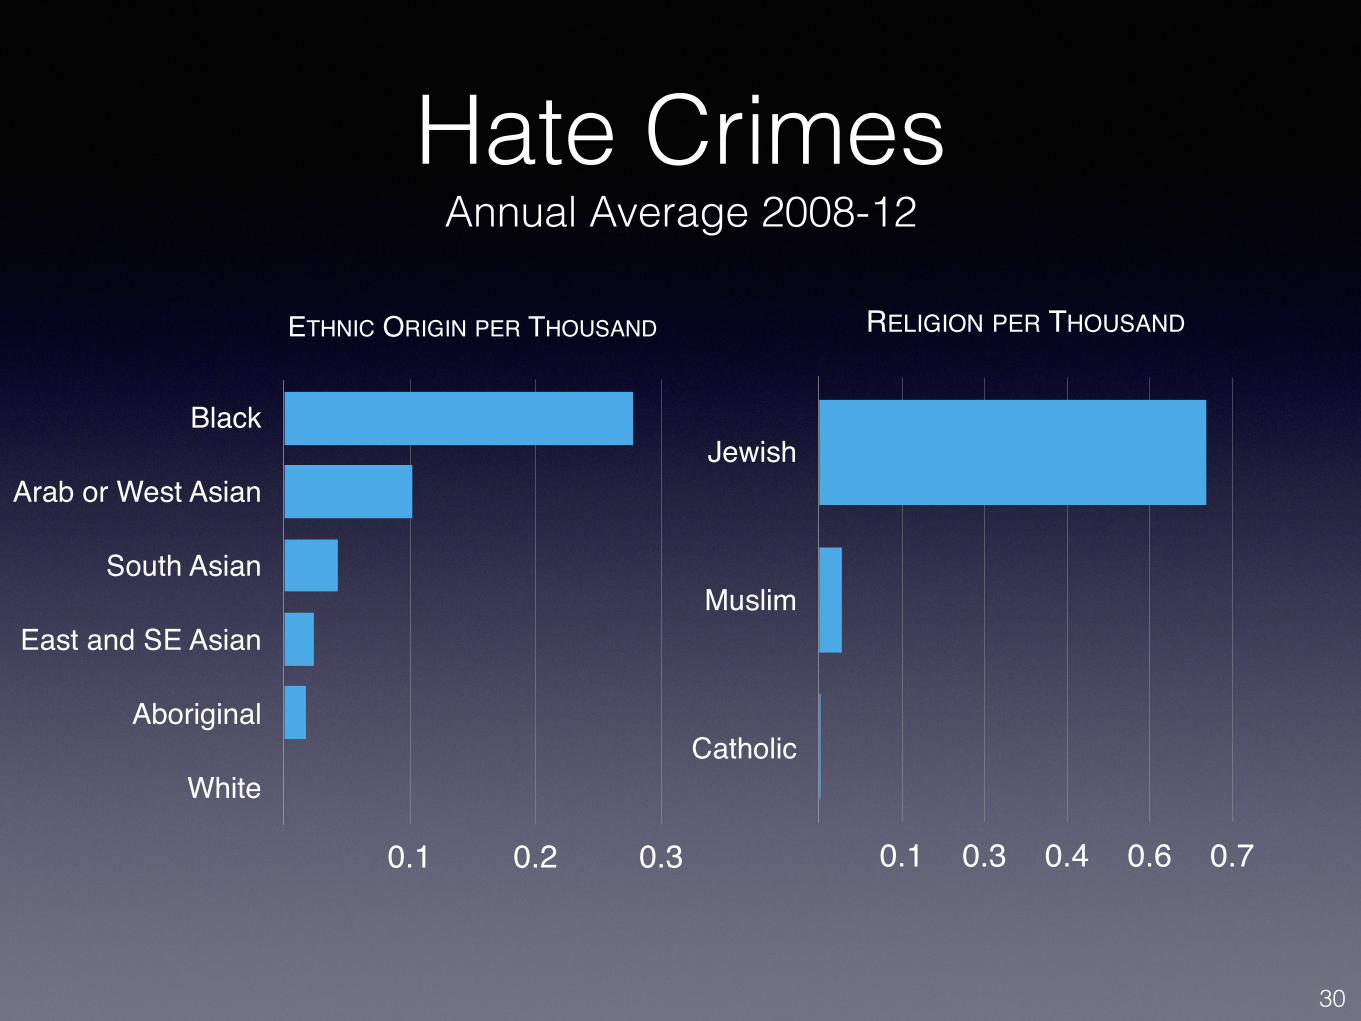
Hate Crimes Annual Average 2008-12
ETHNIC ORIGIN PER THOUSAND
Black
Arab or West Asian
South Asian
East and SE Asian
Aboriginal
White
0.1 0.2 0.3
RELIGION PER THOUSAND
Jewish
Muslim
Catholic
0.1 0.3 0.4 0.6 0.7
30
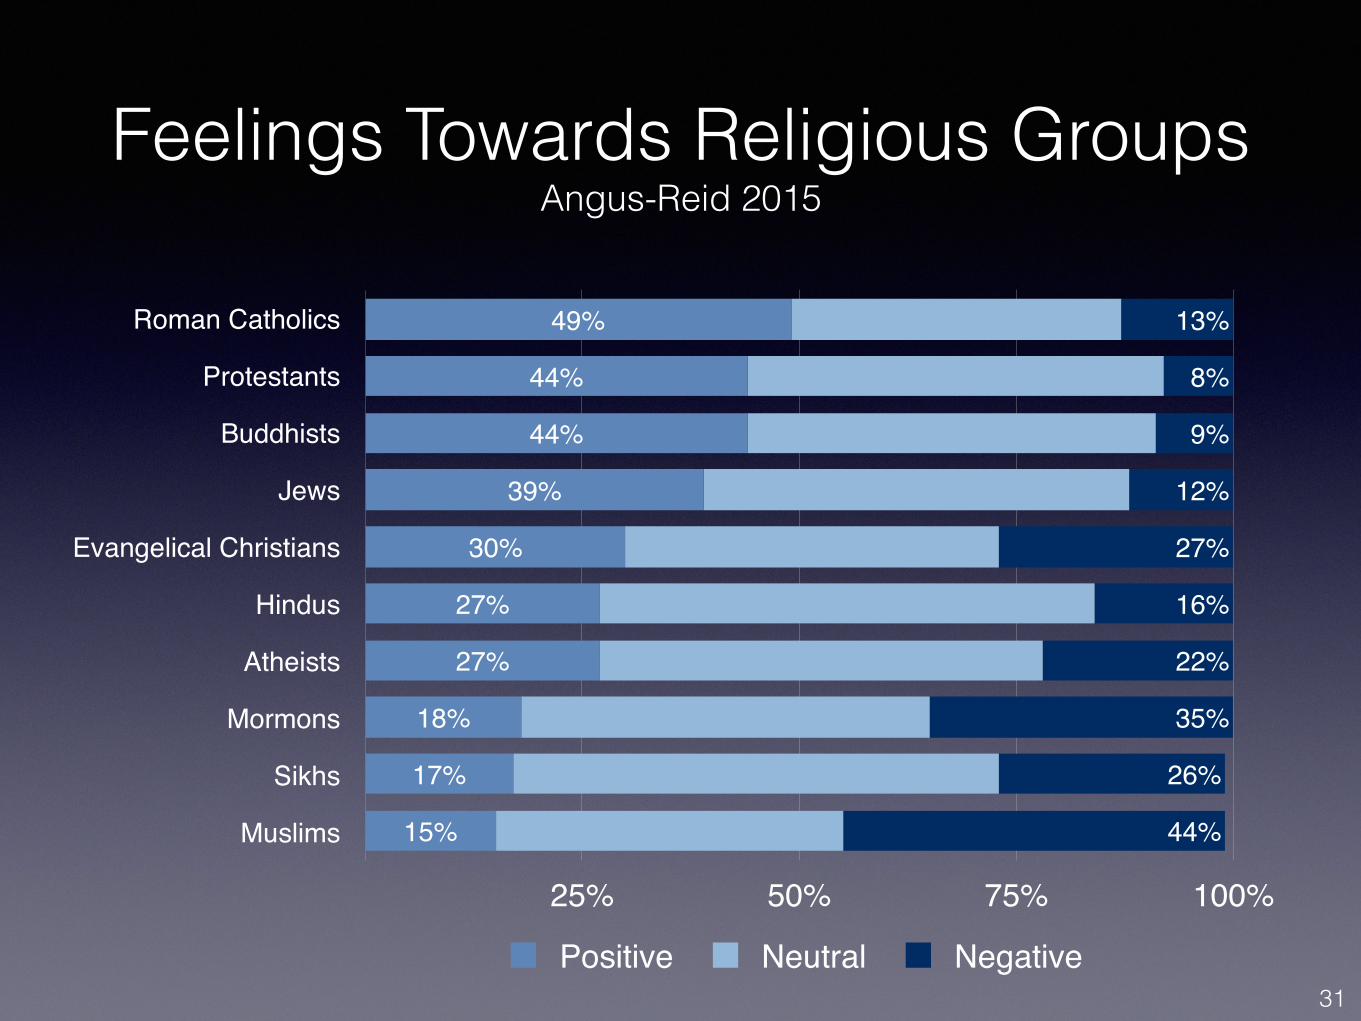
Feelings Towards Religious Groups Angus-Reid 2015
Roman Catholics
Protestants
Buddhists
Jews
Evangelical Christians
Hindus
Atheists
Mormons
Sikhs
Muslims
25% 50% 75% 100%
44%
26%
35%
22%
16%
27%
12%
9%
8%
13%
15%
17%
18%
27%
27%
30%
39%
44%
44%
49%
Positive Neutral Negative 31
Bias and Discrimination Blind CV Test
• Having a foreign sounding name means 40% fewer interviews (Oreopoulos 2009, 2011)
• Assumed to be immigrants, not second generation
• “I personally am guilty of gravitating toward Anglo names on résumés, and I believe that it’s a very human condition – [a result of]resistance to change.” (HR Staffing Officer)
• RBC/EY Report — Outsmarting our brains: Overcoming hidden biases to harness diversity’s true potential
• Implicit Association Test - Sobering realization of bias
32
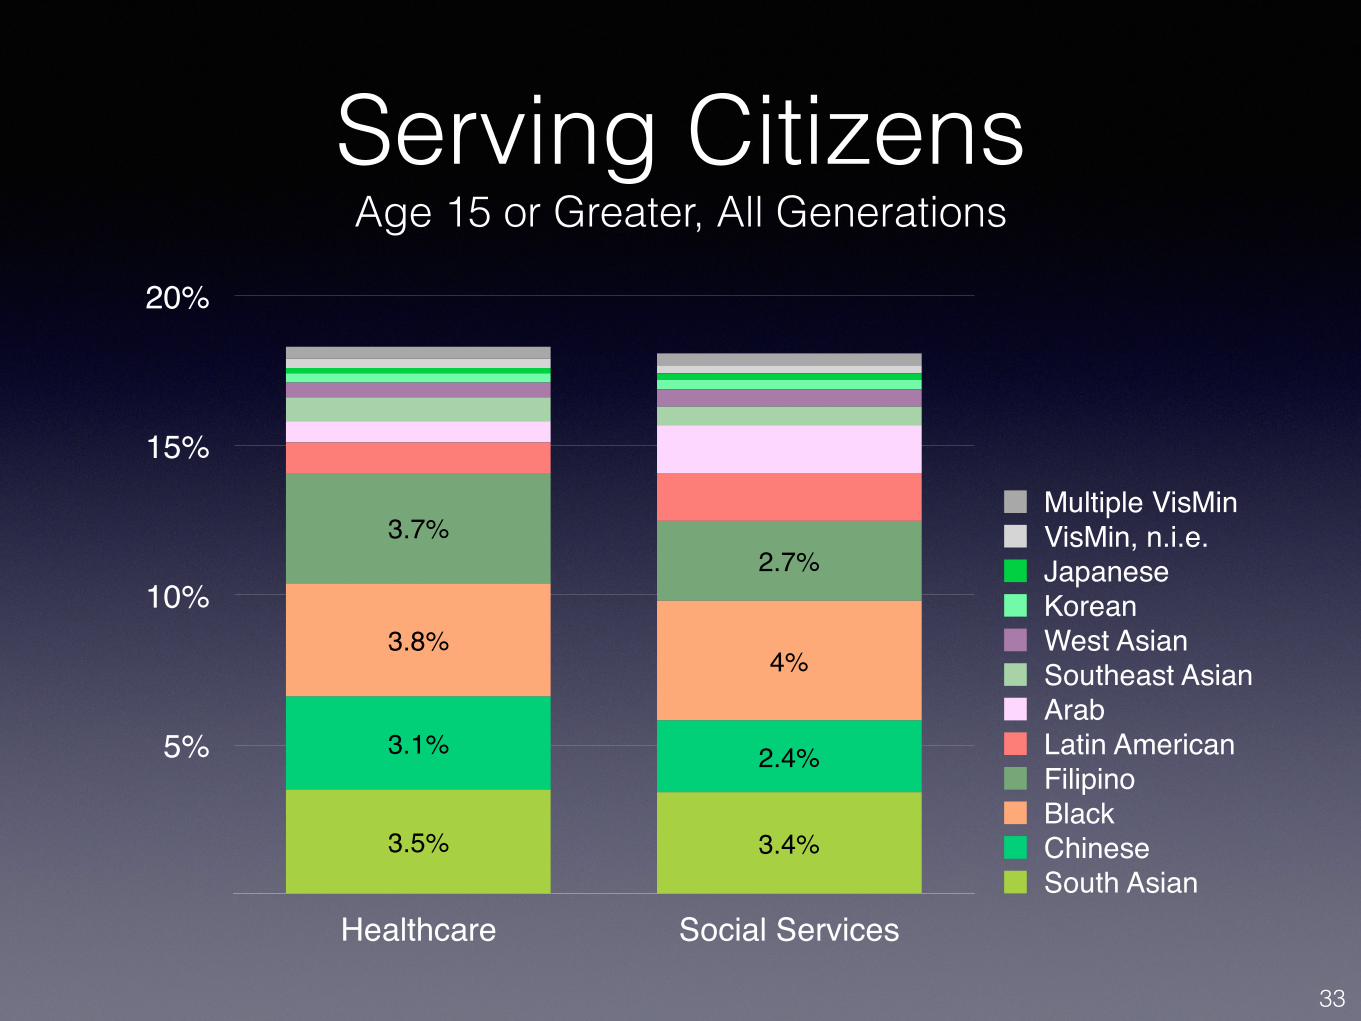
Serving Citizens Age 15 or Greater, All Generations
5%
10%
15%
20%
Healthcare Social Services
2.7%3.7%
4%3.8%
2.4%3.1%
3.4%3.5%South AsianChineseBlackFilipinoLatin AmericanArabSoutheast AsianWest AsianKoreanJapaneseVisMin, n.i.e.Multiple VisMin
33
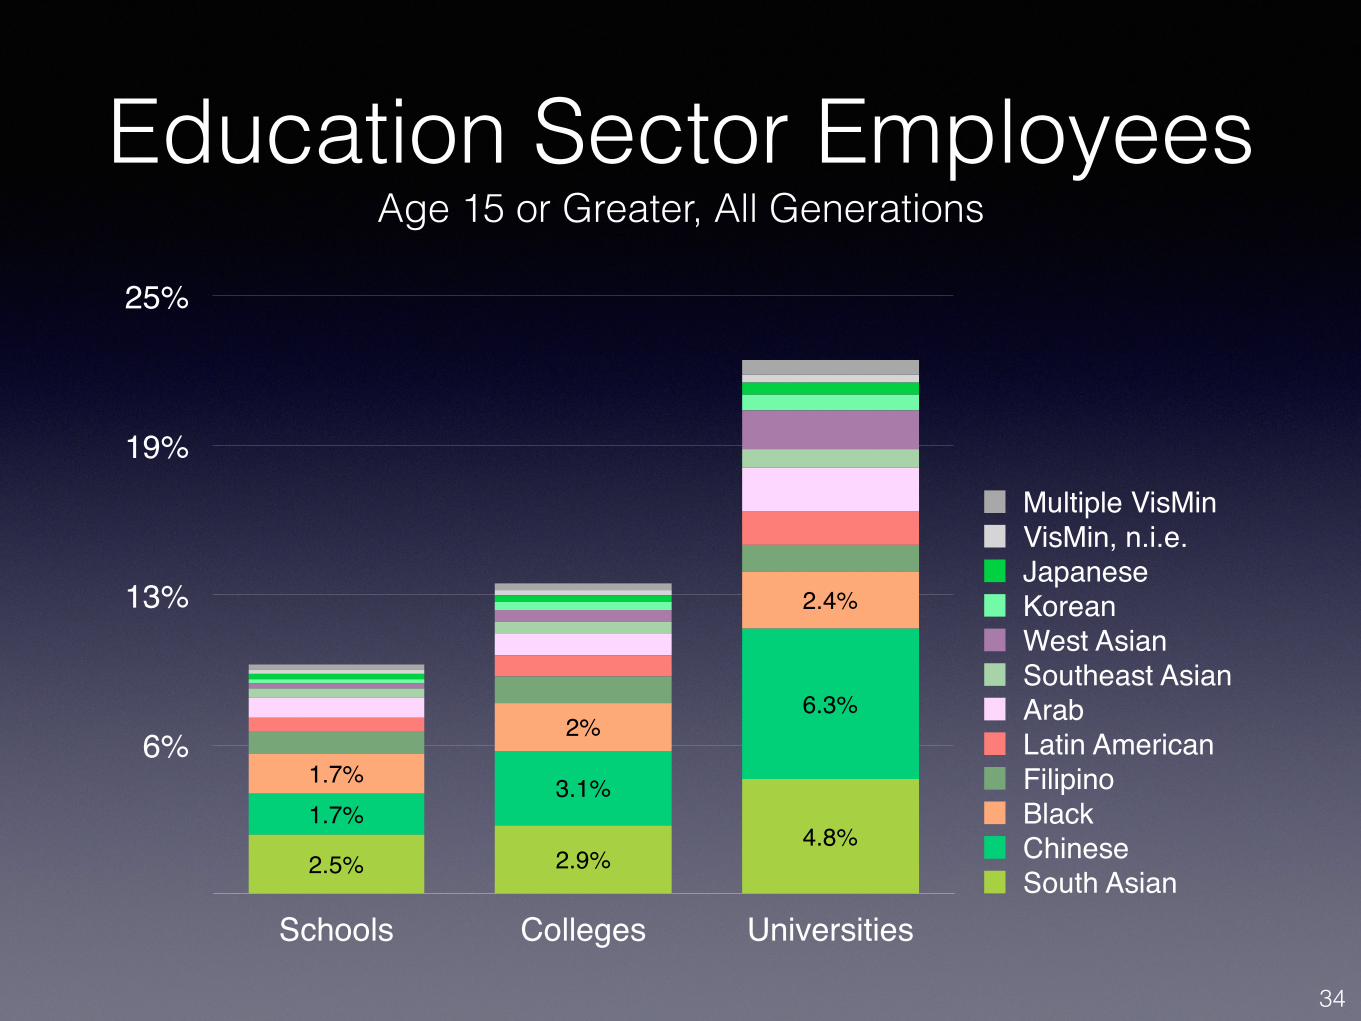
Education Sector Employees Age 15 or Greater, All Generations
6%
13%
19%
25%
Schools Colleges Universities
2.4%
2%
1.7%
6.3%
3.1%1.7%
4.8%2.9%2.5% South Asian
ChineseBlackFilipinoLatin AmericanArabSoutheast AsianWest AsianKoreanJapaneseVisMin, n.i.e.Multiple VisMin
34
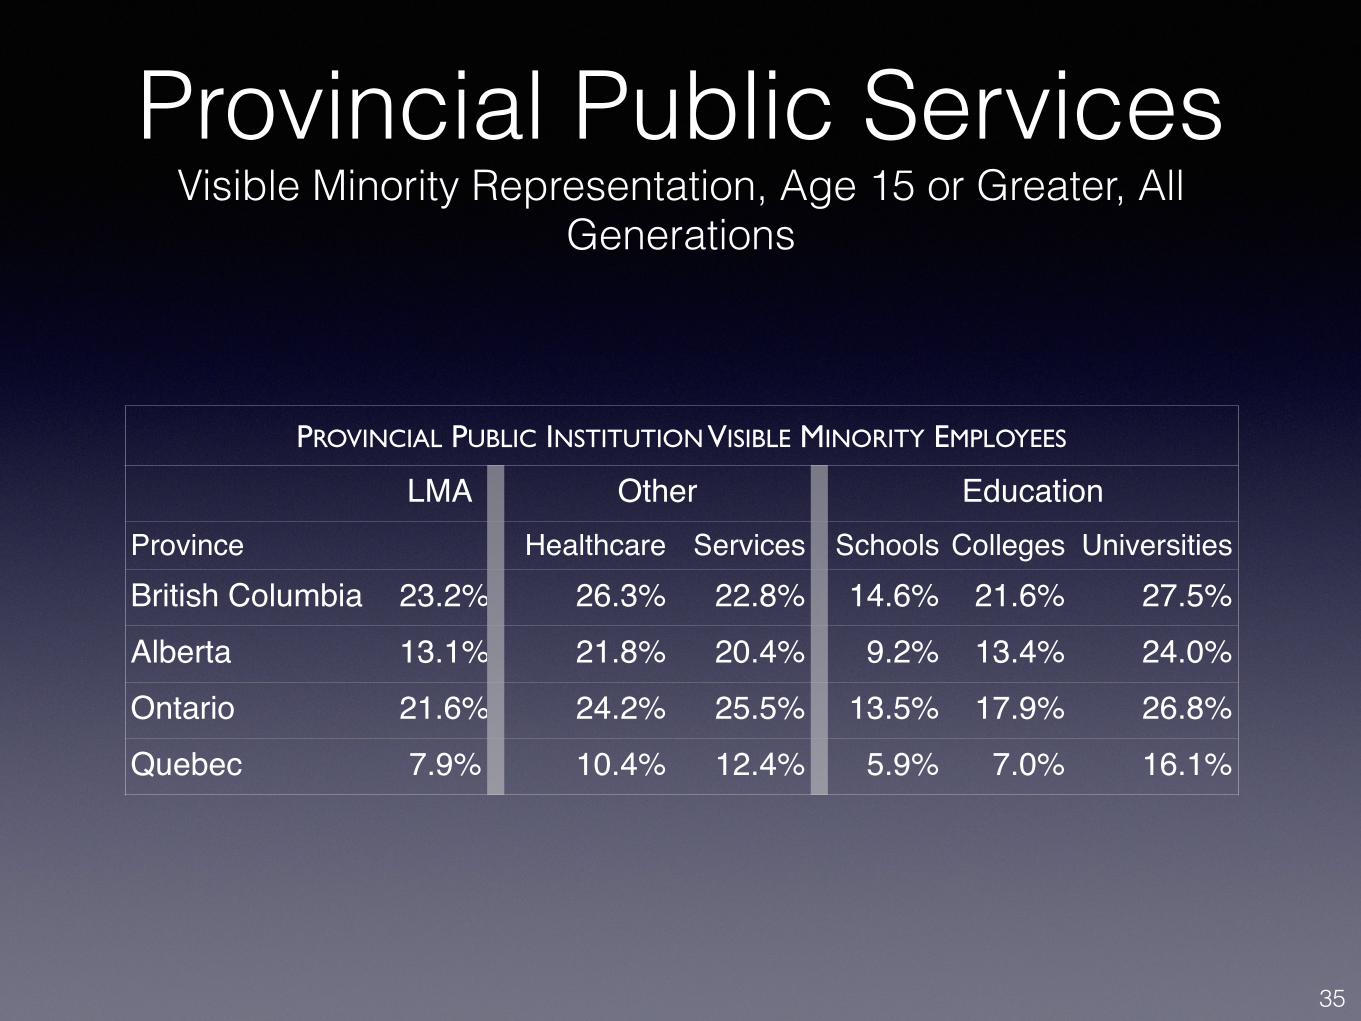
Provincial Public Services Visible Minority Representation, Age 15 or Greater, All
Generations
PROVINCIAL PUBLIC INSTITUTION VISIBLE MINORITY EMPLOYEES
LMA Other EducationProvince Healthcare Services Schools Colleges UniversitiesBritish Columbia 23.2% 26.3% 22.8% 14.6% 21.6% 27.5%Alberta 13.1% 21.8% 20.4% 9.2% 13.4% 24.0%Ontario 21.6% 24.2% 25.5% 13.5% 17.9% 26.8%Quebec 7.9% 10.4% 12.4% 5.9% 7.0% 16.1%
35
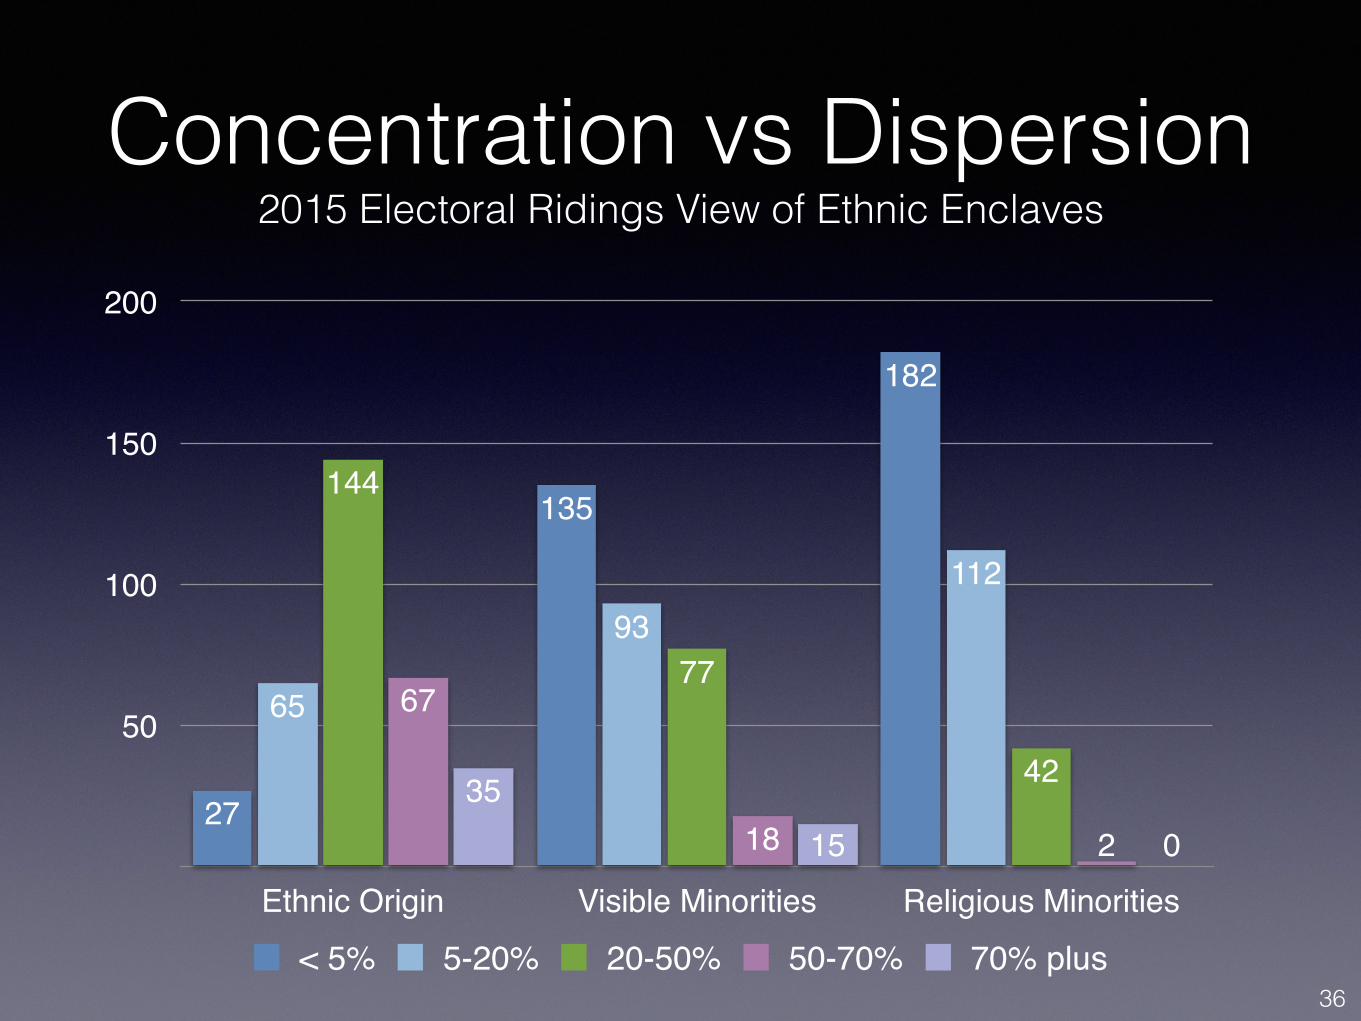
Concentration vs Dispersion 2015 Electoral Ridings View of Ethnic Enclaves
50
100
150
200
Ethnic Origin Visible Minorities Religious Minorities015
35218
67
42
77
144
11293
65
182
135
27
< 5% 5-20% 20-50% 50-70% 70% plus36
Declining Citizenship and Plateauing Political
Representation
37
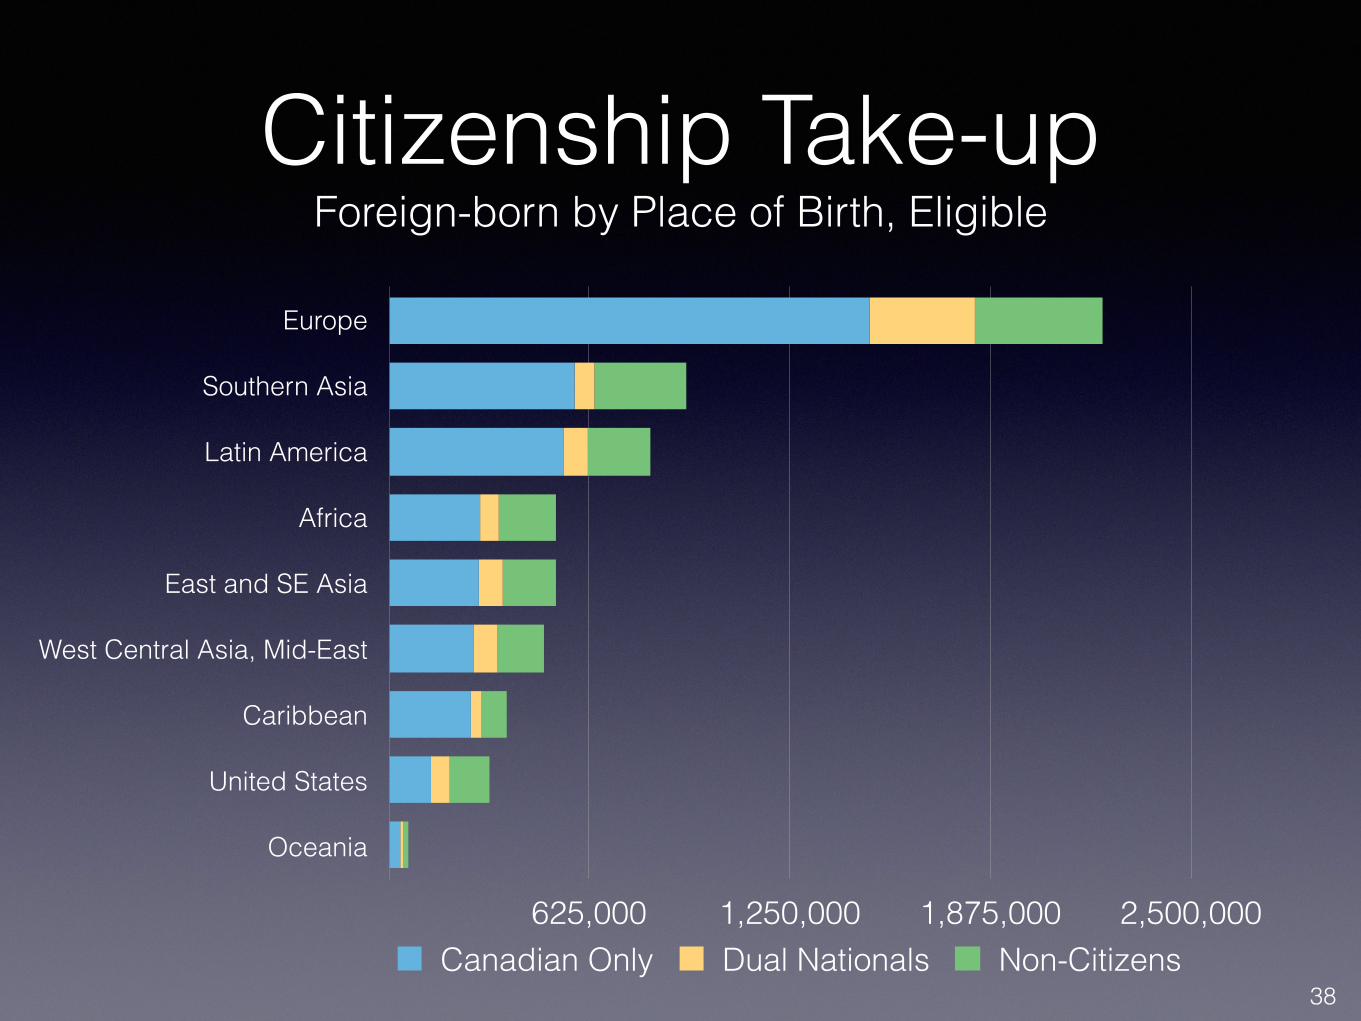
Citizenship Take-up Foreign-born by Place of Birth, Eligible
38
Europe
Southern Asia
Latin America
Africa
East and SE Asia
West Central Asia, Mid-East
Caribbean
United States
Oceania
625,000 1,250,000 1,875,000 2,500,000Canadian Only Dual Nationals Non-Citizens
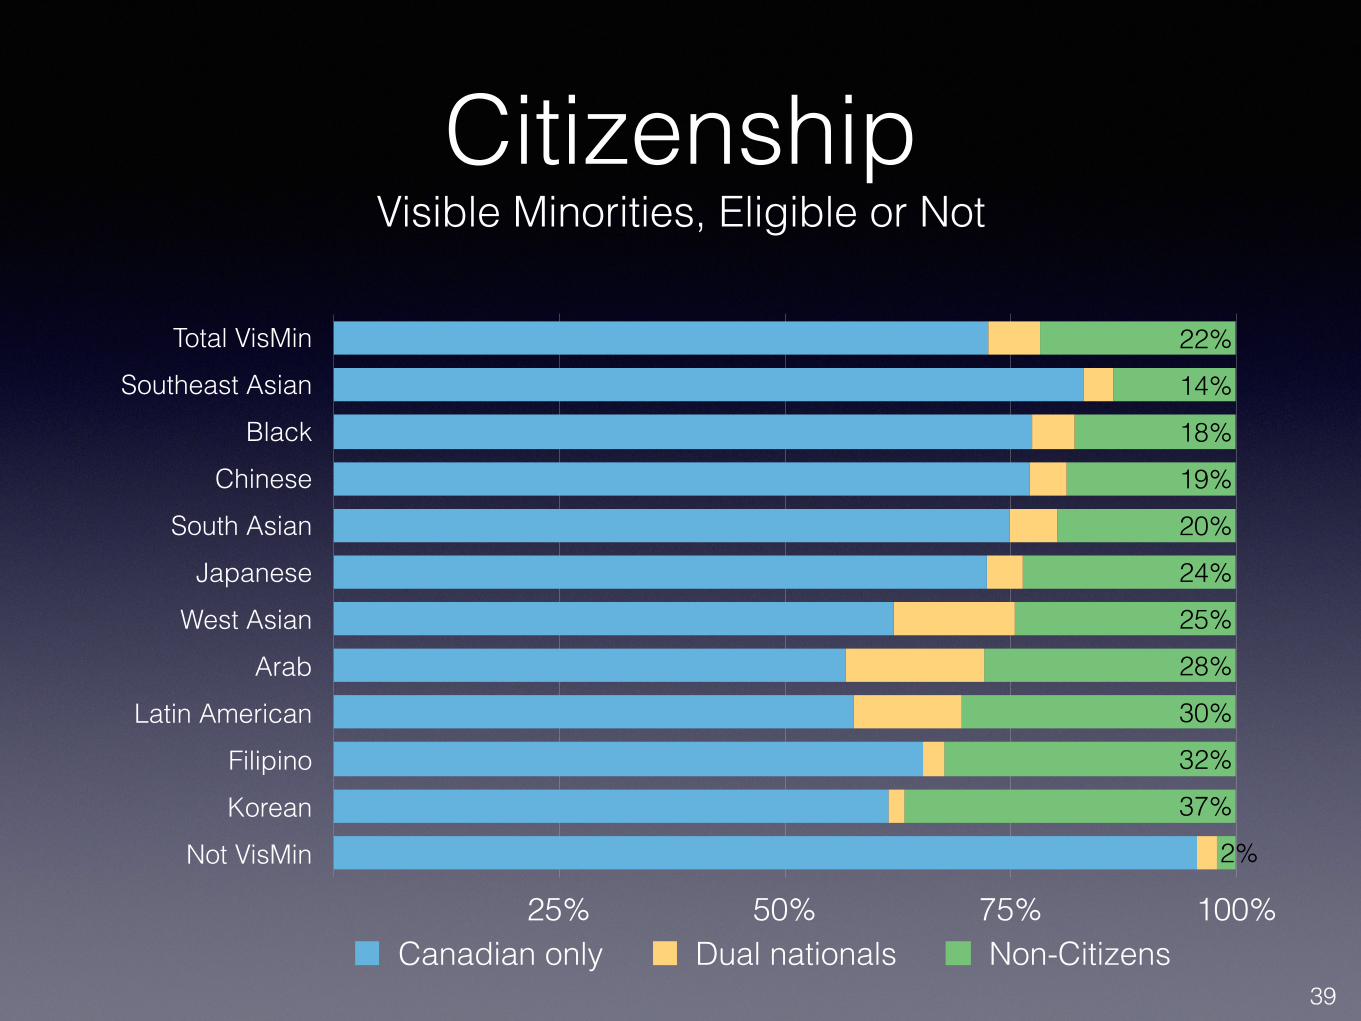
Citizenship Visible Minorities, Eligible or Not
39
Total VisMin Southeast Asian
BlackChinese
South AsianJapanese
West AsianArab
Latin AmericanFilipinoKorean
Not VisMin
25% 50% 75% 100%
2%37%32%30%28%25%24%20%19%18%14%22%
Canadian only Dual nationals Non-Citizens
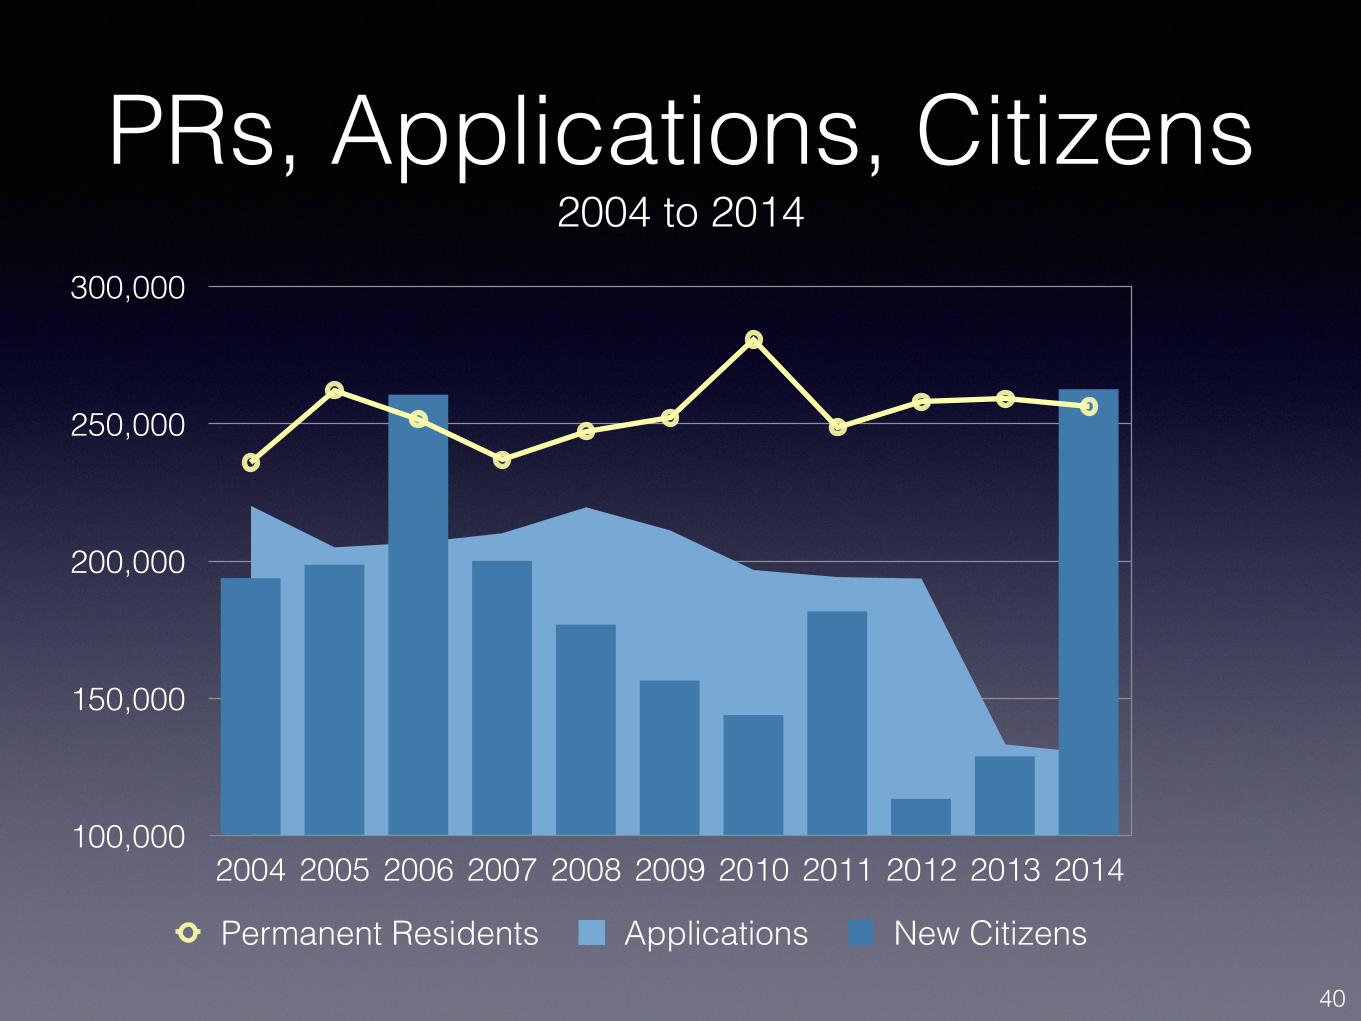
PRs, Applications, Citizens 2004 to 2014
40
100,000
150,000
200,000
250,000
300,000
2004 2005 2006 2007 2008 2009 2010 2011 2012 2013 2014
Permanent Residents Applications New Citizens
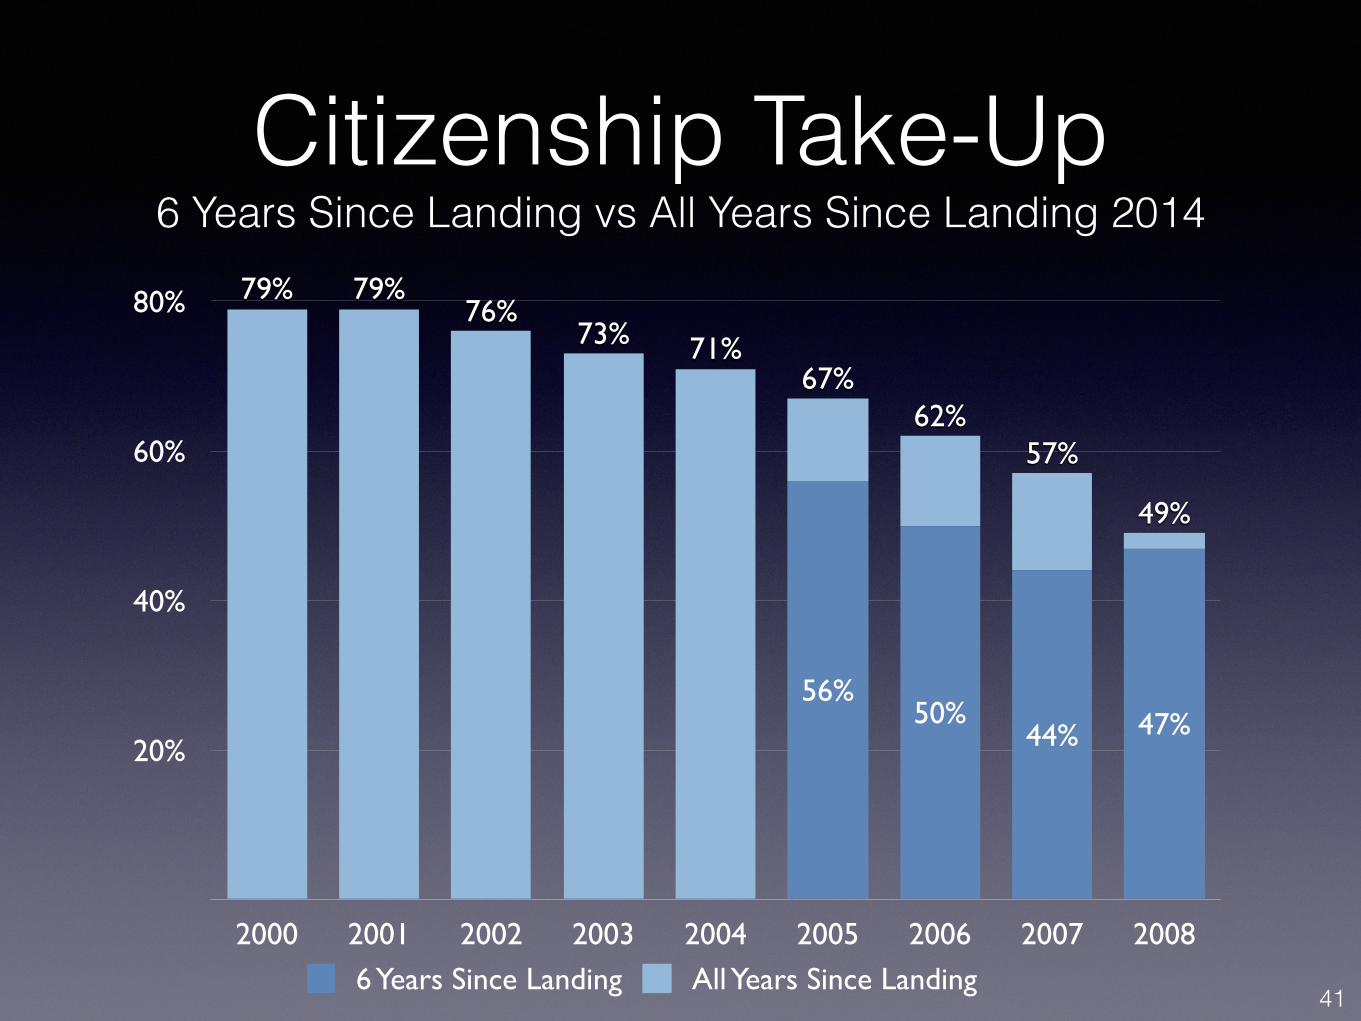
Citizenship Take-Up 6 Years Since Landing vs All Years Since Landing 2014
20%
40%
60%
80%
2000 2001 2002 2003 2004 2005 2006 2007 2008
49%
57%62%
67%71%73%
76%79%79%
47%44%50%
56%
6 Years Since Landing All Years Since Landing41
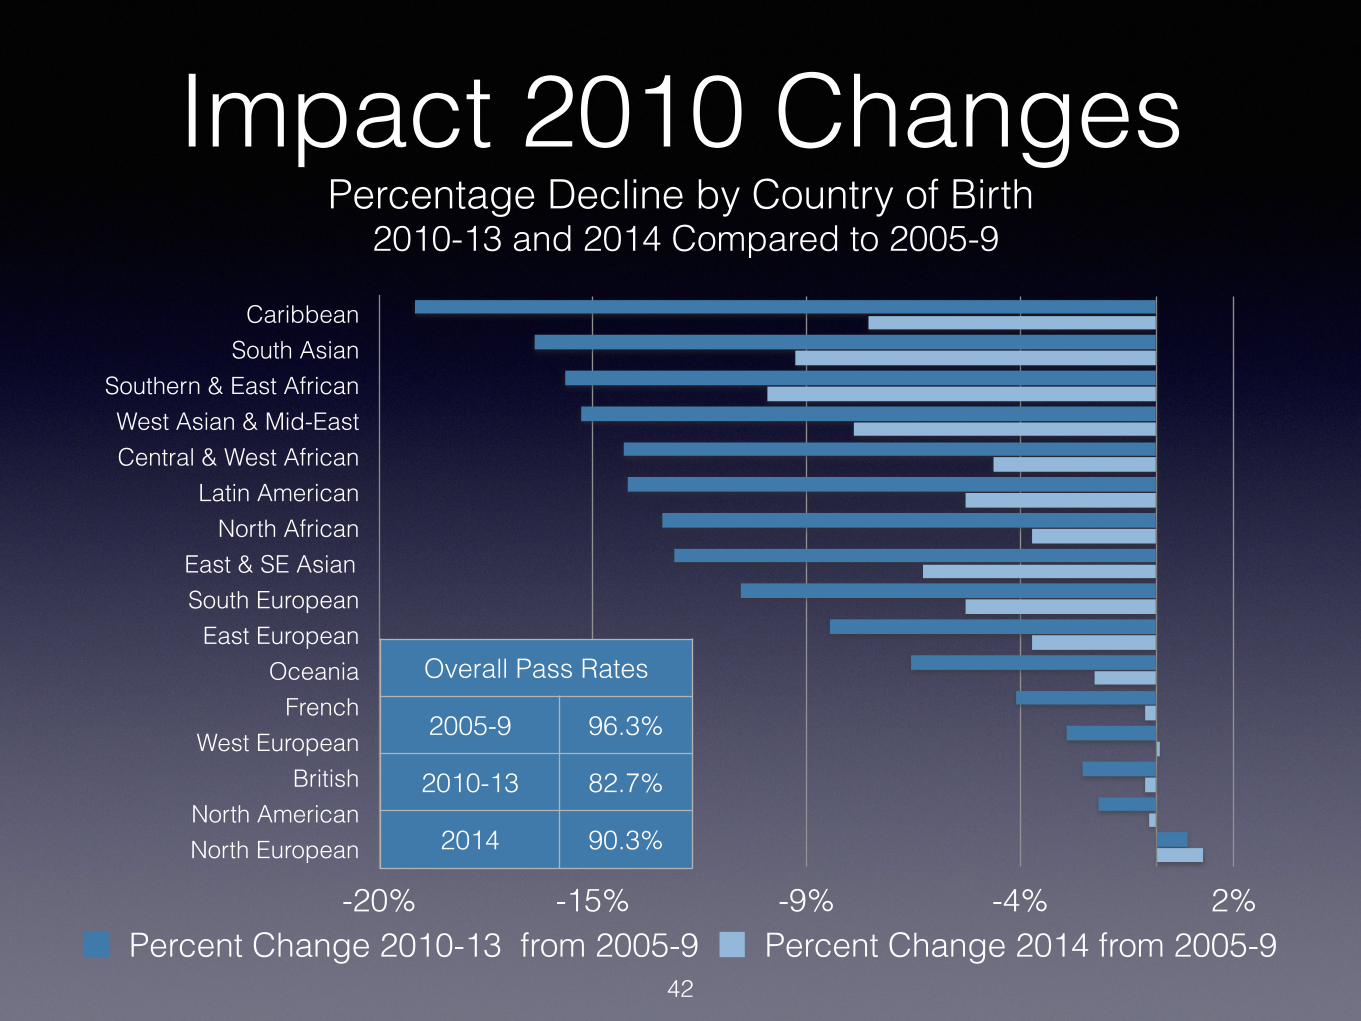
Impact 2010 Changes Percentage Decline by Country of Birth
2010-13 and 2014 Compared to 2005-9
CaribbeanSouth Asian
Southern & East AfricanWest Asian & Mid-EastCentral & West African
Latin AmericanNorth African
East & SE Asian South European
East EuropeanOceania
FrenchWest European
BritishNorth AmericanNorth European
-20% -15% -9% -4% 2%Percent Change 2010-13 from 2005-9 Percent Change 2014 from 2005-9
42
Overall Pass Rates
2005-9 96.3%
2010-13 82.7%
2014 90.3%
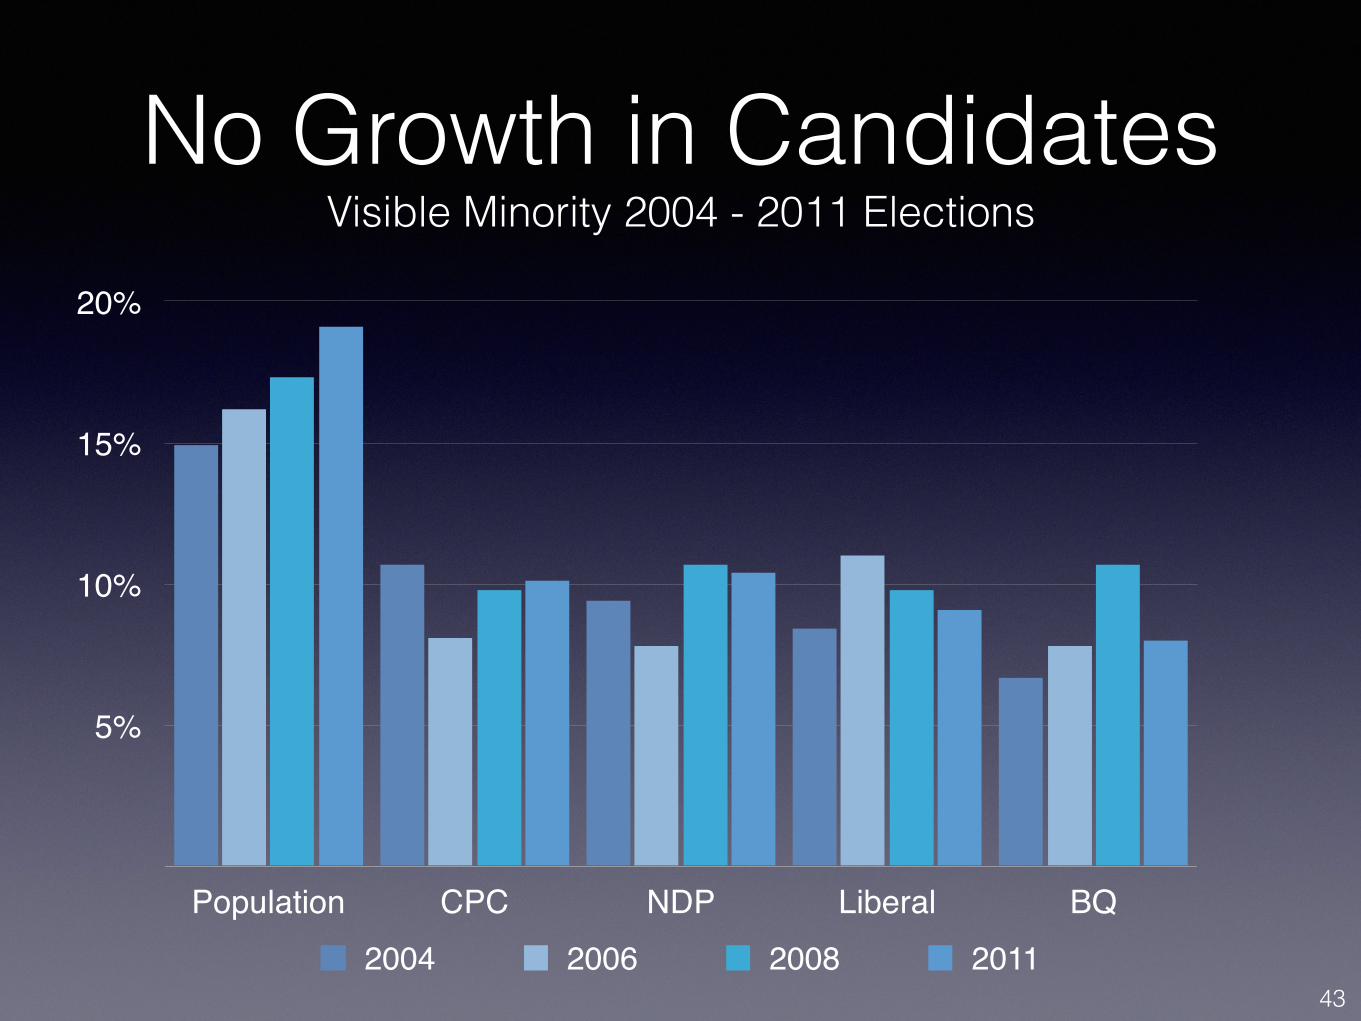
No Growth in Candidates Visible Minority 2004 - 2011 Elections
5%
10%
15%
20%
Population CPC NDP Liberal BQ2004 2006 2008 2011
43
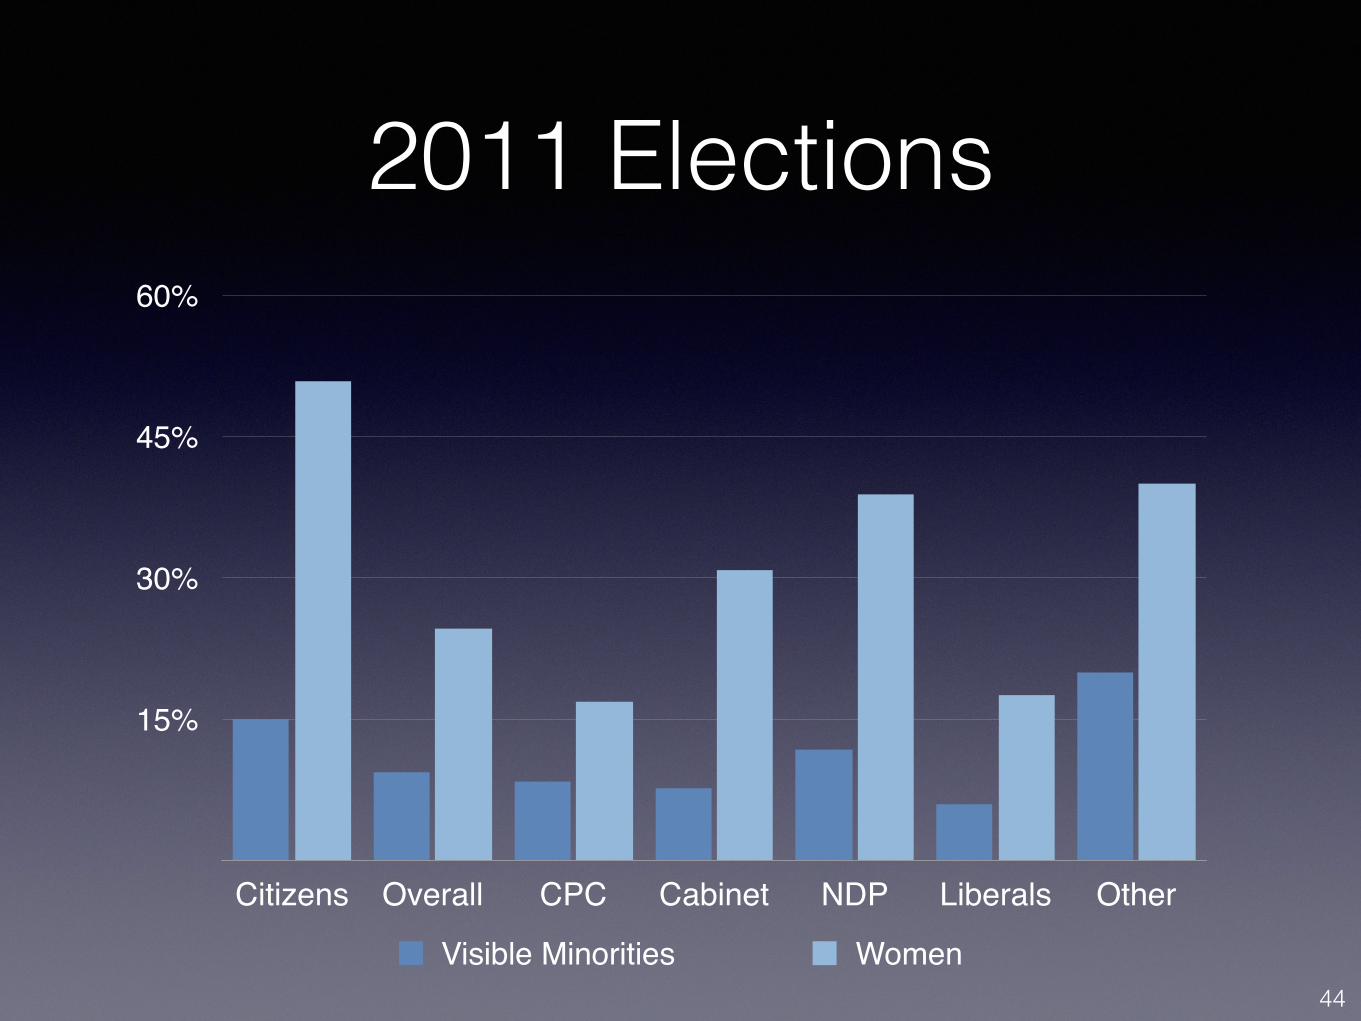
15%
30%
45%
60%
Citizens Overall CPC Cabinet NDP Liberals Other
Visible Minorities Women44
2011 Elections
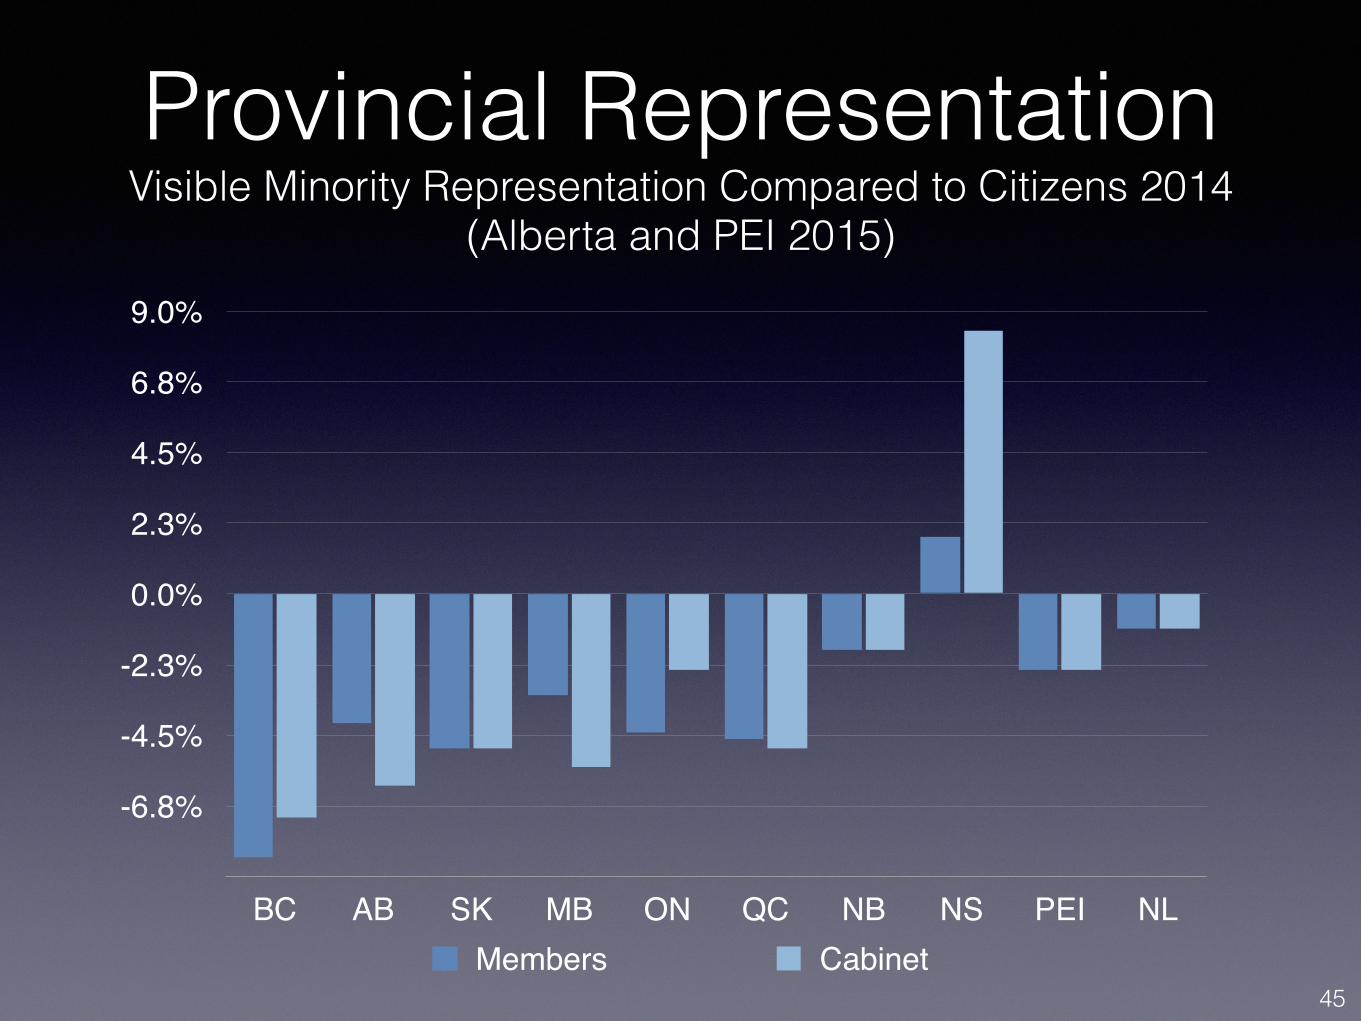
Provincial Representation Visible Minority Representation Compared to Citizens 2014
(Alberta and PEI 2015)
-6.8%
-4.5%
-2.3%
0.0%
2.3%
4.5%
6.8%
9.0%
BC AB SK MB ON QC NB NS PEI NLMembers Cabinet
45
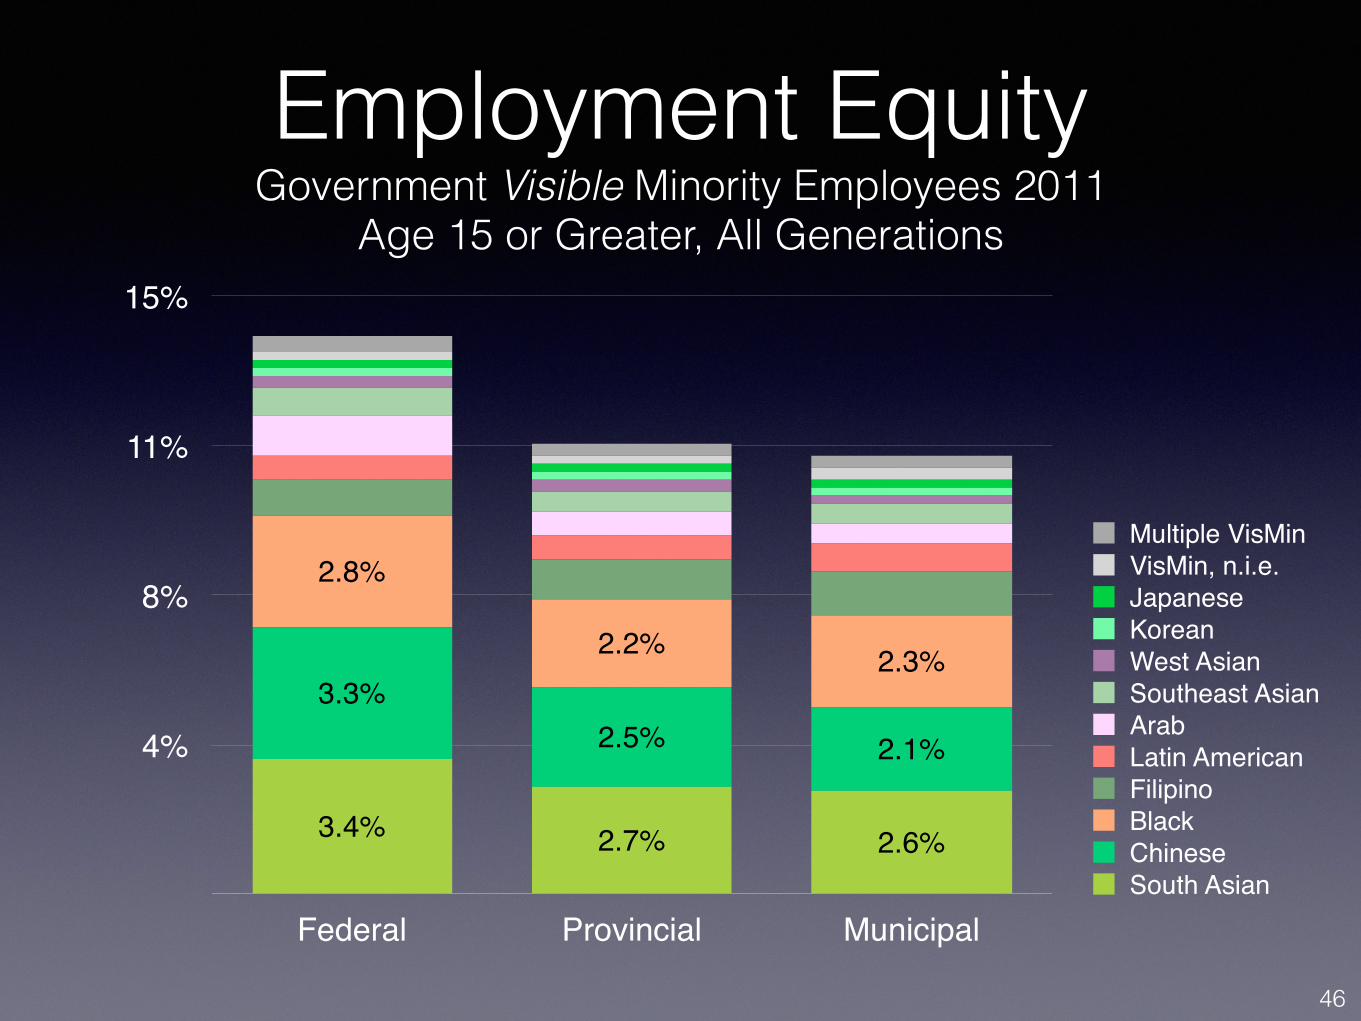
Employment Equity Government Visible Minority Employees 2011
Age 15 or Greater, All Generations
4%
8%
11%
15%
Federal Provincial Municipal
2.3%2.2%
2.8%
2.1%2.5%3.3%
2.6%2.7%3.4%
South AsianChineseBlackFilipinoLatin AmericanArabSoutheast AsianWest AsianKoreanJapaneseVisMin, n.i.e.Multiple VisMin
46
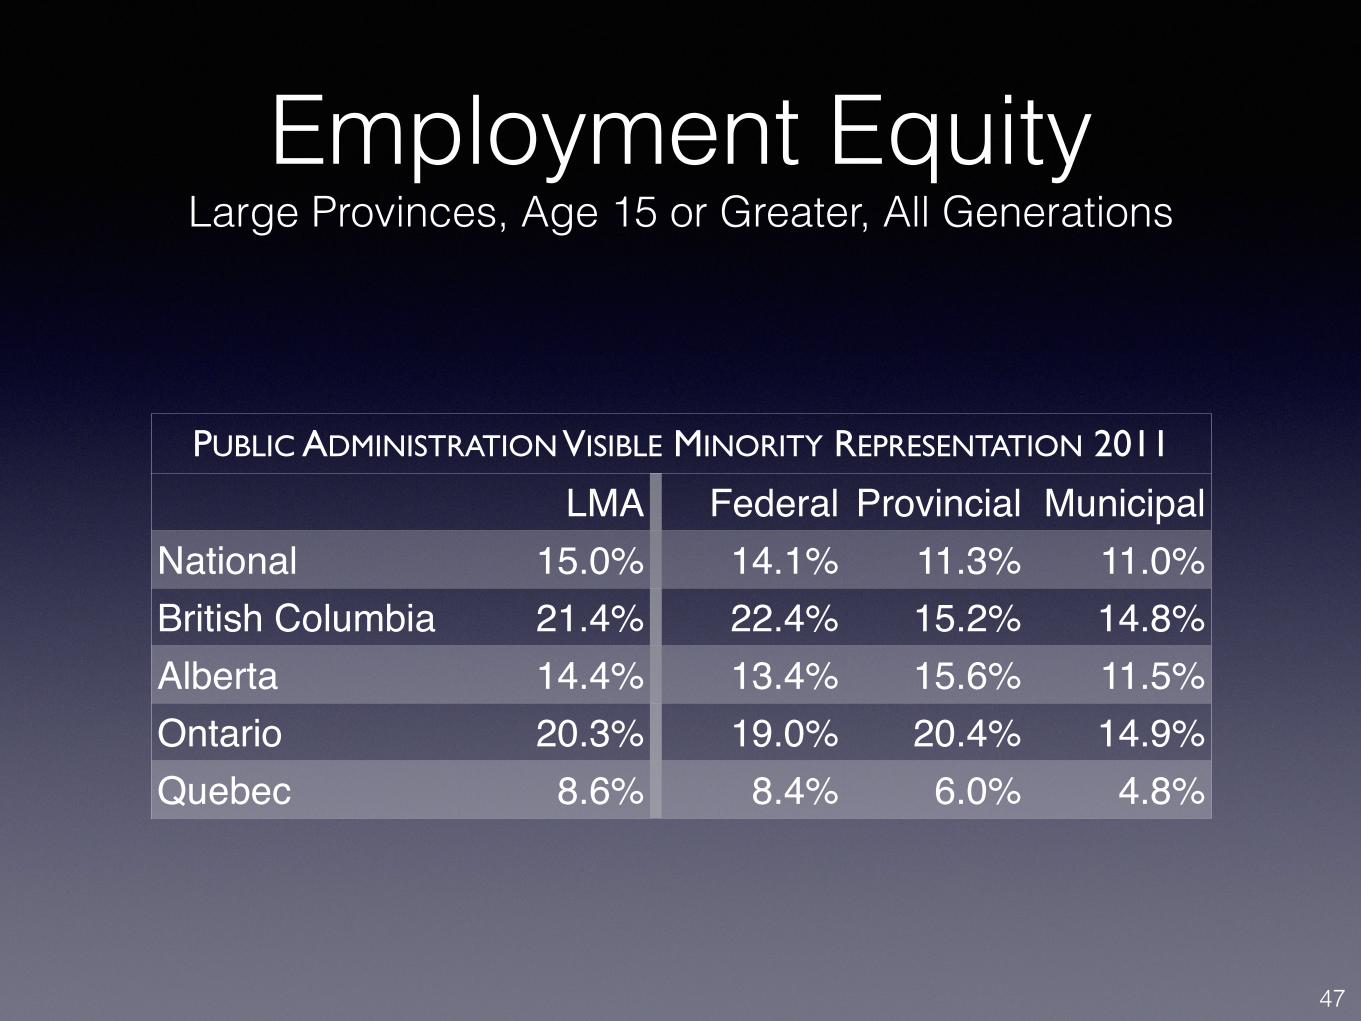
Employment Equity Large Provinces, Age 15 or Greater, All Generations
PUBLIC ADMINISTRATION VISIBLE MINORITY REPRESENTATION 2011
LMA Federal Provincial MunicipalNational 15.0% 14.1% 11.3% 11.0%British Columbia 21.4% 22.4% 15.2% 14.8%Alberta 14.4% 13.4% 15.6% 11.5%Ontario 20.3% 19.0% 20.4% 14.9%Quebec 8.6% 8.4% 6.0% 4.8%
47

Employment Equity Government Religious Minority Employees 2011
Age 15 or Greater, All Generations
2%
4%
5%
7%
Federal Provincial Municipal
0.4%0.7%
0.8%
0.5%0.6%
0.8%
0.7%0.5%
0.9%
0.8%0.9%
1%
1.4%1.6%2.1%
MuslimHinduSikhBuddhistJewishAboriginalOther
48
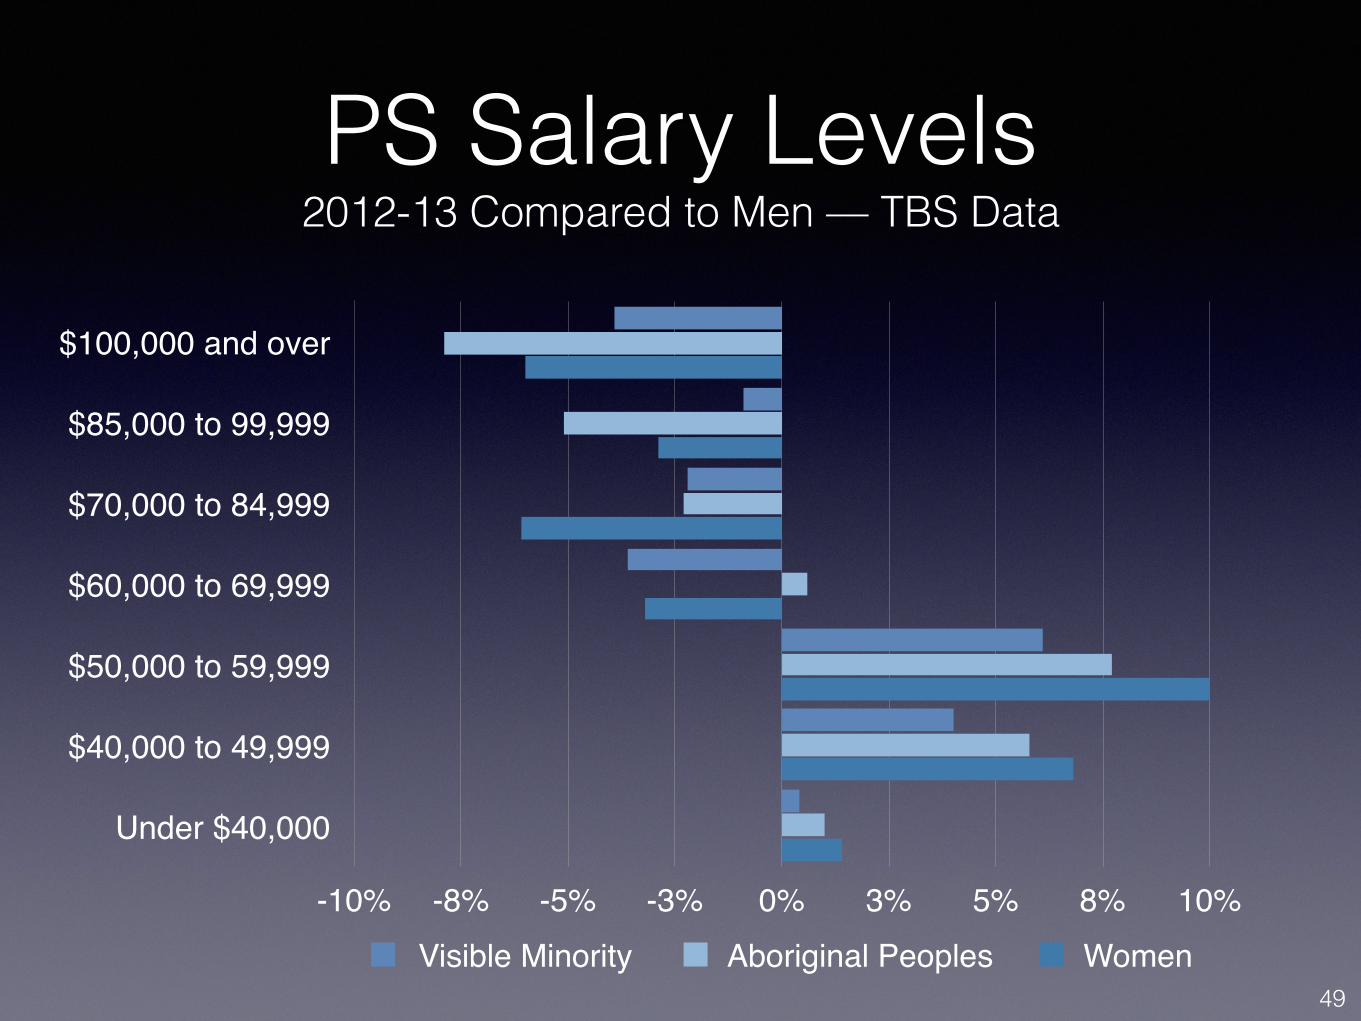
PS Salary Levels 2012-13 Compared to Men — TBS Data
$100,000 and over
$85,000 to 99,999
$70,000 to 84,999
$60,000 to 69,999
$50,000 to 59,999
$40,000 to 49,999
Under $40,000
-10% -8% -5% -3% 0% 3% 5% 8% 10%Visible Minority Aboriginal Peoples Women
49
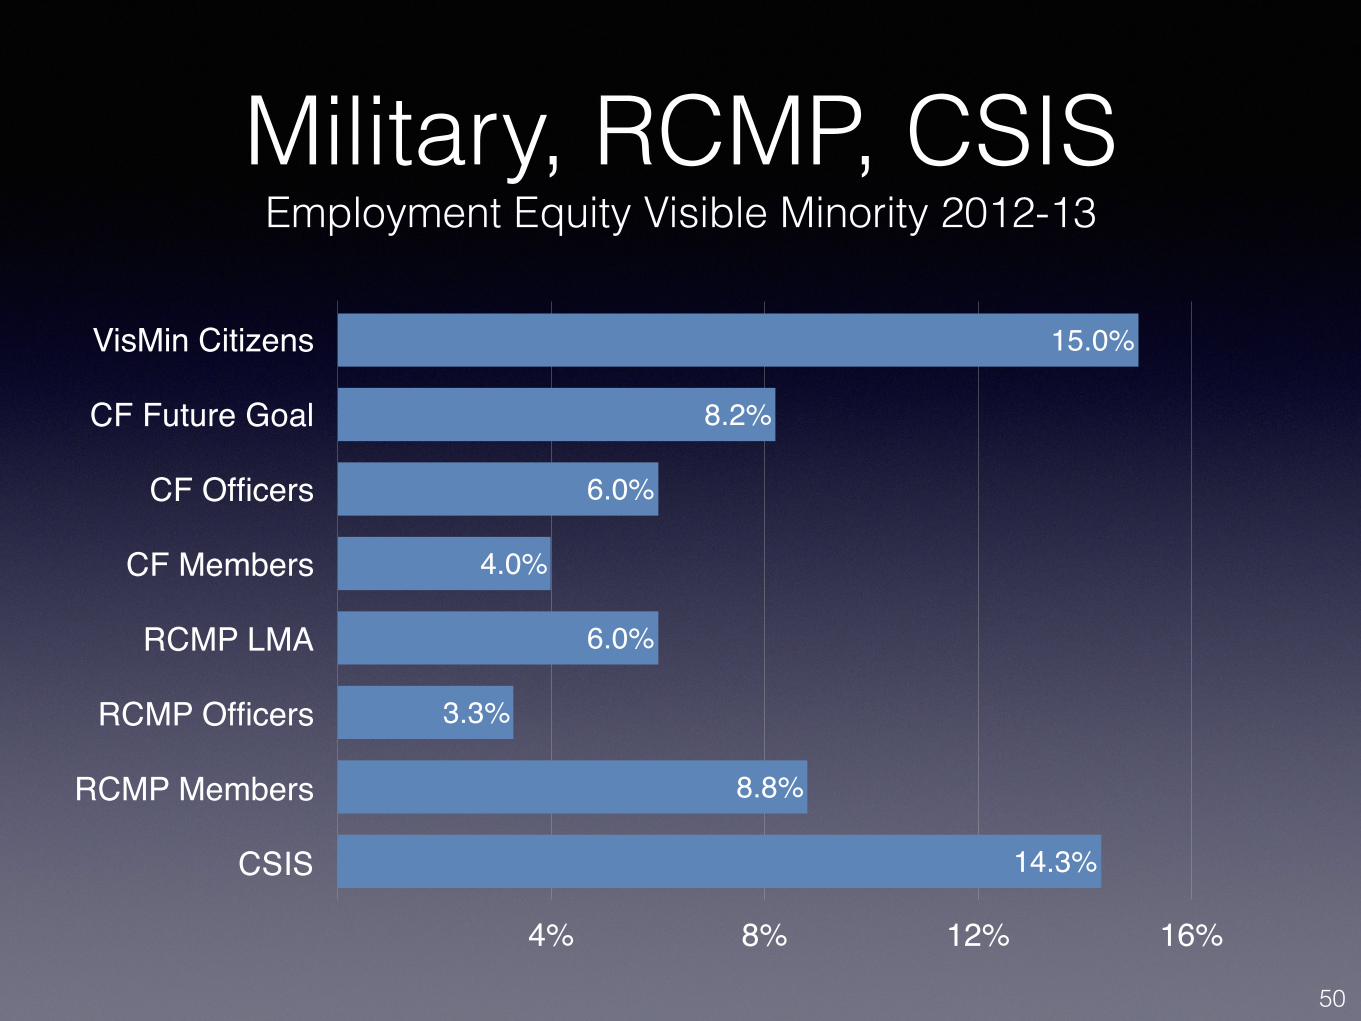
Military, RCMP, CSIS Employment Equity Visible Minority 2012-13
VisMin Citizens
CF Future Goal
CF Officers
CF Members
RCMP LMA
RCMP Officers
RCMP Members
CSIS
4% 8% 12% 16%
14.3%
8.8%
3.3%
6.0%
4.0%
6.0%
8.2%
15.0%
50
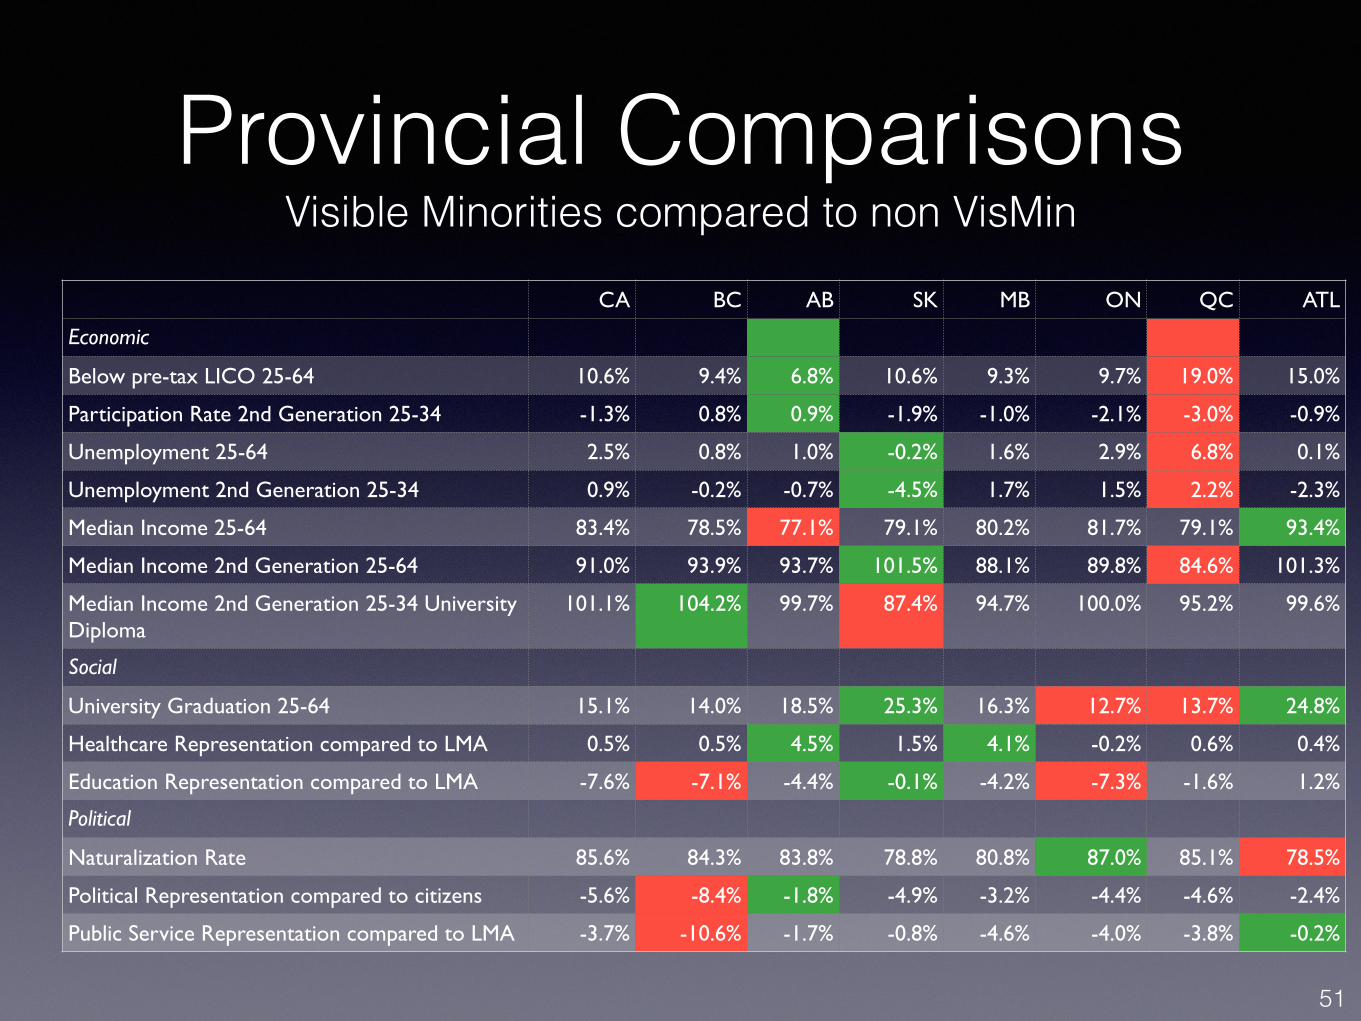
Provincial Comparisons Visible Minorities compared to non VisMin
CA BC AB SK MB ON QC ATL
Economic
Below pre-tax LICO 25-64 10.6% 9.4% 6.8% 10.6% 9.3% 9.7% 19.0% 15.0%
Participation Rate 2nd Generation 25-34 -1.3% 0.8% 0.9% -1.9% -1.0% -2.1% -3.0% -0.9%
Unemployment 25-64 2.5% 0.8% 1.0% -0.2% 1.6% 2.9% 6.8% 0.1%
Unemployment 2nd Generation 25-34 0.9% -0.2% -0.7% -4.5% 1.7% 1.5% 2.2% -2.3%
Median Income 25-64 83.4% 78.5% 77.1% 79.1% 80.2% 81.7% 79.1% 93.4%
Median Income 2nd Generation 25-64 91.0% 93.9% 93.7% 101.5% 88.1% 89.8% 84.6% 101.3%
Median Income 2nd Generation 25-34 University Diploma
101.1% 104.2% 99.7% 87.4% 94.7% 100.0% 95.2% 99.6%
Social
University Graduation 25-64 15.1% 14.0% 18.5% 25.3% 16.3% 12.7% 13.7% 24.8%
Healthcare Representation compared to LMA 0.5% 0.5% 4.5% 1.5% 4.1% -0.2% 0.6% 0.4%
Education Representation compared to LMA -7.6% -7.1% -4.4% -0.1% -4.2% -7.3% -1.6% 1.2%
Political
Naturalization Rate 85.6% 84.3% 83.8% 78.8% 80.8% 87.0% 85.1% 78.5%
Political Representation compared to citizens -5.6% -8.4% -1.8% -4.9% -3.2% -4.4% -4.6% -2.4%
Public Service Representation compared to LMA -3.7% -10.6% -1.7% -0.8% -4.6% -4.0% -3.8% -0.2%
51
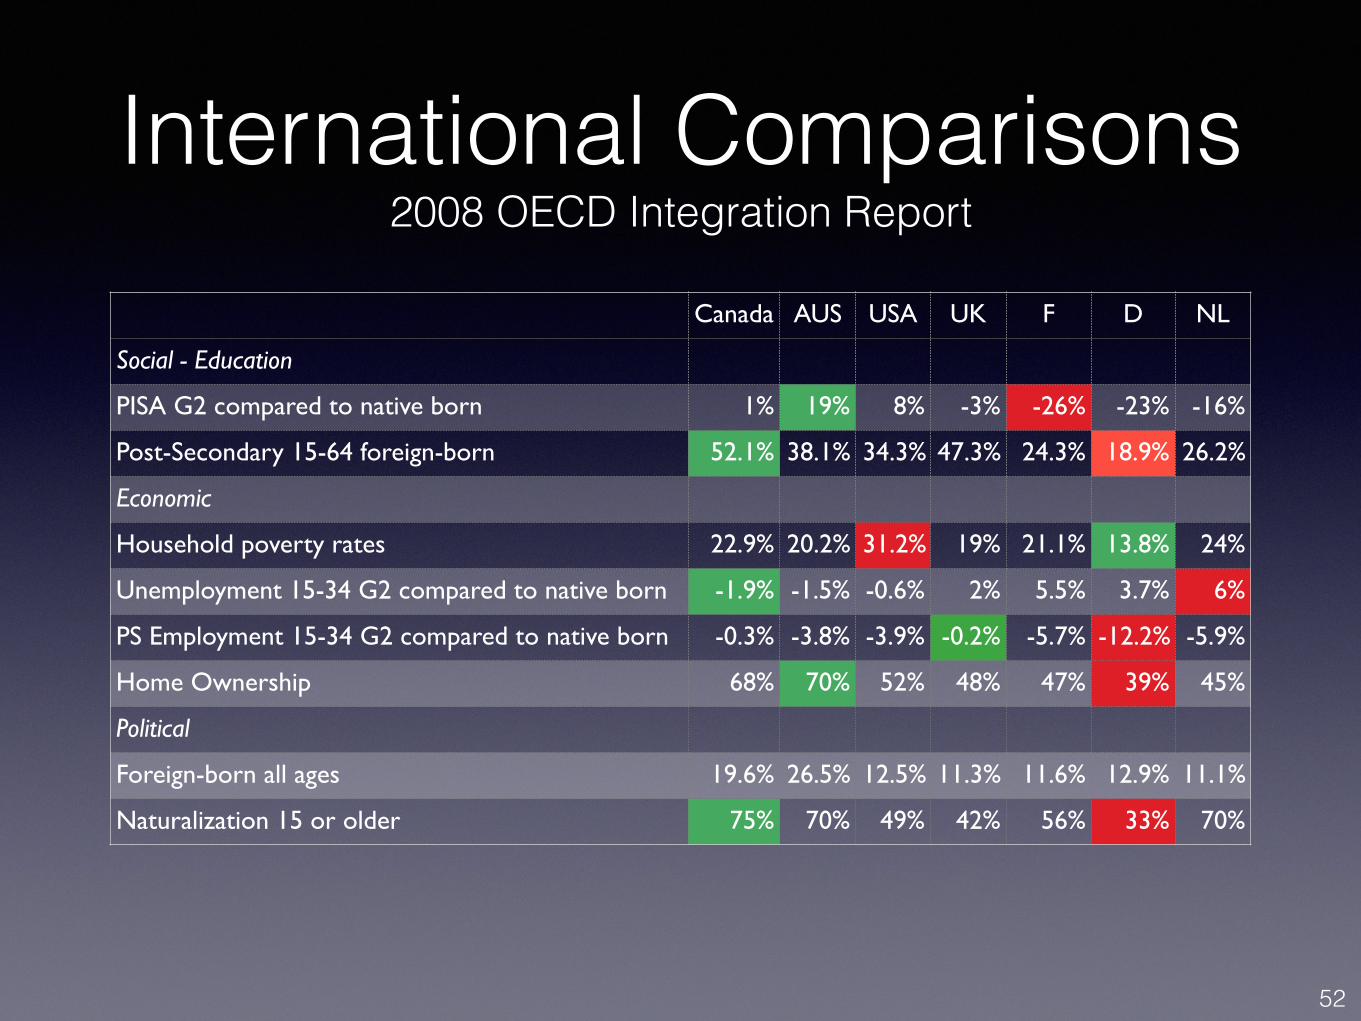
International Comparisons 2008 OECD Integration Report
Canada AUS USA UK F D NL
Social - Education
PISA G2 compared to native born 1% 19% 8% -3% -26% -23% -16%
Post-Secondary 15-64 foreign-born 52.1% 38.1% 34.3% 47.3% 24.3% 18.9% 26.2%
Economic
Household poverty rates 22.9% 20.2% 31.2% 19% 21.1% 13.8% 24%
Unemployment 15-34 G2 compared to native born -1.9% -1.5% -0.6% 2% 5.5% 3.7% 6%
PS Employment 15-34 G2 compared to native born -0.3% -3.8% -3.9% -0.2% -5.7% -12.2% -5.9%
Home Ownership 68% 70% 52% 48% 47% 39% 45%
Political
Foreign-born all ages 19.6% 26.5% 12.5% 11.3% 11.6% 12.9% 11.1%
Naturalization 15 or older 75% 70% 49% 42% 56% 33% 70%
52
Observations, Implications and Risks
53
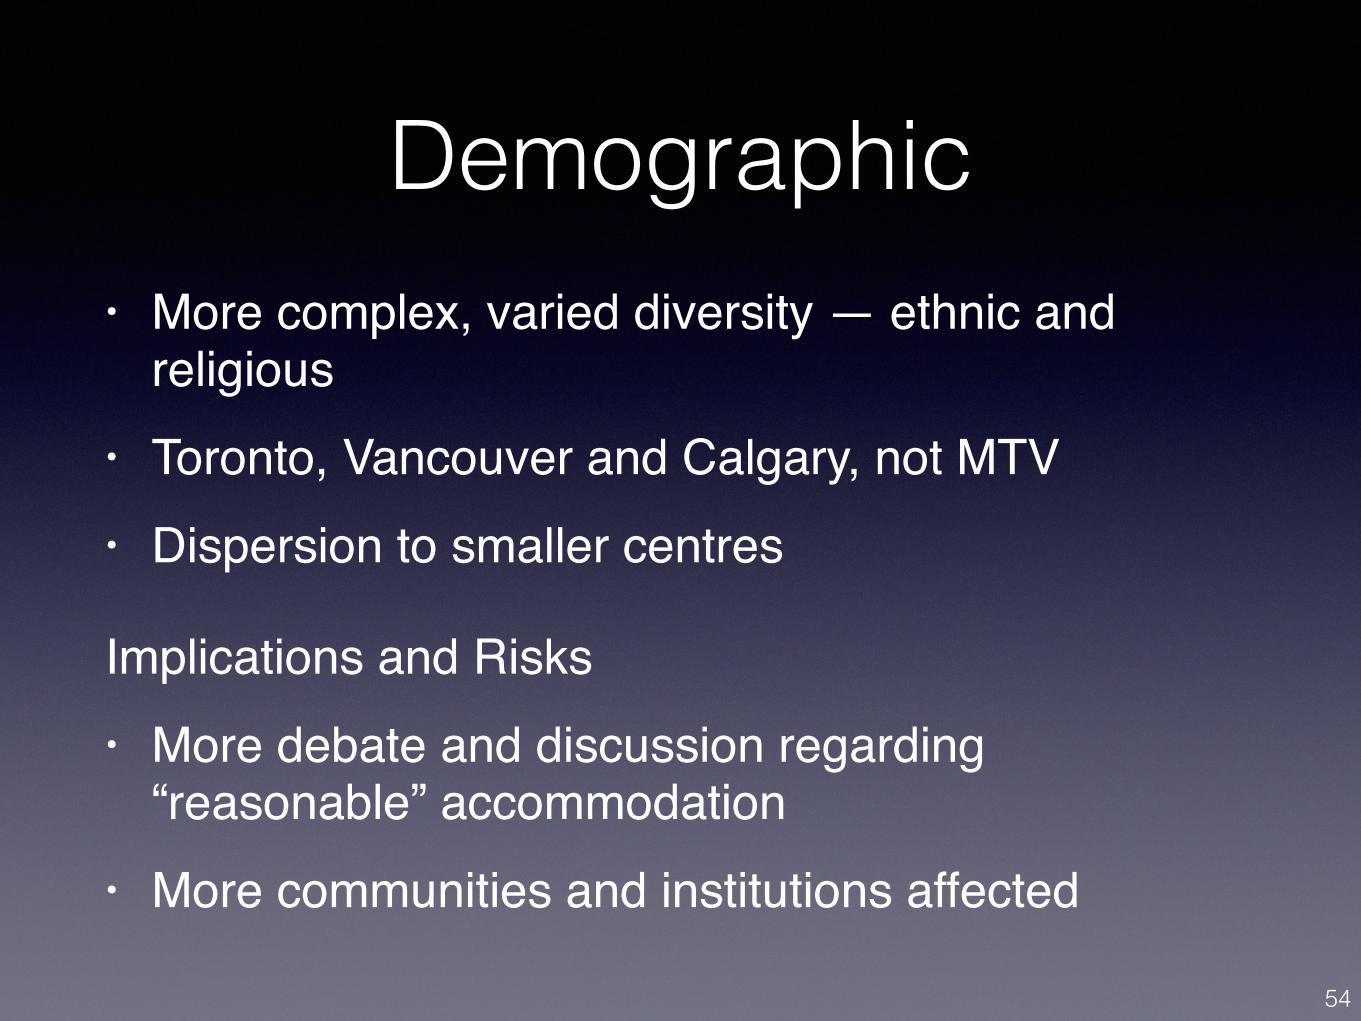
Demographic• More complex, varied diversity — ethnic and
religious• Toronto, Vancouver and Calgary, not MTV• Dispersion to smaller centres
Implications and Risks• More debate and discussion regarding
“reasonable” accommodation• More communities and institutions affected
54
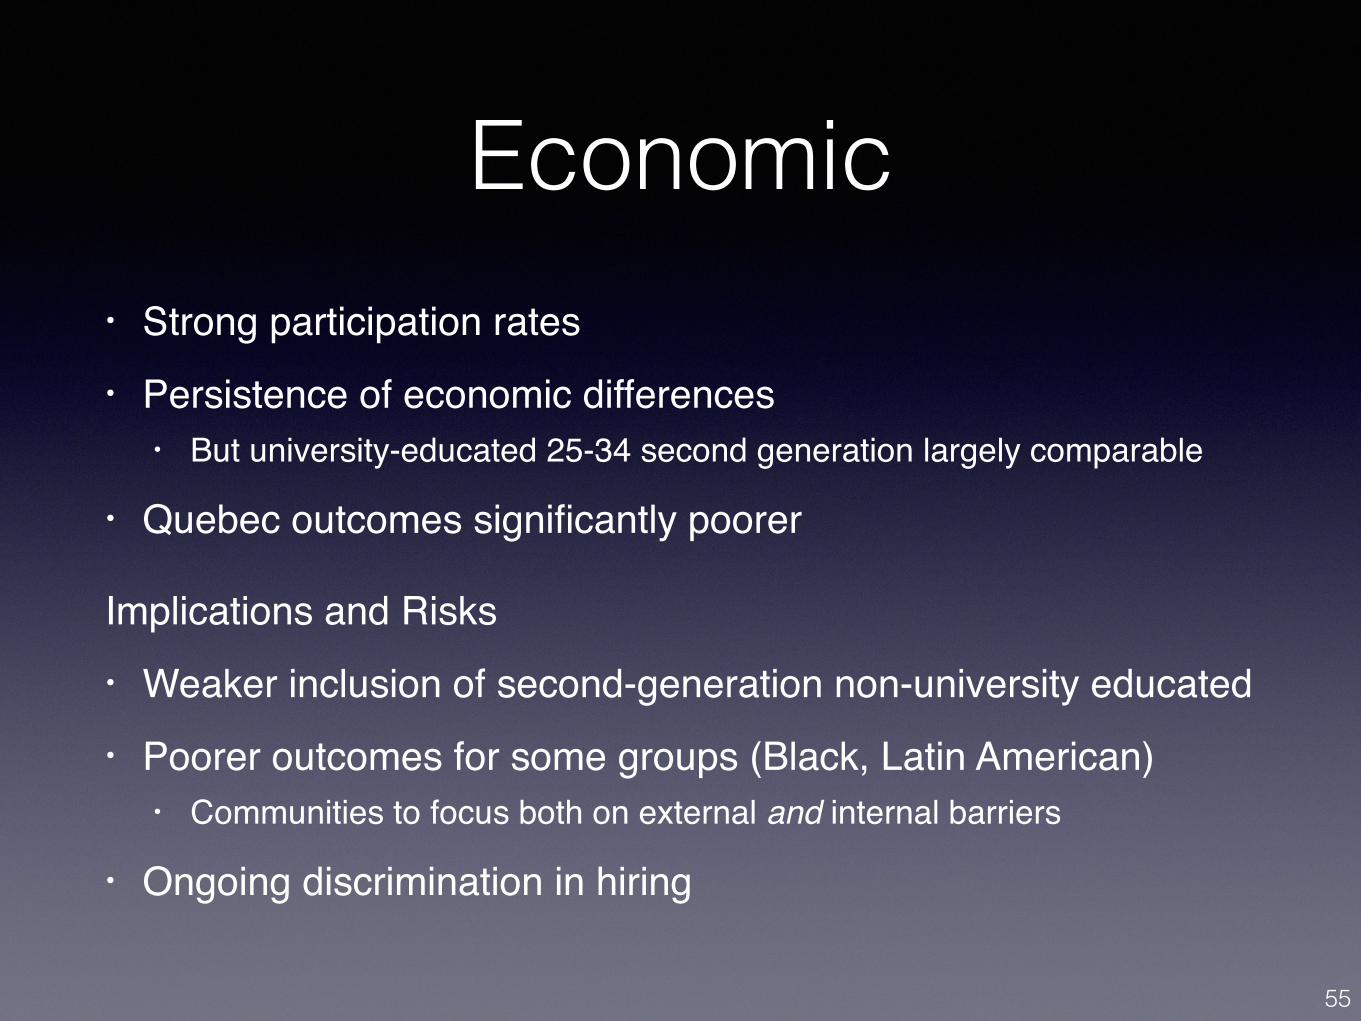
Economic• Strong participation rates• Persistence of economic differences
• But university-educated 25-34 second generation largely comparable
• Quebec outcomes significantly poorer
Implications and Risks• Weaker inclusion of second-generation non-university educated• Poorer outcomes for some groups (Black, Latin American)
• Communities to focus both on external and internal barriers
• Ongoing discrimination in hiring
55
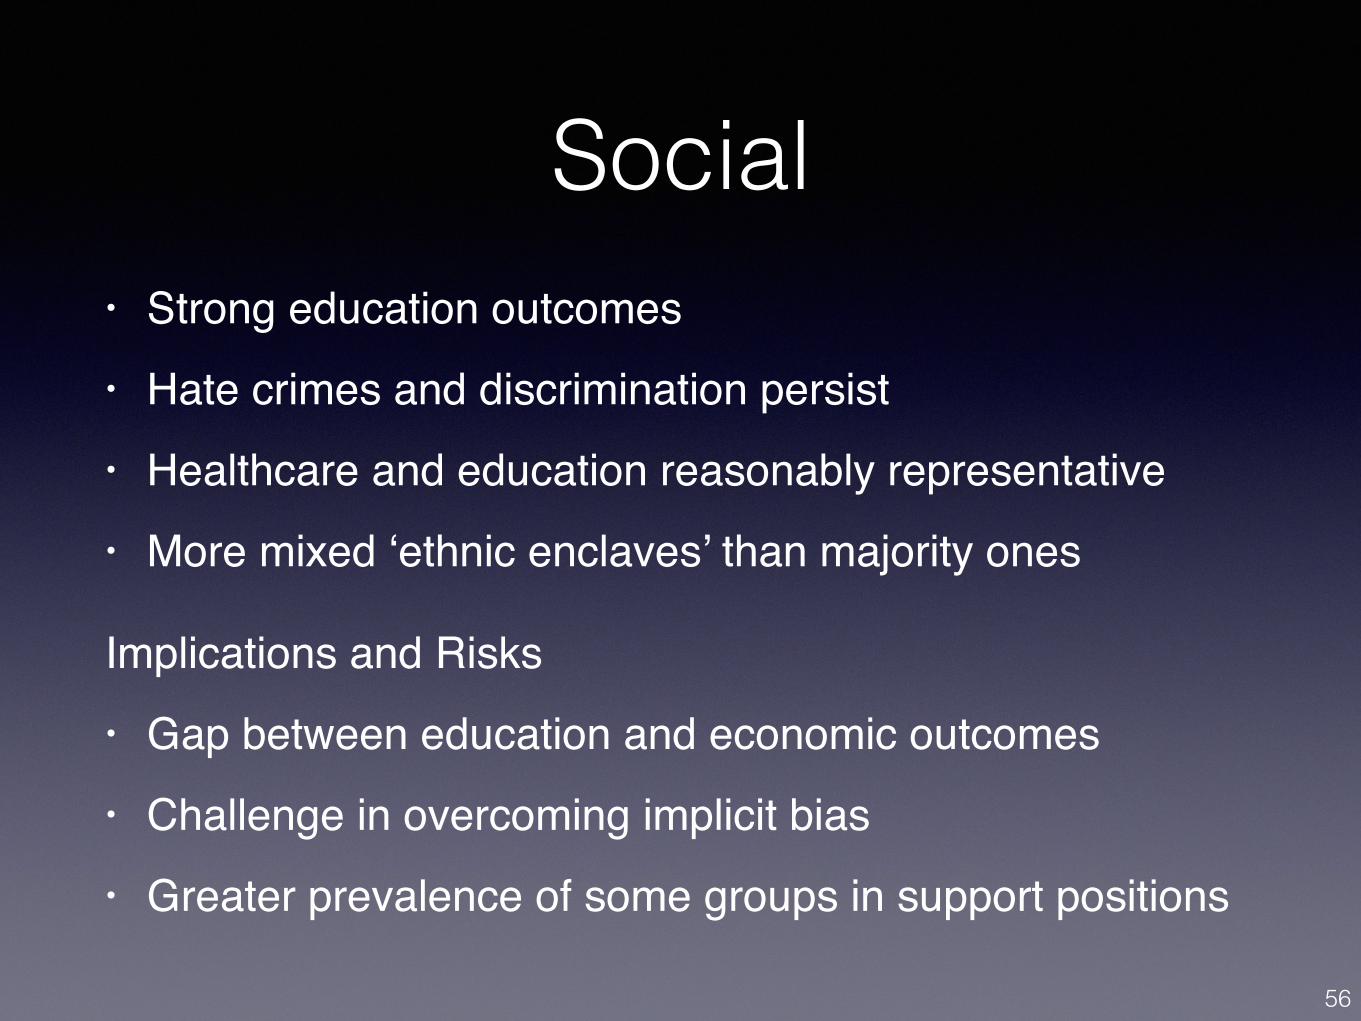
Social• Strong education outcomes• Hate crimes and discrimination persist• Healthcare and education reasonably representative• More mixed ‘ethnic enclaves’ than majority ones
Implications and Risks• Gap between education and economic outcomes• Challenge in overcoming implicit bias• Greater prevalence of some groups in support positions
56
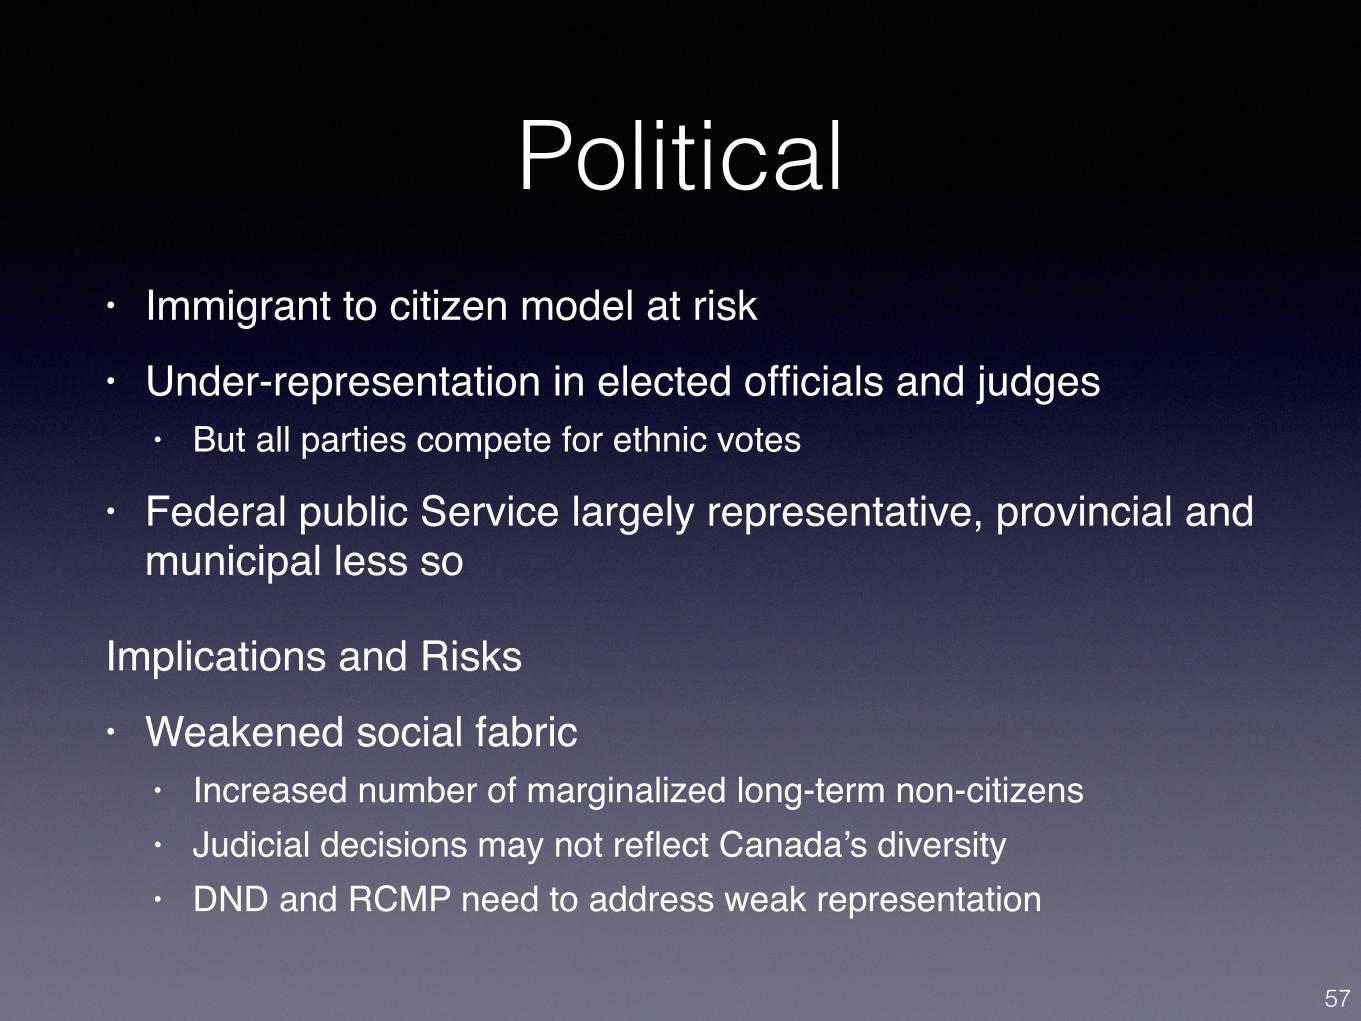
Political• Immigrant to citizen model at risk• Under-representation in elected officials and judges
• But all parties compete for ethnic votes
• Federal public Service largely representative, provincial and municipal less so
Implications and Risks• Weakened social fabric
• Increased number of marginalized long-term non-citizens• Judicial decisions may not reflect Canada’s diversity• DND and RCMP need to address weak representation
57
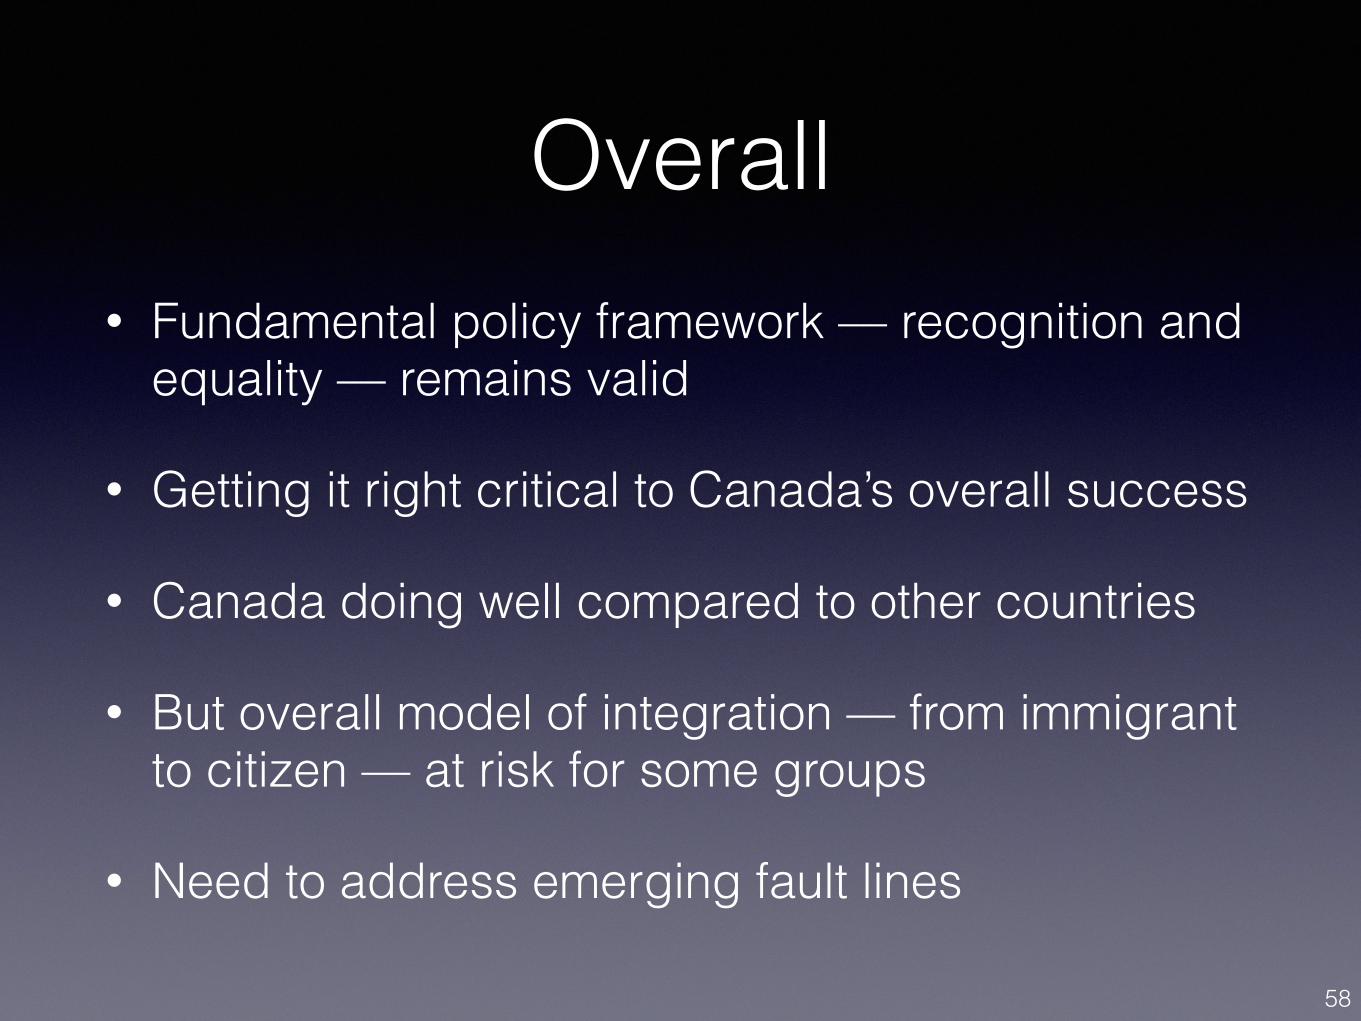
Overall• Fundamental policy framework — recognition and
equality — remains valid
• Getting it right critical to Canada’s overall success
• Canada doing well compared to other countries
• But overall model of integration — from immigrant to citizen — at risk for some groups
• Need to address emerging fault lines
58
Andrew Griffith Email: [email protected]: @andrew_griffithLinkedIn: andrewlgriffithFacebook: Andrew Griffith C&MBlog: www.multiculturalmeanderings.wordpress.com
Books: lulu.com


