Evaluation of the organization and provision of primary ... · Ivan Ivanovic, Batut National...
116
SERBIA EVALUATION OF THE ORGANIZATION AND PROVISION OF PRIMARY CARE IN Primary care in the WHO European Region A survey-based project in the regions of Vojvodina, Central Serbia and Belgrade
Transcript of Evaluation of the organization and provision of primary ... · Ivan Ivanovic, Batut National...
serbiaevaluation of the organization and provision of primary care in
Primary care in the WHO European Region
evaluat
ion of t
he or
ganiz
ation
and
provision
of prim
ary car
e in ser
bia
A survey-based project in the regions of Vojvodina, Central Serbia and Belgrade

Design, layout & productionPhoenix Design Aid, Denmark

serbiae va l u at i o n o f t h e o r g a n i z at i o n
a n d p r o v i s i o n o f p r i m a r y c a r e i n
A survey-based project in the regions of Vojvodina, Central Serbia and Belgrade
Institute of Public Health of Serbia“Dr Milan Jovanovic Batut”

abstractIn many countries in transition, health reforms are part of profound and comprehensive changes in essential societal functions and values. Reforms of (primary) care are not always based on evi-dence, and progress may be driven by political arguments or the interests of specific professional groups, rather than by the results of sound evaluations. However, policy-makers and managers nowadays increasingly demand evidence of the progress of reforms and the responsiveness of services. The implementation of the WHO Primary Care Evaluation Tool (PCET) aims to provide a structured approach to this by drawing on health system functions such as governance, financ-ing and resource generation, as well as the characteristics of a good PC service delivery system: accessibility, comprehensiveness, coordination and continuity. This report gives an overview on the findings for Serbia.
The project was implemented in Serbia in 2009 in the framework of the 2008–2009 Biennial Col-laborative Agreement between the WHO Regional Office for Europe and the Ministry of Health of the Republic of Serbia, which lays out the main areas of work for collaboration between the par-ties. Other partners were the Netherland Institute for Health Services Research (NIVEL) – a WHO Collaborating Centre for Primary Care – and other stakeholders in the health system of Serbia, such as national policy experts, managers, medical educators, PC physicians and their patients.
KeywordsPRIMARY HEALTH CAREEVALUATION STUDIESHEALTH SYSTEMS PLANS – organization and administrationHEALTH CARE REFORMHEALTH POLICYQUESTIONNAIRESSERBIA
© World Health Organization 2010All rights reserved. The Regional Office for Europe of the World Health Organization welcomes requests for permission to reproduce or translate its publications, in part or in full.
The designations employed and the presentation of the material in this publication do not imply the expression of any opinion whatsoever on the part of the World Health Organization concern-ing the legal status of any country, territory, city or area or of its authorities, or concerning the delimitation of its frontiers or boundaries. Dotted lines on maps represent approximate border lines for which there may not yet be full agreement.
The mention of specific companies or of certain manufacturers’ products does not imply that they are endorsed or recommended by the World Health Organization in preference to others of a similarnature that are not mentioned. Errors and omissions excepted, the names of proprietary products are distinguished by initial capital letters.
All reasonable precautions have been taken by the World Health Organization to verify the infor-mation contained in this publication.However, the published material is being distributed without warranty of any kind, either express or implied. The responsibility for the interpretation and use of the material lies with the reader. In no event shall the World Health Organization be liable for damages arising from its use. The views expressed by authors, editors, or expert groups do not necessarily represent the decisions or the stated policy of the World Health Organization.
Address requests about publications of the WHO Regional Office for Europe to:PublicationsWHO Regional Office for EuropeScherfigsvej 8DK-2100 Copenhagen Ø, Denmark
Alternatively, complete an online request form for documentation, health information, or for permis-sion to quote or translate, on the Regional Office web site (http://www.euro.who.int/pubrequest).

table of contentsAbbreviations . . . . . . . . . . . . . . . . . . . . . . . . . . . . . . . . . . . . . . . . . . . . . . . . . . . . . 4Acknowledgements . . . . . . . . . . . . . . . . . . . . . . . . . . . . . . . . . . . . . . . . . . . . . . . . 5Foreword . . . . . . . . . . . . . . . . . . . . . . . . . . . . . . . . . . . . . . . . . . . . . . . . . . . . . 6Executive Summary . . . . . . . . . . . . . . . . . . . . . . . . . . . . . . . . . . . . . . . . . . . . . . . 7
1 Evaluating PC: backgrounds and application . . . . . . . . . . . . . . . . . . . . . 16 1.1. The theoretical framework of the Primary Care Evaluation Tool . . . . 16 1.2. Overview of the PCET development and pilot testing . . . . . . . . . . . . 23 1.3. Overview of the PCET implementation in Serbia . . . . . . . . . . . . . . . . 24
2 Introduction to Serbia . . . . . . . . . . . . . . . . . . . . . . . . . . . . . . . . . . . . . . . . . 29 2.1. The country . . . . . . . . . . . . . . . . . . . . . . . . . . . . . . . . . . . . . . . . . . . . . . . 29 2.2 . Population and health . . . . . . . . . . . . . . . . . . . . . . . . . . . . . . . . . . . . . . . 30 2.3. The health care system . . . . . . . . . . . . . . . . . . . . . . . . . . . . . . . . . . . . . 33
3 Primary care in Serbia: national context . . . . . . . . . . . . . . . . . . . . . . . . . 37 3.1. Stewardship / governance . . . . . . . . . . . . . . . . . . . . . . . . . . . . . . . . . . . 37 3.2 . Resource generation . . . . . . . . . . . . . . . . . . . . . . . . . . . . . . . . . . . . . . . . 45 3.3. Financing. . . . . . . . . . . . . . . . . . . . . . . . . . . . . . . . . . . . . . . . . . . . . . . . . 50 3.4. PC service delivery . . . . . . . . . . . . . . . . . . . . . . . . . . . . . . . . . . . . . . . . . 51
4 GPs and paediatrician responses . . . . . . . . . . . . . . . . . . . . . . . . . . . . . . . . 52 4.1. Respondents’ characteristics. . . . . . . . . . . . . . . . . . . . . . . . . . . . . . . . . 52 4.2. Accessibility of care . . . . . . . . . . . . . . . . . . . . . . . . . . . . . . . . . . . . . . . . 53 4.3. Continuity of care . . . . . . . . . . . . . . . . . . . . . . . . . . . . . . . . . . . . . . . . . . 57 4.4. Coordination of care . . . . . . . . . . . . . . . . . . . . . . . . . . . . . . . . . . . . . . . . 59 4.5. Comprehensiveness of care . . . . . . . . . . . . . . . . . . . . . . . . . . . . . . . . . . 66
5 Patients responses . . . . . . . . . . . . . . . . . . . . . . . . . . . . . . . . . . . . . . . . . . . . 83 5.1. Respondents’ characteristics. . . . . . . . . . . . . . . . . . . . . . . . . . . . . . . . . 83 5.2. Accessibility of care . . . . . . . . . . . . . . . . . . . . . . . . . . . . . . . . . . . . . . . . 84 5.3. Continuity of care . . . . . . . . . . . . . . . . . . . . . . . . . . . . . . . . . . . . . . . . . . 89 5.4. Coordination of care and choice of provider. . . . . . . . . . . . . . . . . . . . . 97
6 Conclusion . . . . . . . . . . . . . . . . . . . . . . . . . . . . . . . . . . . . . . . . . . . . . . . . . . 99 6.1. Summary of findings . . . . . . . . . . . . . . . . . . . . . . . . . . . . . . . . . . . . . . . . 99 6.2. Recommendations . . . . . . . . . . . . . . . . . . . . . . . . . . . . . . . . . . . . . . . . . ??
Annex Glossary of PC terms . . . . . . . . . . . . . . . . . . . . . . . . . . . . . . . . 108
References . . . . . . . . . . . . . . . . . . . . . . . . . . . . . . . . . . . . . . . . . . . . . . . . . . . 110

4Evaluation of the organization and provision of primary care in Serbia
abbreviations
BCA Biennial Collaborative Agreement between the WHO Office for Europe and Member States
CIS Commonwealth of Independent StatesCHC community health centreCME continuing medical educationEU European UnionEU15 European Union Member States before May 2004GDP gross domestic productGP general practitionerHIF Health Insurance FundIUD intrauterine deviceNGO non-governmental organizationNIVEL Netherlands Institute for Health Services ResearchPC primary carePHC primary health carePCET Primary Care Evaluation ToolPPP purchasing power parityRH reproductive healthSDR age-standardized death rateSMS Serbian Medical SocietySTI sexually transmitted infectionTB tuberculosisWHO World Health Organization
5Evaluation of the organization and provision of primary care in Serbia
Acknowledgements
The World Health Organization (WHO) Regional Office for Europe expresses appreciation to all those who contributed to the achievements of this project.
The project implementation team:Principal writers:Wienke G.W. Boerma, the Netherlands Institute for Health Services Research (NIVEL) (technical project leader)Martina Pellny, WHO Regional Office for Europe (project coordinator)Dionne S. Kringos, NIVEL
Reviewers and contributors:Slobodanka Gajic, Dr Milan Jovanovic Batut National Institute of Public Health Ivan Ivanovic, Batut National Institute of Public HealthMirjana Zivkovic Sulovic, Batut National Institute of Public HealthMelita Vujnovic, WHO Country Office in SerbiaValentina Baltag, WHO Regional Office for Europe.
The national working group:
• The Ministry of Health Dr Ivana Misic; Dr Nebojsa Jokic
• The Institute of Public Health of Serbia Dr Tanja Knezevic; Dr Slobodanka Gajic; Dr Ivan Ivanovic; Dr Mirjana Sulovic Zivkovic
• The Regional Institute of Public Health of Vojvodina Dr Sonja Susnjevic; Dr Sanja Cankovic
• The Regional Institute of Public Health of Belgrade Dr Vesna Dragicevic
• The Medical University, Faculty of Medicine, Department of Social Medicine Prof Dr Snezana Simic
• The Health Insurance Fund Ms Milica Miletic
• The Serbian Medical Chamber Dr Tanja Radosavljevic
• The Serbian Nursing Association Ms Milijana Matijevic
• The Serbian Agency for Accreditation Ms Snezana Manic
The project is grateful for the participation of all patients, PC physicians, field workers and local organizers in the regions of Vojvodina, Belgrade and Central Serbia.

6Evaluation of the organization and provision of primary care in Serbia
foreword
Primary health care embodies the values and principles that WHO pursues in its world-wide effort to help countries strengthen their health systems efficiently and equitably. WHO renewed its commitment to global improvements in health, especially for the most disadvantaged populations, in the World health report 2008, which urges countries to act on evidence that access to PC services forms the core of an efficient and appropri-ate health care system. The title of the report underscores the urgency of its message: Primary health care – Now more than ever.
Over the past 30 years, health in the 53 WHO Member States in the European Region has improved considerably overall, despite significant changes in the patterns and trends in disease occurrence, demographic profiles and exposure to major risks and hazards in a rapidly evolving socioeconomic environment. In addition, the Region has seen trends towards more integrated models of care and greater pluralism in the financing and organization of health systems. Governments are continuing to rethink their roles in population health and health care organization and delivery, thereby changing the context for framing and implementing health policy.
This report evaluates PC developments in Serbia, using a methodology that characterizes a good PC system as one that is comprehensive, accessible, coordinated and integrated. Other necessary attributes are continuity and equal consideration to all the functions outlined in the WHO framework in order to improve the overall health system. This means that the financing arrangements, service delivery, human and other resources (such as appropriate facilities, equipment and drugs) and necessary legal frameworks and regulations must be in place, and the system must have effective leadership. The report thus offers interested policy-makers and stakeholders a structured overview of the strengths and weaknesses of the country’s PC organization and provision, taking into account the opinions of the professionals and patients concerned. The report focuses on structural performance, and provides a list of proxy indicators. However, it does not examine the process or outcome of care itself, and thus its quality. It does, nonetheless, signify a first and very important step towards a baseline for improving PC processes and outcomes. We at the WHO Regional Office for Europe hope that this report will contribute to further PC reform in Serbia.
We thank the many collaborators who have generously contributed to this project with their ideas and insights. We also would like to gratefully acknowledge the financial as-sistance of the Netherlands Ministry of Health, Welfare and Sport in the framework of the Partnership Programme between the WHO Regional Office and the Netherlands.
Enis Barıs, MD, PhDDirector, Country Health Systems (DCS)WHO Regional Office for Europe

7Evaluation of the organization and provision of primary care in Serbia
executive summary
This report summarizes the results of the WHO Primary Care Evaluation Tool (PCET), which was implemented in Serbia in 2009 in the framework of the 2008-2009 Biennial Collaborative Agreement (BCA) between the WHO Regional Office for Europe and the Ministry of Health of the Republic of Serbia, which lays out the main collaborative areas between the parties. Other partners were the Netherlands Institute for Health Services Research (NIVEL) – a WHO Collaborating Centre for Primary Care – and other stakehold-ers in the health system of Serbia, such as national policy experts, the Institute for Public Health, educational institutions, regional authorities, PC physicians and their patients.
IntroductionThe Primary Care Evaluation Tool (PCET) is an instrument developed for the WHO Regional Office for Europe to examine both supply and demand-side aspects of PC. It is intended to support ministries of health and other stakeholders in monitoring the progress of their PC-related policies and reforms and to set new priorities on the basis of evidence-based information with the aim of further strengthening PC.
MethodsThe tool was implemented in Vojvodina, Belgrade and Central Serbia in 2009. Data were processed and analyzed in December 2009 and January 2010. The survey approach relies on the self-reported experiences of physicians and their patients. The underlying methodology for the design of the PCET was derived from the WHO 2000 Health Systems Framework (1), which indicates that the performance of a health system is determined by the way in which its functions – stewardship, resource generation, financing and service provision – are organized. The PCET framework encompasses these four functions, together with the key characteristics of PC services, including: accessibility, continuity, coordination and comprehensiveness. Furthermore, a number of key dimensions and subthemes were identified for each of the PC functions and characteristics and in a second step translated into indicators or proxies. In order to evaluate the complexity of PC systems, information is gathered on different levels from demand and supply sides alike. The PCET therefore consisted of three questionnaires: one for the national level of PC, one for PC physicians/general practitioners (GPs) and one for patients. Together, the three questionnaires covered the PC functions identified and the dimensions and items derived from the framework. The questionnaires for GPs and patients were pre-structured, with precoded answers. The questionnaire for the national level contained both prestructured and open-ended questions, as well as statistical data to be filled in.
ResultsNational (based on information gathered by the health system questionnaire and in-terviews with national policy experts)
Stewardship / governanceEspecially since 2002, specific PC (PC) legislation has been developed in Serbia. In the policy document Better health for all in the third millennium, prevention and PC were prioritized. At the Ministry of Health, PC-related responsibilities have been allocated to several departments. Mechanisms have been created to systematically involve stakeholders and interest groups in health policy development. Major PC reforms
8Evaluation of the organization and provision of primary care in Serbia
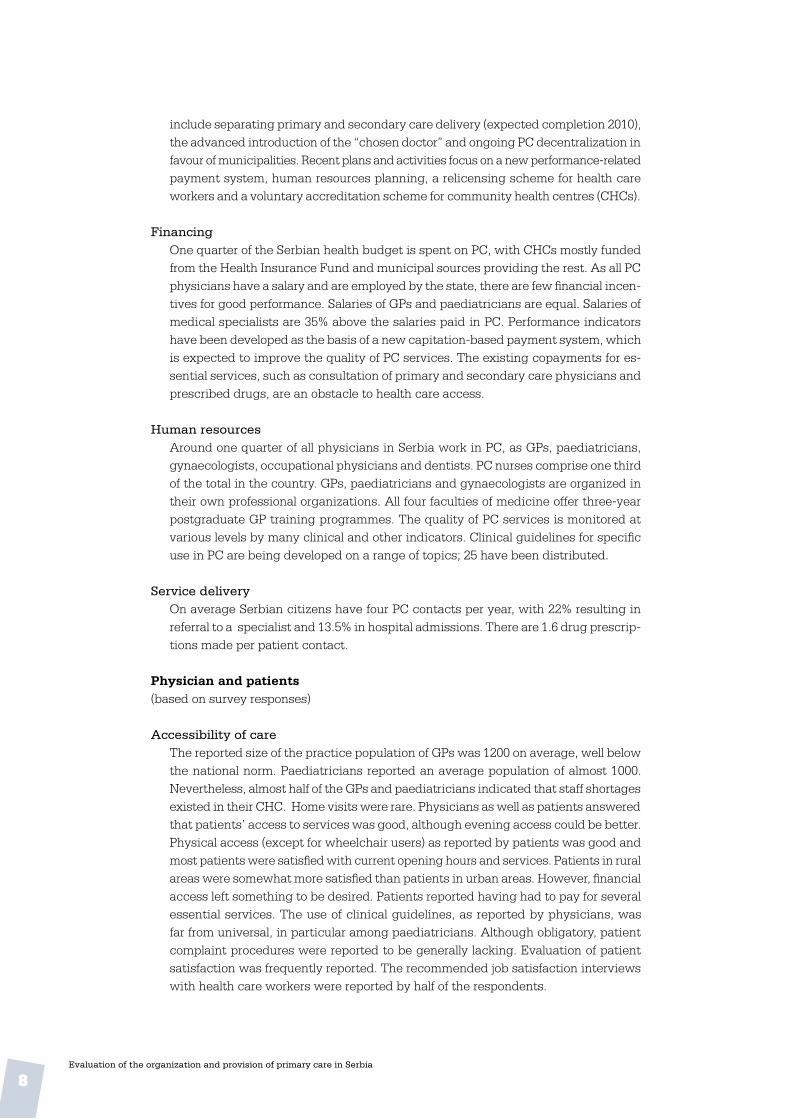
include separating primary and secondary care delivery (expected completion 2010), the advanced introduction of the “chosen doctor” and ongoing PC decentralization in favour of municipalities. Recent plans and activities focus on a new performance-related payment system, human resources planning, a relicensing scheme for health care workers and a voluntary accreditation scheme for community health centres (CHCs).
FinancingOne quarter of the Serbian health budget is spent on PC, with CHCs mostly funded from the Health Insurance Fund and municipal sources providing the rest. As all PC physicians have a salary and are employed by the state, there are few financial incen-tives for good performance. Salaries of GPs and paediatricians are equal. Salaries of medical specialists are 35% above the salaries paid in PC. Performance indicators have been developed as the basis of a new capitation-based payment system, which is expected to improve the quality of PC services. The existing copayments for es-sential services, such as consultation of primary and secondary care physicians and prescribed drugs, are an obstacle to health care access.
Human resourcesAround one quarter of all physicians in Serbia work in PC, as GPs, paediatricians, gynaecologists, occupational physicians and dentists. PC nurses comprise one third of the total in the country. GPs, paediatricians and gynaecologists are organized in their own professional organizations. All four faculties of medicine offer three-year postgraduate GP training programmes. The quality of PC services is monitored at various levels by many clinical and other indicators. Clinical guidelines for specific use in PC are being developed on a range of topics; 25 have been distributed.
Service deliveryOn average Serbian citizens have four PC contacts per year, with 22% resulting in referral to a specialist and 13.5% in hospital admissions. There are 1.6 drug prescrip-tions made per patient contact.
Physician and patients(based on survey responses)
Accessibility of careThe reported size of the practice population of GPs was 1200 on average, well below the national norm. Paediatricians reported an average population of almost 1000. Nevertheless, almost half of the GPs and paediatricians indicated that staff shortages existed in their CHC. Home visits were rare. Physicians as well as patients answered that patients’ access to services was good, although evening access could be better. Physical access (except for wheelchair users) as reported by patients was good and most patients were satisfied with current opening hours and services. Patients in rural areas were somewhat more satisfied than patients in urban areas. However, financial access left something to be desired. Patients reported having had to pay for several essential services. The use of clinical guidelines, as reported by physicians, was far from universal, in particular among paediatricians. Although obligatory, patient complaint procedures were reported to be generally lacking. Evaluation of patient satisfaction was frequently reported. The recommended job satisfaction interviews with health care workers were reported by half of the respondents.

9Evaluation of the organization and provision of primary care in Serbia
Coordination of careStructured cooperation was most frequently intradisciplinary. Regular meetings with medical specialists at the secondary level were rare, but asking advice on a case-by-case basis was frequent. The average referral rate of GPs was very high compared to other countries as well as to paediatricians. GP referral rates varied regionally. The usual finding that urban PC physicians have higher referral rates than those in rural practices was not confirmed in Serbia, where the rates were similar. From the patient survey it turned out that patients generally felt they could choose a doctor and change if desired. Although most patients found communication among the physicians they visit insufficient, they were confident that their GP or paediatrician would receive information about a treatment completed by another physician. Patients were very satisfied with the cooperation between their doctor and the practice nurse. Patients in rural areas were more positive than those in urban areas.
Continuity of careClinical records were well kept, but it was difficult to retrieve specific categorical information from the system. The flow of information between primary and second-ary care related to patient referrals was good. Referral letters are widely used and medical specialists usually inform PC after specialist treatment has finished. Many PC physicians do not use computers and apparently keep records on paper. Other practice staff subsequently store clinical information in the computer, probably for management and statistical purposes. Computers were rarely used to search informa-tion. The use of computers strongly differed among regions. Results from the patient survey (including “heavy users”) suggest a very high PC visit frequency, not just to one’s own physician but also to others. This could indicate an imperfect functioning of the chosen doctor system. Patients were positive about their GPs and their profes-sional skills were well appreciated. Patients were more positive about GPs than they were about paediatricians. Patients in rural areas were generally more positive about their doctors than those in urban areas.
Comprehensiveness of carePC physicians, especially GPs, were not sufficiently equipped to provide a compre-hensive package of preventive, curative and rehabilitative services in either urban or rural practices. However, the availability of laboratory and X-ray facilities (within or outside the practice) was good. Waiting times for results of diagnostic tests could be long, especially for GPs. Waiting time differences were small between urban and rural areas, but wide among regions. As expected, GPs reported a wider range of health problems in the first contact than paediatricians. However, the profile is rather small in international comparison. It seems that, in contrast to paediatricians, GPs lack a clear-cut clinical domain in first contacts. Urban and rural physicians did not differ in their role as first contacts. The GPs’ role in disease treatment was more comprehen-sive than that of paediatricians. GPs’ treatment profile seemed clearer than their first contact profile, with no differences between urban and rural areas. Involvement of GPs and paediatricians in providing medical technical procedures (e.g., minor surgical procedures) was generally very low, while they were modestly involved in screening and categorical services. Family planning and contraception seemed not to belong to the professional domain of GPs, especially in urban areas. Physicians indicated that medically unnecessary prescriptions were made in a small fraction of cases. A majority of GPs and paediatricians answered they would like to spend more time on prevention.
10Evaluation of the organization and provision of primary care in Serbia
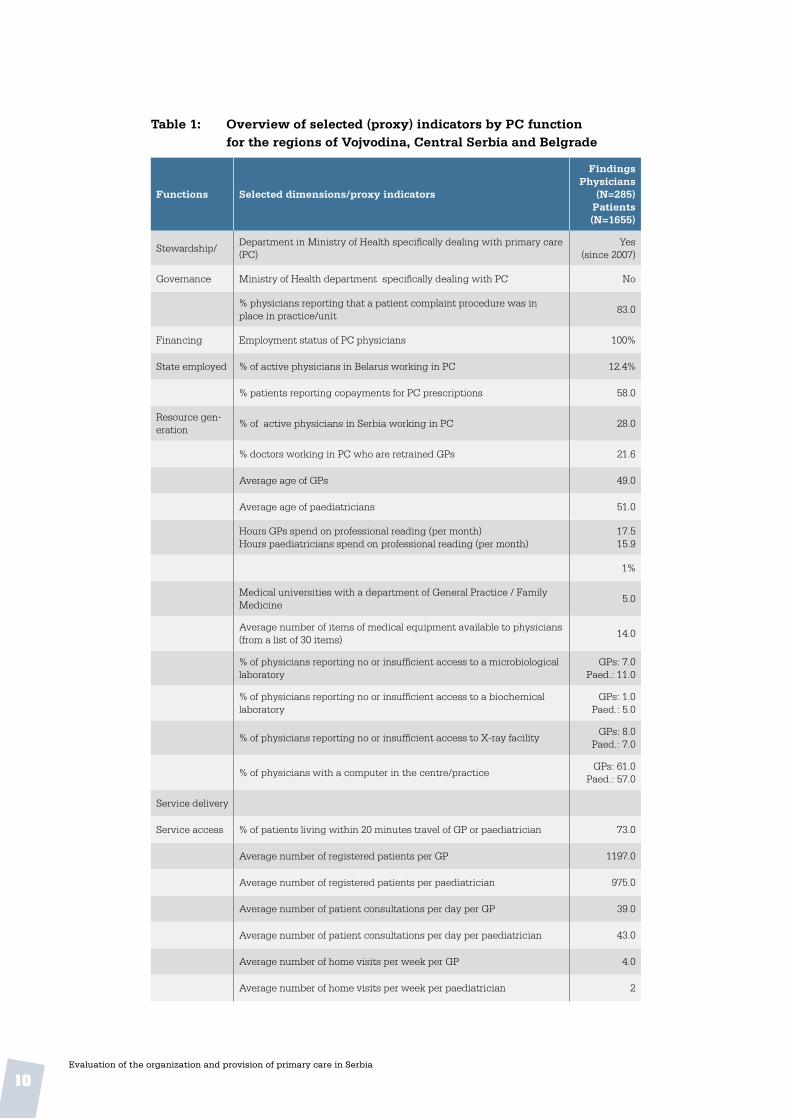
Table 1: Overview of selected (proxy) indicators by PC function for the regions of Vojvodina, Central Serbia and Belgrade
Functions Selected dimensions/proxy indicators
FindingsPhysicians
(N=285)Patients (N=1655)
Stewardship/Department in Ministry of Health specifically dealing with primary care (PC)
Yes(since 2007)
Governance Ministry of Health department specifically dealing with PC No
% physicians reporting that a patient complaint procedure was in place in practice/unit
83.0
Financing Employment status of PC physicians 100%
State employed % of active physicians in Belarus working in PC 12.4%
% patients reporting copayments for PC prescriptions 58.0
Resource gen-eration
% of active physicians in Serbia working in PC 28.0
% doctors working in PC who are retrained GPs 21.6
Average age of GPs 49.0
Average age of paediatricians 51.0
Hours GPs spend on professional reading (per month)Hours paediatricians spend on professional reading (per month)
17.515.9
1%
Medical universities with a department of General Practice / Family Medicine
5.0
Average number of items of medical equipment available to physicians (from a list of 30 items)
14.0
% of physicians reporting no or insufficient access to a microbiological laboratory
GPs: 7.0Paed.: 11.0
% of physicians reporting no or insufficient access to a biochemical laboratory
GPs: 1.0Paed.: 5.0
% of physicians reporting no or insufficient access to X-ray facilityGPs: 8.0
Paed.: 7.0
% of physicians with a computer in the centre/practiceGPs: 61.0
Paed.: 57.0
Service delivery
Service access % of patients living within 20 minutes travel of GP or paediatrician 73.0
Average number of registered patients per GP 1197.0
Average number of registered patients per paediatrician 975.0
Average number of patient consultations per day per GP 39.0
Average number of patient consultations per day per paediatrician 43.0
Average number of home visits per week per GP 4.0
Average number of home visits per week per paediatrician 2

11Evaluation of the organization and provision of primary care in Serbia
Functions Selected dimensions/proxy indicators
FindingsPhysicians
(N=285)Patients (N=1655)
Average working hours of GP per week 35.0
Average working hours of paediatrician per week 36.0
Average length of patient consultations (minutes)GP: 14.7
Paed.: 14.5
Reported average contact rate with a GP by GP patients per year 9.1
Reported average contact rate with a paediatrician by paediatrician patients per year
9.1
% PC physicians offering evening opening at least once per week 43.0
% GP & paediatrician patients having a same day consultation on demand
GPs: 77.0Paed: 64.0
Referral rate to specialist secondary services (% of all office and home care contacts) *
By GPs: 12%By paed.: 5.0
Referral rate to specialist secondary services (% of all office and home care contacts) *
rural: 10.3urban: 9.9
Coordination % of PC physicians sharing premises with other PC physicians 51.0
% of PC physicians having regular meetings with practice nursesGPs: 15.0
Paed.: 11.0
% of PC physicians having regular meetings with midwivesGPs: 19.0Paed.: 7.0
% of PC physicians having regular meetings with pharmacistsGPs: 1.0
Paed.: 0.0
% therapists providing routine antenatal care 53%
Continuity % physicians keeping medical records routinely GPs: 92.0
Paed.: 96.0
% of patients assigned a GP (not chosen) 5.0
% of patients assigned a paediatrician (not chosen) 8.0
% of patients with their GP for at least 1 year 78.0
% of patients with their paediatrician for at least 1 year 75.0
Comprehen-siveness
% of physicians frequently using clinical guidelinesGPs: 61.0
Paed.: 41.0
†= range 1 (never) - 4 (always)
Score for GPs’ role in first contact care for a selection of 18 health problems†
2.1
Score for paediatricians’ role in first contact care for a selection of 18 health problems†
1.7
Score for GPs’ involvement in the treatment of a selection of 20 dis-eases†
3.0
Score for paediatricians’ involvement in the treatment of a selection of 20 diseases†
2.2
Score for GPs’ involvement in the provision of a selection of 16 preven-tive and medical-technical procedures†
1.5

12Evaluation of the organization and provision of primary care in Serbia
Functions Selected dimensions/proxy indicators
FindingsPhysicians
(N=285)Patients (N=1655)
Score for paediatrician or team member involvement in the provision of a selection of 16 preventive and medical-technical procedures†
1.4
Coverage of public health activities (based on 12 items = 100%) by GPs on a routine basis
32.0
Coverage of public health activities (based on 12 items = 100%) by paediatricians on a routine basis
32.0
% physicians involved in cervical cancer screening programmeGPs: 16.0Paed.: -%
% physicians providing family planning / contraception servicesGPs: 11.0
Paed: 32.0
% GPs providing routine antenatal care 14.0
% paediatricians providing routine antenatal care 42.0
% physicians involved in TB screening GPs: 14.0
Paed: 13.0
% of PC physicians having regular meetings with local authorities 22.0
* Self-referrals not included
Policy recommendations Governance and regulation
• Coherence among PC servicesTeamwork and other facilitating conditions should be promoted to counteract frag-mented provision.The segmentation of the PC system in separate sections for women, children and adults is an unfavourable condition for coherent care provision. For instance, inte-gration of care provided to members of one family may be more difficult to realize than in systems with family-oriented PC. The survey found little teamwork and few structural links among physicians from the three sections. No change in the current segmented system is forseeable.
• Distribution of human resourcesSpecial attention should be paid to a more even distribution of human resources. Short-term measures should be taken to ensure it before new planning mechanisms are developed in the government’s human resources strategy. The distribution of human resources is uneven. In some regions physicians are work-ing for practice populations far above the national norm, while in others there is an oversupply of staff.
• Regional variation There should be a policy decision on the acceptable degree of regional variations, and measures of central regulation or coordination should be taken to ensure even quality of, and access to care.

13Evaluation of the organization and provision of primary care in Serbia
Considerable differences were found among the three regions, for example in refer-ral rates to medical specialists, the use of computers and availability of test results.
• The functioning of chosen doctorsMeasures should be taken to promote an effective functioning of the chosen doctor system as a cornerstone of health care reform.Patients visit other PC physicians than their own chosen doctors, suggesting an imperfect functioning of the system, possibly resulting in duplication and poorly coordinated services.
• Home careThe provision of medical and nursing services in the home should be made available, considering the ageing of the population. Home care should be integrated with PC services, social services and long-term care. Home care services, for instance for the frail elderly, chronically ill or those needing care after hospital discharge have not been developed yet. International trends toward more community care and shorter hospital stays suggest that home care services might be an effective response to the ageing of the population.
Education and professional development
• Professional PC skillsFurther investigation should be undertaken to clarify whether the primary care profes-sionals have the knowledge and skills required for the chosen doctor. If necessary, a CME plan to upgrade current capacity should be developed. More specifically, a list of essential skills should be included to the current CME accreditation. As a result of the high number of referrals to specialists, the professional skills of PC physicians may have eroded below the level needed to provide good quality chosen doctor services.
• Effective CMEA CME system that is guided by the educational need rather than personal interests or other considerations aside from professional development, should be gradually introduced. CME accreditation is an important step towards improving its quality. However, physicians and nurses themselves still decide what CME to attend. Often they do not choose subjects for which education is most needed.
• Use of clinical guidelinesClinical guidelines that are accepted by professionals should be continuously pro-duced and updated. Their use should be monitored, for instance by using them in CME programmes, and making their use part of the annual PC quality assessment.The survey showed that the use of clinical guidelines is far from universal among PC physicians, especially paediatricians.
• The role of nurses in PCThe role of nurses in PC should be shifted from administrative work to nursing work (e.g., prevention, health information, routine monitoring of chronic patients). Mea-

14Evaluation of the organization and provision of primary care in Serbia
sures need to be taken to delegate the administration when possible to non-medical workers, or to computerize it.At present, most nurses are mainly involved in documentation and other paperwork.
Financing and payment
• Patients’ payment for servicesInvestigation of the current copayments needs to be undertaken to examine to what extent they are compatible with the officially maintained principles of access. Patients reported they had to pay for essential PC services including visits to physi-cians and prescribed drugs. These financial obstacles may threaten access to services, especially where socially and economically disadvantaged people are concerned.
• Financial incentives for physicians The planned introduction of capitation payment should be accelerated, and additional financial incentives for improving performance should be considered. The possibility to work as independent contractors to the health insurance system should be given to physicians who would prefer so.The current salary structure for physicians in PC lacks incentives for good performance.
Service delivery
• The range of PC servicesIt should be considered whether the present strong reliance on specialist and hospital services is in line with a policy that aims to prioritize PC. The profile of provided curative services and the involvement in screening by phy-sicians at the PC level was found to be very limited. For instance, GPs had a very limited role as doctors of first contact and rarely provide minor surgery and other medical procedures to their patients. Thus, many relatively simple curative services are provided at the secondary level, as reflected in the high referral rates.
• Clinics for prevention and health education A critical evaluation of the preventive activities, including health promotion clinics, should be done with a view to the public they reach and their effects. In PC much attention is paid to health education and prevention, both in individual patient contacts and in special clinics. In the patient survey, however, only very few respondents said their doctor spoke with them about topics of health promotion during such clinics.
• Medical equipment It should be investigated whether the current low level of medical equipment restricts physicians in their role as chosen doctors. If so, investments should be made to bring the equipment up to the desired level. Physicians had relatively few items of medical equipment at their disposal, which may restrict their clinical possibilities.

15Evaluation of the organization and provision of primary care in Serbia
• ITMeasures should be taken to develop and/or implement relevant health informa-tion software, introduce computers in PC physicians’ offices and make physicians computer-minded.Computers were sparsely used to support physicians in their clinical work, for in-stance, for keeping patient records, rapid identification of patient groups at risk or for searching information in expert systems.
• Home visitsThe role of PC physicians in caring for patients who are unable to visit the practice should be reconsidered.Making home visits is unusual among PC physicians. Indeed, home visits are made by separate organizational units. However, treatment by the same physician in the office and in the patient’s home can contribute to continuity of care.

16Evaluation of the organization and provision of primary care in Serbia
1 evaluating primary care: backgrounds and application
1 .1 . The theoretical framework of the PCET
Careful monitoring is required for the fundamental changes taking place in the health care systems of countries in transition. Although strengthening PC services is a priority of health reforms in many countries, in central, eastern and western Europe, the back-grounds of the reforms are not similar. In western Europe, emphasis on PC is a response to rising costs and changing demand resulting from demographic and epidemiological trends. Central and eastern European countries, as well as those formerly part of the Soviet Union, are struggling to improve the performance and cost effectiveness of their entire health systems. In many of these countries, health care reforms have been and continue to be part of profound and comprehensive changes in essential societal func-tions and values (2).
Evaluations and performance measurements increasingly play a role in health care reforms. Stakeholders need this information to guide their decisions in steering the health system towards better outcomes (3). In the past, reforms were not always based on evidence, and progress was often driven by political arguments or the interests of specific professional groups, rather than by the results of sound evaluations, but now stakeholders – not least governments – are increasingly held accountable for their activi-ties and this requires evidence, for instance on the progress of reforms.
In addition, demographic and epidemiological changes require adaptation on the part of health systems. This requires evaluation of their responsiveness from the patients’ perspectives. Such evaluations generate information about access and convenience of services, how patients are treated by health staff, how patients perceive information and communication about their conditions that can impact on their own behaviour and well-being and how their care is managed at the PC level and beyond.
Furthermore, evaluations and performance assessments should be explained within the national contexts. Only then can performance information serve as direct input to policy making and regulation. However, the role of governments goes beyond the direct use of information. The stewardship role also implies that a necessary flow of information be made available to other stakeholders and that the necessary analytical capacity be available (3).
A final major requirement of evaluations and performance assessments is to start from a proper framework for developing measures. Deriving indicators from an accepted frame-work ensures the relevance of the (proxy) indicators and good coverage of the identified areas. The following sections describe the framework used to develop the PCET.
17Evaluation of the organization and provision of primary care in Serbia
Primary care evaluation and health systems A health system can be defined as a structured set of resources, actors and institutions related to the financing, regulation and provision of health care to a given population. The overall objective of a health system is to optimize the health status of an entire population throughout the life cycle, while taking account of both premature mortality and disability (3). Health systems aim to achieve three fundamental objectives (1,3):
• improved health (e.g., better health status and reduced health inequalities);
• enhanced responsiveness to the expectations of the population, encompassing re-spect for the individual and client orientation; and
• guaranteed financial fairness (households paying a fair share of the national health bill and receiving protection from financial risk resulting from health care).
The level of attainment of these goals ultimately reflects the performance of the system as a whole. However, as there are variations in both health conditions and health systems among countries, national contexts need to be taken into account. Thus, performance measurement should cover both goal attainment and available resources and processes.
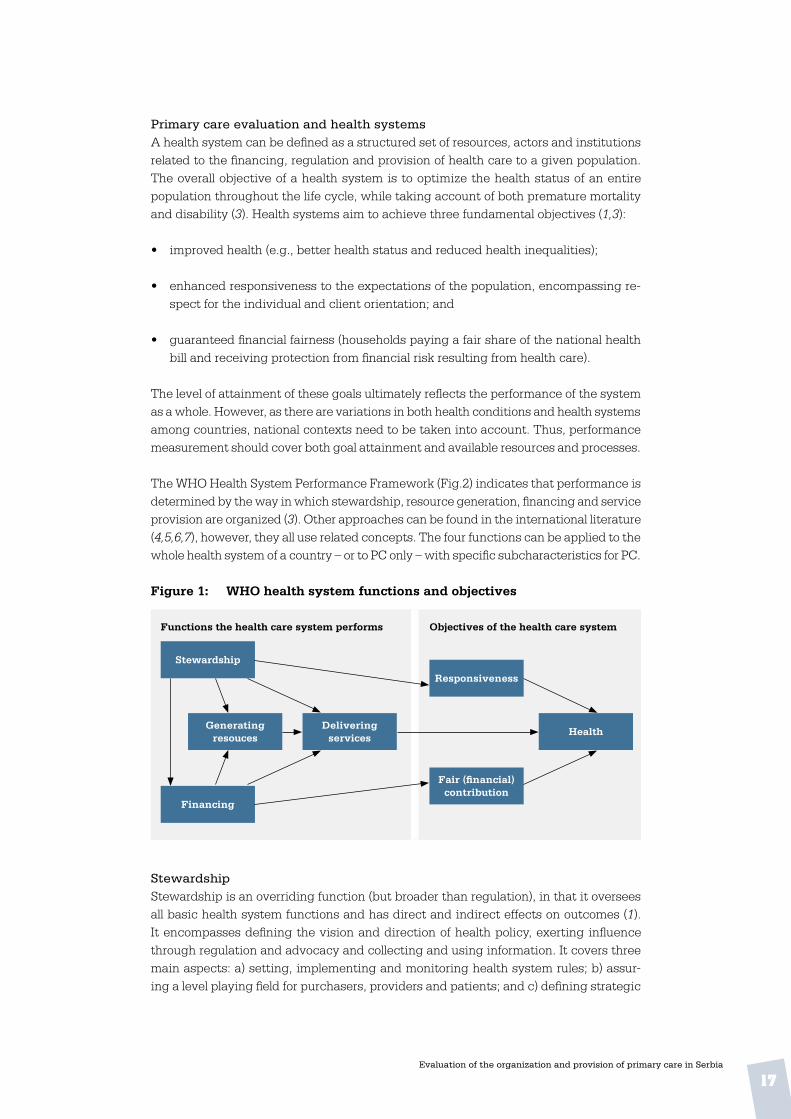
The WHO Health System Performance Framework (Fig.2) indicates that performance is determined by the way in which stewardship, resource generation, financing and service provision are organized (3). Other approaches can be found in the international literature (4,5,6,7), however, they all use related concepts. The four functions can be applied to the whole health system of a country – or to PC only – with specific subcharacteristics for PC.
Figure 1: WHO health system functions and objectives
Functions the health care system performs Objectives of the health care system
Stewardship
Responsiveness
contribution
Generatingresouces
Delivering services
Health
Financing
StewardshipStewardship is an overriding function (but broader than regulation), in that it oversees all basic health system functions and has direct and indirect effects on outcomes (1). It encompasses defining the vision and direction of health policy, exerting influence through regulation and advocacy and collecting and using information. It covers three main aspects: a) setting, implementing and monitoring health system rules; b) assur-ing a level playing field for purchasers, providers and patients; and c) defining strategic

18Evaluation of the organization and provision of primary care in Serbia
directions for the health system as a whole. Stewardship can be subdivided into six subfunctions: overall system design, performance assessment, priority setting, regula-tion, intersectoral advocacy and consumer protection (3). In short, stewardship deals with governance, information dissemination, coordination and regulation of the health system at various levels.
Resource generationAny level of a health system needs a balanced variety of resources to function properly, but they have to be further developed (and expanded) in order to sustain health services over time and across levels and geographical areas. The resources needed encompass physical assets (equipment, facilities), consumable supplies, human resources and in-formation. It is crucial that the quantity and quality of human resources be adequately matched to the demand for services and equitably distributed across the country. Naturally, to ensure quality of care, the skills and knowledge of health providers need to be up-to-date and compatible with developments in technology and evidence-based medicine. Policy development concerning resource planning and a regulatory framework for assuring high quality service provision and consumer protection fall under the stew-ardship function, but the workforce volume, distribution and professional development are usually included under the resource generation function.
FinancingIn general, financing deals with the mobilization, accumulation and allocation of funds to cover the health needs of the people, individually and collectively (8). The financing function in health systems is defined by Murray and Frenk (3) as “the process by which revenues are collected from primary and secondary sources, accumulated in fund pools and allocated to provider activities”. Three subfunctions can be distinguished: revenue collection, fund pooling and purchasing. Revenue collection means the mobilization of funds from primary sources (households, firms) and secondary sources (governments, donor agencies). There are a number of mechanisms through which funds can be mobilized, varying by health systems context, e.g. out-of-pocket payments, voluntary insurance rated by income, voluntary insurance rated by risk, compulsory insurance, general taxes, earmarked taxes, donations from NGOs and transfers from donor agen-cies. In order to share and reduce health risks, funds can be pooled through various forms of health insurance. Purchasing is the allocation of funds to cover the costs (staff, durables and running costs) of specific health service interventions by health providers (institutional or individual) (3). The way these subfunctions are organized and executed has an impact on the access to health services.
Service deliveryService provision involves the mix of inputs needed for the production process within a specific organizational setting leading to the delivery of health interventions (3). It relates to preventive, curative and rehabilitative services delivered to individual patients and to services aimed at larger populations (e.g. health education, promotion) through public and private institutions. Providing services is something that the health system does; it is not what the health system is.
The Primary Care Evaluation FrameworkPC characteristics and definitions vary from country to country (see the Annex); how-ever, a comprehensive or well-developed PC system has the following characteristics:

19Evaluation of the organization and provision of primary care in Serbia
Primary care is that level of a health system that provides entry into the system for all new needs and problems, provides person-focused (not disease-oriented) care over time, provides care for all but very uncommon or unusual conditions, and coordinates or integrates care provided elsewhere or by others. (9)
The Primary Care Evaluation Framework (see figure 2) from which the PCET was de-veloped, encompasses the four functions of a health care system (as mentioned above), combined with the four key characteristics of PC services that are part of service delivery, as derived from the above definition.
Figure 2 . Primary Care Evaluation Framework
Key characteristics of a good PC system
• Access In general, access to health services can be defined as the ease with which health care is obtained (5), or “the patients’ ability to receive care where and when it is needed” (10). Various physical, psychological, sociocultural or financial barriers can restrict ac-cessibility. Included in the PCET scheme are, for instance, geographical limitations, organizational factors such as office hours, distant consultations and timeliness, as well as financial factors such as cost-sharing and copayments.
• Continuity of servicesPC interventions should be geared to patients’ needs over a longer period and cover successive episodes. A general definition of continuity is the “follow-up from one visit to the next” (11). WHO provides a more comprehensive definition, which takes into ac-count the possible involvement of various health care providers. It is described as “the ability of relevant services to offer interventions that are either coherent over the short term both within and among teams (cross-sectional continuity), or are an uninterrupted series of contacts over the long term (longitudinal continuity)” (10).
Several levels of continuity can be distinguished (12): informational continuity related to the medical and social history accessible to any health care professional caring for the patient; longitudinal continuity, in a specific locus where a patient customarily receives health care from an organized team of providers in an accessible and familiar environment; and interpersonal continuity, an ongoing personal relationship between
Stewardship
Responsiveness
Delivery of PC services
Resourcegeneration
Financing &incentives
Access to services Continuity of care
Comprehensiveness Coordination of care

20Evaluation of the organization and provision of primary care in Serbia
the patient and the care provider (12). Furthermore, Reid et al. (13) add another level, management continuity, the provision of timely and complementary services within a shared management plan. The PCET scheme includes informational, longitudinal and interpersonal continuity of care.
Coordination of deliveryParticularly because PC often serves a gate-keeping function to other levels of care, coor-dination of services at PC level is an important element in health system responsiveness. The potential for coordination problems is particularly evident in the primary – secondary interface, or between curative care and other health promotion services (14). A general definition of coordination is “a technique of social interaction where various processes are considered simultaneously and their evolution arranged for the optimum benefit of the whole” (8), more specifically:
…a service characteristic resulting in coherent treatment plans for individual patients [where] each plan should have clear goals and necessary and effective interven-tions, no more and no less. Cross-sectional coordination means the coordination of information and services within an episode of care. Longitudinal coordination refers to the “interlinkages among staff members and agencies over a longer episode of treatment”. (10)
In the PCET scheme, the various dimensions of coordination encompass collaboration within a PC practice, on the same level of PC providers (GPs, community nurses, phys-iotherapists, etc.) and between PC and other levels of care in the context of consultation and referral systems.
• ComprehensivenessComprehensiveness can be defined as the extent to which a full range of services is either directly provided by a PC physician or other provider or specifically arranged elsewhere (15). In PC, comprehensiveness encompasses curative, rehabilitative and supportive care, as well as health promotion and disease prevention (14,16). Comprehensiveness of services is not only manifested in the specific range of services provided but also refers to practice conditions, facilities and equipment, and the professional skills of the PC service provider. The community orientation of PC workers also plays a role. All these dimensions have been taken into consideration for the PCET scheme.
The Primary Care Evaluation SchemeTaking the Primary Care Evaluation Framework (1) as its basis, the Primary Care Evalu-ation Scheme focuses on specific issues, policies and health care priorities relevant to countries. The scheme consists of measurable topics and items related to essential features and national priorities for change in PC and the facilitating conditions. The evaluation scheme, which in turn forms the basis of the PCET, is structured as follows:
• stewardship
• financing and incentives
21Evaluation of the organization and provision of primary care in Serbia
• resource generation
• delivery of PC, subdivided into: » accessibility » care continuity » care coordination » service comprehensiveness.
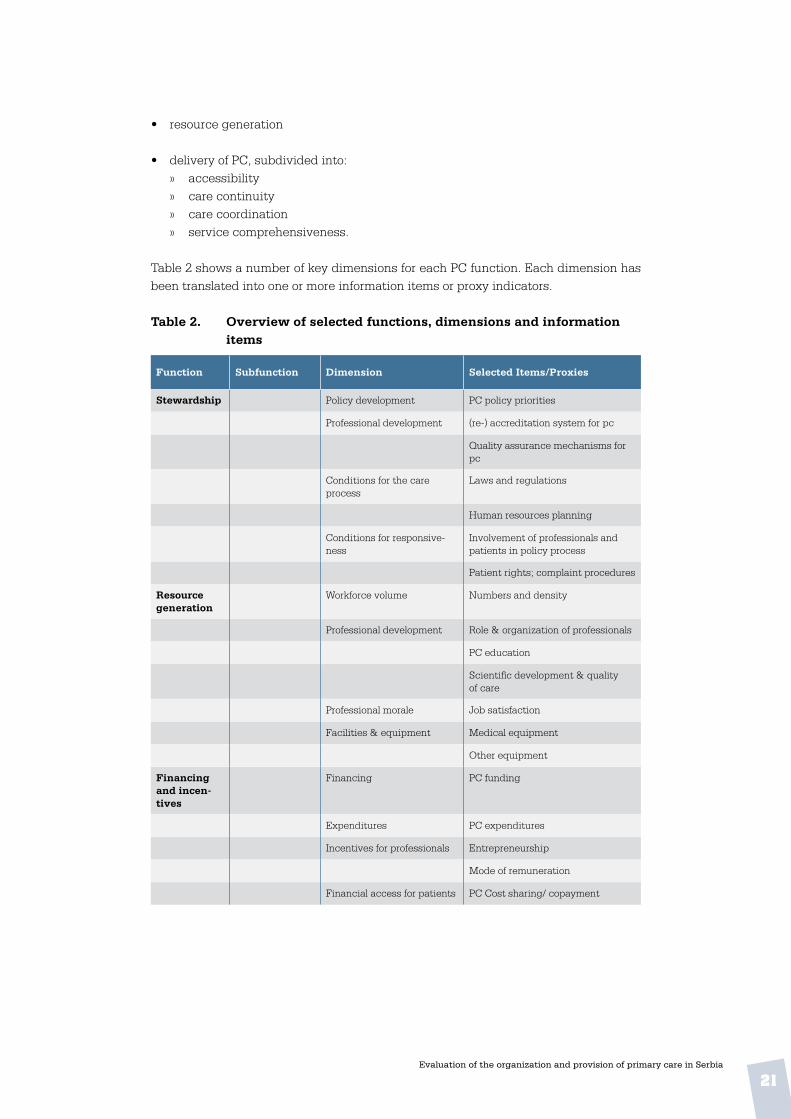
Table 2 shows a number of key dimensions for each PC function. Each dimension has been translated into one or more information items or proxy indicators.
Table 2 . Overview of selected functions, dimensions and information items
Function Subfunction Dimension Selected Items/Proxies
Stewardship Policy development PC policy priorities
Professional development (re-) accreditation system for pc
Quality assurance mechanisms for pc
Conditions for the care process
Laws and regulations
Human resources planning
Conditions for responsive-ness
Involvement of professionals and patients in policy process
Patient rights; complaint procedures
Resource generation
Workforce volume Numbers and density
Professional development Role & organization of professionals
PC education
Scientific development & quality of care
Professional morale Job satisfaction
Facilities & equipment Medical equipment
Other equipment
Financing and incen-tives
Financing PC funding
Expenditures PC expenditures
Incentives for professionals Entrepreneurship
Mode of remuneration
Financial access for patients PC Cost sharing/ copayment

22Evaluation of the organization and provision of primary care in Serbia
Function Subfunction Dimension Selected Items/Proxies
Delivery of Care
Access to services
Geographical access Distance to PC practice
Distribution of PC physicians
Organizational access List size
PC provider workload
PC outside office hours
PC home visits
Electronic access
Planning of non-acute consultations
Responsiveness Timeliness of care
Service aspects
Clinics for specific patient groups
Continuity Informational continuity Computerization of the practice
Medical records
Longitudinal continuity Patient lists
Patient habits with first contact visits/referrals
Endurance of patient-provider relationship
Interpersonal continuity Patient-provider relationship
Coordination
Cohesion within PC PC practice management
Collaboration among GPs/family doctors
Collaboration of physicians with other PC workers
Coordination with other care levels
Referral system/gate-keeping
Shared care arrangements
Comprehen-siveness
Practice conditions Premises, equipment
Service delivery Medical procedures
Preventive, rehabilitative, educa-tional activities
Disease management
Community orientation Practice policy
Monitoring and evaluation
Community links
Professional skills Technical skills

23Evaluation of the organization and provision of primary care in Serbia
In order to evaluate the complexity of any PC system, information is gathered on differ-ent administrative levels and from health providers and patients. Therefore, the PCET consists of three separate questionnaires – for experts (national level), physicians and patients – which cover all identified PC functions, their dimensions and information items, as derived from the scheme. The questionnaires for GPs and patients are pre-structured, with precoded answers. The expert questionnaire has prestructured as well as open-ended questions, and list of statistical data to be provided.
1 .2 Overview of the PCET development and pilot testing
PCET development started in February 2007 and was completed in May 2008, when the final instrument became available to WHO for its health system support activities with Member States. The successive stage of development, from desk research to pilot implementation and an international meeting to discuss experiences and results, will be shortly explained. The development process has been described in more detail else-where (21,22,23).
• Literature reviewAs a first step, the researchers at NIVEL conducted a directed literature study on the basis of the WHO performance framework (1), to find ways to implement key PC system functions. Particular attention was paid to indicators and existing performance measure-ment and evaluation tools and questionnaires. This resulted in a preliminary listing of dimensions and items for the tool.
• First exchange with experts of the WHO RegionThe outcomes of the literature study were discussed in an international expert meeting in March 2007. Major objectives of the meeting were to discuss and reach consensus on key concepts and definitions, discuss and validate the provisional set of dimensions, proxy indicators and information items and improve the first version of the scheme (see Table2) in order to develop the questionnaires. First steps were also taken for pilot implementation of the provisional tool.
• Drafting, validating and translating questionnairesDraft versions of the questionnaires were developed on the basis of the information and feedback from the expert meeting. Comments from the experts on these versions were incorporated in new versions of the three questionnaires. These versions were subsequently tailored to the situation of the two pilot countries, the Russian Federation and Turkey. Terms were adapted accordingly and, on request of health authorities in the two Member States, some additional questions were included on topics related to national PC priorities. The final versions were translated into the respective languages in a check and double-check procedure. The translations were first made into the local language with inputs from a PC expert and then back-translated and compared to the original version.
Two pilot implementationsThe provisional tool was pilot tested in two provinces in Turkey and two districts in the Moscow region of the Russian Federation. Under supervision of the WHO Regional Office for Europe and the respective ministries of health, local partners together with

24Evaluation of the organization and provision of primary care in Serbia
the technical lead of NIVEL organized the details of the fieldwork, including sampling procedures, training of fieldworkers, logistics of data collection and data entry. In both countries meetings were organized with experts to discuss and validate the answers on the national level questionnaires. All data were analysed, conclusions and policy recommendations formulated and a draft report produced – including a section on les-sons learned with the pilot implementation (18,19).
Copenhagen consultation meetingThe draft report was than discussed at a review meeting with international experts at the WHO Regional Office for Europe in Copenhagen on 14–15 April 2008, resulting in a revision of the three questionnaires, with the following changes:
• Questions were made more factual, avoiding asking for opinions.
• The sequence of topics and questions was reordered.
• The national level questionnaire was changed into a more comprehensive background document to be prepared by a small team of local experts and subsequently discussed and validated in a focus group directed by WHO and NIVEL.
• The questionnaires for patients and physicians were shortened.
• The language throughout the questionnaires was made more consistent.
• In addition to the results of the surveys other complementary sources of information were to be used, such as available literature, articles, interviews with health care workers and experts and personal observations during site visits.
• For implementation of the tool, countries would be able to add questions related to specific national priority areas (such as TB care and reproductive health services in the case of Belarus).
• The final report would contain a set of proxy indicators.
After revision, the PCET was available for use. An implementation scheme for the in-formation of Member State counterparts was produced.
1 .3 Overview of the PCET implementation in Serbia
The PCET was implemented in the framework of the 2008–2009 Biennial Collaborative Agreement (BCA) between the WHO Regional Office for Europe and the Ministry of Health of the Republic of Serbia. Preparation was done during a visit of WHO representatives to Serbia in June 2008. NIVEL, in its capacity as WHO Collaborating Centre, and the National Institute of Public Health in Belgrade named collaborating partners. The project effectively started in May 2009.

25Evaluation of the organization and provision of primary care in Serbia
From 11–15 May 2009, a NIVEL researcher visited Serbia to inform counterparts – together with staff from the WHO Country Office – of the implementation purpose and activities, and to prepare further methodological and logistic steps, as follows.
• The translated questionnaires were explained and discussed with the project’s na-tional working group and the partner National Institute for Public Health.
• Additional questions were formulated to be added to the core of the tool.
• Implementation procedures were discussed with the above-mentioned partner and stakeholders.
• Further planning was discussed with the national coordinator, including identification of target populations of physicians and patients, sampling procedures and fieldwork organization.
• Field visits were made.
A second visit was made from 6–10 September 2009 on further implementation mea-sures, including:
• final fieldwork preparations with local counterparts
• meeting with representatives of facilities
• fieldworker instruction on data collection among physicians and patients
• installation of data entry software and related training
• discussion of the national level questionnaire with experts
• discussion of further planning.
The selected regions and districtsIn order to have a good coverage of the country, in close consultation with local partners it was decided to implement the surveys in Vojvodina, Belgrade and Central Serbia.
Vojvodina Vojvodina is an autonomous province located in the north of the country, with a popula-tion of about two million, with various ethnic and cultural backgrounds, predominantly Serbs and Hungarians. Six official languages are used in the province. Three districts were included in the study:
• Novi Sad, the regional capital (pop. c. 370 000), the second largest after Belgrade, and environs;
• Sombor, in extreme northwestern Vojvodina, with around 100 000 inhabitants, half in the city of Sombor; and

26Evaluation of the organization and provision of primary care in Serbia
• Indija, in southern Vojvodina, with a population of 52 000, half in the city.
BelgradeThe Belgrade area includes the capital and environs, with a total population of 1.6 mil-lion. The area is a separate territorial unit consisting of 17 municipalities of varying size, including:
• Stari Grad, the old city of Belgrade, with a population of 55 000; and
• Voždovac, a large area, ranging from industrial to agricultural, 4 km south of down-town Belgrade with a population of around 150 000.
Central Serbia
• Niš district in the southeastern part of Central Serbia and has a population of 380 000. The administrative centre is the city of Niš, an important industrial centre with 250 000 inhabitants. The district outside the city is divided into 6 municipalities.
• Doljevac is one of the municipalities in the Niš district with a population of around 20 000, fewer than 2000 in the village of the same name.
• Smederovo district has a population of around 109 000 and is situated in the north of Central Serbia, bordering the Belgrade area to the west. The city of Smederevo (pop. c. 80 000) is the heart of Serbia’s steel industry. In the more rural parts of the districts fruit growing is a major business.
The selected districts and municipalities not only offer good geographical coverage, but also allow comparison of Vojvodina, where decentralization is more advanced, to Central Serbia, where it is in an early stage.
Preparation and implementation of the surveysTwo groups were selected for the physicians’ survey: GPs (serving the adult population from the age of 18) and paediatricians. The initial intention of including PC gynaecolo-gists in the survey was not realized since they comprise only 9% of all PC physicians in the country and getting a sufficient number in the study would require almost twice the number of centres to be approached, at prohibitive cost.
Within the selected districts official staff lists were used as the sampling frame. From these lists physicians from both populations were selected by the local counterpart according to a random procedure. In each of the three areas random samples of 25 paediatricians and 75 GPs were to be drawn. So there were 75 respondents among paediatricians and 210 among GPs.
For the patient survey, respondents would be recruited from the practices of 10 pae-diatricians and 28 GPs in each district. Each of these practices was to be visited by a trained fieldworker whose task was to ask attending patients to fill in a questionnaire. For patients under the age of 15 an accompanying adult would be asked. The fieldworkers’ task was to collect 15 completed questionnaires, which would result in 450 respondents among patients of 30 paediatricians and 1260 respondents among patients of 84 GPs (altogether 1710 patients).
27Evaluation of the organization and provision of primary care in Serbia
Role of fieldworkersFieldworkers had a crucial role in the data collection among patients. They recruited and informed the patients and distributed and collected the questionnaires among the patients and physicians. Distribution of questionnaires to physicians working in practices not visited by fieldworkers was done via the management of the respective CHC, and returned in closed envelopes. Fieldworkers were recruited by the local coordinator and instructed by the NIVEL researcher during his second mission, including:
• explanation of the context and objectives of the survey;
• the basic principles and structure of the tool and the type of questions used;
• the specific topics of the questionnaires;
• establishing good rapport with respondents by clear explanation and stressing confidentiality;
• creating a suitable environment for patients to fill in the questionnaire;
• checking readability and completeness of answers; and
• logistics.
Information gathering at the national levelA team of 17 experts contributed to answering the questionnaire, from the following institutions: the Ministry of Health, the National Institute of Public Health, the Regional Institute of Public Health of Vojvodina, the Regional Institute of Public Health of Belgrade, the Department of Social Medicine of the Medical Faculty of the Medical University, the Health Insurance Fund, the Serbian Medical Chamber, the Serbian Nursing Association and the Serbian Agency for Accreditation. The answers and the collected statistical data were translated into English and sent to WHO, NIVEL and national working group experts, with whom a discussion and valida-tion meeting was organized in Belgrade on 10 September 2009. The meeting aimed to check and consider the answers in a broader perspective and to gather more detailed information where possible. Results and outcomes can be read in chapter 3 of this report.
Data processing, analysis and reportingData entry was carried out by the counterpart National Institute of Public Health in Bel-grade. A data-entry program was designed by NIVEL, using SPSS Data Entry Station version 3.0.3. Raw data files were sent to the NIVEL research team for processing and analysis. A draft report with results and preliminary recommendations was discussed in a meeting with Serbian and WHO experts in Belgrade on 9 March 2010. On the basis of suggestions and requests for additional information made at this meeting and further peer review at NIVEL, the draft report was revised and finalized in April 2010. This new version was submitted by NIVEL to the WHO Regional Office for Europe for final editing and publication.

28Evaluation of the organization and provision of primary care in Serbia
Table 3 . Key data on the application of the PCET in Serbia
Elements of the Implementation
Explanation
Target groups • PC physicians (GPs and paediatricians)• Patients (visiting PC facilities)• Health care experts (national)
Locations • Vojvodina (3 districts)• Belgrade (2 districts)• (Rest of) Central Serbia (3 districts)
Type of data collection • PC physicians: survey using prestructured questionnaires (disseminated by field workers and IPH staff)
• Patients: survey using prestructured questionnaires (personally handed over by field workers)
• Health care experts: mixed approach; questionnaire and meeting for validation and feed back
Method of sampling • PC physicians: GPs: random samples in 8 districts; Paediatricians: ran-dom samples in 8 districts
• Patients: the first 15 patients attending the practice of 84 GPs and 30 Paediatricians
• Health care experts: 17, recruited by local partner
Planned sample sizes • PC physicians: 285 (210 GPs+75 Paediatricians), as follows: » Vojvodina: 70 GPs + 25 Paediatricians » Belgrade: 70 GPs + 25 Paediatricians » Central Serbia: 70 GPs + 25 Paediatricians
• Patients 1 710 (with 114 sampled physicians; each 15 patients), as fol-lows » Vojvodina: 28 GPs x 15 = 420 patients
10 Paediatricians x 15 = 150 patients » Belgrade: 28 GPs x 15 = 420 patients
10 Paediatricians x 15 = 150 patients » Central Serbia: 28 GPs x 15 = 420 patients
10 Paediatricians x 15 = 150 patients • 17 health care experts:(from various institutes)
Response • Physicians 285 (GPs: 210 Paediatricians: 75)• Patients: 1.655
Instructions • Local coordinator: methodology of sampling and recruitment; identifica-tion of study populations; lists of GPs and paediatricians; logistics of surveys
• Management of CHCs: aim and approach of the study• Field workers: explanation of questions; how to approach and assist
respondents; quality aspects• Respondents: introduction/instruction included in the questionnaires;
introduction, patient support by fieldworkers
Coordination of fieldwork
• Local coordinator: overall responsibility• Field workers: information of respondents; correct administration of data
collection in their facilities• NIVEL: general supervision during and after field visit
Period of data collec-tion (surveys)
September 2009
Analysis & reporting At NIVEL (Utrecht, Netherlands)
Key dates • WHO preparatory visit: June 2008• First visit NIVEL researcher: 11-15 May 2009• Second visit NIVEL researcher: 6-10 September 2009• Expert meeting nat. questionnaire: 10 September 2009• Data files sent to NIVEL: 3 November 2009• Draft report available: 5 February 2010• Expert meeting / workshop in Belgrade on draft report: 9 March 2010

29Evaluation of the organization and provision of primary care in Serbia
2 introduction to serbia
2 .1 The country2
Figure 3 . Map of Serbia
Source: http://en.wikipedia.org/wiki/File:Serbia-CIA_WFB_Map.png
Situation and administration The Republic of Serbia is a landlocked country between central and southeastern Eu-rope, with borders with Hungary to the north, Romania and Bulgaria to the northeast and east, the Former Yugoslav Republic of Macedonia to the south and Croatia, Bosnia and Herzegovina and Montenegro to the west. Disputes exist concerning the border with Albania and the status of Kosovo.
The Serbian landscape is varied, with fertile plains in the north, limestone ranges and basins in the east and mountains and hills in the southeast, with Mount Midzor as the highest point, at 2169 metres. The country is organized into autonomous provinces, districts, cities and municipalities. Vojvodina, in the north, is an autonomous province consisting of 7 districts, 6 cities and 39 municipalities. The territory of Serbia excluding the autonomous provinces is called Central Serbia, which, however is not an adminis-trative entity and has no government of its own. Central Serbia consists of 17 districts and the capital Belgrade is a district itself. Districts are purely administrative, and do not have councils or other representative organs.
The basic units of local self-government are municipalities and cities. Municipalities usually have at least 10 000 inhabitants and are responsible for public services, have
2 Sources: Statistical Office Republic of Serbia at: http://webrzs.statserb.sr.gov.yu/axd/en/index.php ;Serbia: Country Brief 2008. Washington,World Bank, 2008 (http://www.worldbank.org.yu/wbsite/external/countries/ecaext/serbia); Serbia. Wikipedia ( http://en.wikipedia.org/wiki/serbia); Serbia Country Profile. UNDATA (http://data.un.org/CountryProfile).

30Evaluation of the organization and provision of primary care in Serbia
their own budget and are governed by an elected council. Large cities (with more than 100 000 inhabitants) can be divided in a number of municipalities. In those cases com-petences are divided between city authorities and municipalities.
EconomyAfter the turmoil of the 1990s and a period of economic sanctions by the international community, new reform programmes were started after the turn of the century, resulting in economic recovery and increased wealth. Other signs of change are Serbia’s rejoining of the World Bank and the European Bank for Reconstruction and Development, and, in particular, an official application for EU membership in December 2009. As Figure 4 shows, productivity in Serbia is lower than in Croatia, Hungary and Romania. The gross domestic product per capita is less than one third that of the EU-15 countries.
Figure 4 . GDP per capita in PPP$, 2006
Source: WHO HFA database at http://data.euro.who.int/hfadb
In order to increase foreign investments, state institutions need to further improve their performance and be more transparent, which will require legal and judicial reform.
Reduction of poverty and improving the well-being of the most vulnerable groups, es-pecially minorities and rural residents, is another (major) problem that deserves urgent attention, for instance by creating social protection mechanisms and human capacity development. As Serbia has been hit by the economic crisis, like other countries, tack-ling these problems has become more difficult. The severely declining manufacturing output (down by 12.1% from 2008 to 2009) and exports have caused serious economic problems and are a setback to the positive economic development of the past decade.
2 .2 Population and health3
In 2008, Serbia had a population of 7 350 000 (excluding Kosovo), around one-quarter in Vojvodina, and the remainder in Central Serbia. Over the last decade the Serbian popu-
3 Sources: Statistical Office Republic of Serbia ( http://webrzs.statserb.sr.gov.yu/axd/en/index.php); Serbia. Wikipedia ( http://en.wikipedia.org/wiki/serbia); Health for all database. Copenhagen, WHO Re-gional Office for Europe (http://data.euro.who.int/hfadb).
Serbia Hungary Romania EU-15 Croatia 0
5000
10000
15000
20000
25000
30000
35000

31Evaluation of the organization and provision of primary care in Serbia
lation has steadily declined (see figure 5), perhaps due to the hostilities, which caused many people to leave the country, and the very low birth rate (see Table 4). There are large numbers of refugees and displaced people in Serbia. The official number of the UNHCR is 327 000, but the actual number is thought to be higher. Among the diverse ethnic groups in the country, there are an estimated 450 000 Roma, many of whom are socially vulnerable. As many refugees and displaced people are expected to stay, the poverty problem will deserve continued attention.
Figure 5 . Population of Serbia, 1998–2008
Source: Statistical Office RS (excl. data on Kosovo)
In Table 4 and Figures 6 and 7 a number of key indicators for Serbia have been compared to some neighbouring countries and the EU-15. The life expectancy at birth in Serbia is 70.8 years for men, which is higher than in Hungary and Romania but almost 2 years lower than in Croatia and almost 7 years lower than in the EU-15. Female Serbians have an average life expectancy of 76.2 years, comparable to women in Romania, but lower than in Croatia, Hungary and the EU-15.
Figure 6 . Life expectancy at birth in several countries, 2006
Source: WHO HFA database at http://data.euro.who.int
1998
1999
2000
2001
2002
2003
2004
2005
2006
2007
2008
7.0
7.2
7.4
7.6
7.8
8.0
Male Female
Serbia Hungary Romania EU-15Croatia 0
20
40
60
80
100

32Evaluation of the organization and provision of primary care in Serbia
These demographic indicators point to a faster pace of ageing than in the EU-15 coun-tries, where this has become an important policy issue (see 4).
Table 4: Selected demographic, health and life style indicators
Indicator Serbia Croatia Hungary Romania EU-15
Population 0-14 yrs (%) 15.5 15.7 15.5 * 15.2 15.9
Population 65+ yrs (%) 17.2 17.0 15.7 * 14.9 17.5
Population density (per km2) 84 79 108 91 n.a.
Live birth rate (p. 1 000 pop)* 9.2 9.3 9.7 10.3 10.7
Total fertility rate (children per woman) 1.40 1.40 1.35 1.30 1.58
Life expectancy at birth (yrs) M 70.4 F 76.5
M 72.6F 79.4
M 68.8 *F 77.2 *
M 69.8F 77.3
M 77.4F 83.1
Death rate (p. 1 000 pop.) 13.9 11.4 13.5 11.8 9.3
Maternal deaths (per 100 000 live births)
12.7 9.7 8.2 13.5 5.4
Infant mortality (p. 1 000 life birth, reported)
7.1 5.2 6.2 10.8 3.9
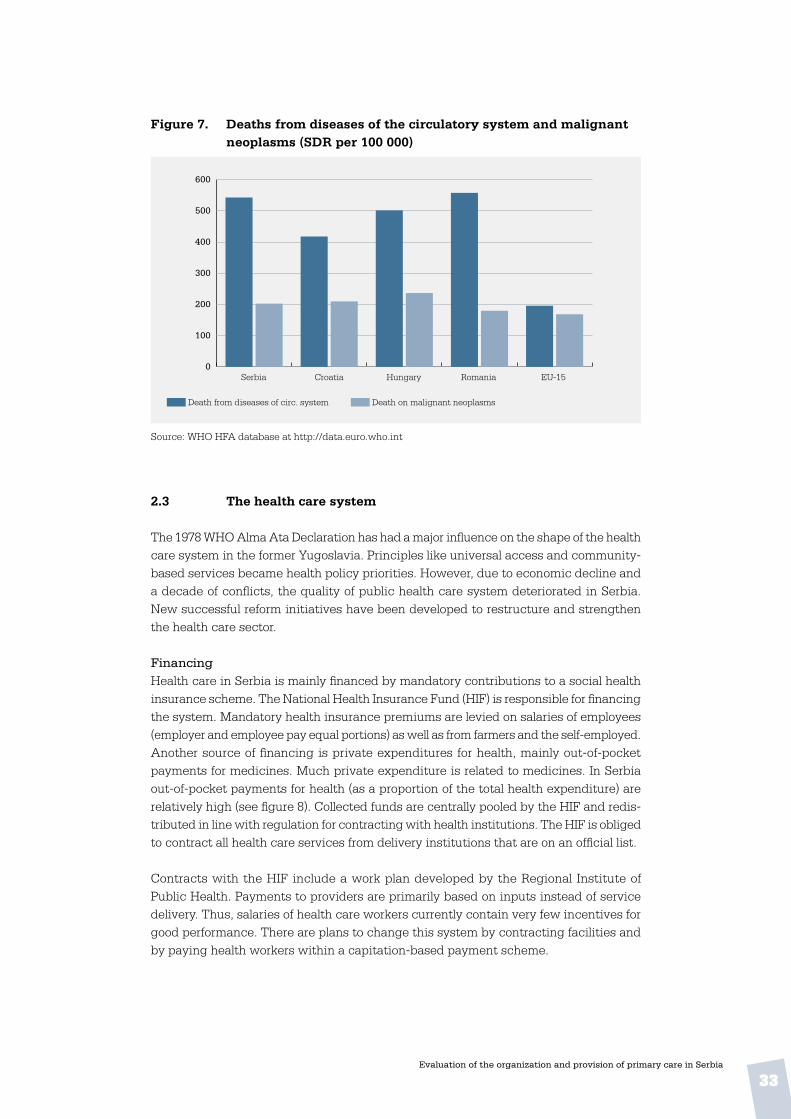
Death from diseases of circulatory system (per 100 000 SDR)
543 418 502 558 196
Death from malignant neoplasms (per 100 000 SDR)
203 210 237 180 169
Death from external cause injury & poisoning (per 100 000 SDR)
45 53 68 57 34
Tuberculosis incidence - official (per 100 000)- estimated
26.6n.a.
20.940
15.317
104.9115
9.213.0
HIV incidence (per 100 000) 1.20 1.49 0.80 0.83 6.14
Abortions (per 1 000 live births) 356 114 449 685 230 *
Regular smokers (% 15+) M: 31 F: 23
M: 34 **F: 22 **
M: 37 **F: 25 **
M: 33F: 10
Germany: M: 37 F: 31 Italy:
M: 29 F: 17
Spain: M: 32
F:22
WHO HFA database at http://data.euro.who.int/hfadb (yr: 2006 or later); n.a. = not available* 2005 or 2004 ** 2003
33Evaluation of the organization and provision of primary care in Serbia
Figure 7 . Deaths from diseases of the circulatory system and malignant neoplasms (SDR per 100 000)
Source: WHO HFA database at http://data.euro.who.int
2 .3 The health care system
The 1978 WHO Alma Ata Declaration has had a major influence on the shape of the health care system in the former Yugoslavia. Principles like universal access and community-based services became health policy priorities. However, due to economic decline and a decade of conflicts, the quality of public health care system deteriorated in Serbia. New successful reform initiatives have been developed to restructure and strengthen the health care sector.
FinancingHealth care in Serbia is mainly financed by mandatory contributions to a social health insurance scheme. The National Health Insurance Fund (HIF) is responsible for financing the system. Mandatory health insurance premiums are levied on salaries of employees (employer and employee pay equal portions) as well as from farmers and the self-employed. Another source of financing is private expenditures for health, mainly out-of-pocket payments for medicines. Much private expenditure is related to medicines. In Serbia out-of-pocket payments for health (as a proportion of the total health expenditure) are relatively high (see figure 8). Collected funds are centrally pooled by the HIF and redis-tributed in line with regulation for contracting with health institutions. The HIF is obliged to contract all health care services from delivery institutions that are on an official list.
Contracts with the HIF include a work plan developed by the Regional Institute of Public Health. Payments to providers are primarily based on inputs instead of service delivery. Thus, salaries of health care workers currently contain very few incentives for good performance. There are plans to change this system by contracting facilities and by paying health workers within a capitation-based payment scheme.
Death from diseases of circ. system Death on malignant neoplasms
Serbia Hungary Romania EU-15Croatia 0
100
200
300
400
500
600

34Evaluation of the organization and provision of primary care in Serbia
According to the ongoing process of decentralization in the PC sector, municipalities increasingly own facilities and equipment, and are therefore responsible for capital investments.
Service provisionThe HIF guarantees access to a relatively broad package of health services to the entire population. Scope and content of care are legally defined and include preventive, curative, rehabilitative, inpatient and outpatient specialist care, and PC including prescription drugs, home care and medical transport. Despite the initial strong emphasis on PC, the system evolved such that curative services were largely carried out by specialists and in the hospitals. The frequent referrals by PC providers to the secondary and tertiary levels resulted in a loss of PC skills, to the point where not all physicians feel capable of performing the more comprehensive chosen doctor duties.
Resources and utilization
Table 5 . Indicators of health care resources and utilization
Indicator Serbia Croatia Hungary Romania EU-15
Total health expenditures as % of GDP (WHO est.)*
8.0 7.4 7.8 5.5 9.6
Total health expenditures per capita (in PPP $)*
395 1.0 1.3 507 2 282
Hospital beds (per 100 000) 540 535 713 654 554
Physicians (per 100 000) 271 259 278 192 338
GPs / District physicians - (per 100 000) - as % of all physicians
6925.5
6525.1
6523.4
6935.9
10230.2
Nurses (per 100 000) 557 524 902 397 805
Pharmacists (per 100 000) 26 57 54 4 81
Dentists (per 100 000) 33 72 42 20 65
Average length of stay (days)- all hospitals- acute hospitals
10.07.8
9.97.5
9.16.0
7.6n.a.
9.46.5
Acute care hospital admissions (per 100)
9.4 14.6 18.5 n.a. 16.7
Outpatient contacts per person (per year)
8.9 6.4 10.8 5.6 Germany: 7.5Denmark: 4.2
Holland: 5.6
WHO HFA database at http://data.euro.who.int (yr: 2007 or 2006) * 2005
Figure 8 below shows that out-of-pocket payments, which increased due to increasing poverty in the 1990s, resulting in more people, particularly those from socially vulnerable groups, having greater difficulty accessing health care services.

35Evaluation of the organization and provision of primary care in Serbia
Figure 8 . Out-of-pocket payments as % of total health expenditure, 2006
Source: The European Health Report 2009. WHO Regional Office for Europe.
Primary care4
At the core of PC in Serbia are the CHC located in all cities and municipalities, which may be relatively large structures, including a number of attached ambulatories, phar-macies and institutes. As a result of decentralization, CHCs are increasingly owned and run by municipalities. This decentralization is an important precondition to implement-ing another financing reform. The new system will be based on contracting facilities, a new payment scheme based on a capitation fee and a clear split between purchaser and provider roles.
Ambulatories are staffed according to the size and needs of the population they serve, varying from several full-time teams of doctors and nurses, dentists and pharmacists working in shifts to one or two weekly doctor visits in remote ambulatories. According to official norms, citizens should have access to a CHC or ambulatory within 15 minutes travel distance. Services provided at CHCs vary considerably. Core services are: preven-tive health care, emergency services, general medical services, women’s and children’s care, home nursing services and diagnostic services (laboratory and imaging). CHCs also provide dental care, occupational medicine, physical therapy, rehabilitation and ambu-lance services if they are otherwise unavailable in the area. If a hospital is more than 20 kilometres away and the catchment area has more than 20 000 inhabitants, the CHC also provides a number of specialist services, including internal medicine, tuberculosis care (phtysiology), ophthalmology, ENT and psychiatric services.
A core element of the ongoing PC reform is the chosen doctor scheme, which requires people to register with a PC physician of their choice. This can either be a GP, a gyn-aecologist, a paediatrician or an occupational doctor. At present, well over 75% of the
4 Based on the draft working paper, “Better primary health care for us; Policy directions to strengthen the primary health care system in Serbia, from 2010 to 2015”. Ministry of Health of the Republic of Serbia / Balkans Primary Health Care Policy Project (CIDA funded). Belgrade, 2009
Net
herla
nds
Luxe
mbo
urg
Fran
ceC
hech
Rep
ublic
Uni
ted
Kin
gdom
Slov
enia
Irel
and
Den
mar
kC
roat
iaG
erm
any
San
Mar
ino
Nor
way
Aus
tria
Swed
enB
elar
usIc
elan
dFi
nlan
dIt
aly
Mal
taSp
ain
Mon
aco
And
orra
Bel
gium
Rom
ania
Port
ugal
Tur
key
Slov
akia
Est
onia
Pola
ndSe
rbia
Mon
tene
gro
MK
DLi
thua
nia
Rus
sian
Fed
erat
ion
Swit
zerla
ndIs
rael
Tur
kmen
ista
nK
azak
hsta
nG
reec
eU
krai
neLa
tvia
Bul
gari
aB
osni
a an
d H
erze
govi
naC
ypru
sU
zbek
ista
nA
rmen
iaR
epub
lic o
f Mol
dova
Kyr
gyzs
tan
Alb
ania
Aze
rbai
jan
Geo
rgia
Taj
ikis
tan
Payment (% of health expenditure)
0
10
20
30
40
50
60
70
80

36Evaluation of the organization and provision of primary care in Serbia
population has registered with a chosen doctor, who is the doctor of first contact, coor-dinating care across levels and being accountable for it.
Figure 9 . Physicians working in PC as a percentage of all physicians
Source: WHO HFA database at http://data.euro.who.int (yr: 2007 or 2006)
Serbia Hungary Romania EU-15Croatia 0
5
10
15
20
25
30
35
40
37Evaluation of the organization and provision of primary care in Serbia
3. primary care in serbia: national context
This chapter will provide an overview of the priorities, regulation and structures rel-evant to PC in Serbia. Topics will include: national policy and legislation, the financial arrangements, workforce and education of providers, aspects of quality assurance and the role of patients.
Information in the chapter is based on answers provided on questions in the national level questionnaire by a team of experts. The statistical backgrounds were contributed by the National Institute of Public Health. Results will be described according to the health system functions and dimensions used in the Primary Care Evaluation Scheme (see Table 2). This chapter describes the context for the results of the surveys among PC physicians and their patients, to be described in the chapters 4 and 5.
3 .1 Stewardship / governance
3 .1 .1 Policy development
The 1978 WHO Alma Ata Declaration, with its community orientation and focus on in-tersectoral collaboration, strongly influenced health care in Yugoslavia. Since then, the health care system has gradually lost its position as an international model as a result of the economy, the disintegration of Yugoslavia and a period of hostilities and isolation of the country. In the years after the turn of the century steps were taken to reverse the trend. The 2002 document “Health policy in the Republic of Serbia” focused on the health status of the Serbian population and the health potential of the nation. It advocated fair and equal access to health care for all, particularly vulnerable groups, putting the user into the centre of the system, health system sustainability, transparency and partial de-centralization, and it aimed to improve performance, efficiency and quality of services. The document also defined the role of the private sector. In 2002 and 2003 two more policy papers were published: “Vision of the health care system in Serbia” and “Strategy and action plan for health system reform in Serbia by the year 2015”. These documents were later contained in the more comprehensive strategic document “Better health for all in the third millennium”, which has been the basis of the health sector reform since. It prioritized prevention and PC, with the team of chosen doctors at the core, consisting of internist or occupational medicine, specialists for adults, paediatricians, gynaecolo-gists and dentists. Other PC services are emergency services, diagnostic services, some specialist-consultative outpatient services and community nursing.
Timeline of PC policy measures Between 2002 and 2009 the following policy documents were published:
• 2002: Health policy of the Republic of Serbia;
• 2003: Better health for all in the third millennium;

38Evaluation of the organization and provision of primary care in Serbia
• 2005. Law on health care protection (Official Gazette, Journal of RS no. 107/2005) (definition of the types of health services and health institutions at primary level; social care; patient rights);
• 2005: Law on Health Insurance (Official Gazette, Journal of RS no.107/2005.) (rights of the insured to health care; responsibilities of chosen doctors);
• 2006: Regulation on detailed conditions for carrying out health activities in health care facilities and other forms of Medical Services (Official Gazette, Journal of RS no. 43/2006) (criteria for staff, space, equipment and drugs in primary level facilities, average number of patients per chosen physician, PC services);
• 2006: Regulation on conditions and internal management of health institutions (Of-ficial Gazette of RS no. 43/2006);
• 2007: Rules on health care quality indicators (Official Gazette of RS no 57/2007) (qual-ity indicators, waiting lists)
• 2007: Regulation on detailed conditions for the implementation of continuing educa-tion for health workers and health assistants (criteria for continuing education and choice of institutions providing continuing education);
• 2008: Regulation on exercising the right of compulsory health insurance (Official Gazette of RS no 108/2008, 112/2008, 11/2009, 24/2009, 56/2009, 80/2009) (number of patients per chosen doctor, procedure of choice, changing chosen doctors);
• 2009: Decree on the Plan network of health institutions (Official Gazette. Journal of RS no.71/2009) (number, structure, capacity and territorial layout of all state-owned health institutions; health establishments for municipalities with at least 10 000 inhabitants or for two or more municipalities.
• 2009: Regulation on the content and scope of the right to health protection from compulsory health insurance and copayment for 2009 (Official Gazette of RS no. 43/06), (content and scope of rights, including prevention, diagnostics, treatment, rehabilitation, etc.); copayments for certain treatment categories),
• 2009: Regulation on conditions, criteria and standards for the contracting health care providers and to set the level of compensation for their work for 2009 (contractual conditions and criteria of HIF funding);
• 2009: Regulation on the nomenclature of health services at primary level (Official Gazette of RS no 23/2009) (list of health services, personnel and time for PC services).
National programmes and national health strategiesSince 2005 national programmes have been adopted for: cancer, colorectal cancer, breast cancer prevention, prevention and early detection of type two diabetes, prevention of cervical cancer, health of women, children and youth, and dental care. National strategies have been developed for: public health, combating drug abuse, palliative care, quality and safety improvement for patients, youth health and mental health.
39Evaluation of the organization and provision of primary care in Serbia
Prevention and early detection (screening) play an important role in the execution of national programmes and strategies on the CHC level. The chosen doctor role is domi-nated by prevention, promotion of healthy lifestyles and health education.
Primary-secondary care splitSince 2005, PC institutions (CHCs) have been separating from secondary care facilities (general hospitals). The old conglomerates including both primary and secondary care functions should have disappeared by 2010. This reform is part of the decentralization of health services under which CHCs are owned and managed by municipalities.
New payment schemeAfter two years of preparation the capitation-based payment system is now being implemented. Payment is related to the number of patients registered with a doctor and performance indicators of efficiency and quality of care are used. Teams of doctors and nurses are rewarded for the performance of certain preventive examinations (such as PAP tests with gynaecologists in PC).
Health promotion centresSince 2006, many CHCs have opened counseling centres for health promotion, primarily intended for employed people, where visitors can have health checks and have their risk for non-communicable diseases assessed.
Human resources planningAs a result of a 2009 regulation, human resource plans are being implemented in publicly owned facilities, aiming to achieve a more rational distribution of staff in line with the official norms and standards. This activity will further rolled out in the coming years.
Licensing of workersAs a result of the project PHC Policy in the Balkans, a scheme on licensing and relicens-ing of health care workers was initiated on 1 January 2010. Relicensing is dependent on staff CME achievements. During the past two years of preparation, all health workers had to get licensed by producing documentation of their qualifications, experience and working status to the Medical Chamber. Educational programmes have been accredited by the Health Council.
Voluntary accreditation of CHCsAccreditation of health care facilities is not obligatory in Serbia. However, some pilot CHCs have successfully completed voluntary accreditation. More CHCs are interested, but funding of accreditation seems to be an obstacle. Primary, emergency and occu-pational medicine services are also subject to initiatives aiming to improve efficiency. Chosen doctorBy the end of 2009 an estimated 75–80% of the population had registered with a doctor (GP, occupational medicine doctor, paediatrician, gynaecologist or dentist) in the CHC in their home territory. Tasks of chosen doctors are to: organize and implement measures to preserve and improve the health of individuals and families; provide detection and suppression of risk factors; provide diagnosis and timely treatment; provide emergency medical care; refer the patient to an appropriate health institution or a medical special-
40Evaluation of the organization and provision of primary care in Serbia
ist; coordinate continued treatment; provide home treatment, health care, palliative care, and post-hospital treatment; prescribe medicines; provide mental health care and perform other duties required by law.
3 .1 .2 Central and local health governance
Primary care at the MinistryNo one section or department at the Ministry of Health has charge of or a coordinat-ing role in PC. In fact, since 2008, there are six sections and departments with partial responsibility for it:
• Organization of Health Services and Health Inspection Section (with one PC reforms coordinator)
• Health Insurance and Health Care Financing Section
• Department of Public Health and Health Care Programme
• Department of Sanitary Surveillance
• European Integration and International Cooperation Section
• Department of Medicines and Medical Devices.
Regional differences in PCThe old regional primary and secondary care conglomerates were different in size and range of services. Decentralization, which should be completed in 2010, will result in priorities and service provision in CHCs increasingly tuned to local needs and circum-stances. Consequently, regional PC differences are likely to grow. For the provision of health care, municipalities are supposed to:
• monitor population health
• set and implement priorities
• create conditions for accessibility and uniform pc utilization
• plan and implement environmental protection programmes
• test food, drinking water, sanitation, etc.
• fund construction, maintenance and equipment of health facilities.
Local governments may design their health care programmes for certain categories of people or types of disease, beyond the national programmes. They also have the power to appoint and dismiss directors and members of management and supervisory boards of health institutions. So, municipalities can make a difference in the range and quality of PC services, the quality of premises and transportation and the patient-friendliness of services and accommodations. Other differences among municipalities may be seen in the way vulnerable groups are cared for; how media are used for health promotion and

41Evaluation of the organization and provision of primary care in Serbia
copayment schemes. The development of municipal health policies will largely depend on local economic conditions.
It should be noted, however, that the financing of health care costs such as salaries, consumables and medicines is not the responsibility of the municipalities, but rather of the HIF (for health services) and the Ministry of Health (for national programmes). Furthermore, municipalities and their CHCs are obviously bound by national rules on financing and criteria for service provision and staffing.
3 .1 .3 Licensing and accreditation
PhysiciansThe following are formal licensing requirements for public and private physicians:
• a medical degree
• a six-month postgraduate internship
• passing a professional exam
• permission to work independently to a minimum of half-time
• working in the area for which the license applies.
Chosen doctors (GPs) must renew their license every seven years, according to the fol-lowing criteria:
• a minimum of 50% of working time in the area for which the license applies
• having been subject to disciplinary procedures
• 24 points annually in accredited CME programmes.
NursesLike physicians, nurses are obliged to recertify every seven years, under the same criteria.
CHCsAccreditation is not obligatory for CHCs. An experimental voluntary accreditation scheme is in place, evaluating:
• clinical quality of work
• protocols and procedures
• good clinical practice guidelines
• work processes
• leadership, management, human resources
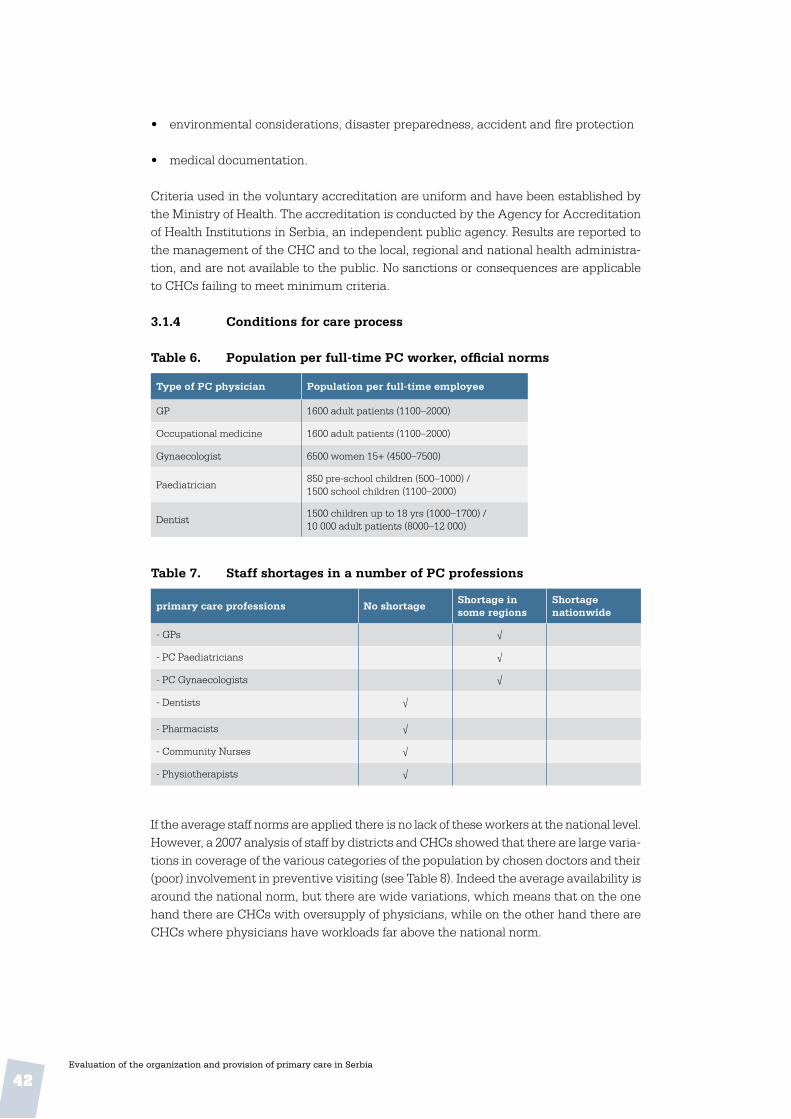
42Evaluation of the organization and provision of primary care in Serbia
• environmental considerations, disaster preparedness, accident and fire protection
• medical documentation.
Criteria used in the voluntary accreditation are uniform and have been established by the Ministry of Health. The accreditation is conducted by the Agency for Accreditation of Health Institutions in Serbia, an independent public agency. Results are reported to the management of the CHC and to the local, regional and national health administra-tion, and are not available to the public. No sanctions or consequences are applicable to CHCs failing to meet minimum criteria.
3 .1 .4 Conditions for care process
Table 6 . Population per full-time PC worker, official norms
Type of PC physician Population per full-time employee
GP 1600 adult patients (1100–2000)
Occupational medicine 1600 adult patients (1100–2000)
Gynaecologist 6500 women 15+ (4500–7500)
Paediatrician850 pre-school children (500–1000) /1500 school children (1100–2000)
Dentist1500 children up to 18 yrs (1000–1700) /10 000 adult patients (8000–12 000)
Table 7 . Staff shortages in a number of PC professions
primary care professions No shortageShortage in some regions
Shortage nationwide
- GPs √
- PC Paediatricians √
- PC Gynaecologists √
- Dentists √
- Pharmacists √
- Community Nurses √
- Physiotherapists √
If the average staff norms are applied there is no lack of these workers at the national level.However, a 2007 analysis of staff by districts and CHCs showed that there are large varia-tions in coverage of the various categories of the population by chosen doctors and their (poor) involvement in preventive visiting (see Table 8). Indeed the average availability is around the national norm, but there are wide variations, which means that on the one hand there are CHCs with oversupply of physicians, while on the other hand there are CHCs where physicians have workloads far above the national norm.

43Evaluation of the organization and provision of primary care in Serbia
Table 8 . Availability of PC physicians compared to national norms, and involvement in preventive visiting .
Population category
Number per doctor / standard
(min – max per district)
% doctors Involved in preventive visits
(min%-max% per district)
Number of visits per doctor(min-max
per district)
Preschool children 678 / 850(414 – 1104)
20%(14%–32%)
6 995 / 6 000(4 216 – 8 576)
School children 1 515 /1 500(1 069 – 3 935)
17%(10%–25%)
6 951 / 6 000(4 172 – 13 114)
Woman 5 988 / 6 500(4 467 – 15 146)
42%(28%–55%)
4 849 / 6 000(3 606 – 10 912)
Adult population 1 768 / 1 600(1 396 – 2 781)
5%(1%–13%)
6 616 / 7 200(4 836 – 8 796)
Mode of practiceNo information was available about the composition of teams, whether monodiscipli-narily (the number of physicians per team) or multidisciplinarily (the number of workers of various disciplines on a team).
Primary care gate-keepingPatients should first visit their chosen doctors before they can see a medical specialist (by referral).
3 .1 .5 Conditions for responsiveness
The role of NGOs / stakeholdersSince 2002 the Ministry of Health has created mechanisms to involve stakeholders and interest groups systematically in the development of policy documents. It has also encouraged civil society initiatives to formulate ideas and needs and to communicate them to the public. Representatives from the organizations listed below, listed with their relevant activities, are formally part of a working group involved in the drafting of strategic documents and in consensus conferences.
• HIF: health care financing and advising; PC staffing norms;
• Chamber of Health Workers: participation in debates of legislative proposals; licensing;
• Chamber of Health Institutions: consultation on Ministry documents;
• Serbian Medical Society: participating in debate on legislation; organization of expert meetings; contribution to themes set by annual programmes;
• Health Care Trade Unions: consultation on Ministry documents; consensus confer-ences; representing the interests of health professionals;
• Health Workers’ Professional Association: consultation Ministry documents; con-sensus conferences;
44Evaluation of the organization and provision of primary care in Serbia
• Standing Conference of Towns and Municipalities: participation in drafting legisla-tion, regulation and national strategies relevant to local governments; organization of public hearings; expert opinion for amendments to laws, regulations and strategies;
• Consumers’ and patients’ associations, including those for specific diseases and those for health care consumers in general: representing the interests and rights of patients; improvement of conditions for people with special needs; promotion of healthy lifestyles; protection of patient rights; participation in working groups and consensus conferences; and
• Other NGOs relevant to PC, although their scope may be wider, for example, those working with vulnerable groups, such as the Roma population, refugees and dis-placed people.
Patient rights Between 2002 and 2007, a series of patients’ rights-relevant laws and regulations were implemented: Vision of Health Care Development, Strategies of Health System Reform by 2015 including an action plan (integrated in the 2003 policy paper Better Health for All in the Third Millennium), the Health Care Protection Act of 2005, the Professional Health Workers Act of 2005 and the Regulation on Indicators of Quality Health Care of 2007. In a second period, from 2007, the Ministry of Health has launched two campaigns, You Have the Right (including regional meetings with rights advocates, press confer-ences, dissemination of information in all health facilities) and Health is Spreading with a Smile, promoting communication between patients and health workers. Since 2007, the Ministry has been more systematically monitoring aspects of patient rights in health care facilities.
Legislation and regulationImportant aspects of patients’ rights have been addressed in the Health Care Protection Act of 2000, including access to care according to need, resources and equal access, rights and obligations related to compulsory health insurance, patient information, free choice (including choice of doctor), confidentiality of information, self-determination and informed consent , access to medical records, complaints, liability and compensation and information on health protection. The Act also defined patient duties, including: participation in protecting, preserving and improving their health, informing health workers about their health, adhering to prescribed treatment and respecting the house rules of health facilities.
Patient choicePatients are assigned to the CHC in the area where they are living. Within the CHC they can choose to register with any GP or other eligible physician. This freedom of choice, which applies from age 18, is guaranteed by law as far as possible. In rural areas choice can be limited by the small number of doctors working in the ambulatory; in such situ-ations patients may also choose a doctor from the central facility of the CHC. Children until the age of 6 years are supposed to be treated by paediatricians from the child health services, while those between 7 and 18 fall under paediatricians from the Institution of School Health. In smaller CHCs, services for children and youth (0-18) are allowed to be organized in one unit. Children up to age 6 may only have a paediatrician as the chosen doctor; those 7–18 may choose a paediatrician or a GP.

45Evaluation of the organization and provision of primary care in Serbia
Access to specialist servicesExcept in emergencies, access to medical specialists at the secondary or tertiary level is only by referral from a chosen doctor). Specialists usually develop a treatment plan, while suggested medication is prescribed by the chosen doctor, who also conducts the follow-up treatment. Often specialists continue to see the patient for monitoring and control. In particular cases (for instance HIV or TB) the division of roles can be different with possible involvement of other physicians. Treating specialists have to report to the patient’s chosen doctor once per month.
Patient complaintsThe procedure for submitting complaints has been established by the Health Care Protection Act, and is obligatory for every health care facility, including CHCs. Even if complaints are communicated orally they need to be recorded in the facility’s files. Written complaints can be delivered either to a health worker or to the “protector of patient rights” in any health institution. Written complaints must be answered within eight days. Patients can also deliver a complaint directly to the Ministry inspectors. Finally, each municipality and town has an Ombudsman to whom perceived violations of human rights may be reported.
Patient organizationsAs mentioned above, there are many national and regional organizations defending the interests of patients, either those with a specific disease or general users of health care services.
Ombudsman The Citizens’ Protector (or Ombudsman) was established in 2007, to oversee and enhance the protection of human and minority rights, and to monitor fairness and legality of the work of the public administration (including the health services). The Ombudsman is elected in the parliament.
3 .2 Resource generation
3 .2 .1 PC workforce
Table 9 . Numbers of professionals working in PC
PHC providers (public facilities) Number (in 2008)
- GPs / internists 4 348
- PHC paediatricians 1 068
- PHC gynaecologist 461
- GPs+paed+gynaec. in PHC 5 877
- Doctors of occupational medicine n.a.
- PHC nurses 13 361
- PHC midwives 860
The total number of active physicians was 20 638 (2008), nurses 41 144 (2007), midwives 2 425 (2007).
46Evaluation of the organization and provision of primary care in Serbia
The main groups of physicians working in CHCs and ambulatories (GPs, internists, paediatricians and gynaecologists) together made up 28% of all physicians in 2008. Ac-cording to the WHO Health for all (HFA) database 25.5% of all physicians were working in PC in 2007 (see Table 5). The number of active nurses in PC amounted to 33.1% of the total number of nurses in Serbia in 2007 and the 860 midwives comprised up 35.5% of the total number. No data were available on the composition of the PC teams.
3 .2 .2 Professional development
Professional organizationsGPs, paediatricians and gynaecologists are organized as indicated below.
GPs:
• General Medicine Section of the Serbian Medical Society (SMS) (1000 members)
• General Medicine Section of the SMS - Vojvodina
• PHC Committee of the Regional Chamber of Physicians Vojvodina
Paediatricians:
• Paediatrics Section of the SMS (500 members)
• Serbian Society of Paediatrics
Gynaecologists:
• Gynaecology Section of the SMS (300 members)
• Serbian Society of Gynaecologists
All organizations mentioned are reported to be involved in professional development (e.g. guideline development); medical education and scientific activities.
Professional journals:The journal General Medicine has about 500 subscriptions. In addition, PC physicians can submit papers to other professional journals, such as Serbian Archives of Medicine, Doctor or The Doctors Voice, the SMS newsletter.
Medical education Faculties of medicine are found at the universities of Kragujevac, Nis, Novi Sad, Belgrade, and the U.S. Medical School, Belgrade. Four of these institutions offer postgraduate programmes in general medicine / GP. Table 10 provides an overview of the duration of the programmes.
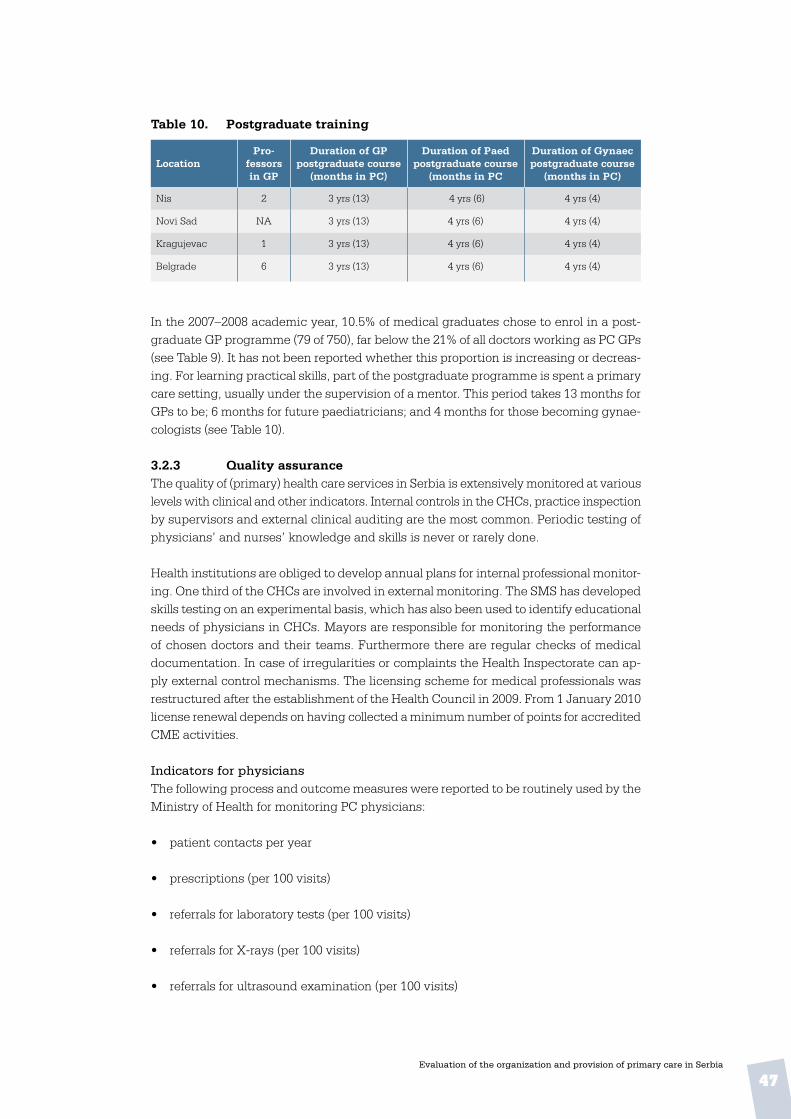
47Evaluation of the organization and provision of primary care in Serbia
Table 10 . Postgraduate training
LocationPro-
fessors in GP
Duration of GP postgraduate course
(months in PC)
Duration of Paed postgraduate course
(months in PC
Duration of Gynaec postgraduate course
(months in PC)
Nis 2 3 yrs (13) 4 yrs (6) 4 yrs (4)
Novi Sad NA 3 yrs (13) 4 yrs (6) 4 yrs (4)
Kragujevac 1 3 yrs (13) 4 yrs (6) 4 yrs (4)
Belgrade 6 3 yrs (13) 4 yrs (6) 4 yrs (4)
In the 2007–2008 academic year, 10.5% of medical graduates chose to enrol in a post-graduate GP programme (79 of 750), far below the 21% of all doctors working as PC GPs (see Table 9). It has not been reported whether this proportion is increasing or decreas-ing. For learning practical skills, part of the postgraduate programme is spent a primary care setting, usually under the supervision of a mentor. This period takes 13 months for GPs to be; 6 months for future paediatricians; and 4 months for those becoming gynae-cologists (see Table 10).
3 .2 .3 Quality assurance The quality of (primary) health care services in Serbia is extensively monitored at various levels with clinical and other indicators. Internal controls in the CHCs, practice inspection by supervisors and external clinical auditing are the most common. Periodic testing of physicians’ and nurses’ knowledge and skills is never or rarely done.
Health institutions are obliged to develop annual plans for internal professional monitor-ing. One third of the CHCs are involved in external monitoring. The SMS has developed skills testing on an experimental basis, which has also been used to identify educational needs of physicians in CHCs. Mayors are responsible for monitoring the performance of chosen doctors and their teams. Furthermore there are regular checks of medical documentation. In case of irregularities or complaints the Health Inspectorate can ap-ply external control mechanisms. The licensing scheme for medical professionals was restructured after the establishment of the Health Council in 2009. From 1 January 2010 license renewal depends on having collected a minimum number of points for accredited CME activities.
Indicators for physiciansThe following process and outcome measures were reported to be routinely used by the Ministry of Health for monitoring PC physicians:
• patient contacts per year
• prescriptions (per 100 visits)
• referrals for laboratory tests (per 100 visits)
• referrals for X-rays (per 100 visits)
• referrals for ultrasound examination (per 100 visits)

48Evaluation of the organization and provision of primary care in Serbia
• referrals for specialist consultation (per 100 visits)
• percentage of preventive contacts (of all contacts)
• coverage of influenza vaccination among people over 65.
The following outcome indicators are recommended by the Ministry to be used at de-central level to monitor PC:
• coverage of influenza vaccination among patients with chronic diseases
• percentage smokers among patients with coronary heart disease (CHD) and stop smoking advice in past 12 months
• percentage patients with CHD with cholesterol record in past 12 months
• percentage patients with hypertension with blood pressure record in past 12 months
• percentage patients with hypertension with record of 140/90 or lower in past 12 months
• percentage women (20 to 65 yrs) with examination for cervical cancer
• percentage children (under 18 yrs) with acute upper respiratory tract infection with antibiotics prescribed at first visit
• percentage first contacts with undefined diagnosis.
Separate sets of mandatory and recommended quality indicators have been developed for medical specialists.
Indicators for institutions Quality improvement in each health care institution, including CHCs, is coordinated by a commission that develops a quality plan, initiates activities and reports about them. The work of the commissions is thoroughly regulated by a set of mandatory quality indicators:
Patient safety
• set procedures for adverse events registration
• set procedures for adverse drug effects the registration
Information dissemination
• information on health care services under compulsory health insurance
• information about private payments and exemptions
• complaint/suggestion boxes
49Evaluation of the organization and provision of primary care in Serbia
• listing of the name, office number and working hours of the protector of patients’ rights
• percentage of complaints/appeals that have been resolved
• listing of chosen doctors, working hours and other details
• patient satisfaction surveys
• analysis of the satisfaction surveys and continuous quality improvement activities
Employees’ satisfaction and keeping up-to-date
• employee satisfaction surveys
• analysis of these surveys and improvement activities
• educational plan for all employees
• workshops, educational meetings and seminars
• indication of staff attendance to relevant courses, seminars etc.
This system of quality indicators has been operational nationwide since 2004 and was updated in 2007. A national quality commission has been continuously improving and extending the indicators. At the annual national conference, an award is given to the facility scoring highest on the current set of indicators.
Clinical guidelinesStandards for good clinical practice (or clinical guidelines) have been produced in a project funded by the European Agency for Reconstruction (EAR). The guidelines are intended to be used by clinicians both in hospitals and PC. After this project, an expert committee started to develop evidence-based guidelines specifically for use in PC. In addition to leading national experts, PC practitioners should be involved in the drafting process. At present 25 guidelines have been published on medical topics under the programme for rationalization and drug administration, with development of diagnostic and therapeutic protocols and patient education. The production of each guideline has been in the hands of a working group with relevant medical specialists, including GPs. They have been promoted and all are available on the Ministry of Health website, and have been distributed free to the CHCs. Physicians are not obliged to follow the guide-lines. Recommendations made in the guidelines have been used in drafting strategic documents, such as the scope and content of health services, national programmes, etc.
No national guidelines for nurses have been developed yet. In general, technical literature for nurses is sparsely available. Some guidelines have been developed in the context of projects, for instance on palliative care and working in the community.
50Evaluation of the organization and provision of primary care in Serbia
3 .3 Financing
3 .3 .1 PC financing and expenditures
For most people copayments are necessary for PC drugs and consultations with the cho-sen doctor. Only certain categories of the population, specified in laws and regulations, are exempted (for instance, disadvantaged groups and people suffering from specific chronic conditions). As noted in section 2.3, out-of-pocket payments as a proportion of total health expenditure are high.
Almost one quarter (24.6%) of the entire health budget is spent on PC, 19.1% in CHCs alone.CHCs are funded mostly (83.8%) by the HIF. Local and central government contribute 4.4% and 0.2% is from donations. Another 11.6% is earned by provision of additional – usually private – services, rental of ambulances and offices, etc. On the expenditure side 70.5% is spent on salaries, 14.5% on procurement of goods and services and 15% on drugs, equipment and other costs.
3 .3 .2 Financial incentives
Payment mechanismsThe calculation of health workers’ salaries is regulated by the Labour Act and the “Regu-lation on coefficients for calculation and payment of salaries of public employees”. In general, salaries are established by application of an education coefficient, which can be increased by a degree of expertise (e.g. specialist, primarius) or academic degrees (Master, PhD). In addition, work experience counts for 0.4% per year of experience. Furthermore, there are supplements for shift work, weekend duty, overtime and field work (e.g., home visits).
The planned introduction of capitation-based PC funding requires a change in the La-bour Act. The capitation formula contains the following four elements: the number of registered patients, the degree of rationality, efficiency and preventive services. In rural areas a correction coefficient is applied to the number of registered patients. In prepara-tion for the new funding scheme, the “Rules on the conditions, criteria and standards for the conclusion of contracts with providers of health services” was amended in 2009, with incentives added for doctor and nurse teams to stimulate registration of patients with a chosen doctor.
Income levels Gross salaries of physicians working at the PC level and at the secondary care level in Serbia are listed in Table 11. GP salaries are equal to those of PC paediatricians, whereas the salaries of secondary care specialists are 35% higher than those of their PC colleagues. Differences in salaries of PC and secondary care specialists arise because of the slightly higher coefficient of qualification in secondary health care, and some differences result from additional payment for night shifts and working on Saturdays and Sundays.

51Evaluation of the organization and provision of primary care in Serbia
Table 11 . Average gross annual salaries of physicians
Medical professionalsGross salary per year*
(in Euros)
GP; chosen PC doctor 7 368
PC Paediatrician 7 368
Gynaecologist/obstetrician (secondary) 10 000
Paediatrician (secondary) 10 000
Internist (secondary) 10 000
Cardiologist (secondary) 10 526
* On average at age 40
3 .4 PC service delivery
3 .4 .1 National data on utilization and provision of services
Table 12 . Key indicators of utilization of PC services
Indicators Rate
Number of PC patient contacts per 1000 population per year* 4 000
Number of PC referrals to medical specialists per 1000 patient contacts** 217
Number of hospital admissions from primary care per 1000 patient contacts 135
Number of PC drug prescriptions per 1000 patient contacts 1 566
* This is part of outpatient contacts.** As reported by the Ministry of Health. The survey among physicians also asked about contact frequencies and number of referrals (see Chapter 4).
Almost 22% of all contacts results in a referral to a medical specialist and 13.5% result in hospital admissions.

52Evaluation of the organization and provision of primary care in Serbia
4. gp and paediatrician responses
This chapter contains the results of the survey among GPs and paediatricians working in CHCs in the regions of Vojvodina, Belgrade and Central Serbia, covering workload and use of time, service availability and access, quality of care, use of clinical information, coordination and cooperation, available medical equipment and clinical task profiles.
4 .1 Respondents’ characteristics
A total of 285 PC physicians responded: 96 in Vojvodina; 95 in Central Serbia and 94 in the Belgrade area (see Table 13). In all three regions around three quarters of the respon-dents were GPs (Vojvodina: 74%, Central Serbia 74%, Belgrade 73%) and one quarter PC paediatricians. Overall 79% of the physicians worked in urban CHCs, but obviously this percentage was higher in the Belgrade area (96%) than in Vojvodina (72%) and Central Serbia (68%).
Table 13: PC GPs and paediatricians
Physicians Vojvodina(N=96)
Central Serbia(N=95)
Belgrade(N=94)
Total(N=285)
urban rural urban rural urban rural Abs . %
GPs 50 21 44 26 65 4 210 74
Paediatricians 19 6 21 4 25 - 75 26
TOTAL 69 27 65 30 90 4 285 100
In Serbia primary medical care is predominantly provided by women, consequently 89% of the respondents were women. The gender distribution is equal for the GPs and the paediatricians.
Table 14 . Gender of urban and rural physicians
Physicians Vojvodina(N=96)
Central Serbia(N=95)
Belgrade(N=94)
Total(N=285)
urban rural urban rural urban rural Abs . %
GPs • Female• Male
427
165
403
233
605
31
18424
65.08.5
Paediatricians • Female• Male
163
6-
174
31
25-
--
678
23.72.8
TOTAL 68 27 64 30 90 4 283 100

53Evaluation of the organization and provision of primary care in Serbia
A number of key characteristics of the physicians and their practices in the three regions are provided in Table 15. Only six physicians answered to have completed a retraining programme. Although in line with the Serbian PC system with separate chosen doctors for adults and children, some respondents working in rural ambulatories without paedia-tricians served a mixed population of adults and children. In Belgrade almost two-thirds of the respondents are older than 50 years; in Vojvodina about half and in Central Serbia well over one-third. Paediatricians on average are somewhat older than GPs.
Table 15 . Summary of characteristics of responding physicians, by region
Physicians Vojvodina (N=96) Central Serbia (N=95) Belgrade (N=94)
Abs . %Valid
Nurban rural
Valid N
urban ruralValid
N
Male physicians 15 15.6 95 11 11.6 94 6 6.4 94
Physicians completing retraining programme
3 3.1 93 1 1.1 91 2 2.1 87
Physicians serving adults and children
13 13.5 96 7 7.4 95 3 3.2 94
Physicians under age 50
49 51.0 96 35 36.8 93 60 63.8 92
Physicians average age • GPs• Paediatricians
Urban49.851.3
Rural*46.748.0
Urban49.851.3
Rural*46.046.5
Urban49.851.3
Rural*45.8
-
Average years work-ing as• GP• Paediatricians
17.817.4
15.214.3
19.522.0
*Including small towns and rural areas
4 .2 Accessibility of care
4 .2 .1 Organizational access
WorkloadThe average number of patients registered with GPs is almost the same in the three regions, around 1200, well below the national norm of 1600. The average number of children reported by paediatricians is closer to the national norm (1100–1200). Although these numbers do not suggest staff shortages, respondent do report them, as seen on the bottom line of the table.

54Evaluation of the organization and provision of primary care in Serbia
Table 16: GPs’ and paediatricians’ workload and use of time, by region
Physicians Vojvodina(N=96)
Central Serbia(N=95)
Belgrade(N=94)
Total(N=285)
MeanValid
NMean
Valid N
MeanValid
NMean
Valid N
List size (patients) • GPs• Paediatricians
1 2071 171
6821
1 181845
6421
1 205916
5623
1 197975
18865
Patient consultations per day• GPs• Paediatricians
4144
7024
4345
7025
3440
6925
3943
20974
Home visits per week • GPs• Paediatricians
53
7022
31
6123
41
5919
42
19064
Working hours per week• GPs• Paediatricians
3632
7025
3538
6525
3538
6020
3536
19570
Hours reading per month• GPs• Paediatricians
1517
6624
2017
6624
1714
6321
1816
19569
Hours following courses per month• GPs• Paediatricians
65
6221
84
4517
56
5110
65
15848
Abs.Valid
NAbs.
Valid N
Abs.Valid
NAbs.
Valid N
Reporting staff shortages• GPs• Paediatricians
238
6825
4115
6925
2313
6623
8736
20373
The same aspects of workload are presented in Table 17, but broken down by level of urbanization. Unlike in many other countries, differences between rural and urban prac-tice are small for most indicators. Rural physicians have only slightly more patients than the urban, make two more home visits and barely work more hours per week.

55Evaluation of the organization and provision of primary care in Serbia
Table 17 . Urban and rural physicians’ workload and use of time, by region
Aspects of workload Vojvodina(N=96)
Central Serbia(N=95)
Belgrade(N=94)
Total(N=285)
MeanValid
NMean
Valid N
MeanValid
NMean
Valid N
List size (patients) • urban physicians• rural physicians
1 1611 289
6326
1 1011 093
5926
1 1011 488
754
1 1201 212
19756
Patient consultations per day• urban physicians• rural physicians
4142
6826
4540
6530
3631
904
4040
22360
Home visits per week • urban physicians• rural physicians
37
6626
23
5727
37
744
35
19757
Working hours per week• urban physicians• rural physicians
33.539.0
6827
36.933.0
6129
35.537.3
773
35.236.0
20659
Working hours per month• urban physicians• rural physicians
13.321.2
6327
19.519.7
6228
15.718.3
804
16.120.4
20559
Hours following courses per month• urban physicians• rural physicians
6.34.6
5825
7.84.8
4121
5.05.7
585
6.24.7
15749
Abs .Valid
NAbs .
Valid N
Abs .Valid
NAbs .
Valid N
Reporting staff shortages• urban physicians• rural physicians
265
6726
4115
6430
351
854
10221
21660
Service availability and accessIn Vojvodina and Central Serbia opening hours in the evening are reported by a major-ity of respondents, but in the Belgrade region such evening services seem to be rarely available. Opening during a weekend day (at least once per month) is widely practised in all three regions. If practices are closed, a majority of physicians report that a telephone number is available for patients.
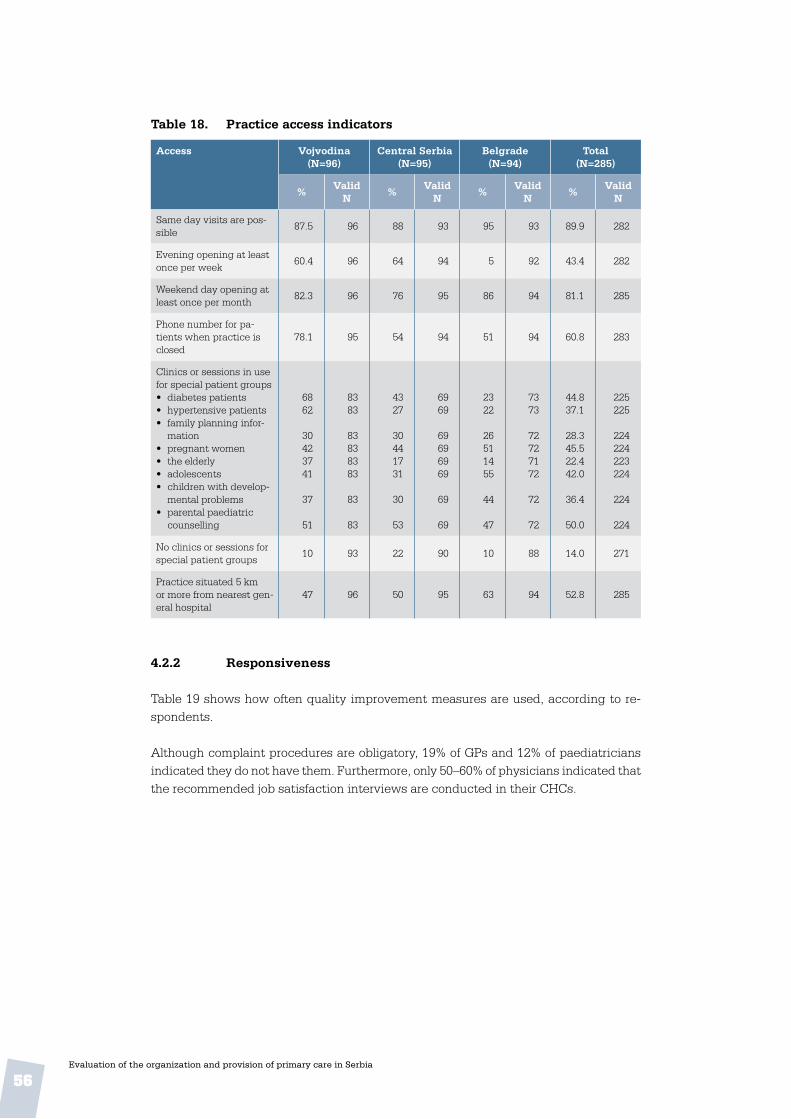
56Evaluation of the organization and provision of primary care in Serbia
Table 18 . Practice access indicators
Access Vojvodina(N=96)
Central Serbia(N=95)
Belgrade(N=94)
Total(N=285)
%Valid
N%
Valid N
%Valid
N%
Valid N
Same day visits are pos-sible
87.5 96 88 93 95 93 89.9 282
Evening opening at least once per week
60.4 96 64 94 5 92 43.4 282
Weekend day opening at least once per month
82.3 96 76 95 86 94 81.1 285
Phone number for pa-tients when practice is closed
78.1 95 54 94 51 94 60.8 283
Clinics or sessions in use for special patient groups• diabetes patients• hypertensive patients• family planning infor-
mation• pregnant women• the elderly• adolescents• children with develop-
mental problems• parental paediatric
counselling
6862
30423741
37
51
8383
83838383
83
83
4327
30441731
30
53
6969
69696969
69
69
2322
26511455
44
47
7373
72727172
72
72
44.837.1
28.345.522.442.0
36.4
50.0
225225
224224223224
224
224
No clinics or sessions for special patient groups
10 93 22 90 10 88 14.0 271
Practice situated 5 km or more from nearest gen-eral hospital
47 96 50 95 63 94 52.8 285
4 .2 .2 Responsiveness
Table 19 shows how often quality improvement measures are used, according to re-spondents.
Although complaint procedures are obligatory, 19% of GPs and 12% of paediatricians indicated they do not have them. Furthermore, only 50–60% of physicians indicated that the recommended job satisfaction interviews are conducted in their CHCs.
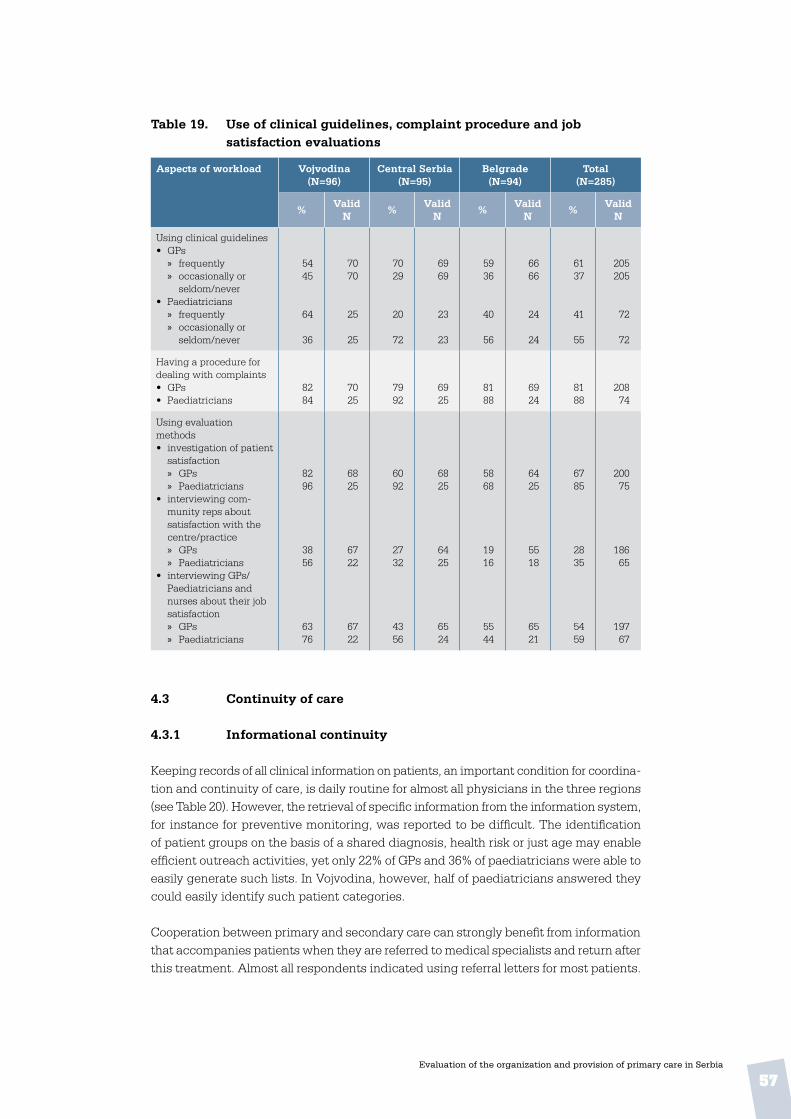
57Evaluation of the organization and provision of primary care in Serbia
Table 19 . Use of clinical guidelines, complaint procedure and job satisfaction evaluations
Aspects of workload Vojvodina(N=96)
Central Serbia(N=95)
Belgrade(N=94)
Total(N=285)
%Valid
N%
Valid N
%Valid
N%
Valid N
Using clinical guidelines • GPs
» frequently » occasionally or
seldom/never• Paediatricians
» frequently » occasionally or
seldom/never
5445
64
36
7070
25
25
7029
20
72
6969
23
23
5936
40
56
6666
24
24
6137
41
55
205205
72
72
Having a procedure for dealing with complaints• GPs• Paediatricians
8284
7025
7992
6925
8188
6924
8188
20874
Using evaluation methods• investigation of patient
satisfaction » GPs » Paediatricians
• interviewing com-munity reps about satisfaction with the centre/practice » GPs » Paediatricians
• interviewing GPs/Paediatricians and nurses about their job satisfaction » GPs » Paediatricians
8296
3856
6376
6825
6722
6722
6092
2732
4356
6825
6425
6524
5868
1916
5544
6425
5518
6521
6785
2835
5459
20075
18665
19767
4 .3 Continuity of care
4 .3 .1 Informational continuity
Keeping records of all clinical information on patients, an important condition for coordina-tion and continuity of care, is daily routine for almost all physicians in the three regions (see Table 20). However, the retrieval of specific information from the information system, for instance for preventive monitoring, was reported to be difficult. The identification of patient groups on the basis of a shared diagnosis, health risk or just age may enable efficient outreach activities, yet only 22% of GPs and 36% of paediatricians were able to easily generate such lists. In Vojvodina, however, half of paediatricians answered they could easily identify such patient categories.
Cooperation between primary and secondary care can strongly benefit from information that accompanies patients when they are referred to medical specialists and return after this treatment. Almost all respondents indicated using referral letters for most patients.
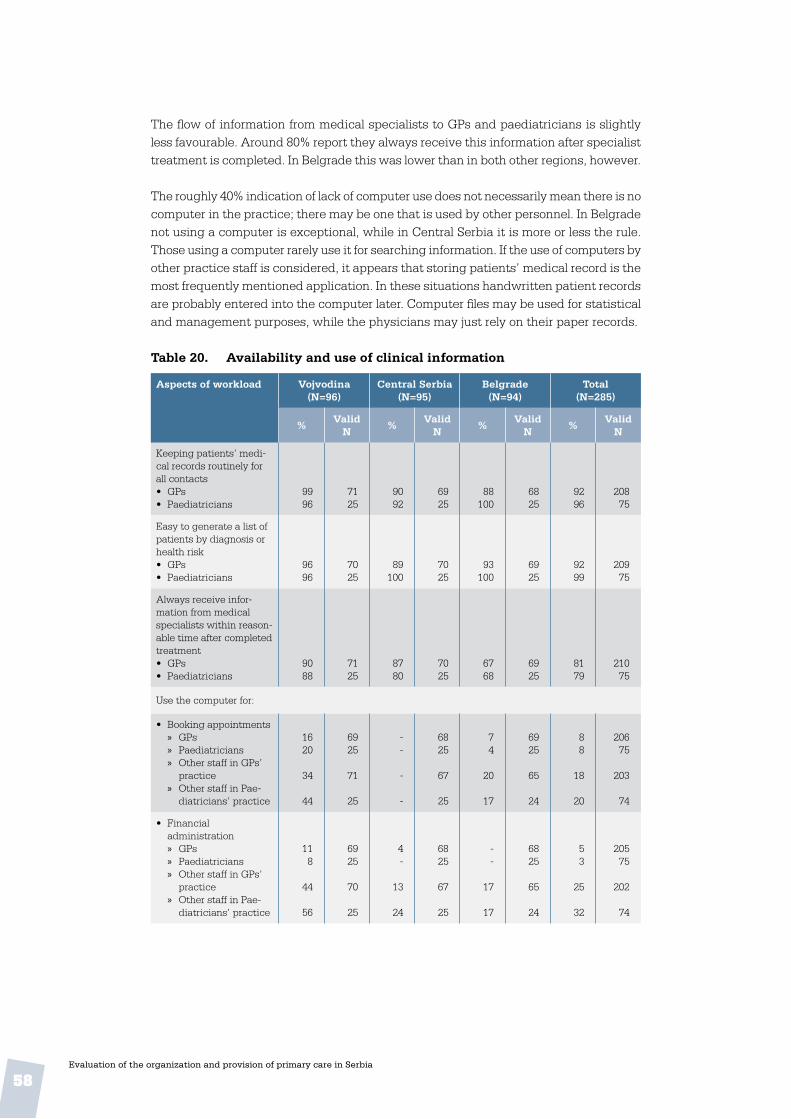
58Evaluation of the organization and provision of primary care in Serbia
The flow of information from medical specialists to GPs and paediatricians is slightly less favourable. Around 80% report they always receive this information after specialist treatment is completed. In Belgrade this was lower than in both other regions, however.
The roughly 40% indication of lack of computer use does not necessarily mean there is no computer in the practice; there may be one that is used by other personnel. In Belgrade not using a computer is exceptional, while in Central Serbia it is more or less the rule. Those using a computer rarely use it for searching information. If the use of computers by other practice staff is considered, it appears that storing patients’ medical record is the most frequently mentioned application. In these situations handwritten patient records are probably entered into the computer later. Computer files may be used for statistical and management purposes, while the physicians may just rely on their paper records.
Table 20 . Availability and use of clinical information
Aspects of workload Vojvodina(N=96)
Central Serbia(N=95)
Belgrade(N=94)
Total(N=285)
%Valid
N%
Valid N
%Valid
N%
Valid N
Keeping patients’ medi-cal records routinely for all contacts • GPs• Paediatricians
9996
7125
9092
6925
88100
6825
9296
20875
Easy to generate a list of patients by diagnosis or health risk• GPs• Paediatricians
9696
7025
89100
7025
93100
6925
9299
20975
Always receive infor-mation from medical specialists within reason-able time after completed treatment• GPs• Paediatricians
9088
7125
8780
7025
6768
6925
8179
21075
Use the computer for:
• Booking appointments » GPs » Paediatricians » Other staff in GPs’
practice » Other staff in Pae-
diatricians’ practice
1620
34
44
6925
71
25
--
-
-
6825
67
25
74
20
17
6925
65
24
88
18
20
20675
203
74
• Financial administration » GPs » Paediatricians » Other staff in GPs’
practice » Other staff in Pae-
diatricians’ practice
118
44
56
6925
70
25
4-
13
24
6825
67
25
--
17
17
6825
65
24
53
25
32
20575
202
74
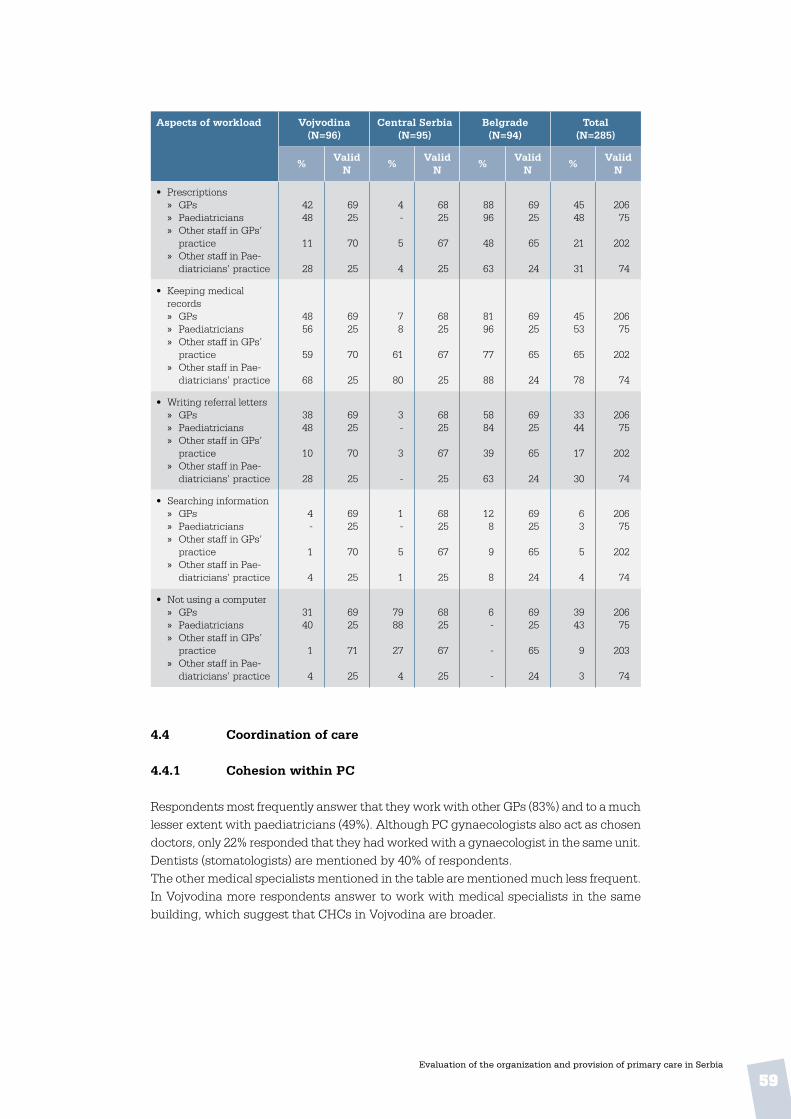
59Evaluation of the organization and provision of primary care in Serbia
Aspects of workload Vojvodina(N=96)
Central Serbia(N=95)
Belgrade(N=94)
Total(N=285)
%Valid
N%
Valid N
%Valid
N%
Valid N
• Prescriptions » GPs » Paediatricians » Other staff in GPs’
practice » Other staff in Pae-
diatricians’ practice
4248
11
28
6925
70
25
4-
5
4
6825
67
25
8896
48
63
6925
65
24
4548
21
31
20675
202
74
• Keeping medical records » GPs » Paediatricians » Other staff in GPs’
practice » Other staff in Pae-
diatricians’ practice
4856
59
68
6925
70
25
78
61
80
6825
67
25
8196
77
88
6925
65
24
4553
65
78
20675
202
74
• Writing referral letters » GPs » Paediatricians » Other staff in GPs’
practice » Other staff in Pae-
diatricians’ practice
3848
10
28
6925
70
25
3-
3
-
6825
67
25
5884
39
63
6925
65
24
3344
17
30
20675
202
74
• Searching information » GPs » Paediatricians » Other staff in GPs’
practice » Other staff in Pae-
diatricians’ practice
4-
1
4
6925
70
25
1-
5
1
6825
67
25
128
9
8
6925
65
24
63
5
4
20675
202
74
• Not using a computer » GPs » Paediatricians » Other staff in GPs’
practice » Other staff in Pae-
diatricians’ practice
3140
1
4
6925
71
25
7988
27
4
6825
67
25
6-
-
-
6925
65
24
3943
9
3
20675
203
74
4 .4 Coordination of care
4 .4 .1 Cohesion within PC
Respondents most frequently answer that they work with other GPs (83%) and to a much lesser extent with paediatricians (49%). Although PC gynaecologists also act as chosen doctors, only 22% responded that they had worked with a gynaecologist in the same unit. Dentists (stomatologists) are mentioned by 40% of respondents.The other medical specialists mentioned in the table are mentioned much less frequent. In Vojvodina more respondents answer to work with medical specialists in the same building, which suggest that CHCs in Vojvodina are broader.

60Evaluation of the organization and provision of primary care in Serbia
Table 21 . Other medical professionals working in the same unit as respondent
Working in the same building
Vojvodina(N=96)
Central Serbia(N=95)
Belgrade(N=94)
Total(N=285)
%Valid
N%
Valid N
%Valid
N%
Valid N
GPs 89 94 81 94 79 93 83 281
PC paediatricians 49 92 50 93 49 94 49 279
PC gynaecologists 26 92 15 94 26 93 22 279
Internists 20 91 15 94 11 92 15 277
Surgeons 1 87 12 94 2 90 5 271
Neurologists 19 89 13 94 9 92 14 275
Dermatologists 18 91 14 94 0 89 11 274
ENT specialists 18 91 12 94 11 92 13 277
Ophthalmologists 25 92 11 93 12 91 16 276
Radiologists 17 91 13 94 11 92 13 277
TB specialists (phtysiolo-gists)
10 89 3 92 4 92 6 273
Psychiatrists 16 89 12 93 9 92 12 274
Pharmacists 18 90 21 94 6 90 15 274
Stomatologists (dentists) 57 93 38 93 25 93 40 279
Practice nurses 51 96 41 94 43 85 45 275
Community nurses 79 95 48 94 60 84 62 273
Midwifes / birth assistants
31 95 7 94 45 83 28 272
Social workers 20 95 25 94 20 83 22 272
Psychologists 31 95 20 94 30 83 27 272
Physiotherapists 26 95 21 94 32 83 26 272
Laboratory technicians 67 96 46 94 48 83 54 273
X-ray technicians 26 95 21 94 32 83 26 272
Others 73 95 54 94 48 82 58 271
Table 22 shows respondents’ frequency of fact-to-face meetings with medical col-leagues, which are more frequently reported in Vojvodina than in the other regions. The data suggest a low level of structured cooperation and teamwork, both within PC and between primary and secondary care. It seems that organized information exchange among chosen doctors is not well developed and most doctors have no regular meeting with nurses. There are very few signs of structured cooperation between medical doc-tors across levels of care.

61Evaluation of the organization and provision of primary care in Serbia
Table 22 . Face-to-face meeting with other PC workers
Meet face-to-face at least monthly with:
Vojvodina(N=96)
Central Serbia(N=95)
Belgrade(N=94)
Total(N=285)
%Valid
N%
Valid N
%Valid
N%
Valid N
(Other) GPs• GPs• Paediatricians
8312
6920
618
6822
648
6818
709
20560
(Other) PC paediatricians• GPs• Paediatricians
1184
5325
168
5523
-40
4325
464
15173
PC Gynaecologists• GPs• Paediatricians
44
5320
18
5421
-4
4217
25
14958
Secondary paediatricians• GPs• Paediatricians
152
5323
112
5520
-20
4219
128
15062
Secondary gynaecologists• GPs• Paediatricians
3-
5320
1-
5620
--
4216
2-
15156
Internists• GPs• Paediatricians
114
5419
2112
5721
10-
4417
145
15557
Surgeons• GPs• Paediatricians
64
5119
316
5321
34
4118
48
14558
Naurologists• GPs• Paediatricians
94
5219
38
5320
6-
4117
64
14656
Dematologists• GPs• Paediatricians
18
5218
620
5421
1-
4117
39
14756
ENT specialists• GPs• Paediatricians
18
5219
416
5420
34
4218
39
14857
Ophthalmologists• GPs• Paediatricians
112
5219
612
5421
64
4218
49
14858
Radiologists• GPs• Paediatricians
112
5219
94
5320
6-
4217
55
14756
TB specialists• GPs• Paediatricians
18
5119
1012
5321
34
4218
58
14658
Psychiatrists• GPs• Paediatricians
64
5219
98
5621
34
4218
65
15058
Pharmacists• GPs• Paediatricians
1620
5319
114
5420
34
4218
109
14957
Stomatologists (dentist)• GPs• Paediatricians
1020
5219
712
5320
14
4218
612
14757
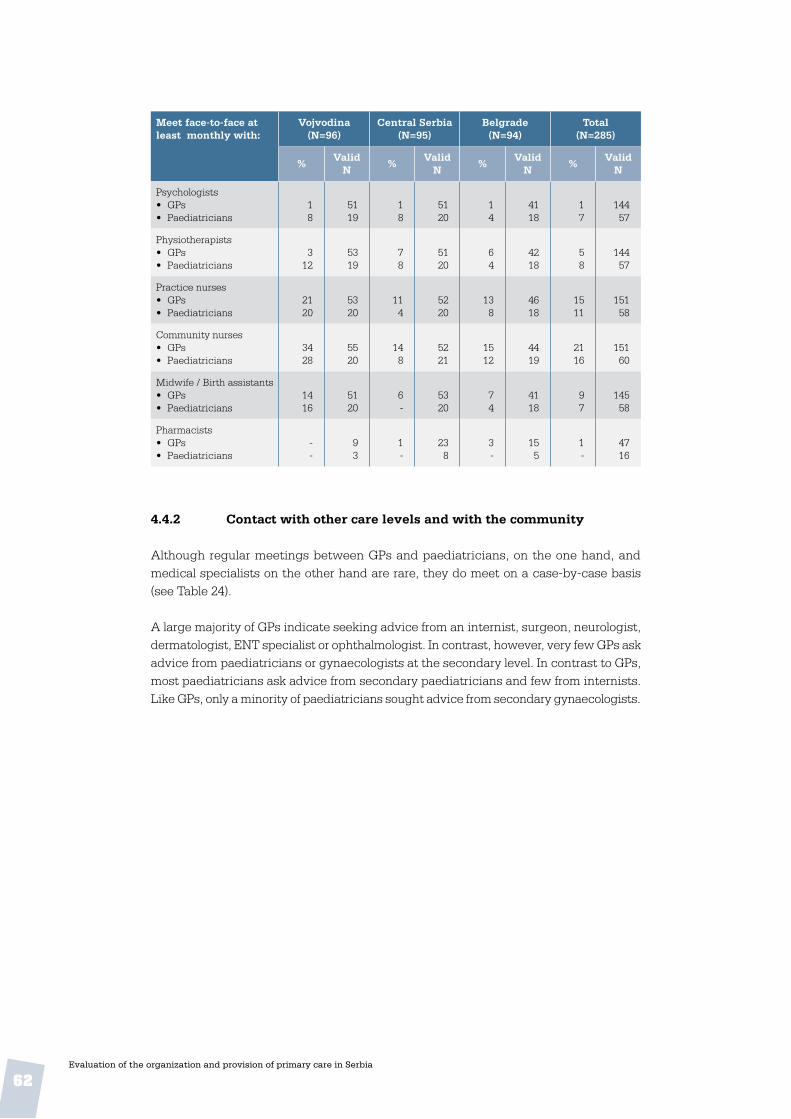
62Evaluation of the organization and provision of primary care in Serbia
Meet face-to-face at least monthly with:
Vojvodina(N=96)
Central Serbia(N=95)
Belgrade(N=94)
Total(N=285)
%Valid
N%
Valid N
%Valid
N%
Valid N
Psychologists• GPs• Paediatricians
18
5119
18
5120
14
4118
17
14457
Physiotherapists• GPs• Paediatricians
312
5319
78
5120
64
4218
58
14457
Practice nurses• GPs• Paediatricians
2120
5320
114
5220
138
4618
1511
15158
Community nurses• GPs• Paediatricians
3428
5520
148
5221
1512
4419
2116
15160
Midwife / Birth assistants• GPs• Paediatricians
1416
5120
6-
5320
74
4118
97
14558
Pharmacists• GPs• Paediatricians
--
93
1-
238
3-
155
1-
4716
4 .4 .2 Contact with other care levels and with the community
Although regular meetings between GPs and paediatricians, on the one hand, and medical specialists on the other hand are rare, they do meet on a case-by-case basis (see Table 24).
A large majority of GPs indicate seeking advice from an internist, surgeon, neurologist, dermatologist, ENT specialist or ophthalmologist. In contrast, however, very few GPs ask advice from paediatricians or gynaecologists at the secondary level. In contrast to GPs, most paediatricians ask advice from secondary paediatricians and few from internists. Like GPs, only a minority of paediatricians sought advice from secondary gynaecologists.

63Evaluation of the organization and provision of primary care in Serbia
Table 23 . Consultation with medical specialists
Frequently or sometimes asking advice from:
Vojvodina(N=96)
Central Serbia(N=95)
Belgrade(N=94)
Total(N=285)
%Valid
N%
Valid N
%Valid
N%
Valid N
Secondary paediatricians• GPs• Paediatricians
2575
5624
1896
5024
1296
4224
1989
14872
Secondary gynaecologists• GPs• Paediatricians
4257
5721
3924
5121
2663
4316
3647
15158
Internists• GPs• Paediatricians
9621
7019
8832
6919
9925
6816
9426
20754
Surgeons• GPs• Paediatricians
83100
6924
9196
6722
9283
6423
8993
20069
Neurologists• GPs• Paediatricians
8891
6923
9178
6923
9374
6719
9182
20565
Dermatologists• GPs• Paediatricians
8296
6825
8588
6824
7770
6120
8286
19769
ENT-specialists• GPs• Paediatricians
86100
6925
8792
6724
9188
6624
8893
20273
Ophthalmologists• GPs• Paediatricians
8796
6925
8792
6924
9287
6623
8992
20472

64Evaluation of the organization and provision of primary care in Serbia
Table 24 . Patients referred to medical specialists during the previous 4 weeks, by region
Patients referred to a: Vojvodina(N=96)
Central Serbia(N=95)
Belgrade(N=94)
Total(N=285)
Mean (range)
Valid N
Mean (range)
Valid N
Mean (range)
Valid N
Mean (range)
Valid N
Secondary paediatrician32
(0-27)62
3.9 (0-40)
652.4
(0-30)39
3.3(0-40)
166
Secondary gynaecologist3.8
(0-30)61
0.8 (0-6)
561.0
(0-10)37
2.0(0-30)
154
Internist16.3
(0-88)64
25.4 (0-88)
7015.5
(0-80)46
19.7(0-88)
180
Surgeon10.6
(0-60)70
9.6 (0-60)
836.5
(0-30)49
9.2(0-60)
202
Neurologist8.9
(0-70)74
14.2 (0-70)
806.8
(0-40)47
10.5(0-70)
201
Dermatologist5.9
(0-51)75
8.6 (0-40)
793.9
(0-20)46
6.5(0-51)
200
ENT-specialist6.5
(0-26)77
9.3 (0-70)
839.1
(0-36)50
8.3(0-70)
210
Ophthalmologist6.0
(0-35)76
13.7 (0-90)
816.8
(0-30)51
9.2(0-90)
208
Total referrals per 4 weeks
74 .1 103 .5 61 .3 81 .7
Referrals as % of all office contacts and home visits• GPs• Paediatricians
10.114.83
14.655.04
10.963.89
12.404.67
The average referral rate (referrals as a percentage of all patient contacts in the office and during home visits) of GPs is more than 2.5 times higher than that of paediatricians, and the regions strongly differ in this respect. Although missing values suggest cau-tion, it seems reasonable to say that the referral rate of GPs is very high in international comparison. The officially provided referral rate from primary to secondary care – 217 per 1000 patient contacts (see Table 12 in chapter 3) – is even higher than that found here, but the survey’s rate of 12.4 is very high.
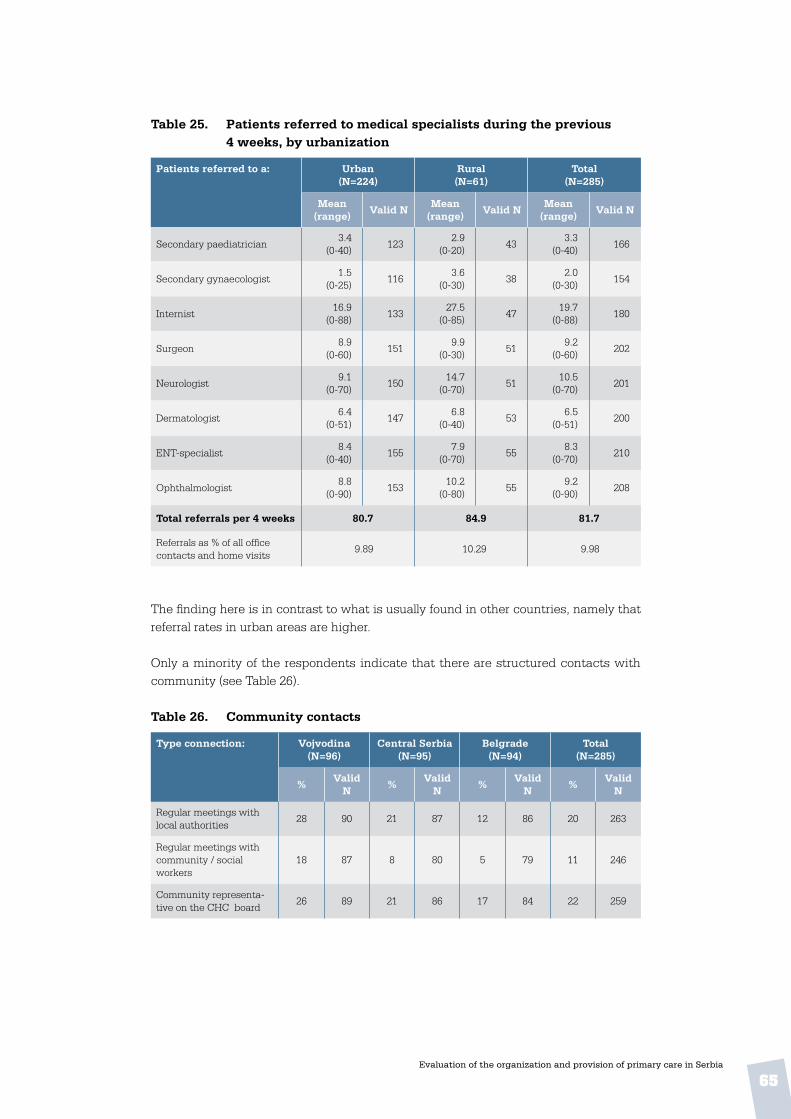
65Evaluation of the organization and provision of primary care in Serbia
Table 25 . Patients referred to medical specialists during the previous 4 weeks, by urbanization
Patients referred to a: Urban(N=224)
Rural(N=61)
Total(N=285)
Mean (range)
Valid NMean
(range)Valid N
Mean (range)
Valid N
Secondary paediatrician3.4
(0-40)123
2.9 (0-20)
433.3
(0-40)166
Secondary gynaecologist1.5
(0-25)116
3.6 (0-30)
382.0
(0-30)154
Internist16.9
(0-88)133
27.5(0-85)
4719.7
(0-88)180
Surgeon8.9
(0-60)151
9.9(0-30)
519.2
(0-60)202
Neurologist9.1
(0-70)150
14.7(0-70)
5110.5
(0-70)201
Dermatologist6.4
(0-51)147
6.8(0-40)
536.5
(0-51)200
ENT-specialist8.4
(0-40)155
7.9(0-70)
558.3
(0-70)210
Ophthalmologist8.8
(0-90)153
10.2(0-80)
559.2
(0-90)208
Total referrals per 4 weeks 80 .7 84 .9 81 .7
Referrals as % of all office contacts and home visits
9.89 10.29 9.98
The finding here is in contrast to what is usually found in other countries, namely that referral rates in urban areas are higher.
Only a minority of the respondents indicate that there are structured contacts with community (see Table 26).
Table 26 . Community contacts
Type connection: Vojvodina(N=96)
Central Serbia(N=95)
Belgrade(N=94)
Total(N=285)
%Valid
N%
Valid N
%Valid
N%
Valid N
Regular meetings with local authorities
28 90 21 87 12 86 20 263
Regular meetings with community / social workers
18 87 8 80 5 79 11 246
Community representa-tive on the CHC board
26 89 21 86 17 84 22 259

66Evaluation of the organization and provision of primary care in Serbia
4 .5 Comprehensiveness of care
4 .5 .1 Practice conditions
GPs and paediatricians were asked whether information materials such as leaflets or posters had been displayed or made available in the waiting room of their CHC or ambulatory. Materials on cardiovascular diseases, healthy diet and smoking cessation were available in the waiting rooms of at least three quarters of the respondents, while materials about social services were least available
Table 27 . Information for patients in the waiting room
Subject of information materials
Vojvodina(N=96)
Central Serbia(N=95)
Belgrade(N=94)
Total(N=285)
%Valid
N%
Valid N
%Valid
N%
Valid N
Cardiovascular disease risks
81 88 74 92 72 81 76 261
Healthy diet 91 93 76 91 85 90 84 274
Smoking cessation 83 85 74 92 77 84 78 261
Obesity 74 84 67 88 66 77 69 249
Diabetes 76 85 66 89 63 76 68 250
Sexually transmitted diseases
56 83 43 87 37 75 46 245
Vaccinations 69 84 56 89 56 80 60 253
Contraception 33 71 20 74 19 60 24 205
Self treatment of cold / coughing
38 72 34 77 21 58 31 207
Social services 35 72 16 73 15 57 22 202
4 .5 .2 Medical equipment Figure 10 and Tables 28 and 29 summarize the state of medical equipment in the CHCs and ambulatories and by region and by urbanization. Overall, an average of 14 items were available from the list of 30 (46%). These results suggest that the equipment that physicians, and in particular GPs, have at their disposal is not compatible with a comprehensive package of preventive, curative and rehabilitative PC tasks. The sharp contrast among the regions with respect to several items also points to opportunities for improvement.

67
Table 28 . Medical equipment available to physicians, by region
Belgrade Central Serbia Vojvodina
Aspirator
Tuning fork
Emergency kit
Ophthalmoscope
Speculum
Gynaec. coach
Nasal specula
Re�ex hammer
Ear syringe
Enema
Urine test strips
Vision chart
ECG
Otoscope
Ultrasound(abdomen)
Hemoglob.Meter
Peak �owmeter
Wound stitchmat.
Car for home visits
Dressing/bandages
Blood sugartest kit
Tonguedepressor
Sphygmomano-meter
Height measure
Scales (infants)
Scales (adults)
Tape measures
Syringes/needles
Thermometer
Stethoscope
0 20
1611
14
15
36
38
21
91314
10
1511
9
27
2718
14
21
5730
3117
20
21
5
1823
30
1520
35
6882
51
3926
54
9696
98
8532
7233
4443
57
8350
5262
59
8767
93
9997
99
9997
99
95
9698
91100
100
91
85
93
1298
82
1330
75
65
1316
1713
610
2414
21
46
40 60 80 100

68Evaluation of the organization and provision of primary care in Serbia
Number of items of equipment
Vojvodina(N=96)
Central Serbia(N=95)
Belgrade(N=94)
Total(N=285)
Abs . % Abs . % Abs . % Abs . %
15 or less 53 55 79 83 72 77 204 72
16 – 20 32 33 2 2 8 9 42 15
21 – 25 5 6 10 11 7 7 22 8
26 – 30 6 6 4 4 7 7 17 5
TOTAL 96 100 95 100 94 100 285 100
Average number of items per physician(from list of 30) • GPs• Paed• Total
15.217.815.9
10.415.311.7
13.715.114.1
13.116.113.8
Table 29 . Medical equipment available to physicians, by urbanization
Number of items of equipment
Urban(N=224)
Rural(N=61)
Total(N=285)
Abs . % Abs . % Abs . %
15 or less 164 73 40 66 204 72
16 – 20 28 13 14 23 42 15
21 – 25 15 7 7 11 22 8
26 – 30 17 7 - - 17 5
TOTAL 224 100 61 100 285 100
Average number of items per physician (from list of 30)
14.0 13.4 13.8
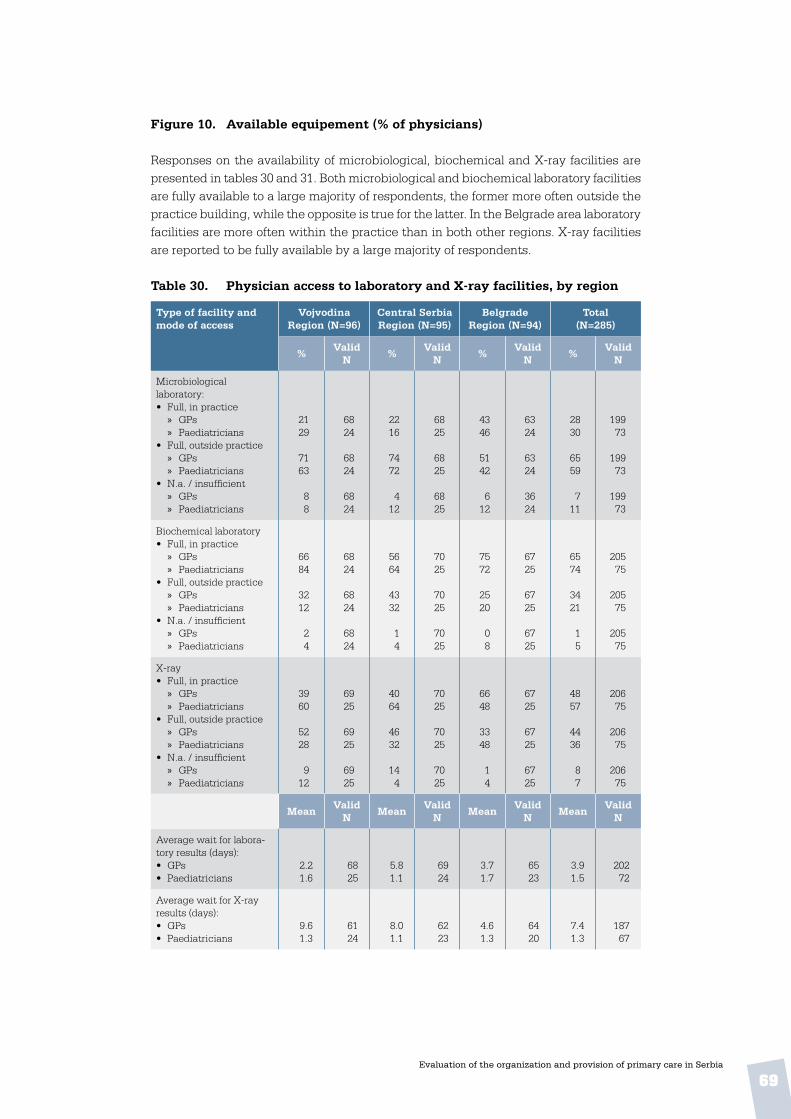
69Evaluation of the organization and provision of primary care in Serbia
Figure 10 . Available equipement (% of physicians) Responses on the availability of microbiological, biochemical and X-ray facilities are presented in tables 30 and 31. Both microbiological and biochemical laboratory facilities are fully available to a large majority of respondents, the former more often outside the practice building, while the opposite is true for the latter. In the Belgrade area laboratory facilities are more often within the practice than in both other regions. X-ray facilities are reported to be fully available by a large majority of respondents. Table 30 . Physician access to laboratory and X-ray facilities, by region
Type of facility and mode of access
Vojvodina Region (N=96)
Central Serbia Region (N=95)
Belgrade Region (N=94)
Total(N=285)
%Valid
N%
Valid N
%Valid
N%
Valid N
Microbiological laboratory:• Full, in practice
» GPs » Paediatricians
• Full, outside practice » GPs » Paediatricians
• N.a. / insufficient » GPs » Paediatricians
2129
7163
88
6824
6824
6824
2216
7472
412
6825
6825
6825
4346
5142
612
6324
6324
3624
2830
6559
711
19973
19973
19973
Biochemical laboratory• Full, in practice
» GPs » Paediatricians
• Full, outside practice » GPs » Paediatricians
• N.a. / insufficient » GPs » Paediatricians
6684
3212
24
6824
6824
6824
5664
4332
14
7025
7025
7025
7572
2520
08
6725
6725
6725
6574
3421
15
20575
20575
20575
X-ray• Full, in practice
» GPs » Paediatricians
• Full, outside practice » GPs » Paediatricians
• N.a. / insufficient » GPs » Paediatricians
3960
5228
912
6925
6925
6925
4064
4632
144
7025
7025
7025
6648
3348
14
6725
6725
6725
4857
4436
87
20675
20675
20675
MeanValid
NMean
Valid N
MeanValid
NMean
Valid N
Average wait for labora-tory results (days):• GPs• Paediatricians
2.21.6
6825
5.81.1
6924
3.71.7
6523
3.91.5
20272
Average wait for X-ray results (days):• GPs• Paediatricians
9.61.3
6124
8.01.1
6223
4.61.3
6420
7.41.3
18767

70Evaluation of the organization and provision of primary care in Serbia
As shown below, physicians in urban practices more often have their own facilities than physicians in rural practices and microbiological laboratory access is more often reported as insufficient or unavailable in rural practices. Table 31 . Physician access to laboratory and X-ray facilities,
by urbanization
Type of facility and mode of access
Urban(N=224)
Rural(N=61)
Total(N=285)
% Valid N % Valid N % Valid N
Microbiological laboratory• Full, in practice• Full, outside practice• N.a. / insufficient
34606
211211211
127711
616161
29647
272272272
Biochemical laboratory• Full, in practice• Full, outside practice• N.a. / insufficient
73252
219219219
49492
616161
68302
280280280
X-ray• Full, in practice• Full, outside practice• N.a. / insufficient
55369
220220220
33625
616161
51418
281281281
Mean Valid N Mean Valid N Mean Valid N
TOTAL 224 100 61 100 285 100
Average wait for laboratory results (days): • GPs• Paediatricians
4.01.4
15362
3.72.1
4910
3.91.5
20272
Average wait for X-ray results (days):• GPs• Paediatricians
7.91.2
14058
5.61.6
479
7.41.3
18767
4 .5 .3 Service delivery
Three categories will be distinguished in the physicians’ clinical task profiles:
• physicians’ first contact roles
• provision of medical technical procedures to their patients and
• treatment and follow-up of diseases. Details of the methodology of this study were described in Chapter 1.
First contact rolesTasks related to the first contact role were measured with 18 items on a variety of problems of men, women and children. Physicians could indicate whether their patients would bring up these problems either “(almost) always”, “usually”, “occasionally”, “seldom/never” or “do not know”. Tables 32 and 33 provide results. Percentages refer to physicians

71Evaluation of the organization and provision of primary care in Serbia
who estimated that they would always or usually be the doctor of first contact, and the percentage in brackets refers to the category “occasionally”.
The overall summary scores for GPs and paediatricians on the bottom line in Table 32 show that GPs report seeing a wider range of health problems in the first contact than paediatricians. This is a consequence of the list of health problems, which are partly typical for children, but also contain problems of women and adults. On the typical problems related to children, paediatricians score very high and GPs extremely low. The position of paediatricians as the first contact is more clear-cut than that of GPs. None of the listed health problems is unanimously reported by GPs as normally presented to them in the first contact. These results suggest that GPs lack a clear domain in the first contact. The summary score of 2.06 is very low compared to GPs in other countries. If the typical paediatric items are excluded the score would be 2.4, which is still low. If regions are compared, GPs in Vojvodina have a more comprehensive role in the first contact than GPs in the other regions.
Table 33 shows that paediatricians in urban and rural practice have identical roles in dealing with patients who have a first contact with a health problem. GPs in urban CHCs, however, see a wider spectrum of health problems in the first contact than their rural colleagues. This is unlike results usually found among GPs in other countries.
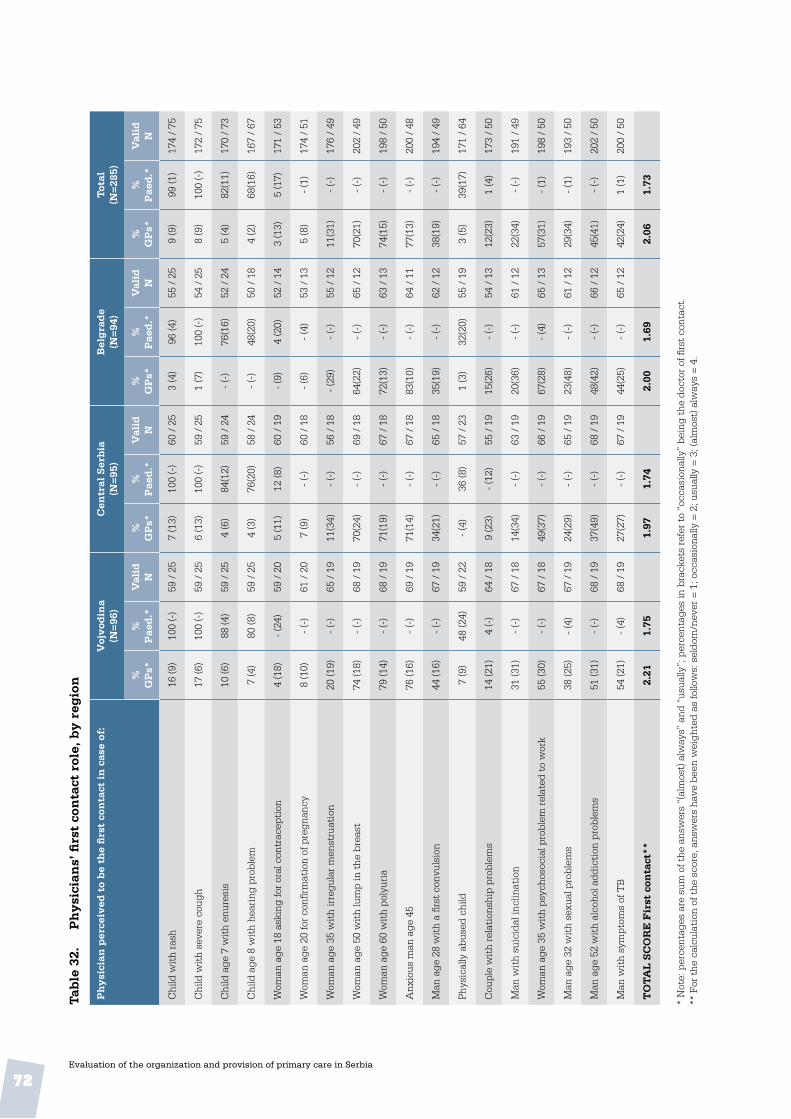
72Evaluation of the organization and provision of primary care in Serbia
Tab
le 3
2 .
Ph
ysi
cian
s’ fi
rst
con
tact
rol
e, b
y r
egio
n
Ph
ysi
cian
per
ceiv
ed t
o b
e th
e fi
rst
con
tact
in
cas
e of
:V
ojv
odin
a(N
=96
)C
entr
al S
erb
ia(N
=95
)B
elg
rad
e(N
=94
)T
otal
(N=
285)
%
GP
s*%
P
aed
.*V
alid
N
%
GP
s*%
P
aed
.*V
alid
N
%
GP
s*%
P
aed
.*V
alid
N
%
GP
s*%
P
aed
.*V
alid
N
Chi
ld w
ith
rash
16 (9
)10
0 (-
)59
/ 2
57
(13)
100
(-)
60 /
25
3 (4
)96
(4)
55 /
25
9 (9
)99
(1)
174
/ 75
Chi
ld w
ith
seve
re c
ough
17 (6
)10
0 (-
)59
/ 2
56
(13)
100
(-)
59 /
25
1 (7
)10
0 (-
)54
/ 2
58
(9)
100
(-)
172
/ 75
Chi
ld a
ge 7
wit
h en
ures
is10
(6)
88 (4
)59
/ 2
54
(6)
84(1
2)59
/ 2
4-
(-)
76(1
6)52
/ 2
45
(4)
82(1
1)17
0 /
73
Chi
ld a
ge 8
wit
h he
arin
g pr
oble
m7
(4)
80 (8
)59
/ 2
54
(3)
76(2
0)58
/ 2
4-
(-)
48(2
0)50
/ 1
84
(2)
68(1
6)16
7 /
67
Wom
an a
ge 1
8 as
king
for
oral
con
trac
epti
on4
(18)
- (2
4)59
/ 2
05
(11)
12 (8
)60
/ 1
9-
(9)
4 (2
0)52
/ 1
43
(13)
5 (1
7)17
1 /
53
Wom
an a
ge 2
0 fo
r co
nfirm
atio
n of
pre
gnan
cy8
(10)
- (-
)61
/ 2
07
(9)
- (-
)60
/ 1
8-
(6)
- (4
)53
/ 1
35
(8)
- (1
)17
4 /
51
Wom
an a
ge 3
5 w
ith
irre
gula
r m
enst
ruat
ion
20 (1
9)-
(-)
65 /
19
11(3
4)-
(-)
56 /
18
- (2
9)-
(-)
55 /
12
11(3
1)-
(-)
176
/ 49
Wom
an a
ge 5
0 w
ith
lum
p in
the
bre
ast
74 (1
8)-
(-)
68 /
19
70(2
4)-
(-)
69 /
18
64(2
2)-
(-)
65 /
12
70(2
1)-
(-)
202
/ 49
Wom
an a
ge 6
0 w
ith
poly
uria
79 (1
4)-
(-)
68 /
19
71(1
9)-
(-)
67 /
18
72(1
3)-
(-)
63 /
13
74(1
5)-
(-)
198
/ 50
Anx
ious
man
age
45
76 (1
6)-
(-)
69 /
19
71(1
4)-
(-)
67 /
18
83(1
0)-
(-)
64 /
11
77(1
3)-
(-)
200
/ 48
Man
age
28
wit
h a
first
con
vuls
ion
44 (1
6)-
(-)
67 /
19
34(2
1)-
(-)
65 /
18
35(1
9)-
(-)
62 /
12
38(1
9)-
(-)
194
/ 49
Phys
ical
ly a
buse
d ch
ild7
(9)
48 (2
4)59
/ 2
2-
(4)
36 (8
)57
/ 2
31
(3)
32(2
0)55
/ 1
93
(5)
39(1
7)17
1 /
64
Cou
ple
wit
h re
lati
onsh
ip p
robl
ems
14 (2
1)4
(-)
64 /
18
9 (2
3)-
(12)
55 /
19
15(2
6)-
(-)
54 /
13
12(2
3)1
(4)
173
/ 50
Man
wit
h su
icid
al in
clin
atio
n31
(31)
- (-
)67
/ 1
814
(34)
- (-
)63
/ 1
920
(36)
- (-
)61
/ 1
222
(34)
- (-
)19
1 /
49
Wom
an a
ge 3
5 w
ith
psyc
hoso
cial
pro
blem
rel
ated
to
wor
k55
(30)
- (-
)67
/ 1
849
(37)
- (-
)66
/ 1
967
(28)
- (4
)65
/ 1
357
(31)
- (1
)19
8 /
50
Man
age
32
wit
h se
xual
pro
blem
s38
(25)
- (4
)67
/ 1
924
(29)
- (-
)65
/ 1
923
(48)
- (-
)61
/ 1
229
(34)
- (1
)19
3 /
50
Man
age
52
wit
h al
coho
l add
icti
on p
robl
ems
51 (3
1)-
(-)
68 /
19
37(4
9)-
(-)
68 /
19
48(4
2)-
(-)
66 /
12
45(4
1)-
(-)
202
/ 50
Man
wit
h sy
mpt
oms
of T
B54
(21)
- (4
)68
/ 1
927
(27)
- (-
)67
/ 1
944
(25)
- (-
)65
/ 1
242
(24)
1 (1
)20
0 /
50
TO
TA
L S
CO
RE
Fir
st c
onta
ct**
2 .21
1 .75
1 .97
1 .74
2 .00
1 .69
2 .06
1 .73
* N
ote:
per
cent
ages
are
sum
of t
he a
nsw
ers
“(al
mos
t) a
lway
s” a
nd “
usua
lly”;
per
cent
ages
in b
rack
ets
refe
r to
“oc
casi
onal
ly”
bein
g th
e do
ctor
of fi
rst
cont
act.
**
For
the
cal
cula
tion
of t
he s
core
, ans
wer
s ha
ve b
een
wei
ghte
d as
follo
ws:
sel
dom
/nev
er =
1; o
ccas
iona
lly =
2; u
sual
ly =
3; (
alm
ost)
alw
ays
= 4
.

73Evaluation of the organization and provision of primary care in Serbia
Tab
le 3
3 .
Ph
ysi
cian
s’ fi
rst
con
tact
rol
e, b
y u
rban
izat
ion
Ph
ysi
cian
per
ceiv
ed t
o b
e th
e fi
rst
con
tact
in
cas
e of
:U
rban
(N=
224)
Ru
ral
(N=
61)
Tot
al(N
=28
5)
% G
Ps*
% P
aed
.*V
alid
N
% G
Ps*
% P
aed
.*V
alid
N
% G
Ps*
% P
aed
.*V
alid
N
Chi
ld w
ith
rash
3 (5
)98
(2)
126
/ 65
26 (2
0)10
0 (-
)48
/ 1
09
(9)
99 (1
)17
4 /
75
Chi
ld w
ith
seve
re c
ough
1 (6
)10
0 (-
)12
4 /
65
29 (1
6)10
0 (-
)48
/ 1
08
(9)
100
(-)
172
/ 75
Chi
ld a
ge 7
wit
h en
ures
is1
(-)
82 (1
1)12
2 /
6318
(16)
90 (1
0)48
/ 1
05
(4)
82(1
1)17
0 /
73
Chi
ld a
ge 8
wit
h he
arin
g pr
oble
m1
(-)
66 (1
7)11
9 /
5714
(10)
80 (1
0)48
/ 1
04
(2)
68(1
6)16
7 /
67
Wom
an a
ge 1
8 as
king
for
oral
con
trac
epti
on-
(7)
6 (1
5)12
2 /
4514
(31)
- (3
0)49
/ 8
3 (1
3)5
(17)
171
/ 53
Wom
an a
ge 2
0 fo
r co
nfirm
atio
n of
pre
gnan
cy1
(7)
- (2
)12
5 /
4320
(12)
- (-
)49
/ 8
5 (8
)-
(1)
174
/ 51
Wom
an a
ge 3
5 w
ith
irre
gula
r m
enst
ruat
ion
4 (3
0)-
(-)
127
/ 41
29 (3
3)-
(-)
49 /
811
(31)
- (-
)17
6 /
49
Wom
an a
ge 5
0 w
ith
lum
p in
the
bre
ast
69(2
0)-
(-)
151
/ 41
73 (2
6)-
(-)
51 /
870
(21)
- (-
)20
2 /
49
Wom
an a
ge 6
0 w
ith
poly
uria
74(1
5)-
(-)
148
/ 42
77 (1
6)-
(-)
50 /
874
(15)
- (-
)19
8 /
50
Anx
ious
man
age
45
80(1
1)-
(-)
150
/ 40
67 (2
2)-
(-)
50 /
877
(13)
- (-
)20
0 /
48
Man
age
28
wit
h a
first
con
vuls
ion
40(1
7)-
(-)
144
/ 41
30
(24)
- (-
)50
/ 8
38(1
9)-
(-)
194
/ 49
Phys
ical
ly a
buse
d ch
ild1
(4)
40 (1
7)12
3 /
5510
(8)
30 (2
0)48
/ 9
3 (5
)39
(17)
171
/ 64
Cou
ple
wit
h re
lati
onsh
ip p
robl
ems
13(1
9)-
(5)
126
/ 42
10 (3
7)10
(-)
47 /
812
(23)
1 (4
)17
3 /
50
Man
wit
h su
icid
al in
clin
atio
n25
(31)
- (-
)14
3 /
4112
(41)
- (-
) 4
8 /
822
(34)
- (-
)19
1 /
49
Wom
an a
ge 3
5 w
ith
psyc
hoso
cial
pro
blem
rel
ated
to
wor
k59
(28)
- (2
)14
8 /
4249
(43)
- (-
)50
/ 8
57(3
1)-
(1)
198
/ 50
Man
age
32
wit
h se
xual
pro
blem
s29
(34)
- (2
)14
4 /
4228
(33)
- (-
)49
/ 8
29(3
4)-
(1)
193
/ 50
Man
age
52
wit
h al
coho
l add
icti
on p
robl
ems
48(3
7)-
(-)
152
/ 42
36 (5
3)-
(-)
50 /
845
(41)
- (-
)20
2 /
50
Man
wit
h sy
mpt
oms
of T
B44
(23)
- (2
)15
0 /
4234
(29)
- (-
)50
/ 8
42(2
4)1
(1)
200
/ 50
TO
TA
L S
CO
RE
Fir
st c
onta
ct**
2 .01
1 .73
1 .73
1 .71
2 .06
1 .73
* N
ote:
per
cent
ages
are
sum
of t
he a
nsw
ers
“(al
mos
t) a
lway
s” a
nd “
usua
lly”;
per
cent
ages
in b
rack
ets
refe
r to
“oc
casi
onal
ly”
bein
g th
e do
ctor
of fi
rst
cont
act.
**
For
the
cal
cula
tion
of t
he s
core
, ans
wer
s ha
ve b
een
wei
ghte
d as
follo
ws:
sel
dom
/nev
er =
1; o
ccas
iona
lly =
2; u
sual
ly =
3; (
alm
ost)
alw
ays
= 4
.

74Evaluation of the organization and provision of primary care in Serbia
75Evaluation of the organization and provision of primary care in Serbia
Involvement of PC physicians in the treatment of diseasesIn tables 34 and 35 results are presented on the involvement of GPs and paediatricians in the treatment of a list of 20 diseases. Physicians could indicate whether they would treat a patient from their practice with a diagnosis either “(almost) always”, “usually”, “occasionally”, “seldom/never” or “do not know”. The percentages refer to physicians who estimated that they always or usually be the doctor to treat this patient. The per-centages in brackets refer to the category “occasionally”.The overall summary scores for GPs and paediatricians on the bottom line in Table 35 show that GPs report to be more involved in the treatment of patients with these diag-noses than paediatricians. The treatment profile of GPs seems to be clearer than the first contact profile. From the list of 20 diagnoses there are 9 where at least three quarters of GPs say they are always or usually the treating physician. There is no diagnosis listed with fewer than 20% of GPs responding that they would always or usually treat it. The profile of paediatricians is narrower. Against 3 diagnoses covered by 80 to 90% there are 6 which are reported to be outside the domain of paediatricians, explaining their lower summary score. From the breakdown to urban and rural practice (see Table 35), it appears that the involvement in treatment tasks is not related to working in a city or in the countryside.

74Evaluation of the organization and provision of primary care in Serbia
75Evaluation of the organization and provision of primary care in Serbia
Tab
le 3
4 .
Ph
ysi
cian
in
vol
vem
ent
in t
reat
men
t an
d f
ollo
w u
p o
f d
isea
ses,
by
reg
ion
Con
dit
ion
:V
ojv
odin
a(N
=96
)C
entr
al S
erb
ia(N
=95
)B
elg
rad
e(N
=94
)T
otal
(N=
285)
% G
Ps*
%
Pae
d .*
Val
id
N%
GP
s*%
P
aed
.*V
alid
N
% G
Ps*
%
Pae
d .*
Val
id
N%
GP
s*%
P
aed
.*V
alid
N
Hyp
erth
yroi
dism
75 (1
0)60
(20)
68/2
263
(26)
40 (2
8)67
/22
68 (1
7)24
(4)
64/1
669
(18)
41 (1
7)19
9/60
Chr
onic
bro
nchi
tis
94 (4
)10
0 (-
)70
/25
93 (3
)88
(4)
68/2
496
(3)
76 (8
)68
/22
94 (3
)88
(4)
206/
71
Hor
deol
um (s
tye)
79 (1
6)88
(8)
70/2
471
(19)
76 (1
2)66
/24
74 (2
3)72
(4)
68/2
175
(19)
79 (8
)20
4/69
Pept
ic u
lcer
93 (4
)48
(20)
70/2
289
(6)
36 (3
2)67
/23
90 (9
0)24
(8)
68/1
791
(6)
36 (2
0)20
5/62
Her
niat
ed d
isc
lesi
on82
(16)
8 (1
6)70
/20
81 (1
0)20
(4)
66/2
288
(9)
12 (4
)68
/17
84 (1
1)13
(8)
204/
59
Acu
te c
ereb
ro-v
ascu
lar
acci
dent
78 (1
4)-
(4)
70/1
956
(27)
8 (4
)65
/21
57 (2
6)-
(4)
66/1
663
(22)
3 (4
)20
1/56
Con
gest
ive
hear
t fa
ilure
76 (1
8)4
(12)
68/1
977
(13)
16 (1
2)65
/21
70 (2
2)8
(4)
67/1
574
(18)
9 (9
)20
0/55
Pneu
mon
ia96
(3)
96 (-
)70
/24
89 (6
)88
(4)
67/2
493
(6)
76 (8
)68
/22
92 (5
)87
(4)
205/
70
Peri
tons
ilar
absc
ess
73 (1
7)84
(4)
70/2
347
(6)
68 (1
6)66
/22
67 (1
7)56
(16)
67/2
162
(23)
69 (1
2)20
3/66
Ulc
erat
ive
colit
is61
(23)
28 (1
6)70
/21
40 (2
7)32
(44)
66/2
149
(28)
24 (1
2)68
/15
50 (2
6)28
(24)
204/
57
Salp
ingi
tis
30 (2
8)16
(12)
67/1
914
(29)
8 (3
6)58
/21
15 (1
6)4
(20)
61/1
420
(24)
9 (2
3)18
6/54
Con
cuss
ion
40 (3
1)44
(16)
67/2
023
(27)
32 (3
6)62
/21
26 (3
0)32
(4)
64/1
530
(30)
36 (1
9)19
3/56
Park
inso
n's
dise
ase
69 (1
4)-
(4)
70/1
963
(16)
- (-
)65
/21
61 (1
5)4
(-)
68/1
464
(15)
1 (1
)20
3/54
Unc
ompl
icat
ed d
iabe
tes
(typ
e II)
92 (7
)20
(8)
70/2
093
(1)
16 (1
6)67
/21
93 (4
)12
(-)
67/1
592
(4)
16 (8
)20
4/56
Rhe
umat
oid
arth
riti
s80
(3)
44 (1
2)70
/21
82 (9
)64
(12)
66/2
381
(12)
20 (1
2)68
/17
81 (1
1)43
(12)
204/
61
Dep
ress
ion
85 (1
3)20
(12)
70/1
979
(14)
20 (4
8)67
/22
77 (1
3)12
(12)
67/1
580
(13)
17 (2
4)20
4/56
Myo
card
ial i
nfar
ctio
n70
(20)
- (4
)70
/19
74 (1
4)-
(-)
66/2
162
(26)
- (4
)67
/15
69 (2
0)-
(3)
203/
55
Follo
w u
p T
B c
are
49 (2
4)28
(8)
69/1
939
(26)
44 (-
)62
/22
42 (1
5)12
(8)
64/1
543
(21)
38 (5
)19
5/57
Prob
lem
s of
men
opau
se52
(24)
4 (-
)68
/19
43 (2
6)8
(8)
63/2
139
(33)
- (-
)64
/14
45 (2
8)4
(3)
195/
54
Am
enor
rhoe
a35
(28)
28 (8
)68
/20
29 (2
3)20
(32)
59/2
223
(22)
16 (1
2)63
/15
29 (2
4)21
(17)
190/
57
TO
TA
L S
CO
RE
Tre
atm
ent
task
s**
3 .14
2 .24
2 .91
2 .26
2 .94
1 .99
3 .00
2 .18
* N
ote:
per
cent
ages
are
sum
of t
he a
nsw
ers
“(al
mos
t) a
lway
s” a
nd “
usua
lly”;
per
cent
ages
in b
rack
ets
refe
r to
“oc
casi
onal
ly”
bein
g th
e do
ctor
of fi
rst
cont
act.
**
For
the
cal
cula
tion
of t
he s
core
, ans
wer
s ha
ve b
een
wei
ghte
d as
follo
ws:
sel
dom
/nev
er =
1; o
ccas
iona
lly =
2; u
sual
ly =
3; (
alm
ost)
alw
ays
= 4
.

76Evaluation of the organization and provision of primary care in Serbia
77Evaluation of the organization and provision of primary care in Serbia
Tab
le 3
5 .
Ph
ysi
cian
in
vol
vem
ent
in t
reat
men
t an
d f
ollo
w u
p o
f d
isea
ses,
by
urb
aniz
atio
n
Con
dit
ion
:U
rban
(N=
224)
Ru
ral
(N=
61)
Tot
al(N
=28
5)
% G
Ps*
% P
aed
.*V
alid
N
% G
Ps*
% P
aed
.*V
alid
N
% G
Ps*
% P
aed
.*V
alid
N
Hyp
erth
yroi
dism
71 (1
5)43
(14)
150/
5161
(26)
30 (4
0)49
/969
(18)
41 (1
7)19
9/60
Chr
onic
bro
nchi
tis
94 (3
)88
(5)
156/
6194
(4)
90 (-
)50
/10
94 (3
)88
(4)
206/
71
Hor
deol
um (s
tye)
75 (2
0)77
(8)
155/
5975
(18)
90 (1
0)49
/ 10
75 (1
9)79
(8)
204/
69
Pept
ic u
lcer
91 (6
)37
(17)
156/
5388
(8)
30 (4
0)49
/991
(6)
36 (2
0)20
5/62
Her
niat
ed d
isc
lesi
on84
(12)
12 (9
)15
6/51
84 (1
0)20
(-)
48/8
84 (1
1)13
(8)
204/
59
Acu
te c
ereb
ro-v
ascu
lar
acci
dent
64 (2
1)3
(3)
152/
4863
(28)
- (1
0)49
/863
(22)
3 (4
)20
1/56
Con
gest
ive
hear
t fa
ilure
76 (1
5)9
(11)
151/
4769
(26)
10 (-
)49
/ 8
74 (1
8)9
(9)
200/
55
Pneu
mon
ia95
(3)
85 (5
)15
6/60
84 (1
2)10
0 (-
)49
/10
92 (5
)87
(4)
205/
70
Peri
tons
ilar
absc
ess
64 (2
3)68
(14)
154/
5859
(26)
80 (-
)49
/862
(23)
69 (1
2)20
3/66
Ulc
erat
ive
colit
is54
(23)
26 (2
5)15
5/49
39 (3
3)40
(20)
48/8
50 (2
6)28
(24)
204/
57
Salp
ingi
tis
16 (2
2)9
(21)
138/
4629
(31)
10 (3
0)48
/820
(24)
9 (2
3)18
6/54
Con
cuss
ion
29 (2
9)37
(15)
145/
4831
(31)
30 (4
0)48
/830
(30)
36 (1
9)19
3/56
Park
inso
n's
dise
ase
65 (1
3)2
(-)
155/
4661
(22)
- (1
0)48
/864
(15)
1 (1
)20
3/54
Unc
ompl
icat
ed d
iabe
tes
(typ
e II)
92 (5
)14
(9)
155/
4894
(2)
30 (-
)49
/892
(4)
16 (8
)20
4/56
Rhe
umat
oid
arth
riti
s79
(13)
40 (1
4)15
6/47
86 (4
)60
(-)
48/9
81 (1
1)43
(12)
204/
61
Dep
ress
ion
79 (1
5)17
(26)
155/
4784
(10)
20 (1
0)49
/980
(13)
17 (2
4)20
4/56
Myo
card
ial i
nfar
ctio
n69
(18)
- (2
)15
5/47
69 (2
6)-
(10)
48/8
69 (2
0)-
(3)
203/
55
Follo
w u
p T
B c
are
42 (2
1)28
(6)
147/
4949
(22)
30 (-
)48
/843
(21)
28 (5
)19
5/57
Prob
lem
s of
men
opau
se44
(28)
5 (3
)14
7/46
47 (2
6)-
(-)
48/8
45 (2
8)4
(3)
195/
54
Am
enor
rhoe
a26
(25)
20 (1
7)14
2/49
37 (2
2)30
(20)
48/8
29 (2
4)21
(17)
190/
57
TO
TA
L S
CO
RE
Tre
atm
ent
task
s**
3 .00
2 .16
3 .01
2 .29
3 .00
2 .18
* N
ote:
per
cent
ages
are
sum
of t
he a
nsw
ers
“(al
mos
t) a
lway
s” a
nd “
usua
lly”;
per
cent
ages
in b
rack
ets
refe
r to
“oc
casi
onal
ly”
bein
g th
e do
ctor
of fi
rst
cont
act.
** F
or t
he c
alcu
lati
on o
f the
sco
re, a
nsw
ers
have
bee
n w
eigh
ted
as fo
llow
s: s
eldo
m/n
ever
= 1
; occ
asio
nally
= 2
; usu
ally
= 3
; (al
mos
t) a
lway
s =
4.

76Evaluation of the organization and provision of primary care in Serbia
77Evaluation of the organization and provision of primary care in Serbia
Preventive and medical technical procedures provided in PC Involvement in the provision of medical procedures to patients (such as minor surgery) was measured with 16 items. Physicians could indicate whether they would provide the procedure “(almost) always”, “usually”, “occasionally”, “seldom/never” or “do not know”. The percentages in tables 36 and 37 refer to physicians who said that they would always or usually provide the procedure. The percentages in brackets refer to the category “oc-casionally”. At a glance, Table 36 shows that these clinical tasks are outside the core of the professional domain of Serbian GPs and paediatricians. The very low summary scores on the bottom line of the table need little further explanation.
In contrast to the previous tasks, these procedural tasks show parallel profiles for GPs and paediatricians, who are marginally involved in the listed procedures, but in those where they are involved they are both involved. This general picture applies to all three regions and to both urban and rural areas (see Table 37).

78Evaluation of the organization and provision of primary care in Serbia
79Evaluation of the organization and provision of primary care in Serbia
Tab
le 3
6 .
Ph
ysi
cian
in
vol
vem
ent
in m
edic
al-t
ech
nic
al p
roce
du
res,
by
reg
ion
Pro
ced
ure
Voj
vod
ina
(N=
96)
Cen
tral
Ser
bia
(N=
95)
Bel
gra
de
(N=
94)
Tot
al(N
=28
5)
% G
Ps*
%
Pae
d .*
Val
id
N%
GP
s*%
P
aed
.*V
alid
N
% G
Ps*
%
Pae
d .*
Val
id
N%
GP
s*%
P
aed
.*V
alid
N
Wed
ge r
esec
tion
of i
ngro
wn
toen
ail
1812
71/2
51
2970
/24
65
69/2
29
621
0/71
Rem
oval
of s
ebac
eous
cys
t fr
om s
calp
114
71/2
51
469
/24
3-
69/2
25
120
9/71
Wou
nd s
utur
ing
3329
69/2
43
-66
/24
1610
67/2
018
1320
2/68
Exc
isio
n of
war
ts7
-69
/24
2-
66/2
45
-65
/20
5-
200/
67
IUD
inse
rtio
n1
-69
/21
5-
66/2
43
-63
/16
3-
198/
61
Rem
oval
of r
usty
spo
t fr
om c
orne
a4
-69
/23
2-
66/2
42
-66
/19
3-
201/
66
Fund
osco
py1
-69
/23
2-
66/2
42
-67
/20
2-
202/
67
Join
t in
ject
ion
10-
69/2
15
-66
/24
6-
66/1
87
-20
1/63
Max
illar
y (s
inus
) pun
ctur
e2
-68
/21
9-
65/2
32
-65
/18
1-
198/
62
Myr
ingo
tom
y of
ear
drum
(par
acen
tesi
s)2
-68
/22
--
66/2
42
-65
/18
1-
199/
64
App
lyin
g pl
aste
r ca
st1
-69
/22
2-
66/2
45
-63
/20
3-
198/
66
Stra
ppin
g an
ank
le28
2368
/22
1917
67/2
434
1564
/20
2723
199/
66
Cry
othe
rapy
(war
ts)
4-
68/2
26
-63
/23
10-
60/1
87
-19
1/63
Sett
ing
up in
trav
enou
s in
fusi
on91
5769
/23
8629
66/2
486
7464
/19
8852
199/
66
Imm
uniz
atio
n fo
r flu
or
teta
nus
9910
069
/24
8883
67/2
496
9666
/25
9793
202/
73
Alle
rgy
vacc
inat
ions
364
67/2
442
2567
/24
2816
64/1
935
1519
8/67
TO
TA
L S
CO
RE
Med
ical
pro
ced
ure
s /
p
rev
enti
on *
1 .
561 .
441 .
501 .
401 .
501 .
391 .
521 .
41
* Fo
r th
e ca
lcul
atio
n of
the
sco
re, a
nsw
ers
have
bee
n w
eigh
ted
as fo
llow
s: u
sual
ly d
one
by m
edic
al s
peci
alis
t =
1; u
sual
ly d
one
by o
ther
PH
C d
octo
r =
2; u
sual
ly d
one
by p
ract
ice
staf
f = 3
; usu
ally
do
ne b
y m
ysel
f = 4

78Evaluation of the organization and provision of primary care in Serbia
79Evaluation of the organization and provision of primary care in Serbia
Tab
le 3
7 .
Ph
ysi
cian
in
vol
vem
ent
in m
edic
al-t
ech
nic
al p
roce
du
res,
by
urb
aniz
atio
n
Pro
ced
ure
Urb
an(N
=22
4)R
ura
l(N
=61
)T
otal
(N=
285)
% G
Ps*
% P
aed
.*V
alid
N%
GP
s*%
Pae
d .*
Val
id N
% G
Ps*
% P
aed
.*V
alid
N
Wed
ge r
esec
tion
of i
ngro
wn
toen
ail
85
159/
6112
1051
/10
96
210/
71
Rem
oval
of s
ebac
eous
cys
t fr
om h
airy
sca
lp5
215
9/61
6-
50/1
05
120
9/71
Wou
nd s
utur
ing
1510
153/
5827
3049
/10
1813
202/
68
Exc
isio
n of
war
ts5
-15
1/58
4-
49/9
5-
200/
67
IUD
inse
rtio
n2
-14
9/53
6-
49/8
3-
198/
61
Rem
oval
of r
usty
spo
t fr
om c
orne
a1
-15
2/57
6-
49/9
3-
201/
66
Fund
osco
py1
-15
3/58
2-
49/9
2-
202/
67
Join
t in
ject
ion
7-
152/
548
-49
/97
-20
1/63
Max
illar
y (s
inus
) pun
ctur
e1
-15
0/53
--
48/9
1-
198/
62
Myr
ingo
tom
y of
ear
drum
(par
acen
tesi
s)1
-15
0/55
--
49/9
1-
199/
64
App
lyin
g pl
aste
r ca
st3
-14
9/57
--
49/9
3-
198/
66
Stra
ppin
g an
ank
le23
2315
0/57
4122
49/9
2723
199/
66
Cry
othe
rapy
(war
ts)
8-
145/
544
-46
/97
-19
1/63
Sett
ing
up in
trav
enou
s in
fusi
on88
4615
1/57
8889
48/9
8852
199/
66
Imm
uniz
atio
n fo
r flu
or
teta
nus
9592
154/
6492
100
48/9
9793
202/
73
Alle
rgy
vacc
inat
ions
3514
150/
5838
2248
/935
1519
8/67
TO
TA
L S
CO
RE
Med
ical
pro
ced
ure
s /p
rev
enti
on *
1 .
511 .
401 .
551 .
521 .
521 .
41
* Fo
r th
e ca
lcul
atio
n of
the
sco
re, a
nsw
ers
have
bee
n w
eigh
ted
as fo
llow
s: u
sual
ly d
one
by m
edic
al s
peci
alis
t =
1; u
sual
ly d
one
by o
ther
PH
C d
octo
r =
2; u
sual
ly d
one
by p
ract
ice
staf
f = 3
; usu
ally
do
ne b
y m
ysel
f = 4

80Evaluation of the organization and provision of primary care in Serbia
81Evaluation of the organization and provision of primary care in Serbia
Tab
le 3
8 .
Ph
ysi
cian
in
vol
vem
ent
in a
ctiv
itie
s fo
r sp
ecifi
c g
rou
ps
Act
ivit
y
Voj
vod
ina
(N=
96)
Cen
tral
Ser
bia
(N=
95)
Bel
gra
de
(N=
94)
Tot
al(N
=28
5)
% G
Ps*
%
Pae
d .*
Val
id
N%
GP
s*%
P
aed
.*V
alid
N
% G
Ps*
%
Pae
d .*
Val
id
N%
GP
s*%
P
aed
.*V
alid
N
Scre
enin
g fo
r ST
Ds
138
66/2
211
864
/24
912
60/1
911
919
0/65
Scre
enin
g fo
r H
IV /
AID
S14
866
/22
144
64/2
413
1660
/18
149
190/
64
TB
Scr
eeni
ng
1716
65/2
213
2063
/23
124
58/1
714
1318
6/62
Influ
enza
vac
cina
tion
pro
gram
me
for
high
-ri
sk g
roup
s89
7268
/24
6656
67/2
490
7267
/21
8167
202/
69
Reh
abili
tati
ve c
are
3220
66/2
120
4062
/23
3916
59/1
631
2518
7/60
Scho
ol h
ealth
car
e16
8062
/24
768
61/2
4-
6050
/22
869
173/
70
Cer
vica
l can
cer
scre
enin
g 21
-66
/21
16-
62/2
310
-54
/18
16-
182/
62
Bre
ast
canc
er s
cree
ning
55
-67
/21
37-
64/2
355
-60
/18
49-
191/
62
Col
on c
arci
nom
a sc
reen
ing
87-
70/2
156
-65
/22
83-
66/1
875
-20
1/61
Ana
emia
scr
eeni
ng69
8868
/25
5688
65/2
464
6063
/21
6379
196/
70
Scre
enin
g in
fant
s fo
r hi
p de
form
atio
n10
6465
/25
164
59/2
480
4055
/20
456
179/
69
Scre
enin
g fo
r he
arin
g an
d vi
sion
defi
cien
-ci
es28
6067
/23
2072
60/2
422
3658
/19
2356
185/
66
TO
TA
L c
over
age
for
Sp
ec . g
rou
ps
37 .6
%34
.7%
26 .4
%35
.0%
39 .8
%26
.3%
32 .4
%31
.9%
Two
addi
tion
al q
uest
ions
dea
lt w
ith
the
phys
icia
ns’ p
erce
ptio
n of
unn
eces
sary
dru
g pr
escr
ipti
ons
and
thei
r op
inio
n ab
out
the
bala
nce
in t
heir
wor
k be
twee
n cu
rati
ve a
nd p
reve
ntiv
e ta
sks.
Res
ults
are
pre
sent
ed in
tab
les
38 a
nd 3
9.
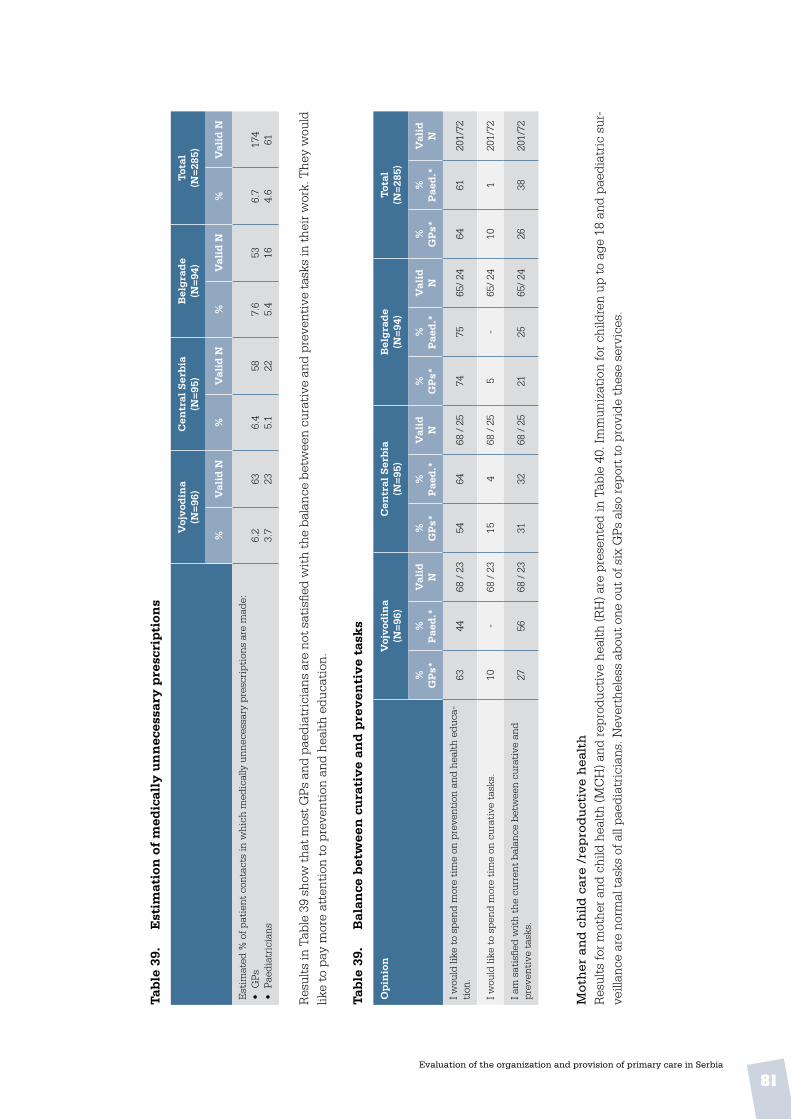
80Evaluation of the organization and provision of primary care in Serbia
81Evaluation of the organization and provision of primary care in Serbia
Tab
le 3
9 .
Est
imat
ion
of
med
ical
ly u
nn
eces
sary
pre
scri
pti
ons
Voj
vod
ina
(N=
96)
Cen
tral
Ser
bia
(N=
95)
Bel
gra
de
(N=
94)
Tot
al(N
=28
5)
%V
alid
N%
Val
id N
%V
alid
N%
Val
id N
Est
imat
ed %
of p
atie
nt c
onta
cts
in w
hich
med
ical
ly u
nnec
essa
ry p
resc
ript
ions
are
mad
e:•
GPs
• Pa
edia
tric
ians
6.2
3.7
63 236.
45.
158 22
7.6
5.4
53 166.
74.
617
461
Res
ults
in T
able
39
show
that
mos
t GPs
and
pae
diat
rici
ans
are
not s
atis
fied
wit
h th
e ba
lanc
e be
twee
n cu
rati
ve a
nd p
reve
ntiv
e ta
sks
in th
eir w
ork.
The
y w
ould
lik
e to
pay
mor
e at
tent
ion
to p
reve
ntio
n an
d he
alth
edu
cati
on.
Tab
le 3
9 .
Bal
ance
bet
wee
n c
ura
tiv
e an
d p
rev
enti
ve
task
s
Op
inio
nV
ojv
odin
a(N
=96
)C
entr
al S
erb
ia(N
=95
)B
elg
rad
e(N
=94
)T
otal
(N=
285)
%
GP
s*%
P
aed
.*V
alid
N
%
GP
s*%
P
aed
.*V
alid
N
%
GP
s*%
P
aed
.*V
alid
N
%
GP
s*%
P
aed
.*V
alid
N
I wou
ld li
ke t
o sp
end
mor
e ti
me
on p
reve
ntio
n an
d he
alth
edu
ca-
tion
.63
4468
/ 2
354
6468
/ 2
574
7565
/ 24
6461
201/
72
I wou
ld li
ke t
o sp
end
mor
e ti
me
on c
urat
ive
task
s.10
-68
/ 2
315
468
/ 2
55
-65
/ 24
101
201/
72
I am
sat
isfie
d w
ith
the
curr
ent
bala
nce
betw
een
cura
tive
and
pr
even
tive
tas
ks.
2756
68 /
23
3132
68 /
25
2125
65/
2426
3820
1/72
Mot
her
an
d c
hild
car
e /r
epro
du
ctiv
e h
ealt
hR
esul
ts fo
r m
othe
r an
d ch
ild h
ealth
(MC
H) a
nd r
epro
duct
ive
heal
th (R
H) a
re p
rese
nted
in T
able
40.
Imm
uniz
atio
n fo
r ch
ildre
n up
to
age
18 a
nd p
aedi
atri
c su
r-ve
illan
ce a
re n
orm
al t
asks
of a
ll pa
edia
tric
ians
. Nev
erth
eles
s ab
out
one
out
of s
ix G
Ps a
lso
repo
rt t
o pr
ovid
e th
ese
serv
ices
.

82Evaluation of the organization and provision of primary care in Serbia
GPs
in ru
ral a
reas
are
muc
h m
ore
invo
lved
in a
ll fo
ur ta
sks
(Tab
le 4
0). R
ural
pae
diat
rici
ans
are
also
mor
e in
volv
ed th
an u
rban
col
leag
ues,
but
onl
y in
fam
ily p
lan-
ning
/ c
ontr
acep
tion
and
rou
tine
ant
enat
al c
are.
Tab
le 4
0 .
Ph
ysi
cian
s p
rov
idin
g s
erv
ices
to
all
or m
ost
mot
her
s an
d c
hil
dre
n, b
y r
egio
n
Ser
vic
eV
ojv
odin
a(N
=96
)C
entr
al S
erb
ia(N
=95
)B
elg
rad
e(N
=94
)T
otal
(N=
285)
%
GP
s*%
P
aed
.*V
alid
N
%
GP
s*%
P
aed
.*V
alid
N
%
GP
s*%
P
aed
.*V
alid
N
%
GP
s*%
P
aed
.*V
alid
N
Fam
ily p
lann
ing
and
cont
race
ptio
n14
4265
/19
1129
64/2
48
2452
/17
1132
181/
60
Rou
tine
ant
enat
al c
are
1940
64/2
011
3862
/24
1250
49/1
614
4217
5/60
Nor
mal
imm
uniz
atio
ns o
f chi
ldre
n un
der
age
1826
100
66/2
58
9661
/24
1010
049
/24
1599
176/
73
Rou
tine
pae
diat
ric
surv
eilla
nce
(und
er a
ge 1
8)30
100
66/2
516
9662
/25
1010
049
/23
1899
177/
73
Tab
le 4
1 .
Ph
ysi
cian
s p
rov
idin
g s
erv
ices
to
all
or m
ost
mot
her
s an
d c
hil
dre
n, b
y u
rban
izat
ion
Ser
vic
eU
rban
(N=
224)
Ru
ral
(N=
61)
Tot
al(N
=28
5)
% G
Ps*
% P
aed
.*V
alid
N%
GP
s*%
Pae
d .*
Val
id N
% G
Ps*
% P
aed
.*V
alid
N
Fam
ily p
lann
ing
and
cont
race
ptio
n9
3313
2/51
1678
49/9
1132
181/
60
Rou
tine
ant
enat
al c
are
943
129/
5128
6746
/914
4217
5/60
Nor
mal
imm
uniz
atio
ns o
f chi
ldre
n un
der
age
189
100
128/
6333
9048
/10
1599
176/
73
Rou
tine
pae
diat
ric
surv
eilla
nce
(und
er a
ge 1
8)11
100
129/
6338
9048
/10
1899
177/
73
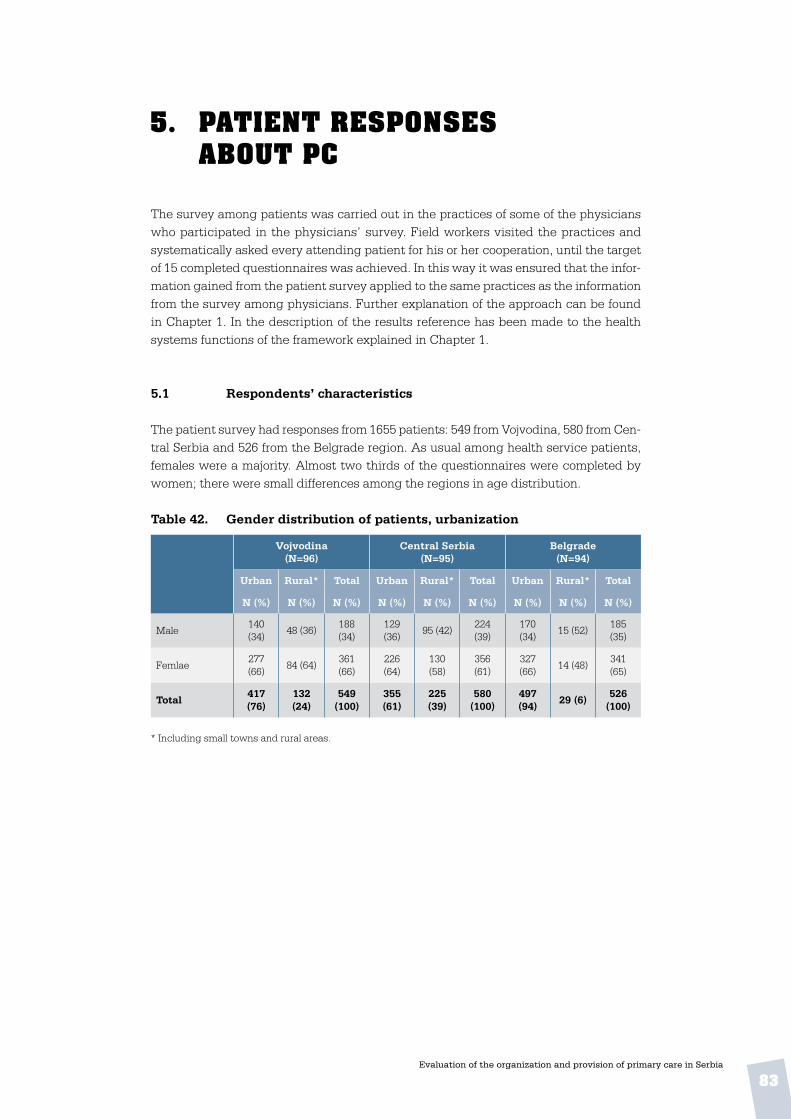
83Evaluation of the organization and provision of primary care in Serbia
5. patient responses about pc
The survey among patients was carried out in the practices of some of the physicians who participated in the physicians’ survey. Field workers visited the practices and systematically asked every attending patient for his or her cooperation, until the target of 15 completed questionnaires was achieved. In this way it was ensured that the infor-mation gained from the patient survey applied to the same practices as the information from the survey among physicians. Further explanation of the approach can be found in Chapter 1. In the description of the results reference has been made to the health systems functions of the framework explained in Chapter 1.
5 .1 Respondents’ characteristics
The patient survey had responses from 1655 patients: 549 from Vojvodina, 580 from Cen-tral Serbia and 526 from the Belgrade region. As usual among health service patients, females were a majority. Almost two thirds of the questionnaires were completed by women; there were small differences among the regions in age distribution.
Table 42 . Gender distribution of patients, urbanization
Vojvodina(N=96)
Central Serbia(N=95)
Belgrade(N=94)
Urban Rural* Total Urban Rural* Total Urban Rural* Total
N (%) N (%) N (%) N (%) N (%) N (%) N (%) N (%) N (%)
Male140 (34)
48 (36)188 (34)
129 (36)
95 (42)224 (39)
170 (34)
15 (52)185 (35)
Femlae277 (66)
84 (64)361 (66)
226 (64)
130 (58)
356 (61)
327 (66)
14 (48)341 (65)
Total417 (76)
132 (24)
549 (100)
355 (61)
225 (39)
580 (100)
497 (94)
29 (6)526
(100)
* Including small towns and rural areas.

84Evaluation of the organization and provision of primary care in Serbia
Table 43 . Patients’ age, occupation and living situation
Patients’ background Urban(N=224)
Rural(N=61)
Total(N=285)
Abs . % Abs . % Abs . %
Age• up to 20 yrs• 21 – 30• 31 – 40• 41 – 50• 51 – 60• Over 60
2652
11911893
137
51022221724
3464
45895
102124
61127161822
2144
1188496
147
49
23171928
Total 539 100 577 100 510 100
Occupation• in school• unemployed• unable to work (disability)• looking after family• employee• self-employed• retired• other
36662
3024722
13710
71206
454
251
34104
942
22926
12810
61727
395
222
30486
1526110
1539
6913
491
292
Total 550 100 582 100 532 100
Living situation• alone• with parents• with husband / wife• with family (incl. children)• with children • other
586290
2833821
1111165174
446577
3315316
811135792
635685
2555716
11111648113
Total 552 100 586 100 532 100
5 .2 Accessibility of care
5 .2 .1 Financial access
Table 44 . Services for which copayment from patients is required
Type of service Vojvodina(N=549)
Central Serbia(N=580)
Belgrade(N=526)
Abs . % Abs . % Abs . %
Visit to your doctor 277 50 230 39 247 46
Medicines or injections prescribed by your doctor 364 65 309 53 315 58
A visit to a specialist after referral by your doctor 283 51 246 42 261 48
Home visit by your doctor 159 29 80 14 98 18
Regular check up of baby or young child 29 5 29 5 16 3

85Evaluation of the organization and provision of primary care in Serbia
Except for one, for all PC services listed in Table 44 required payment by substantial proportions of respondents, indicating financial barriers for many people accessing es-sential PC services, as 11% of the respondents delayed or avoided a visit to the doctor in the past twelve months for this reason (see Table 45).
Table 45 . Patients reporting financial barriers to PC access, past 12 months
Decision taken in past year Vojvodina(N=549)
Central Serbia(N=580)
Belgrade(N=526)
Abs . % Abs . % Abs . %
Not to visit or delay a visit because I could not pay for the medicines 56 10 66 11 59 11
5 .2 .2 Geographical access and responsiveness
In this section results will be presented for CHC or ambulatory services, in the categories of attainability and accessibility, opening hours and convenience and patient-friendliness. As Figure 11 and Table 46 show, on average, at least two-thirds of the respondents answer they can reach their doctor and pharmacy within 20 minutes travelling time. The reported travel times to the dentist are longer than to the doctor and the pharmacy, but still half of the respondents could reach the dentist within 20 minutes. Hospitals are usually farther away. Around 20% can reach a hospital within 20 minutes.
Figure 11 . Patients with under 20 minutes travel time
Vojvodina Central Serbia Belgrade
Your doctor Dentist HospitalPharmacist 0
20
40
60
80
100

86Evaluation of the organization and provision of primary care in Serbia
Table 46 . Patients’ travel time to PC providers
Provider and distance Vojvodina(N=549)
Central Serbia(N=580)
Belgrade(N=526)
Abs . % Abs . % Abs . %
Your doctor• up to 20 minutes• 20-40 minutes• 40-60 minutes• more than 1 hour• don’t know
44696913
8017201
4261261981
7322320
35912239161
6723730
Total 555 100 580 100 537 100
Pharmacist• up to 20 minutes• 20-40 minutes• 40-60 minutes• more than 1 hour• don’t know
440695-3
85131-1
36913337131
6724720
396651772
8113411
Total 517 100 553 100 487 100
Dentist• up to 20 minutes• 20-40 minutes• 40-60 minutes• more than 1 hour• don’t know
287138232034
5728447
283157612912
52291162
232140432727
4930966
Total 502 100 542 100 469 100
Hospital• up to 20 minutes• 20-40 minutes• 40-60 minutes• more than 1 hour• don’t know
1352141044512
27422092
176229102368
31411972
1261971034613
26412193
Total 510 100 551 100 485 100
Table 47 shows the respondents’ perceived quality of their PC facility, including acces-sibility and convenience, treatment by practice staff and opening hours and availability of service providers. Possible answers were: “Yes, I agree”, “I agree somewhat”, “I do not agree”, and “I don’t know”. Percentages in the table refer to the number answering “Yes, I agree”.
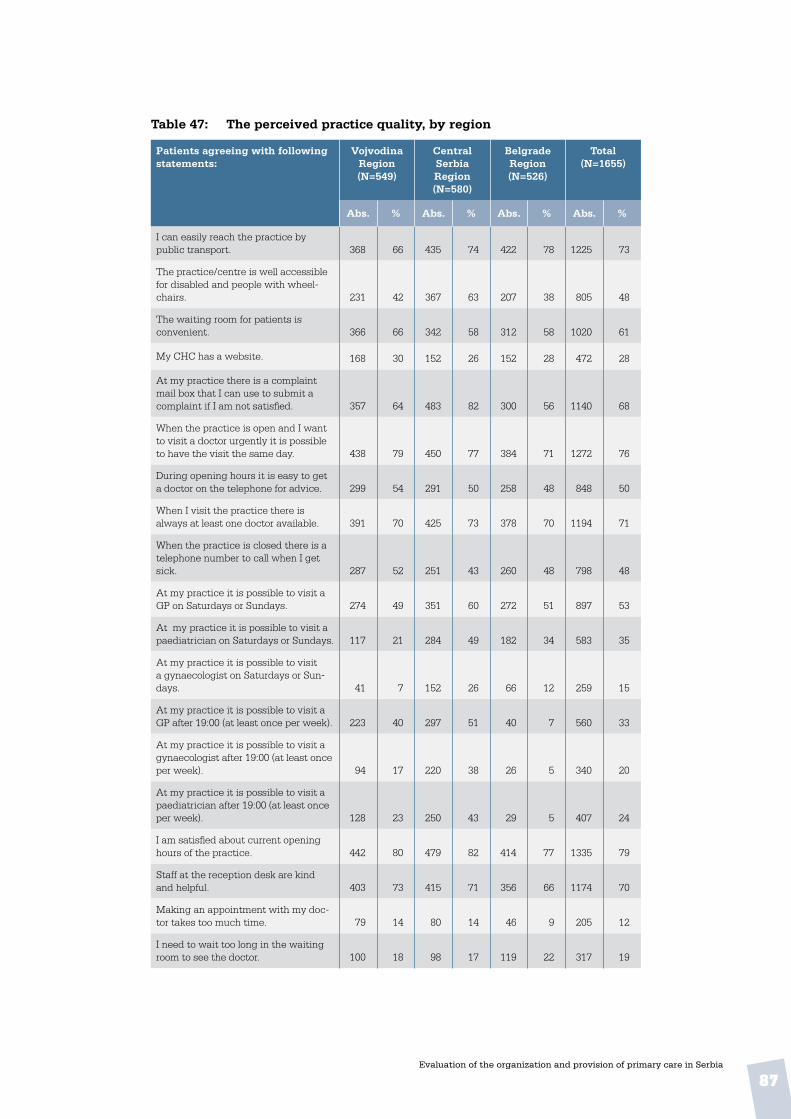
87Evaluation of the organization and provision of primary care in Serbia
Table 47: The perceived practice quality, by region
Patients agreeing with following statements:
Vojvodina Region (N=549)
Central Serbia Region (N=580)
Belgrade Region (N=526)
Total(N=1655)
Abs . % Abs . % Abs . % Abs . %
I can easily reach the practice by public transport. 368 66 435 74 422 78 1225 73
The practice/centre is well accessible for disabled and people with wheel-chairs. 231 42 367 63 207 38 805 48
The waiting room for patients is convenient. 366 66 342 58 312 58 1020 61
My CHC has a website. 168 30 152 26 152 28 472 28
At my practice there is a complaint mail box that I can use to submit a complaint if I am not satisfied. 357 64 483 82 300 56 1140 68
When the practice is open and I want to visit a doctor urgently it is possible to have the visit the same day. 438 79 450 77 384 71 1272 76
During opening hours it is easy to get a doctor on the telephone for advice. 299 54 291 50 258 48 848 50
When I visit the practice there is always at least one doctor available. 391 70 425 73 378 70 1194 71
When the practice is closed there is a telephone number to call when I get sick. 287 52 251 43 260 48 798 48
At my practice it is possible to visit a GP on Saturdays or Sundays. 274 49 351 60 272 51 897 53
At my practice it is possible to visit a paediatrician on Saturdays or Sundays. 117 21 284 49 182 34 583 35
At my practice it is possible to visit a gynaecologist on Saturdays or Sun-days. 41 7 152 26 66 12 259 15
At my practice it is possible to visit a GP after 19:00 (at least once per week). 223 40 297 51 40 7 560 33
At my practice it is possible to visit a gynaecologist after 19:00 (at least once per week). 94 17 220 38 26 5 340 20
At my practice it is possible to visit a paediatrician after 19:00 (at least once per week). 128 23 250 43 29 5 407 24
I am satisfied about current opening hours of the practice. 442 80 479 82 414 77 1335 79
Staff at the reception desk are kind and helpful. 403 73 415 71 356 66 1174 70
Making an appointment with my doc-tor takes too much time. 79 14 80 14 46 9 205 12
I need to wait too long in the waiting room to see the doctor. 100 18 98 17 119 22 317 19
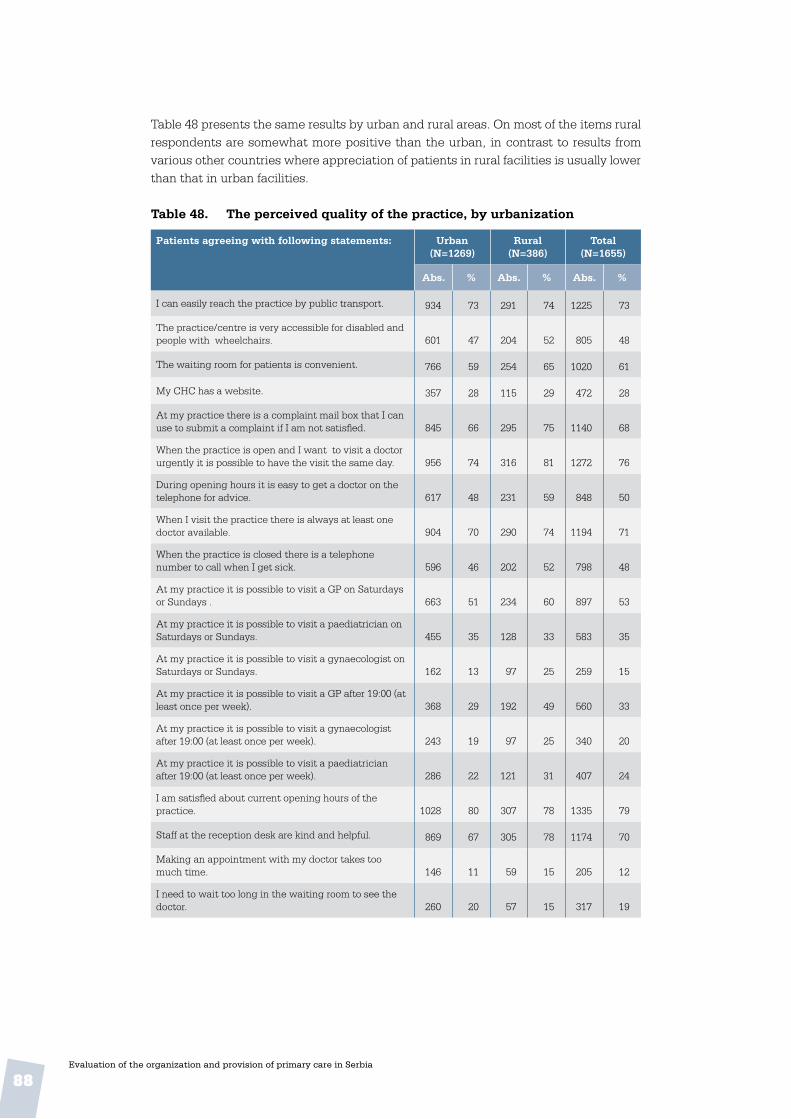
88Evaluation of the organization and provision of primary care in Serbia
Table 48 presents the same results by urban and rural areas. On most of the items rural respondents are somewhat more positive than the urban, in contrast to results from various other countries where appreciation of patients in rural facilities is usually lower than that in urban facilities.
Table 48 . The perceived quality of the practice, by urbanization
Patients agreeing with following statements: Urban(N=1269)
Rural(N=386)
Total(N=1655)
Abs . % Abs . % Abs . %
I can easily reach the practice by public transport. 934 73 291 74 1225 73
The practice/centre is very accessible for disabled and people with wheelchairs. 601 47 204 52 805 48
The waiting room for patients is convenient. 766 59 254 65 1020 61
My CHC has a website. 357 28 115 29 472 28
At my practice there is a complaint mail box that I can use to submit a complaint if I am not satisfied. 845 66 295 75 1140 68
When the practice is open and I want to visit a doctor urgently it is possible to have the visit the same day. 956 74 316 81 1272 76
During opening hours it is easy to get a doctor on the telephone for advice. 617 48 231 59 848 50
When I visit the practice there is always at least one doctor available. 904 70 290 74 1194 71
When the practice is closed there is a telephone number to call when I get sick. 596 46 202 52 798 48
At my practice it is possible to visit a GP on Saturdays or Sundays . 663 51 234 60 897 53
At my practice it is possible to visit a paediatrician on Saturdays or Sundays. 455 35 128 33 583 35
At my practice it is possible to visit a gynaecologist on Saturdays or Sundays. 162 13 97 25 259 15
At my practice it is possible to visit a GP after 19:00 (at least once per week). 368 29 192 49 560 33
At my practice it is possible to visit a gynaecologist after 19:00 (at least once per week). 243 19 97 25 340 20
At my practice it is possible to visit a paediatrician after 19:00 (at least once per week). 286 22 121 31 407 24
I am satisfied about current opening hours of the practice. 1028 80 307 78 1335 79
Staff at the reception desk are kind and helpful. 869 67 305 78 1174 70
Making an appointment with my doctor takes too much time. 146 11 59 15 205 12
I need to wait too long in the waiting room to see the doctor. 260 20 57 15 317 19

89Evaluation of the organization and provision of primary care in Serbia
5 .3 Continuity of care
5 .3 .1 Longitudinal and interpersonal continuity
Table 49 presents the results of the reported number of visits by respondents to various PC physicians and PC nurses. As respondents are not representative of the national population, frequencies in this table cannot be compared to the national average, for instance, as mentioned in Table 12 in Chapter 3. It is most likely that rare visitors to CHCs are under-represented. Furthermore, some patients have reported visits to more than one chosen doctor, which may be due to the scheme’s novelty.
Although these visit data need to be interpreted with care, they seem to clarify some observations. First, taking all visits to chosen and other PC doctors into account, the visit frequency of our respondents seems to be very high. Furthermore, in addition to chosen doctors, respondents see various other PC physicians, so the position of chosen doctors seems to be far from exclusive.

90Evaluation of the organization and provision of primary care in Serbia
Table 49 . Patients’ frequency of visits to their own and other PC physicians during the previous 12 months
Visit frequency past 12 months Vojvodina (N=549)
Central Serbia
(N=580)
Belgrade (N=526)
Total(N=1655)
Abs . % Abs . % Abs . % Abs . %
My GP (chosen doctor)• 1-3 visits• 4-6 visits• 7-9 visit• 10 or more visits
12411726
190
27256
42
1269726
232
26205
49
1409540
183
30219
40
39030992
605
28227
43
Total respondents 457 100 481 100 458 100 1396 100
Average annual visit frequency • GP patients• Paediatrician patients
8.74.0
10.23.0
8.34.0
9.13.6
Other GP Total respondents 64 100 96 100 114 100 274 100
Average annual visit frequency • GP patients• Paediatrician patients
3.24.1
4.52.8
4.12.4
4.02.9
My PC paediatr . (chosen doctor)• 1-3 visits• 4-6 visits• 7-9 visit• 10 or more visits
29311137
27291034
31561868
18321040
16271233
18311338
7611441
138
21311137
Total respondents 108 100 173 100 88 100 369 100
Average annual visit frequency • GP patients• Paediatrician patients
5.59.0
4.79.8
6.47.9
5.59.1
Other PC paediatrician Total respondents 36 100 45 100 43 100 124 100
Average annual visit frequency • GP patients• Paediatrician patients
1.33.9
1.53.3
3.33.4
2.63.5
PC gynaecologist (chosen doctor) Total respondents 136 100 159 100 178 100 473 100
Average annual visit frequency • GP patients• Paediatrician patients
2.22.3
2.42.7
2.62.2
2.42.4
Other PC gynaecologist Total respondents 11 100 11 100 22 100 44 100
Average annual visit frequency • GP patients• Paediatrician patients
1.91.0
2.02.0
1.74.0
1.82.5
Occupational doctor (chosen)Total respondents 19 100 15 100 15 100 49 100
Average annual visit frequency • GP patients• Paediatrician patients
6.33.9
2.32.3
2.01.8
3.53.0
Other occupational doctor Total respondents 21 100 21 100 24 100 66 100
Average annual visit frequency • GP patients• Paediatrician patients
4.21.9
4.41.0
3.42.6
4.02.1
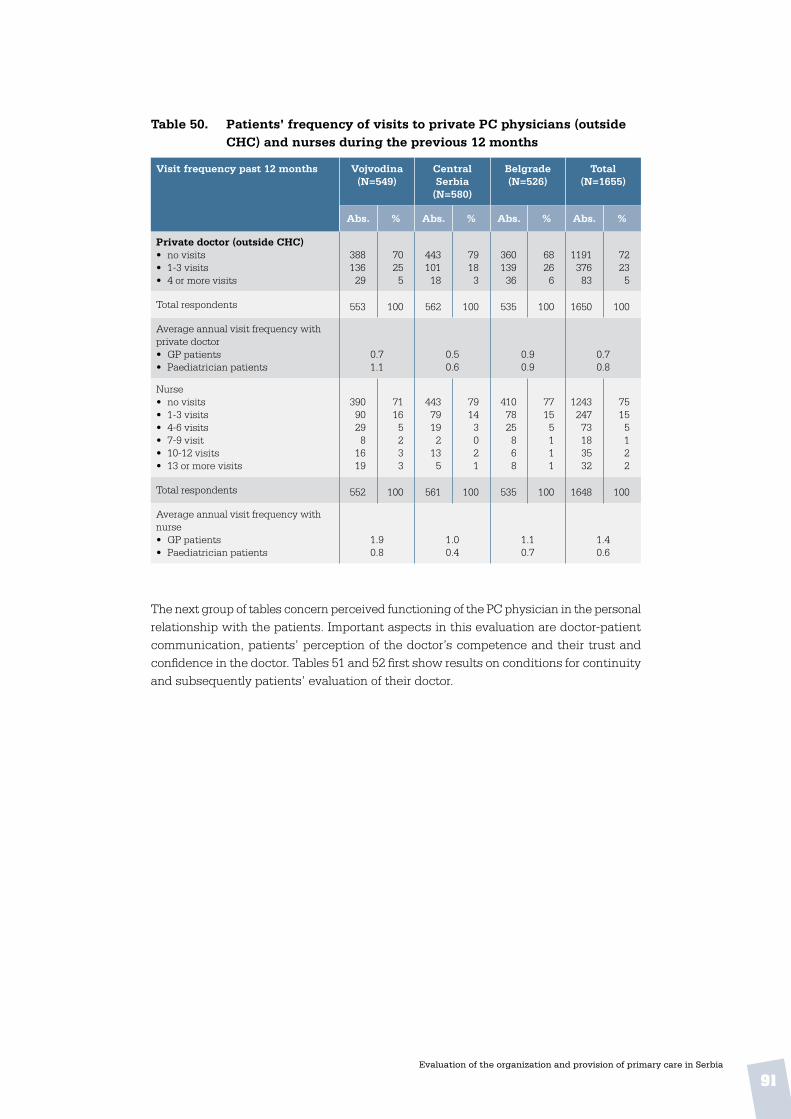
91Evaluation of the organization and provision of primary care in Serbia
Table 50 . Patients’ frequency of visits to private PC physicians (outside CHC) and nurses during the previous 12 months
Visit frequency past 12 months Vojvodina (N=549)
Central Serbia
(N=580)
Belgrade (N=526)
Total(N=1655)
Abs . % Abs . % Abs . % Abs . %
Private doctor (outside CHC)• no visits• 1-3 visits• 4 or more visits
38813629
70255
44310118
79183
36013936
68266
119137683
72235
Total respondents 553 100 562 100 535 100 1650 100
Average annual visit frequency with private doctor • GP patients• Paediatrician patients
0.71.1
0.50.6
0.90.9
0.70.8
Nurse• no visits• 1-3 visits• 4-6 visits• 7-9 visit• 10-12 visits• 13 or more visits
39090298
1619
71165233
44379192
135
79143021
4107825868
77155111
124324773183532
75155122
Total respondents 552 100 561 100 535 100 1648 100
Average annual visit frequency with nurse • GP patients• Paediatrician patients
1.90.8
1.00.4
1.10.7
1.40.6
The next group of tables concern perceived functioning of the PC physician in the personal relationship with the patients. Important aspects in this evaluation are doctor-patient communication, patients’ perception of the doctor’s competence and their trust and confidence in the doctor. Tables 51 and 52 first show results on conditions for continuity and subsequently patients’ evaluation of their doctor.
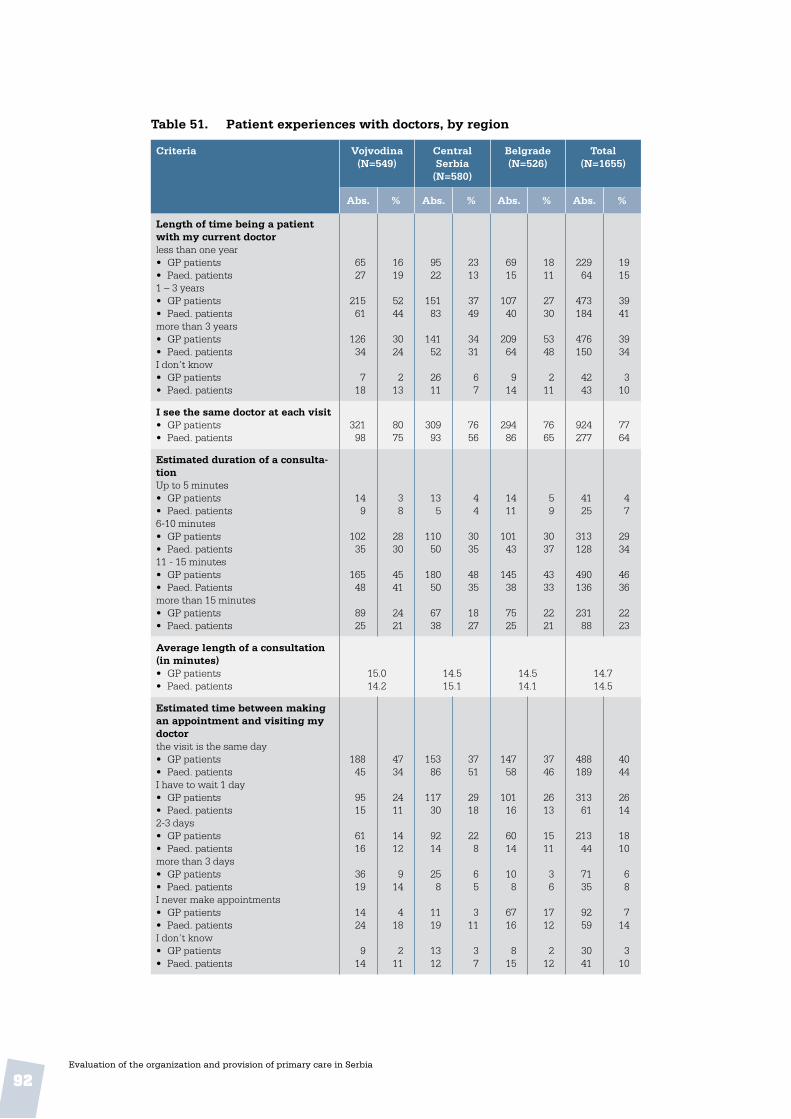
92Evaluation of the organization and provision of primary care in Serbia
Table 51. Patient experiences with doctors, by region
Criteria Vojvodina (N=549)
Central Serbia
(N=580)
Belgrade (N=526)
Total(N=1655)
Abs. % Abs. % Abs. % Abs. %
Length of time being a patient with my current doctorless than one year• GP patients• Paed. patients1 – 3 years• GP patients• Paed. patientsmore than 3 years• GP patients• Paed. patientsI don’t know• GP patients• Paed. patients
6527
21561
12634
718
1619
5244
3024
213
9522
15183
14152
2611
2313
3749
3431
67
6915
10740
20964
914
1811
2730
5348
211
22964
473184
476150
4243
1915
3941
3934
310
I see the same doctor at each visit• GP patients• Paed. patients
32198
8075
30993
7656
29486
7665
924277
7764
Estimated duration of a consulta-tionUp to 5 minutes• GP patients• Paed. patients6-10 minutes• GP patients• Paed. patients11 - 15 minutes• GP patients• Paed. Patientsmore than 15 minutes• GP patients• Paed. patients
149
10235
16548
8925
38
2830
4541
2421
135
11050
18050
6738
44
3035
4835
1827
1411
10143
14538
7525
59
3037
4333
2221
4125
313128
490136
23188
47
2934
4636
2223
Average length of a consultation (in minutes)• GP patients• Paed. patients
15.014.2
14.515.1
14.514.1
14.714.5
Estimated time between making an appointment and visiting my doctorthe visit is the same day• GP patients• Paed. patientsI have to wait 1 day• GP patients• Paed. patients2-3 days• GP patients• Paed. patientsmore than 3 days• GP patients• Paed. patientsI never make appointments• GP patients• Paed. patientsI don’t know• GP patients• Paed. patients
18845
9515
6116
3619
1424
914
4734
2411
1412
914
418
211
15386
11730
9214
258
1119
1312
3751
2918
228
65
311
37
14758
10116
6014
108
6716
815
3746
2613
1511
36
1712
212
488189
31361
21344
7135
9259
3041
4044
2614
1810
68
714
310
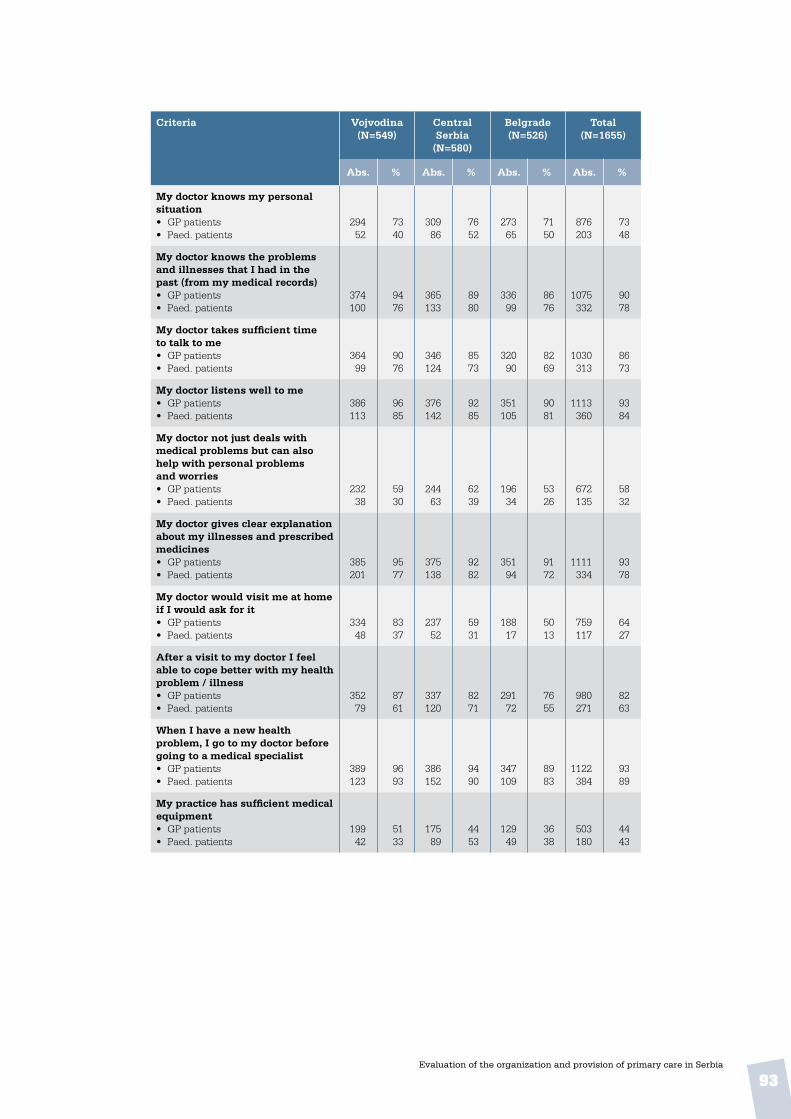
93Evaluation of the organization and provision of primary care in Serbia
Criteria Vojvodina (N=549)
Central Serbia
(N=580)
Belgrade (N=526)
Total(N=1655)
Abs . % Abs . % Abs . % Abs . %
My doctor knows my personal situation• GP patients• Paed. patients
29452
7340
30986
7652
27365
7150
876203
7348
My doctor knows the problems and illnesses that I had in the past (from my medical records)• GP patients• Paed. patients
374100
9476
365133
8980
33699
8676
1075332
9078
My doctor takes sufficient time to talk to me• GP patients• Paed. patients
36499
9076
346124
8573
32090
8269
1030313
8673
My doctor listens well to me• GP patients• Paed. patients
386113
9685
376142
9285
351105
9081
1113360
9384
My doctor not just deals with medical problems but can also help with personal problems and worries• GP patients• Paed. patients
23238
5930
24463
6239
19634
5326
672135
5832
My doctor gives clear explanation about my illnesses and prescribed medicines• GP patients• Paed. patients
385201
9577
375138
9282
35194
9172
1111334
9378
My doctor would visit me at home if I would ask for it• GP patients• Paed. patients
33448
8337
23752
5931
18817
5013
759117
6427
After a visit to my doctor I feel able to cope better with my health problem / illness• GP patients• Paed. patients
35279
8761
337120
8271
29172
7655
980271
8263
When I have a new health problem, I go to my doctor before going to a medical specialist • GP patients• Paed. patients
389123
9693
386152
9490
347109
8983
1122384
9389
My practice has sufficient medical equipment • GP patients• Paed. patients
19942
5133
17589
4453
12949
3638
503180
4443

94Evaluation of the organization and provision of primary care in Serbia
More than 80% of the patients of both GPs and paediatricians have been registered with their current doctor for more than one year. In general, the agreement of patients of paediatricians with the positive attributes is somewhat lower than with GPs, but 89% would first go to their own paediatrician before seeing a specialist. Patients were considerably less positive about the paediatrician knowing their personal situation, helping with personal problems or making home visits.
The relative appreciation of urban and rural respondents for their doctors is shown in Table 52, with consistent differences between them. Respondents from rural areas more often report that they can make same-day appointments and that the duration of consultations is longer. They are also generally more positive about their doctors. In rural areas many more respondents think that their paediatrician would make a home visit if requested, and they more often think their paediatrician has sufficient medical equipment.
Table 52 . Patients’ experiences with their doctor, by urbanization
Statements Urban (N=1269)
Rural (N=386)
Total (N=1655)
Abs . % Abs . % Abs . %
Length of time being a patient with my current doctorless than one year• GP patients• Paed. patients1 – 3 years• GP patients• Paed. patientsmore than 3 years• GP patients• Paed. patientsI don’t know• GP patients• Paed. patients
17257
335165
347130
2640
2015
3842
3933
310
577
13819
12920
163
1714
4139
3841
56
22964
473184
476150
4243
1915
3941
3934
310
I see the same doctor at each visit• GP patients• Paed. patients
650243
7663
27434
8172
924277
7764
Estimated duration of a consultationup to 5 minutes• GP patients• Paed. patients6-10 minutes• GP patients• Paed. Patients11 - 15 minutes• GP patients• Paed. patientsmore than 15 minutes• GP patients• Paed. patients
3122
226121
351125
16266
47
2936
4637
2120
103
877
13911
6922
37
2816
4626
2351
4125
313128
490136
23188
47
2934
4636
2223

95Evaluation of the organization and provision of primary care in Serbia
Statements Urban (N=1269)
Rural (N=386)
Total (N=1655)
Abs . % Abs . % Abs . %
My doctor knows my personal situation (e .g . work or home situation)• GP patients• Paed. patients
618173
7246
25830
7764
876203
7348
My doctor knows the problems and illnesses that I had in the past (from my medical records)• GP patients• Paed. patients
770289
8976
30543
9090
1075332
9078
My doctor takes sufficient time to talk to me• GP patients• Paed. patients
723271
8471
30742
9191
1030313
8673
My doctor listens well to me• GP patients• Paed. patients
790315
9282
32345
9596
1113360
9384
My doctor not just deals with medical problems but can also help with personal problems and worries• GP patients• Paed. patients
455113
5530
21722
6649
672135
5832
My doctor gives clear explanation about my illnesses and prescribed medicines• GP patients• Paed. patients
787294
9177
32440
9683
1111334
9378
My doctor would visit me at home if I would ask for it• GP patients• Paed. patients
50278
5920
25739
7583
759117
6427
After a visit to my doctor I feel able to cope better with my health problem / illness• GP patients• Paed. patients
688232
8061
29239
8683
980271
8263
When I have a new health problem, I go to my doctor before going to a medical specialist• GP patients• Paed. patients
802339
9388
32045
9496
1122384
9389
My practice has sufficient medical equipment• GP patients• Paed. patients
354154
4441
14926
4557
503180
4443

96Evaluation of the organization and provision of primary care in Serbia
Table 53 . Patients’ perception of physicians’ initiative in promoting healthy behaviour
Physicians’ health promotion during normal visits and preventive clinics
Vojvodina (N=549)
Central Serbia
(N=580)
Belgrade (N=526)
Total(N=1655)
Abs . % Abs . % Abs . % Abs . %
Eating healthyNormal visits• GP patients• Paed. patientsPreventive clinics• GP patients• Paed. patients
35797
147
8972
45
373144
54
9288
12
32792
1410
8568
47
1057333
3321
8977
35
Physical exercise Normal visits• GP patients• Paed. patientsPreventive clinics• GP patients• Paed. patients
32988
199
8668
57
342127
87
8780
24
28682
191
8066
58
957297
4626
8572
46
Use of alcoholNormal visits• GP patients• Paed. patientsPreventive clinics• GP patients• Paed. patients
16634
147
4629
46
22167
109
5841
36
13727
238
4223
77
524128
4724
4932
46
Reduce or stop smokingNormal visits• GP patients• Paed. patientsPreventive clinics• GP patients• Paed. patients
19242
219
5337
68
25284
1110
6651
36
17845
2211
5337
79
622171
5430
5843
58
Avoiding stressNormal visits• GP patients• Paed. patientsPreventive clinics• GP patients• Paed. patients
28847
197
7741
56
33890
93
8757
22
25653
1213
7544
411
882190
4023
8048
46
Safe sexNormal visits• GP patients• Paed. patientsPreventive clinics• GP patients• Paed. patients
10235
1510
3330
59
17657
1210
4938
37
10029
1713
3526
612
378121
4433
3932
59
Dangers of illicit drugsNormal visits• GP patients• Paed. patientsPreventive clinics• GP patients• Paed. patients
10333
159
3129
58
18959
79
5138
26
10424
119
3421
48
396116
3327
3930
37
According to these results, both GPs and paediatricians almost exclusively talk about health maintenance during normal visits, and rarely attend preventive clinics.
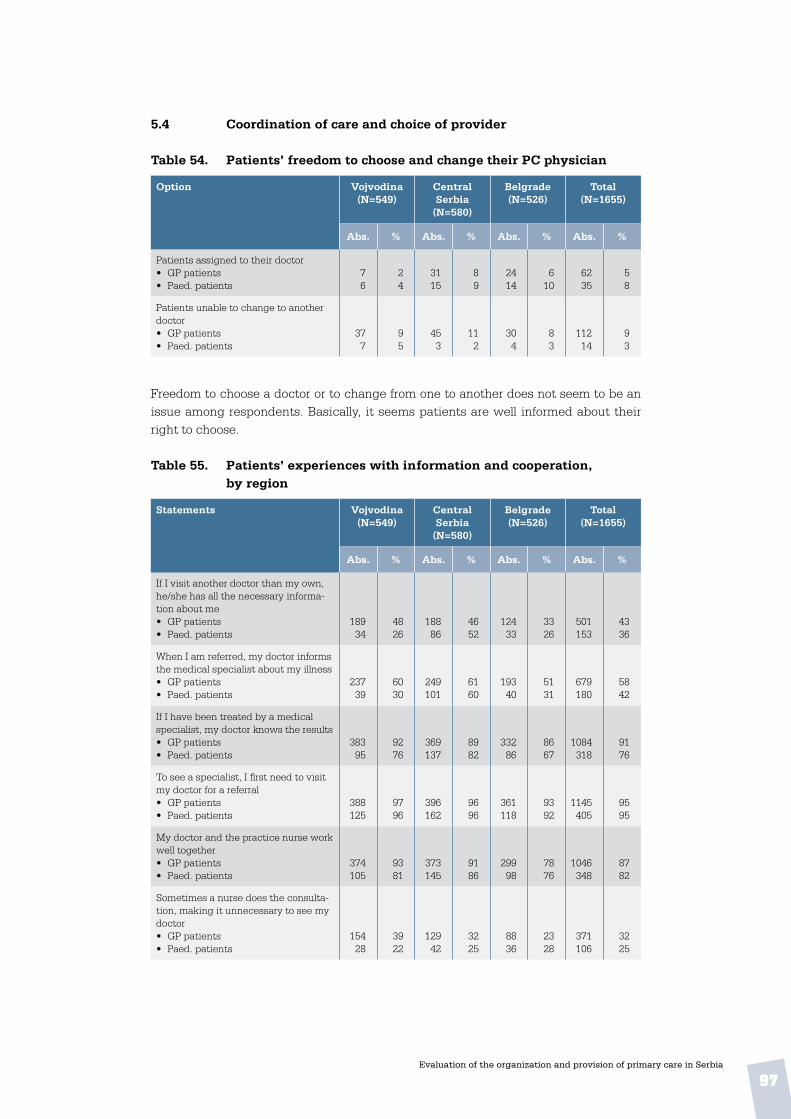
97Evaluation of the organization and provision of primary care in Serbia
5 .4 Coordination of care and choice of provider
Table 54 . Patients’ freedom to choose and change their PC physician
Option Vojvodina (N=549)
Central Serbia
(N=580)
Belgrade (N=526)
Total(N=1655)
Abs . % Abs . % Abs . % Abs . %
Patients assigned to their doctor• GP patients• Paed. patients
76
24
3115
89
2414
610
6235
58
Patients unable to change to another doctor• GP patients• Paed. patients
377
95
453
112
304
83
11214
93
Freedom to choose a doctor or to change from one to another does not seem to be an issue among respondents. Basically, it seems patients are well informed about their right to choose.
Table 55 . Patients’ experiences with information and cooperation, by region
Statements Vojvodina (N=549)
Central Serbia
(N=580)
Belgrade (N=526)
Total(N=1655)
Abs . % Abs . % Abs . % Abs . %
If I visit another doctor than my own, he/she has all the necessary informa-tion about me• GP patients• Paed. patients
18934
4826
18886
4652
12433
3326
501153
4336
When I am referred, my doctor informs the medical specialist about my illness• GP patients• Paed. patients
23739
6030
249101
6160
19340
5131
679180
5842
If I have been treated by a medical specialist, my doctor knows the results• GP patients• Paed. patients
38395
9276
369137
8982
33286
8667
1084318
9176
To see a specialist, I first need to visit my doctor for a referral• GP patients• Paed. patients
388125
9796
396162
9696
361118
9392
1145405
9595
My doctor and the practice nurse work well together• GP patients• Paed. patients
374105
9381
373145
9186
29998
7876
1046348
8782
Sometimes a nurse does the consulta-tion, making it unnecessary to see my doctor• GP patients• Paed. patients
15428
3922
12942
3225
8836
2328
371106
3225
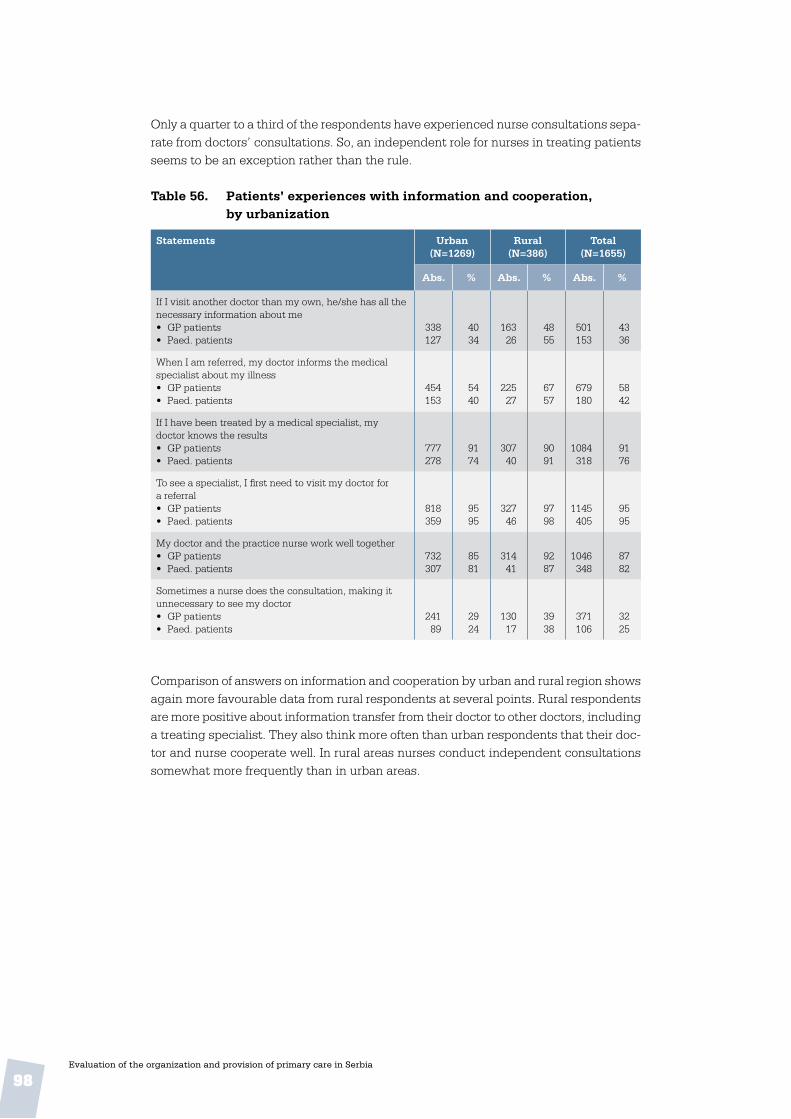
98Evaluation of the organization and provision of primary care in Serbia
Only a quarter to a third of the respondents have experienced nurse consultations sepa-rate from doctors’ consultations. So, an independent role for nurses in treating patients seems to be an exception rather than the rule.
Table 56 . Patients’ experiences with information and cooperation, by urbanization
Statements Urban (N=1269)
Rural (N=386)
Total (N=1655)
Abs . % Abs . % Abs . %
If I visit another doctor than my own, he/she has all the necessary information about me• GP patients• Paed. patients
338127
4034
16326
4855
501153
4336
When I am referred, my doctor informs the medical specialist about my illness• GP patients• Paed. patients
454153
5440
22527
6757
679180
5842
If I have been treated by a medical specialist, my doctor knows the results• GP patients• Paed. patients
777278
9174
30740
9091
1084318
9176
To see a specialist, I first need to visit my doctor for a referral• GP patients• Paed. patients
818359
9595
32746
9798
1145405
9595
My doctor and the practice nurse work well together• GP patients• Paed. patients
732307
8581
31441
9287
1046348
8782
Sometimes a nurse does the consultation, making it unnecessary to see my doctor• GP patients• Paed. patients
24189
2924
13017
3938
371106
3225
Comparison of answers on information and cooperation by urban and rural region shows again more favourable data from rural respondents at several points. Rural respondents are more positive about information transfer from their doctor to other doctors, including a treating specialist. They also think more often than urban respondents that their doc-tor and nurse cooperate well. In rural areas nurses conduct independent consultations somewhat more frequently than in urban areas.

99Evaluation of the organization and provision of primary care in Serbia
6. conclusion
6 .1 Summary of findings
The table below provides an overview of the results and conclusions, structured according to the health system functions, selected dimensions and proxy indicators, as outlined in the Primary Care Evaluation Scheme in Chapter 1.
Table 57 . Summary of findings
Dimension Information items
Selected proxies / findings
Background to findings Source
Stewardship
Policy develop-ment
Primary care as priority area
• Specific legislation developed concerning PC (PC): Yes
• Ministry of Health department specifically dealing with PC: No
From 2002, several important policy documents related to PC have been issued. The policy “Better health for all in the third millennium” prioritized preven-tion and primary health care as the basis and point of entry of the health system.This division of responsibilities for PC at the Ministry was established in 2008. By 2010, CHCs should have been separated from second-ary care facilities.
National level survey
Regional variation
There is an ongoing process of decentralization of priorities and provision to municipalities. Municipal ability to develop health policy will largely depend on the economic development. Despite the existence of general regulation, regional differences in PC are likely to increase.
National level survey
Conditions for the care process
Recent PC policy devel-op-ments
• Primary-secondary care split
• New capitation pay-ment system with performance indicators
• Health promotion centres
• Implementation of hu-man resource plans
• Licensing scheme for health care workers from 1 January 2010
• Voluntary accredita-tion of CHCs
• The chosen doctor is a largely but not fully implemented reform by which each citizen chooses his or her doc-tor of first contact.
National level survey
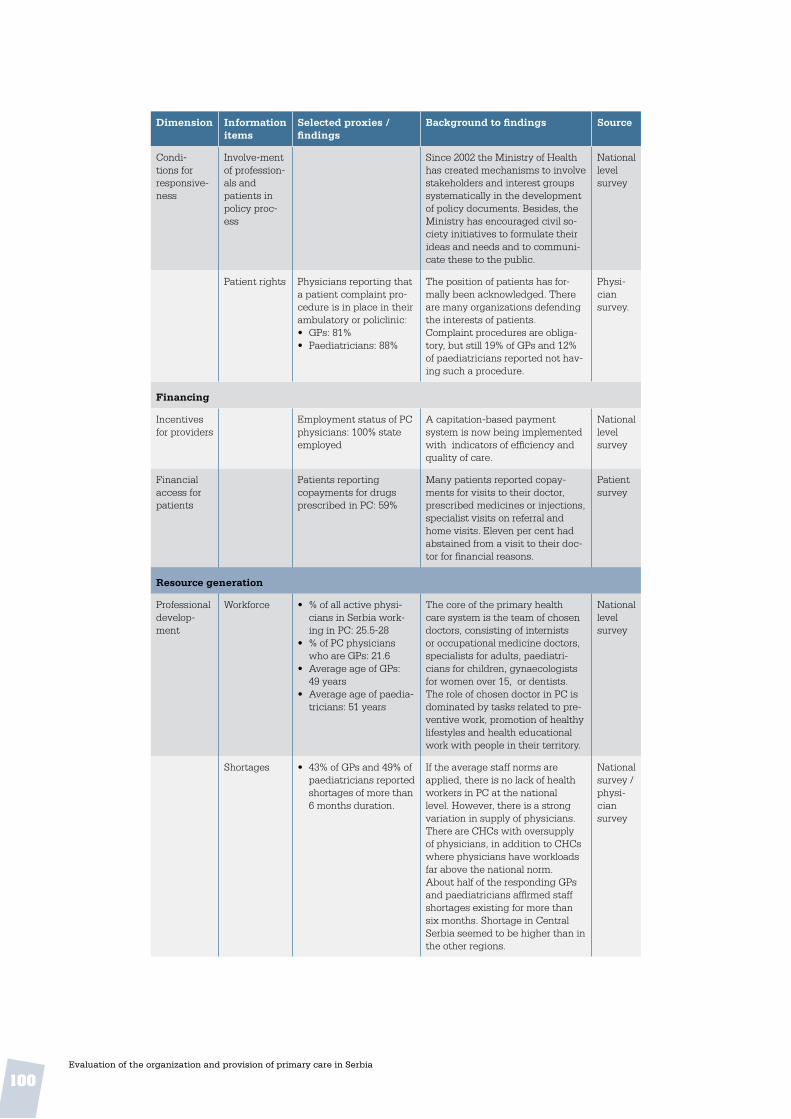
100Evaluation of the organization and provision of primary care in Serbia
Dimension Information items
Selected proxies / findings
Background to findings Source
Condi-tions for responsive-ness
Involve-ment of profession-als and patients in policy proc-ess
Since 2002 the Ministry of Health has created mechanisms to involve stakeholders and interest groups systematically in the development of policy documents. Besides, the Ministry has encouraged civil so-ciety initiatives to formulate their ideas and needs and to communi-cate these to the public.
National level survey
Patient rights Physicians reporting that a patient complaint pro-cedure is in place in their ambulatory or policlinic:• GPs: 81%• Paediatricians: 88%
The position of patients has for-mally been acknowledged. There are many organizations defending the interests of patients.Complaint procedures are obliga-tory, but still 19% of GPs and 12% of paediatricians reported not hav-ing such a procedure.
Physi-cian survey.
Financing
Incentives for providers
Employment status of PC physicians: 100% state employed
A capitation-based payment system is now being implemented with indicators of efficiency and quality of care.
National level survey
Financial access for patients
Patients reporting copayments for drugs prescribed in PC: 59%
Many patients reported copay-ments for visits to their doctor, prescribed medicines or injections, specialist visits on referral and home visits. Eleven per cent had abstained from a visit to their doc-tor for financial reasons.
Patientsurvey
Resource generation
Professional develop-ment
Workforce • % of all active physi-cians in Serbia work-ing in PC: 25.5-28
• % of PC physicians who are GPs: 21.6
• Average age of GPs: 49 years
• Average age of paedia-tricians: 51 years
The core of the primary health care system is the team of chosen doctors, consisting of internists or occupational medicine doctors, specialists for adults, paediatri-cians for children, gynaecologists for women over 15, or dentists.The role of chosen doctor in PC is dominated by tasks related to pre-ventive work, promotion of healthy lifestyles and health educational work with people in their territory.
National level survey
Shortages • 43% of GPs and 49% of paediatricians reported shortages of more than 6 months duration.
If the average staff norms are applied, there is no lack of health workers in PC at the national level. However, there is a strong variation in supply of physicians. There are CHCs with oversupply of physicians, in addition to CHCs where physicians have workloads far above the national norm.About half of the responding GPs and paediatricians affirmed staff shortages existing for more than six months. Shortage in Central Serbia seemed to be higher than in the other regions.
National survey / physi-cian survey

101Evaluation of the organization and provision of primary care in Serbia
Dimension Information items
Selected proxies / findings
Background to findings Source
Quality improvement mechanisms
• Number of hours GPs or paediatricians report spending on profes-sional reading, etc. per month: » GPs: 17.5 hours » Paed.: 15.9 hours
• Physicians reporting that they frequently use clinical guidelines: » GPs: 61% » Paed: 41%
The licensing scheme for medical professionals was restructured in 2009.Formal licensing requirements exist for physicians, chosen doc-tors and nurses. Accreditation for CHCs is not obligatory.Relicensing of physicians depends on having collected a minimum number of points for accredited activities of CME.The quality of (primary) health care services in Serbia is extensively monitored at various levels with use of many clinical and other indicators.Most generally used are internal control measures within the CHC, practice inspection by supervi-sors and external clinical auditing. Obligatory periodic tests of knowl-edge and skills of physicians and nurses are rarely or never used.Doctors are not obliged to follow guidelines; rather their use is rec-ommended. No national guidelines for nurses have been developed.
National level survey/ physi-cian survey
Human resources planning
Recent human resource plans aim to achieve a more rational distribu-tion of staff in line with the official norms and standards. This activity will be further rolled out in the coming years.
National level survey
Organization of profession-als
• 4 out of 5 medical universities in Serbia offer a postgraduate programme in general medicine / GP
Family Medicine has not been recognized as a medical specialty. The number of professors of GP strongly varies among the medical faculties. In the academic year 2007/2008 10.5% of medical gradu-ates chose to enroll in a postgradu-ate programme in GP, which is far below the 21% of all Serbian doc-tors who are working as PC GPs.GPs, paediatricians and gynae-cologists are organized in several sections and societies involved in professional development, medical education and scientific activities.
National level survey

102Evaluation of the organization and provision of primary care in Serbia
Dimension Information items
Selected proxies / findings
Background to findings Source
Medical equipment
• Physicians with a computer available in the practice: » GPs: 61% » Paed: 57%
• Number of items of medical equipment re-ported to be available to physicians (from a list of 30 items): » GPs: 13 items (=
43%) » Paed.: 16 items
(=53%)• 56% of GPs’ patients
and 57% of paediatri-cians’ patients found equipment was insuf-ficient
• Waiting time for lab results: » GPs: 3.9 days » Paed: 1.5 days
• Waiting time for X-ray results: » GPs: 7.4 days » Paed: 1.3 days
A substantial proportion of physi-cians are not using a computer, but in most practices other staff do so, primarily to store patient data. It seems that computerized patient information is used for other purposes than for the physicians’ clinical work.The results suggest that the equipment that physicians, and in particular GPs, have at their disposal is not compatible with a comprehensive package of preven-tive, curative and rehabilitative PC tasks.The sharp contrast between the regions in the availability of several items points to opportunities for improvement.X-ray and laboratory facilities were fully available by a large majority of respondents.Waiting times until results of these diagnostics are available strongly varied between regions and were generally much longer for GPs than for paediatricians. In Central Ser-bia GPs had to wait much longer for lab results than elsewhere. In Vojvodina GPs had to wait much longer for X ray results than in the other regions.
Physi-cian/patientsurvey
Delivery of care
Accessibility
Geographi-cal access
• Patients reporting up to 20 minutes travel to GP or paediatrician: 73%
Patients could generally easily reach the PC practice by public transport. The majority of patients reported travel times of less than 20 minutes to reach their preferred PC doctor, pharmacist or dentist. Hospitals were generally further away from home, resulting in travel times of more than 40 minutes for the majority of patients.
Patientsurvey
Organiza-tional ac-cess
Practice population
• Reported number of patients per GP: 1197 patients
• Reported number of patients per paed.: 975 patients
The average number of patients that GPs reported to be registered with them was well below the national norm of 1600. The average number of children reported by paediatricians seemed to be closer to the national norm. Paediatri-cians in Central Serbia reported the lowest number (845), followed by those in the Belgrade region (916) and Vojvodina (1171).
Physi-ciansurvey
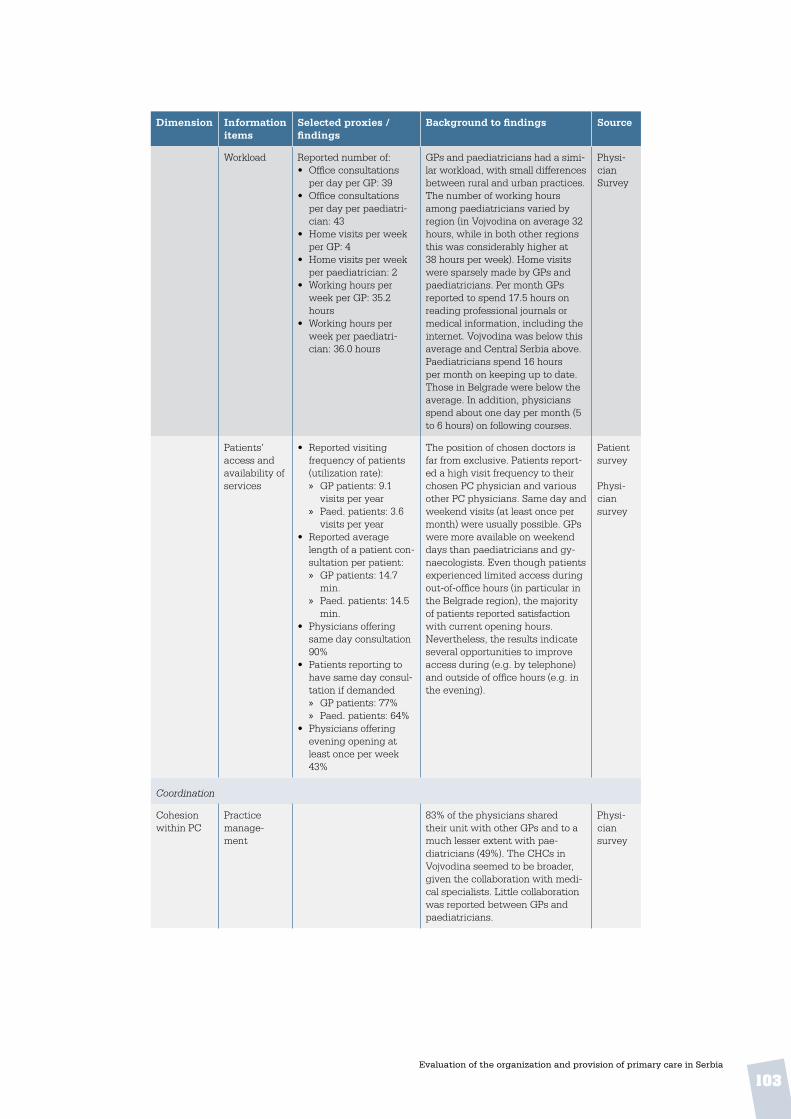
103Evaluation of the organization and provision of primary care in Serbia
Dimension Information items
Selected proxies / findings
Background to findings Source
Workload Reported number of:• Office consultations
per day per GP: 39• Office consultations
per day per paediatri-cian: 43
• Home visits per week per GP: 4
• Home visits per week per paediatrician: 2
• Working hours per week per GP: 35.2 hours
• Working hours per week per paediatri-cian: 36.0 hours
GPs and paediatricians had a simi-lar workload, with small differences between rural and urban practices. The number of working hours among paediatricians varied by region (in Vojvodina on average 32 hours, while in both other regions this was considerably higher at 38 hours per week). Home visits were sparsely made by GPs and paediatricians. Per month GPs reported to spend 17.5 hours on reading professional journals or medical information, including the internet. Vojvodina was below this average and Central Serbia above. Paediatricians spend 16 hours per month on keeping up to date. Those in Belgrade were below the average. In addition, physicians spend about one day per month (5 to 6 hours) on following courses.
Physi-cian Survey
Patients’ access and availability of services
• Reported visiting frequency of patients (utilization rate): » GP patients: 9.1
visits per year » Paed. patients: 3.6
visits per year• Reported average
length of a patient con-sultation per patient: » GP patients: 14.7
min. » Paed. patients: 14.5
min.• Physicians offering
same day consultation 90%
• Patients reporting to have same day consul-tation if demanded » GP patients: 77% » Paed. patients: 64%
• Physicians offering evening opening at least once per week 43%
The position of chosen doctors is far from exclusive. Patients report-ed a high visit frequency to their chosen PC physician and various other PC physicians. Same day and weekend visits (at least once per month) were usually possible. GPs were more available on weekend days than paediatricians and gy-naecologists. Even though patients experienced limited access during out-of-office hours (in particular in the Belgrade region), the majority of patients reported satisfaction with current opening hours.Nevertheless, the results indicate several opportunities to improve access during (e.g. by telephone) and outside of office hours (e.g. in the evening).
Patient survey
Physi-cian survey
Coordination
Cohesion within PC
Practice manage-ment
83% of the physicians shared their unit with other GPs and to a much lesser extent with pae-diatricians (49%). The CHCs in Vojvodina seemed to be broader, given the collaboration with medi-cal specialists. Little collaboration was reported between GPs and paediatricians.
Physi-cian survey

104Evaluation of the organization and provision of primary care in Serbia
Dimension Information items
Selected proxies / findings
Background to findings Source
Collabora-tion
• Physicians reporting working with other PC physician(s) in same premises: 51%
• Physicians reporting to have regular face-to-face meetings with: » Family nurses:
GPs: 15%; Paed: 11% » Midwifes: GPs: 19%;
Paed: 7% » Pharmacists:
GPs: 1%; Paed: -
Shared practices with other GPs, paediatricians, dentists, practice and community nurses and labora-tory technicians were normal.There appeared to be a low level of structured cooperation and team-work, both within PC and between the primary and secondary care levels. Organized exchange of in-formation between chosen doctors seemed to be not well developed and most doctors had no regular meeting with nurses. There were very few signs of structured coop-eration between medical doctors across levels of care.
Physi-cian survey
Patient survey
Coordina-tion with other care levels
Referral system
• Number of referrals to medical specialists in 4 weeks time: 82 » rural: 85 » urban: 81
• Referral rate (% of all office and home care contacts) » GPs: 12.4% » Paed: 4.7% » Rural: 10.3% » Urban: 9.9%
• Number of hospital admissions ordered by PC physicians per 1000 patient contacts: 135
• Number of pharmaceu-tical prescriptions by PC physicians per 1000 patient contacts: 1566
More than 80% of patients in all 3 regions reported they would first visit their GP or paediatrician with a new health problem before seek-ing specialist care.Physicians, in particular GPs, reported very high referral rates.By far the most referrals were made to internists, neurologists, surgeons, ophthalmologists and ENT specialists.The average referral rate (referrals as a percentage of all patient con-tacts in the office and during home visits) of GPs (12.4%) was more than 2.5 times higher than that of paediatricians (4.7%).Central Serbian GPs reported 1.4 times more referrals than in Vojvo-dina and the Belgrade region.
National level survey
Physi-ciansurvey
Patient survey
Collabora-tion with secondary level
Contacts between PC physicians and medical specialists were mainly on a case basis. Most GPs indicated sometimes seeking the advice of an internist, surgeon, neurologist, dermatologist, ENT specialist or ophthalmologist. In contrast to GPs, most paediatri-cians asked advice from secondary level paediatricians and few from internists.
Physi-cian survey

105Evaluation of the organization and provision of primary care in Serbia
Dimension Information items
Selected proxies / findings
Background to findings Source
Continuity
Informatio-nal continu-ity
• Physicians reporting that they keep medical records of all patient contacts on a routine basis: -GPs: 92% » Paediatricians: 96%
• Physicians reporting to routinely use referral letters: » GPs: 92% » Paediatricians: 99%
Even though keeping record of all clinical information of patients was daily routine for almost all physicians in the three regions, the conditions for clinical information could be improved. Physicians had difficulties retrieving informa-tion, for instance for preventive monitoring. This limits efficient outreach activities. Paediatricians in Vojvodina reported more favour-ably in this respect than those in both other regions.Almost all respondents indicated using referral letters. Use of computers strongly differed among regions. In Belgrade not using a computer was exceptional, while in Central Serbia it was more or less the rule. Computers were mainly used for writing prescrip-tions and keeping clinical records, and to a lesser extent for writing referral letters. The results sug-gested a lack of Internet access.
Physi-cian Survey
Patient survey
Longitudi-nal continu-ity
• Patients reporting hav-ing been with their GP for at least 1 year: 78%
• Patients reporting having been with their paediatrician for at least 1 year: 75%
• Patients reporting they did not choose their GP but were assigned: 5%
• Patients reporting they did not choose their paediatrician but were assigned: 8%
A large majority of the patients of both GPs and paediatricians have been registered with their current doctor for more than one year. In Belgrade, a larger proportion of respondents indicated that they had been with the current doctor for more than three years than did those in the other two regions.Only very few respondents reported having been assigned to their current doctor and, similarly, very few indicated they could not change to another.
Patient survey
Interperso-nal continu-ity
• 39% of the patients have been with their GP for more than three years
• 34% of the patients have been with their paediatrician for more than three years
About two thirds of patients would generally see their own doctor each visit. Consultations took on average 15 minutes in all regions.In general, patients were some-what more positive about the qualifications of GPs than of their paediatricians. Rural patients were more positive about their doctor than urban patients.Personal skills of doctors were well appreciated. Most patients thought that their doctor knew their personal situation. Patients were not sure if their doctor would be the right person for discuss-ing non-medical problems that impacted on health. Furthermore, patients were reserved about their doctor’s preparedness to make home visits.
Patient survey

106Evaluation of the organization and provision of primary care in Serbia
Dimension Information items
Selected proxies / findings
Background to findings Source
Comprehensiveness
Practice conditions
Conven-ience
• 48% of patients re-ported that the centre was well accessible for disabled and people in wheelchairs.
Wheelchair access to PC centres was reported to be problem-atic, particularly in Vojvodina and Belgrade. The majority of patients were satisfied with the conven-ience of the waiting rooms and the prompt and friendly treatment at the reception desk.
Patient survey
Information materials
Information materials reported to be available in the waiting room on various topics.Highest:• healthy diet: 84%• smoking cessation:
78%• CVD risks: 76%Lowest:• social services: 22%• contraception: 24%
The availability of information ma-terials, such as leaflets or posters, made available in the waiting room of CHCs or ambulatories could be improved.
Physi-cian survey
Services delivery
Popula-tion groups served
• Consolidated score for the GP as doctor of first contact (based on 18 items; range of score 1-4): 2.06
• Same for paediatrician: 1.73
The position of paediatricians in the first contact was more clear-cut than that of GPs. The results sug-gest that GPs lack a clear clinical domain in the first contact. The summary score of 2.06 is very low compared to GPs in other countries.GPs in Vojvodina have a more comprehensive role in the first contact than GPs in both other regions.Paediatricians in urban and rural practice have identical roles in the first contact with health problems. GPs in urban CHCs, however, see a wider spectrum of health problems in the first contact than their rural colleagues.
Physi-cian survey
Involvement of PC physi-cians in the treatment of diseases
• Consolidated score for the provision of treatment of diseases by GPs (based on 20 items; range of score 1- 4):3.00
• Same for paediatri-cians: 2.18
The treatment profile of GPs seemed to be clearer than the first contact profile. GPs reported more involvement in the treatment of patients with the listed diagnoses than paediatricians.Compared to their colleagues in Belgrade, paediatricians in Central Serbia and Vojvodina were more involved in the treatment of pa-tients with the listed diagnoses.GPs in Vojvodina had a somewhat broader treatment profile than GPs in both other regions.The involvement in treatment tasks was not related to working in a city or in the countryside.
Physi-cian survey

107Evaluation of the organization and provision of primary care in Serbia
Dimension Information items
Selected proxies / findings
Background to findings Source
Provision of preventive and medical technical pro-cedures
• Consolidated score for the provision of medical procedures and prevention by GPs (based on 16 items; range of score 1-4): 1.52
• Same for paediatri-cians: 1.41
• Coverage of public health activities (based on 12 items = 100%) by GPs on a routine basis: 32%
• Same for paediatri-cians: 32%
• Involvement in cervical cancer screening pro-gramme GPs: 16 %
GPs and paediatricians were prac-tically not involved in preventive and medical technical procedures, but in the procedures where they were involved they were both involved. These procedures were: immunization for flu or tetanus, intravenous infusion, allergy vacci-nation, ankle strapping and wound suturing.The overall percentage of involve-ment for GPs as well as paediatri-cians in several screening pro-grammes was 32%, which leaves significant room for improvement.
Physi-cian survey
Patient survey
Provision of mother / reproductive and child health care
• GPs providing routine antenatal care: 14%
• Paediatricians provid-ing routine antenatal care: 42%
GPs were rarely involved in the provision of mother and child health services. Paediatricians mostly provided child immuni-zations and routine paediatric surveillance. A minority of pae-diatricians were involved in the provision of routine antenatal care, family planning and contraception care.In general, rural physicians were more involved in mother and child health services than urban physi-cians
Physi-cian survey
Perceived quality of prescribing
Patients estimated to receive medically unnec-essary prescriptions:• GPs: 6.7%• Paediatr: 4.6%
Physi-cian survey
Perceived balance between curative and preventive work
Satisfied with current balance:• GPs: 26%• Paediatr: 38%
Would like to spend more time on prevention and health promotion:• GPs: 64%• Paediatr: 61%
Physi-cian survey
Community orientation
• Physicians reporting regular meetings with local authorities: 22%
There were very few reported structured connections with the community.
Physi-cian Survey

108Evaluation of the organization and provision of primary care in Serbia
annex 1. glossary of pc terms
Accessibility: the patients’ ability to receive care where and when it is needed, given possible physical, financial or psychological barriers (10).
Comprehensiveness: the extent to which services provided comprise curative, reha-bilitative and supportive care, as well as health promotion and disease prevention (16).
Confidentiality: the right to determine who has access to one’s personal health in-formation (1).
Continuity: the ability of relevant services to offer interventions that are either coher-ent over the short term both within and among teams (cross-sectional continuity), or are an uninterrupted series of contacts over the long term (longitudinal continuity) (10).
Coordination: a service characteristic resulting in coherent treatment plans for individual patients. Each plan should have clear goals and necessary and effective interventions, no more and no less. Cross-sectional coordination means the coordination of information and services within an episode of care. Longitudinal coordination means the interlinkage among staff members and agencies over a longer period of treatment (10).
CHC: a comprehensive PC facility, usually including a number of (rural) health posts.
Financing: function of a health system concerned with the mobilization, accumula-tion and allocation of money to cover the health needs of the people, individually and collectively, in the health system (8).
Family medicine teams: Family medicine teams can vary from country to country. The core team usually encompasses the general practitioner and a nurse, but can con-sist of a multidisciplinary team of up to 30 professionals, including community nurses, midwifes, medical attendants, dentists, physiotherapists, social workers, psychiatrists, speech therapists, dieticians, pharmacists, administrative staff and managers (21). In 2003, WHO described a PC team as a group of “fellow professionals with complementary contributions to make in patient care [; t]his would be part of a broader social trend away from deference and hierarchy and towards mutual respect and shared responsibility and cooperation” (22). By definition, family medicine teams are patient-centred and therefore their composition and organizational model cannot but change over time; it is a flexible construct.
General practice: General practice is a term now often used loosely to cover the gen-eral practitioner and other personnel as well, and is therefore synonymous with PC and family medicine. Originally, it was meant to describe the model of the most significant single player in PC: the general practitioner or PC physician, while family medicine originally encompassed more the notion of a team approach. Whenever the notion of a solo practitioner (general practice) versus team-based approach (family medicine) is relevant, the distinction should be made. According to Atun (23), the specificity of the general practitioner is that he/she is “the only clinician who operates in the nine levels of care: prevention, pre-symptomatic detection of disease, early diagnosis, diagnosis of
109Evaluation of the organization and provision of primary care in Serbia
established disease, management of disease, management of disease complications, rehabilitation, palliative care and counselling”.
Performance (or composite goal performance): the extent to which the health system relates goal attainment to what could be achieved in the given context of the country (1).
Primary health care (PHC): This term should be used when it is intended to refer to the broad concept elaborated in the Declaration of Alma Ata (1978) with its principles of equity, participation, intersectoral action and appropriate technology and its central place in the health system (24).
Primary care (PC): is more than just the level of care or the gate-keeping – it is a key process in the health system. It is the first contact, accessible, continued, comprehensive and co-ordinated care. First contact care is accessible at the time of need. Ongoing care focuses on the long-term health of a person, rather the short duration of the disease. Comprehensive care is a range of services appropriate to the common problems in the respective population. Coordination is the role by which PC involves other specialists that the patient may need (23). Primary care is a subset of primary health care.
Primary Care Evaluation Tool (PCET): is an instrument developed for the WHO Re-gional Office for Europe to examine Member States’ health system functions and typical characteristics of PC delivery systems. The tool considers policy and regulation as well as supply- and-demand aspects. It is intended to support ministries of health and other stakeholders in monitoring the progress of their PC-related policies and reforms and to set new priorities on the basis of evidence-based information with the aim of further strengthening the PC level.
Proxy indicator: Indirect measure or sign that approximates or represents a phenom-enon in the absence of a direct measure or sign.
Resource generation: the provision of essential inputs to the health system, including human capital, physical capital and consumables (1).
Responsiveness: is a measure of how the system performs relative to non-health as-pects, meeting or not meeting a population’s expectations of how it should be treated by providers of prevention, care or non-personal services (not a measure of how the system responds to health needs, which shows up in health outcomes). Enhancing responsiveness to the expectations of the population, includes: respect for people (in-cluding dignity, confidentiality and autonomy in health decisions) and client orientation, including prompt attention, access to social support networks, quality of basic amenities and choice of provider) (1).
Stewardship: a function of a government responsible for the welfare of the population, and concerned with the trust and legitimacy with which its activities are viewed by the citizenry. It includes the overseeing and guiding of the working and the development of the nation’s health actions on the government’s behalf. The components of stewardship are: health policy formulation (defining the vision and direction for the health system), regulation (setting fair rules of the game with a level playing field) and intelligence (as-sessing performance and sharing information) (1,8).
110Evaluation of the organization and provision of primary care in Serbia
references
1. The World Health Report 2000: Health systems: improving performance. Ge-neva, World Health Organization, 2000 (http://www.who.int/whr/2000/en/whr00_en.pdf, accessed 8 September 2008).
2. WHO Regional Committee for Europe resolution EUR/RC55/R8 on Strengthen-ing health systems as a continuation of the WHO Regional Office for Europe’s Country Strategy “Matching services to new needs”. Copenhagen, WHO Regional Office for Europe, 2005 (http://www.euro.who.int/Governance/resolu-tions/2005/20050920_2, accessed 16 December 2008).
3. Murray C, Frenk J. World health report 2000: a step towards evidence-based health policy. Lancet, 2001, 357:1698–1700.
4. Atun RA et al. Introducing a complex health innovation; Primary health care reforms in Estonia (multimethods evaluation). Health Policy, 2006, 79:79-91 (http://www.praxis.ee/data/atun_et_al_phc_2006.pdf, accessed 10 December 2008).
5. Kelley E, Hurst J. Health care quality indicators project. Conceptual frame-work paper. Paris, Organization for Economic Cooperation and Development, 2006 (OECD Health Working papers no. 23) (http://www.oecd.org/datao-ecd/1/36/36262363.pdf, accessed 8 September 2008).
6. Sibthorpe, B. A proposed Conceptual Framework for Performance Assessment in Primary Health Care. A Tool for Policy and Practice. Canberra, Australian Primary Health Care Research Institute, 2004 (http://www.anu.edu.au/aphcri/Publications/conceptual_framework.pdf, accessed 10 December 2008).
7. Watson, DE et al. A results-based logic model for primary health care: laying an evidence-based foundation to guide performance measurement, monitoring and evaluation. Vancouver, Centre for Health Services and Policy Research, 2004.
8. Health Systems Performance: Glossary [web site]. Geneva, World Health Orga-nization, 2001 (http://www.who.int/health-systems-performance/docs/glossary.htm, accessed 8 September 2008).
9. Starfield, B. Primary Care. Balancing health needs, services and technology. New York, Oxford University Press, 1998.
10. Health Evidence Network. What are the arguments for community-based mental health care? Annex 2. Key principles for balanced community-based mental health services [web site]. Copenhagen, WHO Regional Office for Europe, 2004 (http://www.euro.who.int/HEN/Syntheses/mentalhealth/20030903_1, accessed 12 December 2008).
111Evaluation of the organization and provision of primary care in Serbia
11. Starfield B et al. Continuity and coordination in PC: their achievement and utility. Medical Care, 1976, 14:625–636.
12. Saultz JW. Defining and measuring interpersonal continuity of care. Annals of Family Medicine, 2003, 1:134–143 (http://www.annfammed.org/cgi/content/full/1/3/134, accessed 10 December 2008).
13. Reid R, Haggerty J, McKendry R. Defusing the confusion: Concepts and mea-sures of continuity of healthcare. Ottawa, Canadian Health Services Research Foundation, 2002 (http://www.chsrf.ca/funding_opportunities/commissioned_re-search/projects/pdf/defusing_e.pdf, accessed 10 December 2008).
14. Boerma WGW. Coordination and integration in European PC. In: Saltman RB, Rico A, Boerma WGW, eds. Primary Care in the Drivers Seat? Organizational reform in European PC. Maidenhead, Open University Press, 2006 (http://www.euro.who.int/Document/E87932_chapt1.pdf, accessed 8 September 2008).
15. Starfield B. Primary care and health. A cross-national comparison. Journal of the American Medical Association, 1991, 266:2268–2271.
16. Boerma WGW. Profiles of general practice in Europe. An international study of variation in the tasks of general practitioners. Utrecht, NIVEL, 2003 (http://www.nivel.nl/pdf/profiles-of-general-practice-in-europe.pdf, accessed 5 September 2008).
17. Boerma WGW, Fleming DM. The role of general practice in primary health care. Copenhagen, WHO Regional Office for Europe, 1998.
18. Meads G. Primary care in the twenty-first century – an international perspec-tive. Oxford, Radcliffe Publishing, 2006.
19. Atun R. What are the advantages and disadvantages of restructuring a health care system to be more focused on PC services? Copenhagen, WHO Regional Office for Europe, 2004 (Health Evidence Network report; http://www.euro.who.int/document/e82997.pdf, accessed 9 February 2007).
20. Primary Health Care: Report of the International Conference on Primary Health Care, Alma-Ata, USSR, September 6-12 1978. Geneva, World Health Organiza-tion, 1978.
21. Boerma WGW et al. Evaluation of the organization and provision of PC in Be-larus. A survey-based project in the regions of Minsk and Vitebsk. Copenhagen: WHO Regional Office for Europe, 2009.
22. Kringos DS et al. Evaluation of the Organizational model of PC in Turkey; a survey-based pilot project in two provinces of Turkey. Copenhagen, WHO Regional Office for Europe, 2008.

112Evaluation of the organization and provision of primary care in Serbia
23. Kringos DS et al. Evaluation of the Organizational model of PC in the Russian Federation; a survey-based pilot project in two districts in the Moscow Region. Copenhagen, WHO Regional Office for Europe, 2008.
24. Kringos DS et al. The breadth of PC: a systematic literature review of its core dimensions. London, BMC Health Services Research 2010, 10:65. http://www.biomedcentral.com/1472-6963/10/65


WH
OL
IS NU
MB
ER
: E00000 . O
rigin
al: En
glish WHO Regional Office for Europe
Scherfigsvej 8, DK-2100 Copenhagen Ø, DenmarkTel.:+45 39 17 17 17. Fax: +45 39 17 18 18
E-mail: [email protected]
summary
Although the strengthening of Primary Care (PC) services is a priority of health reforms in many countries of eastern, central and western Europe, backgrounds and reasons for reforms are not similar. In western Europe emphasis on PC reflects an approach to rising costs and changing de-mand as a result of demographic and epidemiological trends. Central and eastern European countries, as well as former Soviet Union coun-tries, are struggling to fundamentally improve the performance of their entire health systems. PC is now being reorganized in many countries as bringing adequate and responsive health services closer to the popula-tion.
In many countries in transition health reforms are part of profound and comprehensive changes of essential societal functions and values. PC reforms are not always based on evidence, and progress is often driv-en by political arguments or interests from specific professional groups rather than based on sound evaluations. However, policy makers and managers increasingly demand evidence about progress of reforms and responsiveness of services.
This report evaluates PC developments in Serbia based on a methodol-ogy that characterizes a good PC system as comprehensive, accessible, coordinated and integrated, that ensures continuity, and that recogniz-es that all health system functions outlined in the WHO Framework are taken equally into consideration to improve the overall health system: financing, service delivery, human and other resources such as appro-priate facilities, equipment and drugs, necessary legal frameworks and regulations and proper direction of the system. It thus offers interested policy-makers and stakeholders a structured overview of the strengths and weaknesses of a country’s organization of PC services, including the voices of the professionals and patients concerned.
evaluat
ion of t
he or
ganiz
ation
and
provision
of prim
ary car
e in ser
bia