EVALUATION OF THE BUMPER STANDARD
260
3-4 ( NHTSA TECHNICAL REPORT DOT HS-805 866 EVALUATION OF THE BUMPER STANDARD APRIL 1981 Prepared by: U.S. DEPARTMENT OF TRANSPORTATION National Highway Traffic Safety Administration Plans & Programs Office of Program Evaluation
Transcript of EVALUATION OF THE BUMPER STANDARD

3-4(
NHTSA TECHNICAL REPORTDOT HS-805 866
EVALUATION OFTHE BUMPER STANDARD
APRIL 1981
Prepared by:
U.S. DEPARTMENT OF TRANSPORTATIONNational Highway Traffic Safety AdministrationPlans & ProgramsOffice of Program Evaluation

NHTSA Technical ReportDOT-HS-805-866
E R R A T A
Page Change
3-2 Add to the first paragraph ofSection 1.2.2 the word "damage".
3-34 After the text and before
footnote 18, add the following:
3.1.6 Sample Size and Survey Assumptions
The first question to be answered in determining
sample size is what will the data be used for.
Basically, the survey data will be used to
detect any difference in
3-42 Delete list of manufacturers and list of bumpertype which are duplicated on page 3-43
6-26 Change "G" to "g" for the 1979 price of gas(third item)
Change 1980 to 1988 on next to last line of page.

Technical Report Documentation Page
1. Report No.
DOT-HS-805 866
2. Government Accession No. 3. Recipient's Catalog No.
4. Title and Subtitle
EVALUATION OF THE BUMPER STANDARD5. Report Dots
April 19816, Performing Organization Code
NPP-1O
7. Author's)
Warren G. LaHeist and Katharine D. Ichter
8. Performing Organization Report No.
9. Performing Organization Name and Address
Office of Program EvaluationNational Highway Traffic Safety Administration400 Seventh Street, S.W.Washington, D.C. 20590
10. Work Unit No. (TRAIS)
11. Contract or Grant No.
12. Sponsoring Agency Name and Address
U.S. Department of TransportationNational Highway Traffic Safety Administration400 Seventh Street, S.W.Washington, D.C.
13. Type of Report and Period Covered
NHTSA Technical Report
14. Sponsoring Agency Code
IS. Supplementary Notes
16. Abstract The objectives of theoumper standards are to reduce damage and providecost savings to consumers, and to protect safety-related parts. The evaluation,presented in this report, includes: (1) determining the effectiveness of thebumper standard by comparing the amounts of crash damage to passenger cars thatwere not required to comply with the standard (1972 and earlier model years) withthe damage sustained by vehicles that had to comply; (2) measuring changes inactual costs of bumper systems to meet the standards; and (3) assessing the costeffectiveness of post-standard bumper systems in terms of net benefits or losses.The evaluation is based on statistical analyses of both 65,000 property damageinsurance claims and data from a national survey of 10,223 households having •14,902 cars. The costs of meeting the bumper standards are based on teardownstudies of 94 bumper systems representing 1972 (pre-standard) through 1980 makesand model passenger cars. It was found that:
o Front bumpers have tended to be cost effective since bumper standards werefirst met in 1973 model cars.
o Rear bumper systems are not and have never been cost effective since thepromulgation of the standards.
17. Key Words
Bumper Standard; Exterior Protection;Federal Motor Vehicle Safety Standard215; Part 581; Title I-MVICS;Evaluation; Statistical Analysis;Cost Effectiveness
IS. Distribution StotementDocument is available to the Publicthrough the National TechnicalInformation Service, Springfield,Virginia 22161
19. Security Clastif. (of this report)
Unclassified
30, Security Clossif. (of this page)
Unclassified
21' No. of Pogns
260
22. Price
Form DOT F 1700.7 (8-72) Reproduction of completed page authorized
1

METRIC CONVERSION FACTORS
Approximate Conversions to Metric Measures
Sym.o! Wiia Vw Know Mvttitly «r Tt flni Srmkel
LENGTH
inft
1*mi
in1
f t 1
* < !mi1
oxIb
i»P
TbspII OIc
pt
Vsalf t 1
ytf1
" F
inchesfeetyardsmilts
square inchessquare leelsquare yardssquare miltsacrtt
1
ouncespoundsshort tons
(2000 Ib)
toaipoonstablespoonsfluid ouncescupspintsquartsgallonscubic feetcubic yards
•2.S300.914
AREA
c.t0.09O.S2.60.4
MASS (weight)
2S0.450.9
VOLUME
EIS300.240.470.953.S0.030.76
TEMPERATURE (exact)
Fahrenheittomporature
5/9 (aftersubtracting.321
centimeterscentimetersmewskilometers
square centimeterssquare meterssquare m i e nsquare kilometershectares
gramskilogramstonnes
millililersmillilittnmiltilitorslitersliterslitersliterscubic meterscubic meters
Celsiustemperature
cmcmmkm
cm2
m 2
m1
km2
to
9kgt
ml
ml
mlI1|
1m '
m3
* C
Approximate Conversions fram Metric Measures
Symbol Wins Tst Knew Miltifty kT T« fat
LEN6TH
Srmbcf
a
"a
UMI':. '•* * i . SO C.il.il..,! Nu. CI3.1»:r«G.l.Jili i , sou MIS Misc. Puht. 2SC.
_ —_ e
cmm
mkm
cm2
m 2
km2
ha
9kgt
ml11Im 1
m*
•c
- 4 0
- 4 0•C
millimeterscentimetersmetersmeterskilometers
square centimeterssquare meterssquare kilometershectaras 110.000 m2|
0.040.43 J1.1OS
AREA
0.1S1.20.42.S
MASS (weight}
gramskilogramstonnes (1000 kg)
millilitersliterslitersliterscubic meterscubic meters
0.03S2.21.1
VOLUME
0.032.11.0S0.2S
IS1.3
TEMPERATURE (exact)
Celsiustemporature
32O | 4 O
I ! I 1 1-to o
* /5 ( thmadd 32)
• r cao I i2o
tO |4O COST
inchesinchesfeetyardsmiles
square indiessquare yardssquare milesacres
ouncespoundsshort tow
fruit) ouncespintsquartsgallonscubic issscubic yards
Fahrenheittemperature
•ftxt
ISO 200 t
•' SO ' UKC
inin( t
Y«mi
ia»
t - 2
mr2
uIb
II ozpt
qt
gal
•r

TABLE OF CONTENTS
ACKNOWLEDGEMENTS xi i i
EXECUTIVE SUMMARY xiv
I. LOW-SPEED COLLISIONS AND THE BUMPER STANDARD 1-1
1.0 AGENCY MISSION AND AUTHORITY 1-1
1.1 Introduction 1-1
1.2 Need to Evaluate Existing Regulations..., 1-2
2.0 HISTORY OF THE STANDARD 1-3
2.1 Historical Highlights 1-3
2.2 Development of the Bumper Standard 1-5
2.3 Complying with the Bumper Standard 1-82.3.1 Energy Absorbers 1-11
2.3.2 Face Bars and Reinforcements 1-11
3.0 EVALUATION OBJECTIVES 1-13
3.1 Introduction 1-13
3.2 Low-Speed Coll is ions 1-13
3.3 Bumper Standard Effectiveness 1-153.3.1 Damage Frequency 1-153.3.2 Extent of Damage 1-163.3.3 Effect of Over and Underride 1-16
3.4 Bumper Standard Costs 1-174.0 ORGANIZATION OF REPORT 1-17
II. FINDINGS AND CONCLUSIONS 2-1
1.0 DATA SOURCES 2-1
111
2.0 LOW-SPEED COLLISIONS 2-1
3.0 BUMPER EFFECTIVENESS 2-2
3.1 Summary of Effectiveness Findings 2-3Damage Frequency 2-3Damage Repair Cost-Unreported Collisions 2-4Damage Repair Cost-Collisions for which InsuranceClaims were Filed 2-5Effectiveness of Bumper Height Requirements 2-11
4.0 BUMPER COSTS 2-11
4.1 Summary of Bumper Cost Findings 2-12
5.0 NET BENEFITS 2-14
5.1 Summary of Findings Related to Net Benefits 2-14
5.2 Additional Factors Affecting Net Benefits 2-18
6.0 CONCLUSIONS 2-19
III. COLLECTING CRASH DAMAGE DATA 3-1
1.0 Establishing Data Requirements 3-1
1.1 Introduction 3-1
1.2 Measures of Effectiveness 3-11.2.1 Frequency of Damage 3-21.2.2 Extent Damage 3-21.2.3 Bumper Override and Underride 3-3
1.3 Low-Speed Collisions 3-4
1.4 Required Data 3-6
2.0 DATA SOURCES 3-8
2.1 Int roduct i on 3-82.1.1 Police Accident Reports 3-92.1.2 State Accident Records 3-102.1.3 National Accident Records 3-122.1.4 Repair Shop Records 3-132.1.5 Auto Parts Sales and Inventory Records 3-142.1.6 Towaway Service Records 3-152.1.7 Inspection of Automobiles in Parking Lots 3-152.1.8 Insurance Claims File 3-162.1.9 Surveys of Automobile Drivers 3-20
IV

2.2 Selection of Data Sources 3-23
3.0 DATA SOURCES USED IN STUDY 3-25
3.1 Driver Survey 3-253.1.1 Survey Overview 3-273.1.2 Survey Design 3-283.1.3 Representativeness of Sample 3-303.1.4 Eligible Incidents 3-333.1.5 Incident Rates 3-343.1.6 Sample Size and Survey Assumptions 3-36
3.2 Description of Insurance Claim Analysis 3-373.2.1 Measures of Effectiveness 3-373.2.2 Types of Insurance Coverage 3-383.2.3 Sources of Insurance Data 3-393.2.4 Description of State Farm Files 3-403.2.5 Stratification of the Data Base 3-41
4.0 USE OF THE DATA 3-43
IV. BUMPER STANDARD EFFECTIVENESS 4-1
1.0 INTRODUCTION 4-1
2.0 DAMAGE FREQUENCY IN UNREPORTED, LOW-SPEED COLLISIONS 4-4
2.1 Damage Frequency by Vehicle Model Year Group 4-4
2.2 Damage Frequency by End of Car Struck 4-72.2.1 Front End Damage Frequency 4-72.2.2. Rear End Damage Frequency 4-72.2.3 Comparing Front End to Rear End Damage Frequency 4-11
2.3 Analysis of Confounding Variables 4-12
2.4 Damage Frequency Evaluation Summary 4-15
3.0 EXTENT OF DAMAGE IN LOW-SPEED COLLISIONS 4-16
3.1 Introduction 4-16
3.2 The Number of Parts Damaged in Unreported, Low-SpeedCollisions 4-173.2.1 Parts Studied 4-173.2.2 Distribution of the Number of Damaged Parts in
Unreported, Low-Speed Collisions 4-18
3.3 Damaged Parts in Collisions for Which an Insurance ClaimWas Filed 4-20
3.4. Comparison of Repaired vs. Replaced Bumpers in InsuranceCl aims 4-22
3.5 Degree of Damage to Parts—Unreported, Low-Speed Collisions....4-253.5.1 Defining Damage Severity 4-253.5.2 Degree of Damage to Front End and Rear End Parts 4-26
3.6 Cost to Repair Damage 4-293.6.1 Average Repair Cost for Damage in Unreported, Low-
Speed Col 1 isions 4-293.6.2 Average Repair Cost of Damage Based on Insurance
Cl aims 4-323.6.3 Analysis of the Effect of Vehicle Make on Insurance-
Claimed Repair Costs 4-353.6.4 Analysis of the Effect of Bumper Materials on
Insurance-Claimed Repair Costs 4-37
3.7 Analysis of the Number of Insurance Claims per InsuredVehicle 4-393.7.1 Scope of Analysis 4-393.7.2 Comparison of Property Damage Claims 4-403.7.3 Comparison of Bumper Vs. Non-Bumper Collision
and Liability Claims 4-423.7.4 Comparison of the Number of Insurance Claims Involving
Bumper by Vehicle Size and End of Car Struck 4-453.7.5 Analysis of the Effect of Vehicle Use on the Number
of Insurance Claims Involving the Bumper 4-473.7.6 The Effect of Vehicle Age on the Percentage of Insurance
Claims Involving the Bumper 4-49
3.8 Extent of Damage-Evaluation Summary 4-53
4.0 BUMPER MISMATCH IN UNREPORTED, LOW-SPEED COLLISIONS 4-57
4.1 Definition and Data Source 4-57
4.2 Comparison of Bumper Mismatch 4-57
4.3 Comparison of Bumper Contact Configuration and DamageFrequency 4-59
4.4 The Effect of Bumper Height Requirements on DamageRepair Costs. 4-60
4.5 Bumper Mismatch Evaluation Summary 4-63

V. ACTUAL COST OF THE BUMPER STANDARDS ....5-1
1.0 INTRODUCTION 5-1
2.0 METHOD FOR DETERMINING THE ACTUAL COST OF BUMPER SYSTEMS 5-3
2.1 Consumer Cost Elements 5-3
2.2 Bumper Systems Studied—Selection Criteria 5-6
2.3 Method for Estimating Lifetime Fuel Cost 5-7
2.4 Secondary Weight Consideration 5-9
3.0 INCREMENTAL CONSUMER COSTS OF THE BUMPER STANDARD 5-10
3.1 Derivation of Representatives Weights and Costs 5-10
3.2 Incremental Consumer Cost 5-12
4.0 ADDED LIFETIME FUEL COST 5-19
4.1 Incremental Bumper System Weight 5-19
4.2 Added Lifetime Fuel Cost 5-21
5.0 TOTAL INCREMENTAL BUMPER COST 5-21
VI. BUMPER STANDARD-BENEFITS AND COSTS 6-1
1.0 INTRODUCTION 6-1
1.1 Comparing Benefits and Costs 6-1
1.2 Selection of an Effectiveness Measure 6-2
1.3 Contents of the Chapter 6-4
2.0 DESCRIPTION OF FACTORS INVOLVED IN THE CALCULATION OF
LIFETIME BENEFITS AND COSTS 6-4
2.1 Selection of Inflation Rate 6-4
2.2 Establishment of a Base Year for Analysis 6-5
2.3 Controlling for a Changing Vehicle Size Mix 6-6
2.4 Low-Speed Collisions Reported to the Police 6-7
2.5 Effect of Secondary Weight 6-8
3.0 LIFETIME BENEFITS 6-10
vii

3.1 Definition of Lifetime Benefits „.• 6-10
3.2 Gross Lifetime Benefits in Constant 1979 Dollars 6-113.2.1 Calculation of Gross Lifetime Benefits in Constant
1979 Dollars 6-123.2.2 Sample Calculation of Incremental Benefits for
the 1979 Model Year Front Bumper System 6-15
3.3 Discounting Gross Lifetime Benefits 6-173.3.1 Discounting Method for Lifetime Benefits 6-183.3.2 Sample Calculation of Discounted Gross Benefits
for the Model Year 1979 Front Bumper System 6-20
4.0 LIFETIME COSTS 6-22
4.1 Introduction 6-22
4.2 Lifetime Discounted Fuel Costs 6-234.2.1 Discounting Method for Lifetime Fuel Cost 6-25
4.2.2 Sample Calculation of Discounted Lifetime Fuel Cost 6-28
4.3 Discounted Incremental Lifetime Costs 6-29
4.4 Secondary Weight Effect 6-294.4.1 Method for Calculating Consumer Cost and Discount
Fuel Costs for Secondary Weight 6-314.4.2 A sample calculation of Secondary Weight
Cost (Discounted) 6-32
4.5 Total, Discounted Incremental (Lifetime) Bumper Costs 6-33
5.0 NET BENEFITS 6-37
5.1 Method for Determining Discounted Net Benefits 6-375.2 Sample Calculation of Discounted Net Benefits Including
Secondary Weight Effect 3-37
5.3 A Brief Discussion of Discounted Net Benefits 6-42
6.0 EFFECT ON DISCOUNTED NET BENEFITS OF ADDITIONAL FACTORS(AFFECTING DISCOUNTED GROSS BENEFITS) 6-47
6.1 Effect on Net Benefits of Excluding Cost to Repair DamageIn Unreported Collisions 6-48
6.2 Effects of Including Less Tangible Benefits 6-496.2.1 The Effects on Discounted Net Benefits of the Cost
of Insurance 6-506.2.2 The Effect on Discounted Net Benefits of the Savings
in Consumer Time and Inconvenience 6-51

REFERENCES R-l
Appendix A: Procedures for Adjusting Incident Rates for Bias A-l
Appendix B: Detectable Percent Change in Damage Frequency B-l
Appendix C: Log-Linear Analysis C-1
IX
LIST OF TABLES
Table 1-1 Standard 215 Exterior Protection 1-61-2 Bumper Standard (Part 581) 1-7
II-l Car Damage Frequency in Unreoorted Collisions 2-6II-2 Proportion of Bumper Involved Claims in all Property Damage
Claims 2-7II-3 Repair Cost of Damage in Unreported Collisions 2-8II-4 Damage Repair Cost in Insurance-Claimed Collisions 2-9II-5 Bumper Contact in Unreported, Multi-Vehicle Collisions 2-10II-6 Total Discounted Incremental (lifetime) Bumper Costs 2-13II-7 Discounted Net Benefits 2-15I II-l Number of Surveyed Vehicles by Model Year 3-30III-2 Model Year Distribution of Passenger Cars 3-31111-3 Average Number of Cars and Licensed Drivers Per Household 3-32III-4 Distribution of Low-Speed Incidents By Model Year and Reason
for Ineligibility 3-33IV-1 Damage Frequency in Unreported, Low-Speed Collisions (Front and
Rear Collisions Combined) 4-6IV-2 Damage Frequency in Unreported, Low-Speed Collisions (Front End
Collisions) 4-8IV-3 Damage Frequency in Unreported, Low-Speed Collisions (Rear End
Collisions) 4-9IV-4 Key Factors Influencing Damage Frequency 4-14IV-5 Distribution of Unreported, Low-Speed Collisions by Number of
Damage P arts 4-19IV-6 Percent of Insurance Claims which included Parts Listed 4-21IV-7 Insurance Claims for Repaired vs. Replaced Bumpers (one year old
cars) 4-23IV-8 Damage Severity to Front Exterior Parts 4-27IV-9 Damage Severity to Rear Exterior Parts 4-28IV-10 Repair Estimated for Damage in Unreported, Low-Speed Collisions.4-31IV-11 Average Repair Cost for Damage Reported in Bumper-Involved
Insurance Claims 4-33IV-12 Average Repair Cost for Bumper Claims by Make of Car 4-36IV-13 Average Insurance-Claimed Repair Cost By Bumper Material 4-38IV-14 Number of Property Damage Insurance Claims Per Insured Vehicle
Per Year 4-41IV-15 Bumper vs. Non-Bumper-Involved Property Damage Claims'(one-year-
old cars) 4-43IV-16 Bumper-Involved Claims as a Percentage of Total Property
Damage Claims — By Model Year and Vehicle Size (one-year-oldveh i cl es) 4-46
IV-17 Vehicle Miles Travelled, Auto Registration, and Annual MilesDri ven Per Car 4-47
IV-18 Relative Ratio of VMT by Car Size 4-50IV-19 Relative Ratios for VMT by Calendar Year and Car Size 4-50IV-20 Bumper-Involved Insurance Claim Percentages Adjusted for
Vehicle Use , 4-51IV-21 Comparison of Percentages of Property Damage Related Insurance
Claims Involving the Bumper for one vs. Three-Year-Old Cars 4-52

IV-22 Collisions by Bumper Contact Configuration and Model YearGroup 4-58
IV-23 Damage Frequency in Multi-Vehicle Unreported, Low-SpeedCollisions by Bumper Contact Configuration and Model Year Group. 4-61
IV-24 Effect of Bumper Height or Requirements on Repair Costs 4-62V-l Models Selected for Cost Evaluation 5-8V-2 Baseline Weight and Cost Data 1972 Bumper Systems 5-13V-3 Post-Standard Bumper Systems Weights 5-14V-4 Cost of Post-Standard Bumper Systems 5-15V-5 Incremental Consumer Costs of Each Bumper Standard Version 5-16V-6 Average Cost Trend of Post-Standard Bumper Systems (1979 Dollars
and Vehicle Mix) 5-19V-7 Incremental Bumper System Weight Per Car (1979 Vehicle Mix) 5-20V*-8 Lifetime fuel Cost Per Car 5-22V-9 Total Incremental Cost of Bumper Standard Due to Increased
Weight and Lifetime Fuel use Per Car (1979 Vehicle,Mix) 5-23VI-1 Proportion of Property Damage Insurance Claims, Involving the
Bumper, to All Property Damage Insurance Claims 6-14VI-2 Proportion of cars Struck in Front or Rear In Unreported, Low
Speed Col 1 isions 6-14VI-3 Gross Lifetime Benefits of Bumper Systems in Constantl979Dollars,6-16VI-4 Vehicle Miles Traveled During A Car's Life , 6-18VI-5 Discount Factors for a 10 Percent Rate 6-19VI-6 Gross Lifetime Benefits of Post Standard Bumper Systems —
Discounted to 1979 Dollars 6-21VI-7 Incremental Consumer Cost of Each Bumper Standard Version (1979
Dollars and Vehicle Mix) 6-22VI-8 Incremental Bumper System Weight... .6-24VI-9 Lifetime Fuel Cost In Constant 1979 Dollars (Fuel Price = $1.00/
Gallon) 6-24VI-10 Estimated Average Price of Unleaded Gasoline 6-27VI-11 Discounted Lifetime Fuel Cost 6-29VI-12 Discounted Incremental Lifetime Costs (no secondary weight) 1979
Dollars 6-30VI-13 Discounted Lifetime Costs of Secondary Weight (Discounted to
1979) - At Indicated 1979 Costs Per Pound - 6-34VI-14 Total Discounted Incremental (Lifetime) Bumper Costs (Discounted
to 1979 Dollars) - At Indicated 1979 Secondary Weight Costs/l.b.T6"36VI-15 Discounted Net Benefits, 1973 Bumper Systems (1979 Dollars)
Secondary Weight Consumer Cost Factor 6-39VI-16 Discounted Net Benefits, 1974-78 Bumper Systems (1979 Dollars)..6-40VI-17 Discounted Net Benefits, 1979 Bumper Systems (1979 Dollars) 6"41
LIST OF FIGURES
FIGURE 1-1 Basic Bumper System Components. 1-10V-l Consumer Cost Elements '.'..'.'..5-5

ACKNOWLEDGEMENTS
The authors would like to thank Jim Hedlund and Sue Partyka of the National
Center for Statistics and Analysis for their advice on statistical techniques
and for reviewing the manuscript. Comments and advice from Dr. Charles Kahane
and Robert Lemmer of the Office of Plans and Programs were especially useful
in preparing the evaluation. Finally, the effort of the stenographers in the
Office of Plans and Programs were crucial in successfully completing this
manuscript.
xn

EXECUTIVE SUMMARY
The objectives, of the bumper standards are to reduce damage and provide cost
savings to consumers, and to protect safety-related parts. Title I of the
Motor Vehicle Information and Cost Savings Act of 1972, and section 103 of the
National Traffic and Motor Vehicle Safety Act of 1966 are the bases for the
objectives.
The evaluation of the bumper standards was carried out under the policy of
Executive Order 12291 (Federal Regulation), dated February 17, 1981, which
superseded Executive Order 12044, and under Department of Transportation
Regulatory Policies and Procedures (February 26, 1979).
The bumper standard added more weight and cost to passenger cars than any
motor vehicle safety standard in existence. The evaluation of the
effectiveness of the bumper standard compares the amount of crash damage to
vehicles that were not required to comply with the standard (those
manufactured prior to the 1973 model year), with the damage sustained by
vehicles that had to comply. The first standard , FMVSS No. 215, required the
protection of safety parts (damage protection) at impact speeds of 5
miles-per-hour (mph) for the front bumper, and 2 1/2 mph for the rear bumper.
The standard was made more stringent for the 1974, and later, model years, and
again upgraded for both the 1979 and 1980 model years as the part 581 Bumper
Standard.
xv

In making comparisons there are two measures of effectiveness:
0 Frequency of Damage — Given a population of low-speed coll isions and
assuming a similar distr ibution with respect to impact speed for both pre-
and post-standard cars, the change in damage frequency (the number of cars
damaged) w i l l reflect the degree of effectiveness of exterior protection
provided on post-standard cars.
0 Extent of Damage - - The effectiveness of exterior protection systems on the
extent of damage in a low-speed col l is ion, is based on the change in damage
repair costs between pre- and post-standard cars, again, assuming a similar
pre- and post-coll ision speed distr ibut ion.
Both the frequency and the extent of damage can be affected by the degree of
over or underride of the col l iding bumper systems. Beginning with model year
1974, pendulum impact tests were required at bumper heights of 16 to 20 inches
above a surface to align bumper heights on post-standard cars so that both
over and underride are minimized in low-speed col l is ions.
Changes in the cost of col l is ion damage must be compared to the cost of
providing increased exterior protection. Bumper systems designed to meet the
standard in earlier years tended to be comprised mostly of steel, adding
weight and i ts concomitant increased fuel use, as well as resulting in price
increases, to post-standard cars. Fleet downsizing and the need to improve
fuel economy, hence reduce weight, led to the use of l ighter materials and
simpler attaching devices. Therefore, key results in this report are
xv i

presented in terms of net benefits, difference between gross benefits and
incremental costs to meet standards.
Low-speed accidents often cause slight or no damage and thus go unreported
leaving a vast gap in available data. To approach this problem, the potential
applicable accident population had to be defined. Low-speed coll isions may be
reported, but only for insurance claim purposes. The findings in this study
are based on s ta t is t ica l analyses of 65,000 property damage insurance claims
and data from a national survey of 10,223 households having 14,902 cars. The
costs of meeting the bumper standard are based on teardown studies of 94
bumper systems representing 1972 (pre-standard) through 1980 makes and
models.
PRINCIPAL FINDINGS
Low Speed Collisions
Bumper standards were established to prevent car damage in low-speed
collisions. Estimates based on the national survey, show:
0 Approximately one in five cars on the road (22 percent) is involved in
a low-speed collision each year.
0 Of the 22 percent, 14 percent do not report the collision either to the
police or an insurance company, another 7 percent of those involved file
insurance claims and may report the accident to the police, and the
remaining 1 percent report the collision to the police, but do not file
insurance claims.xyn

° Half of the cars involved in unreported low-speed coll isions incur damage.
Thus, 7 percent of al l cars on the road sustain damage in unreported low-speed
col l is ions.
BUMPER EFFECTIVENESS
The standard's effectiveness in reducing damage in low-speed co l l i s ions is
measured by comparing the fo l lowing pre- and post-standard values:
0 Damage frequency - the proportion of cars damaged in unreported
collisions.
0 Damage frequency - the proportion of cars where property damage insurance
claims are filed.
0 Repair Cost - the cost to repair damage sustained in unreported collisions.
° Repair Cost - the cost to repair damage as determined from cases where
insurance claims are filed.
0 Over or underride in multi-vehicle collisions
Summary of Effectiveness Findings
Damage Frequency:
There was a reduction of between 20 to 30 percent in the number of times
post-standard cars suffered damage in low-speed collisions, when compared
to cars with pre-standard bumpers. This reduction is statistically significant
xviii
° Front bumper systems were instrumental in reducing the frequency of damage,
although their effectiveness did not improve as standards became more
stringent from 1973 through 1980. The reduction in damage frequency is
between 28 and 37 percent.
0 Rear bumper systems were only effective in reducing the frequency of damage
in the 1974-78 models. There are conflicting results for the 1979-80
models, possibly due to sample size. In cases where collisions were
unreported - the expected "lowest" speed contacts - the 1979-80 rear
bumpers were not effective when compared to pre-standard rear bumpers.
From cases based on insurance claims, which tend to reflect the higher
damage range of low-speed collisions, they were effective.
° The 2 1/2 mile per hour rear bumper (1973) did not reduce the frequency of
damage when compared to pre-standard bumpers.
° The degree of bumper effectiveness was not affected by type of bumper
material nor by make of car.
Damage Repair Cost - Unreported Collisions
Unreported collisions represent bumper accidents with the lowest impact
speeds—reflected in their smaller damage repair costs, compared to insurance
claimed collisions. Analysis of unreported accidents showed the bumper
standard having a significant effect in reducing repair costs for cars damaged
in unreported collisions.
XV1X

° Cars with bumper systems meeting post-standard requirements are $20 less
expensive to repair than vehicles with pre 1973 systems when struck in the
front end. This is a s ta t i s t i ca l l y significant reduction, $188 vs. $166.
The average post-standard front bumper repair cost varied l i t t l e from the
lat ter value, even though the standard changed several times over the
1973-1980 period.
0 The cost to repair damage in the rear of a car dropped an average of $7 as
a result of 1973 through 1978 bumper standards, but increased by over $40
(relat ive to pre-standard) for cars meeting the 1979-80 requirements.
Damage Repair Cost - Collisions for Which Insurance Claims Were Filed
Insurance claims were analyzed for front and rear damage (bumper related).
This damage tends to result from the higher end of the low-speed col l is ion range
as is evident from repair costs, which are almost four times greater per damaged
car than for a car in an unreported co l l is ion. While the bumper standard
signi f icant ly reduced the number of bumper related damage claims, the effect on
damage repair cost per claim is higher for post-standard cars.
° The damage repair cost per post-standard car (1974-1979) with a front
bumper related damage claim signif icant ly increased compared to 1972
pre-standard cars, by about $145 per claim (a 20 percent increase). The
number of such claims decreased, however, by about 30 percent so that the
total dollar amount per insured car of such claims decreased by 15 percent.
The bumper standard had the effect of reducing the extent of damage in many
coll isions which then went unreported. The net effect is that insurance
claims are f i led only for the more severely damaged cars ~ hence a higher
repair cost per claim for post-standard cars.
xx

* The post standard cars struck in the rear incurred damage repair costs of
about $600 per bumper related damage claim. This represents some $60 (10
percent) more than the repair cost for a pre-standard car. There were,
however, 20 percent fewer insurance claims for post-standard cars, which
had the net effect of reducing the total amount of such claims by 10
percent.
Effectiveness of Bumper Height Requirements
° As a result of bumper height requirements there was a 12 percent increase
in the number of times bumpers made contact (matched) in multi-vehicle
collisions, compared to pre-standard cases.
° Damage frequency and damage repair costs decreased as a result of more
"matched" collisions.
Bumper Costs
There are two kinds of costs which were determined:
° The complete cost of a bumper system for various make/model cars and,0 The incremental cost--the difference between pre- and post-standard cars,
reflecting the actual cost to meet a particular bumper standard.
The incremental costs include the sum of:
0 The incremental cost due to bumper weight changes.0 The discounted lifetime fuel costs due to bumper weight changes.0 The total secondary weight costs.0 The discounted lifetime fuel cost due to secondary weight.
xxi

Summary of Bumper Cost Findings
0 The 1979-80 bumper standards increased the cost of bumpers (front
and rear) by $150 to $200. This is the increase relat ive to
pre-standard bumper systems, and is based on secondary weight ratios
of between 0.35 and 0.75 (which added $25 to $75 to the cost of
bumpers.)
° For the same parameters as above, the increased cost for front
(1979-80) bumpers is $80 to $110; rear, $65 to $90.
0 The consumer costs, exclusive of added fuel consumed, and secondary
weight, of 1979-1980 bumpers—front and rear—were $89 higher than
for pre-standard cars.
* The heavier weight of 1979-1980 bumpers over pre-standard bumpers
results in the increased consumption of 43 gallons of fuel over the
l i f e of a car, at a discounted cost penalty of $36.
(NOTE: All of the above values are discounted to 1979 dollars.)
0 Bumper redesign for downsizing, including material substitut ion,
improved technology, etc. , reduced both the weight and cost of
1979-80 systems when compared to 1974-78 bumpers, even though the
standard's requirements were more stringent in 1979-80.
xxii

5.0 NET BENEFITS
When the actual costs associated with the bumper standard are subtracted from
the gross benefits due to the standard, the result is a net benefit or loss.
This is simply a measure, in dol lars, of whether, or to what degree, a
standard has paid for i t s e l f — i . e . , is cost effect ive.
The findings ref lect values discounted to 1979 dol lars. Gross benefits are
based on the difference in damage repair cost between pre- and post-standard
cars involved in low-speed col l is ions.
The following Table l i s ts a complete set of net benefits for various secondary
weight ratios and for each version—1973 through 1979--of the bumper standard.
Although the actual cost of al l standards through the 1980 model year was
obtained, gross benefits could not be calculated for that model year since
insurance claim data—a necessary part of the gross benefit calculation—was
not available at the conclusion of the evaluation work.
5.1 Summary of Findings Related to Net Benefits
Net benefit (or loss) values are shown for secondary weight ratios 0.35, 0.50,
0.75 and 1.00 in addition to values when no secondary weight is considered.
The results are further divided by two values of cost per pound of secondary
weight. One at $0.60 per pound reflects the cost of adding material only,
X X l l l

DISCOUNTED NET BENEFITS(DISCOUNTED TO 1979 DOLLARS}
- At Indicated 1979 Secondary Weight Costs/lb. -
X!-1.
"H
SecondaryWeightFactor
Front and Rear0.000.35
—0.500.75
— 1.00
Front0.000.350.500.751.00
Rear0.000.350.500.751.00
1973 Bumper
$0.60/lb
ir-15-28-48-68
57362713-2
-43-51-54-59-65
System
$1.60/lb.
13-32-52-84-116
572410
-14-37
-43-55-60-69-78
1974-78
$0.60/lb
454
-14-43-73
593829150
-13-34-43-58-73
Bumper System
$1.60/lb.
45-21-50-97-144
592612
-12-35
-13-47-62-86-110
1979 Bumper
$0.60/lb.
276-3-20-32
614944 -3628
-33-42-46-53-59
System
$1.60/lb
27-7-22-47-71
614233206
-33-48-55-65-76
NOTE 1. Values may not add due to rounding.
NOTE 2. Values are point estimates.

the other at $1.60 per pound represents the cost per pound of total car
weight. Both are consumer costs in 1979 dollars.
Views on the existence and/or amount of secondary weight - the added weight
for strengthening affected vehicle systems and parts due to an added weight
to bumper systems - differ. This evaluation does not attempt to resolve the
issue, therefore net benefits (and losses) were calculated for a number of
secondary weight ratios.
In the following summary, net benefit (and loss) values will be discussed, in
most cases based on a secondary weight ratio and cost per pound of 0.50 and
$0.60, respectively.
0 Front bumper systems have tended to be cost effective since bumper standards
were first met in 1973 model cars. The 1979 front bumper system shows a
definitive net benefit of $44 (basis is 0.5 secondary weight ratio and $0.60
per pound of secondary weight.)
° Rear bumper systems are not, and have never been, cpst effective since
the promulgation of the standards. They have consistently incurred net
losses, of between $43 to $54 (1973). The net loss for the 1979 bumper
systems is $46 (same basis as above). The rear bumper systems
show net losses even when no secondary weights are considered.

The combined front and rear results for post standard bumper systems
present a varied picture. Only the 1974-78 bumper systems show a
definitive net benefit, and that is limited to when no secondary weight is
included. The 1979 models tend toward a net benefit under similar
circumstances.
At a secondary weight ratio of 0.5 (and $0.60/lb.) the results begin to
shift and when secondary weight ratios of 0.75 or higher are used, the
combined front and rear post standard bumper systems tend toward, or show,
a net loss.
The relatively positive results (net benefits) for front bumper systems may
stem from a number of conditions. One of these is the finding that the
damage frequency to the front ends of cars is between 25 and 50 percent
higher than to the rear ends. The damage reduction (and benefit) potential
is consequently higher for the front. This is borne out by the reduction
in damage frequencies for post-standard cars (compared to pre-standard
cars) which favored the front end over the rear by a factor of between 2
and 3 to one. Damage repair cost reductions for post-standard cars,
compared to pre-standard, show similar trends.
There is no evidence that downsizing--that 1s, both the decrease in weight
or the substitution of materials--had an effect on net benefits of bumper
systems. The improvement in front bumper net benefits, 1979 over 1974-78,
is as high as 50 percent (0.5 secondary weight ratio) at the same time
that the weight of front bumper systems was reduced by 16 percent (75 lbs.
to 63 lbs.).
xxvi

° The weight reduction, 1974-78 to 1979-80, for rear bumper systems is 20
pounds, or 27 percent (75 lbs. to 55 lbs.) and net losses increased by 7
percent. While no direct cause-effect relationship can readily be
established, the re lat ively large weight reduction can be a contributing
factor, part icularly in l ight of damage frequency and repair cost findings
for the rear bumper systems on 1979-80 cars.
Additional Factors Affecting Net Benefits
° A previous assessment by the agency included estimates of consumer and
insurance (fewer claim settlements) savings resulting from bumper
standards.}j A total of $61 in additional net benefits (1979 dollars)
was estimated for the front and rear bumper system. It was not possible
to collect data to analyze and construct these secondary effects in this
evaluation. The results are neither verified nor disputed.
° Bumper damage is not always repaired, which may reduce the value of a
car when it is sold. The effect of such cases was calculated, assuming
that none of the damage in unreported collisions was repaired. The
result could reduce net benefits by an amount of $12 (1979 front and
rear bumpers combined).
1/ National Highway Traffic Safety Administration, Final Assessment of the. BumperStandard, DOT HS-804-718 (June 1, 1979). '
XXVll

6.0 CONCLUSIONS
0 Front bumper systems have been effective in reducing property damage.
They generally show net benefits, particularly for the 1979 model cars,
The lack of damage reduction potential to parts and components in the rear
of a car lead to consistent net losses for rear bumper systems installed
to meet standard requirements. When results for the front and rear
systems are combined they tend toward a net benefit only when little or no
secondary weight is included; at secondary weight ratios of 0.50 and above
the results shift toward or show net losses.
0 The chance for rear bumper systems to achieve net benefits is ^ery
limited. Rear bumper systems for 1979-80 models weigh some 20 pounds less
than their 1974-78 predecessors, and 8 pounds less than their front
counterparts.
0 Downsizing through weight reduction and material substitution appeared to
have no effect on either the damage reducing capability or cost
effectiveness of front bumpers. It may have had a slight aggravating
effect on rear end protection.
xxviii
While a series of secondary effects such as time and insurance cost
savings, the value of unrepaired damage, additional interest cost on car
loans due to added bumper costs, etc., can affect net benefits (or
losses), reliable data are difficult to obtain. Estimates of such
effects, when available, should be considered, as an adjunct to the
primary results.
The mix of the car fleet can be a significant factor affecting both
damage frequency and net benefits. How bumper systems fare when small
cars predominate would require assumptions beyond the scope of this
evaluation.
xxix

CHAPTER I
LOW-SPEED COLLISIONSAND THE
BUMPER STANDARD
1.0 AGENCY MISSION AND AUTHORITY
1.1 Introduction
The primary mission of the National Highway Traffic Safety Administration
(NHTSA) is to reduce traffic accidents and their consequences in terms of
persons injured or killed and to reduce property damage. The National
Traffic and Motor Vehicle Safety Act of 1966 provides the authority for
issuing safety standards and specifies that these standards be
practicable, meet the needs of motor vehicle safety and provide objective
criteria. NHTSA issues vehicle safety regulations (Federal Motor Vehicle
Safety Standards, FMVSS) which require that new motor vehicles or motor
vehicle equipment sold in the U.S. meet specified performance levels.
The first bumper standard issued under the 1966 Act was FMVSS 215--
Exterior Protection, which called for passenger cars, beginning with
model year 1973, to withstand 5 mph front and 2 1/2 mph rear impacts
against a barrier without damage to certain safety related components.
Impact and test requirements were upgraded for subsequent model years, as
will be discussed in more detail later.
1-1

In October 1972, Congress enacted the Motor Vehicle Information and Cost
Savings Act (MVICS Act) which included, under Title I, the authority to
issue bumper standards which would yield the maximum feasible reduction of
costs to the public, taking into account:
o The cost of implementing the standard and the benefits
attainable as a result of implementation;
o The effect on the cost of insurance and legal fees;
o Savings in terms of consumer time and inconvenience; and
o Health and safety considerations.
The initial requirements under the MVICS Act were integrated with FMVSS
215 and promulgated in March 1976 as a new bumper standard applicable to
passenger cars beginning with model year 1979. It allowed damage to bumpers
and limited damage to other front and rear surfaces in low-speed crashes, as
well as to numerous safety-related components.
1.2 Need to Evaluate Existing Regulations
The Secretary of Transportation issued the Department's Regulatory Polices
and Procedures (February 26, 1979) which included a requirement that the
Department prepare, for publication in the Federal Register, a semi-annual
list of existing regulations it has selected for review. An order issued by
the Department (DOT 2100.5 updated 5-22-80), "Policies and Procedures for
Simplification, Analysis, and Review of Regulations," gives guidelines for
identifying and ranking regulations to be reviewed. Some factors to be
considered include: the nature and extent of complaints about a regulation,
1-2

the length of time since a regulation was last reviewed, the importance
and continued relevance of the problem the regulation was originally
intended to solve, the burdens imposed on those directly or indirectly
affected by the regulation, and the degree to which technology, economic
conditions or other factors have changed in the area affected by the
regulation.
Executive Order 12291 issued on February 17, 1981 requires agencies to
initiate reviews of currently existing regulations and perform Regulatory
Impact Analyses of currently existing major rules. The purpose of such
reviews is to ascertain whether the benefits of the rule exceed the costs
to society. This bumper evaluation, which includes new information not
used in previous reviews, meets this latter requirement. The bumper
standard was initially chosen for review nearly 4 years ago because it added more
weight, and cost, than any other regulation issued by the Agency at that time.
In addition, it has long been the center of public controversy over its costs and
benefits.
2.0 HISTORY OF THE STANDARD
2.1 Historical Highlights
The automobile bumper was or ig inal ly designed in the early 1900's to protect
the front and rear of the vehicle in low-speed accidents. Bumpers were generally
unsophisticated but effective—a beam held by spring-like supports.
1-3

These bumper systems did not absorb energy (unless parts were permanently bent
or broken under collision forces); rather, they stored energy for release in a
rebound motion when struck. Bumpers were in an extended position from the car
body and were made of high-strength materials so that low speed collision
forces were spread over a sufficient period of time and space to prevent
severe damage to the car. When bumper heights of two cars matched, they also
aided parking maneuvers.
After World War II, automobiles became more stylish and the bumper's
protective nature tended to be sacrificed to designs that more
attractively matched vehicle shapes. Bumpers were moved closer to body
sheet metal and other vulnerable parts and were often made of lighter
weight materials. These changes resulted in increased damage to bumpers
and other front and rear parts when cars were involved in low-speed
collisions. The results were higher repair and insurance costs to the
motoring public.V
After passage of the National Traffic and Motor Vehicle Safety Act in 1966 and
the subsequent establishment of the Agency, work began toward the development
of a safety regulation for exterior protection--the bumper standard designated
FMVSS 215. The final rule, issued on April 9, 1971, required that passenger
cars, beginning with model year 1973, be in compliance with the standard.
V Stanford Research Institute, Evaluation Methodology for FederalMotor Vehicle Safety Standards, Report No. DOT-HS-802-341 (May 1977),p. 2-10. 1-5
1-4

2.2 Development of the Bumper Standard
The current (1980) bumper standard is best described in terms of four successive
stages, which constitute the object of this evaluation. While Tables 1-1 and
1-2 list the purposes, requirements and compliance test criteria, the following
is a brief description of each of the four bumper standard stages for
identification and reference throughout the report:
Standard
FMVSS 215
FMVSS 215
Part 581incorporatingFMVSS 215
As above
Model Year(s)Applicable
1973
1974-1978
1979
1980
Barrier/Pendulum Speedand Parts Affected
5 mph front and 2 1/2 mph rear impactwith barrier. Safety related partsonly.
5 mph front and rear impacts withbarrier and pendulum; 3 mph cornerimpact with pendulum. Safety relatedparts only. Pendulum test establishedbumper height between 16 and 20 inches,
As above, plus no damage toexterior surfaces, exceptbumper face bar and its fasteners.
As above, except face bar can haveno permanent deviation in contour orposition greater than 3/4 inch, and nopermanent localized surface deviationgreater than 3/8 inch.
1-5

TABLE 1-1
STANDARD 215—EXTERIOR PROTECTION
ITEM
Effective DateModel Year
September 1,1973
1972
DESCRIPTION
September 1, 1973*1974-1978
o Specific purpose: Establish requirements for impactresistance and height of bumpers.
Purpose ofStandard o General purpose:
- Prevent low-speed accidents from impairing safeoperation.
- Reduce the frequency of override or underride inhigher speed collisions.
GeneralRequirementsof Standards
Vehicle can impact fixedbarrier at 5 mph forwardor 2.5 mph in reverse andsuffer limited damage to:
Lamps and reflectors;hood, trunk and doors;fuel, cooling andexhaust systems.
•Vehicle can be impacted by apendulum-like test device (5mph front and rear and 3 mphcorner) between 16 and 20inches from ground followedby front and rear fixed-barrierimpacts at 5 mph, and suffer1imited damage, to:
Same items as earlier test;and propulsion, suspension,steering, and braking systems.
The basic principle used in meeting this Standard isAlternative energy absorption. Various torsional systems, mechanical
Compliance systems, and energy absorbing materials have been used:Methods springs, pneumatic shock absorbers, plastic foams, etc.
(See Section 2.3).
Standard 215 has been in effect for all passenger carsScope of since September 1, 1972. Certain special configuration
Coverage vehicles with less than 115 inch wheelbase were exemptedfrom the September 1, 1973, pendulum impact requirements untilAugust 31, 1974.
1-6

TABLE 1-2
BUMPER STANDARD (PART 581)1/
ITEM
Effective DateModel Year
September 1,1979
1978
DESCRIPTION
September 1,1980
1979*
o Specific purpose; Establish requirements for impactPurpose of resistance of vehicles in low-speed front and rear
Standard accidents.
o General purpose: Reduce the physical damage to thefront and rear ends of motor vehicles.
The vehicle must undergo the front and rear barrier impact testat 5 mph and the pendulum 5 mph impact test to both front and rearbumpers and to the corners. All the damage criteria listed inin Table 1-1 must be met and:
Exterior surfaces shallnot be damaged or havepermanent deviationsexcept for damage tothe bumper face bar andcomponents and fastenersthat attach the bar tothe chassis frame
*Exterior surfaces shall notbe damaged or have permanentdeviations except for facebars which can have nopermanent deviation greaterthan 3/4" from its originalcontour and position relativeto the vehicle frame vehicle. frame, and no permanent surfacedeviation greater than 3/8" from theoriginal contour on areas ofcontact with test devices.
1/ Issued under authority of Title I of the Motor Vehicle Information and"Cost Savings Act of 1972, and Sections 103 and 119 of the Safety Act.
1-7

Bumper standards applicable to passenger cars beginning with the 1979 models
limit damage to vehicle bumpers and other front and rear surfaces in low-speed
crashes. The new standard (Part 581) was issued under the concurrent
authority of Title I of the Motor Vehicle Information and Cost Savings Act and
Sections 103 and 119 of the National Traffic and Motor Vehicle Safety Act. In
addition to specifying limitations on damage to non-safety related components
and vehicle surfaces, Part 581 incorporates the safety components specified in
Standard 215.
2.3 Complying with the Bumper Standard
The components that typically make up a bumper system include the
following:
o Face bar and protective strip
o Face bar reinforcement
o Bumper guards
o License plate bracket
o Filler and valance panels
o Energy absorbers
o Air deflectors (front bumper)
o Heat shield (rear bumper)
o Miscellaneous brackets, braces, etc.2/
V John Z. DeLorean Corporation, Cost Evaluation for Four Federal MotorVehicle Standards: Volume I, DOT-HS-803-871 (October 1978), p. 39.
1-8

Of the components listed, the basic ones that affect the bumper system's
protective capability are the face bar, the face bar reinforcement, and the
energy absorbers. Figure 1-1 is a simplified sketch of a bumper system with
these basic components identified. Pre-standard bumper systems, except for
some brackets and fastening devices, generally consisted of just the face
bar.
The automotive industry responded to the first bumper standard by
installing bumper systems of varying designs. For example:
o General Motors used reinforced steel bumpers with external
rubber guards attached to a pair of energy absorbing
hydraulic/pneumatic cylinders.
o General Motors on a few models installed elastomeric material
which absorbed impact energy.
o Ford used reinforced steel bumpers connected to energy absorbing
blocks of rubber which acted in shear upon impact.
o Chrysler used a full width steel reinforcement attached directly
to the vehicle's frame. The bumper had large energy absorbing
rubber blocks [which looked like bumper guards] attached to it.£/
£/ Ibid., pp. 38-39.
1-9

FIGURE 1-1
BASIC BUMPER SYSTEM COMPONENTS
ENERGY ABSORBERS
REINFORCEMENT
FACE BAR
1-10

Generally General Motors' f u l l size models in 1972, the year before the
bumper standard took effect, were equipped with bumper systems that met the
bumper standard requirement.^/
2.3.1 Energy Absorbers
After the pendulum test was required as part of the bumper standard, the
rubber shear and Chrysler's large rubber blocks were less useful as energy
absorbers in bumper systems.
The piston type energy absorber and use of elastomeric materials were
typica l ly installed on 1979 modeis.fy
2.3.2 Face Bars and Reinforcements
The heaviest components of bumper systems are the face bar and face bar
reinforcement. Most face bars and reinforcements were made of steel for
the 1973 model cars. This had a significant effect on the total bumper
weight. For example, the weight of the front bumper system for a 1973 Nova
was almost twice that of a 1972 Nova.
fy KLD Associates, Inc., Analysis ofInsurance Claims to Determine Bumper Effect on Crash Damage, DOT-HS-842-843TMarch 1980), p T T X '5/ John Z. DeLorean Corporation, Cost Evaluation for Four Federal MotorVehicle Standards: Task VI, 1979 Selected Bumper Systems, Report No.DOT-HS-803-873 (December 1978); and A Cost/Weight StudyTn 1977-1980Production Bumper Systems (New York: The International Nickel Co. |_1980]).These reports contained parts lists for 19 different 1979 model cars.These lists were reviewed to arrive at this conclusion.
1-11

The pendulum test resulted in rear bumper systems weighing as much or
more than the front systems.^/ Most of the weight increase came from
the added material to the face bar and the addition of extra components,
the biggest of which was the face bar reinforcement.
By the late 1970's it became obvious to the auto industry that material
substitution could significantly reduce the weight of bumper systems.
Various combinations came into use. The 1978 Ford-Fairmont was equipped
with an aluminum face bar with steel reinforcement; the 1979
Chevrolet-Maiibu had a steel face bar but aluminum reinforcement.j7
Of course another weight saver was the downsizing of the automobile in
the late 1970's. This allowed for much smaller face bar reinforcements
for two reasons. The dimensions of the car were reduced so that face
bars were not as long. The car weighed much less so that the bumper
systems did not have to absorb as much energy because the pendulum test
specifies that the weight of the pendulum shall equal that of the car
being tested.
fy John Z. DeLorean Corporation, Volume I, pp. A-5, A-7, and A-9., Thisreport shows that the Nova rear bumper system weighed 31 pounds in 1972,47 pounds in 1973, and 81 pounds in 1974 whereas the front bumper systemfor a Nova weighed 61 pounds.
~U A Cost/Weight Study on 1977-1980 Production Bumper Systems (NewYork"! The International Nickel Company, 1980), pp. 22 and 24.
1-12

Downsizing and use of light weight materials resulted in many 1979
bumper systems weighing less than 1974 systems and in some instances
less than the comparable 1972 model.£/
3.0 EVALUATION OBJECTIVES
3.1 Introduction
The objective of the bumper standard, unlike most safety standards, is to
reduce damage. To be sure, the standard specifie, that safety-related
parts must be protected, but under T i t le I of the Motor Vehicle
Information and Cost Savings Act, the primary emphasis is on cost savings
to the consumer. The bumper standard also di f fers from other safety
standards in that i t applies to low speed accidents, given the maximum
test speed of 5 mph. Low-speed accidents often cause slight or no damage
and thus go unreported leaving a vast gap in available data. To approach
th is problem, the potential applicable accident population must be
defined before proceeding with specific evaluation objectives.
3.2 Low-Speed Collisions
The primary problem in setting bumper standards and in the evaluation
of effectiveness is the definition and identification of low-speed
£/ DeLorean Corporation, Volume I, p. 5 and Task VI, p. A-6. Thesereports show that the bumper system for a Caprice in 1972 weighed 194pounds. In 1974 the weight increased to 216 pounds, but in 1979 itdecreased to 150 pounds.
1-13

collisions. There is little information at the State, local or national level
on the number of auto accidents that occur at various speeds, especially the
lower speeds. Computer models have been developed for simulating impact speeds
of higher-speed accidents using data on tire skid marks on the road, before and
after locations of the vehicles in the crash, and the dimensions of the
physical damage to these vehicles. The computer model is accurate for
estimating speeds of the more severe accidents. Even so, the estimates are not
\iery precise. From the computer modeling one can only determine what is not a
low-speed collision, namely, one that includes injured occupants, long tire
skid marks, or a large displacement of vehicles on impact unless one of the
vehicles is much larger than the other (e.g., tractor-trailer impact with a
subcompact car).
From a purely energy management design perspective, bumpers are intended to be
effective in preventing superficial vehicle damage. When the collision speed
exceeds a certain threshold, bumpers are not physically capable of absorbing
all the impact energy and the vehicle frame or other main body structure or
system often is damaged. When this happens the auto usually cannot be driven
from the scene of the accident. Therefore, low-speed collisions generally
would not include vehicles that must be towed away after the accident.
Low-speed collisions often result in no damage or just a few dents or
scratches and seldom is anyone injured. This means that the police or
insurance companies may not be notified and that the occurrence of the
collision is not recorded. Police reports are only required when damage
exceeds a certain dollar amount or when persons are injured. When the
1-14
damage is below a driver's deductible for collision insurance (typically
$100), an insurance claim is not filed. When no damage occurs as the
result of a low-speed collision, there is no report of the accident under
most circumstances.
3.3 Bumper Standard Effectiveness
An evaluation of the effectiveness of the bumper standard basically
compares the amount of crash damage to vehicles that were not required
to comply with the standard with the damage sustained by vehicles that
had to comply with some version of the standard. Such an analysis should
also make comparisons between vehicles meeting different versions of the
standard to determine if one version has been more effective in reducing
damage than another. In making these comparisons there are two
quantities which measure the effectiveness of the bumper
standard--frequency of damage and extent of damage.
While subsequent chapters will cover the approach, measurement and
analysis in more detail, the main evaluation questions are described in
the following sections.
3.3.1 Damage Frequency
Given a population of low speed collisions and assuming a similar
distribution with respect to impact speed for both pre- and post-standard
cars, the change in damage frequency will reflect the degree of
effectiveness of exterior protection provided on post-standard cars.1-15

Damage can range from measuring any deformation or breakage to an assessment
of the cumulative damage caused to each part in a single co l l i s ion, or simply
counting up the number of parts that are damaged. In evaluating damage
frequency the incidence of any damage and the incidence by part--to the degree
possible--wil1 constitute one basis for determining effectiveness.
3.3.2 Extent of Damage
The effectiveness of exterior protection systems on the extent of damage
in a low-speed collision is based on the change of collision damage
repair costs between pre- and post-standard cars, assuming a similar pre-
and post-collision speed distribution. A series of subset analyses may be
possible to examine bumper effectiveness in reducing the extent of damage to
key safety parts.
3.3.3 Effect of Over and Underride
Both the frequency and the extent of damage can be affected by the degree of
over or underride of the colliding bumper systems. Compliance tests,
beginning with model year 1974 required pendulum impacts within specified
bumper height limits (16 to 20 inches above a surface), the obvious purpose
being to align bumper heights on post-standard cars so that both over and
underride are minimized in low-speed collisions.
1-16

3.4 Bumper Standard Costs
Changes in the cost of collision damage must be compared to the cost of
providing increased exterior protection. Bumper systems designed to meet
the standard in earlier years tended to be mostly of steel. Fleet
downsizing led to the use of lighter materials and simpler attaching
devices. Any weight added to produce bumpers which comply with the
standards will result in a fuel penalty thus increasing fuel costs over
the life of the car. The key question here is how does the lifetime
incremental cost of the bumper system compare with incremental lifetime
benefits.
4.0 ORGANIZATION OF REPORT
Chapter II, which follows, contains the findings and conclusions based on
an analysis of data collected for this evaluation. Chapter III presents
methods of collecting data with which to measure the reduction in the
frequency and extent of crash damage in low-speed collisions. Bumper
standard effectiveness in analyzed in Chapter IV and the costs of the
bumper standard are presented in Chapter V. The cost-effectiveness of
the bumper standard is evaluated in Chapter VI.
1-17

CHAPTER II
FINDINGS AND CONCLUSIONS
1.0 DATA SOURCES
The findings are based on statistical analyses of:
0 65,000 property damage insurance claims0 A national survey of 10,223 households, with 14,902 cars.
° Tear down studies of 94 bumper systems covering 1972 through 1980 makes and
models. Actual bumper costs are estimated from such tear downs.
The year 1979 was selected as the base year for the analysis of benefits and
costs of the bumper standard since it was the latest year for which actual
economic data were available. Most of the unreported collisions from the
national survey occurred during that year, therefore, all dollar values shown
in this study are expressed in 1979 dollars.
2.0 LOW-SPEED COLLISIONS
Bumper standards were established to prevent car damage in low-speed
col l is ions. Estimates based on the national survey, show:
° Approximately one in five cars on the road (22 percent) is involved in a
low-speed collision each year.
2-1

° Of the 22 percent, 14 percent do not report the collision to the police or
an insurance company, another 7 percent of those involved file insurance
claims, and the remaining 1 percent report the collision to the police, but
do not file insurance claims.
0 Half of the cars involved in unreported low-speed collisions incur damage.
Thus, 7 percent of all cars on the road are damaged each year in unreported
low-speed collisions.
3.0 BUMPER EFFECTIVENESS
The standard's effectiveness in reducing damage in low-speed collisions is
measured by comparing the following pre- and post-standard values:
0 Damage frequency - the proportion of cars damaged in unreported
collisions.
° Damage frequency - the proportion of cars where property damage insurance
claims are filed.
0 Repair Cost - the cost to repair damage sustained in unreported collisions.
° Repair Cost - the cost to repair damage as determined from cases where
insurance claims are filed.
° Over or underride in multi-vehicle collisions.
2-2

Tables II-l through II-5 show the results together with their statistical
significanceJ7 Not included in this section, but covered in Chapter IV, are
several supplemental effectiveness measures relating to damaged parts.
Summary of Effectiveness Findings
Damage Frequency:
° There was a reduction of between 20 to 30 percent in the number of times
post-standard cars suffered damage in low-speed collisions, when compared to
cars with pre-standard bumpers. This reduction is statistically
significant.
0 Front bumper systems were instrumental in reducing the frequency of damage,
although their effectiveness did not improve as standards became more
stringent from 1973 through 1980. The reduction in damage frequency is
between 28 and 37 percent.
0 Rear bumper systems were only effective in reducing the frequency of
damage in the 1974-78 models. There are conflicting results for the 1979-80
models, possibly due to sample size. In cases where collisions were
unreported - the expected "lowest" speed contacts - the 1979-80 rear bumpers
were not effective when compared to pre-standard rear bumpers. From cases
based on insurance claims, which tend to reflect the higher damage range of
low-speed collisions, they were effective.
V All statistical tests are at 95 percent confidence or £>C = 0.05
2-3

0 The 2 1/2 mile per hour rear bumper (1973) did not reduce the frequency of
damage when compared to pre-standard bumpers.
° The degree of bumper effectiveness was not affected by type of bumper
material nor by make of car.
Damage Repair Cost - Unreported Collisions
Unreported collisions represent bumper accidents with the lowest impact
speeds—reflected in their smaller damage repair costs, compared to insurance
claimed collisions. Analysis of unreported accidents showed the bumper standard
having a significant effect in reducing repair costs for cars damaged in
unreported collisions.
° Cars with bumper systems.meeting post-standard requirements are $20 less
expensive to repair than vehicles with pre 1973 systems when struck in the
front end. This is a statistically significant reduction, $188 vs. $166.
The average post-standard front bumper repair cost varied little from the
latter value, even though the standard changed several times over the
1973-1980 period.
0 The cost to repair damage in the rear of a car dropped an average of $7 as
a result of 1973 through 1978 bumper standards, but increased by over $40
(relative to pre-standard) on cars meeting the 1978-80 requirement.
2-4

Damage Repair Cost - Collisions for Which Insurance Claims Were Filed
Insurance claims were analyzed for front and rear damage (bumper related).
This damage tends to result from the higher end of the low-speed collision range
as is evident from repair costs, which are almost four times greater per damaged
car than for a car in an unreported collision. While the bumper standard
significantly reduced the number of bumper related damage claims, the effect on
damage repair cost per claim is higher for post-standard cars.
° The damage repair cost per post-standard car (1974-1979) with a front bumper
related damage claim significantly increased compared to 1972 pre-standard
cars, by about $145 per claim (a 20 percent increase). The number of such
claims decreased, however, by about 30 percent so that the total dollar amount
per insured car of such claims decreased by 15 percent. The bumper standard
had the effect of reducing the extent of damage in many collisions which then
went unreported. The net effect is that insurance claims are filed only for
the more severely damaged cars -- hence a higher repair cost per claim for
post-standard cars.
° The post standard cars struck in the rear incurred damage repair costs of
about $600 per bumper related damage claim. This represents some $60 (10
percent) more than the repair cost for a pre-standard car. There were,
however, 20 percent fewer insurance claims for post-standard cars, which
had the net effect of reducing the total amount of such claims by 10
percent.
2-5

TABLE II-l
CAR DAMAGE FREQUENCY IN UNREPORTED COLLISIONS
Model Year GroupFREQUENCY OF CARDAMAGE/COLLISION(PERCENT)V
SIGNIFICANTLY LESSTHAN PRE-STANDARD
FRONT AND REAR-END COLLISIONS COMBINED
Pre-Standard (1972and Earlier) 53
Post-Standard:1973
1974-781979-80
403742
YesYesYes
FRONT-END COLLISIONS ONLY
Pre-Standard (1972and Earlier) 60
Post-Standard:19731974-781979-80
374238
YesYesYes
REAR-END COLLISIONS ONLY
Pre-Standard (1972And Earlier) 48
Post-Standard:19731974-781979-80
433146*
NoYesNo
}j Damage frequency of each post-standard group is compared with pre-ceding post-standard group's frequency. Significance is shown as follows
* -significantly greater than preceding group's frequency**-significantly less than preceding group's frequency
No symbol-frequencies are not significantly different
2-6

TABLE 11-2
PROPORTION OF BUMPER INVOLVED CLAIMS
IN ALL PROPERTY DAMAGE CLAIMS!/
PROPORTION OF BUMPER SIGNIFICANTLY LESSINVOLVED CLAIMS THAN PRE-STANDARD
Model Year Groupl' (Percent)!'
FRONT AND REAR END COLLISIONS COMBINED
Pre-Standarad (1972) 56
Post-Standard:1973 53 Yes1974-78 42** Yes1979 42 Yes
FRONT END COLLISIONS
Pre-Standard (1972) 35
Post-Standard:1973 28 Yes
1974-78 25** Yes1979 24** Yes
REAR END COLLISIONS
Pre-Standard (1972) 22
Post-Standard:1973 25 No, higher
1974-78 16** Yes1979 18* Yes
1/ Co l l i s ion and property damage l i a b i l i t y claims.2/ Insurance claim data was unavailable for the 1980 model year.2 / Each post-standard group was compared with the preceding post-standard
group to determine signi f icance as fo l lows:
* - S i g n i f i c a n t l y greater than proportion of preceding group* * - S i g n i f i c a n t l y less than proportion of preceding group
No symbol-proportions are not s i g n i f i c a n t l y d i f fe ren t
2-7

TABLE 11-3
REPAIR COST OF DAMAGE IN UNREPORTED COLLISIONS
MODEL YEAR GROUPREPAIR COST PER
DAMAGE-CAUSING COLLISION(1979 DOLLARS)!/
SIGNIFICANTLY LESSTHAN PRE-STANDARD
FRONT OR REAR-END COLLISIONS COMBINED
Tre-StandarcTTT97rand earl ier) 159
Post-Standard:1973
1974-781979-80
139143168*
YesYesNo, greater
FRONT-END COLLISIONS
Pre-Standard (1972and ea r l i e r ) 188
Post-Standard:1973
1974-781979-80
168163166
YesYesYes
Pre-Standard (1972"and earlier)
REAR-END COLLISIONS
127
Post-Standard:1973
1974-781979-80
121119171*
NoYesNo, greater
V Each post-standard group was compared with the preceding post-standard groupto determine significane as follows:
*-significantly greater than repair cost of preceding group**-significantly less than repair cost of preceding groupNo symbol-repair costs are not significantly different
2-8

TABLE II-4
DAMAGE REPAIR COST IN INSURANCE-CLAIMED COLLISIONS
MODEL YEAR GROUP1/REPAIR COST PEBUMPER CLAIM(1979 DOLLARS)
SIGNIFICANTLY LESSTHAN PRE-STANDARD?
FRONT OR REAR END COLLISIONS COMBINED
Pre-Standard (1972)
Post-Standard:1973
1974-78
1979
669
682
772*
778*
No, higher
No, higher
No, higher
FRONT END COLLISIONS
Pre-Standard (1972)
Post-Standard:1973
1974-78
1979
745
783
890*
891
No, higher
No, higher
No, higher
REAR END COLLISIONS
Pre-Standard (1972)
Post-Standard:1973
1974-78
1979
544
565
591*
618*
No, higher
No, higher
No, higher
V Insurance claim data was unavailable for the 1980 model year.
2/ Each post-standard group was compared with the preceding post-standard groupTo determine significance as follows:
* - significantly greater than repair cost of preceding group
** - significantly less than repair cost of preceding group
no symbol - repair costs are not significantly different
2-9
TABLE II-5
BUMPER CONTACT IN UNREPORTED,MULTI-VEHICLE COLLISIONS1/
Model Year Group2/Collisions where Bumpers
Made Contact^/(Percent)
S ign i f i can t l y GreaterThan Pre-Standard?
FRONT OR REAR END OF SURVEYED CAR
Pre-Standard (T972and ea r l i e r ) 74
Post-Standard:1974-781979-80
8579
YesYes
FRONT-END OF SURVEYED CAR
Pre-StanIa7d~[T97Tand ea r l i e r ) 72
Post-Standard:1974-781979-80
8278
YesNo
REAR-END OF SURVEYED CAR
Pre-Standard (1972and earlier) 76
Post-Standard:1974-781979-80
8780**
YesNo
J_/ Based on driver/owner survey.
2/ The 1973 model year was not shown because there were no applicable bumperheight requirements.
3/ Each post-standard group was compared with the preceding post-standard groupto determine significance as follows:
* - significantly greater than percentage of preceding post-standard group
** - significantly less than percentage of preceding post-standard group
no symbol - percentages are not significantly different.
2-10

Effectiveness of Bumper Height Requirements
0 As a result of bumper height requirements there was a 12 percent increase
in the number of times bumpers made contact (matched) in multi-vehicle
collisions, compared to pre-standard cases.
0 Damage frequency and damage repair costs decreased as a result of more
"matched" collisions (see Chapter IV for details).
4.0 BUMPER COSTS
There are two kinds of costs which were determined:
° The complete cost of a bumper system for various make/model cars and,
0 The incremental cost--the difference between pre- and post-standard cars,
reflecting the actual cost to meet a particular bumper standard.
Table 11-6 shows the incremental costs. These include the sum of:
0 The incremental cost due to bumper weight changes.0 The discounted lifetime fuel costs due to bumper weight changes.
° The total secondary weight costs.0 The discounted lifetime fuel cost due to secondary weight.
2-11

4.1 Summary of Bumper Cost Findings
0 The 1979-80 bumper standards increased the cost of bumpers (front
and rear) by $150 to $200. This is the increase relative to
pre-standard bumper systems, and is based on secondary weight ratios
of between 0.35 and 0.75 (which adds $25 to $75, respectively, to
bumper costs).
° For the same parameters as above, the increased cost for front
(1979-80) bumpers is $80 to $110; rear, $65 to $90.
° The consumer costs, exclusive of added fuel consumed and secondary
weight, of 1979-1980 bumpers—front and rear—were $89 higher than
for pre-standard cars.
0 The heavier weight of 1979-1980 bumpers over pre-standard bumpers
results in the increased consumption of 43 gallons of fuel over the
life of a car, at a discounted cost penalty of $36.
(All values are discounted to 1979 dollars)
0 Bumper redesign for downsizing, including material substitution,
improved technology, etc., reduced both the weight and cost of
1979-80 systems when compared to 1974-78 bumpers, even though the
standard's requirements were more stringent in 1979-80.
2-12

TABLE II-6
TOTAL DISCOUNTED INCREMENTAL (LIFETIME) BUMPER COSTS*/(DISCOUNTED TO 1979 DOLLARS)
- At Indicated 1979 Secondary Weight Costs/lb. -
SecondaryWeightFactor
Front and Rear0.000.350.500.751.00
Front0.000.350.500.751.00
Rear0.000.350.500.751.00
1973 Bumper
$0.60/lb.$1
94122135155175
7192101115130
2331343945
System
.60/lb.
94139159191223
71104118142165
2335404958
1974-78 Bumper
$0.60/lb. $1
153194212241270
699099113128
84105114129144
System
.60/lb.
153219248295342
69102116140163
84118133157181
1979 Bumper
$0.60/lb.
125146155172184
69818694102
5665697682
System
$1.60/lb.
125158172199223
698897110124
5671788899
1980 BUMPER
$0.60/lb.
127148157174186
70828795103
5766707783
SYSTEM
$1.60/lb.
127160174201225
708999111125
57727989100
1/ The summation of: (1) the incremental cost due to bumper- weight changes; (2) the discounted lifetimefuel costs due to the weight changes; (3) the total secondary weight costs, and (4)- the discounted lifetimefuel cost due to secondary weight.

5.0 NET BENEFITS
When the actual costs associated with the bumper standard are subtracted from
the gross benefits due to the standard, the result is a net benefit or loss.
This is simply a measure, in dol lars, of whether, or to what degree, a
standard has paid for i t se l f— i . e . , is cost effect ive.
The findings ref lect values discounted to 1979 dol lars. Gross benefits are
based on the difference in damage repair cost between pre- and post-standard
cars involved in low-speed col l is ions. Details of both the methods used and
calculations are found in Chapter VI.
Table 11-7 l i s t s a complete set of net benefits for various secondary weight
ratios and for each version--1973 through 1979--of the bumper standard.
Although the actual cost of al l standards through the 1980 model year is shown
in Table I1-6 in the previous section, gross benefits could not be calculated
for that model year since insurance claim data—a necessary part of the gross
benefit calculation—was not available at the conclusion of the evaluation work,
5.1 Summary of Findings Related to Net Benefits
Net benefit (or loss) values are shown for secondary weight ratios 0.35, 0.50,
0.75 and 1.00 in addition to values when no secondary weight is considered.
The results are further divided by two values of cost per pound of secondary
weight. One at $0.60 per pound reflects the cost of adding material only,
2-14

TABLE II-7
DISCOUNTED NET BENEFITS(DISCOUNTED TO 1979 DOLLARS)
- At Indicated 1979 Secondary Weight Costs/lb. -
tn
SecondaryWeightFactor
Front and Rear0.000.350.500.751.00
Front0.000.350.500.751.00
Rear0.000.350.500.751.00
1973 Bumper
$0.60/lb
13-15-28-48-68
57362713-2
-43-51-54-59-65
System
$1.60/lb.
13-32-52-84-116
572410
-14-37
-43-55-60-69-78
1974-78
$0.60/lb
454
-14-43-73
593829150
-13-34-43-58-73
Bumper System
$1.60/lb.
45-21-50-97-144
592612
-12-35
-13-47-62-86-110
1979 Bumper
$0.60/lb.
276-3
-20-32
6149443628
-33-42-46-53-59
System
$1.60/lb
27-7
-22-47-71
614233206
-33-48-55-65-76
NOTE 1. Values may not add due to rounding.
NOTE 2. Values are point estimates, see Chapter IV for confidence intervals

the other at $1.60 per pound represents the cost per pound of total car
weight. Both are consumer costs in 1979 dollars.
Views on the existence and/or amount of secondary weight - the added weight
per strengthening affected vehicle systems and parts due to an added weight
to bumper systems - differ. This evaluation does not attempt to resolve the
issue, therefore net benefits (and losses) were calculated for a number of
secondary weight ratios.
In the following summary net benefit (and loss) values will be discussed, in
most cases based on a secondary weight ratio and cost per pound of 0.50 and
$0.60, respectively. The interpretation of results shown in Table 11-7 must be
tempered since these are "midpoint" values within larger confidence intervals.
Tables showing these intervals (or bounds) and a brief explanation of
interpretive procedures can be found in Chapter VI.
0 Front bumper systems have tended to be cost effective since bumper
standards were first met in 1973 model cars. The 1979 front bumper
system shows a definitive net benefit of $44 (basis is 0.5 secondary
weight ratio and $0.60 per pound of secondary weight.)
° Rear bumper systems are not, and have never been, cost effective since
the promulgation of the standards. They have consistently incurred net
losses, of between $43 to $54 (1973). The net loss for the 1979 bumper
systems is $46 (same basis as above). The rear bumper systems show
net losses even when no secondary weights are considered.
2-16

The combined front and rear results for post standard bumper systems
present a varied picture. Only the 1974-78 bumper systems show a
definitive net benefit, and that is limited to when no secondary weight is
included. The 1979 models tend toward a net benefit under similar
circumstances.
At a secondary weight ratio of 0.5 (and $0.60/lb.) the results begin to
shift and when secondary weight ratios of 0.75 or higher are used, the
combined front and rear post standard bumper systems tend toward, or show
a net loss.
The relatively positive results (net benefits) for front bumper systems may
stem from a number of conditions. One of these is the finding that the
damage frequency to the front ends of cars is between 25 and 50 percent
higher than to the rear ends. The damage reduction (and benefit) potential
is consequently higher for the front. This is borne out by the reduction
in damage frequencies for post-standard cars (compared to pre-standard
cars) which favored the front end over the rear by a factor of between 2
and 3 to one. Damage repair cost reductions for post-standard cars,
compared to pre-standard, show similar trends.
There is no evidence that downsizing-that is both the decrease in weight
or the substitution of materials had an effect on net benefits of bumper
systems. The improvement in front bumper net benefits, 1979 over
1974-78, is as high as 50 percent (0.5 secondary weight ratio) at the
same time that the weight of front bumper systems was reduced by 16 percent
(75 lbs. to 63 lbs.).
2-17

0 The weight reduction, 1974-78 to 1979-80, for rear bumper systems is 20
pounds, or 27 percent (75 lbs. to 55 lbs.) and net losses increased by 7
percent. While no direct cause-effect relationship can readily be
established, the re lat ively large weight reduction can be a contributing
factor, part icularly in l ight of damage frequency and repair cost findings
for the rear bumper systems on 1979-80 cars.
5.2 Additional Factors Affecting Net Benefits
° A previous assessment by the agency included estimates of consumer and
insurance (fewer claim settlements) savings resulting from bumper
standards.^/ A tota l of $51 in additional net benefits (1979 dollars)
was estimated for the front and rear bumper system. I t was not possible
to collect data to analyze and construct these secondary effects in this
evaluation. The results are neither verif ied nor disputed.
° Bumper damage is not always repaired which may reduce the value of a
car when i t is sold. The effect of such cases was calculated, assuming
that none of the damage in unreported coll isions was repaired. The
result could affect net benefits by an amount of $12 (1979 front and
rear bumpers combined) in net benefits.
1/ National Highway Traff ic Safety Administration, Final Assessment BumperStandard, DOT HS-804-718 (June 1 , 1979).
2-18

6.0 CONCLUSIONS
Front bumper systems have been effective in reducing property damage.
They generally show net benefits, particularly for the 1979 model cars.
The lack of damage reduction potential to parts and components in the rear
of a car lead to consistent net losses for rear bumper systems installed
to meet standard requirements. When results for the front and rear
systems are combined they tend toward a net benefit only when little or no
secondary weight is included; at secondary weight ratios of 0.50 and above
the results shift toward or show net losses.
0 The chance for rear bumper systems to achieve net benefits is \/ery
limited. Rear bumper systems for 1979-80 models weigh some 20 pounds less
than their 1974-78 predecessors, and 8 pounds less than their front
counterparts.
Downsizing through weight reduction and material substitution appeared to
have no effect on either the damage reducing capability or cost
effectiveness of front bumpers. It may have had a slight aggravating
effect on rear end protection.
2-19

While a series of secondary effects such as time and insurance cost
savings, the value of unrepaired damage, additional interest cost on car
loans due to added bumper costs, etc., can affect net benefits (or
losses), reliable data are difficult to obtain. Estimates, of such
effects, when available should be considered, as an adjunct to the
primary results.
The mix of the car fleet can be a significant factor affecting both
damage frequency and net benefits. How bumper systems fare when small
cars predominate would require assumptions beyond the scope of this
evaluation.
2-20

CHAPTER III
COLLECTING CRASH DAMAGE DATA
1.0 ESTABLISHING DATA REQUIREMENTS
1.1 Introduction
This chapter deals with the subject of collecting data on changes in damage
resistance and any resulting changes in repair costs. The next chapter presents
the findings of the analysis of this data. Changes in costs due to weight,
material, or other changes necessitated by the standard are covered in Chapter V.
Finally, Chapter VI compares the overall benefits derived from damage reduction
with the total costs of providing increased exterior protection and includes an
analysis of the standard's cost-effectiveness.
1.2 Measures of Effectiveness
An evaluation of the effectiveness of the bumper standard basically compares the
amount of crash damage to vehicles that were not required to comply with the
standard with the damage sustained by vehicles that had to comply with some
version of the standard. Such an analysis should also make comparisons between
•vehicles meeting different versions of the standard to determine i f one version
has been more effective in reducing damage than another. In making these
comparisons there are two quantities which measure the effectiveness of the
bumper standard—frequency of damage and extent of damage.
3-1

1.2.1 Frequency of Damage
The question of the probabil ity or frequency of damage is a ^jery important one
because this standard's principal goal is to reduce property damage in
low-speed col l is ions. I t is a two part question:
How many low-speed bumper-related accidents was a particular model year vehicle
involved in , and did any damage occur given that a bumper-involved accident
took place. The rat io of the number of low-speed bumper accidents in which
damage occurred, to the total number of low-speed bumper accidents, is the
probabil ity or frequency of damage. Given a population of low-speed coll isions
and assuming a similar distr ibution with respect to impact speed for both pre-
and post-standard cars, the changes in damage frequency wi l l ref lect the degree
of effectiveness of exterior protection provided on post-standard vehicles.
1.2.2 Extent of Damage
The second measure of effectiveness is the extent of damage in low-speed coll isions,
There are several ways to measure th i s : The number of damaged parts, the
number of damaged parts by degree of damage, and the cost to repair the
The "number of damaged parts" measurement is a simple count of how many bumper
and safety-related parts were damaged. Such a count is deficient in that i t
does not ref lect the severity of damage to the parts or the relat ive value of
the parts. For example, two vehicles may have the same number of parts damaged;
however, one vehicle may have a scratched or chipped headlamp while the other
may have a trunk l i d so deeply creased that i t w i l l not open. Clearly the
second vehicle's damage is much worse and w i l l be more costly to repair.
3-2

This deficiency can be corrected somewhat by including a qualitative determina-
tion of how severely a part is damaged. For example, damage might be
classified as being either major or minor or requiring either repair or
replacement. Such a measure, while an improvement over a simple count, is
difficult to use in making comparisons between benefits and costs of the
standard since it can only indicate shifts in the severity of damage to
individual parts and gives no single estimate of the overall change in the
extent of damage.
Using an estimate of the cost to repair damage eliminates many of the problems
of the other two measures. It is a single value reflecting the severity of
collisions involving damage to the bumper system and safety-related parts.
Comparisons can then be made between pre- and post-standard vehicles, and
vehicles meeting various versions of the standard, i.e., comparisons between
the benefits of the standard (the change in the cost to repair damage) and the
change in the cost of the bumper system.
1.2.3 Bumper Override and Underride
A second purpose of the bumper standard is to reduce the incidence of bumper
override and underride. Compliance tests, beginning with model year 1974,
required pendulum impacts within specified bumper height limits, the objective
being to standardize bumper heights on post-standard cars and thereby reduce
the incidence of bumper mismatch. The measure of whether or not the standard
has been effective in achieving this goal is the change in frequency of
3-3

mismatch between cars that did not have to pass the pendulum impact test (pre-
1974 models) and those that did (1974 and later models).
Given an incidence of bumper mismatch, the measures of effectiveness are
identical to those for low-speed accidents—frequency of damage and extent of
damage.
1.3 Low-Speed Collisions
The main focus of the bumper standard is on low-speed col l is ions. But what are
low-speed coll isions and how can they be identified? Only estimates of speed can
be obtained from drivers since most are not looking at their speedometers when
coll isions occur, and, even i f they are, car speedometers are often not
accurate.ty Therefore, i t is important to put l imits on what is considered a
low-speed co l l is ion. Two such bounds were put on the data collected—accidents
causing injuries were not included, and only vehicles that could be driven away
from the accident (non-towaways) were used.
V The accuracy range of most speedometers is within + 4 mph (49FR6404, January28, 1980). Such a range is considerable in l ight of the 5 mph or less compliancetesting speeds for the bumper standard.
3-4

There is little information at the local, State, or national level on the
number of accidents that occur at various speeds, especially the lower speeds.
Low-speed collisions often result in little or no damage and seldom is anyone
injured. This means that the police or insurance companies may not be noti-
fied and that the occurrence of the collision is not recorded.^/
In accident analysis the amount of damage is often used as a surrogate measure
of collision speed. Clearly such an approach is not feasible for the bumper
standard since extent of damage is a measure of effectiveness and is expected
to differ between different model year vehicles traveling at the same speed.
However, from the purely energy management design perspective, bumpers are
intended to be effective in preventing superficial vehicle damage. When the
collision speed exceeds a certain threshold, bumpers are not physically capable
of absorbing all the impact energy and the vehicle frame or other main body
structure or system is damaged. When this happens the auto usually cannot be
driven from the scene of the accident. Therefore, low-speed collisions would
not include vehicles that must be towed away after the accident.
2/ Police reports are only required when damage exceeds a certain dollaramount or when persons are injured. When the damage is below a driver'sdeductible for collision insurance (typically $100), an insurance claim maynot be filed. When no damage occurs as the result of a low-speed collision,there is generally no need to report the accident at all.
3-5

1.4. Required Data
The f i r s t requirement of a data source is that i t contain enough information to
identify an accident as being in the low-speed range. In other words, i t must
be ascertained whether any injuries occurred in an accident and i f the
vehicle(s) involved could be driven from the scene of the accident. For an
accident to be included in the evaluation of the bumper standard i t must cause
no injuries and the vehicle(s) involved must be driveable after the accident.
A second requirement is that a data source must include the model years of the
vehicles involved in these low-speed col l is ions. With model year data, vehicles
can be grouped as pre- or post-standard or by the version of the standard under
which they are covered ( i f any) so that comparative analyses can be made between
the groupings.
What other data elements can and need to be collected is highly dependent upon
the source used. However, the measures of effectiveness indicate, in general,
the types of data required. Basically the following data are needed:
o The number (frequency) of low-speed bumper coll isions included in the
data source,
o The probability of jiny damage, given that an accident of interest
occurs,
o The amount (extent) of damage to the bumper system and safety-related
parts protected by the bumper. Data needed to measure this include:
the number of parts damaged,
3-6

- the severity of damage to each part,
- dated repair estimates or b i l l s (the date is needed to account for
in f la t ion) ,
- an insurance claim, or
- a cost estimate of damage, obtained from information on the number of
parts damaged and the severity of damage.
o In a two-vehicle col l is ion, did the bumpers meet or did one bumper
override the other?
Data sources should be sought which provide information about the circumstances
of a col l is ion and the vehicles(s) involved. Such information can be used to
explore biases and to make comparisons within the data. Information of interest
includes:
o vehicle data--make, model, size, use and miles travelled annually;
o accident configuration—estimated impact speed, angle of co l l is ion,
and object struck;
o accident sett ing—traff ic conditions, location, and environmental
factors.
3-7

2.0 DATA SOURCES
2.1 Introduction
In earlier methodology development work,3/ no data sources were found that
could accurately estimate the total benefits of the bumper standard over the
life of a car. The main evaluation problem has been a lack of data describing
real-world low-speed collisions. Often these accidents involve little or no
damage and are never reported to the police or an insurer.
Consideration of the courses of action a vehicle owner might take after a
collision indicates possible sources of data on low-speed crash damage. If no
or slight damage occurs, the accident may never be reported to the police or an
insurance company. Only the occupants of the vehicles involved are likely to
know the details of the collision. If damage does occur, there are several
possibilities—the police may be notified, an insurance claim may be filed, both
may occur, or neither may occur. Regardless of whether or not the accident is
reported, the owner has the options of having the car repaired, repairing it
himself, or leaving the damage unrepaired.
£/ Two methodology studies for FMVSS 215 were prepared for the NationalHighway Traffic Safety Administration:o Stanford Research Institute, Evaluation Methodology for Federal Motor
Vehicle Safety Standards, Report No. DOT-HS-802-341 (May 1977).o Center for the Environment and Man, Final Design and Implementation Plan for
Evaluating the Effectiveness of FMVSS 215: Exterior Protection, Report No.DOT-HS-802-344 (May 1977):
3-8

The following potential sources of real-life data were identified during the
early work on methodology development for this and other motor vehicle safety
standards:fy
o Police accident reports
o State accident records
o National accident records
o Repair shop, garage and body shop records
o Auto parts sales and inventory records
o Towaway business records
o Inspection of automobiles in parking lots
o Insurance claim files
o Surveys of automobile owners or drivers
Each source's potential for providing the data needed to evaluate the bumper
standard will be discussed below.
2.1.1 Police Accident Reports
Police accident records include those accidents that are either investigated
by police departments or reported by drivers in accidents. Police officers
usually investigate injury accidents and those which involve extensive property
damage. Similarly, drivers involved in property damage accidents are usually
required to submit a report to the police when the estimated damage exceeds a
certain amount. The reporting threshold varies from State to State and is raised
V Ibid.

periodically to reflect inflation. This means that a low-speed collision with
only minor property damage is not likely to be investigated by a police officer
or reported by a driver.
Even if a report is filed, its focus is typically on the cause of the accident
rather than the damage that occurred. The main use of police reports is to
determine if any traffic violation was committed and to document evidence for
damage suits. In the case of low damage, non-personal injury collisions, even
the latter use is rare since generally the driver at fault has adequate insurance
to cover repair costs.
Due to their minor nature and limited usefulness to police departments, records
of low damage, non-injury accidents are rarely abstracted or compiled for
analytic purposes and are usually only held for a short time at local precincts.
While a study of local police accident records might indicate whether there has
been a shift in the distribution of crash damage away from bumper areas, the
numerous difficulties with these records make them an unusable source of data.
In summary, these problems include:
o Low damage accidents are generally not recorded.
o Due to differing reporting thresholds, the damage severity level of
recorded accidents varies among the States,
o Police records lack data on damage,
o Searching these records would be extremely time-consuming and expensive
since
3-10
- there are many police jurisdictions, each holding a low volume of
data, and
- the records are seldom abstracted or compiled.
o Records of minor damage, non-injury accidents are generally kept for only
a short time.
2.1.2 State Accident Records
State accident records are compiled from State and local police accident records.
As with the local police records, these files were considered for use in a study
of whether there has been a shift in the distribution of crash damage away from
bumper areas. The main advantages of State files over local police accident
records are that the former contain a much larger volume of data and have in many
cases been automated, making them much more accessible and useful. In addition,
the files often contain pre-standard vehicles which were involved in accidents
while they were still "young."
However, many of the problems mentioned in Section 2.1.1 on police accident
records are also problems here. Since State files are compiled from local police
files, many of the accidents the bumper standard is concerned with, i.e., low
speed collisions causing little or no damage, are again not available. A second
major problem is that these summary records lack detailed information on key
variables such as vehicle damage.
3-11

Information obtained on vehicle damage varies from State to State. Most States
l imi t their questions on damage to the location of damage and the dollar amount
to repair the damage (estimated by the driver involved or the police off icer
investigating the accident). Some States ask for a written description of the
damage. Some request that damage be classified on a severity scale. For
example, a respondent might be asked whether damage was "none," "minor,"
"moderate," "major," or t o t a l . " However, terms such as "minor" and "major" are
not defined for the respondent.
Two States, North Carolina and Texas, now use the Traff ic Accident Data (TAD)
vehicle damage scale.fy (Texas has used the TAD scale since 1971 and North
Carolina since 1973.) This scale defines damage severity through the use of
pictures of damaged vehicles. However, even this rating scale is not sensitive
enough to detect changes in the kind and amount of damage generally found in
low-speed col l is ions.
2.1.3 National Accident Records
The National Highway Traffic Safety Administration (NHTSA) presently maintains,
or has compiled in the past, several f i l es of data on accidents occurring
throughout the Nation. These f i les include only police-reported accidents. For
the most part, these national records contain data on accidents involving
fa ta l i t i e s , in jur ies, and towed vehicles. The problem with using such f i les to
fy National Safety Council, Vehicle Damage Severity for Traff ic AccidentInvestigators (2nd ed.)
3-12

evaluate the bumper standard is that the type of accident the standard is
concerned with, i . e . , low-speed col l is ions, seldom causes f a ta l i t i e s , in jur ies,
or enough damage to necessitate towing.
NHTSA f i l es include the Fatal Accident Reporting System (FARS), the
Multidisciplinary Data Accident Investigation (MDAI), the National Crash Severity
Study (NCSS), and the National Accident Sampling System (NASS). FARS is a case
f i l e of al l accidents involving at least one f a ta l i t y . The MDAI f i l e contains
primarily special or catastrophic accidents. This is an older f i l e , no longer
being updated. NCSS, now supplanted by NASS, is a limited sample of towaway
accidents. NASS is a potential source of data but has not yet been completely
inplemented. Eventually NASS wi l l include some low-speed non-towaway accidents;
however, at present, plans are to undersample these accidents. In order to use
data from NASS for evaluating the bumper standard, special in-depth studies of
front and rear end low-speed coll isions would have to be implemented into the
system.
2.1.4 Repair Shop Records
Repair shop, garage, and body shop records were considered as a possible source
of col l is ion damage and repair cost data. However, the problems with obtaining
useful data from this source were overwhelming. F i rs t , going through repair
records to separate bumper-related accident repairs from other accident and
non-accident repairs would be very time-consuming. The amount of order and
detail would vary from shop to shop. Second, the number of shops that would have
to be contacted to obtain an adequate sample size would be enormous.
3-13

Finding data on pre-standard vehicles would be particularly difficult since
repair records would generally only be available for recent years. A third
problem is that the records would not contain information on the circumstances of
the accident (speed, object struck, etc.)- Finally, the more severe accidents
would be overrepresented in these records since damage due to minor accidents
often goes unrepaired even if an insurance claim is filed.
2.1.5 Auto Parts Sales and Inventory Records
Automobile parts are sold in dealerships, automotive supply stores, department
stores, and service stations. Certain parts, e.g., lenses to taillights, are
model and model year specific. Analyzing the time trend of sales of such parts
in relation to parts not protected by the bumper standard could indicate an
effect of the standard.
This approach has little promise of success for the following reasons:
o Inventory policies often have more to do with when parts are reordered
than sales,
o Few parts are model/model year specific, and parts departments would not
generally have records identifying the vehicle for which a part was
purchased.
3-14

o Parts are sold for uses other than accident damage repair. For example,
some parts such as headlamps may need to be replaced as a result of
normal usage.
o No information on the circumstances of accidents can be obtained from
this source.
2.1.6 Towaway Service Records
An analysis of current towaway accidents was proposed^/ to determine i f
vehicles with post-standard bumpers had to be towed less often than pre-standard
cars. This approach uses the fact that some of the parts protected by the
standard (e.g. , the fue l , cooling, and propulsion systems) are necessary for the
operation of the vehicle. This data source was rejected since one of this
study's c r i te r ia for an accident to be classif ied as low-speed is that the car
involved can be driven from the scene of the accident (see Section 1.3 of Chapter
III).
2.1.7 Inspection of Automobiles in Parking Lots
Parking lot surveys of cars can provide information on unrepaired damage. This
is one possible method for finding out about damage in low-speed accidents, many
of which may never have been reported to the police or insurers.
Center for the Environment and Man, p. 2-2.
3-15
However, without considerable follow-up with vehicle owners, there would be no
way to know what caused the damage. If the damage was accident-related, did it
occur in one or several accidents and were these accidents reported? Such a
survey underrepresents the frequency of accident involvement since vehicles in
accidents causing no damage or for which damage has been repaired are not
included.^/
Since this method would require a follow-up contact with vehicle owners, it was
rejected in favor of a random survey of vehicle .owners and drivers, discussed in
Section 2.1.9.
2.1.8 Insurance Claims Files
Collision and liability are the two major forms of property damage insurance
coverage. Collision insurance provides protection for the insured driver who is
at fault by covering the damage to the insured driver's car. Liability insurance
protects the driver at fault by paying for damage to the other car. (Liability
claims are also made for personal injury, but such accidents are not included in
the definition of low-speed collisions for this evaluation.)
The other forms of automobile insurance include comprehensive, medical payments,
uninsured motorist, and no-fault. Comprehensive insurance covers fire, theft,
Jj These parking lot surveys were reviewed for potential use in selecting thesurvey methodology:
o S.J. Sterback and E. J. Rohn, Ford Motors Co., "1975 Model Extended Timein Service and Initial 1976 Model Bumper Effect on Ford Car AccidentDamage," May 19, 1977.
o General Motors," Passenger Vehicle Impact Damage Survey,"January 17, 1973.
3-16

and accidents where no one in particular is at fau l t . Medical payments are l ike
a l i a b i l i t y insurance for in jur ies. I t pays for the injuries to the insured
driver and his or her passengers. Uninsured motorist coverage is for situations
where the other driver is at fault but has no l i a b i l i t y insurance. Recently,
several States have enacted laws requiring no-fault insurance. This form of
insurance combines co l l is ion, l i a b i l i t y , medical payments, and uninsured
motorists into one type of insurance. The insurance company of each insured
driver pays for al l property damage to the driver's car and injuries to occupants
of that car.
Potentially the bumper standard could have several effects on automobile
insurance since insurance claims are essentially a surrogate measure of property
damage. I f the standard reduces the freqency of damage in low-speed
bumper-involved col l is ions, there should be fewer property damage claims
involving bumpers of post-standard cars than there are for pre-standard cars.
The average amount of these claims should also be lower for post-standard
vehicles (once adjusted for inf lat ion) i f the standard is effect ive. These two
effects could produce a th i rd one, namely, lower insurance premiums for
post-standard vehicle owners.
Simple s tat is t ica l analysis techniques are available to handle comparisons of
claim frequency and average claim cost. However, a method for measuring changes
in insurance premiums caused by the implementation of the bumper standard could
not be found. Even though discounts were given by some insurance companies,
there is no way of knowing i f the discounted amount was actually realized by the
insurance companies, i f other forms of insurance cost more, or i f drivers of
older cars actually paid more to compensate for the new car discounts. In
addition, the effect of inf lat ion distorts any study of the effect of the
standard on premiums.3-17

There are mill ions of insurance claims processed by automobile insurance
companies each year and the cost of manually screening insurance claim f i les is
time-consuming and expensive. Fortunately, two computerized insurance f i les are
presently available—State Farm and the Highway Loss Data Inst i tute (HLDI)
f i l e s .
State Farm Insurance Company maintains a detailed data f i l e of a sample of claims
made at i ts drive-in claim centers throughout the country. The f i l e contains
data for claims on both pre-standard (1969-1972) and post-standard (1973-present)
vehicles. Both col l is ion and l i a b i l i t y claim data are included. Coded, raw data
are available in addition to summary data.
The computerized HLDI f i l es contain data from many major insurance companies
including State Farm. No l i a b i l i t y or pre-1972 claim data are available on these
f i l e s . The level of data s t ra t i f ica t ion possible with the State Farm base is not
obtainable from this source.
There are several d i f f i cu l t ies with using these two f i l e s :
o No adequate description of the crash environment can be retrieved from the
insurance data base. Therefore, damage i t se l f becomes, in effect, a surrogate
measure of the accident impact speed. This is a problem since frequency and
extent of damage are measures of effectiveness of the standard. Thus, there is
a danger that the effectiveness of the standard w i l l be underestimated. I f the
post-standard bumper is effective, then damage sustained by a pre-standard car
in a low-speed col l is ion should be comparable to that sustained by a
post-standard car in a higher speed co l l is ion.
3-18

o Any sample of insurance claims wi l l not be representative of the entire
accident population. Unreported accidents are obviously not included, and
low-cost claims are less frequent because of the deductible amount.
o Two d is t inc t ly different kinds of insurance policies—coll ision and property
damage l iabi l i ty—deal with vehicle damage. The f i r s t is limited to damage to
the insured vehicle (and also to damage to other vehicles driven by the
insured); the second covers al l property damage of third parties. Collision
claims tend to be higher than property damage l i a b i l i t y claims since col l is ion
insurance often has a deductible amount which the policy holder must pay.
Another reason for higher col l is ion claims is that they tend to be for the
more severe single car accidents, whereas l i a b i l i t y cases include a
preponderance of rear end accidents. These and other differences between
l i a b i l i t y and col l is ion insurance need to be reconciled in order to combine
the two types.
o Accidents outside the scope of this evaluation ( i . e . , side col l is ions,
rollovers, towaways, injury-causing accidents) are included in the f i l e s .
o Strat i f icat ion of data within the f i l es dictate what analyses can be
performed. HLDI data, for instance, is not s t ra t i f ied by impact point. Thus,
this confounding variable could not be analyzed using the HLDI f i l e .
o Although representative claim data exist in the HLDI f i l es beginning in
mid-1972, adequate claim data are not available for the years before 1972.
Thus, analysis of pre-standard col l is ion claims would be severely limited i f
the HLDI file was used exclusively.3-19

o The State Farm file contains data for only one insurance company and therefore
may not be representative of the insurance industry.
Most of these problems appear to be solvable if both of the computerized
insurance data sources are used and data is collected on accidents for which no
insurance claim is made. The State Farm file contains the detailed data needed
to evaluate bumper effectiveness, historical data predating the bumper standard,
and both collision and liability claim data. The HLDI data can be used for
comparisons at an aggregate level with State Farm summaries to determine the
extent to which the State Farm data represents the insurance industry.
2.1.9 Surveys of Automobile Drivers
This approach involves soliciting information directly from the public using
established sampling techniques. Since the principal driver is the person most
likely to know of minor collisions, he or she is potentially the best source of
data on low-speed, unreported accidents. Drivers can be questioned about any
low-speed collisions their cars were involved in, and the damage, if any,
sustained. In addition, data can be obtained on the car itself, the use of the
car, and the circumstances of any collisions.
There are two potential problems with public surveys. One is the willingness of
individuals to participate and the other is the accuracy of the information they
provide. Both difficulties can be lessened through appropriate selection of a
survey method or combination of methods. Basically, three survey methods are
available—in-person, telephone, and mail (self-administered). Each method has
advantages and disadvantages.
3-20
The mail or self-administered approach is the least expensive method of the
three. Either randomly selected households or households owning a randomly
selected registered vehicle can be mailed a questionnaire. {However, current
vehicle registration data is difficult to obtain.) Use of the mail is a slow
process usually yielding a low return rate even with considerable follow-up.
This approach relies on the ability of participants to accurately complete a
questionnaire without an interviewer's assistance. The advantage of the method
is that participants have records and other household members available for
consultation in answering the questionnaire.
Surveying drivers in person has the appeal of being able to observe the
automobile while questioning the driver. This method does not have to rely on a
participant's ability to estimate extent of damage as the mail and telephone
surveys do since the interviewer would presumably be trained to make these
estimates. However, people may be reluctant, to spend time being questioned
unless they are forewarned about the interview. Depending on where the interview
is held (e.g., parking lot, service station, state inspection center), the
participant may or may not have access to household records or family members to
help fill in data gaps. Assuring that a sample is random and representative is
also a problem in doing in-person interviews at certain locations. Finally,
face-to-face surveys are expensive.
The telephone method has the advantage of immediate feedback from drivers.
Participants at home generally have access to records and others in the household
to help recall the details of an accident. People often feel less threatened
answering questions over the phone than in person and thus are generally more
3-21

willing to participate and more candid in their answers. As in the mail
survey,telephone surveys have to rely on the participant for estimates of damage,
a determination that the participant may not have the technical background to
make.
A telephone survey assumes that a random selection of households with phones will
also result in a random and representative selection of automobiles. The problem
with this assumption is that a household may not have a phone but may have a car
and that these "phoneless" households may also have older model year vehicles.
The National Housing Survey done in 1975 showed that overall, more than 80
percent of all U.S. households had at least one car. The percent of households
with cars ranged from a little less than 50 percent for low income families to
100 percent for upper income families.^/ In contrast, almost 90 percent of all
households had a telephone in 1978. Breaking this down by income, 70 percent of
low income families and almost 100 percent of higher income families had
phones.jty This means that for all households there is a greater likelihood
that there will be a telephone than there will be an automobile (70 percent of
the low income families had a phone, but only 50 percent had cars). Therefore
one can assume that few households having a car, but no phone, will be missed by
the telephone survey.
fy U.S. Departments of Commerce and Housing and Urban Development, AnnualHousing Survey: 1975, Part C; Financial Characteristics of the HousingInvestory, Current Housing Reports, Series H-150-75C (Washington, D.C.:Government Printing Office, 1975), p.3.
9/ Owen T. Thornberry and James P. Massey, "Correcting for Undercoverage BiasTn Random Digit Dialed National Health Surveys," American Stat i st i c al AssociationProceedings of the Section on Survey Research MetTiods, 19/8, pp. 224-229.
3-22

For both the in-person and telephone methods, having someone administering the
survey can be helpful in obtaining more accurate data. A trained survey-taker
can ask questions that will help a participant remember dates and events. Such
questions would not normally be asked on a mail-out survey.
Combinations of survey techniques can also improve survey response and accuracy.
For example, follow-up to any of the survey methods might include a phone call, a
post card, or a visit.
2.2 Selection of Data Sources
Two different data sources were selected for use in the evaluation of the bumper
standard. The two chosen were: insurance claim files and the survey of vehicle
drivers. In Section 2.1 the advantages and disadvantages of these two data bases
were discussed in detail along with those of other potential sources of low-speed
collision data.
Specifically, the computerized State Farm Insurance Company file was selected as
the primary source of insurance data. The State Farm file contains the detailed
data needed to evaluate bumper effectiveness9 historical data predating the
bumper standard, and both collision and liability claim data. Statistical
analysis techniques are available to handle comparisons of claim frequency and
average claim cost, the two measures of effectiveness.
3-23

An additional source of insurance claim data—the Highway Loss Data Institute
(HLDI) file—was also used as a check on whether the State Farm data was
representative of the insurance industry as a whole. The HLDI file contains data
from many major insurance companies including State Farm. Its availability
enabled comparisons to be made at an aggregate level with State Farm summaries.
The primary deficiency of the insurance claims analysis is the bias introduced by
unreported damage loss. To determine the magnitude of this bias, a second source
of data was needed. Of the sources of data on low-speed unreported collisions
described in Section 2.1, the survey of automobile drivers was the most direct
and fruitful method of obtaining this information. Since the principal driver is
the person most likely to know of minor collisions, he or she is potentially the
best source of data on low-speed unreported incidents.
A combination of survey techniques was chosen. The principal data collection
effort was the household telephone survey. This method held the most promise of
obtaining a good response rate in a timely fashion. One advantage of a household
telephone survey is that respondents are at home where records and other family
members are generally available to help fill in any data gaps.
Another consideration in doing a driver survey was that drivers might not have
the technical background or experience to accurately access the extent of damage.
To overcome this problem a portion of the surveys were taken in-person to
spot-check the accuracy of participants' responses.
3-24

3.0 DATA SOURCES USED IN STUDY
3.1 Driver Survey
One component of the data collection process was a survey of car owners and
drivers. The purpose of this survey was to obtain data on unreported, low-speed
collisions. The survey, conducted under contract,10/ included three phases:
design phase, pilot survey, and national survey. Each phase is briefly described
in the following paragraphs.
During the design phase a work plan, survey instruments, procedures, and manuals
to be used and tested during the pilot survey were developed. Work began on these
documents in October 1978. In March 1979, the Office of Management and Budget!!/
approved the survey design, clearing the way to begin the pilot survey.
Information for Section 3.1 was taken from a report prepared for theNational Highway Traffic Safety Administration for use in this evaluation:West at, Inc., Driver Survey on Unreported and Low-Damage Accidents InvolvingBumpers: Final Report, Report No. D0T-HS-805-838"lMayT9S^
11/ All Federal surveys of the public involving more than nine individualsmust be reviewed by the Office of Management and Budget to assure that the summaryis necessary and minimizes the burden placed on the public in responding to thesurvey.
3-25

The pilot survey was run for six months (mid-March through early September 1979)
in Montgomery County, Maryland. Approximately 1,100 county households were
contacted through a random digit telephone dialing system. One or two months
after the initial interview, about 800 of these households were contacted again.
Of these, follow-up contacts, 20 percent were in person and 80 percent were by
phone. 12/
The purposes of the pilot survey were to detect possible problems with survey
instruments and procedures and to obtain estimates on the number of households
that would need to be contacted to obtain a nationally representative sample.
Drawing upon experience and estimates gained from the pilot survey, the national
survey was conducted.
Between September 1979 and June 1980, 10,326 households throughout the nation
were contacted. Approximately half of these households were recontacted about
two months after the first interview. Of the follow-up contacts, 90 percent were
by phone and 10 percent were in person.
The following subsections describe the design of the national survey.
For a more detailed description of the procedures used and resultsobtained in the pilot consult: Westat, Inc., Drivers Survey on Unreported andLow-Damage Accidents Involving Bumpers: Final Report - Pilot Study,(September 1979).
3-26

3.1.1 Survey Overview
The nationwide driver survey was conducted under a design which would yield a
statistically valid sample of unreported, low-speed collisions. Basically, there
were three problems in obtaining such a sample. First, since the low-speed
incidents of interest were relatively minor, they might be difficultto remember.
Second, due to the low incident rate of these accidents, considerable screening
of respondents would be necessary to obtain information on incidents of interest.
Third, respondents might not be able to report accurately about vehicle damage
due to diminished recall or because they did not have the technical background to
describe the extent of damage accurately. Each of these problems had to be dealt
with in the survey design.
The survey plan that was developed overcame the problems identified above in the
following manner. The plan allowed for estimating response bias due to memory
recall. Information was collected on incidents occurring during a six month
retrospective period at the time of original contact and again at the end of a
bounded prospective follow-up period. The follow-up data collection provided
statistics for measuring the recall bias during the six month retrospective
period.
To contact the number of households needed to obtain the desired number of
incidents and still stay within a reasonable cost, a random digit dialing
telephone survey methodology was employed. However, some households were visited
in person and the cars used by household members inspected. The in-person
3-27

interviews and car inspections were used to verify the accuracy of the
information collected during the initial contact and the follow-up interview.
3.1.2 Survey Design
In order to locate households, a random digit dialing procedure was used.1.3/
While this technique excludes households without phones from the sample, the
sampling bias introduced was not expected to be important. Households without
telephones are more likely to have lower incomes, and are, therefore, more likely
to have older vehicles. However, this difference does not introduce a bias in
measuring bumper effectiveness since bumper system performance should be
independent of household characteristics.
After ascertaining that a household had at least one car and one licensed driver,
a screening questionnaire was used to obtain basic information about the
household vehicles (e.g., make, model, year, mileage in last six months). Next,
data was collected from each principal driver (i.e., the person who drove the car
most of the time) on whether a low-speed collision to the front or rear of a car
had occurred during the preceding six months. If such a collision had taken
place, households were asked whether the incident had been reported to the police
or an insurance company and if the car could be driven after the accident.
13/ This time and cost-saving method of obtaining a random national samplereduces the number of calls needed to reach a working residential phone number,whether or not it is listed in the phone book. This method is fully described inthe Westat final report (footnote 7).
3-28

If the low-speed collision was not reported to the police or an insurance company
and the car was driveable after the accident, an interview was conducted with the
person knowing the most about the incident. In the main interview, data was
collected on the characteristics of the incident (i.e., object contacted,
location of contact, speed, place), the amount of damage to property and/or
people, and the exposure of the car (i.e., type of driving) .11/
Upon completion of the screener or main questionnaire, the respondent was asked
to participate during the two month follow-up period. Immediately following the
initial contact, respondents were sent a log in which they could record data on
incidents if they occurred during the follow-up period. In addition, about one
month after the initial contact, participating households were sent a postcard
reminder. For the follow-up period interviews, about 90 percent of the
respondents were recontacted by telephone and the remainder were visited in
person at which time vehicle inspections were conducted. The in»person vehicle
inspection provided visual verification of information collected during the
initial telephone interview, i.e., the presence or absence of damage to the car
under study. Questions asked during the follow-up paralleled those asked during
the initial interview.
M / Copies of the questionnaires used are available in the Westat finalreport, pp. D-41 through D-81 (footnote 7).
3-29

3.1.3 Representativeness of Sample
The 6,996 households that were eligible in the main survey (i.e., those having at
least one licensed driver and one vehicle) and willing to participate in the
national survey had over 12,000 passenger cars. Table III-l shows the breakdown
of these vehicles by the model year groupings which coincide with the different
versions of the bumper standard. (AH additional 3,277 households with 2,854 1979
and 1980 model year cars were subsequently contacted in the summer of 1980)
TABLE III-l
NUMBER OF SURVEYED VEHICLES BY MODEL YEAR
MODEL YEAR GROUPING NUMBER OF CARS
Pre-1973 4,156
1973 1,041
1974-78 5,624
1979-80 1,227
TOTAL 12,048
Because the initial phone interviews took several months to accomplish, the
actual time span of the survey was about ten months, May 1979 to February 1980.
Over this time span, older cars were scrapped and new 1979 and 1980 models were
purchased. In addition, cars of all ages were bought and sold. Therefore, the
model year mix was continually changing over the survey period. Table III-l
3-30

includes any cars owned by the surveyed households during an eight-month
period—the six months prior to and the two months following the initial phone
interview. These vehicles were not necessarily held the entire eight months.
As a check on whether a representative sample of the Nation's automobiles had
been obtained, the survey's model year mix data was compared with U.S. vehicle
registration data. From the 1980 Market Data Book Issue of Automotive
News, U.S. automobile registration data as of July 1, 1979 and new car sales
data through December 1979 were obtained.11./ To arrive at the model year
mix for 1979, the registration data was adjusted with the 1979 new car sales
data. Table 111—2 compares the survey data with the adjusted national
automobile registration data.
TABLE II1-2
MODEL YEAR DISTRIBUTION OF PASSENGER CARS
MODEL YEAR GROUPING PERCENT SURVEYED PERCENT REGISTERED
Pre-1973
1973
1974-78
1979-80
34.8
8.6
46.9
9.7
38.3
9.2
42.7
9.8
— Automotive News: 1980 Market Data Book Issue, April 30s 1980, p.12(new car sales data) and p. 22 (registratiorT^ataT
3-31

The survey and national distributions are very similar with differences appearing
as expected. The survey distribution has fewer older cars and more late model
cars than the national distribution does. This was expected since the survey is
based on a more current time period. The percentages of 1979 cars are quite
close because both sets of data were based on essentially the same time period.
From the comparison of the two distributions, the model year distribution of cars
surveyed adequately represents the national distribution.
Another test of the representativeness of the survey was done using 1977 national
driver license dataM/ and 1977 national housing data on the average number
of cars per household.iZ/ The comparisons are shown in Table III-3. The
survey found fewer drivers and more cars per household than the national data
shows. Considering the age of the national data, the comparisons indicate that
the survey data describes the Nation's population of licensed drivers and cars
fairly wel1.
TABLE 111-3
AVERAGE NUMBER OF CARS AND LICENSED DRIVERS PER HOUSEHOLD
SURVEY DATA NATIONAL ESTIMATES
Drivers 1.76 1.82
Cars 1.41 1.34
16/ 1977 driver license totals compiled by the Federal HighwayAdministration
]JJ U.S. Departments of Commerce and Housing and Urban Development, AnnualHousing Survey: 1977, Part A: General Housing Characteristics, Current HousingReports, Series H-150-77 (Washirfgtcin, D.C.: Government Printing Office, 1977),p.8.
3-32

3.1.3 Eligible Incidents
The 12,000 cars surveyed were involved in 1483 low-speed front or rear collisionsduring the six month recall period before the survey and the two month follow-upperiod. Table 111-4 shows the distribution of these collisions by reason forineligibility and by model year groups.
TABLE 111-4DISTRIBUTION OF LOW-SPEED INCIDENTS BY MODEL YEAR AND
REASON FOR INELIGIBILITY
MODEL YEAR GROUP
Pre-1973
1973
1974-78
1979-80
TOTAL
INSURANCECLAIMED(%)
30
32
32
29
31
POLICE REPORTED,NO INSURANCE CLAIM
(%)
10
4
7
4
7
VEHICLEUNDRIVABLE,UNREPORTED(%)
1
1
0
0
1
UNREPORTEDELIGIBLE
\'o)
59
62
60
66
61
As shown in Table 111-4, approximately 61 percent of the screened low-speed collisions
involving the front or rear of a vehicle were eligible for the survey, i.e., 61 percent
were not reported to the police or an insurance company, and the cars involved could be
driven after the accident. Claims were made to an insurance company for about 31
percent of the low-speed collisions. Thus, about 92 percent of the screened incidents
were eligible for inclusion in either the survey or in the analysis of insurance claims
(Section 3.2).
3-33

3.1.5 Incident Rates
The rate of incidents reported in the national study was found to be much
lower than the rate experienced in Montgomery County, Maryland, during the
pilot test. During the recall period, the unreported incident rate was an
average of 0.012 collisions per car per month. The follow-up survey came up
with an unreported incident rate of 0.010 collisions per car per month.
Each of the two phases of data collection, retrospective vs. follow-up, has
its strong and weak points as far as its usefulness in making estimates of
incidence rates. The follow-up data will not have the memory bias of the
retrospective data, but it will have a relatively higher variance because of
the shorter collection period (2 months). The retrospective data, while
biased by drivers' inability to remember low-speed collisions, will have a
small variance because of a longer collection period (6 months). Using a
procedure which adjusts the data for bias by combining the recall and
follow-up estimates (see Appendix A for a description of this procedure), the
monthly rate for unreported, low-speed collisions was estimated to be 0.0114
incidents/car-month. Thus, approximately 13.7 percent of all cars-on-the-road
are involved in a low-speed unreported accident each year.18/
18/ The parking lot surveys (footnote 7/) estimated 3.63 to 4.18 lifetimeaccidents per car. The driver survey sTTowed that 22 percent of cars on the roadwere involved in low speed front or rear bumper accidents each year. Over a tenyear car life this would be 2.2 collisions per car. The parking lot surveysincluded more than front and rear collisions whereas the driver survey was a partialslice in time and did not include seasonal and year-to-year variations. No precisemeasure of lifetime accidents - reported and unreported currently exists, but thedriver survey incident rate can be considered a conservative estimate.
3-34

the frequency of damage to cars in unreported, low-speed collisions in a comparison
of pre-standard (pre-1973) cars with all post-standard cars (1973 and later).
Granted the data will need to be stratified further (e.g., pre-1973 cars vs. 1974-78
cars) to compare versions of the standard; however, these subgroups are too small to
base the design on at the level of precision desired.
To calculate what percent change in damage frequency could be detected, assumptions
had to be made about the frequency of unreported low-speed collisions, household
characteristics, participation rates, and the probability of obtaining a working
residential number. Pilot study results were used to estimate these parameters.
The following estimates were obtained from the pilot study:
o Frequency of unreported low-speed accident involvement - 2.4-3.6
percent/car-month
o Average number of cars/household = 1.55
o Households having both a car and a licensed driver = 88.6 percent
o Households willing to participate = 79 percent
o Percent of dialed phone numbers that are working residential numbers
- 63 percent
3-35

3.1.6 Sample Size and Survey Assumptions
The f i r s t question to be answered in determining sample size is what wi l l the data
be used for. Basically, the survey data wi l l be used to detect any difference in
A budgetary restraint set the upper l imi t on the number of households to be
contacted at 11,000. Working from this number, the number of unreported low-speed
involvements that could be investigated was found using the lower estimate of the
frequency of unreported low-speed accidents (2,4 percent/car-month):
Telephone Attempts = 17,460
Residences Contacted (63 percent) = 11,000
Residences Participating (79 percent) = 8,690
Residences with Car and Driver (88.6 percent) = 7,700
Number of Vehicles (1.55 per residence) = 11,935
Unreported, Low-Speed Involvements (2.4 percent per month for 8 months)
= 2,290
The difference in damage frequency (between pre-and post-standard cars) that could
be detected with this sample of unreported low-speed involvements was calculated
using the procedure for detecting a difference between proportions ( ot. = 0.05
= 0.10).19/ The calculation showed that at least a seven percent difference
could be detected.
In the national survey, 16,483 telephone attempts were actually made with 10,326
residences contacted. There were 6,996 el igible households ( i . e . , households having
both a car and a driver) among the 8,759 residences that were wi l l ing to
participate. An additional 3,277 el ig ible households with 2,854 1979 and 1980 model
year cars were subsequently contacts in the summer of 1980.
19/ A description of this procedure and the calculations of the percent changethat could be detected are available in Appendix B.
3-36

3.2 Description of Insurance Claim Analysis
Insurance claim files were the second source of data used in the analysis of
the effectiveness of the bumper standard.20/ Basically, two measures were
used to determine from the insurance data if the standard is effective. The
two measures, frequency of bumper-related insurance claims and average bumper
claim amount, were computed and compared for the various versions of the
standard to determine if their values differed significantly.
3.2.1 Measures of Effectiveness
Potentially the bumper standard could have several effects on automobile
insurance. If the bumper standard reduces the frequency of damage in
low-speed collisions, there should be fewer collision and property damage
bumper-involved claims, and the average amount of claims should be lower for
vehicles covered by the standard. These two effects should produce a third
one, namely, lower insurance premiums for post-standard car owners. In fact,
several insurance companies, beginning in 1973, gave their new car owners a
reduced premium in the form of a discount on the cost of collision coverage.
Therefore, analyses of changes in three measures might be useful: (1) the
number of bumper-involved collision and property damage liability claims; (2)
the average bumper-involved claim cost; and (3) insurance premiums. These
changes can be
Information for Section 3.2 was taken from a report prepared for theNational Highway Traffic Safety Administration for use in this evaluation: KLDAssociates, Inc., Analysis of Insurance Claims to Determine Bumper Effect on CrashDamage, Report No. DOT-HS-805-842 and 843 (March 1980).
3-37

measured by comparing vehicles made before any bumper standard was in effect with
those produced after the standard was required. Also, changes should be measured
between model year cars which correspond to the different versions of the bumper
standard.
Methods of measuring differences in claim frequency and average claim costs were
available, but no method for measuring insurance premimurn changes, related to the
implementation of the bumper standard, could be found. Even though discounts were
given by some insurance companies, there is no way of knowing if the discounted
amount was actually realized by the insurance companies, if other forms of insurance
cost more, or if drivers of older cars actually paid more to compensate for the new
car discounts. In addition, the effect of inflation distorts any study of the
effect of the standard on premiums.
3.2.2 Types of Insurance Coverage
The types of insurance and their applicability were previously described in section
2.1.8. This includes collision, liability, medical payments and no fault
provisions. To simplify the data collection process while obtaining the largest
number of cases possible, the two major types of automobile insurance covering crash
damage, collision and liability, were selected for study. Other forms of insurance
could be eliminated because they involve relatively few or no claims for vehicle
crash damage, the focus of the standard.
3-38

3.2.3 Sources of Insurance Data
Because there are millions of insurance claims processed by auto insurance companies
each year and the cost of manually screening insurance claim files is time-consuming
and expensive, only automated insurance data sources were considered. Two such
sources of insurance data, the Highway Loss Data Institute (HLDI) files and the
State Farm Insurance Company files, were found to be useful.
State Farm Insurance Company maintains a detailed data file of a sample of claims
made at its drive-in claim centers throughout the country. The file contains data
for claims on both pre-standard (1969-1972) and post-standard (1973-present)
vehicles. Both collision and liability claim data are included. Coded raw data is
available in addition to summary data.
The computerized HLDI files contain data from many major insurance companies
including State Farm. No liability or pre-1972 claim data are available on these
files. The level of data stratification possible with the State Farm base is not
obtainable from this source.
The State Farm file was selected because it contained the detailed data needed to
evaluate bumper effectiveness, historical data predating the bumper standard, and
both collision and liability claim data. The HLDI data was compared at an aggregate
level with State Farm summaries to determine the extent to which the State Farm data
represents the insurance industry.
3-39

3.2.4 Description of State Farm Files
All pre-standard data (pre-1973 model year vehicles) were taken from a State Farm
tape containing 1969 to 1972 model year vehicles, for which claims were made in the
first quarter of 1972. This al1-model-year tape contained about 33,000 claims. All
1972 vehicles that already met the bumper standard (mostly, General Motors full size
cars) were eliminated.
Post-standard data (1973 and later model vehicles) were found on two groups of
tapes. One group included only current model year vehicles and accidents (i.e., the
1974 calendar year tape contained 1974 model cars involved in collisions in 1974)
and covered calendar years 1973 to 1978. The number of claims per model year tape
ranged from 9,000 to 20,000. The second group of tapes having post-standard data
contained all claims made in a particular calendar year for all vehicle model years.
Tapes in this format were available beginning with the 1976 calendar year.
The data on State Farm tapes is restricted to the following reported claims:
o Only passenger cars
o Only damaged vehicles that were repairable (no "totaled"
vehicles). Generally, damaged vehicles were driven to and
inspected by local State Farm agents,
o Only collision and property damage accidents.
3-40

3.2.5 Stratification of the Data Base
Stratifications of the data (and thus the analyses that could be performed) were
dictated by the State Farm Data tape format and contents. The following
stratifications were used at some point in the analyses:
o Model Year
- Pre-1973 Model Years (vehicles not required to meet any
bumper standards)
- 1973 Model Year (vehicles subject to the first version
of FMVSS No. 215)
- 1974 Model Year (a transition year which was analyzed
both separately and in combination with 1975-78 model years)
- 1975-78 Model Years (most vehicles had to meet all the bumper standard
requirements)
o Age of Car
- One-year-old vehicles (the main focus of the analysis)
- Three-year-old vehicles
o Impact Points
- Front
- Front Corner
- Rear
- Rear Corner
3-41

o Market Class (defined by Wheelbase, WB)
- Subcompact (WB £ 101 inches)
- Compact (101" < WB < 111")
- Intermediate (111" < WB £ 120")
- Ful l -Size (WB > 120")
o Bumper Damage
- Repaired
- Replaced
o Object Struck
- Fixed
- Moving
o Type of coverage
- Collision, deductible less than $100
- Collision, deductible greater than or equal to $100
- Liability
o Manufacturer
- General Motors
- Ford
- Chrysler
- All others
o Bumper Type
- Steel
- Aluminum
- Soft-face (hybrid)
3-42

o Manufacturer
- General Motors
- Ford
- Chrysler
- All others
o Bumper Type
- Steel
- Aluminum
- Soft-face (hybrid)
o Parts Damaged
- Front head lamp
- Tai l lamp
- Hood
- Trunk
- Front quarter panel
- Rear quarter panel
4.0 USE OF THE DATA
The driver survey and insurance claim data will be used in the following
chapter to determine how effective the bumper standard has been in
reducing the frequency and extent of crash damage in low-speed collisions
and the frequency of bumper mismatch. Subsequently, in Chapter VI, the
gross lifetime benefits attributable to the standard will be compared
with the standard's incremental lifetime costs to determine if the
standard is "cost-effective," i.e., did the standard "pay for itself?"
3-43

CHAPTER IV
BUMPER STANDARD EFFECTIVENESS
1.0 INTRODUCTION
This chapter presents the results of the drivers survey on unreported,
low-speed collisions and the analysis of insurance claims. Three measures of
bumper effectiveness are analyzed:
o Damage frequency
o Extent of damage
o Bumper mismatch frequency
Damage frequency is the percent of cars, on the road, damaged in low-speed
collisions. A car was classified as "damaged" if one or more exterior parts
in the front or rear was damaged. As discussed in Chapter III, the change in
damage frequency between pre-and post-standard cars reflects the degree of
effectiveness of exterior protection provided by bumpers on post-standard
vehicles. (In this report, cars manufactured prior to the bumper standard
are designated "pre-standard" and those made after the various standard
requirements were effective, beginning with model year 1973, are referred to
as "post-standard.")
Damage frequencies were computed using driver survey data on unreported,
low-speed collisions. Damage frequencies for all post-standard cars were
first compared with pre-standard cars. Then the damage frequencies for cars
covered by various versions of the standard were compared with each other
4-1

to evaluate differences in the effectiveness of the various versions of the
bumper standard. The damage frequency analysis was further refined by
separately comparing respective front and rear damage frequencies of
pre-standard vehicles with post-standard frequencies.
The extent of damage for pre- and post-standard cars is another basis for
evaluating bumper effectiveness. The damage amount, or extent, was measured
using both driver survey data and insurance claim data. For each data source
several measures were obtained, as follows:
Driver Survey
o Number of parts damaged per car
o Number of parts damaged by severity of damage
o Repair costs of damage in unreported, low-speed collisions
Insurance Claims
o The annual number of property damage insurance claims per insured
vehicle
o The annual number of bumper-involved property damage insurance
claims per insured vehicle
o Repair costs for front and rear damage
o Repairs costs of damage to specific parts covered by the bumper
standard
4-2

Since accident risk is directly associated with automobile use, the more miles
a car is driven, the greater the chance of an accident. Insurance claims for
cars of similar age were used in this analysis to minimize differences in
vehicle use (exposure). This assumes that eyery car model in its first year
is driven the same number of miles. However, a one-year-old 1972 model car
may well have a different mileage history compared to a one-year-old 1979
model, due to changes in car usage since 1972. Mileage may also vary with
vehicle size.
Insurance claim data were analyzed (number of claims) to determine the effect,
if any, of vehicle use in different calendar years, and for different vehicle
sizes. The annual miles driven by the average car (of all ages) for calendar
years 1972 through 1977 were obtained by vehicle size. The mileage history
each year of one-year-old cars was assumed to follow the same trend as the
average car. Using 1972 as the base year and compact cars as the base vehicle
size, an index of vehicle miles per year (Table IV-18) and vehicle size (Table
IV-19) was constructed. The indices were applied to the number of insurance
claims for each model car and the change in claims of pre- and post-standard
cars were calculated (Table IV-20). (The method for calculating the indices
and adjusting the number of claims is explained in Tables IV-18, 19 and 20.)
The adjusted results were also statistically tested and compared with the
unadjusted results to see if the outcomes on bumper standard effectiveness
were different.
4-3

As vehicles age, their mileage history changes—both in the number of miles
and the type of use. The bumper systems may also deteriorate with age,
thereby affecting their ability to reduce damage in low-speed collisions. To
account for vehicle age as a factor in bumper system effectiveness, insurance
claims of one and three-year-old cars were compared.
The objective of the third measure of effectiveness, bumper mismatch
frequency, is to determine whether regulating bumper height leads to damage
reduction. Uniformity in bumper height should allow bumpers to meet on impact
thereby enhancing the bumper's protective capability. Both bumper mismatch
and match frequencies of pre- and post-standard cars were compared, together
with their respective damage profiles.
2.0 DAMAGE FREQUENCY IN UNREPORTED, LOW-SPEED COLLISIONS
2.1 Damage Frequency by Vehicle Model Year Group
Damage in unreported, low-speed collisions occurs when any auto part is
broken, torn, bent or otherwise impaired. Damage frequency refers to the
proportion of these collisions in which one or more parts are damaged. Since
the bumper standard's objective is to prevent or reduce damage in low-speed
collisions, post-standard cars should sustain a lower damage frequency than
pre-standard cars. If each succeeding version of the bumper standard improves
exterior protection, damage frequency should decrease from one model year
group to the next.
4-4

Table IV-1 shows damage frequencies of unreported, low-speed collisions by
model year group. The confidence bounds indicate the range within which the
true damage frequency lies (at the 95 percent confidence level). The last
column shows the significance test conclusions of each post-standard model
year group compared with the pre-standard group (one sided, OL = 0.05).
The damage frequency of pre-standard cars (pre-1973) is 53 percent, while the
combined frequencies of subsequent model groups, which met a bumper standard,
is 39 percent. The statistical test of significance (Ho: pi = P2 vs.
Hl; PI > P?) indicated that the damage frequency of all post-standard
cars was significantly less than that of pre-standard cars.
The damage frequency of each post-standard model group (1973, 1974-78,
1979-80) was also significantly less than the pre-standard frequency.
However, when the damage frequency of each successive post-standard model
group was compared with its successor's frequency, no significant difference
was found.
The damage frequency analysis indicates that the various versions of the
bumper standard are effective in reducing the frequency of damage (front and
rear combined) to exterior parts covered by the respective standard, but
that there was no significant difference in effectiveness as bumper standards
became more stringent over the years since the 1973 model year requirement.
4-5

TABLE I V - 1
DAMAGE FREQUENCY IN UNREPORTED, LOW-SPEED COLLISIONS
(Front and Rear Co l l i s i ons Combined)
MODEL YEAR GROUP
Pre-Standard(Pre-1973)
Post-Standard1973
1974-781979-80
Total Post-Standard CarsWeighted AveragePercentage
TOTAL NO. OFCARS IN COLLISIONS
283
87448217
752
CARS DAMAGED(PERCENT)
53
403742
39
STD.ERROR
3
523
2
CONFIDENCELOWER
48
303336
35
Significance different from 0?BOUNDS 1/ POST-STD. COMPARED TO:UPPER Pre-Std. Group 11
59
50 yes41 yes48 yes
43 yes
Preceding Post-Std. Group
nono
1/ 95 percent confidence level
2/ Signif icant > 0 where: Ho: p j = P2 vs. H-j: p| > P2iOL* 0.05

2.2 Damage Frequency by End of Car Struck
2.2.1 Front End Damage Frequency
Table IV-2 shows damage frequencies of cars in front end collisions. The
front end damage frequency for pre-standard cars is 60 percent. For all
post-standard cars the front end damage frequency is 41 percent, which is
a statistically significant decrease. This continues to hold true for each
version of the standard when compared to the frequency for pre-standard cars.
However, the front end damage frequencies of post-standard cars were not
significantly different from each other.
The damage frequency of cars in front end collisions shows that, in general,
the bumper standard effectively reduced damage to front end exterior parts
specified for protection by the standard, but that there is no significant
difference between the various versions of the bumper standard in damage
reduction ability in low-speed front end collisions.
2.2.2 Rear End Damage Frequency
Table IV-3 shows a damage frequency for pre-standard cars in rear end
low-speed collisions of 48 percent. The combined damage frequency
for all post-standard model groups is 37 percent, which is significantly less
than that of pre-standard cars.
When comparing the damage frequency of each post-standard model group with the
pre-standard frequency, only the 1974-1978 model group was significantly
4-7

TABLE IV-2
DAMAGE FREQUENCY IN UNREPORTED, LOW-SPEED COLLISIONS
(Front End Collisions)
MODEL YEAR GROUP
Pre-Standard(Pre-1973)
Post-Standard1973
1974-781979-80
TOTALCARS
NO. OFIN COLLISIONS
136
3820794
CARS DAMAGED(PERCENT)
60
374238
STD.ERROR
4
7.53.55
CONFIDENCELOWER
51
223628
BOUNDS 1/UPPER
68
524948
Significance differentPOST-STD. COMPARED TOPre-Std. Group 2/
yesyesyes
from 0?
Preceding Post-Std. Group
nono
Total Post-Standard CarsWeighted AveragePercentage
339
41 2.5 36 46 yes
1/ 95 percent confidence level
II Significant > 0 where: Ho: pi = pg vs. Hi: pi > P2.o£= 0.05

TABLE IV-3
DAMAGE FREQUENCY IN UNREPORTED, LOW-SPEED COLLISIONS
(Rear End Collisions)
MODEL YEAR GROUP
Pre-Standard(Pre-1973)
Post-Standard1973
1974-781979-80
Total Post-Standard CarsWeighted "AVeragePercentage
TOTAL NO. OFCARS IN COLLISIONS
147
49241123
413
CARS DAMAGED(PERCENT)
48
433146
37
STD.ERROR
4
73
4.5
2.5
CONFIDENCELOWER
40
292537
32
Significanct difference from 0?BOUNDS 1/ POST-STD. COMPARED TO:UPPER Pre-Std. Group 2/
56
57 no37 yes55 no
42 yes
Preceding Post-Std. Group
noyes
1/ 95 percent confidence level
2/ Significant > 0 where: Ho: p£ * P2 vs. Hj: pj > P2t°t = 0.05
3/ Significant < 0 where: Ho: p^ = P2 vs. Hy. pj < P2,o£= 0.05

lower. Further analysis indicates that an increase in sample size alone would
not change the lack of significance found for the 1973 and 1979-80 model groups.
The reduction in damage frequency in rear end collisions for 197J-1978
post-standard cars is not significantly less than the 1973 post-standard
group. The 1979-80 model group however, has a significantly higher damage
frequency than the 1974-1978 model cars. In other words, the 1973 and
1974-1978 model groups have damage frequencies that are not statistically
different, but the 1979-1980 model group does have a significantly higher
damage frequency in unreported, rear end collisions.^/
There were fewer than a hundred 1979 and 1980 model cars involved in
unreported, low-speed collisions during the driver survey field data
collection period (October 1979-January 1980). This was too small a sample
for analysis; therefore, additional field work, which more than doubled the
sample size, was done in the summer of 1980. Since the procedure for
collecting data was the same, damage frequency results of the two time periods
were combined. The assumption was that the occurrence of the damage to
exterior parts in low-speed collisions was a function of the design of the
bumper systems and not the circumstances that resulted in the collision. If
factors such as the requirements for reporting low-speed collisions to the
police or filing an insurance claim changed sufficiently between the two time
periods, the damage frequency data could be affected. In the absence of any
V The higher damage frequency for 1979-80 model cars may result from theirweight reduction due to downsizing, thus making them more vulnerable to earlier,heavier models which are the largest portion of cars on-the-road (_about 80percent or more were 1978 and earlier models, during the time of the survey).
4-10

information suggesting that such reporting factors had changed, this was
rejected as a cause for the higher rear end damage frequency of 1979-1980
model cars.
2.2.3 Comparing Front End to Rear End Damage Frequency
In this section, the decrease in damage frequencies in front end collisions
will be compared with rear end collision frequency reductions. As shown in
Tables IV-2 and IV-3, the damage frequencies of pre-standard cars in front end
and rear end collisions were 60 and 48 percent, respectively. Forty-one
percent of post-standard cars were damaged in front end collisions while 37
percent were damaged in rear end incidents.
In general the frequency of damage in unreported, low-speed, front end
collisions was greater than for rear end collisions. Front end damage was
more often claimed under collision coverage (the car owner's own insurance
policy). Rear end collisions are usually the "other person's fault" and are
claimed under that person's liability insurance. Collision insurance often
has a deductible amount which the policy holder pays. For example, an
accident may result in a repair bill of $500. If the policy holder has $100
deductible collision insurance, the insurance company pays $400 and the policy
holder $100. Liability insurance has no such deductible, thereby generating
lower damage claims.
Because of the deductible nature of collision insurance, drivers in low-speed
collisions whose cars have a lesser amount of damage may not file collision
claims. In contrast, drivers whose cars are in collisions where the other
4-11

person was at fault, have an incentive to file a liability claim with the
other person's insurance company, regardless of the amount of damage. Since
collision claims are mostly for front end damage, and liability claims are
more frequently filed for rear end damage, there are more unreported damage-
related front end collisions than rear end collisions. Because of this
inherent difference in the reporting of front and rear end collisions, the
relative improvement of these frequencies should be compared to determine
differences in the effectiveness of the bumper standard.
Front end damage frequency dropped 19 percent, from 60 to 41 percent, for pre-
and post-standard cars, respectively. The relative reduction in damage
frequency was 32 percent (19/60). For rear end damage frequencies there was
an 11 percentage point drop between pre- and post-standard cars. The relative
reduction was 23 percent (11/48). These relative percentages indicate that
the bumper standard may have led to a higher reduction in damage frequency
from front end collisions.
2.3 Analysis of Confounding Variables
Several factors that could influence damage frequency were considered to
assure that the changes in damage frequency were associated with the bumper
standard and not other factors. A method known as "log-linear analysis" was
used for this purpose.2/
2/ See Appendix C for an explanation of the log-linear analysis method.
4-12

The effect of the following factors was determined:
o Car accelerating or braking
o Car struck or striking vehicle
o Traffic density (light or heavy)
o Contact point (on, above, below bumper)
o Accident location (on road, in parking lot)
o Relative motion (both cars moving, other car
moving, driver's car moving)
o Relative position (front-to-rear, rear-to-rear, rear-to-front,
front-to-rear)
o Vehicle size (subcompact, compact, intermediate
full size)
o Object struck (vehicle, stationary object)
o Roadway type (interstate, residential)
o Estimated impact speed—only one vehicle moving
(over 5 mph, under 5 mph)
4-13

TABLE IV-4
Control Variable
KEY FACTORS INFLUENCINGDAMAGE FREQUENCY!/
Effect on Damage Frequency
Control Variable Model YearSignificant? Significant?
Front/rearAccelerating/brakingStriking/struckTraffic densityContact point (on/above/below)Location of accidentRelative motionRelative positionVehicle sizeObject contactedRoadway typeEstimated speed
possibly2/yesyesnoVyesyesyesnopossibly?/nonoyes
possiblyf/yesyesyesyesyesyesyesyesyespossibly^/
1/ Burke, John S. et al., West at, Inc., Drivers Survey on Unreported andLow-Damage Accidents Involving Bumpers: Final Report, Report No. D0T-HS-8o5-83^(May 1980), pp. 5-9.2/ 0.01 < 06 < 0.103/ oc £ 0.014/ oc > 0.01
Table IV-4 summarizes the results of this analysis. Model year group, the
factor representing the various versions of the standard, had a significant
influence (oL< 0.05) on damage frequency independent of every control variable.
Independence from the control variables is important in this study for several
reasons. The most important reason deals with the question of speed since the
standards being evaluated require protection in low speed accidents. One of the
most difficult aspects of the evaluation is to insure that attention is focused
on this class of incident. To do this, several variables related to the speed
4-14

at impact were analyzed. These included the driver's estimate of speed, as
well as accident characteristics at the scene. If the conclusions regarding
bumper effectiveness are true when these "speed surrogates" are controlled for,
the conclusions are justifiable. If all of the speed-related factors are
determined to be independent of the relation between "percent damaged" and
model year class, then a clear conclusion can be reached about bumper
effectiveness. In this manner, the confounding effect of the independent
variables can be removed. This means that the model year of the car involved
in a low-speed collision—which represents the presence of a pre- or
post-standard bumper system on the car—is the primary determining factor in
predicting whether the car will be damaged.
2.4 Damage Frequency Evaluation Summary
The evaluation of damage frequency from the survey of unreported, low-speed
collisions shows there were statistically significant reductions in:
o The damage frequency of 1973 model cars compared with pre-standard
cars (front and rear end collision combined)
o The damage frequency of 1973 model years compared with pre-standard
cars in front end collisions
o The damage frequency of 1974-1978 model cars compared with
pre-standard cars (front and rear end collisions combined)
0 The damage frequency of 1974-1978 model cars compared with
pre-standard cars both in front and rear end collisions
o The damage frequency of 1979-1980 model cars compared with
pre-standard cars in front and rear end collisions combined
4-15

o The damage frequency of 1979-1980 model cars compared with
pre-standard cars in front end collisions
The following damage frequencies were not found to be reduced significantly:
o The damage frequency of 1973 model cars compared with pre-standard
cars in rear end collisions
o The damage frequency of 1979-1980 model cars compared with pre-standard
cars in rear end collisions
o The damage frequency of 1974-1978 model cars compared with 1973 model
cars for front, rear, or combined collisions
o The damage frequency of 1979-1980 model vehicles compared with 1974-
1978 model cars for front end and combined (both front and rear end)
collisions
In rear end collisions, the damage frequency of 1979-80 models was found to be
significantly higher than that of 1974-78 cars. The analyses of the extent of
damage covered in the next section will provide more information about the
effectiveness of the 1979 and 1980 version of the bumper standard in rear end
collisions.
3.0 EXTENT OF DAMAGE IN LOW-SPEED COLLISIONS
3.1 Introduction
This section presents several measures describing how much damage was
sustained by cars in low-speed collisions. Findings are based on both the
survey of unreported, low-speed collisions and the analysis of insurance-
4-16

claimed collisions. Changes in the amount of damage were determined from
comparisons of damage to pre-standard cars with the damage to cars meeting
various standard requirements.
The following descriptors of the extent of damage will be examined:
o Number of parts damaged in unreported, low-speed collisions
o Number of damaged parts in collisions for which an insurance claim
was filed
o Bumper repair vs. replacement from insurance claim data
o Degree of damage, by individual part, in unreported, low-speed
coll isions
o Repair cost of cars damaged in unreported, low-speed coll isions
o Repair cost of cars for which an insurance claim was f i l ed
o Number of property damage insurance claims per insured vehicle
o Bumper vs. non-bumper col l is ion and l i a b i l i t y claims
o Number of bumper-involved insurance claims per insured vehicle
3.2 The Number of Parts Damaged in Unreported, Low-Speed Collisions
3.2.1 Parts Studied
One method for determining the magnitude of damage in unreported, low-speed
coll isions is to count the number of damaged parts. The bumper standard
specifies that certain parts are to remain undamaged or at least in an
4-17

operating state after impact testing. Other front and rear exterior sheet
metal parts are included under the broader 1979-1980 specifications.
Following is the list of parts screened for damage in unreported, low-speed
collisions:
o Front bumper o Rear lamps
o Grille o Rear reflectors
o Front reflectors o Right rear fender
o Front right fender o Left rear fender
o Front left fender o Truck lid
o Hood o Truck latch
o Hood latch o Tail pipe
o Radiator o Fuel tank or filler neck
o Rear bumper
3.2.2 Distribution of the Number of Damaged Parts in Unreported
Low-Speed Collisions
From the survey of unreported, low-speed collisions, the number of parts
damaged in each collision was determined. To enhance the analysis, categories
of number of parts damaged per collision were established as follows: 0, 1,
2, and 3 or more. The number of unreported collisions with these categories
was obtained by model year group and is shown along with the percent
distribution in Table IV-5.
4-18

TABLE IV-5
DISTRIBUTION OF UNREPORTED, LOW-SPEEDCOLLISIONS BY NUMBER OF DAMAGED PARTS
Number of Distribution of Collisions by Model Year GroupsDamaged Parts/Collision
NoneOneTwoThree or More
Pre-standardNo.
130702849
%
47251018
No
5218412
1973. %
6121514
1974-1978No.
281982627
%
652367
1979-No.
120631314
•1980%
573067
TotalNo.
58324970
102
%
5825710
100
Chi-Square = 43.5Degrees of Freedom = 9Probability = 0.0001
A chi-square test of the data in Table IV-5 (shown at the bottom of the table)
indicates that the distribution of collisions by the number of damaged parts
differs significantly from one model year group to another. Since the model
year groups were selected to correspond with the various bumper standard
versions, the chi-square results suggest that the bumper standard
significantly affected the number of damaged parts per collision.
The comparison of damage to the same parts (Section 3.2.1) on pre-standard
versus post-standard cars showed that fewer parts are damaged on
post-standard cars than on pre-standard cars when involved in unreported,
low-speed collisions. The number of parts damaged on 1974-78 model cars was
less than on the 1973 models. Parts damaged on the 1979-80 models, however,
nearly equaled the number damaged on 1973 models. This suggests that the
1979-80 version of the standard provided less protection (for parts) than the
1974-78 version and about the same protection as the original standard.
4-19
3.3 Damaged Parts in Collisions for Which an Insurance
Claim Was Filed
Property damage insurance claims were screened to identify those claims where
any of the following parts were damaged: hood, front lights, front quarter
panel, rear lights, rear quarter panel, and trunk. These stratifications of
the data were dictated by the format of the State Farm file. Hence, the list
of parts is shorter and less specific than the one used in the driver survey.
Insurance claims of one-year-old cars were analyzed. This assured that cars
were driven about the same number of miles and had the same accident risk.
The insurance claims were stratified by the model year of the involved car in
relation to the bumper standard's effective dates as follows: 1972 models
represented the pre-standard cars; 1973 models stood for the original bumper
standard; and 1975 models represented the 1974-78 version of the standard.
(This analysis did not include the 1979-80 version of the standard.)
Table IV-6 shows the percentage of insurance claims for the damaged parts
listed above. In this analysis an insurance claim can be counted more than
once if more than one of the specified parts is damaged in the collision.
A two-sided Z-test was used to test the significance of the difference in the
percent of claims between pre-standard (1972) and post-standard (1973 and
1975) automobiles. The percentage of claims decreased significantly from pre-
to post-standard cars for all the parts under study except rear quarter
4-20

TABLE IV-6
PERCENT OF INSURANCE CLAIMSWHICH INCLUDED PARTS LISTED
ModelYear
1972
1973
1975
Hood
22
17*
14*
HeadLights
26
13*
9*
FrontQuarterPanels
33
28*
24*
RearQuarterPanels
16
19**
15
TailLights
13
8*
6*
Trunk
19
13*
6*
*Significance > 0 where H0:pi=P2 vs. Hi:pi/p2 ando6/2=0.025,meaning that the percent of claims is significantly less than that of the 1972vehicles.** Significance < 0 where H0:pi=p2
v.s- Hl-'Pl/P2 andOd/2=0.025,meaning that the percent of claims is significantly higher than that of the1972 vehicles.
panels. In other words, damage to hoods, trunks, front quarter panels, and
lights was not claimed as often for post-standard cars. The reduction is
s ta t i s t i ca l l y signif icant. In contrast, rear quarter panels were claimed
signi f icant ly more often for 1973 cars than for 1972 models. Claim
percentages for rear quarter panels did not di f fer s igni f icant ly between
pre-standard (1972) and 1975 models.
In a separate analysis, the percentage of claims for damage to rear quarter
panels was compared for one-year-old 1972 (pre-standard), 1975 (post-
standard), and 1977 (post-standard) automobiles. The analysis showed that a
signif icant ly lower percentage of claims involving rear quarter panels were
made for 1977 vehicles (12%) than for 1972 (16%) or 1975 (15%) vehicles.3/
3/ KLD Associates, Inc., Analysis of Insurance Claim to Determine BumperEffect on Crash Damage, Report No. DOT-HS-805-842 and 843 (March 1980), p.TTT
4-21

The percentages of insurance claims involving hoods, trunks, lights, rear
quarter panels, and front quarter panels were compared for two post-standard
model years--1973 and 1975 one-year-olds. The test of significance indicated
a significant decrease in the percentage of claims for all of these parts
between 1973 and 1975.
In general, the parts studied were better protected with each successive
version of the standard. The only exception was the rear quarter panels whose
claim percentage increased significantly for the 1973 standard and then
declined from the 1973 level for the later versions.
3.4 Comparison of Repaired vs. Replaced Bumpers in Insurance Claims
Another analytic approach was used to determine the extent of bumper damage
using insurance claims. As a first step in this analysis, claims for damage
to the bumper face bar were sorted from other claims. Next bumper damage
claims were separated into those where the face bar was replaced and those
where it was repaired. Claims were then stratified into model year categories
corresponding to the effective dates of the bumper standard and were analyzed
to determine if there was a shift from replaced to repaired bumper face bars.
The assumption of this analysis is that whether a bumper face bar had to be
repaired or replaced indicates how severe the damage was, i.e., repaired
bumper face bars sustained less damage than those that had to be replaced. A
shift in the frequency of face bar replacement to face bar repair would
indicate a reduction in bumper damage.
4-22

Table IV-7 displays the percentage of insurance claims for one-year-old cars
which had a bumper face bar either repaired or replaced. Insurance claims
were s t ra t i f ied by the following model years: 1972 models, representing
pre-standard cars; 1973 models, the original bumper standard; 1974-1978
models, the second version of the standard; and 1979 models, the 1979 version
of the standard. The percentage of bumper repair claims increased
signi f icant ly for post-standard cars while the percentage of bumpers that had
to be replaced on post-standard cars was signif icant ly less than that of
pre-standard cars.
TABLE IV-7
INSURANCE CLAIMS FOR REPAIREDVS. REPLACED BUMPERS (ONE-YEAR-OLD CARS)
PERCENT OF INSURANCE CLAIMSMODELYEAR
1972
1973
1974-78
1979
BUMPER REPAIRED
4.6
5.9**
5.0**
5.8**
BUMPER REPLACED
51.7
47.0*
36.6*
35.8*
*Significance > 0 where H0:pi=p;? vs. Hi:pi=P^ ando£/2=0.025,meaning that the percent of claims is significantly less than that ofpre-standard cars.**Significance < 0 where H0:pi=p2 vs. Hj:pi=P2 and0^/2=0.025,meaning that the percent of claims is s igni f icant ly more that that ofpre-standard cars.
4-23

This analysis of bumper damage shows that there has been a shift from having
bumpers replaced to having them repaired. It is an indication of the bumper
standard's effect in reducing damage to face bars in collisions, based on data
from insurance claims. The analysis also shows that 1974-78 and 1979 model
cars sustained significantly less bumper damage than 1973 cars, indicating
that the more stringent bumper standards, following the initial 1973 version,
further reduced damage to bumper face bars.
Although there was a shift from replacing to repairing bumpers, the increase
in the number of repaired bumper face bars did not completely offset the
decrease in replacements. A possible explanation of this discrepancy is that
there has been an increase in bumper-involved accidents where either no damage
was sustained or no claim filed.
A separate analysis of insurance claim cost for both repaired and replaced
bumpers was performed.4/ Claims requiring bumper repair, cost about the same
amount for pre- and post-standard cars. However, when a bumper had to be
replaced, the cost was higher for post-standard cars, ref lect ing the higher
manufacturing cost of post-standard bumpers (discussed in Chapter V).
4/ Ib id. p. 63.
4-24

3.5 Degree of Damage to Parts--Unreported, Low-Speed Collisions
The focus of this section is on how much damage occurred to individual
exterior auto parts in unreported, low-speed collisions. The analysis is
based on data obtained during the driver survey. Questions about the degree
of damage to exterior auto parts were asked of drivers whose cars were
damaged. The definitions used to described damage and the results obtained
are discussed in the following sections.
3.5.1 Defining Damage Severity
For each part listed in Section 3.2.1, the degree of damage was assessed by
driver survey repondents. (As will be seen later, this data provided a basis
for estimating repair cost since drivers seldom had repair records for
unreported, low-speed collisions.) To make sure that respondents used the
same definitions of the classifications of severity, "minor," "moderate," and
"major," each of these terms was defined by a description of the damage. For
example, to determine the degree of hood damage, the driver was asked if the
damage fitted one of these descriptions: (A) only surface paint was scraped
off with a scratch 6 inches or less or that there was a dent less than the
size of a quarter, or (B) the hood was torn or had deep creases or could not
be opened or closed. The first description, A, was classified as "minor"
4-25

damage and the second, B, "major" damage. Damage that fell between the two
was classified as "moderate." Similar descriptions were developed for the
other auto parts surveyed.£/
3.5.2 Degree of Damage to Front and Rear End Parts
The severity of damage to front and rear parts is shown in Tables IV-8 and
IV-9, respectively. To facilitate comparisons between the various versions of
the standard, the severity data is stratified by model year groups
representing the period each version was effective. The "moderate" and
"major" classifications used in the survey were combined into one category for
these tables to simplify comparisons.
A look at the degree of damage by model year group indicates that auto parts
of post-standard cars generally sustained less damage than those on
pre-standard automobiles. This trend continues with each succeeding version
of the standard.
5/ Burke, John S. et al., Westat, Inc., Drivers Survey on Unreported andLow-Damage Accidents Involving Bumper: Final Report, Report No.DOT-HS-805-838 (Nov. 1980), pp. D-71-D-75.
4-26

TABLE IV-8
DAMAGE SEVERITY TO FRONT EXTERIOR PARTS
Part Damage, by Model Yea Group, in Each Severity Class( in Percent of Model Year Cars) ! /
Part
FrontBumper
Grille
Front Lamps
FrontReflectors
Front RightFender 2/
Front LeftFender 2/
Hood 2/
Hood Latch
Radiator
Pre-1973None
58
79
80
89
87
83
84
90
93
Minor
20
9
3
4
8
7
3
5
Major
22
12
. 15
8
9
9
9
7
2
None
70
92
81
94
92
89
92
100
100
1973Minor
22
8
3
0
0
6
3
0
0
Major
8
0
16
6
8
5
5
0
0
1974-1978None
71
92
86
97
94
92
96
97
99
Minor
20
2
3
0
2
3
1
2
1
Major
9
6
11
3
4
5
3
1
0
None
92
97
94
100
100
100
100
100
100
1979-1980Minor
8
3
0
0
0
0
0
0
0
Major
0
0
6
0
0
0
0
0
0
1/ Car population includes those cars for which at least one part was damaged in a low-speed, unreportedcollision. Definitions of "minor" and "major" damage vary by part and can be found in the Westat, Inc.report (see footnote 5 of text) on pages D-74 and D-75.
2/ The severity category "moderate" used in the Westat report for these reports was combined with "major"damage to simplify this table.

TABLE IV-9
DAMAGE SEVERITY TO REAR EXTERIOR PARTS
Part Damage, by Model Year Group, in Each Severity Class(in Percent of Model Year Cars)!/
CD
Part
RearBumper
Rear Lamps
RearReflectors
Rear RightFender 2/
Rear LeftFender 2/
Trunk Lid 2/
Trunk Latch
Tail Pipe
Fuel Tankor FillerNeck
Pre-1973None
63
89
94
98
93
91
95
96
98
Minor
25
4
2
1
1
4
3
3
2
Major
12
7
4
9
6
5
2
1
0
None
63
94
98
94
96
88
96
98
100
1973Minor
24
0
0
2
0
7
2
0
0
Major
13
6
2
4
4
5
2
2
0
1974-1978None
80
95
97
95
97
97
100
99
100
Minor
14
0
2
2
2
1
0
1
0
Major
6
5
1
3
1
2
0
0
0
None
82
93
100
95
96
100
100
100
100
1979-1980Minor
13
3
0
2
2
0
0
0
0
Major
5
4
0
3
2
0
0
0
0
1/ Same as for Table IV-8.7/ Same as for Table IV-8.

While a test of statistical significance was not performed,^/ the decreasing
trend in severity of damage to individual parts does suggest that the standard
improved the protection capability of bumpers in low-speed collisions. The
continuation of this trend for each succeeding model year group indicates
further improvement with each version of the standard.
3.6 Cost to Repair Damage
3.6.1 Average Repair Cost for Damage in Unreported, Low-Speed Collisions
The damage descriptions from the driver survey (used to establish degree of
damage) were the basis for estimating repair costs for unreported, low-speed
collisions. Repair estimates had to be reconstructed from damage descriptions
since only 14 percent of the drivers surveyed, and whose cars were damaged,
possessed repair bills or estimates.
For parts sustaining minor damage, a cost estimate was based on the cost to
rep ajr. the parts. Where damage was major, the cost to replace the part was
used. For parts with moderate damage (this classification was only used for
parts, such as fenders, made of sheet metal), repair and replacement costs
6/ No such test was done due to the lack or absence of data in some of thecells of the tables and questions regarding the usefulness and validity of theresulting statistics.
4-29

were averaged. Part costs were obtained from 1979 replacement parts manuals.
A national average of 1979 labor rates was estimated based on regional rates
and techniques used by insurance adjusters.^/
Table IV-10 shows the average repair cost estimates for damage in unreported,
low-speed collisions in 1979 dollars. For all post-standard cars combined,
the average estimated, per car, repair cost of $151 was significantly less
than the average repair cost for pre-standard cars ($159). Compared to
pre-1973 models, repair costs for 1973 and 1974-78 model cars were
significantly lower. The newer 1979-80 model cars were significantly more
costly to repair ($168), however.
Only about ten percent of the cars on-the-road at the time of the survey were
either 1979 or 1980 models. These more recent models were lighter, on
average, than 1978 and earlier models due to downsizing. Thus, in a multi-car
collision, a 1979 or 1980 model was more likely to be involved with a heavier
earlier model car than with another 1979 or 1980 model. This involvement of
1979 and 1980's with heavier cars may explain their higher repair cost in
unreported collisions.
7/ The labor rate used was $22 in 1979 dollars.
4-30

TABLE IV-iO
REPAIR ESTIMATES- FOR OAMASE IN UNREPORTED, LOW-SPEED COLLISIONS
(1979 Dollars)
MODEL YEAR GROUP
Pre-Standard(Pre-1973)
Post-Standard:1973
1974-1978
1979-1980
Total Post-Standard CarsWeighted Average
Cost
TOTAL NO. OFCARS DAMAGED
147
35
161
92
288
AVERAGE REPAIR STD.COST/CAR ($) ERROR
159188 Front127 Rear
139168 Front121 Rear
143163 Front119 Rear
168166 Front171 Rear
151
12
13
9
14
11
Significance difference from 0?CONFinENCF BOUNDS 1/ POST-STD. COMPARED TO:
LOWER UPPER
136 182
113 165
124 161
141 1953/
129 173
Pre-Std. Groisp 2/
Yes
Yes
YesV
Yes
Preceding Post-Std. Group
No
Yes
1/ 95 percent confidence level
2/ Significant > 0 where: Ho: uj = 112 vs. H]: u\ >U2,*t= 0.05, meaning the latter group is significantly less.
21 Significant < 0 where: Ho: u^ = ug vs. Hy. u\ >U2,0C= 0.05, meaning the latter group is significantly more.

3.6.2 Average Repair Cost of Damage Based on Insurance Claims
The average repair costs of bumper damage based on insurance cases^/ are
shown in Table IV-11. Repair costs for both front and rear end damage are
shown as well as the average cost by model year group. Tests of s tat is t ica l
significance apply only to the average cost f igures.
For al l model year groups (pre- and post-standard), the repair costs for
damage in front-end coll isions are consistently higher than those in rear end
col l is ions. This is par t ia l ly due to the fact that front end coll isions are
more often covered by col l is ion insurance and rear end coll isions by l i a b i l i t y
insurance. Collision insurance usually has a deductible amount that the auto
owner pays. This means that col l is ion insurance claims are only f i l ed when
the cost to repair is greater than the deductible. L iab i l i t y claims, on the
other hand, can be made for any repair cost, no matter how small.
The average repair cost of al l post-standard groups combined was signif icant ly
higher than that of pre-standard cars. In addition, each successive
post-standard group had an average repair cost that was signif icant ly higher
than the cost for the pre-standard group or the preceeding post-standard
group.
8/ KLD Associates, Inc., Analysis of Insurance Claims to Determine BumperEffect on Crash Damage, Report No. D0T-HS-805-842-843 (March 1980).
4-32

TABLE IV-I1
ifERASE REPAIR COST FOR DAMASE REPORTED IN BUMPER-INVOLVED INSURANCE CLAIMS
(1379 Dollars)
1/ 95 percent confidence level
II Significant <0 where: Ho: u\
MODEL YEAR GROUP
Pre-Standard1972
Post-Standard:1973
1974-1978
1979
Total Post-Standard CarsWeighted AverageRepair Cost/Claim
TOTAL MO. OFCLAIMS
4657
7893
13989
3306
25188
AVERAGE REPAICOST/CAR $
S69745 Front544 Rear
682783 Front565 Rear
772890 Front591 Rear
778891 Front618 Rear
745857 Front593 Rear
R STD,ERROR
9
6
6
21
9.5
CONFIDENCESignif icance dif ference from 0?
ROUNDS 1 / POST-STD, COMPARED TO:LOWER | UPPER Pre-Std . Group 2 /
651
670
760
736
726
687
694 Yes
784 Yes
820 Yes
764 Yes
Preceding Post-Std. Group2/
Yes
Yes
vs. < U2>6t= 0.05, meaning the repair cost has increased significantly.

These higher post-standard costs may have been caused by more expensive
replacement parts, particularly for bumper systems. Another possible
reason for the higher post-standard cost is that insurance claims filed
for post-standard cars may actually have involved collisions occurring at
higher speeds, thus causing more damage, than claims for pre-standard
cars. (If the post-standard bumper is effective, then damage sustained
by a pre-standard car in a low-speed collision should be comparable to
that sustained by a post-standard car in a higher speed collision.) This
may be the explanation if the protective quality of post-standard bumpers
is more a "step-function" than a linear one, meaning post-standard
bumpers provide good protection up to a given impact speed, but above
that speed, they provide little or no protection.
The ratio of average repair costs for insurance claims to that of
unreported accidents is about 6 to 1. The insurance claim average repair
cost was between $669 and $778 while the unreported collision average
repair cost ranged from $139 to $168. This should be expected, since the
repair costs of unreported collisions were only slightly higher than the
typical $100 deductible amount for collision insurance. It also means
that total benefits of the bumper standard will be most heavily
influenced by the insurance claim data.
4-34

3.6.3 Analysis of the Effect of Vehicle Make on Insurance-Claimed Repair Costs
From the insurance files, claims were extracted for the major domestic manu-
facturers (General Motors, Ford, Chrysler). An average insurance claimed repair
cost was determined for each of these three manufacturers and for the rest of
the auto manufacturers combined1. As in previous insurance claim analyses,
1972 model cars represented pre-standard cars, 1973 models the original bumper
standard, 1975 model cars the 1974-1978 version of the bumper standard, and
1979 cars the latest version of the standard. In addition, repair costs for
1977 model cars were analyzed to see how their bumper system designs compared
with the 1975 bumper systems since both 1975 and 1977 model years came under
the same bumper requirements. Due to small sample sizes, no attempt was made
to analyze different bumper types produced by the various manufacturers.
Table IV-12 shows the average repair cost for bumper claims by make of car in
1979 dollars. When compared to pre-standard models by manufacturer, no
significant differences were found--even though there appeared to be an
increasing trend in repair costs. This lack of significance may have been
caused by the smaller sample sizes which resulted from stratifying the data.
In addition the total sample of insurance claims for this analysis was smaller
than that in the previous section because not all insurance claim records had
the make identified.
4-35

TABLE IV-12
AVERAGE REPAIR COST FOR BUMPER
CLAIMS BY MAKE OF CAR
(1979 Dollars)
ModelYear
Pre-Standard1972
Post-Standard:1973
1975
1977
1979
Note:
General Motors
$686
669
750
721
751
Ford
$665
706
770
737
778
Chrysler
$663
606
711
791
783
All OtherMakes
$669
682
766
729
777
1. For each manufacturer, there was jio significant difference between pre-and post-standard groups. Ho ui = U2 vs. Hi: ui < U2, ^- 0.05
2. There was JTO significant difference between manufacturers for vehicleswithin the same model year group. Ho: ui = U2 vs. H^ U2,ft?./2 = 0.025.
Additional tests were performed across each model year to determine if repair
costs by make were significantly different from each other (e.g., 1972 repair
costs of GM cars were compared with 1972 costs of Ford cars). No significant
differences were found. This lack of statistically significant differences does
not provide absolute proof that all makes had bumper systems equally capable of
protecting passenger cars. However, the tests do indicate that no manufacturer
had a design that weas significantly more effective than another. Thus, it
appears that the auto indistry, in general, developed bumper systems of nearly
equal property damage capability.
4-36

3.6,4 Analysis of the Effect of Bumper Materials on Insurance-Claimed Repair
Costs
Bumpers were classified by their material type { i . e . , steel, aluminum, and
hybrid—a combination of materials such as steel and rubber). Only subcompact
and compact cars were analyzed because bumper systems of larger cars generally
continued to be made of steel , meaning there were inadequate sample sizes in the
"aluminum" and "hybrid" material categories. Bumpers on 1973 and 1974 model year
cars were not analyzed because they were usually made of steel as were pre-
standard bumpers. Pre-standard vehicles, constructed of steel exclusively, were
represented by one-year-old 1972 models. The post-standard comparison years were
1975, 1977, and 1979.
Table IV-13 shows comparisons by bumper type. No unusual distribution of the cost
data as a function of body type is discernible, perhaps because the sample size
was small due to stratification of the data and the fact that bumper material type
could not be determined for all insurance claims.
Repair costs increased in general for post-standard models in comparison to
pre-standard vehicles for all bumper types. (The only exceptions were the 1977
steel and 1975 hybrid compact bumpers.) This increase may in part be due to
higher labor costs, the sophistication of the different bumper designs, or the
irscorporation of additional parts into the bumper assembly. Another possible
4-37

TABLE IV-13
AVERAGE INSURANCE-CLAIMED REPAIRCOST BY BUMPER MATERIAL
Material
Combined(Average ofAll MaterialsBelow)
Steel
Aluminum
Hybrid
ModelYear
1972197519771979
1972197519771979
1972197519771979
1972197519771979
(1979 Dollars)
Repair CostSubcompact
628787*696741
628766*735745
See Steel795752680
See Steel826*741832*
by Vehicle SizeCompact
711733684916*
711737647936*
See Steel735762830
See Steel682776840*
*Repair cost is signif icant ly greater than for 1972 (pre-standard) bumpers(a l l steel) . Significance < 0 where: Ho: u\ = U2 vs. H\: u\ = U2W2= 0.025.
4-38

explanation could be that newer designs have reduced the number of less severe
low-cost accidents, causing mean costs to shift to a higher value.£/ Overall,
the 1977 models had the lowest post-standard repair cost; bumpers on 1979 models
were more costly to repair than those on any other model year vehicle studied.
3.7 Analysis of the Number of Insurance Claims per Insured Vehicle
3.7.1 Scope of Analysis
Property damage insurance claims per insured vehicle should be less frequent if
the bumper standard is effectively reducing property damage in low-speed
collisions. In particular, there should be fewer insurance claims involving
damaged bumpers. In this section the first analysis will be of the number of
property damage claims per insured vehicle by model year. Next, bumper
involvements will be separated from other property damage claims and the ratios
of property damage claims involving the bumper to claims for non-bumper property
damage will be compared for the two types of property damage insurance
claims—collision and property damage liability. In order to determine how the
standard is affecting vehicles of different sizes in various accident
configurations, the two types of vehicle damage insurance will be combined and
the frequency of bumper-involved claims will be stratified by impact point
(front, front corner, rear, rear corner), vehicle size, and model year. The last
two analyses look at the effects of vehicle use and vehicle age on the percent of
insurance claims involving the bumper.
9/ KLD Associates, p. 107.
4-39

The support study!?/ ^ o r this analysis relied on data supplied by State Farm
Insurance Company on insurance claims f i led at the Company's drive-in claim
centers. The insurance data analyzed consisted of property damage insurance
claims involving the bumper--the number and damage repair cost for these claims.
In addition, data on the number of property damage insurance claims per insured
vehicle was obtained from State Farm. This number, representing all passenger
cars insured by the company, was an annual figure for al l car makes, sizes and
model years combined and included both col l is ion and property damage l i a b i l i t y
claims.
3.7.2 Comparison of Property Damage Claims
The annual number of insurance claims per insured vehicle, in the same calendar
year as i ts model year, are compiled in Table IV-14. This figure declined each
year from 1972 through 1979. All post-standard groups combined, as well as each
group individually, showed a signi f icant ly smaller number of insurance claims per
insured vehicle per year. When each post-standard group was compared with the
preceding post-standard group, the decrease in the number of insurance claims was
also signif icant.
10/ KLD Associates, Inc., Analysis of Insurance Claims to Determine BumperEffect on Crash Damage, Report No. DOT-HS-805-842+843 (March 1980).
4-40

TABLE IV-14
NUMBER OF PROPERTY DAMAGE INSURANCE CLAIMS PER INSURED VEHICLE PER YEAR 1/
(1979 Dollars)
NO. OF CLAIMS/ Significance difference from 0?NO. OF _ INSURED STD. CONFIDENCE BOUNDS 1/ POST-STD. COMPARED TO:MODEL YEAR GROUP
Pre-Standard1972
Post-Standard:1973
1974-78
1979-80
Total Post-Standard CarsWeighted AverageNo. of Claims
INSURED VEHICLES 2/
46,000
88,000
214,000 •- .'
54,000
356,000
VEHICLE-YEAR
0.179
0.169
0.157
0.147
0.158
ERROR
0.0015
0.0013
0.0008
0.0015
0.0006
LOWER
0.176
0.166
0.155
0.144
0.157
UPPER Pre-Std. Group 4/
0.182
0.172 Yes
0.159 Yes
0.150 Yes
0.159 Yes
Preceding Post-Std. Grouo
-
-
Yes
Yes
If Collision and property damage liability claims.
If Since data on total number of insured vehicles in sample files, these figures are estimated fromTable IV-II. This column provides estimates of the number of 1972 model years cars insured in 1973, 1973 models insured in 1973,and so forth.
3/ 95 percent confidence level.
4/ Significance > 0 where Ho: pi - p2 = o vs Hi: Pi - P2 > 0,«U= 0.05.

3.7.3 Comparison of Bumper vs. Non-Bumper Collision and Liability Claims
Two distinctly different kinds of insurance—collision insurance and property
damage liability—deal with vehicle damage. Both types include claims for
accidents outside the scope of this evaluation (i.e., side collisions, rollovers,
towaways, injury-causing accidents, and non-bumper-involved front and rear
collisions). Both collision and property damage liability files were screened for
bumper involvements. Collision bumper claims were further stratified by deductible
amounts—less than $100 and more than $100.
With the screened files of bumper cases, comparisons were made between the
various model year groups representing the versions of the standard. This was
done to see if the bumper standard had affected the proportion of bumper to
non-bumper claims for collision or property damage liability claims. These model
year comparisons are listed in Table IV-15, which shows the percentage of each model
year's property damage claims by claim type. For example, of the property damage
claims for 1972 models, 31 percent were collision claims with a $100 or less
deductible amount, 34 percent were collision claims with deductibles over $100, and
32 percent were liability claims. These three claim types add up to 97 percent of
total property damage claims. The remaining 3 percent of property damage claims
were covered by comprehensive insurance. The collision claims with deductibles less
than $100 comprised about the same proportion of property damage claims for all
three model year groups. Collision claims with deductibles over $100 increased
while liability claims decreased as a portion of total property damage claims
from pre- to post-standard groups.
4-42

TABLE IV-15
BUMPER VS. NON-BUMPER-INVOLVED PROPERTY DAMAGE CLAIMS
(One-Vear-Oid Cars)
Claim Model Percentage of Model Year Property Damage Claims: { Ratio of Bumper
Type Year j Not Involving the Bumper j Involving the Bumper | Total [ To Non-Bumper Claims
C o l l i s i o n , With) 1972 |
Deductible ( 1 9 7 3 |
Less Than $100 | 1374-78 j
. I I
13
15
23
18
15
10
| 31
| 30
j 33
111
1.38
1.0
0.43
i ICol l i s ion , With} 1972 |
Deductible More | 1973 |
Than $100 | 1974-78 |
I I
13
15
18
21
22
20
1i1
34
37
38
1t1
1.62
1.47
1.11
Liability 1972 \
1973 |
1974-78 j
J
16
14
15
16
13
10
32
27
25
1.0
0.93
0.67

A distinct pattern of bumper involvement was evident in each type of claim.
Collision claims, with a deductible under $100, tended toward a decreasing
percentage of bumper involvements (and thus contained increasing percentages of
non-bumper-involved claims). The frequency of collision claims with a deductible
over $100 showed a negligible change in bumper involvements, but
non-bumper-involved claims rose. Liability claims, involving the bumper,
decreased while non-bumper-involved claims remained almost constant. The net
effect of these trends was a shift from a preponderance of pre-standard property
damage claims which involved the bumper (55 percent of 1972 claims) to less than
half for 1974-1978 (40 percent of the claims). This shift is evident for the
three claim types based on the ratio of bumper to non-bumper claims.
Most of the decrease in property damage claims is attributable to the decrease in
bumper-involved liability claims, because there was no corresponding increase in
non-bumper-involved claims. This explains the decrease in frequency of property
damage claims seen in Table IV-14 and discussed in section 3.7.2.
Among bumper-involved claims, claim frequency has generally decreased between
pre-standard and post-standard groups for all claim types. The lower deductible
collision claims decreased the most, followed closely by liability claims. Since
a low-speed collision would tend to cause less damage than a higher speed
collision, a shift in insurance claims caused by a reduction in bumper-involved
claims would have more of an effect on claims of lower amounts. The analysis
4-44

shows that, in fact, the less costly collision claims—collision claims with
a deductible less than 100 dollars and the liability claims—did decrease
more than the costlier collision claims, whose deductibles were over $100.
3.7.4 Comparison of the Number of Insurance Claims Involving the Bumper by
Vehicle Size and End of Car Struck
In this section claim frequencies for bumper involvement are examined in
detail. The number of insurance claims involving the bumper were separated
by vehicle size, and four impact poirits: direct front end collisions, angle
collisions to the corners of the front end, direct rear end collisions, and
angle collisions to rear corners. For comparison, the number of property
damage claims for collisions into the sides of automobiles are also shown.
Pre-standard cars are represented by 1972 models, 1973 models represent
post-standard cars meeting the original bumper standard, 1978 model year
cars represent the 1974-78 version of the bumper standard, and 1979 model
year cars represent the 1979 version of the standard.
Table IV-16 shows the number of insurance claims involving the bumper.
Front, front corner, and rear claim frequencies generally declined for
post-standard cars, for all vehicle sizes. Rear corner bumper claim
frequencies showed an increase for 1973 models over 1972 models. The
1974-1978 models, while showipg fewer rear corner bumper claims than 1973
models, had more than the pre-standard (1972) models. The 1979 model
subcompact and compact size cars had fewer rear corner claims than the
preceding post- and pre-standard models.
4-45

TAPLE IV-16
BUMPER-INVOLVED CLAIMS AS A PERCENTAGE OF '
TOTAL PROPERTY DAMAGE CLAIMS — BY MODEL YEAR AND VEHICLE SIZE
(One-Year-Old Vehicles)
BUMPERINVOLVEMENT
Front
FrontCorner
Rear
Rear-Corner
All Bumper(Direct)
All Bumper(Corner)
MODELYEAR
1972737879
1972737879
1972737879
1972737879
1972737879
1972737879
SUBCOMPACT
15.811.$11.111.7
21.318.917.314.4
14.015.48.28.0
9.212.68.07.1
60.358.544.641.2
39.741.555.458.8
COMPACT
13.29.310.010.7
21.418.615.712.4
13.015.27.47.2
8.110.49.06.9
55.853.442.237.2
44.246.657.862.8
INTERMEDIATE
12.79.88.010.7
20.218.314.411.1
11.210.87.59.6
8.710.09.011.1
52.848.839.042.5
47.251.261.057.5
FULL
12.46.87.48.4
19.017.114.116.2
12.99.77.18.9
8.512.69.611,7
52.946.238.145.3
47.153.861.954.7
4-46

The results of Table IV-16 support the conclusion of the previous section that
the bumper standard reduced the number of insurance claims. However, from the
detailed analysis the standard did not reduce the number of claims, involving the
bumper, for angle collisions to rear corners.
3.7.5 Analysis of the Effect of Vehicle Use on the Number of Insurance Claims
Involving the Bumper
Both insurance claim costs and the number of claims v/ere analyzed for one-year-
old cars to normalize the claims for the exposure to risk of having a bumper-
involved accident. This was also done to minimize vehicle age as a factor, since
it may influence insurance coverage as well as the filing of a claim.
Exposure to the risk of having an automobile accident is usually based on the
number of miles the car is driven each year.v Another refinement of the exposure
measurement is to determine the type of use made of the car (e.g., urban, rural).
Studies have shown that vehicle age and size are factors having an effect on how
much cars are used (and the type of use) .11/ T"e method of using insurance
records for one-year-old cars to eliminate vehicle age, and normalizing for
exposure, is based on the findings from the reference above that show cars of
similar age are driven about the same amount.
11/ KLD Associates, Inc., Analysis of Insurance Claims to Determine BumperEffect on Crash Damage, Report Not DOT-HS-805-842 and 843 (March 1980).
4-47

In this section vehicle mileage data by vehicle size will be used to adjust the
data on the number of insurance claims involving bumpers. The adjusted data will
be analyzed using the same procedure as for the unadjusted data to determine any
effect vehicle use may have on previous conclusions.
Vehicle miles of travel (VMT)j^/ are the total miles driven by vehicles in the
U.S. VMT has generally been increasing each year; however, when divided by the
number of autos registered in the U.S.il/.the average miles driven per
automobile dropped from 1973 to 1974, but has been increasing slightly through
1977 (see Table IV-17). This change in vehicle use could effect the number of
insurance claims per insured vehicle and so will be used later to adjust the
insurance data.
TABLE IV-17
VEHICLE MILES TRAVELLED, AUTO REGISTRATION, ANDANNUAL MILES DRIVEN PER CAR
Calendar Year
1972
1973
1974
1975
1976
1977
Vehicle Miles(100 Million)
986.4
1016.9
990.7
1028.1
1075.8
1118.6
U.S. AutoRegistration (Millions)
96.9
101.2
104.7
106.7
110.4
113.7
AnnualMiles/Car
10,180
10,048
9,462
9,635
9,749
9,838
V2J Calculated and published annually by the Federal Highway Administration.13/ Ibid.
4-48

Two studies of miles driven, by vehicle size, have been cited which show that
smaller cars are driven less than large cars.M/ Indices were developed to
adjust for differences in miles driven by vehicle sizes and are shown in Table
IV-18. Similar indices were developed for the average mileage data from Table
IV-17 with 1972 as the base year. The two sets of indices (average miles driven
per car each calendar year, and mileage by vehicle size) were multiplied
and are shown in Table IV-19.
The number of insurance claims involving the bumper were adjusted for vehicle use
by multiplying them by the appropriate indices. The adjusted number of insurance
claims were statistically tested as was done with the raw data; the number of
claims of pre- and post-standard cars were compared to determine if there was a
significant difference.
As can be seen from Table IV-20, which shows the original and adjusted data on the
number of insurance claims involving the bumper, the findings of the adjusted data
are the same as for the orginal data. This means that the use of insurance claims
of one-year-old cars was an adequate surrogate for equalizing the insurance data
for vehicle use.
3.7.6 The Effect of Vehicle Age on the Percentage of Insurance Claims Involving
The Bumper
To analyze the effect of vehicle age on bumper effectiveness (effects of bumper
deterioration), the percentages of insurance claims involving the bumper for one-
year-old and three-year-old cars were compared. Table IV-21 shows the
comparisons. One-year-old pre-standard cars were represented by 1972 models and
three-year-old pre-standard cars by 1969 models.
W KLD Associates, p. 72.4-49

TABLE IV-18
RELATIVE RATIO OF VMT BY CAR SIZE
Car Size (Compact Mileage is Base)
Subcompact Compact Intermediate
Ratio l.lOV 1.00 1.09
V The relative ratio of vehicle miles travelled by car size comes fromstudies of North Carolina and New York state data. Compact cars in NorthCarolina average 12,099 miles in 1974 whereas subcompacts were driven 13,301miles. Using compacts as a base, the relative ratio for subcompacts is13301/12099 = 1.10. For New York state subcompacts the ratio was 1.09. Theseresults were averaged ([1.10 + 1.09]/2 = 1.095).
TABLE IV-19
RELATIVE RATIOS FOR VMT BY CALENDAR YEAR AND CAR SIZE
Car Size (1972 Compact Mileage is Base)
Model Year Group Subcompact Compact Intermediate Full
1972 1.10 1.00 1.09 1.19
1973 1.08V 0.99 1.07 1.17
1974-78 1.04 0.95 1.03 1.13
_V By dividing the national VMT for passenger cars by the number of registeredpassenger cars in the same year, an average mileage estimate per car wasdetermined. For the average passenger car in 1972 the mileage was 10,180(986.4 x 10⁸ VMT/96.9 x 10& registered cars). For cars in 1973 theaverage was 10,048 miles per car per year. The ratios, based on 1972, for 1973 is0.987 (10,048/10,180). The relative ratio by vehicle size (1.095 for subcompacts)were multiplying by the calendar VMT ratios (0.987 for 1973) to get the relativeratios for VMT by calendar year and car size (for 1973 subcompacts 1.095 x 0.987 =1.08).
4-50

TABLE IV-20
BUMPER-INVOLVED INSURANCE CLAIM PERCENTAGESADJUSTED FOR VEHICLE USE
ModelYearGroup
1972
1973
1974-78
SubcompactOriginal Adjusted
60.3 66.3
58.5* 63.2*
44.6* 46.4*
Original
55.8
53.4*
42.2*
CompactAdjusted
55.8
52.9*
43.5*
IntermediateOriginal
52.8
48.9*
39.0*
Adjusted
57.6
52.3*
40.2*
Original
52.9
46.2*
38.1*
FullAdjusted
63.0
54.1*
43.1*
Notes:1. The original bumper involved insurance claim percentages were multiplied by the relative ratios from Table IV-19
(for 1972 subcompacts 60.3 x 1.10 = 66.3). The original percentage represents claims per insured vehicle per year.The adjusted percentage represents claims per insured vehicle per annual miles driven.
2. Vehicle use is based on Table IV-19.
3. An asterisk (*) indicates that the percentage is significantly smaller than the corresponding 1972 percentage.Significance > 0 where Ho: pj = P2 vs. Hj: PI P2» ofc/2 = 0.025.

TABLE IV-21
COMPARISON OF PERCENTAGES OF PROPERTY DAMAGE RELATEDINSURANCE CLAIMS INVOLVING THE BUMPER FOR ONE V S
THREE-YEAR-OLD CARS
ModelYear
Pre-standard
1973
1974-78
Percent of ClaimsOne-Year-Old Cars
56.3
53.0
41.6
Involving BumpersThree-Year-Old Cars
57.5
47.1*
43.1
* Percent is significantly less than that of corresponding one-year-oldmodels. Significance 0 where Ho: p. = p2 vs. H]_: p=P2.ot/2 = 0.025.
Table IV-21 shows that one and three-year-old cars had similar
bumper-involved claim pecentages except for 1973 where the three-year-old
cars yielded significantly fewer claims than one-year-old cars. However,
this is most likely caused by the small sample of insurance claims for
three-year-old cars 1973 model cars. With the larger sample of 1974-1987
models, claim percentages for the one and three-year-old cars were similar.
Trends by model year for the one and three-year-old cars are also similar.
Vehicle age can represent vehicle use in miles driven, type of use (commuting
vs. pleasure), as well as deterioration. This analysis has shown little
difference in the percentage of insurance claims involving the bumper because
of vehicle age. It shows that bumper systems have funtioned about as well in
three-year-olds as in one-year-old cars and do not appear to deteriorate.
4-52

3.8 Extent of Damage—Evaluation Summary
Several measures of the extent of damage were developed based on: (1) a survey
of unreported, low-speed coll isions and, (2) an analysis of insurance claims.
There were significant reductions in :
o The number of parts damaged on post-standard cars compared to
pre-standard cars (from survey)
o Damage to hoods, trunks, front and rear l ights and front quarterpanels
on post-standard cars compared to pre-standard cars (based on insurance
claim data)
o The number of damaged rear quarterpanels on 1977 model cars compared to
1973 model cars, and pre-standard cars (based on insurance claim data)
o The number of damaged bumper face bars which were replaced on post-
standard cars compared to pre-standard cars (from insurance claim data)
o The repair cost of damage for 1973 and 1974-1978 model cars compared to
pre-standard cars (from survey)
o The repair cost of damage for 1979 model cars compared to 1974-1978
model cars (based on insurance claims)
o The number of property damage claims for a l l post-standard cars and for
each post-standard group of cars compared to pre-standard cars (from
insurance claims)
4-53

o The number of property damage insurance claims for each post-standard
group of cars compared to its preceding post-standard group (1974-78
compared to 1973 and 1979 compared to 1974-78)
The following measures of the extent of damage to cars in low-speed collisions
showed statistically significant increases in:
o The number of insurance claims for damaged rear quarterpanels on 1973
model post-standard cars compared to pre-standard cars
o The number of damaged bumper face-bars which were repaired for
post-standard cars compared to pre-standard cars (from insurance claims)
o The cost to repair damage for 1979 and 1980 model cars compared to other
post-standard cars and pre-standard cars (from survey)
o The damage repair costs for all post-standard cars compared to
pre-standard cars, and for 1974-1978 model cars compared to 1973 model
cars (from insurance claims)
The following measures of the extent of damage generally declined, but were not
statistically significant (or did not lend themselves to statistical testing):
o Front and rear exterior parts of post-standard cars compared to
pre-standard cars (from survey)
4-54

o Property damage claims, of post-standard cars, which included damaged
bumper face bars in comparison to such claims for pre-standard cars.
o Collision and l i a b i l i t y claims for post-standard cars which involved the
bumper compared to pre-standard cars.
o Collision coverage claims, with deductible less than 100 dol lars, and
l i a b i l i I t y coverage, compared to col l is ion coverage with deductibles
over 100 dol lars.
o Insurance claims for al l post-standard cars in f ront , front corner and
rear col l is ions, compared to pre-standard cars; and for each
post-standard group of cars compared to i ts preceding group.
The analysis of extent of damage for different types of insurance coverage showed
a general increase—though not s ta t i s t i ca l l y signif icant as follows:
o Collision coverage claims with al l deductibles, but not involving the
bumper, showed an increase for post-standard cars, compared to
pre-standard cars ( l i a b i l i t y claims contained about the same number of
non-bumper claims).
4-55

o Insurance claims, involving the bumper, for rear-corner collisions of
1973 model cars compared to pre-standard cars. 1974-1978 model cars had
fewer such claims for rear-corner collisions than 1973 model cars but,
more than pre-standard cars. Intermediate and full size 1979 model cars
had more insurance claims for rear-corner collisions, but subcompact and
compact size cars had fewer such claims, compared to pre-standard cars.
The measures of extent of damage when tested to determine the effects of other
factors on findings showed no significant differences as follows:
o Major domestic manufacturers made bumper systems that are about equally
effective in reducing property damage.
o Bumper systems made of different materials have similar damage repair
costs, although repair costs for aluminum bumpers seem to be lower.
o Variations in vehicle use, vehicle size and vehicle age do not appear
to affect previously determined findings on the extent of damage in
insurance claims.
4-56
4.0 BUMPER MISMATCH IN UNREPORTED, LOW-SPEED COLLISIONS
4.1 Definition and Data Source
When two cars collide front-to-front, front-to-rear, or rear-to-rear, their
bumpers' damage protection capabilities depend on whether the bumpers meet on
contact. This matching of bumpers is enhanced when the bumpers are the same, or
nearly the same height. Achieving uniform bumper heights is one of the bumper
standard's objectives and the pendulum test establishes the bumper height range.
The pendulum test specifies that a vehicle's front, rear and corresponding bumper
corners be struck by a pendulum at heights between 16 and 20 inches.
Bumper mismatch in unreported, low-speed collisions was recorded during the
driver survey. When cars were in multi-car collisions, drivers were asked if the
bumpers of the cars made contact. That is, did the bumpers meet, or was one
bumper higher (or lower) than the other? In the analysis, collision impact
configurations were classified as "on the bumper" if the bumpers met and as
"mismatch" if the respondent's car was struck above or below the bumper.
4.2 Comparison of Bumper Mismatch
Table IV-22 shows the number and percentage of multi-car, unreported low-speed
collisions, by bumper contact configuration and model year group. The data is
stratified into accidents involving the front and the rear of a respondent's car.
4-57
TABLE IV-22
COLLISIONS BY BUMPER CONTACTCONFIGURATION AND MODEL YEAR GROUP1/
Collisions PercentSignificance different from 0?Post-Std. Compared to:
Model Year
Front End:Pre-Standard
1973
1974-78
1979-80
Rear End:Pre-Standard
1973
1974-78
1979-80
Number ofColl isions
120
36
188
87
135
45
213
111
OnBumper
72
88
82
78
76
80
87
80
Not on Bumper(Mismatch)
28
12
18
22
24
20
13
20
Pre-StandardGroup 2 /
Yes
Yes
No
No
Yes
No
Preceding Post-Standard Group
—
_
No
No
-
No
Yes3/
1/ Using unreported, low-speed collision data (from survey) on the interviewed person's(far.
2/ The percentage of bumpers not meeting (mismatching) decreased significantly.Ho: PI = P2 vs. Hi: pi > P2,;t= 0.05.
3/ The percentage of bumpers mismatching increased significantly. Ho: pj = p£vs. Hy. pi < P2, tC= 0.05.
4-58

In. multi-car collisions, cars with bumpers meeting the standards were more often
hit on the bumper (no mismatch) than those with pre-standard bumper systems. In
front end collisions, 1973 and 1974-78 model car's bumper mismatched on
significantly fewer occasions than pre-standard cars. Although mismatch of
bumpers involving 1979-80 model cars was less than for pre-standard cars, the
sample was too small to be statistically confident of the reduction. In rear end
collisions, only the 1974-78 model car mismatches were of a sufficient number to
show a significant reduction in relation to pre-standard cars.
The bumper standard appears to have reduced the incidence of bumper mismatch in
unreported, low-speed collisions.
4.3 Comparison of Bumper Contact Configuration and Damage Frequency
The effect of bumper contact configuration, that is "on bumper" or "mismatch", on
damage frequency in multi-car collisions is shown on Table IV-23.
In coll isions where the bumpers contacted, post-standard cars were damaged
signi f icant ly less frequently than pre-standard cars. In bumper "mismatch"
col l is ions, the percentage of cars damaged, in both pre- and post-standard groups
remained about the same.
4-59

4.4 The Effect of Bumper Height Requirements on Damage Repair Costs
The damage frequency, when bumpers matched in low-speed col l is ions, is lower
than when they did not match, as is shown in the previous section. Also,
when cars with bumpers meeting the standard requirements col l ided, and their
bumpers made contact, the damage frequency was lower than when pre-standard
cars were in a similar si tuat ion.
In this section the damage repair cost when bumpers matched, in unreported,
low-speed col l is ions, is compared to the damage repair costs when bumpers
mismatched. This measure is intended as an indication of benefits of the
bumper height requirement. Data for the measure is obtained from the driver
survey which showed that for the 1979-80 model year, 157 cars made contact
with the bumper in a low-speed co l l i s ion. Of these, 50 cars suffered damage
which cost an average of $182 per car to repair, yielding an average repair
cost of $58 per car for the sample population of 157 cars making a bumper
contact in a low-speed col l is ion (both damaged and undamaged).
A similar process is applied to the cars that "mismatched" in low speed
col l is ions, which for 1979-80 model years came to $102 per car, or $44 more
per car than the average damage repair cost for cars that made bumper
contact. A complete set of results for pre- and post-standard cars is shown
in Table IV-24, where the last column l i s t s the measure of difference
between (average, per car, repair costs for a l l cars) "mismatch" and "on
bumper" col l is ions.
4-60

TABLE W-23
DAMAGE FREQUENCY IN MULTI-VEHICLE UNREPORTED,LOW-SPEED COLLISIONS BY BUMPER CONTACTCONFIGURATION AND MODEL YEAR GROUP
ModelYearGroup
On BumperNumber Cars Damagedof Cars (Percent)
Not on Bumper (Mismatch)Number Cars Damagedof Cars (Percent)
Pre-Standard
Post-Standard:1973
1974-78
1979-80
190
68
359
157
45 65 62
31*
26*
29*
13
42
41
62
74
71
All Post Standard 584 27* 96 71
* Significance > 0 where Ho: p-| = P2 vs. H-|: p-| > P2, 06 = 0.05, meaningthe percentage is significantly less than the corresponding pre-standard percent.
4-61

TPSLE TJ-2ACF HMER iEB3ff EB3HEMNIS CN EEEMR OBIS
Pce-Std.
1973
1974-73
oj 1979-80
N3. o£C
190
68
359
157
t H BCMBSf 03IISB3B
as j / fb. of Cacsg/
85
21
90
50
Repair3/3astvCar
$153
140
157
132
Hie. R=pair
All Cats
$71
43
39
58
1
ND. of Ca
65
13
42
41
flasocH" coLisiaB
csj/ ND.
40
8
31
29
of Cars2 /H^aic3 /Ctst/CarDaitye
$161
135
102
144
OOSfcy'CcIT fcf
AllCas
$99
84
75
102
DiffetHtB babweanAwg. ImpairQst/Car "MianEtdi" l s s 'Ch
Ritper"
$28
41
36
44
_2/ Baaad a i Etiva: Sutvey
V r^iniiat-Ri firm damage lEpeir estimates, based cn ctasgs astett D^txta^ in ccive: Sucwy.
j ^ £tfc. of Cars EBnagaa) x (I^Hir dost PET danagad car) * (OttaL N3. of Cars in respective t^ges cf collisicns).

Bumper height requirements, a factor in providing for "on bumper" contact in
low-speed collisions can be credited with lowering the repair cost when such
costs are spread over the number of cars so involved-which includes both
damaged and undamaged cars. The reduction is over 40 percent for
post-standard cars and less than 30 percent for pre-standard cars. There is
not, however, a great deal of difference in damage repair cost for the
particular cars that sustain damage, be it in "on bumper" or "mismatch"
collisions, although the number of cars damaged in the latter situation is
considerably higher (by almost 3 to 1) than the former.
4.5 Bumper Mismatch Evaluation Summary
The evaluation of the bumper standard for uniform bumper heights was based
on data gathered during the driver survey. The major findings on bumper
mismatch in multi-vehicle collisions are as follows:
o Cars in compliance with the standard were contacted significantly
more often on the bumper (bumper match) than pre-standard cars.
This was the case for both front and rear end collisions.
o In rear end collisions, 1979-80 model cars were involved in
significantly more incidences where bumpers mismatched than
1974-78 models.
4-63

o When bumper heights matched on contact, the frequency of damage
was signif icant ly less for al l post-standard car groups (together
and individually) than the pre-standard group.
o When post-standard bumpers mismatched, the damage frequency was
about the same as that of pre-standard bumpers.
o When bumpers matched on contact, repair costs were 28 to 49
percent less than when they mismatched for both pre- and
post-standard cars. The average repair cost of post-standard
cars was lower than for pre-standard cars, when bumpers
matched. This was also true for mismatching coll isions except
for 1979-80 model cars.
4-64

CHAPTER V
ACTUAL COST OF THE BUMPER STANDARDS
1.0 INTRODUCTION
While bumper systems, designed to meet Federal regulations, may reduce repair
bills, their weight and cost must also be considered. A cost-effective
standard will achieve sufficient consumer savings to offset any increases in
the automobile purchase price or fuel costs. This chapter looks at the added
Cost and weight resulting from the bumper standard.
Bumper systems meeting the standard generally weighed more, had more complex
designs, and required more costly materials to manufacture. Any weight added
to the automobile requires more fuel. With today's fuel prices, a small
increase in fuel consumption can have a significant effect on operating
expenses over the life of an automobile. Post-standard bumper system designs
included new parts; energy absorbers and face bar reinforcements were the
major ones. Current bumper systems are commonly made of high-strength metals
and elastomerics. These new parts and materials have added to the cost of
manufacturing bumper systems.
The bumper standard required changes to be made to existing vehicle hardware,
i.e., the bumper system. Thus, only the incremental consumer bumper system
cost (the difference in cost to the buyer between pre- and post-standard
bumper systems) rather than the total bumper system cost is attributable to
5-1

the standard. Incremental consumer bumper system costs, reflected in the
purchase price of a vehicle, were obtained for each version of the standard
through tear-down studies. Tear-downs were performed on 1972 model cars,
representing pre-standard bumper systems; 1973 models, for the original standard;
1974 models, covered by the 1974-78 version; and 1979 and 1980 cars, representing
the two versions of the standard in effect for those model years.V
To determine the total incremental cost of the bumper standard, the additional
fuel cost attributable to heavier post-standard bumper systems must be added
to the incremental consumer bumper system cost. During the tear-down studies,
bumper system weights were obtained. The weight differential between pre- and
post-standard bumper systems was calculated and multiplied by the lifetime
fuel penalty (number of gallons of gas used over the lifetime of a car per
additional pound times the cost per gallon) to determine the added lifetime
fuel cost.
V C.B. Eckel, et al. De Lorean Motor Company Implementation Cost to theConsumer of Part 581 - Bumper Standard, Phase II; Weight and CostStudies of Three T" BoayBumper Systems; and Consumer Replacement Cost forComplete Bumper Systems Studied, Report No. POT-HS-805-779 (October 19801T"
M.R. Harvey, Clifford Eckel, David Cowan, John Z. De Lorean Corp., CostEvaluation for Four Federal Motor Vehicle Safety Standards, Task VIAdditional Bumpers, FMVSS 215 - Exterior Protection, Report No.DOT-HS-803-873 (May 1979).Robert F. McLean, Clifford Eckel, and David Cowan, John Z. De Lorean Corp.,Cost Evaluation for Four Federal Motor Vehicle Safety Standards, Volume I,Report No. DOT-HS-803-871 (October 1978). ~
5-2

This chapter includes:
o The method for determining the actual cost of a bumper system,
o Incremental consumer costs for each version of the bumper standard
in relation to pre-standard bumpers.
o The added lifetime fuel cost due to added bumper weight,
o The total incremental cost for each version of the bumper standard.
2.0 METHOD FOR DETERMINING THE ACTUAL COST OF BUMPER SYSTEMS
2.1 Consumer Cost Elements
For the purposes of this section, consumer cost is defined as the
manufacturer's suggested retail price of a new car. While the suggested
retail price is not generally the actual selling price, it does reflect the
typical manufacturer and dealer costs that are passed on to the consumer.
Factors which cause the actual sales price to differ from the suggested retail
price (e.g., factory rebates, financing, trade-ins, consumer demand, dealer
discounts, shipping distances, taxes) have no direct connection with the
bumper system and can only be estimated for a whole vehicle rather than a
system.
The conamer cost of a bumper system is not as readly available, and the
actual costs of such systems must be estimated. Starting with torn down
components, a precedure to cost out the elements of consumer cost is used.
5-3

Figure V-l shows the elements of consumer cost. Each element is defined
below:
0 Variable Cost -- expenses that vary with the production quantity. Consists
of direct labor, direct material (material in finished product plus scrap),
and variable burden (all other expenses due to production process that vary
directly with production volume and contribute to cost of sales, such as
perishable tools or fuel) to produce each component.
0 Fixed Cost -- expenses related to the operation of a manufacturing plant
that do not vary, regardless of the volume. Major contributors to this
category are indirect labor (e.g., plant supervision), indirect materials
(e.g., plant maintenance supplies), and fixed burden (e.g., insurance
costs).
o Manufacturing Cost -- all fixed and variable costs (except tooling)
incurred during the production of each component.
0 Tooling Cost -- expense of special tools and dies to manufacture a bumper
system component. The total expense is apportioned by dividing it by the
lifetime production volume of the component (the number of years the
component, as designed, was used multiplied by the average annual volume of
the component).
o Other Cost and Profit — includes engineering, warranty, selling, and
administrative costs and corporate burden, taxes, depreciation,
5-4

FIGURE V-l
CONSUMER COST ELEMENTS
VARIABLE COST
FIXED COST
TOOLING COST
OTHER COST ANDPROFIT
MANUFACTURING COST
DEALER WHOLESALE
CONSUMERCOST
DEALER MARKUP
5-5

maintenance, profit, and other expenses (excludes factory burden, taxes,
depreciation, and maintenance).
o Dealer Wholesale -- manufacturing cost, tooling cost, and "other" cost and
profit.
o Dealer Markup -- the amount, usually expressed as a percent of dealer
wholesale, covering all costs incurred in the operation of a dealership
(e.g., salaries, taxes, depreciation, advertising, maintenance) and profit,
0 Consumer Cost -- the sum of dealer wholesale and dealer markup.
2.2 Bumper Systems Studied -- Selection Criteria
There were over 400 model and body style combinations produced in 1979 by
domestic and foreign manufacturers._£/ To represent this large market mix, a
sample of bumper systems was selected to provide a high volume representation
of the industry rather than any specific manufacturer. The models selected
are representative of the high volume vehicles in each vehicle size and body
style class. Both domestic and imported models are included.
Model year 1972 cars were chosen to represent the pre standard-models (1972
models for which manufacturers had anticipated the standard and installed a
bumper system intended to comply were not included). The first model year
II Automotive News: 1980 Market Data Book Issue, April 30, 1980, pp. 52, 53,and 82.
5-6

in which cars had to comply with a particular version of the standard was
selected to represent it (i.e., 1974 cars represented the 1974-78 version, and
1980 vehicles represented the 1980 and later version). In addition, a
subsample of 1975-78 models was used to study design trends affecting cost and
weight since the standard that went into effect for the 1974 model year
covered the next four model years as well. Only rear bumpers of 1973 and 1974
vehicles were compared since manufacturers in general anticipated the 1974
front bumper requirements in 1973.
Table V-l shows the 1972 through 1980 models for which actual bumper costs
were estimated.
2.3 Method for Estimating Lifetime Fuel Cost
Additional weight, as a result of the bumper standard, means that more fuel is
required to operate a post-standard car. Lifetime fuel expenses are
calculated using three elements: the bumper system weight increase, the
lifetime gallons of fuel consumed per pound of weight, and the unit price of
fuel.
A lifetime weight penalty of 0.9 to 1.1 gallons of fuel consumed per pound
of vehicle weight is used in this evaluation.^/
V "Economic Impact Assessment-Amendment to Federal Motor Vehicle Safetystandard No. 208". National Highway Traffic Safety Administration, PublicDocket No. 73-19, Washington, 1977; U.S. Department of Transportation."Nonpassenger Automobile Average Fuel Economy Standards Model Year1980-81". Public Hearings before National Highway Traffic SafetyAdministration, January, 1978, Dr. Potter, V.P. General Motors, Statement.
5-7
TABLE V-lMODELS SELECTED FOR COST EVALUATION
cni
Co
Manufacturer
Domestic:American Motors
Chrysler
Ford
General Motors
Foreign:
Toyota
Volkswagen
Volvo
1972, 1973, 1974 1/
Gremlin
Fury, Valiant
Gaiaxie, Pinto,Gran Torino,Maverick
Camaro, Vega,Nova, Caprice,Malibu, Firebird
Corona, Celica
Beetle
Volvq2_/
Model
1975-78
Pacer (1975)
Cordoba (1975)Volare (1976)
Granada (1975)
Caprice (1977)Malibu (1978)Seville (1975)
-
Rabbit (1975)
-
Years
1979
-
LeBaron,Volare
Fairmont, LTD,LTD II, Pinto
Camaro, Nova,Caprice,Firebird,Grand Am,Malibu
Corona
Volvo
1980
Concord
LeBaron,Volare
Fairmont, LTD,Mustang, Pinto
Cadillac, Camaro,Caprice, ChevetteCitation, Cutlass,Electra, Malibu,Phoenix, Regal,Salon, Skybird,Sunbird
Corona
Rabbit
The same models were selected for each model year.
1971 and 1973 model years only.

Until 1973, gas prices had been nearly stable for over 20 years.4/
Since then, prices have continuously risen, and the average price of
unleaded gasoline in 1979 was $0.95 per gallonJy The Federal Highway
Administration, in its study of the cost of owning and operating an
automobile in 1979, used $1.00 per gallon, the average price of gasoline in
the Baltimore, Maryland study area during 1979._£/ Since the bumper
systems that were evaluated, as well as the period during which the survey
and insurance studies were conducted, covered 1979 and previous years, the
Federal Highway's 1979 value of $1.00 per gallon was used as the baseline
value for fuel cost.
2.4 Secondary Weight Consideration
Some automotive system designs vary with total vehicle weight (i.e.,
suspension, brakes, frame). When systems such as bumpers increase or
decrease car weight, the size and weight of these dependent systems also
changes. This size/weight change is called the "Secondary Weight
Effect."7/
_5_/ Federal Highway Administration, Cost of Owning and Operating Automobileand Vans, 1979 (Washington, D.C.: U.S. Government Printing Office, 1980),p.6.
5/ National Highway Traffic Safety Administration, "Final RegulatoryAnalysis of the Model Year 1982 Light Truck Fuel Economy Standards," March1980, pp. II-4.
6/ Federal Highway Administration, p. 6.
7/ N.E. South, "The Fuel Shortage and Some Potential Effects on BodyEngineering," Vol. 1, No. 1, October 1973, p. 31.
5-9

Auto industry docket comments on the Agency assessment &/ of the bumper
standard stated that secondary weight was a design factor. The Agency
summarized these comments and stated that it doubts secondary weight is
actually applied to auto designs Ji/ However, the assessment did
include secondary weight as a cost factor using 0.35 pounds of secondary
weight per one pound of bumper weight. For actual cost analysis in this
report, secondary weight is considered in the calculation of net benefits
in Chapter VI.
3.0 INCREMENTAL CONSUMER COSTS OF THE BUMPER STANDARD
3.1 Derivation of Representative Weights and Costs
Incremental costs (and weights) are defined as the difference between the
complete costs (and weights) of pre- and post-standard bumper systems. To
arrive at both representative weights and costs, based on tear-down
estimates of the selected bumper systems, a "weighted" average weight and
cost is calculated for each vehicle size class in each of the model year
cars torn down. The basis is the model year proportion of the total
production volume in the size class sample. For example, the sample of
1973 full size cars included:1P_/
8/ National Highway Traffic Safety Administration, Final Assessment ofThe Bumper Standard, DOT-HS-804-71 (June 1, 1979).
9/ National Highway Traffic Safety Administration Administrator to"Congressman James H. Scheuer, Chairman, House Subcommittee on ConsumerProtection and Finance, March 18, 1980, p.8 of Enclosure 1, "Excerpt onSecondary Weight from December 1979 Review of Comments on the BumperStandard Assessment."
10/ Taken from the third reference of footnote J7 of this chapter.5-10

Ford Galaxie Approximately 860,000 producedGM Caprice Approximately 940,000 producedChrysler Fury Approximately 280,000 produced
Total 2,100,000 produced
The representative weight (or cost) for the f u l l s ize, 1973 models is
obtained by "weighting" each of the above models as follows:
86 94 28(Galaxie wt.) 2T0 + (Caprice wt.) 2T0 + (Fury wt.) 2T0"
The baseline weights and costs, i.e., for the 1972, pre-standard bumper
systems, are shown in Table V-2. The table includes data for front, rear and
total bumper systems. Costs are in 1979 dollars. Weights and costs for
post-standard bumper systems are presented in Tables V-3 and V-4,
respectively.
A further aggregation has to be performed before incremental costs (and
weights) are obtained. The costs and weights of each size class (subcompacts,
compacts, etc.) in each model year are "weighted" to yield a single average
weight (or cost) for front, rear and total bumper systems. To do this the
size class mix for 1979 is used as follows:!!/
11/ Based on 1979 new car registration data in Wards Automotive Year Book,1980 (Detroit: Ward's Communications, Inc., 1980), p. 154. All imports wereclassified as subcompacts; luxury cars were classified as full size; andpassenger vans were excluded since they are not required to comply with thestandard.
5-11

Subcompact 38.9 percentCompact 18.3 percentIntermediate 22.1 percentFull Size 20.7 percent
100.0 percent
Applying this d is t r ibu t ion , for example, to the respective weights of rear
bumper systems, in 1972 models, for the four size classes (Table V-2), the
"weighted" average weight i s :
Subcompact, rear bumper 20 lbs. (0.389) = 7.78 lbs.Compact, rear bumper 29 lbs. (0.183) = 5.31 lbs.Intermediate, rear bumper 44 lbs. (0.221) = 9.72 lbs.Full Size, rear bumper 73 lbs. (0.207) = 15.11 lbs.
"Weighted" Average Weight (rounded) = 38.00 lbs.
The "weighted" average values—shown in each of the tables on weight and
cost (Tables V-2, 3 and 4) represent completed costs of a model's bumper
sytems, for the model years needed. To establish what weight and cost in
associated with a bumper standard the incremental values are obtained.
3.2 Incremental Consumer Cost
The effect of bumper standards on bumper costs—the incremental costs—are
derived for each size class in each model year for which a version of the
standard applied (1973, 1974-78, 1979, 1980). The cost increments are shown
in Table V-5. The values are the differences between respective post- and
pre-standard amounts as shown in Tables V-4 and V-2, respectively.
5-12

TABLE V-2
BASELINE WEIGHT AND COST DATA1972 BUMPER SYSTEMS ±1
(1979 Dollars)
WEIGHT PER CAR (LBS.) COST PER CAR
VEHICLE SIZE
SubcompactCompactIntermediateFull Size
WeightedAverage^/
Front
19404675
41
Rear
20294473
38
Total
396990148
79
Front
$29$52$62$74
$50
Rear
$31$38$56$77
$47
Total
$60$90$118$151
$97
1/ Robert F. Me Lean, Clifford Eckel, and David Cowan, John Z. DeLorean Corp., Cost Evaluation for Four Federal Motor Vehicle SafetyStandards, Volume I, Report No. DOT-HS-803-871 (October 1978).
2/ Based on 1979 new car registration volumes.
5-13

TABLE V-3
POST-STANDARD BUMPER SYSTEMS WEIGHTS 1/(Lbs.)
1973 MODELS
VEHICLE SIZE
SubcompactCompactIntermediateFull Size
Weighted Average
VEHICLE SIZE
SubcompactCompactIntermediateFull Size
Weighted Average
VEHICLE SIZE
SubcompactCompactIntermediateFull Size
Weighted Average
VEHICLE SIZE
SubcompactCompactIntermediateFull Size
Weighted Average
Front
3669120106
75
Front
3669120106
75
Front
43886772
63
Front
43886673
63
Rear
21386799
51
Rear
4276101109
75
Rear
41526175
55
Rear
42536275
55
Total
57107187205
126
1974 MODELS
Total
78145221215
150
1979 MODELS
Total
84140128147
118
1980 MODELS
Total
85141128148
118
V See the first footnote of this chapter for data source reference.
5-14
TABLE V-4
COST OF POST-STANDARD BUMPER SYSTEMS V(1979 Dollars and Vehicle Mix)
VEHICLE SIZE
SubcompactCompactIntermediateFull Size
Weighted Average
VEHICLE SIZE
SubcompactCompactIntermediateFull Size
Weighted Average
SubcompactCompactIntermediateFull Size
Weighted Average
VEHICLE SIZE
SubcompactCompactIntermediateFull Size
Weighted Average
Front
5270120112
83
Front
5270
120112
83
8210996125
99
Front
8310997126
100
Rear
36427092
56
Rear
5694126128
93
827582115
87
Rear
837584115
88
1973 MODELS
Total
88112190204
139
1974 MODELS
Total
108164246240
176
1979 MODELS
164184178240
186
1980 MODELS
Total
166184178241
188
V Sources of the cost information are listed under thefirst footnote in this chapter.
5-15

CJl
TABLE V-5INCREMENTAL CONSUMER COSTS OF EACH BUMPER STANDARD VERSION^/
(1979 Dollars and Vehicle Mix)
1973 MODELS 1974 MODELS 1979 MODELS 1980 MODELS
VEHICLE SIZE
SubcompactCompactIntermediateFull-Size
WeightedAverage
Front
32185838
33
Rear
541415
9
Total
28227253
42
Front
23185838
33
Rear
25567051
46
Total
4874
12889
79
Front
53573451
49
Rear
51372638
40
Total
104946089
89
Front
54573552
50
Rear
52372838
41
Total
106946390
91
1/ Incremental cost is the difference between post and pre-standard (1972)--bumper system costs.

The costs of post-standard bumper systems were higher than pre-standard bumper
systems costs. The bumper systems of 1979 and 1980 intermediate and full size
vehicles had lower or equal costs compared to 1974 models. These lower costs may
reflect improved designs, technology, use of new materials, or downsizing.
Pre-standard bumpers were generally made of steel whereas post-standard bumpers were
made of various materials (aluminum and elastomerics as well as steel). The costs
of post-standard bumpers represent an average of these material types.
Comparing costs of 1973 and 1974 models shows the effect of the more stringent
1974 rear bumper requirements. The incremental cost of rear bumpers in 1973 was
$9; for 1974 cars it was $46. The front bumpers of 1973 and 1974 models
remained virtually the same, so both 1973 and 1974 incremental costs of front
bumpers are the same.
The 1979 model incremental costs are lower than the 1974 model costs even
though the requirements of the standard for 1979 call for more damage protection
than the 1974-1978 version of the standard. This lower incremental cost probably
reflects the previously mentioned improvements in design and technology plus use of
stronger, lighter weight materials and the 1979 downsizing of many domestic
manufactured vehicles.
The incr mental costs of 1979 and 1980 models (relative to pre-standard) are
almost the same. This suggests that manufacturers, when redesigning for the
1979 models, anticipated the 1980 standard. The review of part numbers for 1979 and
1980 model bumper systems disclosed that most parts were the same.
5-17

To confirm that the lower cost change for 1979 model bumper systems relative to 1974
model bumper systems is the result of technological improvements, a trend study of
1977-1978 model bumper systems was performed. These models had to comply with the
same basic bumper requirements as the 1974 models. Therefore, differences in bumper
system costs should be the result of design or technology improvements.
Table V-6 shows the average cost of post-standard bumper systems including the trend
study results. The 1975-78 models selected were comparable to those cost-estimated
for 1974 and 1979 models (see Table V-l). Because of the small sample size of
1975-78 cars studied, only the composite average bumper system costs were compared.
The trend study indicates that the 1974 bumper system cost estimates were higher
than the costs of the comparable 1975-78 models. This suggests that the previous
conclusion was correct and that improved design and technology and the use of new
materials probably helped to lower bumper system costs.
5-18

TABLE V-6
AVERAGE COST TREND OF POST-STANDARD BUMPER SYSTEMS(1979 Dollars and Vehicle Mix)
Average Cost/Car(Front and RearCombined)
1973
$139
1974
$176
1975-1978
$161
1979
$186
1980
$188
4.0 ADDED LIFETIME FUEL COST
4.1 Incremental Bumper System Weight
Table V-7 shows weight increases of the bumper systems (without secondary
weight) for each version of the standard compared with the weights of 1972
pre-standard model cars. The incremental weights are shown by vehicle size for both
front and rear bumper systems. The method for arriving at these increments is the
same as for incremental costs in the previous section (a l l respective values in
Table V-3 are subtracted from those in Table V-2).
The costs of post-standard bumper systems were higher than pre-standard bumper
system costs. The bumper systems of 1979 and 1980 intermediate and f u l l size
vehicles had lower or equal costs compared to 1974 models. These lower costs
may reflect improved designs, technology, use of new materials, or downsizing.
Pre-standard bumpers were generally made of steel whereas post-standard
bumpers were made of various materials (aluminum and elastomerics as well as
steel) . The costs of post-standard bumpers represent an average of these
material types.
5-19

TABLE V-7INCREMENTAL BUMPER SYSTEM WEIGHT1/ PER CAR
(1979 Vehicle Mix)
iroQ
VEHICLE SIZE
SubcompactCompactIntermediateFun-Size
WeightedAverage
1973
Front
17297431
35
MODELS
Rear
192326
13
Total
18389757
48
1974
Front
17297431
35
MODELS
Rear
22475736
37
Total
397613167
72
1979
Front
244821-3
22
MODELS
Rear
2123172
17
Total
457138-1
39
1980 MODELS
Front
244820-2
22
: Rear
2224182
17
Total
4672380
39
1/ All incremental weights were found by subtracting the weight of 1972 of pre-standard systemsfrom the post-standard bumper weights. All weights are to the nearest pound.

4.2 Added Lifetime Fuel Cost
Using $1 per gallon (average price of gas in 1979), multiplying by 1.1 gallons
per pound of bumper weight (estimated over the l i f e of a car) times the
incremental bumper system weights shown in Table V-7, the l i fetime fuel
costs, due to increased weight for the bumper standard, are calculated.!?/
These fuel costs are shown in Table V-8. Added fuel costs for post-standard
cars ranged from $42 for 1979 models, to $79 for 1974 models. In Chapter VI
projected fuel costs for the remaining lives of various models are used9 and
then discounted to 1979, to reflect both the inflationary effect and present
value of the added l i fet ime fuel costs.
5.0 TOTAL INCREMENTAL BUMPER COST
Adding the values from Table V-5 (Incremental Consumer Costs) and Table V-8
(Lifetime Fuel Costs) yields the total incremental cost of the bumper system
for each version of the bumper standard. The results, broken down by vehicle
size for both front and rear bumper systems, are shown in Table V-9 for each
model year group.
In general, bumper system costs increased for post-standard vehicles. The
1973 models showed the smallest increase ($94) while 1974 bumper systems
increased the most (by $158) in comparison to 1972 (pre-standard) cars. (Only
the front bumper systems of 1979 and 1980 subcompacts declined in costs.)
\2J See brief discussion and sources in Section 2.3 of this chapter,
5-21

TABLE V-8
1973 MODELS
LIFETIME FUEL COST PER CARl/(in constant 1979 Dollars)
1974 MODELS 1979 MODELS 1980 MODELS
en
VEHICLE SIZE
SubcompactCompactIntermediateFull Size
WeightedAverage
Front
$19328134
38
Rear
1102529
14
Total
204210663
52
Front
19328134
38
Rear
24526340
41
Total
438414474
79
Front
265323-3
24
Rear
2325192
18
Total
497842-1
42
Front
265322-2
24
Rear
2426202
19
Total
5079420
43
1/ Based on weights in Table V-7 and using $1 per gallon (the price of gas in 1979) and 1.1 gallons perpound of bumper weight (estimated over the life of a car).

TABLE V-9
TOTAL INCREMENTAL COST OF BUMPER STANDARD DUE TO INCREASEDWEIGHT AND LIFETIME FUEL USE(In Constant 1979 Dollars)
tniroCO
VEHICLE SIZE
SubcompactCompactIntermediateFull Size
WeightedAverage
1973
Front
425013972
71
MODEL*
Rear Total
6143944
23
4864178116
94
1974
Front
425013972
71
MODELS
Rear
4910813391
87
Total
91158272163
158
1979
Front
791105748
73
MODELS
Rear
74624540
58
Total
15317210288
131
1980
Front
801105750
74
MODELS
Rear
76634840
60
Total
15617310590
134

Intermediates had the greatest average increase for the 1973 and 1974 versions
of the standard, and compact models' bumper systems increased the most for the
1979 and 1980 standards. For 1973 models, the cost of front bumper systems
increased more than rear systems while for 1974 and later models the reverse
was true.
The next chapter addresses the benefits of bumper systems, and together with
the cost of such systems, net benefits are derived, taking into account a
range of secondary weights.
5-24

CHAPTER VI
BUMPER STANDARD—BENEFITS AND COSTS
1.0 INTRODUCTION
1.1 Comparing Benefits and Costs
In this chapter the lifetime benefits of each version of the bumper
standard are computed and compared with the respective lifetime
incremental costs. The lifetime benefits of the standard are the
difference in repair costs between pre- and post-standard cars for the
total number of low-speed collisions that occur in an average car's life.
The repair cost data for pre- and post-standard cars were obtained in both
the driver survey of unreported, low-speed collisions and the insurance
claim study and were presented in Chapter IV.
Lifetime incremental costs, calculated in Chapter V, include the
incremental cost to the consumer plus the added lifetime fuel cost that
can be attributed to the bumper standard. The incremental consumer cost was
estimated from tear-downs of pre- and post-standard bumper systems.
Since both benefits and costs of the standard are expressed in dollars, they
can be compared directly to determine if the standard was sufficiently
effective to "pay for itself."
6-1

1.2 Selection of an Effectiveness Measure
The objective of this report is to determine if the bumper standard
achieved sufficient benefits to offset the added costs associated with the
standard. For the standard to do this, its lifetime benefit—the
difference between pre- and post-standard cars' damage repair costs in
low-speed collisions over a car's life—must be larger than the lifetime
cost of the standard—incremental consumer cost plus added fuel cost.
There are several ways to compare benefits and costs:
o Benefit to cost ratio
o Number of years to recoup costs
o Net benefit (benefit minus cost)
Each of these methods will be briefly discussed below.
If the standard is cost-effective, the benefit-cost ratio (B-C ratio)
should equal or exceed unity. It is a "quick" ratio to measure the
effectiveness of the standard. Such ratios are useful in comparing
alternative programs or solutions to a problem, but by themselves do not
reflect the magnitude of benefits or costs. B-C ratios are valuable when
there is a large difference among alternatives (e.g., B-C ratios of 2/1,
10/1, etc.). The difference in the effectiveness of the versions of the
bumper standard may not be sufficiently large to result in B-C ratios that
would be useful for analysis.
6-2

Computing the number of years to recoup costs of the standard is a
comparison of the annual benefits with the total costs of the
standard. The technique can be applied when the costs are a one time
investment, and there is an expected time period in which the costs
should be offset by benefits. The costs of the bumper standard are
both "one time" (consumer costs) and variable (fuel cost). There is
no prescribed time period in which a standard is to achieve a prede-
termined level of effectiveness. Therefore, using the "number of
years to recoup costs" technique is not appropriate for evaluating
the bumper standard.
The net benefit of the standard is the difference between the
lifetime benefits and the lifetime costs. After all the costs
associated with the standard are deducted from its gross benefits,
the remainder, or net benefit of the standard, is a measure of
effectiveness. The implied intention here is that the bumper
standard should provide sufficient property damage protection to
offset its added costs.
The net benefits measure was selected as the appropriate
effectiveness criterion for comparing benefits and costs of the
bumper standard.
6-3

1.3 Contents of the Chapter
This Chapter is divided into the following topics:
o Description of Factors Involved in the Calculation of Lifetime
Benefits and Costs
o Calculation of Lifetime Benefits
o Calculation of Lifetime Costs
o Net Benefits of the Bumper Standard
o Additional factors Affecting Net Benefits
2.0 DESCRIPTION OF FACTORS INVOLVED IN THE CALCULATION OF LIFETIME
BENEFITS AND COSTS
2.1 Selection of Inflation Rate
The bumper standard has been in effect for over seven years, during a time
when the value of the dollar has changed considerably. The purchase price
of an automobile has nearly doubled during this period. The cost of both
labor and materials for repairs has increased by a similar magnitude. In
order to evaluate the standard, dollars from different time periods had to
be compared. To do this, an inflation rate that is representative of the
overall time period was estimated. This rate is a measure of the change
in the value of money over that time period.
6-4

To select an appropriate inflation rate, a comparison of four of the
Bureau of Labor Statistic's indices, relevant to automobile repair costs,
was conducted. These included the Auto Repair Index, the New Car Price
Index, the New Tire Price Index, and the Consumer Price Index.l/
During most of the years in question, a ten percent inflation rate best
fitted the rate of change in the indices and was used to adjust the
benefits and costs of the bumper standard for inflation.
2.2 Establishment of a Base Year for Analysis
A base year is needed for economic analysis so that dollar values of
benefits and costs from different time periods can be compared. In
theory, any year—even one outside the study period—can be selected.
This assumes that possible errors are small when using inflation or
discount rates not representative of the actual change in money values
during the time period; that is, the rate is too high or too low or the
change in the rate over time is geometric rather than linear.
The year 1979 was selected as the base for the analysis of benefits and
costs since it was the latest year for which actual economic data were
1/ KLD Associates, Analysis of Insurance Claims to Determine Bumper Effecton Crash Damage, DOT-HS-805-842 and 843, March 1980, pp. 23-25.
6-5

available. Most of the unreported, low-speed collisions which were studied
occurred during 1979 and the repair costs for damaged cars in those
collisions were estimated using 1979 labor rates and part costs. Insurance
data were analyzed for 1972 through 1979 calendar years and included claims
for 1969 through 1979 model cars. Consumer costs for 1972 through 1980
bumpers were analyzed from tear-downs. Calendar year 1980 had not ended
when this analysis was begun and complete actual 1980 economic information
was not available.
2.3 Controlling for a Changing Vehicle Size Mix
During the time period the bumper standard has been in effect (1973-1980),
the mix of new vehicle sizes sold each year changed from one in which full
size cars predominated to a mix containing more economical, fuel efficient,
subcompact cars. The values of the following three variables used in the
calculation of net benefits differed significantly by vehicle size class:
(1) the proportion of bumper-involved insurance claims, (2) the repair cost
for damage in bumper-involved insurance-claimed accidents, and (3) the
incremental consumer cost of the standard. For these variables the vehicle
size mix was held constant from one model year to the next. This approach
helped to ensure that differences in net benefits of the various versions
of the standard were due to the different requirements of the standards
rather than the effect of a changing vehicle mix.
6-6

To correspond with the base year selected for the analysis, the vehicle mix
of 1979 model cars sold in 1979 was used as the constant vehicle mix for
weighting and calculating, broken down by vehicle size class, the three
affected variables. Section 6.0 looks at the effect on net benefits of
using vehicle mixes which correspond to the model years of the different
versions of the standard rather than using the 1979 mix.
2.4 Low-Speed Collisions Reported to the Police
Certain low-speed collisions which result in property damage may have to be
reported to the police. Generally, if an injury occurs, the collision must
be reported. When the collision only involves property damage, it is
usually reported to the police if the estimated repair cost exceeds a
predetermined amount. For some of these collisions, although a police
report is completed, an insurance claim may not be filed, especially if the
estimated repair cost is about the same as the deductible amount in the
driver's insurance policy.
The driver survey showed that about seven percent of low-speed collisions
involving the bumper were reported to the police only—no insurance claim
was filed. The other 93 percent were either unreported or an insurance
claim was filed. To obtain a representative sample of police reported
collision reports would have required another, costly survey. The variety
of police reporting requirements—particularly those for low-speed
6-7

collisions—would have made obtaining a representative sample difficult.
Also, the cost of damage in a police-reported collision is probably quite
close to that of an unreported collision. Benefits from reduced repair
costs in police-reported collisions would be very small when compared to the
benefits from unreported collisions or collisions in which an insurance
claim was filed. Excluding benefits based on police reported collisions
would have the effect of slightly understating the estimates of benefits of
the bumper standard.
Because of these factors, police-reported collisions were not included in
this study.
2.5 Effect of Secondary Weight
Chapter V included a discussion of secondary weight—weight of dependent
automotive systems, such as suspension and brake systems, which change with
total vehicle weight changes. Because the bumper standard increased the
weight of the bumpers, consideration of the effects of secondary weight are
necessary.
Previous studies have included estimates of the secondary weight factor. An
assessment of the bumper standard published in 1979 assumed an adjustment of
0.35 pounds of secondary weight per pound of primary bumper weight
6-8

change..£/ In response to automotive industry comments to the docket
regarding the assessment's secondary weight factor, an analysis of primary
and secondary weights was performed, and the factor was revised to
0.5.1/ The auto industry submitted several estimates of secondary
weight: General Motor's estimated factor was between 0.75 and l.Qi/
and Ford's was 1.1 to 1.6§/ The Ford estimates of secondary weights
were not specifically keyed to bumper systems alone and may not solely
reflect changes in bumper system weight.^./ The secondary weight
factors used in subsequent sections range from 0.35 to 1.0.
As in the previous calculations of incremental cost, described in Chapter
V, two costs are associated with secondary weight--consumer cost and
additional lifetime fuel cost. The consumer cost was estimated for two
different assumptions. One is based on the average consumer cost per pound
of car ($1.60/pound in 1979 dollars). The other is the additional
"material only" cost of steel and aluminum incorporated into the car in
2/ National Highway Traffic Safety Administration, "Final Assessment ofthe Bumper Standard," June 1, 1979, p. 48.
3/ The Transportation Systems Center analyzed industry data and performedan independent analysis. The results are summarized in an attachment to aletter dated March 18, 1980, from the Administrator of NHTSA to theChairman of the House Subcommittee on Consumer Protection and Finance, p.16.
4/ Ibid, p. 20.
5/ Ibid.
6/ Ibid, p. 16.
6-9

production (using a 9 to 1 steel to aluminum ratio, at $0.22 and $1.11 per
pound, respectively). This works out to a consumer cost of $0.60 per added
pound of bumper weight in 1979 dollars.Z/ The added lifetime fuel cost
for secondary weight is the product of the lifetime fuel requirements (1.1
gallons/pound), the cost of fuel, the change in weight due to the standard,
and the secondary weight factor (the number of pounds added to dependent
systems per additional pound of bumper weight).
3.0 LIFETIME BENEFITS
3.1 Definition of Lifetime Benefits
Benefits come from property damage protection in low-speed collisions
afforded by bumper systems which meet the standard. Measurement of
property damage protection is a comparison of the difference in repair cost
(incremental repair cost) of damage to pre- and post-standard cars in
low-speed collisions. The incremental repair cost summed over the number
of low-speed collisions that can occur in a car's life is defined as the
lifetime benefit of the standard.
77 THe calculation for this consumer cost is:
[$0.22 x 0.9 + $1.11 x 0.1] = $0.31 (the variable cost in 1978 dollars)Consumer cost = Variable cost x 1.767 = $0.31 x 1.767 = $0.55 (1978dollars)Consumer cost (1979 dollars) = $0.55 x 1.1 = $0.60
6-10
The number of low-speed collisions that can occur in a car's life is
assumed to be the same for both pre- and post-standard cars..8/
Because post-standard bumper systems are expected to reduce damage in some
collisions to zero, the number of low-speed collisions in which the car is
damaged should be different for pre- and post-standard cars and must be
taken into account when computing lifetime benefits.
The survey and insurance claim analysis are the data sources that were
used for computing lifetime benefits. In the following sections benefits
will first be calculated in constant 1979 dollars and then discounted to
reflect the stream of future benefits for the various make/model bumper
systems.
3.2 Gross Lifetime Benefits in Constant 1979 Dollars
The benefit as derived here is the incremental change in dollars of repair
costs between pre- and post-standard cars. The total repair cost is the
sum of repair costs obtained from unreported and "insurance
8/ Drivers were asked as part of the national survey on unreportedcollisions how many miles their cars had been driven during the same timeperiod for which unreported collisions occurred. Incident rates per 1,000vehicle miles were computed and showed older cars had a greater collisionrate per mile than newer cars. The newer cars, however, were used moreand had higher mileage for the same time period. The net effect was thatthe unreported collision rate based on time alone was about the same forold and new cars. The small sample sizes of each model year group pluslesser confidence in data based on drivers ability to recall vehiclemileage, led to the assumption that an average incident rate per yearshould be used for all age vehicles.
6-11

claimed" collisions. To determine the lifetime benefit, it is assumed that annual
benefits are average values which are then expanded to reflect a 10 year life for a
car .9/40/
3.2.1. Calculation of Gross Lifetime Benefits in Constant 1979 Dollars
The following expression is used to calculate the value of incremental gross
benefits (B):
B = L [U {(D1Ci)-(D2C2)} + (N1I1K1) - (N2I2K2) ]
where:
B = The incremental gross benefits of post-standard bumper systems in dollars.
L = Average car life = 10 years.
U = The low speed collision incident rate of all cars on the road each year. A
value of 13.7 percent was found from the driver survey (see Chapter III,
Sec. 3.1.5).
97Transportation Systems Center study of R.L. Polk registration datacontained in the following publication: Environmental Protection Agency,Passenger Car Fuel Economy: EPA and Road, (Washington, D.C.: U.S.Government Printing Office, September 1980), pp. 264-271.
10/ Federal Highway Administration, Cost of Owning and Operating"Automobiles and Vans, 1979 (Washington, D.C.I U.S. Government PrintingOffice, 1980), p. 4.
6-12

D = The damage frequency of cars per unreported co l l i s ion ,that i s , the percentage of cars damaged in unreportedcol l is ions. Ref. Tables IV-1, 2 and 3 for combined frontand rear col l is ions, front col l is ions, and rear col l is ions,respectively.(Dj = pre-standard; D;? = post-standard)
C = The cost ($) to repair damage, per car, in unreportedcol l is ions. Ref_. Table IV-10.
= pre-standard; C2 = post-standard)
N = Number of property damage insurance claims, per insured car,per year. Ref. Table IV-14(Nj = pre-standard; N = post-standard)
I = Proportion of property damage insurance claims involving thebumper, to a l l property damage insurance claims ( ra t io ) .Ref. Table VI-1(I]_ = pre-standard; I2 = post-standard)
K = The cost ($) to repair damage in insurance claims involvingthe bumper. Ref. Table IV-11.(K]_ = pre-standard; K2 = post-standard)
This equation yields values of incremental gross benefits for the
combination of front and rear bumper systems. Before continuing with
an example, two tables are presented which give the ratios ( I ) of
property damage insurance claims involving the bumper, to al l
property damage insurance claims (Table VI-1); and the ratios of cars
in unreported coll isions struck in either the front or rear (Table
VI-2). The lat ter values are used when calculating the incremental
benefits for either the front or rear bumper systems.
6-13

TABLE VI-1
PROPORTION OF PROPERTY DAMAGE INSURANCECLAIMS, INVOLVING THE BUMPER, TO ALLPROPERTY DAMAGE INSURANCE CLAIMS
MODEL YEAR
Pre-Std. (1972)
1973
1974-78
1979
COMBINED FRONT AND REAR
0.57
0.53
0.41
0.42
FRONT ONLY
0.35
0.28
0.25
0.24
REAR ONLY
0.22
0.25
0.16
0.18
TABLE VI-2
PROPORTION OF CARS STRUCK IN FRONT OR REARIN UNREPORTED, LOW SPEED COLLISIONS
MODEL YEAR
Pre-Std (All
1973
1974-78
1979-80
pre-1973)
FRONT ONLY
0.48
0.44
0.46
0.43
REAR ONLY
0.52
0.56
0.54
0.57
6-14

3.2.2. Sample Calculation of Incremental Benefits for the 1979 Model Year
Front Bumper System
The equation for calculating the incremental benefit of either the front or rear
bumper system differs only slightly from the one used for combined bumper systems.
B(Front)=L J*u{(DiCiPi) - (D2C2P2)}
All definit ions are the same as l isted in Section 3.2.1 except that substitions for
D, C, I and K must ref lect the appropriate value for front bumpers, and where:
P = The proportion of cars in unreported coll isions that werestruck in the front or rear ( ra t io ) .Ref. Table VI-2{P\ = pre-standard; P2 = post-standard)
Using the values for 1979 Model Year front bumper systems found in the references
l isted in each def in i t ion, and using L = 10 years (average l i f e of a car) and U =
0.137 (13.7 percent of al l cars on the road are involved in an unreported low-speed
col l is ion per year):
B(front) = 10[0.137 ((0.60 x 188 x 0.48) - (0.38 x 166 x 0.43))+ (0.179 x 0.35 x 745) - (0.147 x 0.24 x 891)]
B(front) = $ 189
6-15

The incremental gross lifetime benefits for all bumper standard
versions, front and rear systems combined and separately, are shown
in Table VI-3.
TABLE VI-3
GROSS LIFETIME BENEFITSOF BUMPER SYSTEMS IN CONSTANT 1979 DOLLARS
MODEL YEARAND SYSTEM
1973 Front and RearFrontRear
1974-78 Front and RearFrontRear
1979 Front and RearFrontRear
INCREMENTALGROSS BENEFIT
$
111133-21
22914882
221189
33
CONFIDENCEINTERVAL!/
$
72 to 15098 to 168
-45 to 3
197 to 261113 to 183
63 to 101
176 to 266147 to 231
6 to 60
1/ Due to sampling error, the range of gross benefits at a 95percent confidence level is shown.
6-16

3.3 Discounting Gross Lifetime Benefits
Discounting is the process by which a future stream of benefits are valued
in present dollars. The purpose of the calculation is to bring expected
benefits that accrue over varying future lives back to a common base period
so that preferred program actions can be taken when choosing among
alternatives. While this definition does not completely apply here,
discounting future benefits of the various bumper systems is appropriate
since all post-standard cars, as well as a number of pre-standard models
are, and will be, on the road to complete their individual life spans.
A car life is assumed to be 10 years during which it travels 100,000 miles
(see Section 3.2 for reference). It is also assumed that the benefits will
accrue on a mileage basis over a car's life. The frequency of low-speed
collisions is somewhat dependent on the amount of miles a car is driven.
This suggests the benefits will also be mileage dependent. A measure of
the rate that benefits accrue per mile of driving is estimated using the
gross lifetime benefits from Table VI-3 divided by the lifetime vehicle
miles (100,000 miles). The vehicle miles traveled each year are shown in
Table VI-4.
6-17

YEAR
TABLE VI-4
VEHICLE MILES TRAVELEDDURING A CAR'S LIFE
1
2
3
4
5
6
7
8
9
10
TOTAL 100,000
ANNUAL MILESTRAVELED If
18,110
15,110
13,260
11,830
10,580
9,240
7,820
6,200
4,600
3,250
CUMULATIVE MILESTRAVELED
18,110
33,220
46,480
58,310
68,890
78,130
85,950
92,150
96,750
100,000
1/ National Highway Traffic Safety Administration, Department ofTransportation, Final Assessment of the Bumper Standard, DOT HS-804-718,(June 1, 1979), p. 23.
3.3.1 Discounting Method for Lifetime Benefits
Future benefits are discounted to this evaluation's base calendar
year of 1979 (end of year). A 1979 model year car, for example, is
considered to be new with ten years to go for discounting purposes,
6-18

Likewise, a 1973 model will have accumulated six "historical" years
through calendar year 1979 and have four "future" years over which
benefits are still to be obtained.
To calculate discounted future benefits, a discount rate of 10
percent is used.11/ Discount factors to be applied in the
calculation are given in Table VI-5.
TABLE VI-5
DISCOUNT FACTORS FOR A 10 PERCENT RATE
YEAR FACTOR
1 0.909
2 0.826
3 0.751
4 0.683 .
5 0.621
6 0.564
7 0.513
8 0.467
9 0.424
10 0.386
11/ Office of Management and Budget, "Discount Rates to Be Used inEvaluating Time Distributed Costs and Benefits," Circular A-94,Revised (March 27, 1972), Attachment A.
6-19

The expression for discounted gross benefits is as follows:
, y=H y=10B (discounted) = B <r~» A (y) + <Cp> A (y)-S (y-H)[
1 y=Hwhere:
B The gross incremental benefits of post-standard bumpersystems in dollars (constant 1979 dol lars), from TableVI-3.
M = Lifetime vehicle miles traveled—100,000 miles, Ref. TableVI-4.
A = Annual miles traveled over a car's ten year l i f e . Ref.Table VI-4.
y = Year of car l i f e , 1 through 10.
H = Number o f ' "h is to r ica l " years--the number of years a carmodel has been on the road through the base year fordiscounting.
S = Discount factor at a 10 percent rate. Ref. Table VI-5.
3.3.2. Sample Calculation of Discounted Gross Benefits for the Model
Year 1979 Front Bumper System
The 1979 model year cars have no "histor ical" years (H = 0) through
the base calendar year 1979 (end of year). The stream of benefits
due in the "future" ten years have to be discounted to the base year.
Therefore, the equation shown in the previous section is now
expressed with the appropriate summation l imi ts .
B (discounted) = BM
1^
y^ A (y) + ^ - » A (y)-S (y)
6-20

Substituting, and summing up, B (discounted) is:
$__189__"100,000
18,110+15,110+13,260+11,830+10,580+ 9,240+ 7,820+ 6,200+ 4,600+ 3,250
XXXXXXXXXX
0.9090.8260.7510.6830.6210.5640.5130.4670.4240.386
$ 130
The complete discounted incremental gross benefits for all post-
standard bumper systems are shown in Table VI-6.
TABLE VI-6
GROSS LIFETIME BENEFITS OF POST STANDARDBUMPER SYSTEMS—DISCOUNTED
TO 1979 DOLLARS
MODEL YEARAND SYSTEM
1973 Front and RearFrontRear
1974-78 Front and RearFrontRear
1979 Front and RearFrontRear
DISCOUNTEDINCREMENTALGROSS BENEFITS
$
107128-20
19812871
15213023
CONFIDENCE INTERVAL 1/$
69 to 14595 to 161
-43 to 3
170 to 22698 to 16155 to 3
121 to 183101 to 1594 to 42
1/ Due to sampling error, the range of gross benefits, at a 95 percent confidenceTevel, is shown.
6-21

4.0 LIFETIME COSTS
4.1 Introduction
In Chapter V, the lifetime costs of the bumper standard were presented
and included both the incremental consumer cost to make bumpers comply
with the standard, and the lifetime fuel cost for the extra weight of
post-standard bumpers. The former cost (incremental consumer cost) is a
one-time expense paid by consumers when purchasing a new car. In this
sense, it is a sunk cost and as such has no future implications. The
incremental consumer costs of the bumper standard (taken from Table V-4)
are repeated in Table VI-7 for 1973, 1974 and 1979 models (since
insurance data was not available for 1980 model year cars, their gross
benefits were not calculated and so their costs are not included in this
section).
VEHICLE SIZE
Weighted Average
TABLE VI-7
INCREMENTAL CONSUMER COST OF EACHBUMPER STANDARD VERSION
(1979 Dollars and Vehicle Mix)
1973 MODELSFRONT REAR TOTAL
1974 MODELSFRONT REAR TOTAL
1979 MODELSFRONT REAR TOTAL
SubcompactCompactIntermediateFull
23185838
541415
28227253
23185838
25567051
4874
12889
53573451
51372638
104946089
33 42 33 46 79 49 40 89
6-22

Fuel costs, for added bumper weight, accumulate over the car's life
and should be discounted in the same manner as were future gross
benefits. Fuel costs in Chapter V were calculated using a factor of
1.1 gallons of fuel required over the life of a car for each
additional pound of bumper weight. The bumper weights (taken from
Table V-7) are repeated in Table VI-8 (1980 bumper weights are
excluded).
4.2 Lifetime Discounted Fuel Costs
In Chapter V the fuel costs were calculated in constant 1979 dollars
for which only the 1979 price of fuel was required ($l/gallon was
the estimate) and the total lifetime rate (1.1 gallons per pound)
was used without regard to how the fuel costs were distributed over
the car's life. To discount the future fuel costs, a basis for
distributing these costs must be assumed. The approach used here is
that fuel costs will accrue on a mileage basis over a car's life--
the same assumption that was made for discounting future gross
lifetime benefits. Again a car's life is assumed at 10 years with a
total mileage of 100,000 miles, which is distributed annually as
shown in Table VI-4. To compute the fuel cost each year, for
discounting purposes, an estimate of the cost per mile is required.
This is done as follows: (1.1 gallons/pound x incremental bumper
weight) divided by 100,000 to yield the fuel cost per mile for the
added bumper weight. The lifetime fuel costs in constant dollars
(from Chapter V) are shown in Table VI-9.
6-23

VEHICLE SIZE
Subcompact
Compact
Intermediate
Full
Wei anted Averaa
INCREMENTAL
FRONT
17
29
74
31
e 35
1973REAR
1
9
23
26
13
TABLE VI-8
BUMPER SYSTEM WEIGHT
TOTAL
18
38
97
57
48
FRONT
17
29
74
31
35
1974REAR
22
47
57
36
37
TOTAL
39
76
131
67
72
FRONT
24
48
21
-3
22
1979REAR
21
23
17
2
17
TOTAL
45
71
38
_l
39
VEHICLE SIZE
TABLE VI-9
LIFETIME FUEL COSTIN CONSTANT 1979 DOLLARS
(FUEL PRICE = $1.OO/GALLON)
1973FRONT REAR TOTAL
1974FRONT REAR TOTAL
1979FRONT REAR TOTAL
Subcompact
Compact
Intermediate
Full
19
32
81
34
1
10
25
29
20
42
107
63
19
32
81
34
24
52
63
40
43
84
144
74
26
53
23
-3
23
25
19
2
50
78
42
-1
Weighted Average 39 14 53 39 41 79 24 19 43
6-24

4.2.1. Discounting Method for Lifetime Fuel Cost
Future lifetime fuel costs are discounted to this evaluation's base
calendar year (end of 1979). A 1979 model year car is considered new with
a full ten year life remaining for discounting purposes; whereas, a 1973
model has accumulated six "historical" years (H = 6 in the following
equation) through calendar year 1979 and has four remaining years over
which fuel costs must be discounted. A 10 percent discount rate is used.
The factors in Table VI-5 will also apply here.
Since fuel prices have been rising at a rate greater than inflation, their
actual and projected prices in 1979 dollars for each year starting with the
base year 1979 must be used for discounting. Table VI-10 shows the fuel
price projections. For historical fuel costs (prior to the 1979 base
year), the 1979 fuel price ($1.00/gallon) applies since all dollars are
expressed in 1979 dollars.
The equation for discounted lifetime fuel costs is as follows:
F(discounted) =M
y=H
y-1
y=10
A (y)-(y-H).G (y-H)
y-H+1
6-25

where:
F = Lifetime fuel cost for added bumper weight in constant 1979
dollars from Table VI-9.
M = Lifetime vehicle miles traveled - 100,000 miles.
Ref. Table VI-4.
4L J6 1979 price of gas = $1.00/gallon, constant price for "h is tor ical"
miles traveled. Ref. Table VI-10.
A = Annual miles traveled over a car's ten year l i f e Ref. Table VI-4.
y = Year of car l i f e , 1 through 10.
H = Number of "h is tor ica l " years--the number of years a car model has been
on the road through the base year for discounting.
S = Discount factor at a 10 percent rate Ref. Table VI-5.
tG = Price of gas each year projected through 1982f in 1979
dollars Ref. Table VI-9.
6-26

TABLE VI-10
ESTIMATED AVERAGE PRICEOF UNLEADED GASOLINE^
2/CALENDAR YEAR PRICE ($/GALL0N IN 1979 DOLLARS)-
1979
1980
1981
1982
1983
1984
1985
1986
1987
1988
1/ National HighwayTransportation, Final
l.OOi/
1.18
1.20
1.25
1.27
1.33
1.38
1.39
1.40
1.41
Traffic Safety Administration, Department ofRegulatory Analysis for Model Year 1983-85 Light
Trucks, (November 1980), Table II-3, p. II-8.
2/ Original table was in 1980 dollars starting with the 1980 fuel priceand was deflated by 10% to get prices in 1979 dollars.
3/ See Chapter V for reference.
6-27

4.2.2 Sample Calculations of Discounted Lifetime Fuel Cost
Model Year 1979 Front Bumper System
The 1979 model year cars have no " historical " years (H=0) through the
base calendar year 1979 (end of year). The stream of fuel costs in the
ten year future have to be discounted to the base year. Therefore, the
previous equation for the 1979 model year cars becomes:
F(discounted) = < —M
y = 0 y = 10
A(y) A(y)- S(y)'G(y)
y = 1 y =
Substituting, and summing up, F(discounted) i s :
$ 24100,000
+18110+15110+13260+11830+10580
92407820620046003250
0.909 x0.826 x0.751 x0.673 x0.621 x0.564 x0.513 x0.467 x0.424 x0.386 x
1.001.181.201.251.271.331.381.391.401.41
= $20
All the discounted l i fet ime fuel costs for post-standard bumper systems are
shown in Table VI-11.
6-28
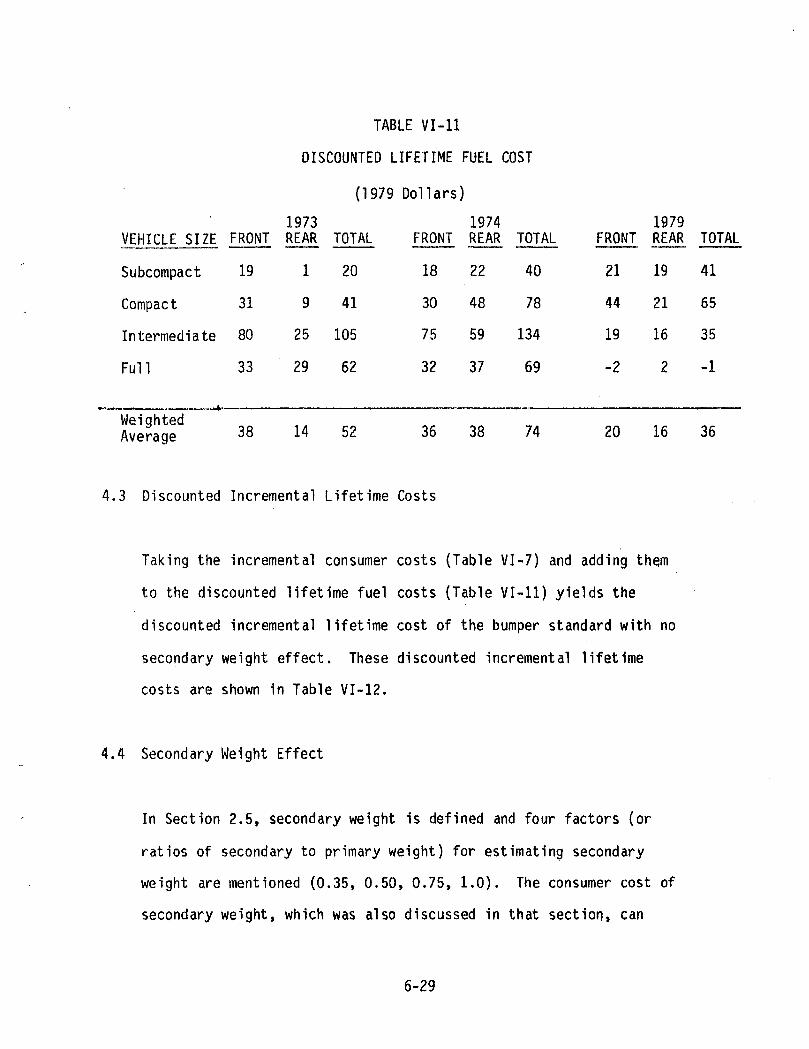
TABLE VI-11
DISCOUNTED LIFETIME FUEL COST
(1979 Dollars)
VEHICLE SIZE
Subcompact
Compact
Intermediate
Full
WeightedAverage
FRONT
19
31
80
33
38
1973REAR
1
9
25
29
14
TOTAL
20
41
105
62
52
FRONT
18
30
75
32
36
1974REAR
22
48
59
37
38
TOTAL
40
78
134
69
74
FRONT
21
44
19
-2
20
1979REAR
19
21
16
2
16
TOTAL
41
65
35
-1
36
4.3 Discounted Incremental Lifetime Costs
Taking the incremental consumer costs (Table VI-7) and adding them
to the discounted lifetime fuel costs (Table VI-11) yields the
discounted incremental lifetime cost of the bumper standard with no
secondary weight effect. These discounted incremental lifetime
costs are shown in Table VI-12.
4.4 Secondary Weight Effect
In Section 2.5, secondary weight is defined and four factors (or
ratios of secondary to primary weight) for estimating secondary
weight are mentioned (0.35, 0.50, 0.75, 1.0). The consumer cost of
secondary weight, which was also discussed in that section, can
6-29

range from $0.6Q/pound (only the added cost of material plus manufacturing
and sales overhead and pro f i t ) to $1.60/pound (the average consumer cost
per pound of cars sold in 1979).
TABLE VI-12
VEHICLE SIZE
Subcompact
Compact
Intermediate
Full
Weighted Averaqe
DISCOUNTED(NO
FRONT
42
49
138
71
i 71
1973REAR
6
13
39
44
23
INCREMENTAL LIFETIME COSTSSECONDARY WEIGHT)1979 DOLLARS
TOTAL
48
63
177
115
94
FRONT
42
48
133
70
69
1974REAR
47
104
129
88
84
TOTAL
88
152
262
158
153
FRONT
74
101
53
49
69
1979REAR
70
58
42
40
56
TOTAL
145
159
95
88.
125
As in the case of the bumper standard (incremental consumer cost and lifetime
fuel cost), the consumer cost of secondary weight is a sunk cost, but the fuel
cost is distributed over time and has to be discounted.
6-30

4.4.1 Method for Calculating Consumer Cost and Discounted Fuel Costs forSecondary Weight
The consumer cost of secondary weight is calculated as follows:
J = E-W-P
Where:
J = consumer cost of secondary weight in 1979 dollars.
E = secondary weight factor (0.35, 0.5, 0.75 or 1.0).
W = incremental bumper system weight.Rejf. Table VI-8.
P = Cost/# of secondary weight, $0.60 or $1.60.
To calculate discounted lifetime fuel costs for secondary weight, the
discounted lifetime fuel costs for the incremental bumper system weight
need only be multiplied by the secondary weight factor, as follows:
T (discounted) = E«F (discounted)
where:
T = lifetime fuel cost of secondary weight in 1979 dollars (as discounted)
E = secondary weight factor (0.35, 0.5, 0.75 and 1.0)
F (discounted) = discounted lifetime fuel cost for added bumperweight.Ref. Table VI-11.
6-31

4.4.2' A Sample Calculation of Secondary Weight Cost (Discounted)
The two equations just presented will be used in this example for
obtaining the discounted costs, due to secondary weight, of the
model year 1979 front bumper system.
The incremental weight of 1979 front bumpers is 22 pounds (Table
VI-8) and their discounted lifetime fuel cost is $20 (Table VI-11)
The consumer cost (J) is: J = E( 22 )( P )•
For P =
J (0 .35)
J (0 .50)
J (0 .75)
J ( i . o )
$0.60
= $5
= $7
= 10
= 13
• For P = $1.60
$12
18
26
35
The discounted lifetime fuel cost of the secondary weight for 1979
front bumpers is:
T(discounted) = E (20)
T(discounted)o.35 = $7
T(discounted)Q#5 = JQ
T(discounted)0.75 = 15
T(discounted)j>o = 20
6-32

The total cost of secondary weight, the sum of J + T (discounted), is:
Unit Price of Secondary Weight
Secondary WeightFactor
0.35
0.50
0.75
1.0
$.60/Pound
$12
17
25
33
$1.60/Pound
$19
28
41
55
Using the same approach outlined above, the costs of secondary weight are
shown in Table VI-13.
4.5 Total, Discounted Incremental (Lifetime) Bumper Costs
This section summarizes the various elements of cost, calculated in the
preceding sections, to obtain the incremental bumper costs that are
subtracted from gross benefits to arrive at net benefits. The cost
elements are as follows:
6-33
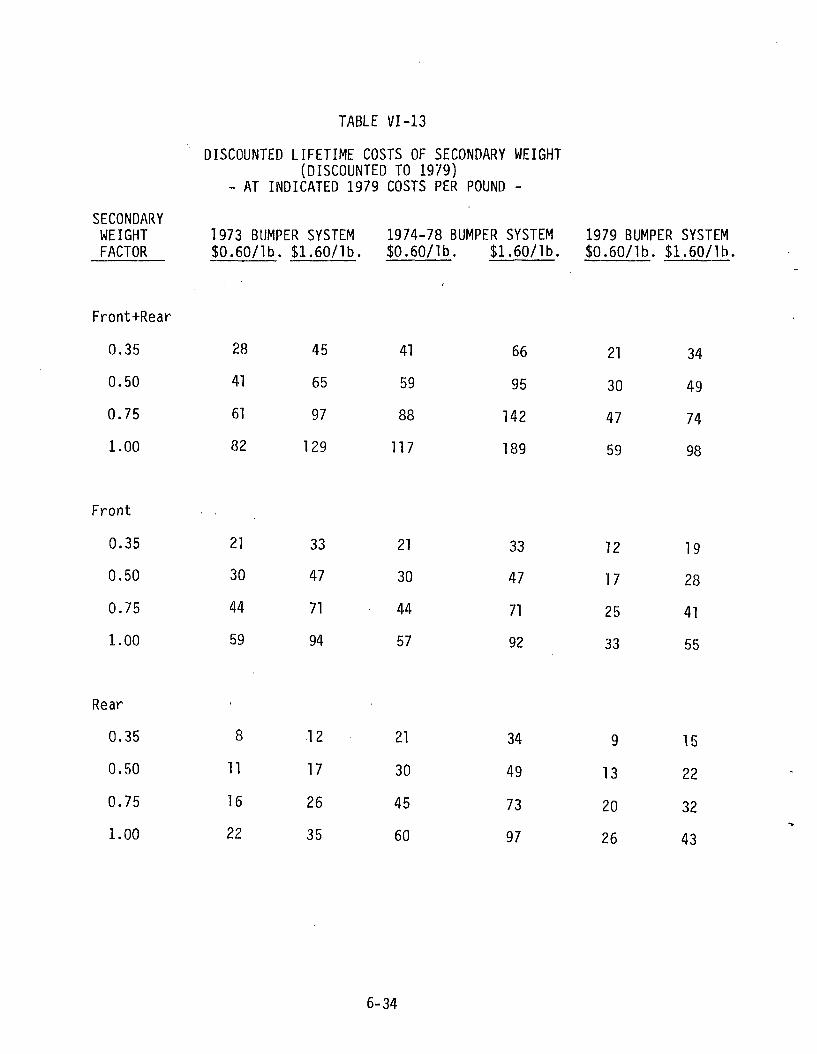
TABLE VI-13
DISCOUNTED LIFETIME COSTS OF SECONDARY WEIGHT(DISCOUNTED TO 1979}
- AT INDICATED 1979 COSTS PER POUND -
SECONDARYWEIGHTFACTOR
Front+Rear
0.35
0.50
0.75
1.00
Front
0.35
0.50
0.75
1.00
Rear
0.35
0.50
0.75
1.00
1973 BUMPER SYSTEM$0.60/ lb . $1 .60/ lb .
28
41
61
82
21
30
44
59
•
8
11
16
22
45
65
97
129
33
47
71
94
12
17
26
35
1974-78$0.60/ lb
41
59
88
117
21
30
44
57
21
30
45
60
BUMPER SYSTEM$1.60/ lb .
66
95
142
189
33
47
71
92
34
49
73
97
1979 BUMPER$0.60/ lb . $1
21
30
47
59
12
17
25
33
9
13
20
26
SYSTEM.60/lb
34
49
74
98
19
28
41
55
15
22
32
43
6-34

1. The incremental cost due to weight changes to meet bumper
standard requirements, that is, post to pre-standard
differentials.
2. The discounted lifetime fuel costs due to the weight increase
above.
3. The total secondary weight costs.
4. The discounted lifetime fuel cost due to secondary weight.
The first two elements are added and can be found in Table VI-12.
The last two are shown, as a sum, in Table VI-13. It now remains to
add the values of these tables, which is done in Table VI-14. Note
that the Total, Discounted, Incremental (Lifetime) Bumper Costs are
given for both the lower and upper range of secondary weight
cost/pound assumptions.
6-35

TABLE VI-14
TOTAL DISCOUNTED INCREMENTAL (LIFETIME) BUMPER COSTS 1/(DISCOUNTED TO 1979 DOLLARS)
- AT INDICATED 1979 SECONDARY WEIGHT COSTS/LB. -
SECONDARYWEIGHTFACTOR
Front+Rear0.000.350.500.751.00
Front0.000.350.500.751.00
Rear0.000.350.500.751.00
1973 BUMPER$0.60/ lb. $1
94122135155175
7192
101115130
2331343945
SYSTEM.60 / lb .
94139159191223
71104118142165
2335404958
1974-78 BUMPER$0.60/ lb. $1
153194212241270
699099
113128
84105114129144
SYSTEM.60/ lb .
153219248295342
69102116140163
84118133157181
1979 BUMPER$0.60/ lb. $1
125146155172184
69818694
102
5665697682
SYSTEM.60/lb
125158172199223
698897
110124
5671788899
1/ The summation of: (1) the incremental cost due to bumper weightchanges; (2) the discounted lifetime fuel costs due to the weightchanges; (3) the total secondary weight costs; and (4) the discountedlifetime fuel cost due to secondary weight.
6-36

5.0 NET BENEFITS
Net benefits of the bumper standard are the remaining discounted
benefits (in 1979 dollars) after the standard's discounted
incremental lifetime costs have been deducted from the discounted
incremental gross benefits.
5.1 Method for Determining Discounted Net Benefits
Since both gross lifetime benefits and the lifetime costs have been
discounted using similar procedures, calculating the discounted net
benefits involves a simple subtraction as follows:
Net Benefit (discounted) = B (discounted) - Q (discounted)
where:
B (discounted) = discounted incremental gross lifetime benefits,Ref. Table VI-6.
Q (discounted) = discounted incremental lifetime costs includingsecondary weight effects Ref. Table VI-14.
5.2 Sample Calculation of Discounted Net Benefits Including Secondary
Weight Effect
The 1979 model year front bumper system is used to work out an
example of the net benefit calculation. The discpunted, incremental
gross lifetime benefit (B) for this bumper system is $130 (dis-
counted, 1979) from Table VI-6 (Section 3.3.2). The discounted
incremental lifetime cost (Q) from Table VI-14 varies depending on
the secondary weight factor used and on the cost of secondary weight
per pound. Using 0.5 for the former and $1.60 for the latter, and
6-37

substituting Q = $99 (Table VI-14), the discounted net benefit is:
Net Benefit (discounted) = B (discounted) - Q (discounted)
Net Benefit (discounted) = $130- $99 = $31
The discounted net benefits for 1973> 1974-78 and 1979 model year
bumper systems are shown in Tables VI-15, 16 and 17. A brief
discussion of net benefits follows these tables.
6-38

TABLE VI-15
DISCOUNTED NET BENEFITS1973 BUMPER SYSTEMS
(1979 DOLLARS)
Secondary Weight Cost Factor 1/
SECONDARYWEIGHT
RATIO
Front and Rear0.000.350.500.751.00
Front0.000.350.500.751.00
Rear0.000.350.50
• 0.751.00
NOTE: Values may
$0.
NetBenefit
13-15-28-48-68
573627132
-43-51-54-59-65
be off by
60 per Pound
Confidence($) Interval ($) 2/
-25 to 51-53 to 23-66 to 10-86 to -10
-106 to -30
24 to 903 to 69
-6 to 60-20 to 46-35 to 31
-66 to -20-74 to -28-77 to -31-82 to -36-88 to -42
$1.00 due to rounding
$1.60 per
NetBenefit ($)
13-32-52-84
-116
572410
-14-37
-43-55-60-69-78
Pound
ConfidenceInterval ($) 2 /
-25 to 61-70 to 15-90 to -4
-122 to -37-154 to -69
24 to 90-9 to 57
-23 to 43-47 to 19-70 to -4
-66 to -20-78 to -32-83 to -37-92 to -46
-101 to -55
1/ The $0.60/pound secondary weight cost factor is the 1979 consumer"cost of secondary weight of material incorporated into a production car. Itassumes a 9 to 1 steel to aluminum mix. The $1.60/pound factor represents the1979 consumer cost per pound of car.
2/ The 95 percent confidence level.
6-39

TABLE VI-16
DISCOUNTED NET BENEFITS1974-78 BUMPER SYSTEMS
(1979 DOLLARS)
Secondary Weight Cost Factor 1/
SECONDARYWEIGHT
RATIO
Front and Rear0.000.350.500.751.00
Front0.000.350.500.751.00
Rear0.000.350.500.75
'1.00
$0.60 per
NetBenefit ($)
454
-14-43-73
59382915
0
-13-34-43-58-73
Pound
ConfidenceInterval ($) 2/
17 to 73-24 to 32-42 to 14-71 to -15
-101 to -45
29 to 898 to 68
-1 to 59-15 to 45-30 to 30
-29 to 3-50 to -18-59 to -27-74 to -42-89 to -57
$1.60 per
NetBenefit ($)
45-21-50-97
-144
592612
-12-35
-13-47-62-86
-no
Pound
ConfidenceInterval ($) 2 /
17 to 73-49 to 7-78 to -22
-125 to -69-172 to -116
29 to 89-4 to 56
-18 to 42-42 to 18-65 to -5
-29 to 3-63 to -31-78 to -46
-102 to -70-126 to -94
NOTE: Values may be off by $1.00 due to rounding
V The $0.60/pound secondary weight cost factor is the 1979 consumercost of secondary weight of material incorporated into a production car. Itassumes a 9 to 1 steel to aluminum mix. The $1.60/pound factor represents the1979 consumer cost per pound of car.
2/ The 95 percent confidence level.
6-40

TABLE VI-17
DISCOUNTED NET BENEFITS1979 BUMPER SYSTEMS
(1979 DOLLARS)
Secondary Weight Cost Factor ]_/
SECONDARYWEIGHTRATIO
Front and Rear0.000.350.500.751.00
Front0.000.350.500.751.00
Rear0.000.350.500.751.00
$0.
NetBenefit
276-3-20-32
6149443628
-33-42-46-53-59
60 per Pound
Confidence($) Interval ($) 2/
-4 to 58-25 to 37-34 to 28-51 to 11-63 to -1
32 to 9020 to 7815 to 737 to 65-1 to 57
-52 to -14-61 to -23-65 to -27-72 to -34-78 to -40
$1.60 per
NetBenefit ($)
27-7
-22-47-71
614233206
-33-48-55-65-76
Pound
ConfidenceInterval ($) 2/
-4 to 52-38 to 24-53 to 9-78 to -16-102 to -40
32 to 9013 to 714 to 62-9 to 49-23 to 35
-52 to -14-67 to -29-74 to -36-84 to -46-95 to -57
NOTE: Values may be off by $1.00 due to rounding
]_/ The $0.60/pound secondary weight cost factor is the 1979 consumercost of secondary weight of material incorporated into a production car. Itassumes a 9 to 1 steel to aluminum mix. The $1.60/pound factor represents the1979 consumer cost per pound of car.
2/ The 95 percent confidence level.
6-41
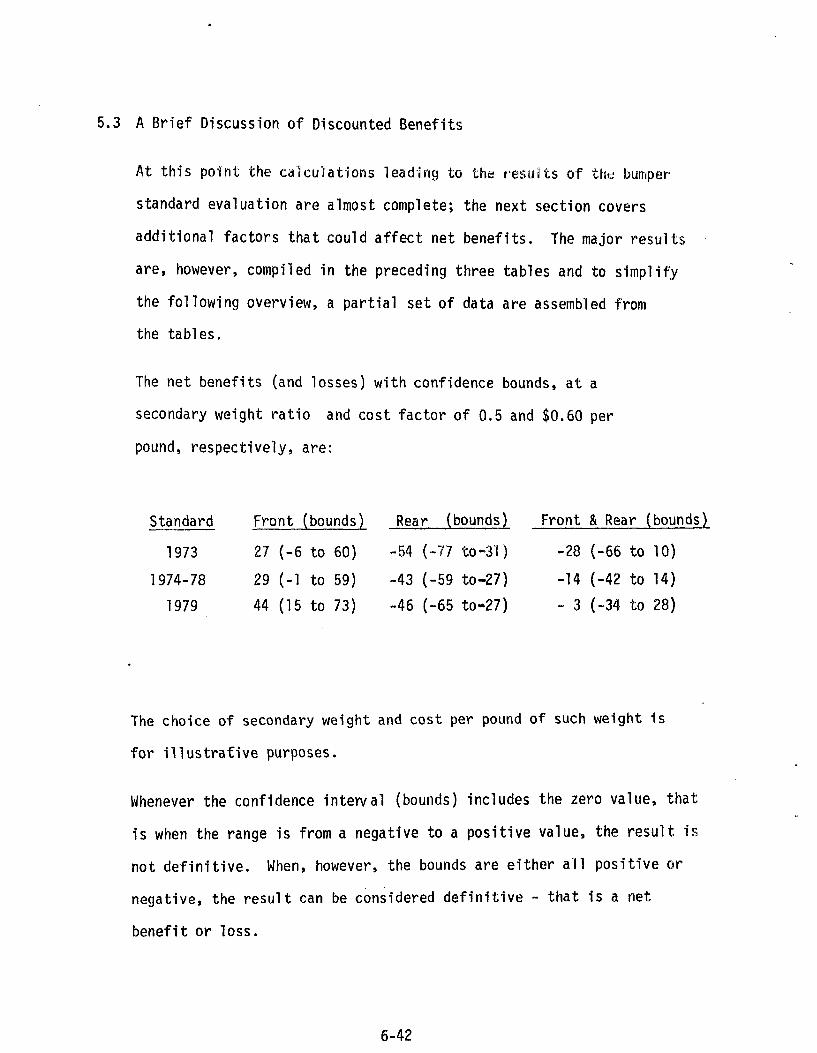
5.3 A Brief Discussion of Discounted Benefits
At this point the calculations leading to the results of the bumper-
standard evaluation are almost complete; the next section covers
additional factors that could affect net benefits. The major results
are, however, compiled in the preceding three tables and to simplify
the following overview, a partial set of data are assembled from
the tables.
The net benefits (and losses) with confidence bounds, at a
secondary weight ratio and cost factor of 0.5 and $0.60 per
pound, respectively, are:
Standard Front (bounds) Rear (bounds) Front & Rear (bounds)
1973 27 (-6 to 60) -54 (-77 to-31) -28 (-66 to 10)
1974-78 29 (-1 to 59) -43 (-59 to-27) -14 (-42 to 14)
1979 44 (15 to 73) -46 (-65 to-27) - 3 (-34 to 28)
The choice of secondary weight and cost per pound of such weight is
for illustrative purposes.
Whenever the confidence interval (bounds) includes the zero value, that
is when the range is from a negative to a positive value, the result is
not definitive. When, however, the bounds are either all positive or
negative, the result can be considered definitive - that is a net
benefit or loss.
6-42

On this basis, the 1979 front bumper system is cost effective,
i.e., shows a definitive net benefit. Rear bumper systems for all
post-standard models show consistent net losses. The combined
front and rear bumper systems for all model years (post standard)
show results (as per preceding illustration) that are not definitive.
Going back for a moment,to front bumpers, the bounds for 1973 and
1974-78 models cross the zero value, but are predominantly in the
positive range. While a strict adherence to the criteria would
require that the results be termed "not definitive", there is, in
these two cases, a "tendency toward" a net benefit.
Up to a secondary weight ratio of 0.5 (and $0.60/lb.) front bumper
systems on post standard cars tended to be cost effective - the 1979
bumper system definitely. All rear bumper systems for post standard
cars show net losses even when no secondary weights are included.
The combined front and rear results for post standard bumper systems
vary quite a bit. Only the 1974-78 models yield a definite net benefit
and that is limited to the case where \/ery little, or no secondary
weight is included. The 1979 models "tend" toward a net benefit
under similar circumstances. All other cases are either not definitive
or show net losses.
The introduction of standards in model year 1973 required "beefed up"
bumpers at a sizeable weight and cost penalty. They tended to do
the job of exterior protection in the front (1973), but the combination
of bumper cost and the limited repair costs avoided (benefits) made the
2 1/2 miles per hour rear bumpers incur a net loss.
6-43

"Heavy" systems continued into the next bumper eras the 5 and 5,
which ran for five model years and by 1978, more than 60 percent
of the cars on the road were so equipped.
The next phase was, and is, the size and weight reduction—or
downsizing--in response to energy conservation demands. This required
a serious review of component design, and beginning in 1977 and
continuing in the years since, bumper designs have emerged in harmony
with car weight reduction programs. The incremental cost dropped
(1979 <1974 in relation to pre-standard), improving the tendency of
front bumper net benefits in 1979 models, but not doing much for rear
bumpers.
With redesign—lower weight, new materials, advanced technology—the
1979 model front bumpers did relat ively wel l , given the col l is ion
probabil i t ies with heavier cars in the fleet—although i t already
included certain lines of downsized 1977 and 1978 models.
The results are based on data from several sources. The "benefit"
side derives from the survey and insurance claim f i l e s . When
comparing damage frequencies of post standard cars with pre-standard
cars, the results from the survey are corroborated with insurance
claim data. This is def in i te ly the case for front bumper system damage
frequencies, and combined front and rear values. The damage
frequencies in rear-end col l isions are generally lower for post
standard compared to pre-standard models, but for the 1979 models
this is s ta t i s t i ca l l y signif icant only when based on insurance claim
cases. The rear-end bumper related damage to 1979 models was s i g n i f i -
6-44

cantly costlier to repair than the damage to pre-standard cars, and to
the preceding 1974-78 models - both the survey of unreported low speed
collisions (with repairs estimated) and insurance claim data, show such
trends.
The relatively positive results (net benefits) for front bumper systems
may stem from a number of conditions. One is the finding that the
damage frequency to the front end is between 25 and 50 percent higher
than to the rear of a car. The damage reduction (or benefit) potential
is consequently higher for the front than for the rear. This is borne
out by the values of damage frequency for post standard cars where the
reductions (compared to pre-standard cars) favored the front end over
the rear by between 2 and 3 to 1.
Another factor which may affect the 1979-80 model rear bumper systems
is their weight relative to pre-standard and 1974-78 models, as well
as to the 1979-80 front bumpers. The average weight of a rear pre-
standard bumper (1972) was 38 pounds. This rose to 51 pounds in the
1973 models and 74 pounds for 1974 models. Downsizing dropped the
weight to 55 pounds for 1979 models where it stayed through the 1980
model. While the front bumper was slightly heavier in 1972 (41^ front,
38* rear) and increased to 75 pounds in 1974 models (same weight as the
rear bumper), its average weight was 63 pounds for both 1979 and 1980
models, or 8 pounds heavier than the rear. Exploring this by vehicle
size, front and rear bumpers weighed about the same in 1979-80 models
6-45

except in compact sizes where there is a difference of more than 30
pounds. Compacts made up a little over 18 percent of the vehicle mix
(1979) used in this evaluation.
There is no evidence that downsizing - that is both the decrease in
weight or the substitution of materials had an effect on net benefits
of bumper systems. The improvement in front bumper net benefits,
1979 over 1974-78, is as high as 50 percent (0.5 secondary wt. ratio),
at the same time front bumper weight was reduced by about 16 percent.
The weight reduction, 1974-78 to 1979, for rear bumper systems is
20 pounds, or 27 percent (75 lbs. to 55 lbs.) and net losses increased
by 7 percent (0.50 secondary wt. ratio).
When no secondary weight is considered, the improvement to net benefits,
1979 over 1974-80, in front bumper systems is quite small—about
3 percent, but the net loss for rear bumper systems goes from -$13 to
The question of how lighter late model (1979-80) cars fare in a
population of heavier cars, mainly pre 1979, given the results from
this evaluation, can only be answered separately for front and rear
bumper systems. As discussed previously, the front bumpers are
both effective in reducing frontal damage,and generally tend to be
cost effective. Rear bumper systems have not fared well all along.
What this bodes for a car population made up of predominantly smaller,
lighter cars with "downsized" bumper systems can only be projected,,
a task which is not part of the evaluation of an existing regulation.
6-46

6.0 EFFECTS ON DISCOUNTED NET BENEFITS OF ADDITIONAL FACTORS
(AFFECTING DISCOUNTED GROSS BENEFITS)
There are a number of factors which can affect the gross benefits, and
thus net benefits of the bumper standard.
o Damage which, in fact, is not repaired (the evaluation assumed all
damage is repaired) reduces gross benefits.
o The reduction of inconvenience to car owners, when no damage is
sustained in a collision, due to improved bumper systems.
o Potential reductions in administrative costs involved in
processing insurance claims for damage.
It was not possible to collect the necessary field data to account for
the effect of the latter two factors. There are questions as to the
possibility of such data being obtainable with sufficient precision,
without a considerable resource investment. Their possible effect
was, however, estimated in a previous study, and is discussed in
subsequent sections.
6-47

Since so many analysis "cuts" are possible (e.g., by version of the
standard; front, rear, front and rear; secondary weight ratio, etc.)
the effects of the above factors are worked out for the 1979 bumper
system only, and a limited (high and low) set of secondary weight
ratios.
6.1 Effect on Net Benefits of Excluding Cost to Repair Damage in
Unreported Collisions
The calculation of incremental gross lifetime benefits (discussed in
section 3.2 of this chapter) included the change in repair costs from
both unreported collisions and those for which insurance claims were
filed. This assumed that all damaged cars involved in unreported
collisions were repaired. This assumption is changed here to one where
none of the damaged cars in unreported collisions are repaired (the real
number is, most likely, somewhere between these extremes).
Using only the "unreported" portion of the expression for calculating
incremental gross benefits (Section 3.2.1), and discounting, as was
done in Section 3.3, the revised discounted incremental gross lifetime
benefits for 1979 bumper systems—and the change from the original
discounted gross benefits (Table VI-6)~-are as follows:
(1979 DOLLARS)Revised Discounted Change from Original
1979 BUMPER Incremental Gross Discounted GrossSYSTEMS Lifetime Benefit Benefits
Front and Rear $140 -12Front 105 -25Rear 35 +12
6-48

$ 15
36
-21
-$93
- 19
- 64
The change in discounted gross benefits added to the original discounted
net benefits (Table-17) yields the following revised discounted net benefits
(shown only for: 0 and 1,0 secondary weight factors and a 1.60 cost/pound of
secondary weight):
Discounted Net Benefits (No DamageRepair in Unreported Collisions)
1979 Bumper - Secondary Weight Ratios -Systems 0.0 1.0
Front and Rear
Front
Rear
The effect of assuming unreported damage is not repaired is to reduce net
benefits for front bumpers and to decrease net losses for rear systems. With no
secondary weight, the front bumper still comes out with net benefits, but now in
the more stringent case (1.0 secondary weight ratio) yields a net loss.
6.2 Effects of Including Less Tangible Benefits
The Motor Vehicle Information and Costs Savings Act calls for the agency to set
bumper standards, taking into account:!?_/
"(A) Cost of implementing the standard and benefits attainable as
the results of implementation of the standard.
12/ Motor Vehicle Information and Cost Savings Act, Section 102(b)(l),15 USC 1912 (1972).
6-49

(B) The effect of implementation of the standard on the cost of
insurance and prospective legal fees and costs.
(C) Savings in terms of consumer time and inconvenience,
(D) Consideration of health and safety including emission
standards."
This evaluation concentrated on measuring the costs and benefits called for in
(A) above. It was not possible to obtain data to take into account (B), (C),
and (D). However, estimates of benefits were previously made by the agency 13/
for: (1) the cost of insurance and (2) savings in car owner time and
inconvenience.
6.2.1 The Effects on Discounted Net Benefits of the Cost of Insurance
The bumper standard resulted in fewer bumper-involved insurance claims which,
in turn, reduced claim settlements. The Agency previously assumed that fewer
settlements would have these effects.M/
° The agent's commission would not be paid;
0 The administrative cost to adjust claims was not incurred; and0 Insurance company profits are reduced.
13/ National Highway Traffic Safety Administration, Final Assessment of theBumper Standard, DOT HS-804-718 (June 1, 1979).
14/ Ibid, p. 41.
6-50

The adjustment to discounted gross benefits for these net savings was estimated
at $25 per car ($28 in 1979 dollars).!!/
Adding this amount to the discounted net benefits for 1979 front and rear
bumper systems results in the following effect:
-
SecondaryWeight Ratio
0.0
1.0
1979 Front and RearBumper Systems
Insurance Savings Effect -
Original (Discounted)Net Benefit
$ 27
- 71
AdjustedNet
$
(DiscountedBenefit
55
43
6.2.2 The Effect on Discounted Net Benefits of the Savings in Consumer Time
and Inconvenience
For low-speed collisions in which no damage occurs, drivers benefit by not
having to remain at the accident scene exchanging information and
notifying the police. Other savings result from avoiding the
inconvenience of getting car repairs. To estimate the value of these
savings, the agency previously made several assumptions about the
15/ *Ibid, p. 40 and Appendix A-6 through A-14.
6-51

value of a persons' time, the amount of time required at the scene, the
number of vehicle occupants inconvenienced and the time required to obtain
repairs.
The value of the total time savings was estimated to be about $30 per car,
($33 in 1979 dollars).— Adding this amount to the original discounted net
benefit of 1979 front and rear bumper systems (combined) gives the following:
1979 Front + Rear Bumper Systems- Time Saving Effect -
Original (Disc.) Adjusted (Disc.)Secondary Weight Factor Net Benefit Net Benefit
0.0 $ 27 $ 601.0 -71 -38
16/ Ibid, pp. 43 and A-19 through A-26.
6-52

REFERENCES
Abramson, P. et al, KLD Associates* Inc., Analysis of Insurance Claimsto Determine Bumper Effect on Crash Damage, National 'Technical InformationService, Springfield, Virginia, 1980. '(DOT-HS-805-842 and 843)
A Cost/Weight Study on 1977-1980 Production Bumper Systems, New York, The"International Nickel Co., 1980 "~ ~
Automotive News: 1980 Market Data Book Issue, Detroit, Michigan, April 30,TOT: - — -Braun, R.L. et al, Stanford Research Institute, Evaluation Methodology forFederal Motor Vehicle Safety Standards, Springfield, Virginia, NationalTechnical Information Service, 1977V (DOT-HS-802-341)
Burke, J.S. et al, Westat, Inc., Drivers Survey on Unreported and Low-DamageAccidents Involving Bumpers: Final Report, Springfield, Virginia, NationalTechnical Information Service, 1980. (DOT-HS-805-838)
Eckel, C.B. et al, De Lorean Motor Company, Implementation Cost to theConsumer of Part 581 - Bumper Standard, Phase I.I; Weight and Cost Studies ofThree "x" Body Bumper Systems; and Consumer Replacement Cost for CompleteBumper Systems Studied, Springfield, Virginia, National Technical InformationServTce7l980. (DOT-HS-805-779)
Environmental Protection Agency, Passenger Car Fuel Economy:. EPA andRoad, Washington, D.C., U.S. Government Printing Office,' 'September "1980,pp~264-271.
Federal Highway Administration, Cost of Owning and Operating Automobiles andVans, 1979, Washington, D.C., U."S. Government Printing Office, 1980.
General Motors Corp., Passenger Vehicle Impact Damage Survey, Detroit,Michigan January 17, l"9~73T
Harvey, M.R. et al, John Z Delorean Corp., fast.Evaluation for FourFederal Motor Vehicle Safety Standards, Task VI - Additional Bumpers - FMVSS2 1 5 - 'ExteriorProtect i'qn', Springfield, Virginia, National Technical InformationService, 1979. (DOT-HS-803-873)
McLean, R.F. et al, John Z Delorean Corp., Cost Evaluation for Four FederalMotor Vehicle Safety Standards, Volume I, Springfield, Virginia, NationalTechnical Information Service, 1978.' (DOT-HS-803-871)
Motor Vehicle Information and Cost Savings Act, Section 102 (b) (1),15USC1912, Washington, D.C., U.S. Government Printing Office, 1972.
National Highway Traffic Safety Administration, "Economic Impact Assessment -Amendment to Federal Motor Vehicle Safety Standard No. 208", Public Docket No.73-19, Washington, D.C., U.S. Department of Transportation 1977.
R-l

National Highway Traffic Safety Administration, Final Assessment of the BumperStandard, Springfield, Virginia, National Technical 'information Service, 1979.TDOT-HS-804-718)
National Highway Traffic Safety Administration, Final Regulatory Analysisfor Model Year 1983-85 Light Trucks, U.S. Department of Transportation,Fashington, D.C. November, 1980.
Northrop, G.M., Center for Environment and Man, Final Design andImplement ation Plan for Evaluating the Effectiveness of FMVSS 215:E xter ior Protect ion, Springfield, Virginia, National Technical InformationService, 1977. (DOT-HS-802-344)
Office of Management and Budget, "Discount Rates to be Used in EvaluatingTime Distributed Costs and Benefits", Circular A-94, Washington, D.C, March 27,1972.
South, N.E. "The Fuel Shortage and Some Potential Effects on Body Engineering",Body Engineering, Vol 1., No. 1, Detroit, Michigan, American Society of BodyEngineering, October 1973, p.31.,
Sterback, S.J. and Rohn, E.J. "1975 Model Extended Time in Service andInitial 1976 Model Bumper Effect on Ford Car Accident Damage", Detroit,Michigan, Ford Motor Co., May 19, 1977.
Thornberry, O.T. and Massey, J.P., "Correcting for Undercoverage Bias inRandom Digit Dialed National Health Surveys", American Statistical Association.Proceedings of the Section on Survey Research Methods, Washington, D.'C,' 19787pp.224-229.
U.S. Departments of Commerce and Housing and Urban Development, Annual HousingSurvey: 1975^ Part C: Financial Characteristics of the Housing Inventory,Current Housing' Reports, Series H-T50-75C, Washington, D.C, Government PrintingOffice, 1975,p.3.
U.S. Departments of Commerce and Housing and Urban Development, Annual HousingSurvey: 1977, Part A: General Housing Characteristics, Current Housing Reports,Series H-150-77, Washington, D.C, Government Printing Office, 1977, p.8.
Wards Automotive Year Book, 1980, Detroit, Michigan, Ward's Communication, Inc.,1980, p. 15C
R-2

APPENDIX A
PROCEDURE FOR ADJUSTING INCIDENT RATES FOR BIAS
Each of the two phases of data collection, retrospective vs. follow-up, has
its strong and weak points as far as its usefulness in making estimates of
incidence rates. The follow-up data will not have the memory bias of the
retrospective data, but it will have a relatively higher variance because
of the shorter collection period (2 months). The retrospective data,
while biased by drivers' inability to remember low-speed collisions, will
have a small variance because of a longer collection period (6 months).
The following rationale was used to arrive at a combined estimate of the
probability of an unreported low-speed collision:
Let r represent an unbiased estimate of the incidence rate as determined
from the follow-up interviews and r1 a biased estimate based on
retrospective data. Then a linear combination,
r" = wr + (l-w)r' o<w<l
may be an estimate with less mean square error (MSE) than r alone, if the
proper w is selected. Denoting B as the bias of r1, then
MSE(r") = Var[wr = (l-w)r'] + (1-W)2B2.
This is minimized for
w = K + (l-pft)/tK + (t+l-2p|T)/t
where K= B2/Var(r) and t is the ratio of the lengths of the recall
period to the follow-up period. The average time under study for vehicles
during the recall period was 5.47 months and for the follow-up period,
2.11 months. Their ratio leads to a value of 2.59 for t.
A-l

Estimates had to be made of the bias of the recall data, B; the
correlation of the follow-up and recall data, p; and the variance of the
unbiased estimate of the incident rate, Var(r). These estimates were made
separately for coll isions with some damage and those with no damage.
Bias estimates, calculated as the difference between the col l is ion rate
for the retrospective period and that for the follow-up period, were
0.001. Assuming that the occurrence of the type of low probabil ity event
under study can be adequately modeled as a Poisson process, Var(r) can be
estimated by the incident rate, r.
The correlation p was estimated as the sample correlation between I r and
I f defined as follows:
I r = 1 for vehicles with at least one unreported low-speedcol l is ion in the recall period;
0 otherwise.
I f = 1 for vehicles with at least one unreported low-speedcollision in the follow-up period;
0 otherwise.
Based on the sample data, p was estimated to be 0.02408.
Table III-5 shows the unreported low-speed collision rates by whether or
not the accidents caused damage and the two study periods. Using the
rationale described above, a combined unreported collision rate of 0.0114
collisions per car per month was found. Thus, approximately 13.7 percent
of all cars are involved in a low-speed unreported accident each year.
A-2

TABLE A-l
MONTHLY UNREPORTED INCIDENT RATE
TYPE OF RECALL FOLLOW-UP COMBINED
INCIDENT RATE RATE B VAR (r) W RATE
With some
damage
reported O.OO5 0.004 -0.001 0.004 0.2738 0.0047
With no
damage
reported 0.007 0.006 -0.001 0.006 0.2738 0.0067
All
eligible 0.012 0.010 -0.002 0.010 0.2739 0.0114
A-3
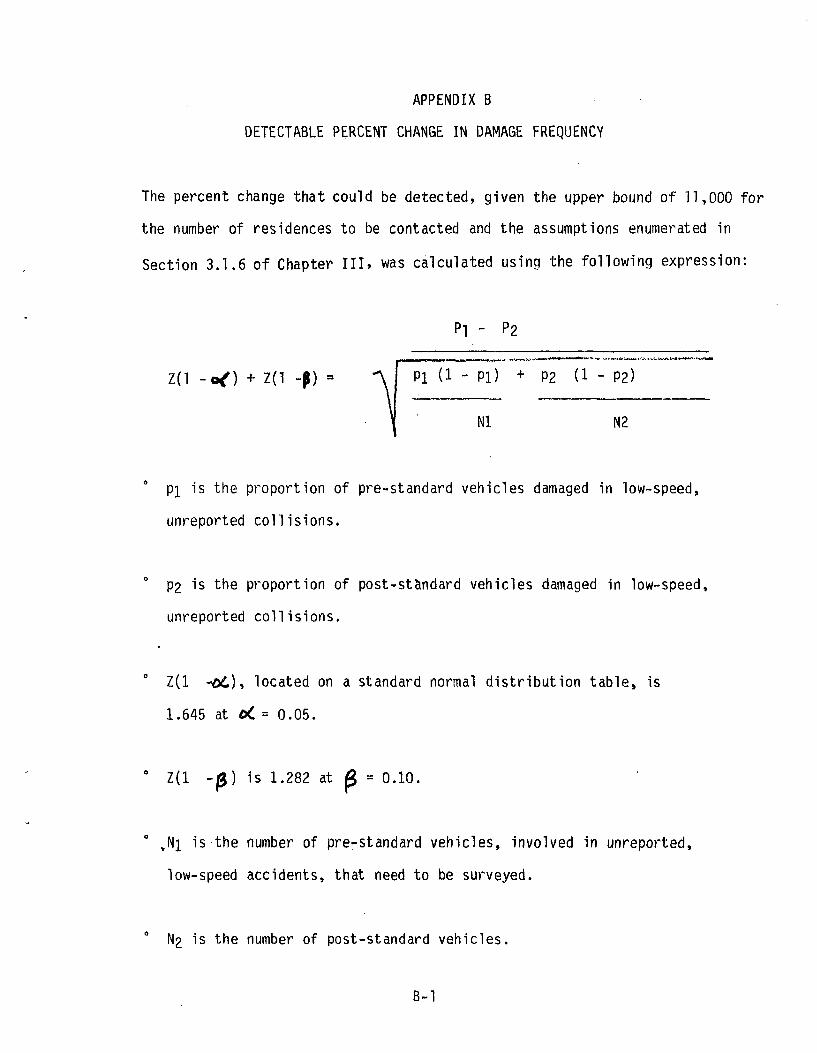
APPENDIX B
DETECTABLE PERCENT CHANGE IN DAMAGE FREQUENCY
The percent change that could be detected, given the upper bound of 11,000 for
the number of residences to be contacted and the assumptions enumerated in
Section 3.1.6 of Chapter III. was calculated using the following expression:
Pi - P2
Z(l -a() + Z(l -p) = A I PI (1 " Pi) + P2 (1 - P2)
Nl N2
Pl is the proportion of pre-standard vehicles damaged in low-speed,
unreported collisions.
P2 is the proportion of post-standard vehicles damaged in low-speed,
unreported col l is ions.
Z(l -od), located on a standard normal distr ibut ion table, is
1.645 at o(. = 0.05.
Z(l -p) is 1.282 at g == 0.10.
,Ni is the number of pre-standard vehicles, involved in unreported,
low-speed accidents, that need to be surveyed.
N2 is the number of post-standard vehicles.
B-l

Since only about 30 percent of the cars on the road are pre-standard,
the total sample size, n, had to be weighted in order to have an adequate
sample of pre-standard cars:
n = ni + n2 = 2290 (from Section 3.1.6 of Chapter III)
ni = 0.3 n = 0.3(2290) = 687
n2 = 0.7 n = 0.7(2290) =1603
Assuming pi = 0.50 (the "worst case," i.e., the value which will yield the
highest detectable percent change), the only "unknown" in equation (1) is
0.5 -
1.645+1.282= -A 0.5(0.5) P2 (1 - P2)
687 1603
After several manipulations, the equation comes down to:
= 0.2456
Ne\t several values are plugged in for p2 with the following results;
For an 8 percent change, p2 = 0.42
B-2

p2 - P22 = 0.2436 < 0.2456
For a 7 percent change, pg - 0.43:
P2 - P22 = 0.2451 < 0.2456
For a 6 percent change, P2 = 0.44:
P2 - P2 2 = 0.2464 > 0.2456
Thus, at least a 7 percent change in damage frequency will be detectable.
B-3

APPENDIX C
LOG-LINEAR ANALYSIS
The frequency of car damage in unreported, low-speed collisions appears
to be dependent on the model year groups which correspond to the various
versions of the bumper standard. To increase confidence in this
finding, several independent factors were examined in relation to damage
frequency and model year group. If the finding regarding damage
frequency is true when these other variables are controlled for, then a
clearer conclusion can be reached about bumper effectiveness. The
log-linear model was developed to handle this type of analysis.
To evaluate the relation between damage frequency and model year group,
several independent variables were introduced into the log-linear model
as control variables. For example traffic density was one control
variable which was compared with damage frequency and model year group.
Another control variable was vehicle size and so forth. The objective
of the analysis was to determine if any of the control variables
influence damage frequency, and if so, were they independent of, and
more important than model year group?
The actual log-linear model is a contingency table of frequency counts.
Continuing with the example of vehicle size, damage, and model year
group, the frequency counts would be defined with these indices:
i ~ 1 damage
= 2 no damage
C-l

j = 1 - pre-1973
= 2 - 1973
= 3 - 1974-78
= 4 - 1979-80
k = 1 - subcompact
- 2 - compact
= 3 - intermediate
= 4 - full size
The frequency count would be noted as Njj|<. For the model the log
of the frequency is expressed as follows:
log (N-jjk) = + ai + bj + c^ + interaction terms
where a = factor representing damage
bj = factor for model year group
C|< = factor for vehicle size
The estimate of the magnitude of differences between model year classes is
obtained from the value of bj, for vehicle size, from C|<, etc. If
the variables are independent, the interaction terms will be small. The
standard deviations of the factors are converted to confidence intervals
for the probability of damage for each factor.
C-2

The log-linear analysis led to the conclusion that each factor examined
was independent of the relationship between model year group and percent
of cars damaged, and that model year group was the most important factor
in predicting damage frequency.
To perform the analytical computations, a statistical package, the
Statistical Analysis System (SAS) was used. The program FUNCAT, based
on the work of Grizzle, Starmer, and KochV was used to obtain the
log-linear values.
V Grizzle, J.E. et al "Analysis of Categorical Data by LinearModels", Biometrics, p. 25 (1969)
C-3