Evaluation of Joint Sealants of Concrete Pavements · EVALUATION OF JOINT SEALANTS OF CONCRETE ......
149
TECHNICAL REPORT DOCUMENTATION PAGE 1. Report No. 2. Government Accession No. 3. Recipient's Catalog No. FHWA/TX-98/187-27 4. Title and Subtitle EVALUATION OF JOINT SEALANTS OF CONCRETE PAVEMENTS 5. Report Date March 1997 6. Performing Organization Code 7. Author(s) Ashok H. Gurjar, Tianxi Tang, and Dan G. Zollinger 8. Performing Organization Report No. Research Report 187-27 9. Performing Organization Name and Address Texas Transportation Institute The Texas A&M University System College Station, Texas 77843-3135 12. Sponsoring Agency Name and Address Texas Department of Transportation Research and Technology Transfer Office P. 0. Box 5080 Austin, Texas 78763-5080 10. Work Unit No. (TRAIS) 11. Contract or Grant No. Study No. 0-187 13. Type of Report and Period Covered Interim: September 1995- August 1996 14. SpoDSOring Agency Code 15. Supplementary Notes Research performed in cooperation with the Texas Department of Transportation and the U.S. Departmeni 1 of Transportation, the Federal Highway Administration. Research Study Title: Evaluation of Joint Sealants 16. Abstract Project 0-187 task 15 continued investigative efforts of project 1371. The project completed laboratory tests including relaxation tests, bond-strength tests, and fatigue tests for various sealant materials, and also established a field test site of a variety of joint sealants to monitor performance. The researchers constructed a material behavior model based on finite-deformation viscoelasticity as a function of temperature, deformation, and age effects. They studied the correlation between natural and artificial weathering and proposed a sealant performance model. Based on this model, this report provides a procedure for estimation of the service life of a sealant in concrete pavement joints. Material and pavement engineers can use this procedure for design and maintenance purposes. This report also proposes a specification and a test protocol for joint sealant materials, which incorporate performance prediction procedure. The proposed guidelines can be verified and refmed through continuous observation of the field test sections. The researchers of the project expect that application of the research products from this project will lead to an improved sealant selection process and reduced maintenance cost for concrete pavements. 17. KeyWords 18. Distn'bution Statement Asphalt, Age, Bond Strength, Concrete, Concrete Pavements, Deformation, Fatigue, Joint, Modulus, Performance, Polymer, Relaxation, Sealant, Service Life, Silicone, Specification, Strain, Temperature, Test, Traffic Load, Viscoelasticity) Weathering No restrictions. This document is available to the public through NTIS: 19. Security ClassiC. (of this .report) Unclassified Fonn DOT F 1700.7 (8-72) National Technical Information Service 5285 Port Royal Road Springfield, Virginia 22161 20. Security Oassif. (of this page) Unclassified Reproduction of completed page authorized 21. No. of Pages 150 22. Price
Transcript of Evaluation of Joint Sealants of Concrete Pavements · EVALUATION OF JOINT SEALANTS OF CONCRETE ......

TECHNICAL REPORT DOCUMENTATION PAGE
1. Report No. 2. Government Accession No. 3. Recipient's Catalog No.
FHWA/TX-98/187-27
4. Title and Subtitle
EVALUATION OF JOINT SEALANTS OF CONCRETE PAVEMENTS
5. Report Date
March 1997
6. Performing Organization Code
7. Author(s)
Ashok H. Gurjar, Tianxi Tang, and Dan G. Zollinger 8. Performing Organization Report No.
Research Report 187-27
9. Performing Organization Name and Address
Texas Transportation Institute The Texas A&M University System College Station, Texas 77843-3135
12. Sponsoring Agency Name and Address
Texas Department of Transportation Research and Technology Transfer Office P. 0. Box 5080 Austin, Texas 78763-5080
10. Work Unit No. (TRAIS)
11. Contract or Grant No.
Study No. 0-187
13. Type of Report and Period Covered
Interim: September 1995- August 1996
14. SpoDSOring Agency Code
15. Supplementary Notes
Research performed in cooperation with the Texas Department of Transportation and the U.S. Departmeni 1
of Transportation, the Federal Highway Administration. Research Study Title: Evaluation of Joint Sealants
16. Abstract
Project 0-187 task 15 continued investigative efforts of project 1371. The project completed laboratory tests including relaxation tests, bond-strength tests, and fatigue tests for various sealant materials, and also established a field test site of a variety of joint sealants to monitor performance. The researchers constructed a material behavior model based on finite-deformation viscoelasticity as a function of temperature, deformation, and age effects. They studied the correlation between natural and artificial weathering and proposed a sealant performance model. Based on this model, this report provides a procedure for estimation of the service life of a sealant in concrete pavement joints. Material and pavement engineers can use this procedure for design and maintenance purposes. This report also proposes a specification and a test protocol for joint sealant materials, which incorporate performance prediction procedure. The proposed guidelines can be verified and refmed through continuous observation of the field test sections. The researchers of the project expect that application of the research products from this project will lead to an improved sealant selection process and reduced maintenance cost for concrete pavements.
17. KeyWords 18. Distn'bution Statement
Asphalt, Age, Bond Strength, Concrete, Concrete Pavements, Deformation, Fatigue, Joint, Modulus, Performance, Polymer, Relaxation, Sealant, Service Life, Silicone, Specification, Strain, Temperature, Test, Traffic Load, Viscoelasticity) Weathering
No restrictions. This document is available to the public through NTIS:
19. Security ClassiC. (of this .report)
Unclassified
Fonn DOT F 1700.7 (8-72)
National Technical Information Service 5285 Port Royal Road Springfield, Virginia 22161
20. Security Oassif. (of this page)
Unclassified
Reproduction of completed page authorized
21. No. of Pages
150
22. Price


EVALUATION OF JOINT SEALANTS OF CONCRETE PAVEMENTS
by
Ashok H. Gurjar Graduate Research Assistant
Texas Transportation Institute
Tianxi Tang Assistant Research Engineer
Texas Transportation Institute
and
Dan G. Zollinger Associate Research Engineer Texas Transportation Institute
Research Report 187-27 Research Study Number 0-187
Research Study Title: Evaluation of Joint Sealants
Sponsored by the Texas Department of Transportation
In Cooperation with U.S. Department of Transportation Federal Highway Administration
March 1997
TEXAS TRANSPORTATION INSTITUTE The Texas A&M University System College Station, Texas 77845-3135


IMPLEMENTATION STATEMENT
The fmdings of this project will have an important bearing on the design, selection, and
maintenance procedure of the joint sealants. A procedure for determination of the service life
of a joint sealant in the concrete pavement is proposed based on various models developed in
project 1371 and this project, namely, the material behavior model, the bond strength model,
and the performance modeL The procedure can be used by the highway agency to properly
design and select joint sealants for a given climate and traffic condition. Necessary
laboratory tests to support the procedure are specified in the proposed specification and test
protocol for the sealant materials used in concrete pavement joints. It is hoped that the
results obtained from the study and the guidelines provided will reduce the distress levels in
concrete pavement caused by poor sealant performance and help reduce rehabilitation costs.
v


DISCLAIMER
The contents of this report reflect the views of the authors who are responsible for the
facts and the accuracy of the data presented herein. The contents do not necessarily reflect
the official view or policies of the Texas Department of Transportation (TxDOT) or the
Federal Highway Administration (FHWA). This report does not constitute a standard,
specification, or regulation.
vii

ACKNOWLEDGMENT
Appreciation is extended to the Texas Department of Transportation and the Federal
Highway Administration for the financial support provided under study no. 0-187-15. This
report presents the results of the study.
viii

TABLE OF CONTENTS
Page
List of Figures ....................................................................................................................... xii
List of Tables ....................................................................................................................... xvi
Summary ............................................................................................................................. xvii
CHAPTER 1 INTRODUCTION ........................................................................................... 1
CHAPTER 2 FIELD STUDY ................................................................................................ 5
INTRODUCTION .................................................................................................................. 5
ESTABLISHMENT OF FIELD TEST SECTION ................................................................. 5
Test Site Location ....................................................................................................... 5
Field Test Site Installation .......................................................................................... 8
Bubbling .................................................................................................................... 11
FIELD SURVEY AND JOINT SEALANT PERFORMANCE ........................................... 12
Performance Data Collected ..................................................................................... 12
INITIAL OBSERVED PERFORMANCE ........................................................................... 15
Deflection Testing ..................................................................................................... 15
JOINT SEALANT SURVEY AMONG DISTRICT ENGINEERS ..................................... l9
Survey Form .............................................................................................................. 19
FINDINGS ............................................................................................................................ 19
CHAPTER 3 LABORATORY TEST PROGRAM ............................................................. 21
INTRODUCTION ................................................................................................................ 21
TEST MATERIALS ............................................................................................................. 21
PREPARATION OF TEST SPECIMENS ........................................................................... 23
Relaxation Specimen ................................................................................................ 24
TEST PROCEDlTRES .......................................................................................................... 26
Relaxation Test ......................................................................................................... 26
VISCOELASTIC MATERIAL MODEL ............................................................................. 27
PREFORMED JOINT SEALANT ....................................................................................... 30
lX

TABLE OF CONTENTS (Continued)
Page
Weathering ................................................................................................................ 3 1
Test Specimen and Procedure ................................................................................... 32
ACCELERATED WEATHERING (AGING) ...................................................................... 32
CHAPTER 4 ANALYSIS OF EXPERIMENTAL DATA .................................................. 37
INTRODUCTION ................................................................................................................ 37
MATERIAL MODEL ........................................................................................................... 38
Time-Deformation Shift Factor, aE(E) ...................................................................... 38
Time-Age Shift Factor, aA(A) ................................................................................... 38
Time-Temperature Shift Factor, ar(T) ...................................................................... 40
ANALYTICAL MATERIAL MODEL ................................................................................ 40
Generalized Maxwell Model ..................................................................................... 41
PREFORMED JOINT SEAL TEST RESULTS .................................................................. 53
CHAPTER 5 CORRELATIONAL STUDY OF ARTIFICIAL AND
NATURAL WEATHERING .................................................................................... 57
INTRODUCTION ................................................................................................................ 57
ARTIFICIAL WEATHERING ............................................................................................. 58
NATURAL WEATHERING ................................................................................................ 58
SOLAR DATA ..................................................................................................................... 58
CORRELATION BETWEEN NATURAL WEATHERING AND
ARTIFICIAL AGING .............................................................................................. 59
CHAPTER 6 PROCEDURE FOR ESTIMATION OF SERVICE LIFE
OF A JOINT SEALANT .......................................................................................... 65
INTRODUCTION ................................................................................................................ 65
ESTIMATION PROCEDURE ............................................................................................. 67
EFFECTS OF SEALANT GEOMETRY ............................................................................. 75
ILLUSTRATION OF ESTIMATION PROCEDURE ......................................................... 76
X

TABLE OF CONTENTS (Continued)
Page
CHAPTER 7 CONCLUSIONS AND FUTURE RESEARCH ............................................ 79
REFERENCES ..................................................................................................................... 83
APPENDIX A- PROPOSED SPECIFICATION FOR JOINT SEALANTS
IN CONCRETE PAVEMENTS ............................................................................... 85
APPENDIX B - PROPOSED TESTS PROTOCOL FOR JOINT SEALANTS
FOR CONCRETE PAVEMENTS ............................................................................ 91
APPENDIX C - JOINT SEALANT SURVEY FORM ...................................................... 111
APPENDIX D- RELAXATION TEST RESULTS FOR SEALANT MATERIAL
CRAPCO 903 SL .................................................................................................... 115
xi

Figure
1
2
3
4
5
6
7
8
9
10
11
12
13
14
15
16
17
LIST OF FIGURES
Page
Schematic Test Site Layout ........................................................................................ 7
Joint Geometries Employed at Test Section ............................................................... 9
Joint Survey Form, Part I .......................................................................................... 13
Joint Survey Form, Part!!. ........................................................................................ 14
Adhesion Loss for Various Test Sections ................................................................. 16
Load Transfer Efficiency Along the Test Site .......................................................... 18
Performance Rating of Various Sealants from TxDOT District Survey .................. 20
Relaxation Specimen (a) Specimen Mold, (b) Cured Sheet of Material,
(c) Specimen Strips, and (d) Test Specimen ............................................... 25
Preformed Compression Seal Models V -687 and V -812 .......................................... 31
Atlas Ci65A Xenon Weather-Ometet ...................................................................... 34
Test Samples in Atlas Ci65A Xenon Weather-Ometer® ........................................... 35
Comparison of Spectral Distribution of Natural Sunlight and Atlas Ci65A ............ 35
Generalized Maxwell Model ..................................................................................... 42
Master Relaxation Modulus Curve and Fitted Generalized Maxwell
Model for Crafco 903 SL ............................................................... : .............. 48
Master Relaxation Modulus Curve and Fitted Generalized Maxwell
Model for Dow Corning 888 ......................................................................... 49
Master Relaxation Modulus Curve and Fitted Generalized Maxwell
Model for Dow Corning 890 SL .................................................................... 50
Master Relaxation Modulus Curve and Fitted Generalized Maxwell
Model for Percol Joint Sealant.. .................................................................... 51
18 Master Relaxation Modulus Curve and Fitted Generalized Maxwell
Model for Industries FX-570 ........................................................................ 52
19 Relaxation Modulus for Seal V -687 at 15% Strain Level ........................................ 54
xu

LIST OF FIGURES (Continued)
Figure Page
20 Relaxation Modulus for Seal V -687 at 30% Strain Level ........................................ 54
21 Relaxation Modulus for Seal V-812 at 15% Strain Level ........................................ 55
22 Relaxation Modulus for Seal V-812 at 30% Strain Level ........................................ 55
23 Solar Radiation Observed at the Exposure Site Weekly ........................................... 60
24 Average Daily Solar Radiation per Week at the Exposure Site ................................ 60
25 Average Daily Solar Radiation per Month at the Exposure Site .............................. 61
26 Accumulated Solar Radiation at the Exposure Site .................................................. 61
27 Relaxation Moduli of Crafco 903 SL After Natural and Artificial Weathering ....... 62
28 Relaxation Moduli of Dow Corning 888 After Natural and
Artificial Weathering .................................................................................... 62
29 Relaxation Moduli of Dow Corning 890 SL After Natural and
Artificial Weathering .................................................................................... 63
30 Flow Chart of the Service Life Estimation Procedure for Concrete
Pavement Joint Sealants ................................................................................ 66
31 Base Life for Different Types of Sealants ................................................................ 68
32 Relaxation Modulus of Type 1 Joint Sealants .......................................................... 72
33 Relaxation Modulus of Type 2 Joint Sealants .......................................................... 72
34 Relaxation Modulus of Type 3 Joint Sealants .......................................................... 73
35 Adhesion Loss versus Number of Load Repetition for Silicone Based
Sealants at Phoenix, Arizona, Test Site ........................................................ 78
36 Adhesion Loss versus Number of Load Repetition for Asphalt Based
Sealants at Phoenix, Arizona, Test Site ........................................................ 78
37 Mold Assembly for Bond Test Specimen ................................................................. 98
38 A Typical Specimen for Bond Strength Test ............................................................ 98
39 Mold Assembly for Relaxation Test Specimen ...................................................... 100
xiii

LIST OF FIGURES (Continued)
Figure Page
40 Relaxation Test Specimen with End Plates ............................................................ 100
41 Test Setup for the Relaxation Test.. ........................................................................ 103
42 Joint Sealant Survey Form Distributed to TxDOT Districts (Part I) ...................... 113
43 Joint Sealant Survey Form Distributed to TxDOT Districts (Part II) ..................... 114
44 Relaxation Modulus of a Fresh Crafco 903 SL Specimen at- 25°C ...................... 117
45 Relaxation Modulus of a 500 Hours Artificially Weathered Crafco 903 SL
Specimen at- 25 oc ..................................................................................... 117
46 Relaxation Modulus of a 1000 Hours Artificially Weathered Crafco 903 SL
Specimen~ at -25 oc ..................... ,. ............................................................ 118
47 Relaxation Modulus of a 2000 Hours Artificially Weathered Crafco 903 SL
Specimen at -25°C ...................................................................................... 118
48 Relaxation Modulus of a Fresh Crafco 903 SL Specimens at 0 °C ......................... 119
49 Relaxation Modulus of a 500 Hours Artificially Weathered Crafco 903 SL
Specimen at 0°C ......................................................................................... 119
50 Relaxation Modulus of a 1000 Hours Artificially Weathered Crafco 903 SL
Specimen at ooc ......................................................................................... 120
51 Relaxation Modulus of a 2000 Hours Artificially Weathered Crafco 903 SL
Specimen at 0°C ......................................................................................... 120
52 Relaxation Modulus of a Fresh Crafco 903 SL Specimen at 25 o C ........................ 121
53 Relaxation Modulus of a 500 Hours Artificially Weathered Crafco 903 SL
Specimen at 25 oc ....................................................................................... 121
54 Relaxation Modulus of a 1000 Hours Artificially Weathered Crafco 903 SL
Specimen at 25°C ....................................................................................... 122
55 Relaxation Modulus of a 2000 Hours Artificially Weathered Crafco 903 SL
Specimen at 25 o C ....................................................................................... 122
xiv

LIST OF FIGURES (Continued)
Figure Page
56 Relaxation Modulus of a Fresh Crafco 903 SL Specimen at 40°C ........................ 123
57 Relaxation Modulus of a 500 Hours Artificially Weathered Crafco 903 SL
Specimen at 40°C ....................................................................................... 123
58 Relaxation Modulus of a 1000 Hours Artificially Weathered Crafco 903 SL
Specimen at 40°C ........................................................................... 124
59 Relaxation Modulus of a 2000 Hours Artificially Weathered Crafco 903 SL
Specimen at 40°C ........................................................................... 124
60 Relaxation Modulus of a Fresh Crafco 903 SL Specimen at 60°C ................... 125
61 Relaxation Modulus of a 500 Hours Articially Weathered Crafco 903 SL Specimen
at 60°C ....................................................................................... .125
62 Relaxation Modulus of a 1000 Hours Artificially Weathered Crafco 903 SL
Specimen at 60°C ....................................................................................... 126
63 Relaxation Modulus of2000 Hours Artificially Weathered Crafco 903 SL
Specimen at 60°C ....................................................................................... 126
64 Time-Deformation Shift Factor Relationship for Crafco 903 SL ........................... 127
65 Relaxation Modulus Curves Normalized for Extension at -25°C .......................... 127
66 Relaxation Modulus Curves Normalized for Extension at 0°C .............................. 128
67 Relaxation Modulus Curves Normalized for Extension at 25°C ............................ 128
68 Relaxation Modulus Curves Normalized for Extension at 40°C ............................ 129
69 Relaxation Modulus Curves Normalized for Extension at 60°C ............................ 129
70 Relaxation Modulus Curves Normalized for Age and Extension
for Crafco 903 SL ....................................................................................... 130
71 Time-Age Shift Factor Relationship of Crafco 903 SL .......................................... 130
72 Master Relaxation Modulus Curves Normalized for Extension, Age
and Temperature for Crafco 903 SL ........................................................... 131
73 Time~ Temperature Shift Factor Relationship of Crafco 903 SL ............................ 131
XV

LIST OF TABLES
Table Page
1 Classification of Joint Sealants Studied .................................................................... 23
2 Relaxation Test Performed for Various Temperature Levels ................................... 28
3 Relaxation Test Performed for Various Age Levels ................................................. 28
4 Operating Cycle of the Exposure .............................................................................. 3 3
5 Time-Deformation Shift Constants ........................................................................... 39
6 Time-Age Shift Constants ......................................................................................... 39
7 Time-Temperature Shift Constants ........................................................................... 40
8 Coefficients of Generalized Maxwell Model for Crafco 903 SL. ............................ .44
9 Coefficients of Generalized Maxwell Model for Dow Corning 888 ....................... 45
10 Coefficients of Generalized Maxwell Model for Dow Corning 890 SL. .................. 45
11 Coefficients of Generalized Maxwell Model for Percol Joint Sealant .................... .46
12 Coefficients of Generalized Maxwell Model for FX-570 ......................................... 47
13 Coefficients of Performance Model .......................................................................... 68
14 Adjustment Factor for Aggregate Type .................................................................... 70
15 Adjustment Factor for to Preparation Technique ...................................................... 70
16 Adjustment Factor for Relaxation Modulus ............................................................. 71
17 Adjustment Factor for Unit Extension Level.. .......................................................... 71
18 Aggregate Grading .................................................................................................... 97
19 Data Collection Sheet ............................................................................................... 97
20 Operating Cycle of the Exposure ............................................................................ 102
21 Relaxation Test Data Acquisition Table for Unaged Specimens ............................ 104
22 Test Data Acquisition Table for the Aged Specimens ............................................ l05
XVI

SLTMMARY
Project 187·15 is a continuation of project 1371 "Evaluation of Joint Sealants."
Investigation under this project included completion of relaxation tests of selected joint
sealant materials for concrete pavements at different temperatures, deformation levels, and
ages and the establishment of a field test site which consisted of a variety of joint sealant
materials near Liberty, Texas, on SH 90. The project included a test program that included
relaxation tests of specimens of sealant materials after naturally or artificially aged to
establish the equivalency of the natural weathering and accelerated weathering achieved in
the laboratory. Laboratory bond-strength and fatigue tests were previously completed in
project 1371.
Bas:d on these tests, a matcial behavior model and a sealant performance model have
been proposed. These models have led to a procedure for estimation of the service life of a
joint sealant material in concrete pavements. Engineers can use this procedure to estimate
the service life for design and maintenance purposes. This procedure requires some material
properties, including bond strength and relaxation modulus. As a result of the laboratory
evaluation process for sealant materials, a specification and test protocol for joint sealant in
concrete pavements is proposed based on the behavior and performance models. Continuing
field observation of the test sections near Liberty, Texas, on SH 90 will further verify and
improve the procedure. Sealants of different geometries were installed in the test sections to
study effects of sealant geometry on the sealant service life.
Improved sealant selection and reduced maintenance cost for concrete pavements is
expected upon application of the proposed material behavior and performance models, the
proposed specification and test protocol, and the proposed procedure for estimation of service
life of the joint sealant.
xvii


CHAPTER 1 INTRODUCTION
This report documents investigation of concrete pavement joint sealants which began
with project 1371 "Evaluation of Joint Sealants." The purpose of the continued investigation
is to propose specification and test protocol for joint sealants in concrete pavements based on
characterization of selected material properties. The report documents the procedure for
estimation of the service life of a sealant joint sealant material and its application to
specification development..
Laboratory material tests are reported in the final report of project 1371 [1], but
additional laboratory tests were conducted by the researchers under this project. Sealant
performance in the field test section established near Liberty, Texas, was observed. This
field test sectio11 should be monitored from time to time to ve1lfy the proposed specit:;.::ation
and test protocol and improve the life prediction model.
Joints play an important role in the performance of jointed and continuously reinforced
concrete pavement systems. Accordingly, concrete slabs move with a certain level of
freedom under traffic, temperature, and moisture changes. Slab movements (which occur at
the joint) reduce slab stresses and resulting pavement distresses. Conversely, when the
pavement slabs move, the joint sealant can undergo extensive deformation (both compressive
and tensile), which may eventually cause failure of the sealant. In addition, exposure to
various climatic and solar radiation levels may tend to deteriorate the sealant material.
Therefore, joint sealants judiciously selected (based on appropriate performance models)
should provide better performance than those which are not.
There are many different joint sealant materials, each of which can be classified as a
material of low modulus whose behavior is time-dependent. The elastic modulus of a sealant
material changes with time upon loading. This phenomenon results in sealant materials
exhibiting creep and relaxation characteristics. Such materials are also referred to as
viscoelastic materials. Tests conducted in this project have shown that behavior of each
tested sealant is not only time-dependent, but also strain-, temperature-, and age-dependent.
In the current documented test procedures of the Texas Department of Transportation
(TxDOT), which were revised in 1982, Test Method Tex-525-C "Testing Concrete Joint

Sealers" [2] adopts ASTM D 545 [3] and ASTM D 994 [4] to test poured concrete joint
sealers. These tests determine some physical and mechanical properties of the sealant
material that may provide some reference for evaluation purposes. The departmental material
specification D-9-631 0 ( 1992) [5] establishes requirements for concrete sealants based on
results of these tests. However, these tests only concern properties of a sealant immediately
after placement. It was evident in this project that consideration of long-term sealant
behavior and environmental conditions must be taken into account to achieve full
characterization of the sealant. Very few previous research efforts on joint sealants have
characterized behavior of the largely deformable sealant under repetitive loading relative to
long-term effects of aging due to solar radiation and moisture effects. Neither did these
studies provide a failure criterion. In order to establish a complete test procedure for
evaluating various concrete joint sealant materials available in the current market, it was of
interest to develop the necessary tools such that performance of the sealant in service can be
predicted with the data from the tests conducted in the materials laboratory.
Researchers undertook several different laboratory tests conducted in the course of this
project. These tests include relaxation tests at different temperature, deformation and age
levels, adhesive strength tests, and fatigue tests. Material samples were naturally weathered
and artificially aged in a Weather-Ometer®. An attempt was made to establish the local
equivalency between artificial aging and natural aging. Based on these tests and theoretical
models, material behavior (or relaxation) and material performance (or failure criterion) were
characterized in a model format, from which the service life of the sealant under varying
traffic and climatic conditions could be predicted.
Researchers conducted a field study to examine the performance of sealants under field
conditions in project 1371. A special field section was established in this project where
different sealants were placed in transverse joints of a rehabilitated jointed concrete pavement
system. Long-term observations of these test sections documenting the joint sealant
performance should prove to be very useful in future study.
As a result of this research effort, a new modified specification and a new test protocol
were developed which include the measurement of sealant bond strength as well as relaxation
behavior. Each of these is documented in the attached appendices.
2

This report consists of five chapters. Chapter 2 gives a brief description of the field
test site investigation and performance survey results. Chapter 3 includes summaries of
further laboratory tests conducted under this study. Following the test results, Chapter 4
gives the analysis of the experimental data and provides a material behavior model. Chapter
5 presents the efforts to investigate the correlation between natural and artificial weathering.
Chapter 6 provides the procedure for estimation of the service life of the joint sealant based
on the proposed performance model under the standard conditions. An example of using the
procedure is also demonstrated in the chapter. Chapter 7, the last chapter, presents the project
conclusions. Appendices A and B present the proposed specification and test protocol for
joint sealants in concrete pavements, respectively. Appendix C provides the joint sealant
survey form used to collect information pertaining to joint sealants in concrete pavement
from various TxDOT districts. Appendix D shows thirty figures for details of the relaxation
test results for a sealant material.
3


CHAPTER 2 FIELD STUDY
INTRODUCTION
This chapter covers the initial results of joint sealant performance surveys performed at a
field test site established near Liberty, Texas. The test section was established to monitor the
behavior of various joint sealants under actual field conditions. The purpose of the field test
was to better understand joint sealant material behavior, to monitor and calibrate material
performance models, and ultimately to verify the procedure for estimation of service life of a
joint sealant, and refine and improve sealant specifications and test protocols. The proposed
service life estimation procedure of a joint sealant in a concrete pavement based on the
material behavior and perforr1ance models is discus::ed in Chapter 6. The in.Jplementation of
these models is encompassed within the specification and test protocol for the joint sealant as
proposed in Appendices A and B.
ESTABLISHMENT OF FIELD TEST SECTION
A field test site was established to evaluate several combinations of joint sealant types and
joint geometries under actual field conditions. It should be possible to use the results of these
field sections, in conjunction with the results from laboratory investigations done in project
1371 and this project, to fulfill the purpose of validating and advancing the behavior and
performance models, the specification and test protocol, and the service life estimation
procedure for joint sealant materials used in concrete pavements.
Test Site Location
The Beaumont District volunteered a test site on SH 90, west of Beaumont near Liberty,
Texas. The test section begins at FM 1413 and continues for 5.8 km (3.6 miles) in the
5

eastbound direction. The pavement at this site is a jointed reinforced concrete pavement
(JRCP) with expansion joints located on 18.44 m centers. No control joints are located in
this pavement. Figure 1 shows the layout of the test sections.
Factorial Experiment
The proposed field test plan was simple in that it entailed the use of only two primary
variables, joint sealant type and joint geometry. Ten joints for each combination of joint
sealant type and joint geometry were included. Provision was made for three extra joints for
each material to serve as practice joints for the construction crews performing the work, thus
resulting in a total of thirteen joints for each material. These three extra joints should not be
monitored in the evaluation of the material performance. Therefore, a total of 312 ( 6x4 x 13)
transverse joints were used to establish the test section. Both lanes of the two-lane highway
were used for the test section. The following is a description of the primary variables and
their levels in the experimental layout.
Materials : Two hot applied thermoplastic sealants, three cold applied thermoplastic
sealants, and one two-part, thermosetting sealant were installed in this experiment. These
sealants were selected based on laboratory test results, and they include:
Hot Applied Thermoplastic Sealants
• Durafill 3405; Polymeric Rubber with Asphaltic Resin
• Solarite K.M-1166; Elastomeric Modified Asphalt
Cold Applied Thermoplastic Sealants
• Dow Corning; 888 SL (Self-Leveling)
• Crafco; Road Saver Silicone Sealant (SL)
• Kengo Sealer; Single component asphalt based latex
Two-Part Thermosetting Sealant
• Percol Joint Sealant; (this material is a two-part polyurethane)
6

Traffic Flow -US90 l
I
Section 1 Section 2 Section 3 Section 4 Section 5 Section 6 Section 7 Dow890 SL Crafco 903 SL Ken go Crafco RoadSaver Durafill Dow890SL Crafco 903 SL
-- Traffic Flow --Geometries of Joints used in Sections
SECTION #1 and 6 DOW CORNING 890 SL Joint Geo.#l Joint Geo. #2 Joint Geo. #3 Joint Geo. #4
13 Joints 13 Joints 13 Joints 13 Joints 6 Primed 17 Unprimed 6 Primed 17 Unprimed
.....:! 6 Primed 17 Unprimed 6 Primed 17 Unorimed
SECTION #2 and 7 Crafco 903 SL Joint Geo.#l Joint Geo. #2 Joint Geo. #3 Joint Geo. #4
13 Joints 13 Joints 13 Joints 13 Joints 6 Primed 17 Unprimed 6 Primed 17 Unprimed 6 Primed 17 Unorimed 6 Primed 17 Unorimed
SECTION #3 Kene:o Joint Geo.#l !Joint Geo. #2 Joint Geo. #3 Joint Geo. #4
13 Joints I 13 Joints 13 Joints 13 Joints
SECTION #4 Crafco RoadSaver 231 Joint Geo.#l I Joint Geo. #2 Joint Geo. #3 Joint Geo. #4
13 Joints 13 Joints 13 Joints 13 Joints
SECTION #5 Duraflll Joint Geo.#l !Joint Geo. #2 Joint Geo. #3 Joint Geo. #4
13 Joints 13 Joints 13 Joints
Figure 1. Schematic Test Site Layout.

Joint Geometry: The width of these joints varied slightly depending on the condition of the
existing joints. Figure 2 shows the various levels of joint geometry used.
The objective of this experiment was to test the performance of the joint sealants
themselves and not the long-term concrete slab performance resulting from the effectiveness
of the sealant. The latter is beyond the scope of this study. The exception to this may be in
terms of joint spalling resulting directly from the presence or absence of the joint sealant after
traffic has been applied.
Joint sealant performance parameters include:
• Spalling of concrete at the joint,
• Extrusion of joint sealant material,
• Intrusion of joint sealant material,
• Adhesive or cohesive sealant failure, and
• Cracking in joint sealant.
Selected co-variables of the experiment include:
• Time of year of sealant placement,
• Temperature of concrete at placement,
• Joint width at time of placement,
• Temperature of sealant at placement, and
• Traffic level (two levels: inside vs. outside lane).
Field Test Site Installation
The field test site consisted of a re-sealing project covering two lanes where each sealant
material was placed in a sector or group of consecutive transverse joints extending across
both lanes as previously indicated. The centerline longitudinal joint was also sealed. Prior to
placing the new material, cleaning of existing joints was done. This consisted of removing
the existing joint sealant material followed by sandblasting and cleaning the joint with
compressive air.
8

w .. ..
w a)
w ... ...
3W/4 b)
w
c) W/2
w .. d) W/4
FIGURE 2. Joint Geometries Employed at Test Section.
9

Dow Corning 890·SL Installation
This material was placed during hot, swmy, humid weather conditions. The ambient
temperature was 35 to 40 °C. After placement of the backer rod, certain joint faces (if
designated) were primed. The material was recessed just below the surface of the joint. The
self-leveling property of the sealant gave the material a smooth finish; however, because of
the slight slope of the pavement, it also allowed for the sealant to run out at the ends of the
joint wells. For areas of heavy spalling at the ends, the material tended to pool, making it
necessary to apply additional sealant for these joints.
A special type of installation, referred to as a split sealant, was also completed. A split
sealant consists of two backer rods, the first of which was placed as normally specified while
the second (9.525 mm diameter) was embedded within the body of the joint sealant. In order
to facilitate placement, the sealant material was placed in two lifts or layers. A certain
amount of time must expire for surface curing to prevent the 9.525 mm backer rod from
floating to the upper surface. Examination of the one·day cured Dow Corning 890-SL
material revealed that it was very soft and mushy. Piercing the very thin cured surface layer
showed that under the surface the material was uncured. This was a concern since it was
observed that small aggregates had pierced into the layer under traffic pushing the uncured
sealant to the surface.
Crafco 903·SL Silicone Sealant Installation
This sealant is a single compound, self-leveling silicone sealant, that was placed under
similar conditions as the Dow Corning 890-SL material. The split sealant type installation
was also performed with this material.
Kengo Sealer Installation
The Kengo material installation went very fast due to its low viscosity and the fact that,
according to the manufacturer, no preparation other than removing the old backer rod was
10

necessary. It was so fluid that, in the absence of a water tight seal between the backer rod
and the slab, most of the material would have leaked out of the joint well. Even though the
Kengo would set in approximately 20 to 30 seconds, it still caused the backer rod to float to
the top. A problem observed with this material was that the traffic immediately pulled out
the backer rods from the joints.
Durafill and Crafco Road Saver Installation
These hot poured joint sealant materials were applied using the manufacturer's provided
instructions. The Percol joint sealant and Solarite sealant were not installed due to lack of
supply of material at the test section.
Bubbling
A phenomena that occurred in most installations, except in the Kengo, was bubbling at the
sealant surface. The hot poured materials, Durafill and Crafco Road Saver, exhibited
bubbling almost immediately out of the applicator. The silicone sealants would produce
bubbles after a period of time, approximately five to 15 minutes after placement. Different
mechanisms as to the cause of the bubbling were explored. One of the material
representatives claimed that it was due to slicing the closed-cell, gas-filled backer rod since
the tools the workmen used to lay the backer rod could easily pWlcture the rod. However,
after placing and pouring over sufficient length of visibly ripped backer rod, no bubbles were
present. This test was conducted on many joints of different geometries with different
sealant materials. It was observed that some of the ripped backer rods did produce some
bubbling; however, it was also observed that backer rods that did not have any visible tears
produced bubbles as well. Another possibility was that the applicator, as it was being
dragged along the backer rod, was entrapping air behind it. This was negated when three
joints were poured where the wand was held in the air and produced just as many air pockets.
A sufficient amom1t of material was poured straight from the applicator into a cup to see if
the bubbles existed before placement. This was apparently not the case since the bubbles
11

were formed only at the surface. The entire phenomenon was unusual, since samples poured
in the laboratory did not display this characteristic.
The future survey at the test site should include visual observation, checking for
adhesion, cohesion, sealant pull out, exposed backer rod, etc. Falling weight deflection
(FWD) testing should also be conducted to monitor the joint performance relative to load
transfer and joint opening.
FIELD SURVEY AND JOINT SEALANT PERFORMANCE
The test section was evaluated on December 14, 1995, to record the performance of various
joint sealants. The right lane at the test site was closed down, and a detailed inspection of the
joints was carried out. During this survey, the condition of sealant and the joint well were
observed. Falling weight deflection (FWD) tests were also carried out. The following
section discusses the performance data recorded and presents a summary of FWD data as
well as sealant performance to date.
Performance Data Collected
To assist in systematically recording the field performance data in a consistent and logical
manner, joint seal field survey forms were prepared. The two parts of these survey forms are
shown in Figures 3 and 4. Part I of the survey form is used to record the pertinent
information of the joints being surveyed and also includes a distress identification reference.
Three severity levels for each distress type were identified and referenced in part I (Figure 3).
Part II of the survey form (Figure 4) was used to graphically record the observed distresses.
One form was used for each section which had ten joints. The joints were surveyed a
foot at a time, and distress types were recorded on both sides of the joint well (i.e., approach
and leave sides). The distress manifestations included:
• Adhesion loss,
• Cohesion loss,
12

Joint Seal Field Survey Form
Date Surveyed: ---'-/ _ _,_/--'"'" Date Accepted: _ __,_/_-.!../ __
State Contact:------------- Phone: ________ __
District:----- County:------- Highway: ___ _
CSJ: ----~- Nearest RM: ----- Direction: ___ _ Nearest City: --------- Sealant Type/Class:-------
Location Description:--------------------------
Total Length;
Lane Number: Slab Width: Slab Length: ___ _ AirTemp: °F Pavement Temp: ___ °F Time: __ _.._ __
PCCThick: m Subbase Thick: --~-i.n Subgrade Type: -------Notes: ____________________________________ _
Distress Identification Reference: Distress
Number- T~e Low Severity Medium Severity High Severity A- Adhesion Still tight to side, bond Full depth loss of bond Opening ~ 1/16"
lost at top only. but opening< 1116".
C- Cohesion Small crack in sealant. Crack in sealant _:51/8" Wide crack in sealant.
I - Intrusion Somewhat difficult to Difficult to penetrate, Sealant dried and penetrate. may be stones embedded. cracked.
M- Missing Less than 2"/foot. Between 2"- 4"/foot. More than 4 "/foot.
P - Partial Depth Cracks outside of joint, Spalled but broken pieces Spalled pieces Spall (joint not yet broken. still attached. missing. remains sealed)
S -Full Depth Spall Spalled pieces still Less than 4 "/foot More than 4"/foot (joint no longer attached. missing. missing. sealed)
E - Extrusion Less than 2 "/foot Between 2"- 4"/foot. More than 4"/foot. pushed above joint.
F- Faulting Less than 118". 118"- 1/4" More than 114".
FIGURE 3. Joint Survey Form, Part L
13

Date: I I CSJ: Nearest RM: ---
Lane:......_ __ _ Direction: ----
15 14 1312 11 10 9 8 7 6 5 4 3 2 1 0
10 . ~ . . .. " . .. .. " . . . . . . .. .... * .............................................................. .. . . . ,. .. .. ..
9 . . .. .. .. .. .. . .. . . .. .. .. . .. . . .. .. .. .. .. . .. .. .. .. .. .. .. . .. .. . .. .. ... ~ ............... .. . .. .. .. . ..
8 .. f * .. . . . .. .. .. .. . .. . .. . . . .. .. .. .. . .. .. .. . . . .. .. .. .. .. . . . ~ . .. . .. .. . .. . . .. .. . .. . ... .
7 . . . . . .. .. . .. . . . . .. .. . . . .. .. .. .. .. . . " .. .. .. .. .. .. .. . .. .. .. . .. .. .. . . .. ~ .. .. . . .. .. . .. .. . .
6 .. . .. .. .. .. . . . ..................................................................
5 . . . . . . . . . . .. .. .. . .. . . .. . .. " . . . .. .. .. .. . .. .. .. . .. .. . . .. .. . . . .. . .. . . . . .. . . . . . ~ .. . . .. . .. . ~ .
4 . . . ....................................................................
.. . .. .. ..
3 . .. .. .. .. ~ .. . .. .. . . . .. .. .. . . .. .. . . . .. . . .. .. .. . . . .. .. . .. .. . . .. .. .. . .. .. .. .......................... .
2 ~----~--------------------------------~
... : .. -~-1-i ... : ... : ... ~--- : __ . : ... : ... : ... : ... : ... ~-- .: ... . . I • . . . . . • . . • . .
1 • 1 •
. I :
FIGURE 4. Joint Survey Form, Part II.
14

• Intrusion,
• Missing sealant,
• Partial depth spall,
• Full depth spall, and
• Extrusion.
INITIAL OBSERVED PERFORMANCE
The loss of adhesion to the concrete was the most common form of distress observed in the
field. This was particularly true for the hot applied joint sealants. Figure 5 shows the
adhesion loss observed at various test sections, which are specified by the section number
(Figure 1) and sealant geometry number (Figure 2). For example, the symbol ofS3-2 in
Figure 5 designates a section within Section 3 as shown in the test site layout (Figure 1). The
number 2 in the symbol indicates that joints in the section used Geometry 2, which is shown
in Figure 2. As seen from the plot, silicone sealant had an overall better performance
compared to other types of joints.
Section three, which was installed using Kengo joint sealant, had the poorest
performance. This behavior was expected, since most of the material had drained into the
shoulders leaving behind empty joint wells during installation. It was also observed that the
hot poured sealants were also prone to intrusion.
Deflection Testing
A FWD (falling weight deflectometer) test program was carried out to record the load
transfer efficiency across the joints. The testing equipment is a trailer-mounted FWD
weighing approximately 6,670 N (1,500 lb). The impulse force is created by dropping
masses. The load, measured by a transducer, is transmitted to the pavement through the load
plate having a radius of 150 mm (5.9005 in). Deflections are measured by using velocity
transducers mounted on a bar that is lowered simultaneously with the load plate to the
15

100%
90%
80%
70% = 60% Q,)
~50% Q,)
.Q. 40%
30%
20%
10%
0%
+ OAdhesion- High
II Adhesion - Med
t-II Adhesion- Low
r1 _ • 1 __ ry <'( '1' N ":"
N N l"'l
"" "" "" "" "" "" ""
,... r
,.. l"'l .,.., .... N -A ~ -A ~
"" "" "" "" "" Site
FIGURE 5. Adhesion Loss for Various Test Sections.
16
r
I -....
""

pavement surface. The results of FWD field measurements are described in terms of the load
plate deflection (D0 ), the load transfer efficiency (L TE), and the effective stiffness (E<) at the
joint. The L TE is equal to the change in deflection on the unloaded side of the joint divided
by the change in deflection on the loaded side of the joint. The effective stiffness Ec is
determined from the Westergaard solution for slab-on-grade deflections at an interior load
position.
To study the effect of pavement temperature, the FWD test runs were carried out once
in the morning and then repeated in the late afternoon. The morning test was carried out until
approximately 11:30 a.m. on an overcast day. No significant change in the ambient
temperature was observed during this test session. The afternoon session was carried out
over the same joints and a comparison made. Figure 6 illustrates the L TE plot, across each
joint in the test site. For comparison purposes, both the morning as well as the afternoon test
results are plotted in Figure 6. As seen from the L TE plot, the transfer of load across the
joints was excellent. Morning and afternoon sessions did show some difference. These data
will be useful as a reference for future evaluation of the in-place joint sealants.
FWD tests were also carried out at the center of the selected slabs in each section.
These data can be used to back-calculate the elastic layer modulus of underlying layers and
also to determine the deflection basin along the length of the test section. A continued effort
should be made to survey and record the FWD test data for future reference. These data can
be effectively applied to evaluate the influence of joint sealants on pavement performance.
Continual monitoring of the changes in L TE across a joint over a long period can reveal the
benefits of joint sealants in improving the pavement joint life as well as sealants'
effectiveness. As an additional note, there are many factors that affect the actual response of
slabs to FWD loading, such as pavement temperature, which can affect measured deflections
due to slab curling and warping over the course of the day. To minimize variability due to
this effect, FWD tests should be carried out under the same environmental and seasonal
conditions.
17

100
90
80 -~ = 70 -~ ~ 60 ~
50
40 I ........... I
30 0 1 2 3 4
Distance (miles)
·······Morning -Afternoon J
FIGURE 6. Load Transfer Efficiency Along the Test Site.
18

JOINT SEALANT SURVEY AMONG DISTRICT ENGINEERS
During the course of this project, joint sealant survey forms were sent to various TxDOT district
pavement management engineers to procure information pertaining to use of joint sealants in
their concrete pavements. The researchers were interested in knowing what kind of joint
sealants were most often used and their performance levels. The specific information sought
included:
• Brand name of sealants used in recent past,
• Their performance rating (s) (on a scale of 1 to 5),
• Mode of failure, if any, and
• Maintenance and other pertinent information.
Survey Form
A survey form was developed to procure the above mentioned information from district
pavement engineers. This joint sealant survey form (provided in Appendix C) was sent to all
the TxDOT district offices. The survey form had listed the sealants used in project 1371 and
this project. Due to rapid development in the sealant industry and constant change in sealant
formulation, only information pertaining to sealants less than eight years old was requested.
Sealants that did not survive beyond six months were rated poor while those surviving
more than five years without failure were rated excellent.
FINDINGS
Figure 7 illustrates the performance rating of various joints sealants as obtained from the
survey. Generally, the silicone-based sealant performed better than the asphaltic sealants
(hot poured). It was also found that the districts relied on their experience and used a sealant
that had worked best in the past. None of the asphaltic-based sealant was rated excellent.
There was one instance where a silicone-based sealant was rated poor. Upon further
investigation, it was found that this particular sealant was not properly installed at the time of
sealing and hence rapidly failed.
19

8 ,-------------------------------------------~
7
~6 = ·--~5 ~4 ""' ~ .Q3 e z2
1
0 Crafco SL Dow 890 Crafco 231 Meadows 164 Sonneborn SLl
Dow 888 Baysilone Durafill Solarite Preformed Sealant Type
[ • Po~r • Good • Excellent I
FIGURE 7. Performance Rating of Various Sealants from TxDOT District Survey.
20

CHAPTER 3 LABORATORY TEST PROGRAM
INTRODUCTION
One of the benefits of the laboratory testing conducted in project 1371 and this project was the
development of specification and test protocols for joint sealants in concrete pavements to
evaluate the sealant material performance, which was based upon material models for
estimation of the service life of a joint sealant (Chapter 6). As a result of the laboratory tests, as
well as the field observations conducted in project 1371 and this project, new specification and
test protocols in Appendices A and B were developed which should be validated under field
conditions. Sealant evaluation was carried out relative to the material relaxation, bond strength
and performance models for va.-Ious sealant materials. Most of these efforts Wf"re developed
under project 13 71. Results of these tests, as well as detailed laboratory setup and theoretical
background involved in synthesizing the data, can be found in the final report of project 13 71
[1]. More relaxation tests of :fresh specimens and artificially aged specimens were performed
under this project. All the relaxation tests of fresh and artificially aged specimens of various
joint sealant materials are summarized and reported in this chapter and Chapter 4. Under this
project, relaxation tests of specimens of many sealant materials were conducted after naturally
or artificially aging in order to understand the equivalency between effects of natural and
artificial weathering. This equivalence is discussed in Chapter 5. Also, relaxation tests of
preformed sealants were conducted. For readers' convenience, relaxation test procedures and
related theoretical background are repeated briefly in this chapter and Chapter 4, although they
have been addressed in the final report of project 1371 [1].
TEST MATERIALS
Today, there are numerous varieties of sealants available on the market for joints in concrete
pavements [6, 7]. Many are either silicone-based, urethane, or asphaltic in nature. Silicone
sealants can be found in either self-leveling or non-sagging form. To distinguish between
different materials, they are classified according to Item 433 of Texas Department of
21

Transportation's Standard Specifications for Construction of Highways, Streets and Bridges,
1993 [8].
The materials selected covered a wide range of material classification. A brief
description of the materials used in the laboratory test programs follows.
1. Crafco Roadsaver: This is an asphaltic-based material, which is hot applied.
2. Crafco 903-SL: It is a cold-applied, one-part low modulus silicone rubber. The
material is packaged in a cartridge container which is extruded with a hand
operated caulking gun.
3. Dow Corning 888: It is a cold-applied, one-part low modulus silicone rubber.
The material is packaged in a cartridge container which is extruded with a hand
operated caulking gun.
4. Dow Corning 890-SL: It is also a cold-applied, one-part low modulus self
leveling silicone sealant The material is packaged in a cartridge container
which is extruded with a hand-operated caulking gun.
5. Durajill 3405: This is a hot-applied asphaltic-based material, which is specially
formulated to be heat stabilized for direct-fired heaters.
6. Fox Industries FX-570: It is a two-component polymeric joint sealant The two
components are mixed in a proportion as provided by the manufacturer. The
manufacturer provided smaller convenient packages for this study which were
thoroughly mixed to produce a caulking gun grade material.
7. Percol Joint Sealant: It is a two component polyurethane joint sealant The two
components are mixed in equal proportion with the aid of an air-pressure
operated caulking gun. The material is packed in such a manner that while
extruding, the two components are mixed in the nozzle specially provided for it
The material sets quickly, and its curing time is about ten minutes with a pot life
of up to two minutes.
8. Solarite KM-2780: This is a hot-poured rubber-asphalt sealant which
incorporates a minimum of20% crumb rubber tire stock uniformly dispersed.
9. Delastic Preformed Neoprene Seals: This a preformed compression seal
manufactured by D.S. Brown in various configurations.
22

Table 1 below describes the materials used in the laboratory for evaluation and their
classification according to TxDOT Standard Specifications [8]. Since sealant materials of
Classes 1 and 4 demonstrate similar mechanical properties, and so do those of Classes 2 and 7,
we group Classes 1 and 4 as Type 1, Classes 2 and 7 as Type 2. Correspondingly, Class 5 is
Type 3; Class 3 is Type 4, and Class 6 is Type 5. We designate Type 6 for new materials that
cannot be classified in Types 1· 5. For the definitions of types of sealant materials, please refer
to Appendix A.
Table 1. Classification of Joint Sealants Studied.
Joint Sealant Classification Type (Item 433) (Appendix A)
D. 3, Brown Preformed Sea.l Class 6 TypeS
Crafco RoadSaver 230 Class 3 Type4
Crafco 903 SL Class 5 Type3
Dow Corning 888 Class 4 Typel
Dow Corning 890 SL Class 5 Type3
Durafill Class 3 Type4
Fox Industries FX·570 Class 1 Type 1
Percol Joint Sealant Class 2 Type2
Solarite Class 3 Type4
PREPARATION OF TEST SPECIMENS
When available, the test specimens used in the experimental study were prepared according to
the AS 1M standard requirements. Following sections discuss the preparation techniques used
for preparing relaxation, bond strength, and fatigue test specimens.
23

Relaxation Specimen
Relaxation tests were conducted in the uniaxial tension mode, and at present there is no
standard to specify test specimen geometry. There is little information in the literature
regarding the size ~ shape effects. Due to the mode of testing and traditional usage, a
rectangular-shaped test specimen was chosen for the test.
All the specimens were prepared from the material obtained from the same cartridge
container to preserve consistency among the specimens. The sealant specimens for relaxation
tests were prepared in a 300 mm x 230 mm x 6.35 mm wooden mold as shown in Figure 8(a).
A plastic sheet coated with a thin layer of silicone lubricant placed at the bottom of the mold
prevented adhesion between the material and the mold. The curing time for the material varied
according to the manufacturer's recommendations. All curing was done at 25 °C temperature
and 50% relative humidity. Once the curing was accomplished, the sheet of the cured sealant
material (Figure 8(b)) was removed from the mold, and 6.35 mm wide strips were cut using a
band saw (Figure 8(c)). Consequently, strips of a cross-sectional area of 12.7 mm x 6.35 mm
were obtained. These strips of material were then tested to characterize the unaged sealant
material. The relaxation test specimen had a gauge length of 50.8 mm and 25.4 mm of grip
length on each end. To securely grip the test specimen without pinching, 3 mm thick plywood
strips measuring 6.35 mm wide and 25.4 mm long were glued on opposite sides of each end of
the specimen (Figure 8d).
The remaining uncut sheet of the sealant material was then placed in the Ci65A Atlas
Weather-Ometer® for accelerated aging [9]. The material was artificially aged by exposing it to
weathering cycles for at least 2000 hours in 500-hour intervals. Strips of the aged materials
were cut from the sheet of the material at the end of every 500-hour interval for the preparation
of test specimens. Use of the Atlas Weather-Ometer will be discussed at the end of this chapter.
24

Plywood Strip
_L ·:> 6.35 mm
I .__..__._-----------------._.__._..
(d) 1----- 51mm
IOOmm
Figure 8. Relaxation Specimen (a) Specimen Mold, (b) Cured Sheet of Material, (c) Specimen Strips, and (d) Test Specimen.
25

TEST PROCEDURES
Standard test procedures were followed to conduct the test program when available.
Unfortunately, there are not many standard specifications for testing joint sealant materials
pertaining to the scope of this research. Therefore, the tests were either conducted based on the
literature review or a standard specification available for a similar material for a similar
purpose. The following section discusses the test procedures used to conduct various tests on
the sealant material specimen prepared.
Relaxation Test
Researchers used stress relaxation tests to investigate and characterize the time-dependent
properties and aging effect of joint sealants. Accordingly, a test specimen was instantaneously
stretched to a predetermined unit extension level and maintained at that unit extension level.
The decaying magnitude of the load with time in the test specimen was recorded and was used
for determining the viscoelastic parameters.
All the dimensions of the specimen were measured and recorded before setting it up for
the test. All the relaxation tests were carried out on an Instron machine, model4505. A 690 N
load cell was used to record the load, and the data was automatically acquired using lnstron data
acquisition software. All the specimens were stretched at a constant rate of 50.8 mm/minute to
the desired unit extension levels. This applied displacement rate of50.8 mm/minute met the
specification of ASTM D 2991 [10]. Field studies of pavement joints in the past have shown
that joint sealant materials can experience a large amount of joint opening and closing. In an
attempt to encompass the wide range of movements that may be experienced by a concrete
pavement joint sealant in the field, six different levels of unit extensions were used. These
levels varied from 5, 10, 30, 50, and 100% of the original gauge length (50.8 mm). The unit
extension level of 30% was later dropped for test temperatures other than 25 °C. This was done
for each level of age, generally at 500 hours of exposure, in the Atlas Weather-Ometer, apart.
There were generally five age groups up to 2000 hours of exposure. Crafco 903 SL (Table 1)
26

was also studied for additional age level of2500 hours of exposure. The above combinations of
unit extension levels and age levels were repeated at five different test temperatures, namely,
-25, 0, 25,40 and 60 °C. Tables 2 and 3 summarize aging exposure time and temperatures used
for the relaxation tests of different joint sealant materials.
VISCOELASTIC MATERIAL MODEL
A joint sealant response depends not only on the temperature but also the deformation and its
age. To characterize effects of deformation, age, and temperature, a relationship similar to one
proposed by William, Lande!, and Ferry [11] (usually referred as the WLF equation) is used.
The WLF equation was originally proposed to relate the effect of temperature to the effect of
time on relaxation modulus, based on a great deal of experimental evidence. The relationship
proposed in this investigation converts the factors of deformation, age, and temperature to the
factor of time:
(1)
t (2) -r=
a(E, A, T)
where,
~ =relaxation modulus,
t = reduced time,
a(E, A, T) =material shift factor,
E =unit extension,
A =age,
T = tempemture,
Eo = reference unit extension,
27

Table 2. Relaxation Test Performed for Various Temperature Levels.
Material Temperature Level CC) Type
-25 0 25 40 60
Crafco 903 SL ./ ./ ./ ./ ./
Dow Coming 888 ./ ../ ./ ./ ../
Dow Coming 890 SL ../ ../ ./ ./ ./
Percol Joint Sealant ./
Fox Industries FX-570 ../
Table 3. Relaxation Test Performed for Various Age Levels.
Material Age Level (Hours of Exposure) Type
0 500 1000 1500 2000 2500 i
Crafco 903 SL ./ ./ ./ ./ ../
Dow Coming 888 ../ ../ ./ ../ ./ ../
Dow Coming 890 ./ ../ ./ ../ ./ SL
Percol Joint ../ ../ ../ ../ ./ Sealant
Fox Industries ../ ../ ../ ../ ../ FX-570
28

= reference age, and
= reference temperature.
The material shift factor, a(E, A, T) can be separated into three distinct factors, namely,
time-deformation, time-age, and time-temperature shift factor as:
(3)
It is found that the time-deformation shift factor, ~(E), the time-age shift factor, aA(A),
and the time-temperature shift factor, ay(T), can be well described in the form as:
and
where,
L /£l _ - K1 (E - Eo) og a£ 1' 1 - K E E
2 + - 0
- KJ(A - Ao)
K4 +A - Ao
~(E) = time-deformation shift factor,
aiA) =time-age shift factor,
ar(T) = time-temperature shift factor,
K1, K2 =material constants determining the deformation effect,
K3, ~ = material constants determining the age effect, and
K5, = material constant determining the temperature effect.
29
(4)
(5)
(6)

To determine the relaxation modulus from laboratory tests, the following equations
were used to convert the unit extension into Cauchy stress (or true stress) and finite strain [ 1]:
a(t) = P(t) = P(t)L(t) A(t) w;T;L;
(7)
1 2 E11 =-(A O) -1)
2 (8)
where
cr(t) = Cauchy stress (or true stress) at time t,
P(t) = load at time t,
A(t) = deformed cross-sectional area at time t,
wi = initial width of the test specimen,
Ti = initial thickness of the test specimen,
L. I = initial length of the test specimen,
En = the tensile strain in the load direction, and
A(l) = L(t)/Li =stretch.
Relaxation modulus is then obtained as
(9)
Note that~~>- 1 = [L(t)-/Li ]/Li is referred to as unit extension.
PREFORMED JOINT SEALANT
Delastic preformed neoprene seals supplied by D.S. Brown Co. were evaluated in the
laboratory. Two preformed compression seal models viz., V-687 and V-812 as shown in
Figure 9 were tested. These seals are used to prevent the entry ofhann:ful and damaging
particles and moisture into a concrete pavement joint. This is achieved by exerting a constant
compressive force on the joint reservoir wall while allowing the concrete pavement to move
30

because of temperature and moisture changes. These V -series models are generally used for
sealing joints in concrete pavements.
Typical joint design for the KE" and "V" series pavement seals.
' .· . . . .· .. ·. .
n ·. :.~·::
. · .. "" - -
. ... " . . . . . .· .. . . .
. .. ........ . ~ . .. . .. ... ......
,. ·.. . . .... . ..... . .. .. ....
"' .. . .. . -· .. . ,~.: .. ... .. . .. . .. . . .. . .. .. . .. .. .. .. ·: ~ ... 118": ..
.., "' • .. I '" ., "' •
Model Nominal Width Nominal Height (W),mm (H),mm
V-687 17.46 20.64 V-812 20.64 23.81
Figure 9. Preformed Compression Seal Models V-687 and V-812.
Weathering
Samples of the preformed joint sealant were artificially weathered to study the effect of aging
on the seal behavior. A number of 150-mm-long strips were cut from the roll supplied and
were subjected to artificial weathering in the Atlas Weather-Ometer. These were exposed
along with other joint sealants such as silicone and asphalt-based sealant. The specimens
were placed in the mold and were exposed only from the top. These samples were tested in
compression relaxation mode at different levels of weathering, namely 0, 1000, and 2000
hours.
31

Test Specimen and Procedure
The test specimens measured 76 mm in length and were obtained by cutting off the ends of
the 150-mm-long strips. This was primarily done to remove the ends of the strips which
might have been exposed to radiation from the sides. The test specimens were supported by
thin plywood strips on both ends to prevent any slipping while they were compressed to the
desired level. The plywood strips were not glued to the test specimen because of the
compressive nature of the test.
Two levels of compressive strains, 15 and 30% were used in the study. For each age
level, the specimens were compressed to the desired strain level at a rate of 52 mm/min and
held constant in that position with time. The load required to maintain the deformation was
measured and recorded to study the relaxation behavior. The test and measurement were
accomplished using the lnstron model 4505 test system.
ACCELERATED WEATHERING (AGING)
Joint sealant materials were subjected to repeated exposure to accelerated weather cycles in the
Atlas Ci65A Weather-Ometer® system (Figure 10) [9]. The Ci65A Xenon Weather-Ometer®
has a controlled irradiance Xenon exposure system. It reproduces and accelerates the
degradation process of the specimen by controlling parameters including black panel
temperature, dry bulb temperature, humidity, light, and water spray. The weather cycle, as
shown in Table 4, was 120 minutes long and consisted of60 minutes oflight exposure only,
followed by 40 minutes oflight exposure and water spray, and finally a dark period of20
minutes. The term "cycle" is defined as the total time for all exposure conditions to be
repeated. The samples were placed horizontally inside the apparatus as shown in Figure 10.
The radiant energy is provided by a single water-cooled-xenon-arc lamp whose filtered spectral
output closely simulates natural sunlight (Figure 11). ASTM Standards, D 4798, "Standard Test
Method for Accelerated Weathering Test Conditions and Procedures for Bituminous Materials
(Xenon-Arc Method)" [12], and G 26, "Practice for Operating Light-Exposure Apparatus
32

(Xenon-Arc Type) With and Without Water for Exposure ofNonmetallic Materials" [13] were
used to successfully weather the test samples.
The temperature, moisture, and radiation conditions provided by the Atlas Weather
Ometer are different from those in nature. (Figure 12 compares spectral distributions of natural
sunlight and the radiant rays in the Atlas Ci65A.) Efforts were made to determine the
equivalency of the natural and artificial wearthering , which will be discussed in Chapter 5.
Table 4. Operating Cycle of the Exposure.
Test Conditions Time, min i
Light only ( 60 oc ± 3 oc black panel temperature) 60
Light with spray 40
Dark 20
A complete cycle 120
Total cycle time (12 complete cycles) 24h
33

FIGURE 10. Atlas Ci65A Xenon Weather-Ometer®.
34

FIGURE 11. Test Samples in Atlas Ci65A Xenon Weather-Ometer®.
1.2
,..-._
] "'
0.8
~ 0.6 ..._, \l) t.)
~ 0.4
~ t:: 0.2
Xenon -0 275 :100 325 350 :175
Wavelength (run)
FIGURE 12. Comparison of Spectral Distribution ofNatural Sunlight and Atlas Ci65A.
35


CHAPTER4 ANALYSIS OF EXPERIMENTAL DATA
INTRODUCTION
This chapter presents the analysis of experimental data obtained from relaxation tests under
different conditions. The analysis of the relaxation test results, as well as the bond and fatigue
test results, forms the basis of the specification and test protocol listed in Appendices A and B.
The bond and fatigue tests have been previously described in the final report of project 13 71
[1 ].
MATERIAL MODEL
Due to their apparent viscoelastic nature, stress relaxation tests were employed to investigate
the time-dependent properties and aging characteristics of joint sealants. In the relaxation test,
the sample was brought to a predetermined unit extension level and held indefinitely. The
decaying load to maintain the given unit extension level was recorded using the Instron data
acquisition system. These data were then converted into a relaxation modulus using finite
strain and true stress definitions.
Up to six different levels of unit extensions namely 5, 10, 20, 30, 50 and 100%, five
levels of age, namely 0, 500, 1000, 1500, and 2000 hours of exposure time, and five different
temperature levels, namely -25, 0, 25, 40, and 60 °C, were used in this study. Relaxation
modulus curves were successively normalized to account first for deformation, then for age, and
finally for temperature. As a result, a master relaxation modulus curve was obtained, in which
factors of deformation, age, and temperature are converted to the factor of time by three shift
relationships. These relationships are combined to form material shift factors
(Equations 3-6).
All the relaxation modulus curves obtained for Crafco 903 SL (Table 1) are plotted in
Appendix D. Data for Dow Corning 888, Dow Corning 890 SL, Percoljoint sealant, and Fox
Industries FX-570 have been shown in the final report of project 1371. For Percoljoint sealant
and Fox Industries FX-570, relaxation tests were conducted only at room temperature (25 °C),
37

and the temperature dependence was not measured due to time and budget constraints. To
maintain the clarity of explanation, only Crafco 903 SL will be discussed in the following
sections. But the results for other materials are provided where appropriate.
Time-Deformation Shift Factor, aE(E)
Relaxation modulus curves measured for various unit extension levels are shown in
Figures 44-63 of Appendix D for the material Crafco 903 SL. These relaxation modulus curves
were normalized for deformation. This was achieved by horizontally shifting the individual
curves to superimpose them on a chosen reference unit extension level. In this study, a unit
extension level of 5% was chosen as the reference level, c0• Accordingly, all the curves were
shifted to the right to form a smooth curve. The amount of shifts for each unit extension level
was recorded. The time-deformation shift factors, 3:E (E) for Crafco 903 SL are shown in Figure
64. Figures 65-69 show the resulting curves for all temperature and age levels. For
convenience, all these curves normalized for unit extension are displayed on the same plot for
each temperature level.
Using the shifts required to generate a master curve, the time-deformation shift
relationship, aE(E), in the form of Equation 4 was deduced for each material. The material
constants, K1 and K2 , of time-deformation shift relationships, aE (E), were obtained as a
minimum error fit, as shown in Table 5. The solid line in Figure 64 is the fitted curve
(Equation 4) is found to be a good fit to the observed data.
Time-Age Shift Factor, aA(A)
Figure 70 of Appendix D collectively illustrates the relaxation modulus curves normalized for
all age levels obtained under five different temperature levels. The effect of exposing the
specimen to UV radiation, temperature, and moisture is clearly evident from these figures. As
expected, the material became stiffer with age, and the modulus increased with each exposure
level. As proposed, the effect of age was normalized by forming yet another master curve.
38

Table 5. Time-Deformation Shift Constants.
Joint Sealant Kt K2 I
Dow Coming 888 10.66 109.12
Dow Coming 890 SL 6.36 72.52
Crafco 903 SL 9.63 49.10
Percol Joint Sealant 5.62 29.04
I FX570 7.66 27.31
This time, the unaged level (zero hours of exposure) was chosen as the reference age, and the
curves in Figures 65-69 were moved horizontally to the left. These shifts are plotted in Figure
71. Equation 5 was used to describe the relationship between age and the time-age shift factor.
The fitted relationship is plotted in Figure 70 of Appendix D along with observed values
of the time-age shift factors for each material. The new normalized relaxation modulus curves
are thus obtained, which have been normalized for deformation and age. For convenience, all
these curves are shown together for different temperatures in the same figure. The time-age
shifts constants, K3 and K4, obtained for all the materials tested are tabulated in Table 6.
Table 6. Time-Age Shift Constants.
Joint Sealant K3 ~
Dow Coming 888 3.79 888.00
Dow Coming 890 SL 12.11 13700.00 !
Crafco 903 SL 102.97 35230.00
Percol Joint Sealant 4.69 1082.00
FX570 6.54 686.65
39

Time-Temperature Shift Factor, aT(f)
Figure 72 shows the relaxation modulus normalized for deformation and age effects. As can be
seen from the plot, these curves can be shifted one more time to form a "fmal" master relaxation
modulus curve for the material. A temperature of 25 oc was chosen as the reference
temperature, and the curves were shifted to the right or left accordingly. Figure 73 shows the
plot of time-temperature shift factors. Equation 6 for the time-temperature shift factors was
used to fit a curve and determine the material constants. Table 7 provides the values ofK5 for
the material tested. Figure 56 shows the fmal master relaxation modulus curve obtained for
Crafco 903 SL after normalizing for unit extension, age, and temperature dependence.
Table 7. Time-T~mperature Shift Constants.
Joint Sealant K5 (T <25 °C) K5 (T> 25 °C)
Crafco SL 903 SL 1.884 0.01237
Dow Corning 890 SL - -Dow Corning 888 - -
ANALYTICAL MATERIAL MODEL
A model for pavement joint sealants can be developed reliably if an appropriate material
model representing the behavior of the material is incorporated. The constitution of silicone
and polymer sealants is such that it displays a viscoelastic behavior. These materials are
neither pure elastic solid nor pure fluid. Their response lies somewhere in between these two
extremes. The constitutive equation, which relates the response of the material to external
displacements, can be developed from relaxation modulus curves. The viscoelastic behavior
can be represented by various combinations of springs and dashpots [14-16]. A linear spring
element represents instantaneous elasticity and instantaneous recovery, whereas, a dashpot
represents the viscous nature of the material. These basic units can be arranged in various
40

combinations to represent a particular material response. For this study, the Generalized
Maxwell model in parallel was chosen to represent the sealant behavior as it can accurately
predict the time-dependence of stress associated with a prescribed strain variation. This
model is also easy to incorporate in finite element analysis.
Generalized Maxwell Model
The Maxwell model consists of linear spring and linear viscous dashpot elements connected
in series. In the generalized Maxwell model in parallel, Maxwell units are connected in
parallel with a single spring element, shown in Figure 13. This model represents
instantaneous elasticity, delayed elasticity with various retardation times, stress relaxation
with various relaxation times, and viscous flow. The generalized Maxwell model in parallel
can be used to predict stress associated with a prescribed strain variation more accurately
since the same strain is applied to each individual element. The resulting stress is then
simply the sum of the individual contributions of each Maxwell unit. The relaxation
modulus,~, for a generalized Maxwell model in parallel is given by:
n
ER(r)= Eo + L E; (10) i=l
where
~('t) =relaxation modulus,
Eb 11; = modulus and viscosity of ith Maxwell unit, and
n =the total number of the Maxwell units.
The above equation is generally written in the following form for convenience:
n r
E(r) = Eo + L E; e-;; (11) i=l
where
~ = 11/Ei = relaxation time for ith Maxwell unit.
41

Eo
Figure 13. Generalized Maxwell Model.
The relaxation moduli of a viscoelastic material is determined from stress relaxation
tests. Once the "master relaxation modulus" curve normalized for the deformation, age, and
temperature effects is obtained for a material, a generalized Maxwell model can be fitted to
the experimental data. There are different numerical techniques to obtain parameters for the
Maxwell model that make the master relaxation modulus curve fit the experimental data. One
method would be to minimize the square error between the measured relaxation modulus data
and analytical representation, i.e., generalized Maxwell model (Equation 11 ). Another common
method is to equate the experimental data and analytical representation at several points. This
matching procedure is called the collocation method.
The range of variation of a single exponential function is approximately one decade, and
if several exponentials with widely separated relaxation times are added together, it results in
the staircase-type function. However, if the time constants are selected close together, the
42

exponentials blend together to form a smooth curve. It is clear that these times should not be
separated by more than a decade.
The two sets of unknown coefficients, Ei and l;1, were determined by using the
collocation technique. This was easily done by solving Equation 11 for an arbitrarily chosen
set of relaxation times (l;/s) for each Maxwell unit. Once the <;'s are fixed, Equation 11
reduces to a set of simple equations which are solved simultaneously to obtain the modulus
values. Tables 8-12list the values of relaxation time used for each material and the
corresponding modulus (EJ values obtained from the solution. Once the relaxation modulus
for each unit was obtained, the corresponding coefficients of viscosities were calculated using
the following relationship:
(12)
In Figures 14-18, the master relaxation modulus curves obtained from the laboratory
tests and the one described by fitted Generalized Maxwell Model in parallel are plotted for
each material. As seen from the figures, the fitted model provides an accurate and reliable fit
to the laboratory curves.
43

Table 8. Coefficients of Generalized Maxwell Model for Crafco 903 SL.
Element# Modulus (psi) Coefficient of Viscosity Log Relaxation
Ei ~(psi-sec) Time t; (sec)
0 16.674 - -1 0.8 1.6E-3 2E-03
2 1.531 3.06E-2 2E-02
3 1.537 3.07E-1 2E-01
4 0.804 1.6 2E+OO
5 0.8"2 1.7E+1 2E+01
6 0.7 1.4E+2 2E+02
7 0.64 1.38E+3 2E+03
8 0.94 1.88E+4 2E+04
9 0.519 1.04E+5 2E+05
10 0.902 L8E+6 2E+06
11 0.631 1.26E+7 2E+07
12 0.795 1.6E+8 2E+08
13 0.667 L334E+9 2E+09
14 0.358 7.16E+9 2E+l0
15 0.673 L35E+ll 2E+ll
16 0.358 7.16E+ll 2E+12
17 0.698 1.396E+13 2E+13
44
Table 9. Coefficients of Generalized Maxwell Model for Dow Coming 888.
Element# Modulus (psi) Coefficient of Viscosity Log Relaxation
Ei llj (psi-sec) Time ti (sec)
i 0 16.674 - -
1 7.59 1.52E-01 2E-02
2 16.918 3.384 2E-01
3 33.585 67.17 2E+OO
4 29.622 5.92E+02 2E+Ol
5 33.807 6.76E+03 2E+02
6 10.776 2.152E+04 2E+03
7 5.019 1.004E+05 2E+04
Table 10. Coefficients of Generalized Maxwell Model for Dow Coming 890 SL.
Element# Modulus (psi) Coefficient of Viscosity Log Relaxation
E. I llj (psi-sec) Time ti (sec)
0 2.27 - -
1 1.965 3.93E-1 2E-01
2 7.343 1.468 2E+OO
3 11.67 2.334E+02 2E+Ol
4 4.272 8.544E+02 2E+02
5 0.807 1.614E+03 2E+03
6 0.605 1.21E+04 2E+04
45

Table 11. Coefficients of Generalized Maxwell Model for Percol Joint Sealant.
Element# Modulus (psi) Coefficient of Viscosity Log Relaxation
Ei ~(psi-sec) Time 1j (sec)
0 23.4 - -
1 9.776 1.96E-2 2E-03
2 5.246 1.05E-1 2E-02
3 0.65 1.3 2E-01
4 4.019 8.04 2E+OO
5 2.339 4.67E+1 2E+01
6 2.502 5.0E+2 2E+02
7 2.635 5.27E+3 2E+03
8 2.375 4.75E+4 2E+04
9 1.178 2.36E+5 2E+05
10 3.284 6.34E+6 2E+06
11 3.261 6.32E+7 2E+07
46

Table 12. Coefficients of Generalized Maxwell Model for FX-570.
Element# Modulus (psi) Coefficient of Viscosity Log Relaxation
£. I
h; (lb/in2-sec) Time~ (sec)
0 50.674 - -
1 19.878 0.03976 2E-03
2 37.899 0.75798 2E-02
3 36.902 7.3804 2E-01
4 42.941 85.882 2E+OO
5 0.464 9.28 2E+01
6 63.342 1.27E+3 2E+02
7 10.349 2.07E+4 2E+03
8 32.051 6.41E+5 2E+04 i
9 5.051 1.01E+6 2E+05
10 20.965 4.19E+7 2E+06
11 11.24 2.25E+8 2E+07
12 11.169 2.24E+9 2E+08
13 4.663 9.33E+9 2E+09
14 14.112 2.82E+11 2E+l0
47

220
--~ 200 g -a 1so -= "0 Q 160 ~ c Q
·.:::: 140 ~ il'< ~
~ 120
100
-10
\
i\
I
-5
I I i
~ ~ I
I
' ~ '"" --.
~
0 5 10 15 Log Reduced Time (sec)
Figure 14. Master Relaxation Modulus Curve and Fitted Generalized Maxwell Model for Crafco 903 SL.
48

180
-eo:: I 50
~ -; 120 -::::
\
1\ ~
1'\.. "0 0 90 ~ c 0 ·- 60 -eo: ~
I ""' •
"' ' •
" ......... "' C':l -<IJ
30 ~
............ ........_ '- ----
0 ,-· ' t=C
-4 -2 0 2 4 6 8 10 Log Reduced Time (sec)
Figure 15. Master Relaxation Modulus Curve and Fitted Generalized Maxwell Model for Dow Corning 888.
49

30
";' 25
~ ~ 20 -::I
"C
~ 15
= Q
:c 10 ~ ~ ~ -~ 5
0
\ \
1\
\. ~
-·
··-----2 0
i
I I !
'-.... i
'-
"' ~ --~ ~-~--...._
r-j
2 4 6 8 10 Log Reduced Time (Sec)
Figure 16. Master Relaxation Modulus Curve and Fitted Generalized Maxwell Model for Dow Coming 890 SL.
50

450
-~ 400 ~
~ -~ 350 -= "'C
~ 300 Cl Q ::: 250 c: >< c: -~ 200
150
' 1'\ 'I'..
[
I
-4 -2
!
!
I i
.......,
~ -~ I I I I
I
"1---.. j I
"!"--I ............
b--. I
I ....... ~
("
'
0 2 4 6 8 10 Log Reduced Time (sec)
Figure 17. Master Relaxation Modulus Curve and Fitted Generalized Maxwell Model for Percol Joint Sealant
51

2500
-~ 2000 -en = :; 1500 "'C 0
~ § 1000
0
\ I
I
·'\
'""
I
!
. ! i
-6 -4
I I I I
I I I
I I I
~ I
""' I ___,
"" ~ !'--.. '> I ·~
!'--..
~ I I I'- I
I I tt I
I I
-2 0 2 4 6 8 10 Log Reduced Time (sec)
Figure 18. Master Relaxation Modulus Curve and Fitted Generalized Maxwell Model for Fox Industries FX-570.
52

PREFORMED JOINT SEAL TEST RESULTS
For preformed joint seals, the test duration was consistent with the other relaxation tests
performed on silicone and polymer sealants. Figures 19-22 show the decaying modulus with
time. It should be noted that the stiffness of this type of seal is a "structural" stiffuess since
the 'modulus' refers to the overall rigidity ofthe seal and not elastic modulus of the material.
These figures clearly show that the stress relaxation occurs in the seals. With time, the
preformed compression seal loses its compressive reaction for the same amount of
deformation. The extent of this compressive loss will greatly affect the performance and
service life of the sealant. A preformed joint seal will be effective in field only if it maintains
a certain amount of compressive reaction on joint reservoir walls.
The effect of aging was also apparent from these figures. The seal structure hardened
and became stiffer with greater levels of exposure. The amount of increase in modulus is
large enough to warrant its inclusion in the design process. As seen from the plots, aging
caused the m9dulus to increase, and this upward shift between two ages was generally
constant with time. This behavior was clearly displayed in all tests except for model V -812
at 30% compression. The implication of this behavior is that a master curve can be generated
to normalize the effect of aging and strain by simply shifting the curves horizontally.
Equations similar to those proposed to normalized temperature, deformation, and age
in silicone sealant can be also used for preformed compression seals. To develop these
master curves and to determine the shift factors, a more rigorous test program involving
different test temperatures should be explored and its effects characterized.
53

50 ~------------------------------------~
-ellS
~ 40 -rl.l = -= "C 35
~
0
3 0 -·-·- - -- -·-·-· -- - . ----··-
25 +~~~~~ +-1 ll+li+IIH-Ij --+1-+-1 HI 1-HII-1+111---I --+-1 -tl-ti+i ++llt+lllj-·1--+++-H++I----+---t-+++H+I
lE-1 lEO lEI 1E2 1E3 1E4 Time (seconds)
Figure 19. Relaxation Modulus for Seal V -687 at 15% Strain Level.
80~---------------------------------.
70
·-·-·--~--'±·-·-··-·-·--·--······
40
30 I I 1111111! I I I I I lllj
IE-1 lEO lEI 1E2 1E3 IE4
Time (seconds)
Figure 20. Relaxation Modulus for Seal V -687 at 30% Strain Level.
54
+
Ohrs 0
lOOOhrs
. 2000hrs
+
Ohrs Cl
1000 hrs
2000 hrs

220 ~----··~---------------------------,
200 0
-== " v
~ 180 - ... Cl
{I}
= -= v
-= 160 0
~ ...
140
120 +-+-+-++++++t---+--++t++ttt--+-+-++HH+t--t-+++-t+t+J---1f-t-t-+++++j
lE-I lEO lEI 1E2 1E3 1E4
Time (seconds)
Figure 21. Relaxation Modulus for Seal V-812 at 15% Strain Level.
300 .-------------------------------~
-== ~ -250
~ 200 -= -= ~
0
~ 1j1
0
v ·-·---···--··--·--·······-·--:--~....,..~ ... ··--···-·---·······--.. -----~
......... ___ ~ ~
150
100
-------------------- --- - -~---- -
IE-1 lEO lEI 1E2 1E3 IE4 Time (seconds)
Figure 22. Relaxation Modulus for Seal V-812 at 30% Strain Level.
55
Ohrs
1000 hrs 0
2000 hrs !
Ohrs
1000 hrs 0
2000 hrs


CHAPTER 5 CORRELATIONAL STUDY OF ARTIFICIAL AND NATURAL WEATHERING
INTRODUCTION
In service, a joint sealant is exposed to the natural environment. The environmental factors
include:
• sunlight (UV radiation and heat radiation),
• ambient heat conduction, and
• precipitation, drainage, and moisture transfer.
Heat from the infra red portion of natural sunlight causes the temperature of the exposed
body of the sealant to rise above ambient temperature while ultraviolet light of wavelengths
between 280 and 400 nm, which makeup only about 6% of the total solar radiation received
by the earth's surface, is largely responsible for the degradation of materiaL Presence of
water or moisture may lead to macroscopic swelling of the sealant upon absorption. Water
may also lead to the hydrolysis of chemical bonds within the sealant's polymeric matrix and
manifest itself in the loss of adhesion. Thus, it is generally observed that the light, moisture,
and heat combine synergistically in the natural environment to cause photochemical and
mechanical changes in joint sealants [18].
These environmental factors listed above vary widely, even at the same geological
location. In contrast, artificial weathering provides stable conditions. Radiation intensity,
temperature, and moisture content in the artificial weathering chamber are controlled.
Consequently, the artificial weathering chamber cannot completely simulate the natural
weathering because of the complexity of the environmental factors. It is obviously important
to understand how artificial weathering is correlated to natural weathering. The methodology
used in this project is to correlate the relaxation modulus of the specimens weathered in these
different ways because a series of relaxation tests conducted in project 13 71 and this project
have given equivalency among effects of temperature, deformation, and artificial aging on
the relaxation modulus (Chapters 3 and 4).
57

ARTIFICIAL WEATHERING
An Atlas Weather-Ometer® Ci65A was used to artificially weather the sealant specimens.
Atlas Ci65A reproduces and accelerates the natural degradation process. The radiant energy
in Ci65A is provided by a single, water-cooled xenon arc lamp whose spectral output closely
simulates natural sunlight.
Samples were artificially aged and tested in the laboratory following the procedure
shown in Chapter 3. The results of this test will be utilized to generate a correlation between
artificial and natural weathering.
NATURAL WEATHERING
For the purpose of correlating the two kinds of weathering, the joint sea.tant specimens were
subjected to natural weathering according to ASTM G7 [17] specifications. The exposure
site was located in College Station, Texas. Molded sheets of sealant material measuring 300
mm by 110 mm and 12.7 mm thick were placed on the rooftop on a plane surface at an angle
of 5° facing the equator. Test specimens were cut from these sheets at periods of2, 6, 12, 24,
and 52 weeks and tested in the laboratory. These samples were subjected to the relaxation
test regime.
The sealants subjected to natural weathering include Dow Corning 888 and 890SL,
Crafco 903 SL, Crafco RoadSaver 231, Durafill3405, Solarite KM, FX-570, and D.S. Brown
Company's Preformed pavement joint seals model V687 and V812.
SOLAR DATA
The solar data pertaining to the test period were obtained with the aid of the Meteorological
Department of Texas A&M University. The weather station located nearby is capable of
recording the ultra violet radiation, temperature, and wind speed, and downloads relevant
data every five seconds via a modem. The solar ultraviolet radiation (UV) recorded every
five seconds by the weather station was cumulatively added to obtain total radiation received
58

for the appropriate time durations. The intensity of total UV radiation, plotted in Figures 23-
26, was reasonably close to the one indicated by the general UV radiation contour maps.
CORRELATION BETWEEN NATURAL WEATHERING AND ARTIFICIAL
AGING
The relaxation tests conducted on these specimens are used to correlate natural and artificial
aging for individual materials. Tests revealed that the different materials react differently to
natural weathering. With controlled artificial weathering as the reference, some materials
degraded faster than others. The researchers concluded that the correlation between the
natural and artificial weathering is material-dependent. This is not surprising because
different mechanisms prevail in degradation of different sealant materials [18].
It has been shown that a sealant material becomes stiffer after artificial weathering
(Chapter 4). Similarly, natural weathering increases the relaxation modulus of the sealant
material. Since there was considerable noise in the load records of the relaxation tests of
naturally exposed specimens at unit extensions of 5% and 10%, relaxation test results at the
unit extension of30% are reported herein. Figures. 27-29 show relaxation moduli ofCrafco
903 SL, Dow Corning 888, and Dow Coming 890 SL after weathering. In these figures,
discrete marks indicate the relaxation moduli of artificially weathered specimens, while
continuous curves (either solid or dashed) represent the relaxation moduli of naturally
exposed specimens. It is easily seen that, in the sense of material stiffening, four weeks'
natural exposure is equivalent to 1000 hours artificial weathering for Crafco 903 SL; four
weeks' natural exposure is equivalent to 2200 hours artificial weathering for Dow Corning
888, and four weeks natural exposure is equivalent to 1000 hours artificial weathering for
Dow Coming 890 SL; Material dependence of the correlation between the natural and
artificial weathering is obvious.
It is usually expected that artificial weathering facilities accelerate the weathering
process because these facilities provide more UV radiation than sunlight, and UV is usually
taken as the primary cause of polymer degradation. The tests conducted in this project
indicate that this point of view needs to be rectified. Although the spectrum of the UV
59

0.1~-------------------------------------------.,_ • .-.
~~~~~~ I N' 0.09 < i 0.08
• 0.07 = i 0.06 Ill
t 0.05
~ = 0.04 0
·-; 0.03
1 IZ4 0.02
6 0.01
I. .. ~.... ' ,.,._. )•
:· ~tfc'C "" ~ .,~. ·: • J • • • ... . -_... ~~ . . ........ ,. ............ . • • ~.,. • • I •
••• • rlfl ... _ • .. ..-..... .. •• • • • . r ... . ·· .· . . . :
•
• I
•
• • o+-~~~·~~---+--,_~-~--,_--r-~---r--+---~~-~~--~
V)
~ 0
V)
~ --.. $ --.. - - --Exposure Day
Figure 23. Solar Radiation Observed at the Exposure Site Weekly.
0.09 ... • 0.08
~ •• • t'il 0.07 • • • •• "= -N • < 0.06 • • • .@ • • •• • • ~ 0.05 • • = • • • 0 0.04 • • i •• • ••• • 3 0.03 • • •• • • 5; 0.02 •
0.01 Natural Exposure Commenced on 7/20/95
0
0 5 10 15 20 25 30 35 40 45
Exposure Time (Week)
Figure 24. A vemge Daily Solar Radiation per Week at the Exposure Site.
60

0.08
• 0.07 •
~ • • C':l 0.06 ~ • < • a 0.05 ;:;, 6 • • = 0.04
= • • ... .... C':l 0.03 :; • ,g
0.02 5
O.Ql Natural Exposure Corrunenced on 7/20/95
0
0 2 3 4 5 6 7 8 9 10 11
Exposure Time (Month)
Figure 25. Average Daily Solar Radiation per Month at the Exposure Site.
- 2.5 .... C':l
"CC f":i <
2 •• a
~ •• •• = •• .s 1.5 ••• .... ••• C':l .... ••• "CC ,g ••••• ••• 5 ••• •• "CC •• .;
0.5 •• = •• a •• = <:.I • Natural Exposure Commenced on 7/20/95 < •• 0
0 5 10 15 20 25 30 35 40 45
Exposure Time (Week)
Figure 26. Accumulated Solar Radiation at the Exposure Site.
61

Modulus at Various Times for 30% Unit Extension (Crafco 903)
175 .,.------------------, -~ 170 -165 ~ 'S160 "'«='
0
--·--··········-~----·······--···-·-o-·-·-.. ······----------···--~------·----- ... .- ..... -------··-········--·--·-·
"1 0
i 155 l'l'!-""""""';;;;;.;;;::·
s 150 ·-= = 145 to: ~140+--·-··----·-···-······-··--·-·--·----·-··"-- .,~-·~···-·-· .... ······~~
135+-~~-+--r---r-~-+~~+---~
0 0.5 1 1.5 2 2.5 3 Log Time (sec)
Cl
1000 his
1500 his 0
2000 hrs
4 Weeks
12 Weeks
Figure 27. Relaxation Moduli ofCrafco 903 SL After Natural and Artificial Weathering.
Modulus at Various Times for 30% Unit Extension (Dow 888)
700 -,----- ---------------~ 650
';;'600 = = 550 "'«=' i 500 +--·-·-·-····--····----------·--=-·····""""'""
s 450 -;: a400+--·------·--···-·------·----·---····--·- ............... ~ ........... ·---·~------·~~
~ 350
300+-~~-+-4--+--~~~~--+-~~
0 0.5 1 1.5 2 2.5 3 Log Time (sec)
Cl
1000 his v
2000 his 0
2500 hrs
4Weeks
12 Weeks
! 24 Weeks I
Figure 28. Relaxation Moduli of Dow Corning 888 After Natural and Artificial Weathering.
62

120 -«<
~ 100 -fl.)
= -= 80 "CC e ~ = 60 e
':;:: «< ;.<!
40 = ~
20
0
Modulus at Various Times for 30% Unit Extension (Dow 890)
0.5 1 1.5 2 2.5 Log Time (sec)
0
500 hrs
lOOOhrs
1500 hrs
2000 hrs
4 Weeks
12 Weeks 3
Figure 29. Relaxation Moduli of Dow Coming 890 SL After Natural and Artificial Weathering.
radiation is similar to that of the solar UV radiation, sunlight provides abundant visible and
infrared rays which are scarce in the Weather-Ometer chamber. These rays apparently have
significant effects on sealant material aging. To accurately simulate natural weathering,
mechanisms of sealant material degradation should be studied. The major factors responsible
for the degradation of a specific material must be counted in artificial weathering.
Apparently, artificial weathering represents the natural aging effects at different levels
for different materials. In order to account for the effect of aging in the service life
prediction process discussed in the next chapter, this effect will need to be incorporated to
improve the prediction method.
63


CHAPTER 6 PROCEDURE FOR ESTIMATION OF SERVICE LIFE OF A JOINT SEALANT
INTRODUCTION
The procedure presented in this chapter is intended to assist in estimating the service life of a
joint sealant material in concrete pavement. The proposed procedure is based on the laboratory
findings and field performance data available for various joint sealants. This service life
estimate can be used in performing cost-to-benefit analysis. There are situations where the
sealant is needed only for a short duration, and then there are instances where maximum
possible life is sought. Cost-to-benefit analysis is desirable in order to optimize the selection
and use of joint sealant. The proposed procedure can be updated and modified by local
agencies to suit their needs. A flow chart is presented in Figure 30 to illustrate the steps for
using this procedure. The parameters for the service life of the, Nb, N1ab, and Ndesign are all
expressed in terms of the number of cycles of load. To estimate the expected service life of a
joint sealant material for the purpose of design Ndesign• the following operations need to be
executed in order:
• Step 1: obtain base life Nb from the performance model under the standard
conditions,
• Step 2: obtain the modified base life Nlab , to account for the material and
construction technique to be used, and
• Step 3: calibrate the modified life to local prevailing field conditions to determine
Ndesign •
To fulfill steps 1 and 2, a limited number of laboratory materials tests, including bond
tests and relaxation tests, are necessary. Procedures for these tests of different types of sealant
materials are provided in Appendices A and B. The sealant life determination procedure does
not require fatigue tests since these tests are the most time consuming. Based on results of
project 1371 and this project, effects of different service and construction conditions on the
fatigue life of the sealant have been summarized in terms of adjustment factors. These factors
can be easily determined by looking up the tables and graphs provided in this chapter.
65

Performance Model
sealant/ concrete -lr
bond strength
Base Life Nb
aggregate type
1concrete surface trea adjustment f--1--411111--
I factor I relaxation modulus
i
tment
I lOll I I maximum unit extens ·
.,.
Modified Base Life N Iab
- multiplying - field performance -- factor ,,
Expected Life N design
Figure 30. Flow Chart of the Service Life Estimation Procedure for Concrete Pavement Joint Sealants.
66

ESTIMATION PROCEDURE
Step 1: Determination of the Base Life from the Performance Model
As the first step, the user needs to determine the base life of the sealant, Nb, from the
performance model. The performance model was proposed in the fmal report of project 1371
[1] based on a series of laboratory tests, including relaxation tests, bond tests, and fatigue tests.
Procedures for these tests are covered in Appendix B. The model predicts the life of the sealant
under the standard conditions:
where
=
E ::::::
O'b =
Bs =
eL =
fl,f2,f3
Number of cycles to failure observed in the laboratory under
standard conditions,
Long term relaxation modulus at 25 °C and 20% unit extension,
Bond strength,
Seasonal opening,
Maximum joint opening due to load, and
are all constants.
The standard conditions mean that (1) the ambient temperature is 25° C, (2) the maximum
(13)
extension level is 20%, (3) limestone is used as the coarse aggregate in concrete mix, and ( 4)
concrete surface is sand-blasted and then cleaned before the sealant is applied. The constants,
f1, f2, and f3, are experimentally determined. Their values for Perool joint sealant, Dow Corning
888, and Crafco 903 SL have been obtained [1] and are listed in Table 13. With this
performance model, the life of a sealant material can be predicted without doing very time
consuming fatigue tests.
Based on these test data, the base life, Nb , versus the bond strength, crb , curves at the
standard conditions for the three types of sealant materials are shown in Figure 31. The user of
67

this procedure can estimate the base life of a sealant material of one of the three types. (Refer to
Appendix A for other types of sealant materials.)
Table 13. Coefficients in Performance Model.
Sealant Material Type fl f2 f3
Percol joint sealant 2 4641 -0.985 -0.739
Dow Corning 888 1 10664 -0.377 -1.053
Crafco 903 SL 3 1715 -1.201 -1.520
1200000
ci: 1000000 -t------ _,_
c. < .,
800000 « +--,--------0 ..J -0
600000 0 ~ ~ 400000 ;,j Q,) en «
200000 CQ
o~~~~~+-~~4-~~~~~~~4-~ 30 50 70 90 110 130 ISO 170 190 210 230 250
Bond Strength (kPa)
Figure 31. Base Life for Different Types of Sealants.
Step 2: Determination of the Modified Base Life
The base life is obtained under specific laboratory conditions which are referred to as the
standard conditions. When the conditions are different, adjustment should be made to modify
the base life for the standard conditions to the modified base life to take into account various
68
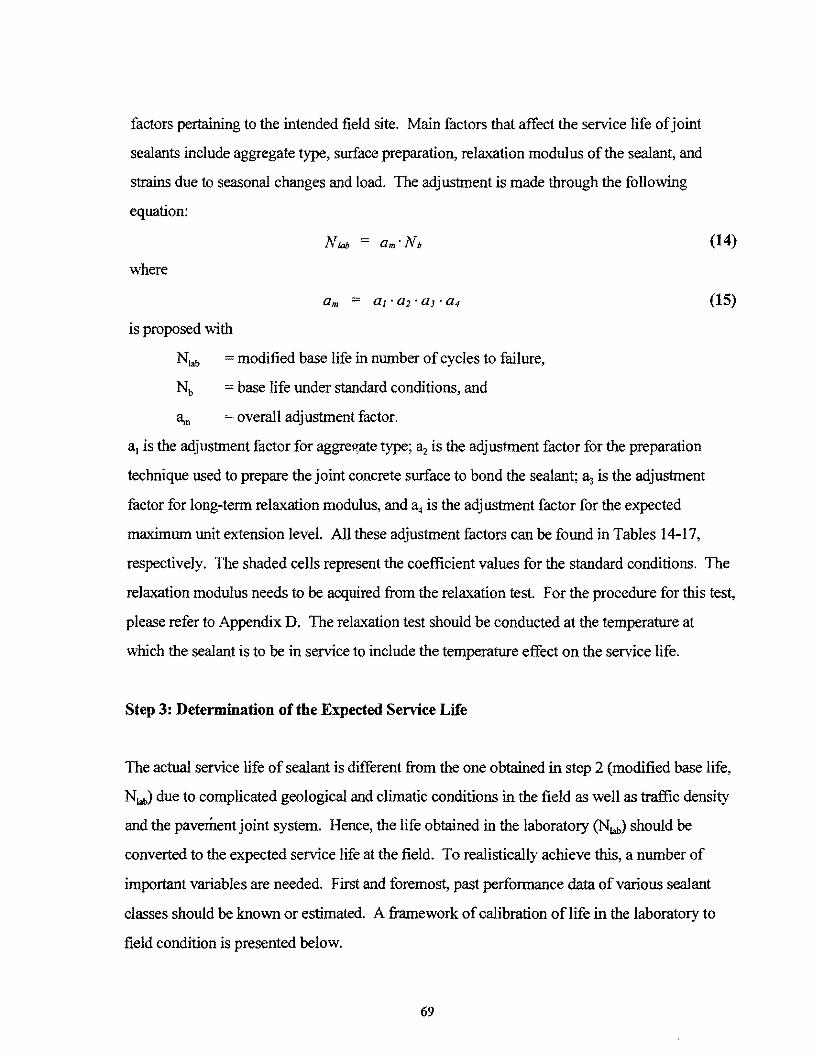
factors pertaining to the intended field site. Main factors that affect the service life of joint
sealants include aggregate type, surface preparation, relaxation modulus of the sealant, and
strains due to seasonal changes and load. The adjustment is made through the following
equation:
where
is proposed with
N1ab modified base life in number of cycles to failure,
Nb = base life under standard conditions, and
~ =overall adjustment factor.
(14)
(15)
a1 is the adjustment factor for aggre~ate type; ~ is the adjustment factor for the preparation
technique used to prepare the joint concrete surface to bond the sealant; 3.:3 is the adjustment
factor for long-term relaxation modulus, and a4 is the adjustment factor for the expected
maximum unit extension level. All these adjustment factors can be found in Tables 14-17,
respectively. The shaded cells represent the coefficient values for the standard conditions. The
relaxation modulus needs to be acquired from the relaxation test. For the procedure for this test,
please refer to Appendix D. The relaxation test should be conducted at the temperature at
which the sealant is to be in service to include the temperature effect on the service life.
Step 3: Determination of the Expected Service Life
The actual service life of sealant is different from the one obtained in step 2 (modified base life,
N1ab) due to complicated geological and climatic conditions in the field as well as traffic density
and the pavement joint system. Hence, the life obtained in the laboratory (Nial>) should be
converted to the expected service life at the field. To realistically achieve this, a number of
important variables are needed. First and foremost, past performance data of various sealant
classes should be known or estimated. A framework of calibration of life in the laboratory to
field condition is presented below.
69

Table 14. Adjustment Factor for Aggregate Type.
Aggregate Type t Adjustment Factor, a1
Type 1 Type2 Type3
Limestone
Rivergravel 1.15 1.16 1.19
t Type of the coarse aggregate used in concrete.
Table 15. Adjustment Factor for Preparation Technique.
Surface Preparation: Adjustment Factor, a2
Type 1 Type2 Type3
Sand Blast
Water Blast+ Sand Blast 1.00 0.973 0.917
Sand Blast+ Primer 1.00 1.00 1.26
~ The method used to finish the concrete joint surface.
70

Table 16. Adjustment Factor for Relaxation Modulus.
Relaxation Modulust Adjustment Factor, a3
(see Figures 3-5) Class 1 Class 2 Class 3
Above the Standard Curve: 0.90 0.90 0.90
Equal/Crosses
Below the Standard Curve 1.10 1.10 1.10
t Relaxation modulus test in accordance with the test specification proposed.
! The standard curves for Types 1, 2, and 3 are shown in Figures 32-34, respectively.
Table 17. Adjustment Factor for Unit Extension Level.
Unit Extension Levell Adjustment Factor, a4
10%
20%
30%
40%
Class 1 Class 2 Class 3
1.91 1.33 1.75
0.75 0.90 0.63
0.51 0.75 0.47
The expected unit extension of the sealant in service. The unit extension is
[(W-W0)/W0]x100%, where W0 is the original joint width, and W is the expected
maximwn width of the joint.
71

650
_600 ~
~ 550 -l1l
.: 500 = "C
~ 450
= .:: 400 -~ = 350 -~ =: 300
250
-1
-~
\: l !\ i
~ ~
i .
'
0 1 2 Log Time (sec)
Figure 32. Relaxation Modulus of Type 1 Joint Sealants.
650
_600 ~
~ 550 -l1l
.e 500 = "C
~ 450
= .s 400 -= = 350 -~ =: 300
250
-1
-~
0
!
~ T
\ i
\ ~
" ~
1 2 Log Time (sec)
Figure 33. Relaxation Modulus of Type 2 Joint Sealants.
72
i i
~ -·----···---·-·~·-
~ ... ..,.-·~·-·-·-
[
3 4
T
~ ~ ··---·-
3 4

170
-~ ~ 165 -17.!
= -= "CC
i 160
= Q ~ ~
= 155 -~ 150
-0.5 0 0.5 1 1.5 2 2.5 Log Time (sec)
Figure 34. Relaxation Modulus of Type 3 Joint Sealants.
Field Calibration of Modified Base Life
Collection of Field Data: To estimate the service life of a joint sealant, it is important to know
different variables such as geographical location of site, traffic density, etc. Previous field data
of joint failure versus traffic are also needed. This data should be for the same type of sealant
material as the one that is being evaluated. A Weibull distribution curve can then be
constructed to fit these observed data points in order to characterize the performance of the
sealant at a particular field site. This will result in detennination of the two Weibull distribution
parameters called shape factor (y) and size factor (A.). The relationship between load cycles and
damage level, as measured in terms of full depth debonding failure, is given as:
where
y, A =
number of load cycles,
shape and scale factors, and
73
(16)

= percentage of the sealant in the joint length where full depth
debonding has occurred.
The relationship between Nr and db can be determined for each pavement and sealant
type as a unique property of the individual pavement section. Before more performance data
are available, y = 0.522 and lnA=19.39 for silicone based sealants andy= 0.83 and lnA=l7.87
for asphalt-based sealants are suggested for dry, non-freeze areas in Texas. These values are
obtained based on field data from the Phoenix, Arizona, test site in the SHRP H-106 study. The
climatic conditions of the site are similar to those of many areas in Texas. Acquirement of these
data are discussed in a following section "Illustration of Estimation Procedure." For a chosen
maximum value of db, referred to as db max• corresponding life Nrc can be determined easily as:
where,
number of cycles to failure corresponding to ~max·
Multiplying Factor: The multiplying factor is simply the ratio of the number of load
repetitions to the failure of the test specimen in the laboratory to the life observed in the field
for the same unit extension level. This level is represented as sr which is a characteristic of the
pavement section.
where,
MFC
Nlab(sr) =
Nfc (sr) =
db max =
MFc = Nlah( Bj}
NJ/&J)
multiplying factor,
number of load cycles to failure in lab at Sr level,
number of load cycles to failure in field at sr level, and
maximum level of damage allowed.
74
(17)
(18)

Expected Life of a Joint Sealant
For a given design unit extension level, Ed, the life can be determined using the following
equation:
where,
= expected life at the extension level of Ed in laboratory based on local
conditions, and
expected design life at the field conditions.
(19)
This number of cycles can be easily converted to life in years by estimating the average
daily traffic density.
EFFECTS OF SEALANT GEOMETRY
Concrete pavement joint sealants have displayed a high incidence of adhesive failure. Although
many efforts have been made to improve the adhesion, adhesion failure is still the primary
cause of sealant failure. Laboratory bond-strength and fatigue tests conducted in project 1371
simulated this failure mode. In other words, the sealant life determination procedure given in
the previous section predicts the service life of the sealant that finally fails because of
de bonding from the concrete wall of the joint In the bond-strength tests, (the aspect ratio, the
ratio of the depth to the width of the sealant material) which was 4, much larger than the aspect
ratio used in pavement. Therefore, the service life determination procedure gives a
conservative estimate because a higher aspect ratio causes higher adhesive stresses.
The finite element analysis conducted at the University of Cincinnati [ 19] shows that
because of the effects of variations in sealant geometry upon the magnitude and distribution of
adhesive stresses, rectangular sealants with low aspect ratios are preferable to those with high
aspect ratios. The same work also analyzed trapezoidal sealants and concluded that trapezoidal
geometry was apparently neither advantageous nor disadvantageous. Since the small
75

deformation theory was used to analyze finite deformation in this work, the computation results
may involve large errors; however, it indicated a trend. The viscoelastic behavior model of the
sealant material constructed in Chapter 4 is based on the finite deformation theory and can
provide considerably more accurate solutions of stress distribution in the joint sealant in
service. Because of the limited time and fimding, numerical analysis was not conducted in
project 1371 or this project.
Instead of numerical analysis, the effects of the sealant geometry were investigated in
the field test section (Chapter 2), where four aspect ratios were applied, i e., 1, 3/4, 1/2, and 114
(Figure 2). The round backer rod formed concave surfaces at the bottom of the installed
sealants. The concave surface helped reduce stress concentration near the bonded region. The
top surface of the sealant was leveled flat for installation convenience. These sealants of
different geometries should be surveyed in the future relative to their performance. Although it
would be difficult to make trapezoidal joints, geometry was not advantageous, as indicated by
the finite element analysis [19]. Accordingly, the field test section did not employ this
geometry for joints.
ILLUSTRATION OF ESTIMATION PROCEDURE
This section illustrates the procedure for estimation of the expected life of the joint sealant in
the concrete pavements. Field data from the Phoenix,. Arizona test site in the SHRP H-106
study [20] were selected because the climatic conditions of this site (dry, non-freeze Region III)
are similar to those in many areas ofT exas. Many different types of sealant materials were
installed in the test site. Surveys of the performance were conducted 3, 5, 9, 14, 18, 31, and 43
months after sealant installation was made. The average daily traffic (ADn at this site was
estimated as 18,000.
Step 1. For illustration purposes, it is assumed that the bond strength obtained in the
laboratory for Type 2 sealant is 100 kPa. From Figure 31, we first determine the base life Nb =
120,000 cycles under the standard conditions.
Step 2. Consider that the concrete pavement is made up of river gravel, and the surface
is sandblasted prior to the sealant application. Upon performing a relaxation test, it was found
76

that the relaxation curve of the material was below the standard curve shown in Figure 32.
With the assistance ofTables 14-17, the overall adjustment factor is found to be
Thus,
and
~= (1.16)x (l.O)x (0.9)x (1.33) = 1.388
~ = (1.16)x (1.0)x (0.9)x (1.0) = 1.044
Nlab (&I)= 1.388 X 120,000 = 166,700
Nla6 (&d) = 1.044 X 120,000 = 125,300
for sf= 10%, and
forsd=20%.
for sf= 10%, and
for sd=20%.
Step 3. Choosing the maximum allowable damage level (dbmaJ of 10%, we obtain Nr..,,
= 21,000,000 cycles for the silicone sealant. Note that the sr= 10% but design unit extension Ed
is 20%.
Plots of full-depth failure v-.:rsus traffic was obtaineJ for silicone sealants a:~d asphalt
sealants and the Weibull distribution curves are drawn for them, shown in Figures 35 and 36,
respectively. Constants y and A for silicone-based sealants are y = 0.522 and ln A= 19.39,
respectively, and for asphalt-based sealants, y = 0.83 and In A =17.87, respectively. (Note that
we only demonstrate the calculation example for the silicone sealant.)
The multiplying factor according to Equation 18, is then found to be:
Therefore, for a design unit extension level of20%, the expected life is given as:
125,300 Ndesign(&d) = 0.00
79 = 15,800,000
Finally, this expected life can be easily converted into life in years if the average daily
traffic density is known. With assuming the average daily traffic density= 18,000 in this
particular site, the life of the above sealant is then 2.43 years, or 2 years and 5 months.
Values of parameters y and A vary with types of sealants, climatic conditions, and traffic
levels. It is proposed that more field data should be accumulated in different areas in Texas for
accurate prediction of service life of sealants.
77
- 10 ~ 0 - 8 ~ ~
= - 6 ·-= '-.c 4 -c.. ~
Q 2 --= '- 0
14
y = 0.522 In A = 19.39
14.5 15 15.5 16
Traffic (Ln N r)
16.5 17 17.5
• Field Data
-Predicted
Figure 35. Adhesion Loss versus Number of Load Repetition for Silicone-Based Sealants at Phoenix, Arizona Test Site.
25 -~ 0 - 20 ~ ~
= - 15 ·-= '-.c 10 -c.. ~
Q 5 --= '- 0
y = 0.83 In A = 17.87
14 14.5 15 15.5 16 16.5
Traffic (Ln Nr)
17 17.5
• Field
-Predicted
Figure 36. Adhesion Loss versus Number of Load Repetition for Asphalt-Based Sealants at Phoenix, Arizona Test Site.
78

CHAPTER 7 CONCLUSIONS AND FUTURE RESEARCH
This report swnmarizes the findings obtained under project 0-187 task 15, which was a
continuation of project 1371 "Evaluation of Joint Sealants." Laboratory tests, including
relaxation tests, bond-strength tests, and fatigue tests of sealant materials used in concrete
pavement joints, were completed. A field test section was set up, and initial surveys of sealant
performance in concrete pavement joints were conducted. Based on test results, sealant
material behavior and performance models were proposed. By combining these models with
the effects of field conditions, a procedure for estimating the service life of a joint sealant was
developed. Proposed also were specification and test protocols for the .concrete pavement joint
sealants, based upon the use of the service life estimation procedure. These procedures can be
applied in concre~(:: pavement design and .naintenance to improve joint sealant material a:A
reduce maintenance cost.
Bond-strength tests and fatigue tests were conducted under project 1371. These tests
have been reported in the final report of project 1371 "Evaluation of Joint Sealants of Concrete
Pavements." However, more relaxation tests were conducted under project 0-187-15,
including tests at different temperatures, tests of specimens after naturally and artificially
weathering, respectively, and tests of performed sealants. A material behavior model for
relaxation modulus was constructed and verified which reflects the effects of temperature,
deformation, and age on the modulus by converting these factors to a factor of time. Stresses
in the sealant are determined by the relaxation modulus under any given movement of the
pavement. In addition, degradation of the sealant material by material aging can be measured
by the increase in the relaxation modulus. Therefore, relaxation moduli of a fresh specimen
and a weathered specimen are suggested to be included in a modified sealant specification.
The effects of aging were also demonstrated in the behavior of preformed
compression joint seals. Compressive reaction of the seal maintains it in place. With time
and aging, the relaxation lessens the compressive reaction. A preformed compression joint
seal needs sufficient stiffness for adequate performance. The effect of aging was apparent in
the tested seals as it counteracted the effect of the sealant stiffness on performance.
Consequently, the amount of increase in stiffness (and the concomitant reduction in
79

compressive force) was large enough to warrant its inclusion in the design process, thus
mandating the use of a calibration procedure in the life predi~tion analysis process.
Relaxation tests were used to correlate natural and artificial weathering for individual
sealant materials. Correlations for three materials were obtained. The researchers found the
correlation to be material-dependent, because different mechanisms prevailed in degradation
of different sealant materials.
In this project, a procedure for estimation of the service life of the joint sealant was
proposed, which expressed the fatigue life in terms of a number of variables including bond
strength, relaxation modulus, and deformation due to seasonal changes and traffic loads.
Some material tests are necessary in the testing protocols, but the most time-consuming
fatigue tests were avoided. After proper calibration, this procedure can be used to predict the
life of a sealant undf"r specific field conditions.
A field test site was established near Liberty, Texas, and surveyed. The site should be
monitored regularly to record the performance data. This continuous monitoring will help
researchers better understand the field behavior of the various joint sealants placed at the test
site. This may then be used to better correlate the laboratory data to the field performance
and eventually verify and improve the service-life estimation procedure.
A joint sealant survey form was also circulated through the offices ofTxDOT districts
to procure information pertaining to the use and performance of sealants they employed in
the past. It was found that most districts tended to use silicone-based sealants based on past
experience.
A specification and a test protocol for joint sealants in concrete pavements were
developed. These were based on the present specification used by TxDOT and modified to
include bond-strength and relaxation tests. It is hoped that by introducing these tests, the
selection of joint sealants can be made more discriminatory and based on the engineering
properties. These guidelines are necessary for use of the service life estimation procedure.
For future research, additional surveys of the Liberty, Texas, field sites need to be
conducted for a trial demonstration of the TTl method for predicting the service life of a joint
sealant, which was developed in this project. A database of sealant types, locations, and
traffic levels needs to be developed to provide a basis for future performance model
80

calibration. Although several tests of preformed compression joint seals were conducted in
this project, a performance model needs to be developed to predict their service life.
Relationships between natural and artificial weathering need to be improved based on further
understanding of the mechanism of sealant degradation.
81


REFERENCES
1. GUijar, A., Zollinger D., and Tang, T., Evaluation of Joint Sealants of Concrete
Pavements, Research Report 1371-1F, Texas Transportation Institute, College Station,
Texas, in press.
2. TEX-525-C Test Method, "Tests for Asphalt and Concrete Joint Sealers," Manual of
Testing Procedures, Division of Materials and Tests, Texas Department of
Transportation, Vol. 2, 1993.
3. American Society for Testing and Materials Standards, "Methods ofTesting Preformed
Expansion Joint Fillers for Concrete Construction (Non-extruding and Resilient
Types)," ASTM D542, Vol. 4.02, 4.03, 1982.
4. American Society for T~sting and Materials S+andards, "Specifications for Preformed
Expansion Joint Fillers for Concrete (Bituminous Type)," ASTM D 994 Vol. 4.02,
4.03, 1982.
5. Texas Department of Transportation, Departmental Material Specification D-9-
6310, Texas Department of Transportation, Director of Materials and Tests, March
1993.
6. Damusis, A., Sealants, Reinhold Publishing Corporation, New York, 1967.
7. Panek, J. R., Construction Sealants and Adhesives, Wiley Series of Practical
Construction Guides, 2nd Edition, John Wiley & Sons, New York, 1984.
8. Texas Department of Transportation, Standard Specifications for Construction of
Highways, Streets and Bridges, March 1, 1993.
9. Atlas Electric Devices Co., Ci65A Weather-Ometer Instruction Manual, 1989.
10. American Society for Testing and Materials Standards, "Recommended Practice for
Testing Stress-Relaxation of Plastics," ASTM D 2991, Vol. 08.02, 1978.
11. Williams, M. L., Landel, R. F., and Ferry, J.D., "The Temperature Dependence of
Relaxation Mechanisms in Amorphous Polymers and Other Glass-Forming Liquids,"
Journal of American Chemical Society, 77, 3701-3707, 1955.
12. American Society for Testing and Materials Standards, "Standard Test Method for
Accelerated Weathering Test Conditions and Procedures for Bituminous Materials
83

(Xenon-Arc Method), "ASTM D 4798, Vol. 04.04, 1995.
13. American Society for Testing and Materials Standards, "Practice for Operating Light
Exposure Apparatus (Xenon-Arc Type) With or Without Water for Exposure of
Nonmetallic Materials, "ASTM G 26, Vol. 14.02, 1995.
14. Williams, M. L., "Structural Analysis ofViscoelastic Material," AIAA Journal, Vol.
2, No.5, May 1964.
15. Findley, W. N., and Lai, J. S., Creep and Relaxation of Nonlinear Viscoelastic
Materials, Dover Publications, Inc., New York, 1976.
16. Nielsen, L. E., Polymer Rheology, Marcel Dekker, Inc., New York, 1977.
17. American Society for Testing and Materials Standards, ''Recommended Practice for
Atmospheric Environmental Exposure Testing of Nonmetallic Materials," ASTM G7,
VoL 14.02, 1983.
18. Davis, A., and Sims, D., Weathering of Polymers, Applied Science Publishers,
London, 1983.
19. Wang, C., and Weisgerber, F., "Effects ofSeal Geometry on Adhesive Stresses in
Pavement Joint Seals, " Transportation Research Record No. 1392, National
Research Council, Washington, D.C., 1993.
20. Lynn D. Evans, Personal Communication, ERES Consultants, Inc., 505 West
University Avenue, Champaign, IL 61820.
84

APPENDIX A
PROPOSED SPECIFICATION FOR JOINT SEALANTS IN CONCRETE PAVEMENTS
85


PROPOSED SPECIFICATION FOR JOINT SEALANTS IN CONCRETE PAVEMENTS
1. Scope
1.1 This specification covers joint sealants for concrete pavements.
1.2 The values stated in SI units are to be regarded as the standard.
2. Referred Documents
2.1 TxDOT Test Method Tex-525-C.
2.2 ASTM C 33, C 150, C 192, D 3583, D 2170, D 2171, D 3407, D 2528, D 4798, G 26.
2.3 TxDOT Departmental Materials Specification- D-9-631 0.
3. Significance ~nd Use
3.1 This specification is intended to provide information in assisting the selection of joint
sealant material for concrete pavements.
4. Types of Sealants
4.1 Joint sealants shall conform to one of the sealant types described in this section. The
actual sealant type(s) to be used shall be designated on the plans or governing specifications.
The contractor shall furnish to the state and comply with the manufacturer's
recommendations for placing the sealant(s).
4.2 The sealant material shall be classified into the following categories:
4.2.1 Type 1 -Non-Sag Silicone or Polysulfide Sealant
4.2.2 Type 2- Two-Part Self-Leveling Silicone or Polyurethane
4.2.3 Type 3- One-Part Self-Leveling Silicone
4.2.4 Type 4 - Hot Poured Asphaltic Rubber
4.2.5 Type 5 - Preformed Joint Sealant
4.2.6 Type 6 - Future new product
87

5. Sampling and Testing
5.1 Sampling and testing shall be in accordance with the Texas Department of
Transportation, Materials and Tests Division, Manual of Testing Procedures, and the ASTM
procedures stated herein.
6. Packaging, Labeling, and Storage
6.1 The joint sealant material shall be delivered in suitable factory-sealed containers or
packaging where applicable. The type of material, brand name, name of manufacturer, lot or
batch number, date of packaging, expiration date, quantity contained, and mixing instructions
shall be clearly marked on the label of the container.
7. Measurement and Payment
7.1 Procurement by the State- Measurement and payment for a material is governed by this
specification and shall be in accordance with the conditions prescribed in the purchase order
awarded by the state.
7.2 Contracts - Measurement and payment for all materials governed by this specification
and utilized in the performance of work specified in the contract shall be considered
subsidiary to the governing bid item in the contract.
8. Performance Requirement
8.1 The following requirements shall be used to qualify joint sealants for use in concrete
pavement joints. These shall also be used to ensure that the sealant material chosen has the
appropriate material characteristics.
8.2 Type I- Non-Sag Silicone Sealant or Polysulfide Sealant- The physical, mechanical, and
performance properties of the Type I sealants shall conform to the following requirements:
Property Flow,mm Extrusion Rate, g/minute Tack Free Time, 25 + 1 °C, minutes Tensile Strength
Initial, 7 days cure, 25 + 1 °C, kPa
88
Requirement 5maximum 90 to 250 35 to 75
69 to 345
Test Method ASTMD3407 ASTMC 1183 ASTMD2377 Tex-525-C

After Water Immersion After Heat Aging, kPa After Cycling, -29 °C, 50%, 3 cycles, kPa 24 Hour Extension Test
Bond Strength, kPa Loss in Relaxation Modulus, After 1 hour Increase in Modulus after 500 hrs of exposure
69 to 345 69 to 345 69 to 345 Pass t 100 min. 20%min. 50% max.
Tex-525-C Test #1 Test #2 Test #2, Sec. 3
t After 24 hours, there shall be no evidence of cracking, separation, or other opening that is over 3 mm deep at any point in the sealer or between the sealer and the test blocks.
8.3 Type 2- Two-Part Self-Leveling Silicone or Polyurethane Sealant- The physical,
mechanical, and performance properties of the Type 2 sealants shall conform to the
following requirements:
Property Flow,mm Extrusion Rate, g/minute Tack Free Time, 25 + 1 °C, minutes Tensile Strength
Initial, 7 days cure, 25 + 1 °C, kPa After Water Immersion After Heat Aging, kPa After Cycling, -29 °C, 50%, 3 cycles, kPa 24 Hour Extension Test
Bond Strength, kPa, min. Loss in Relaxation Modulus, After 1 hour, min. Increase in Modulus after 500 hrs of exposure
Requirement 5 maximum 90 to 250 30 to 70
28 to 207 28 to 207 28 to 207 28 to 207 Passt 50 20% 50% max.
Test Method ASTMD 3407 ASTM C 1183 ASTMD2377 Tex-525-C
Tex-525-C Test #1 Test #2 Test #2, Sec. 3
1' After 24 hours, there shall be no evidence of cracking, separation, or other opening that is over 3 mm deep at any point in the sealer or between the sealer and the test blocks.
8.4 Type 3 - One-Part Self- leveling Silicone Sealant- The physical, mechanical, and
performance properties of the Type 3 sealants shall conform to the following requirements:
Property Tack Free Time, 25 + 1 °C, minutes Tensile Strength
Initial, 7 days cure, 25 + 1 °C, kPa After Water immersion
89
Requirement 120 max.
28 to 207 28 to 207
Test Method ASTMD2377 Tex-525-C
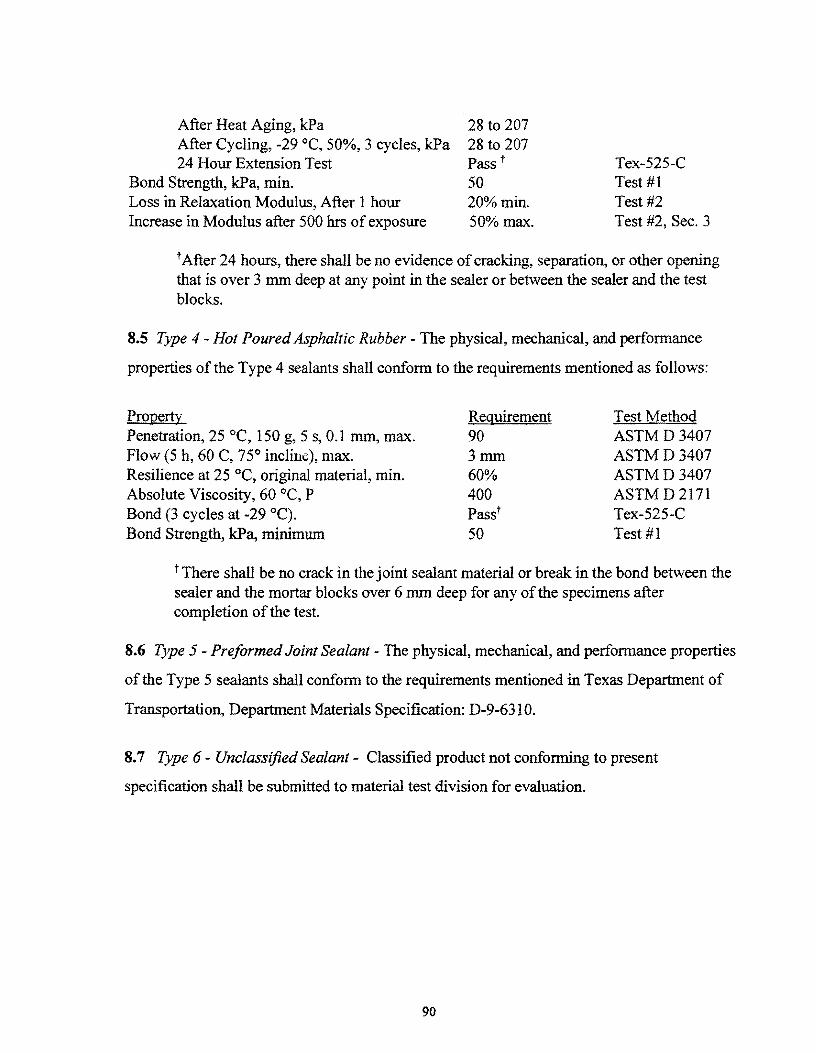
After Heat Aging, kPa After Cycling, -29 °C, 50%, 3 cycles, kPa 24 Hour Extension Test
Bond Strength, kPa, min. Loss in Relaxation Modulus, After 1 hour Increase in Modulus after 500 hrs of exposure
28 to 207 28 to 207 Pass t 50 20%min. 50% max.
Tex-525-C Test #1 Test#2 Test #2, Sec. 3
t After 24 hours, there shall be no evidence of cracking, separation, or other opening that is over 3 mm deep at any point in the sealer or between the sealer and the test blocks.
8.5 Type 4 - Hot Poured Asphaltic Rubber - The physical, mechanical, and performance
properties of the Type 4 sealants shall conform to the requirements mentioned as follows:
Property Penetration, 25 °C, 150 g, 5 s, 0.1 mm, max. Flow (5 h, 60 C, 75° incline), max. Resilience at 25 °C, original material, min. Absolute Viscosity, 60 °C, P Bond (3 cycles at -29 °C). Bond Strength, kPa, minimum
Requirement 90 3mm 60% 400 Passt 50
Test Method ASTMD3407 ASTMD3407 ASTMD3407 ASTM D 2171 Tex-525-C Test #1
t There shall be no crack in the joint sealant material or break in the bond between the sealer and the mortar blocks over 6 mm deep for any of the specimens after completion of the test
8.6 Type 5 - Preformed Joint Sealant- The physical, mechanical, and performance properties
of the Type 5 sealants shall conform to the requirements mentioned in Texas Department of
Transportation, Department Materials Specification: D-9-631 0.
8. 7 Type 6 - Unclassified Sealant - Classified product not conforming to present
specification shall be submitted to material test division for evaluation.
90

APPENDIXB
PROPOSED TEST PROTOCOL FOR JOINT SEALANTS FOR CONCRETE PAVEMENTS
91


PROPOSED TEST PROTOCOL FOR JOINT SEALANTS FOR CONCRETE PAVEMENTS
INTRODUCTION
These methods cover the various test procedures for evaluating concrete pavement joint sealant
materials. The results obtained from these tests may be used for specification purposes.
LIST OF THE TEST PROCEDURES PRESENTED
Test 1. Test Method for Determining Tensile Bond Strength Between Sealant Material
and Concrete
Test 2. Suess Relaxation Test for fypes 1, 2, and 3 Sealant Materials in Concrete
Pavements
Test 3. Test Method for Measurement of Tensile Strength of Types 1, 2, and 3 Sealant
Material
Test 4. Test Method for Measurement of Viscosity of Type 4 Asphalt-based Sealant Material
Test 5. Test Method for Measurement of Penetration, Flow, and Resilience Type 4 Sealant
Material
Test 6. Test Method for Type 5 Preformed Joint Seals for Concrete Pavement Joints
93

TEST 1. TEST METHOD FOR DETERMINING TENSILE BOND STRENGTH BETWEEN SEALANT MATERIAL AND CONCRETE
1. Scope
1.1 This test furnishes a method of measuring, in the laboratory, the tensile bond strength
between concrete blocks and sealant material for sealant Types 1, 2, 3, and 4.
1.2 The values stated in SI units are to be regarded as standard.
2. Referenced Documents
2.1 ASTM Standards:
C 33 Specification for Concrete Aggregates, Vol. 04.02.
C 150 Specification for Portland Cement, Vol. 04.02.
C 192 Method ofMaking and Curing Concrete Test Specimens in the Laboratory, Vol.
04.02.
D 3583 Testing Joint Sealant, Hot-Applied, Elastomeric-Type, for Portland Cement
Concrete Pavements, or Joint Sealant, Hot-Applied, Elastomeric, Jet-Fuel-Resistant-Type,
for Portland Cement Concrete Pavements, VoL 04.03.
3. Significance and Use
3.1 This test method provides one measure of tensile bond strength for sealant materials and
may be used to measure bond strength for specification requirements.
4. Apparatus
4.1 Mold- The mold assembly shall be similar in design to that shown in Figure 37. The mold
shall be made of two concrete blocks and two spacers made of wood or metal. The concrete
blocks shall conform to ASTM C 33, except as specified herein. The aggregate gradation shall
be as shown in Table 18. The coarse aggregate shall consist of crushed limestone having a
water absorption of not more than 1.5%. Portland cement shall conform to Type II of
specification ASTM C 150. The concrete shall have a water-to-cement ratio of0.49, a cement
94

factor of335 ± 30 Kg/m3 (6.0 ± 0.5 bags of cement/yd3), and a slump of63 ± 12.7 mm. The
concrete shall be prepared in accordance with the procedure specified in ASTM C 192.
4.2 Dimensions- The concrete blocks shall measure 76 x 51 x 12.5 mm and will be prepared
with a limestone coarse aggregate. The spacers can be made out of metal, wood, or any suitable
rigid plastic. The spacers shall measure 12.5 x 12.5 x 51 mm.
4.3 Rubber bands, metal plates, and silicone lubricant- These materials are needed to prepare
and secure the mold assembly.
4.4 Extension Testing Machine - A machine capable of griping the concrete blocks and
separating them at a uniform speed of 12.7 mm per minute through a minimum displacement of
250 mm without undue vibration. This machine shall have one stationary grip. \\There
available, a data acquisition software program shall be used to record the displacement.
5. Procedure
5.1 Test Specimen- Assemble sufficient molds to prepare three specimens. Sandblast the
intended contact surfaces (76 x 51 mm) of the concrete blocks until all surfaces are clean of any
foreign material. Lightly coat the spacers with the silicone lubricant. Form the mold assembly
by placing the spacer between the two concrete blocks and securing them with rubber bands,
clamps, or other suitable means. Place and secure a treated metal plate at one end of the mold
to form a cavity; open on one face only. Make sure that the inside surface of the metal plate is
also lubricated with silicone to assist in latter removal without damage to the test specimen.
This should result in an assembly with a cavity size of 51 x 51 x 12.5 mm. Pour the sealant
material in the upright mold to fill it completely, and immediately level off the top surface with
a spatula
5.2 Curing - Place the three molds with sealant specimen for curing under standard conditions
of 25 oc and 50% relative humidity for the curing period specified by the manufacturer.
5.3 Testing- Remove the spacers and measure the actual dimensions of the test specimen to the
nearest 0.1 mm; record using Table 19 (Figure 38). Place the specimen in the extension testing
machine specified in 4.4, and extend the test specimen at a rate of 12.7 ± 2.5 mm/min.
Continue the extension until the specimen fails either in adhesion or cohesion.
95

6. Record
6.1 Record the maximum load for all three specimens in Table 19.
6.2 Record the failure mode (cohesion or adhesion).
6.3 Inspect the failure surfaces, and record the existence of any excessively large air bubbles or
honey combing.
7. Calculation
7.1 Calculate the bond strength by dividing the maximum load by area of contact for each
specimen as follows:
where
crb =bond strength, kPa,
O"b = lOOOx Pmax L•W
P max =maximum tensile load to failure, N (1 lb = 4.448 N), and
L, W =measured length and width of the test specimen, mm.
7.2 Average the three bond strengths.
8. Report
8.1 Report the average bond strength of the joint sealant tested.
8.2 Report the failure mode.
8.3 Report any large air pockets observed on the failure surfaces.
96
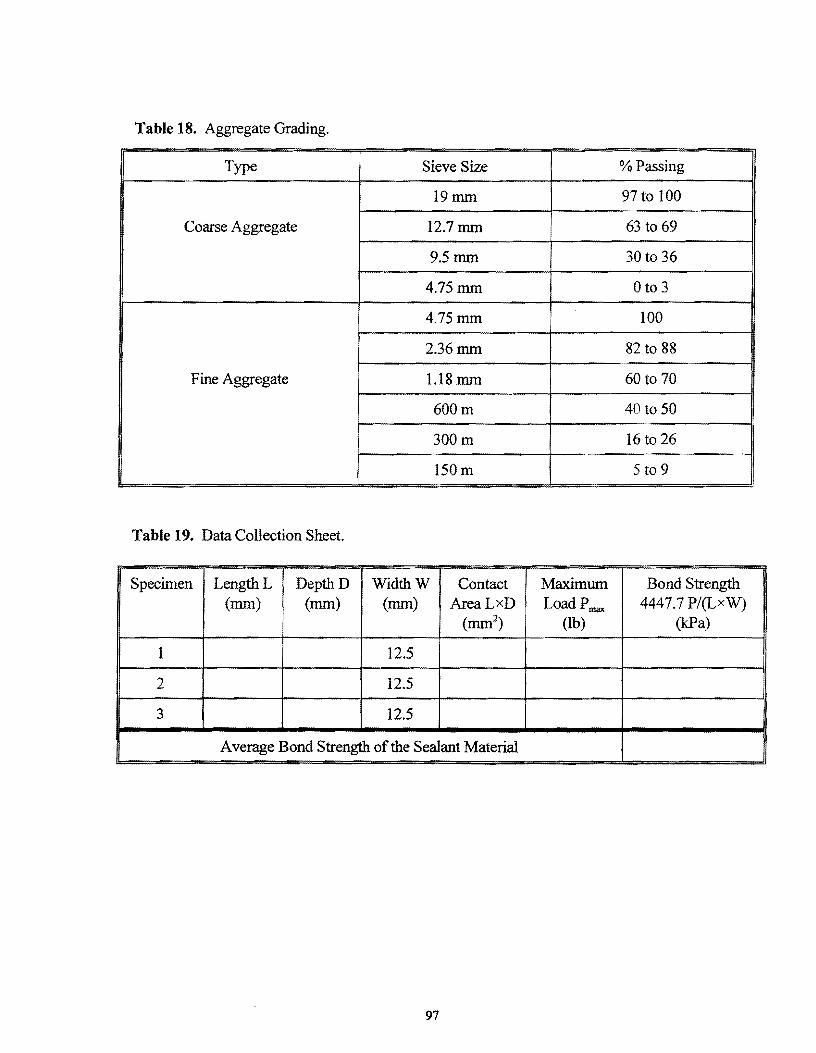
Table 18. Aggregate Grading.
Type Sieve Size %Passing
19mm 97 to 100
Coarse Aggregate 12.7mm 63 to 69
9.5mm 30 to 36
4.75mm 0 to 3
4.75mm 100
2.36mm 82 to 88
Fine Aggregate 1.18mm 60 to 70
600m 40 to 50
300m 16 to 26 ·-
150m 5 to 9
Table 19. Data Collection Sheet.
Specimen LengthL Depth D Width W Contact Maximum Bond Strength (mm) (mm) (mm) AreaLxD Load Pmax 4447.7 P/(LxW)
(mm2) (lb) (k:Pa)
1 12.5
2 12.5
3 12.5
Average Bond Strength of the Sealant Material
97

METAL BLOCKS
Figure 37. Mold Assembly for Bond Test Specimen.
+---- 76mm,.__ ____ -l 5lmm--
~ --------------~,
SEALANT 12.5 x 51 x 5lmm
~--'-~~
Figure 38. A Typical Specimen for Bond Strength Test.
98

TEST 2. STRESS RELAXATION TEST FOR TYPES 1, 2, AND 3 SEALANT MATE~SFORCONCRETEPAVEMENTS
1. Scope
1.1 This test method provides a means of measuring the amount of stress relaxation or the time
dependence of stress for a Type 1, 2, and 3 joint sealant material.
1.2 The values stated in SI units are to be regarded as the standard.
2. Summary of the Method
2.1 In this method, the specimen is subjected to an extension that is held constant with time.
The load required to maintain the displacement is measured at time. The load readings are
converted to relaxation stress in the specimen, which is plotted against the logarithm of time in
secom.is.
2.2 The relaxation test is also performed on artificially aged specimens for specification
purposes.
3. Apparatus
3.1 Mold- The mold assembly shall be similar in design to that shown in Figure 39. The mold
shall consist of two steel plates and a channel-shaped spacer.
3.2 Dimensions- The steel plates shall measure 100 x 50 x 6.5 mm. The channel-shaped spacer
shall be made of steel or plastic with the depth of channel equal to 12.7 mm and a length of 100
mm, as shown in Figure 40.
3.3 Rubber Bands, Clamps, Lubricant - Rubber bands, clamps or any other means of securing
the mold shall be used. Silicone lubricant must be applied to all the surfaces that will come in
contact with sealant.
3.4 Epoxy, Plywood Strips- Plywood strips 3 mm thick, 12.7 mm wide, and 25 mm long shall
be used to make rigid ends for the specimen.
3.5 Extension Testing Machine - An extension machine capable of griping the test specimen
and performing a stress relaxation test shall be used. The specimen shall be stretched at a rate
99

METAL PLATES
50mm
Figure 39. Mold Assembly for Relaxation Test Specimen.
PI)Wood Strip
_L > 6.35mrr
I .__._.._--------------~------~
1---- 5lmm
12.
100 mm ----------1
Figure 40. Relaxation Test Specimen with End Plates.
100

of 51 mm per minute to the desired extension and held constant for one hour. The machine
shall also be capable of displaying the load required to maintain the extension at any time t.
4. Specimens
4.1 Specimen Preparation - Assemble molds to prepare four specimens. Two specimens will
be tested immediately upon curing, and two specimen will be artificially aged as described in
section 4.6 before testing. Apply a thin layer of silicone lubricant on all the surfaces of the
mold that may come in contact with the sealant materiaL Form a mold assembly by placing the
spacer between the two steel plates and securing it with rubber bands or clamps (Figure 39).
Carefully pour the sealant in the upright mold, and level the top with a spatula. This should
result in a specimen with a cross-section of 12.7 x 6.5 mm and the length of 100 mm.
4.2 Curing- Place all four molds with the sealant for curing under standard conditions of25 °C
and 50% relative humidity for the curing period specified by the manufacturer.
4.3 Artificial Aging - After the specimen has been cured for a specified time period, remove the
molds from two specimens. Artificially age two of the four specimens, while still in the molds,
according to Section 5 "Artificial Aging."
5. Artificial Aging
5.1. Referenced Documents
5.1.1 ASTM Standards
D 4798-88 Standard Test Method for Accelerated Weathering Test Conditions and
Procedures for Bituminous Materials (Xenon-Arc Method), Vol. 04.04.
G 26 Practice for operating Light-Exposure Apparatus (Xenon-Arc Type) with and
without Water for Exposure ofNonmetallic Materials, Vol. 14.02.
5.2 Exposure Apparatus - The apparatus employed shall use xenon-arc lamps as the source of
radiation. The term "cycle" is defined as the total time for all exposure conditions that are
repeated. The apparatus should be equipped with a suitable frame in the test chamber to
uniformly expose all specimens.
101

5.3 Test Specimens- The test specimen shall be made in accordance with section 4.1. The test
specimen shall be held in the mold while subject to radiation in order to expose the top surface
only to aging. Two specimens of each material shall be aged.
5.4 Exposure Procedure - Proceed in accordance with the Method 2 of standard practice G 26
of ASTM standards with following modifications:
5.4.1 The recommended minimum spectral irradiance level is 0.35 W/m2/nm band at 340 nm.
The precise irradiation level employed shall be stated in the report.
5.4.2 Operate the apparatus continuously according to cycle specified in Table 20 below:
Table 20. Operating Cycle of the Exposure.
Test Conditions Time
Light only ~60 °C ± 3 °C black prutel temperature) 60 minutes
Light with spray 40 minutes
Dark 20 minutes
A complete cycle 120 minutes
Total cycJe time (twelve complete cycles) 24 hours
5.4.3 The duration of exposure under this test method shall be 21 repetitions of a 24-hour cycle
of operation, in accordance with Table 3, resulting in approximately 500 hours of exposure.
6. Relaxation Test Specimen
6.1 Clean the specimen free oflubricant and other mold-release coating that may deter
adhesion of plywood strips to the specimen. /so-octane or other suitable solvent may be used to
clean the specimen.
6.2 The test specimen shall have a gauge length of 51 mm. This can be achieved by applying a
thin layer of epoxy glue and adhering four 25 mm long plywood strips, two on each side of the
specimen, as shown in Figure 41. Let the glue completely cure before testing.
6.3 Measure and record the dimensions of the specimens to the nearest 0.1 mm.
102

7. Relaxation Test Procedure
7.1 Grip the specimen, as shown in Figure 41, and balance (zero) the load and strain. The
specimen is to be held such that there is no 'pinching.' Set the reading on the strain indicator for
the specified unit extension level. Unit extension is the relative elongation with respect to the
original length, that is, (L - L0)/L0, where L is the length of the specimen under extension, and
L0 is the original gauge length of the specimen. Specimens shall be subjected to a unit
extension level of 10% of original gauge length. The two readings shall be averaged and
Figure 41. Test Setup for the Relaxation Test.
103

reported. This shall also be done on the two aged specimens of the material tested. Extend the
specimen at a rate of 51 rnrnlmin. to the required unit extension level, and hold the test
specimen in that position. Immediately record the "initial load" (at time t=O), and continue to
record the load-at-time intervals as shown in the data acquisition sheet (Tables 21-22).
Alternatively, if possible, data acquisition software may be used to record the load with time.
7.2 Each relaxation test shall be conducted for a duration of one hour on each separate
specimen.
8. Report
8.1 Report the results of relaxation tests on the semi-log graph provided, which has standard
relaxation curves.
Table 21. Relaxation Test Data Acquisition Table for Unaged Specimens.
Time Load, P(t), lb Relaxation Modulus Er = 150.5xP(t), k:Pa
t, minutes Sample I Sample 2 Sample 1 Sample2 Average
0
1
5
10
15
20
30
40
50
60
104

Table 22. Test Data Acquisition Table for the Aged Specimens.
Time Load, P(t), lb Relaxation Modulus Er = 150.5xP(t), kPa
t,rninutes Sample 1 Sample 2 Sample 1 Sample 2 Average
0
1
5
10
20
30
40 -50
!
60 I
105

TEST 3. TEST METHOD FOR MEASUREMENT OF TENSILE STRENGTH OF TYPES 1, 2, AND 3 SEALANT MATERIAL
1. Scope
1.1 This test provides a method of measuring tensile strength for type 1, 2, and 3 joint sealants
material.
1.2 The values stated in SI units are to be regarded as standard.
2. Referenced Documents
2.1 This test shall be perfonned in accordance to Texas Department of Transportation,
Materials and Tests Division Test Method Tex-525-C.
106

TEST 4. TEST METHOD FOR MEASUREMENT OF VISCOSITY OF TYPE 4 -ASPHALT-BASED SEALANT MATERIAL
1. Scope
1.1 This test provides a method of measuring viscosity for Type 4, asphalt-based joint sealants.
1.2 The values stated in SI units are to be regarded as standard.
2. Referenced Documents
2.1 ASTM Standards:
ASTM D 2170 (AASHTO T 201) Test Method for Kinematic Viscosity of Asphalt, Vol.
04.03.
ASTM D 2171 (AASHTO T 202) Test Method for Viscosity of Asphalt by Vacuum
Capill<:uyr Viscometer, Vol. 04.03.
107

TEST 5. TEST METHOD FOR MEASUREMENT OF PENETRATION, FLOW, AND RESILIENCE OF TYPE 4- ASPHALT-BASED SEALANT MATERIAL
1. Scope
1.1 This test provides a method of measuring penetration, flow, and resilience for Type 4,
asphalt-based joint sealants.
1.2 The values stated in SI units are to be regarded as standard.
2. Referenced Documents
2.1 ASTM Standards:
ASTM D 3407 Standard Methods of Testing Joint Sealants, Hot-Poured, for Concrete and
Asphalt pavements, Vol. 04.03.
108

TEST 6. TEST METHOD FOR TYPE 5- PREFORMED JOINT SEALS FOR CONCRETE PAVEMENT JOINTS
1. Scope
1.1 This test provides a method of testing preformed joint seals for concrete pavements.
1.2 The values stated in SI units are to be regarded as standard.
2. Referenced Documents
2.1 This test shall be done in accordance to Texas Department of Transportation, Materials and
Tests Division's Test Method Tex-525-C.
2.2 ASTM Standards:
D 2628 Standard Specification for Preformed Polychloroprene Elastomeric Joint Seals for
Concrete Pavements, Vol. 04.02, 04.03.
109


APPENDIXC
JOINT SEALANT SURVEY FORM
111

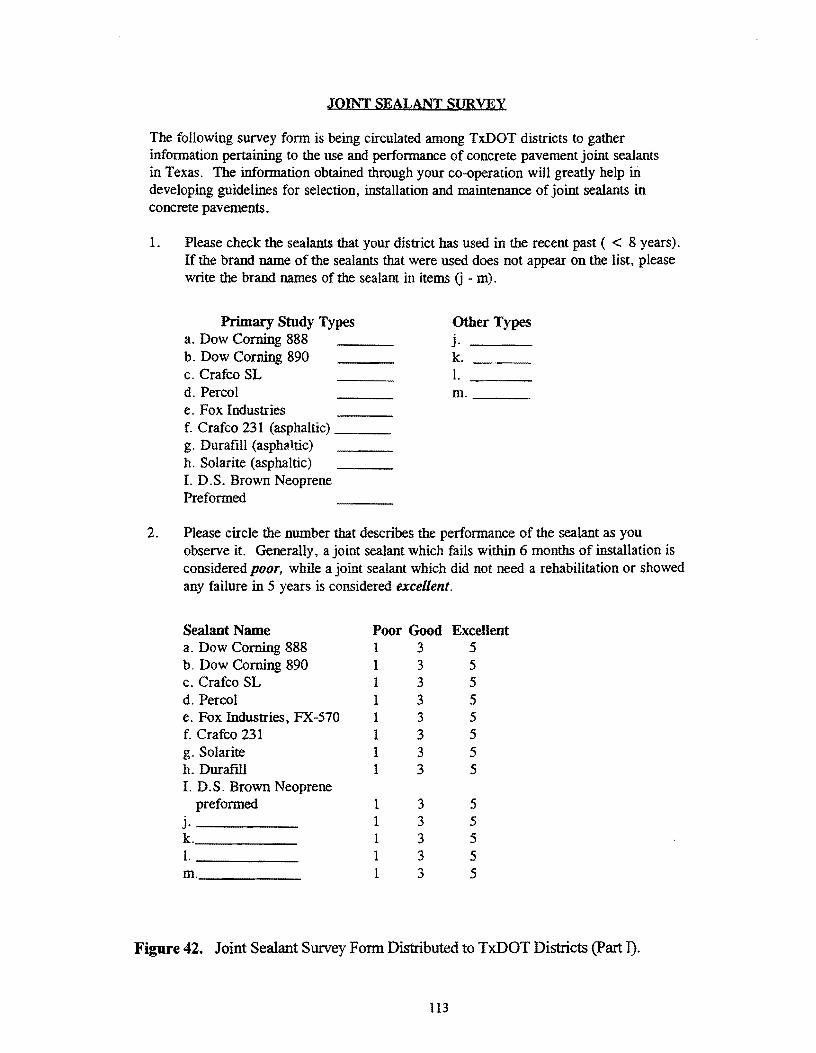
JOINT SEALANT SlJRVEY
The following survey form is being circulated among Tx.DOT districts to gather information pertaining to the use and performance of concrete pavement joint sealants in Texas. The information obtained through your co-operation will greatly help m developing guidelines for selection, installation and maintenance of joint sealants in concrete pavements.
1. Please check the sealants that your district has used in the recent past ( < 8 years). If the brand name of the sealants that were used does not appear on the list, please write the brand names of the sealant in items G - m).
Primary Study Types a. Dow Corning 888 b. Dow Corning 890 c. Crafco SL d. Percol e. Fox Industries f. Crafco 231 (asphaltic) __ _ g. Durafill (asphaltic) h. Solarite (asphaltic) I. D.S. Brown Neoprene Preformed
Other Types j. k. l. m. __ _
2. Please circle the number that describes the performance of the sealant as you observe it. Generally, a joint sealant which fails within 6 months of installation is considered poor, while a joint sealant which did not need a rehabilitation or showed any failure in 5 years is considered excellent.
Sealant Name Poor Good Excellent a. Dow Corning 888 1 3 5 b. Dow Corning 890 1 3 5 c. Crafco SL 1 3 5 d. Percol 1 3 5 e. Fox Industries, FX-570 1 3 5 f. Crafco 231 1 3 5 g. Solarite 1 3 5 h. Durafill 1 3 5 I. D.S. Brown Neoprene
preformed 1 3 5 j. 1 3 5 k. 1 3 5 I. 1 3 5 rn. 1 3 5
Figure 42. Joint Sealant Smvey Form Distributed to TxDOT Districts (Part I).
113

3. Please enter any specific comments you may have about the mode of failure (i.e, debonding, cracking, extrusion etc.) exhibited by the sealants that you observed or are aware of.
Sealant Name Poor Good Excellent a. Dow Corning 888 1 3 5 b. Dow Corning 890 1 3 5 c. Crafco SL 1 3 5 d. Percol 1 3 5 e. Fox Industries, FX-570 1 3 5 f. Crafco 231 1 3 5 g. Solarite 1 3 5 h. Duraflll 1 3 5 L D.S. Brown Neoprene
• preformed 1 3 5 J. 1 3 5 k. 1 3 5 l. 1 3 5 m. 1 3 5
4. Please indicate (by the corresponding letter) for any of the sealant types that you responded to in Item 2 or 3 if any of the follo\.ing information is availav!e.
Approximate date of sealant installation Joint well geometry details Sealant/joint maintenance history Associated traffic data
Sealant Name (letter designator)
5. Are you aware of or planning any construction or rehabilitation projects that will involve the placement of concrete pavement joint sealants by August 1996? If so, where and approximately when is construction work expected to begin?
6. Please provide the name and address of the person who should be contacted if further information is needed. Thank you for your time.
7. Please return the completed forms to:
Dr. Dan Zollinger Suite 503E TTIICE Bldg, Texas Transportation Institute, Texas A&M University System, College Station, TX 77843-3135 (409) 845-9918
Figure 43. Joint Sealant Survey Form Distributed to TxDOT Districts (Part II).
114

APPENDIXD
RELAXATION TEST RESULTS FOR SEALANT MATERIAL CRAFCO 903 SL
115


0
~180 T--·-···----~-~·······r~··-···---····+·-·-·-····----·· ........... , ............................ : ................................ 1
~I70r-·-·----·-·-·-~·····-~--~---~~+·---·---·--··· .. ·---+------····--··--·-·--··~--.............................. J v.l .= ~160T-................. ~~'·---c,-------··'~- ... -~~·--·-·-~--·--···--···----------+-··------------- .... -<:> ~ = 150 +---·--......... ..!::O .... ,j,, .................. ~*8--<:>
':C = 140 +----........................ ~.--...... __________ ..; .. .. = 'il = 130 T .............................. ~ ................................... ; ................................ L .................. .:~-------·-·----------
120+-~--~--+--,---r--+-~--~--+-~
-1 0 1 2 3 4 Log Time (sec)
0
5%
10% 0
30%
50%
'100%
Figure 44. Relaxation Modulus of a Fresh Crafco 903 SL Specimen at -25 °C.
220 -r-·---:-----,---------,------......., I
-~200 -! = 180 ., <:> ~ s 160
':C = = ~ 140
l
0• •-• ~·--••»>• ••••••-•-·-•.t••·-•••"'""""-•-•-•••' • • """'"~" -·-• ~--··•--••• ··-·--·~-- ._ ••••••o ••~•-•-• -•· ••+•''"'·-•-•-·-• -• ""'""" ••-
120+--~-+--r--4--+-~---+-~--~~
-1 0 1 2 3 4 Log Time (sec)
Cl
5%
100/o 0
30%
50%
100%
Figure 45. Relaxation Modulus of a 500 Hours Artificially Weathered Crafco 903 SL Specimen at -25°C.
117

Figure46.
Figure47.
220 ,...-----,.........,-----,..--
- : ;
~200 ···-·-i··-···"'··-··-···-·-·~-·····i.··-·~·-·-·-·-·· .. ··· ·-··-
--~ -; 180 'C c ~ g 160
'.::: = ~ 140 ····-·-············-·-·-·•···········-·-·-·-·······l·····-·-·-·-
120+---~~--+-~-+--~~-4--+--r__j
-1 0 1 2 3 4
Log Time (sec)
5%
10% 0
30%
50% z
i 100%
Relaxation Modulus of a 1 000 Hours Artificially Weathered Crafco 903 SL
Specimen at -25 °C.
260r-----,-----~-----,------------
~240
--220 ~ -6200
~ = 180 c ·.;: a 160 'il ~ 140
Cl i : ' ' -------·-····-··---·-o·······--··-·---·-···--i·-·---·-- ···-·····-·-~·-············--------····"·····---·--·---·······-
120 +---+----!---1--+---+--+---+---+---+-~ -1 0 1 2 3 4
Log Time (sec)
Cl
5%
10% 0
30%
500/o
100%
Relaxation Modulus of a 2000 Hours Artificially Weathered Crafco 903 SL Specimen at -25 °C.
118

Figure48.
Figure 49.
190 ..,..-----,..,.--,-----:-----,--- -....,...-------,
";'180 ~ -~ 170 "S "'CC
~160 = c i 150
= 'il "140
cp ' ' --- -~-r-----~-~-~--~--- -----····--··-·-·----1·--------------
0
------· .. ··-------~ ............. -----·- .
"' 4>
130 ;----t--+--+---t---+---1---+--!----+----i
-1 0 1 2 3 4 Log Time (sec)
0
5%
100/o 0
30%
500/o
100%
Relaxation Modulus of a Fresh Crafco 903 SL Specimen at 0 °C.
1W.,-----~----~------~-----,------.
";'180+--·-·-·--···-·~·-·'····-··la·--·-·-.. -... "·-·--·-· .. ····-···'·---· .. ·-·-·-·--·-.. t·-------·--··--·-·-l
~170+·-···-·--·-"'"·----+·-----~---~~~-------·---··---+·-............. _______ +------·--·-·-l Ql'l
.:e -6 160 +-·-·-·--............ ___ ,, ........ _:;.--···-·-·"''"' c ~ = 150 +-·-------··--· .. ---j,-· .. ··-------·"""" c
·.c:: = 140 +·---............ ~=---i----·-----·-·"·--+~""'liillllih:.:'"""-·+-.... ~
'il r ......................... J ............. =::~~~~::==~~t:-----·----··-1 " 13o T 120 -+---~--+--+---f---+-----1!----+--1----+------l
-1 0 1 2 3 4 Log Time (sec)
0
5% '17
10% 0
30% (;;.
50% X
i 100%
Relaxation Modulus of a 500 Hours Artificially Weathered Crafco 903 SL Specimen at 0 °C.
119

Figure 50.
Figure 51.
200
D - 'V = !!a 180 5% - 'V
f/:.1 = 0 - 10% = -= C;. i 160 0
= X 30% c:> ·.c C;.
CIS
=140 50% -~ X
100%
120
-1 0 1 2 3 4 Log Time (sec)
Relaxation Modulus of a 1000 Hours Artificially Weathered Crafco 903 SL Specimen at 0 °C.
210~-----~-----,------~----~------
(i200
~190 f/:.1
= :g 180
~ = 170 c:> -:: a 160 'iS ~ 150
D
'V
-1
0
v
0 1 2 3 4 Log Time (sec)
D
5%
10% 0
30%
50%
Relaxation Modulus of a 2000 Hours Artificially Weathered Crafco 903 SL Specimen at 0 °C.
120

200 0
- 5%
= 180 ~ v -Ul
10%
= = 160 -= ~ 0
20% :a 1:>.
g 140 ':::1 30%
= = X
~ 120 50% 181
100 1000/o
-1 0 1 2 3 4 5 Log Time (se~)
Figure 52. Relaxation Modulus of a Fresh Crafco 903 SL Specimen at 25 oc.
Figure 53.
200 0
--~ 180
5% v -Ul 100/o
= "5160 -= ~ :a
0
20% t::.
g 140 ':::1 =
300/o ~ X
= ~ 120 50% 181
100 100%
-1 0 1 2 3 4 5 Log Time (sec)
Relaxation Modulus of a 500 Hours Artificially Weathered Crafco 903 SL Specimen at 25 °C.
121

Figure 54.
Figure 55.
0
5% 'C'
10% 0
20% t:;
30% X
50% 181
• 1000/o
-1 0 1 2 3 4 5 Log Time (sec)
Relaxation Modulus of a 1000 Hours Artificially Weathered Crafco 903 SL Specimen at 25 °C.
220 0
- 5%
= 200 ~
'C'
-fl2 10%
= "'S 180 0
"C e 20% :E t:;
! 160 ·:: 30%
a X
'iS 140 = 50% 181
120 100%
-1 0 I 2 3 4 5 Log Time (sec)
Relaxation Modulus of a 2000 Hours Artificially Weathered Crafco 903 SL Specimen at 25 °C.
122

Figure 56.
Figure 57.
160 ...-----:-----------~---~ 0
--·-···-··-··· f·--a·a-a--···t··-·-·-········-·······-···r·-···--··--·--·-····~·-·---·-·-···-····-- 0
5%
10% 0
30%
50%
100%
-1 0 1 2 3 4 Log Time (sec)
Relaxation Modulus of a Fresh Crafco 903 SL Specimen at 40 oc.
170 ~---------~~---~----~~---,
-;-160
~150 con
= :§140 i = 130 c:> ·.:::: a 120 "iS =: 110
---···-·····Q . ...J_ ......... ·-·-·-·-······.L-·-·····-····--·-·..L·-·····-······-··········~·· ··-···-···-······-·· ~ i 0 o
'V j ·--·-··-·--·v-·--····--
--·-···--·-+···-·-···-·---~--~-~-·-·-·-·--·-
100+-~--~--4---~-+--4---~-+--~-4
-1 0 1 2 3 4 Log Time (sec)
0
5%
10% 0
300/o
50%
1100%
Relaxation Modulus of a 500 Hours Artificially Weathered Crafco 903 SL Specimen at 40 °C.
123
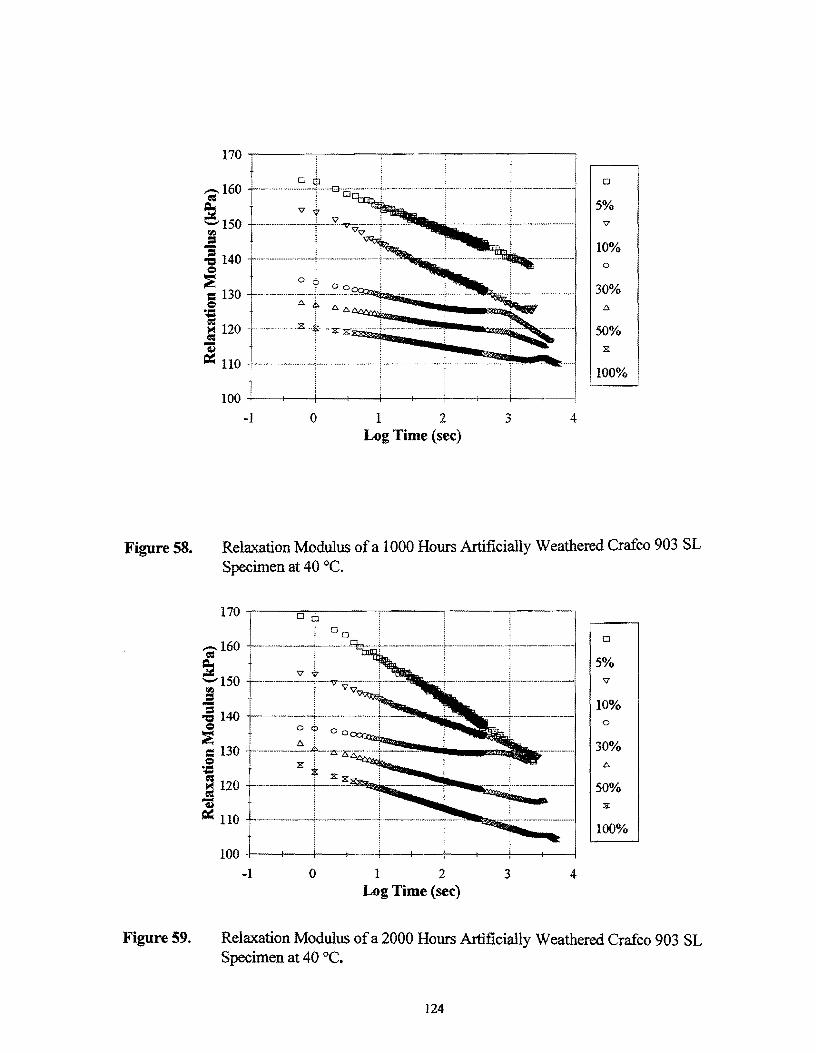
Figure 58.
Figure 59.
D
5%
10% 0
30%
50% X
100%
-1 0 1 2 3 4 Log Time (sec)
Relaxation Modulus of a 1000 Hours Artificially Weathered Crafco 903 SL Specimen at 40 °C.
170 I D ¢J
-160 t ______________ _, ~~-bf-"'t---_,+-----------------~--------·--------------~----------------------·---1 = ' ~150 .! .a 140 <:l :g = 130 <:l ~
= 120 = "iS ' ~ 110 -·--·--..l·······-··-·-·--···-+---·--·-·-·····---~---·~------~~c·
100+---+---~-4---+--~--~--~--+---~~
-1 0 1 2 3 4 Log Time (sec)
D
5% v
10% 0
30% e.
50% X
100%
Relaxation Modulus of a 2000 Hours Artificially Weathered Crafco 903 SL Specimen at 40 °C.
124

150 -r-------,----,.---------......-----, 0 i
';'140
~ -~ 130 :; "1:1
~ 120
= <:'>
iuo
= QS ~ 100
--·-············--k-----·---·--··-····~---·---·-·-·--·L---·············-·-·----1 .. ---·--·-·--·--·-
' '
·-·-·-·····-··-·~-·~-~·.-.;····
90+-~~-+-~-+-~~-+-~-+-~-~
-1 0 1 2 3 4 Log Time (sec)
Cl
5%
10% 0
• 30%
50%
100%
Figure 60. Relaxation Modulus of a Fresh Crafco 903 SL Specimen at 60 oc.
160
D 5% -······-·--~----··~·-·-·--··--+·-··---·--···---·- 'V :
-;-150
~140 fl:l
Cl
= -.; 130 <:'>
10% 0
~ = 120 30%
<:'> ".::: a 110 50% -~ ~ 100
90 -1 0 1 2 3 4
Log Time (sec)
Figure61. Relaxation Modulus of a 500 Hours Artificially Weathered Crafco 903 SL Specimen at 60 °C.
125

160 0
0
';'150
~ 5% - " ~140 -= 10% "'CC
i 130
= 0
30% Q
~ 120 6
~ ~ 50% -G.;
=:l llO X
• 100%
100
-1 0 1 2 3 4 Log Time (sec)
Figure62. Relaxation Modulus of a 1000 Hours Artificially Weathered Crafco 903 SL Specimen at 60 °C.
Figure63.
1W~----~------,-----~-----,-----, 0
0
5%
.. ~---~---··t-· .. ~-·-------~~-10%
0
300/o
50%
. 100%
110+---~-4---+--~--+---r--4---+--~~
-1 0 1 2 3 4
Log Time (sec)
Relaxation Modulus of a 2000 Hours Artificially Weathered Crafco 903 SL Specimen at 60 °C.
126

7
6 6 0 '1 n
~ 'V
'? ... 1'8
t;il
B 'V
C3 D
@
0 'V
1 ~
0 .., 5 10 30 50 100
Unit Extension(%)
Figure 64. Time-Deformation Shift Factor Relationship for Crafco 903 SL.
260
_240 Clll
~220 I'll
0
Ohrs
.e 200 = "C i 180 500 hrs
0
= ·! 160 Clll
1000 hrs
= 140 -~ ~ 120
2000 hrs
100
-2 0 2 4 6 8 10 Log Reduced Time (sec)
Figure65. Relaxation Modulus Curves Normalized for Extension at -25 °C.
127

220
-~200 -0
Ohrs Vi :I = 180
"'0 ~ 500 hrs
~ 0
s 160 '!&::
1000 hrs «<
= 4S 140 =: 2000 hrs
120
-2 0 2 4 6 8 10 Log Reduced Tin:~ (sec)
Figure66. Relaxation Modulus Curves Normalized for Extension at 0 °C.
220
'i'200 ~ -a 1so -= "'0
~ 160
= ~
i 140 lo'l «< -<l.l =: 120
100
-2 0 2 4 6 8 10 12 Log Reduced Time (sec)
Figure 67. Relaxation Modulus Curves Normalized for Extension at 25 °C.
128

-~ 160 -Ql}
= = 140 +--------+---~'1!!11·-"ll.-' "'C
~ g 120 +·-···--·-····-+·-----·-+-·--······~-"':"""~ ·-= ~ =
0
Ohrs
500 hrs 0
IOOOhrs
~ 100 +-·······-·····-·!-·--···-·-····-+···-········ ····+·····-··· .. ······+·-·-········•11.:-·-·--"'•·"····-·-··•«••«···-·~ 2000 hrs
-2 0 2 4 6 8 10 12 Log Reduced Time (.;ec)
Figure68. Relaxation Modulus Curves Nonnalized for Extension at 40 oc.
-~ 160 -r--~*'i!.-·····+-·-·-····---+-·-·-·--·-···+·---------··----i-----------······'··-·-·----·1 0 -~ Ohrs
:g 140 +---··-·-~.::::-"tilllbk ""''lllo;..-····!·-·--··-·-·-+---------'--·--·-·-······-'-------1 e ~
500 hrs 0 s 120 +-·-·---+---·-~ ..... ---···--·:;!11111~.
~ --~~
a lOOOhrs
~100+----4---·-·----~'--·----·+-·------· .. ·--F~~---~-~~~~---·---·-···I 2000hrs
-2 0 2 4 6 8 10 12 Log Reducced Time (sec)
Figure 69. Relaxation Modulus Curves Nonnalized for Extension at 60 °C.
129

-\\'# 200 +·--·-······7··-·--' ~ .._
~ 180
"g 160 -!-·-··········;,-·-·--· .....
~ 140 +·······--·~-·-·-··--!-··-....>OIIIIri; = <:I
·-; 120 -1--··--······ir--·--r-··-·----T--··········-·'···-"~ ~ ~ 100
80+-~---r--~~1---+--~--~-+--~--.
-10 -5 0 5 10 15 :Log Reduced Time ~sec)
0
-25C
oc 0
25C
40C
60C
Figure 70. Relaxation Modulus Curves Normalized for Age and Extension for Crafco 903 SL.
0
0
-1 0 -25C X
0 oc 0
A
X 25C
t;,. 40C 0
-6 ' 60C
0 500 1000 1500 2000 Age (hours of exposure)
Figure 71. Time-Age Shift Factor Relationship of Crafco 903 SL.
130

Figure 72.
Figure 73.
180
-e:l 160 ~ -!if)
= = 140 "C e ~ .~ 120 -= 11'1 = -as 100 ~
80
-4 -2 0 2 4 6 8 10
Log Reduced Time (sec)
Master Relaxation Modulus Curves Normalized for Extension, Age, and Temperature for Crafco 903 SL (with Reference Conditions: E0=5%, Ao=O hrs., T0 =25 °C).
8 ~---------------------~-------------,
~ /:1/ s 6 +·-·--···-·-·--·-·--·-··---·-··-·-·-·-·------···-···-···-········--··-·-··-····-······--r-··-1 Col ,/
~ / ~ 4 +---···--·--·--··········---·-------·--········----·-·····-··--·-··--·······----~/ ___________ ,
~ ;// ~ 2 +--·-•·"-·•··----·--·--··----·----·-········--·-······-·····-······-~/. _______________________ 1
~ //.
~ 0 ./ .... ~ r--~======3C~==-····--···-··············-·----····-----l
-2 +---+-----l---t----+---+----1----+----t-----t-----j
-60 -40 -20 0 20 40 (Temp.- Reference Temp.) (C)
Time-Temperature Shift Factor Relationship of Crafco 903 SL. (Reference temperature = 25 °C.)
131