EVALUATION OF COLOUR STABILITY OF FLEXIBLE DENTURE...
83
EVALUATION OF COLOUR STABILITY OF FLEXIBLE DENTURE BASE RESIN IN FOUR COMMONLY USED FOOD SUBSTANCES Dissertation submitted to THE TAMILNADU Dr.MGR MEDICAL UNIVERSITY In partial fulfilment for the degree of MASTER OF DENTAL SURGERY BRANCH I PROSTHODONTICS AND CROWN AND BRIDGE APRIL 2012
Transcript of EVALUATION OF COLOUR STABILITY OF FLEXIBLE DENTURE...

EVALUATION OF COLOUR STABILITY OF FLEXIBLE
DENTURE BASE RESIN IN FOUR COMMONLY
USED FOOD SUBSTANCES
Dissertation submitted to
THE TAMILNADU Dr.MGR MEDICAL UNIVERSITY
In partial fulfilment for the degree of
MASTER OF DENTAL SURGERY
BRANCH I
PROSTHODONTICS AND CROWN AND BRIDGE
APRIL 2012

CERTIFICATE
This is to certify that the dissertation titled “ Evaluation of
colour stability of flexible denture base resin in four commonly
used food substances” is a bonafide record of work done by
Dr. S. Janani under my guidance during her postgraduate study period
2009 – 2012.
This dissertation is submitted to THE TAMILNADU Dr. M.G.R
MEDICAL UNIVERSITY , in partial fulfilment for the degree of
Master of Dental Surgery in Prosthodontics including Crown and
Bridge and Implantology. It has not been submitted (partially or
fully) for the award of any other degree or diploma.
Guide
Prof. (Dr). Anjana Kurien, M.D.S. Prof (Dr) V. R. Thirumurthy, M.D.S.
Head of the Department
Department of Prosthodontics including
Crown and Bridge and Implantology.
Prof (Dr). V. Prabakar, M.D.S.
Principal,
Sri Ramakrishna Dental College and Hospital,
Coimbatore.

ACKNOWLEDGEMENT
ACKNOWLEDGEMENT
First and foremost, I express my sincere gratitude to my Prof.
(Dr).V.R.Thirumurthy , Head of the Department, Department of
Prosthodontics who has been my source of inspiration since my
undergraduate years for his constant support and guida nce
throughout the study.
I am greatly obliged to my guide Prof.(Dr).Anjana Kurien ,
Department of Prosthodontics who, with her helpful crit iques , has
sculptured me to what I am today.
Dr.K.S.Limson, Associate Professor, Department of
Prosthodontics has a lways been a role model to all his students and
I am truly thankful to him.
My sincere thanks to Dr.Y.A.Bindhoo, Reader, Department of
Prosthodontics, whose encouragement and guidance made me realize
my innate potent ial .
I am indebted to Dr.Sunil Joseph Jacob , Senior Lecturer,
Department of Prosthodontics who instilled in me the ability to
think and reason out which made all my endeavours meaningful.

ACKNOWLEDGEMENT
I extend my sincere thanks to Er.Mr.Thangavel,
Mr.Sekkizhar, Er.Mr.Duraisamy, Er.Mr.Rajarajan and all my
friends who helped me out with the technical part of the study.
Finally, I thank The Almighty, my parents and my loving
sister to whom I dedicate my entire life.

CONTENTS
Contents:
1. Introduction 1
2. Aim and Objective 5
3. Review of Literature 6
4. Materials and Methods 14
5. Results 28
6. Discussion 42
7. Summary and Conclusion 51
8. Bibliography 53
9. Annexure 58
INTRODUCTION
1
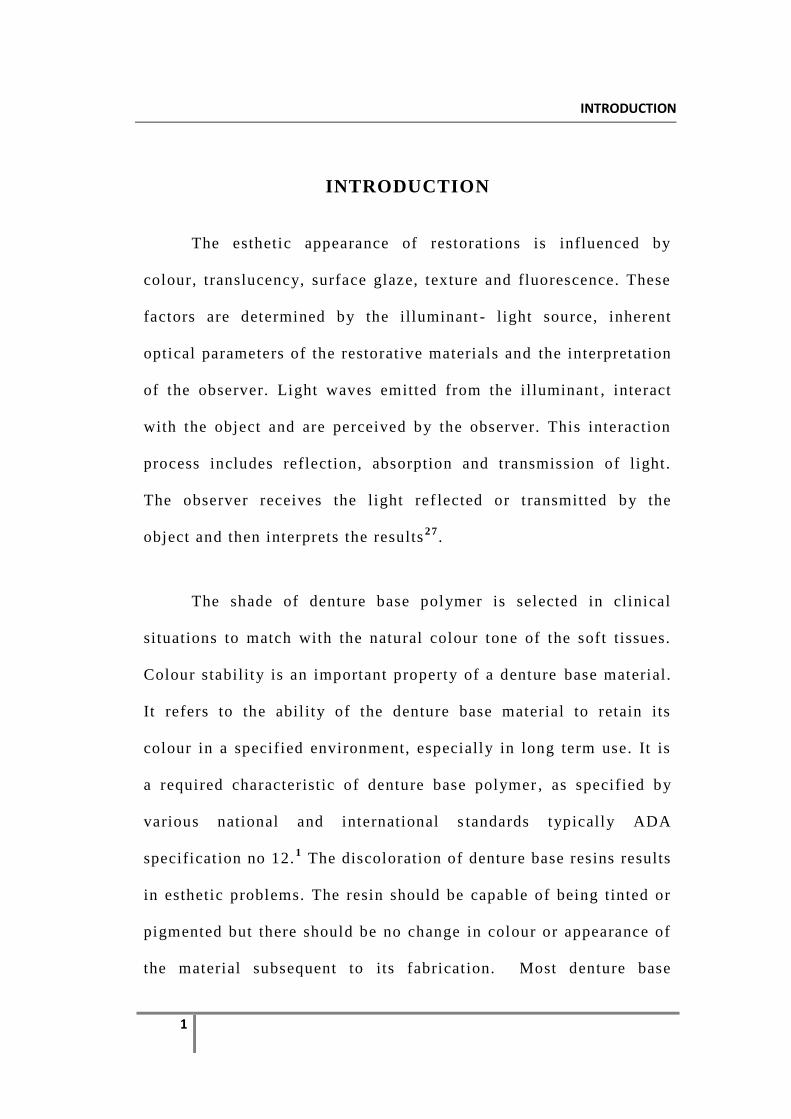
INTRODUCTION
The esthetic appearance of restorations is influenced by
colour, translucency, surface glaze, texture and fluorescence. These
factors are determined by the illuminant - light source, inherent
optical parameters of the restorative materials and the interpretation
of the observer. Light waves emitted from the il luminant , interact
with the object and are perceived by the observer. This interaction
process includes reflection, absorption and transmission of light.
The observer receives the light ref lected or transmitted by the
object and then interprets the results27
.
The shade of denture base polymer is selected in clinical
situations to match with the natural colour tone of the soft tissues.
Colour stability is an important property of a denture base material.
It refers to the abil ity of the denture base material to retain its
colour in a specified environment, especially in long term use. It is
a required characteristic of denture base polymer , as specified by
various national and international s tandards typically ADA
specification no 12.1 The discoloration of denture base resins results
in esthetic problems. The resin should be capable of being tinted or
pigmented but there should be no change in colour or appearance of
the material subsequent to its fabrication. Most denture base
INTRODUCTION
2
materials are subject to sorption, a process of absorption and
adsorption of liquids dependent upon environmental conditions8.
Discoloration is possible especially, when the contacting solution is
pigmented.
Indian food is known to have a high quantity of ingredients
which have a high staining capacity. Hersek N10
has reported that
beverages such as tea, coffee, wine and artificial food colorants like
erythrosine, tartrazine and sunset yellow increase the development
of stain on clean acrylic surfaces. Absorption and penetration of
these colorants into the organic phase of the resin based materials is
probably due to the compatibility of the polymer phase with these
pigments37
. Tea and coffee contain large amount of s taining agents
like gall ic acid and tannins. Denatured proteins and iron from the
diet contain thiol groups that provide sulphur and eventually form
iron sulphide which is responsible for the sta in. Turmeric has been
used as a flavouring or colouring agent in a variety of foods. The
yellow colour of turmeric is due to curcumin(3%) which is an active
substance22
. Staining of prostheses by colorants in a service
environment may be more largely responsible for colour change
than colour instability of the mater ial itself.

INTRODUCTION
3
Chowdary R3 has reported that the prevalence of edentulism
in India varies from 60% to 69% in 25 years and above age group.
The incidence of tooth loss increases with age leading to an increase
in prevalence of part ial edentulism in general p opulation. The
removable partial dentures are an economical treatment option in
these patients. Due to increased esthetic expectations, non metal
clasp dentures using thermoplastic resins have recently become a
treatment option for these patients. It is a pressure injected flexible
denture base resin that is ideal for partial dentures. The material is
a specialized form of nylon in the family of super polyamides that
will not deteriorate when it comes into contact with fluids and
microorganisms in the oral environment. They possess properties
like superior esthetics, reduced potential for allergic reactions, and
flexibility due to high elastic nature that decreases the stresses on
the abutment teeth14
. They do not require tooth preparation as cast
partial dentures and they reduce the chair time required to construct
the prosthesis.
The main disadvantage of this material is the lack of rigidity,
the essential cri teria of removable partial denture and also difficulty
in repair but their flexibility allows th e design to take full
advantage of the undercuts, especially recessed areas of supporting
alveolar contours and they provide retention without pressure at the

INTRODUCTION
4
contact point. It achieves the effect of a stress breaker without
attachments, the gingival tissue is gently stimulated under
mastication and unnatural stresses on the remaining teeth are
substantially reduced34 ,40
. There are only few studies reported on
the colour stability of flexible denture base resins. Being a more
esthetic alternative to cast pa rtial dentures their colour stabil ity has
to be evaluated over clinical use.

AIM AND OBJECTIVE
5
AIM AND OBJECTIVE
AIM
The aim of this study was to evaluate the colour stability of
flexible denture base resin in four commonly used food substances
in India.
OBJECTIVE
The objective of the study was to evaluate the colour stability
of flexible denture base resin of two thicknesses (1.0 – 1.5 mm) and
(2.0- 2.5 mm) in four commonly used food substances such as
coffee, tea, turmeric and sunset yellow dye.

REVIEW OF LITERATURE
6
REVIEW OF LITERATURE
Crispin B J et al4 in 1979 compared the colour stability of
materials used in the fabrication of temporary restorations. Six
different temporary restorative materials were tested. Tea, coffee
and grape staining solutions were used. It was concluded that rough
materials darkened significantly more than polished materials.
There was no statistically significant difference in the amount of
staining between air cured and pressure cured samples. Based on
chemical composition the methyl met hacrylate material showed the
least darkening followed closely by ethyl methyl methacrylate
material .
Khan Z et al1 8
in 1987 evaluated the staining potential of the
VLC material with a conventional acrylic resin, polymethyl
methacrylate. Tea and sodium azide solutions were prepared and
staining tests performed. The Triad material showed significantly
greater staining than the acrylic resin material in tea solution
maintained at 37 and 50 degrees C. The differences in staining
characteristics were ascribed to the differences in water sorption
exhibited by the two materials, that of Triad VLC being 3.6 times
greater than that of conventional acrylic resin denture base material .

REVIEW OF LITERATURE
7
May K B et al2 3
in 1992 evaluated the colour stabili ty of five
denture base acrylic resins (Lucitone Hypro, Acron, Triad, Accelar
20 and Compak 20) and one denture base repair resin (Perm). The
samples were subjected to conditions of accelerated ageing to test
colour stability. It was found that the colour of Lucitone, Hypro and
Acron was least affected by conditions of accelerated ageing. Triad,
Accelar 20 and Perm demonstrated noticeable colour changes.
Compak 20 had an appreciable colour change and was least colour
stable of the materials tested.
Ilmaz B et al1 1
in 1994 evaluated the colour stability of one
light polymerized, three heat polymerized, and three
autopolymerized denture base polymers that were exposed to coffee,
tea and water at 50 degrees. It was found that coffee and tea stained
the denture base materials superf icially and brushing with tooth
paste and moderate grinding reduced discolouration to an acceptable
level. All materials were relatively colour stable when immersed in
water at 50 degrees.
May K B et al2 4
in 1996 evaluated the colour stabili ty of
seven conventional and one microwave heat cured denture base
material . The samples were subjected to conditions of accelerated
ageing in both to test for colour stability. The results revealed that

REVIEW OF LITERATURE
8
colour changes occurred after accelerated ageing in both heat cur ed
denture base resins and Argon GC microwave acrylic resins
processed with the microwave method.
Wang X et al3 8
in 1996 evaluated the colour stability of heat
activated and chemically activated acrylic resins processed by
compression moulding or fluid resin matrix. They concluded that
heat activated acrylic resins were more colour stable than
chemically activated acrylic resin.
Yannikakis S A et al3 9
in 1998 evaluated the discolouration
effects of coffee and tea on some materials that are commonly use d
in the fabrication of provisional restorations. It was concluded that
provisional restorative materials, staining solutions, and immersion
time were significant factors that affected color stabil ity. After
immersion for 7 days, all materials showed obser vable color
changes. The composite-based materials, especially light -curing
composites, were the least color stable. The coffee solution
exhibited more staining capacity than the tea solution.
Herserk N et al1 0
in 1999 evaluated the colour stability of
five commercially available denture base acrylic resins. The
specimens were exposed to 3% erythrosine, tartrazine and sunset
yellow solutions. Colour changes were determined with a computer

REVIEW OF LITERATURE
9
controlled spectrophotometer after 1, 3 and 6 months of exposure to
staining solutions. It was concluded that all materials tested had
acceptable colour stabili ty when exposed to the food colorants. The
polymethyl methacrylate denture base resins were hydrophilic and
attracted more water soluble dyes on the surface and sta ining
occurred as a result of electrostatic charges. The least staining was
found to be in the sunset yellow solution as erythrosine and
tartrazine have more electrostatically charged groups than the
sunset yellow dye.
Lai Y et al2 1
in 2003 compared the colour stability, stain
resistance, and water sorption of 4 materials (one silicone, one
copolyamide and 2 heat polymerized acrylic resins) commonly used
for gingival flange prostheses. The specimens were immersed in
coffee and tea solutions. The specimens placed in water and exposed
to air served as controls. All flange materials tested demonstrated
color stability in air and water. However, the color changes of
silicone and copolyamide materials stored in coffee solution for 180
days were greater than 3 NBS (National Bureau of Standards) units,
which would be characterized as appreciable and considered
clinically unacceptable. The disparity in staining may be partly
attributable to different polar properties of the tested materials that
affect both the affinity of a material to extrinsic stains and the
diffusion of water molecules.

REVIEW OF LITERATURE
10
Koksal T et al1 9
in 2008 evaluated the colour stability of two
brands of porcelain teeth and three brands of acrylic denture teeth.
Samples were immersed into three staining drink s as test groups and
distilled water as control. Colour change values were determined
after 1 day, 1 week, 2 weeks, and 4 weeks of immersion. Instant
coffee was found to be the most chromogenic among the solutions
tested. Among the materials tested porcela in was found to be more
resistant to discoloration. It was concluded that acrylic teeth
showed a high degree of colour change and that the amount of
colour change for each group increased proportionally with t ime.
Rodrigues M et al2 9
in 2009 evaluated the effect of different
microwave polymerization cycles on the colour changes of a
microwave processed denture base resin after accelerated ageing
and immersion in beverages such as coffee, tea, cola and wine. It
was concluded that the colour changes of micr owave polymerized
denture base resin tested were not affected by different
polymerization cycles after accelerated ageing or immersion in
beverages.
Daniela M et al5 in 2010 evaluated the colour stability,
surface roughness, surface porosity of acrylic re sins for eye sclera
polymerized by different heat sources and submitted to accelerated

REVIEW OF LITERATURE
11
artificial ageing. Three heat sources short cycle, long cycle, dry
heat oven were used. It was concluded that irrespective of the type
of heat used for polymerization, t here was an intense colour
alteration to clinically unacceptable levels when the specimens were
subjected to artificial accelerated ageing.
Imirzalioglu P et al1 2
in 2010 investigated the effect of four
solutions [saliva (control group), saliva+tea, sal iva+coffee,
saliva+nicotine] on the colour of different denture base acrylic
resins (heat-polymerized, injection-molded, autopolymerized) and a
soft denture liner. Colorimetric measurements were done on the 1s t
,
7t h
and 30t h
days. Goldstein and Schmitt reported that when ∆E is
more than 3.7, i t is no longer within the limits of clinical
acceptability and it assumes the quality of visual detectabil ity. The
color shifts of al l test materials were clinically acceptable
(∆E < 3.7) excep t for soft liner in nicotine, which was not clinically
acceptable over time. A decrease in colour difference values was
observed for each type of material in tea and coffee solution
especially after the 7t h
day. This was attributed to the removal of
accumulated layers from the specimens once they reached a certain
thickness. Therefore it was concluded that minimizing drinking of
such beverages and use of tobacco, part icularly when soft l iner is
applied, may be advantageous for denture wearers for long -term
color stability.

REVIEW OF LITERATURE
12
Goiato M C et al6 in 2010 evaluated the possible chromatic
and microhardness alterations of the flexible resins Ppflex and
Valplast in comparison to the conventional acrylic resin Triplex
when submitted to accelerated aging. Accelerated aging
significantly increased the values of microhardness of the resins
tested, with the highest values being observed for the resin Triplex.
The resin Valplast presented the greatest chromatic alteration value
after accelerated aging, which was significan tly different from those
of the other resins tested. This was either due to the lower monomer
content of Triplex and Ppflex or greater amount of reagents such as
benzoyl peroxide in Valplast.
Takabayashi Y et al3 5
in 2010 examined six thermoplastic
resins and conventional acrylic resins and found that cl inically
noticeable staining may occur on the polyamide resins and
polyethylene terephpthalate resins. The staining occurred due to the
physical penetration of pigments between the molecular lattices or
the adsorption of pigments on the surface of the specimens.
Navarro W. F. S et al2 5
in 2011 determined the colour
stability of two heat cured denture base acrylic resins (Lucitone
550, Vipi Cril) and one nylon denture base material (Transflex) by
subjecting them to three beverages - coffee, cola and red wine.

REVIEW OF LITERATURE
13
Distilled water served as control. I t was concluded that the greatest
chromatic changes were found in red wine immersion followed by
coffee and cola. Transflex displayed staining after immersion in
cola. The staining effect of red wine and coffee on the three
commercially available resins used as denture base material was
found to be at clinically acceptable levels.

MATERIALS AND METHODS
14
MATERIALS AND METHODS
In this study, colour stability of valplast material (Valplast
International Corporation, New York, USA) was tes ted in two
thicknesses [20x10 x (1-1.5mm)] and [20 x10 x (2-2.5mm)].
Materials used in the study:
Table 1
Material Manufacturer
Flexible denture base material
– Valplast
Valplast International Corp,
New York, USA
Modelling wax Hindusthan Dental products,
Hyderabad, India
Sprue wax Renfert , Germany
Dental stone Asian chemicals, Rajkot,
Gujarat , India
Processing flask Valplast International Corp,
New York, USA
Ultra Violet visible recording
Spectrophotometer, Mac Beth
7000 A
Tokyo, Japan

MATERIALS AND METHODS
15
The study methodology followed was:
1. Metal die for wax pattern fabrication
2. Preparation of the wax pattern
3. Processing and finishing of the samples
4. Grouping of samples
5. Preparation of staining solutions
6. Staining procedure
7. Spectrophotometric analysis of colour stabili ty
Metal die for wax pattern
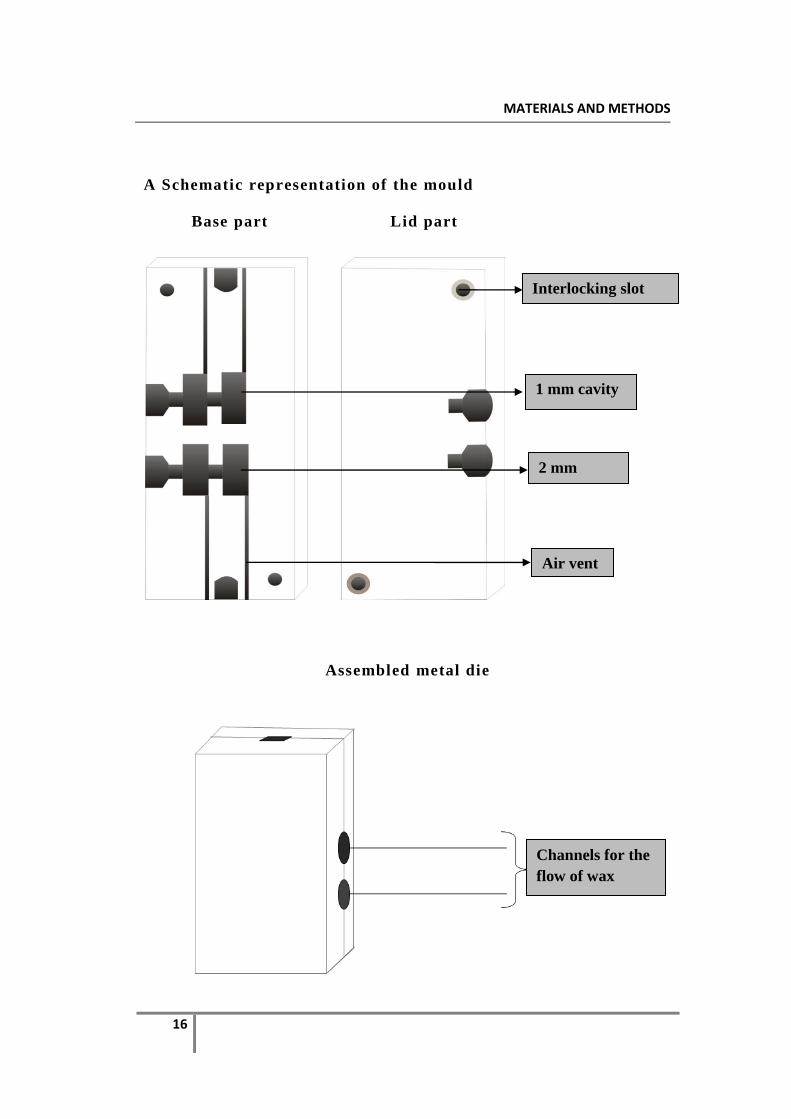
An aluminum metal mould was made for making wax patterns.
The mould was made in two parts – base and lid. The base part
contained 4 rectangular cavities, two cavities with internal diameter
of 20x10x (1-1.5 mm) and two cavities with internal diameter of
20x10x (2-2.5 mm). Air vents were made along the side of the
cavities to prevent the formation of air bubbles during the
preparation of wax patterns. The lid was provided with two
interlocking slots to seat accurately on the base. On locking, the
base and the lid formed a channel through which molten wax
(Modelling wax, Hindustan Dental Products, Hyderabad, India) was
poured to make the wax patterns.
MATERIALS AND METHODS
16
A Schematic representation of the mould
Base part Lid part
Assembled metal die
Interlocking slot
2 mm
cavity
Air vent
1 mm cavity
Channels for the
flow of wax

MATERIALS AND METHODS
17
Preparation of wax pattern
The base and the lid portions of metal mould was coated with
petroleum jelly and locked together. Modelling wax (Hindustan
Dental Products, Hyderabad, India) was melted and poured through
the two channels of the mould. The metal mould was immersed in
water and the wax was allowed to cool. Once cooled the two parts
of the mould were separated and the patterns were carefully
removed.
Processing and finishing of the samples
The samples were processed by injection moulding technique
by using a flask special ly designed by the manufacturer . Wax sprues
were attached and the wax patterns were invested in the lower part
of the dental flask using dental stone (Type 3 gypsum).
After the stone had set , separating medium was applied and
space maintainer for the cartridge was placed. The counter part of
the flask was placed on the base part and the dental stone was
poured. After the stone was set, the flask was placed in boiling
water for 4-6 minutes. The space maintainer and the patterns were
gently removed from the investment material and dewaxed
thoroughly. Separating medium was applied and flask allowed to
cool to the room temperature.

MATERIALS AND METHODS
18
The valplast cartridge was placed in the fur nace and
preheated to a temperature of 287.70 ⁰C (550⁰ F) for 11 minutes.
The stone moulds were exposed under heat lamps and was uniformly
heated for 15 to 20 minutes to a temperature of 80°C , to avoid any
premature freezing of the molten nylon as it entered the mould
cavity under pressure. The metal injector was placed in position and
along with the cartridge containing melted Valplast, they were
placed on to the injection unit . The molten Valplast was then
forced into flask using a plunger, the injection moulding pressure
being maintained at 5 bars for 3 min and then the assembly was
removed and disengaged. The flask was bench -cooled for 20 min
and then deflasked. The blanks were removed from the moulds and
the sprues were removed with a Valplast specific cutting disc. The
surfaces of the specimens were polished using Valplast specific
polishing compounds according to the manufacturer’s instructions.
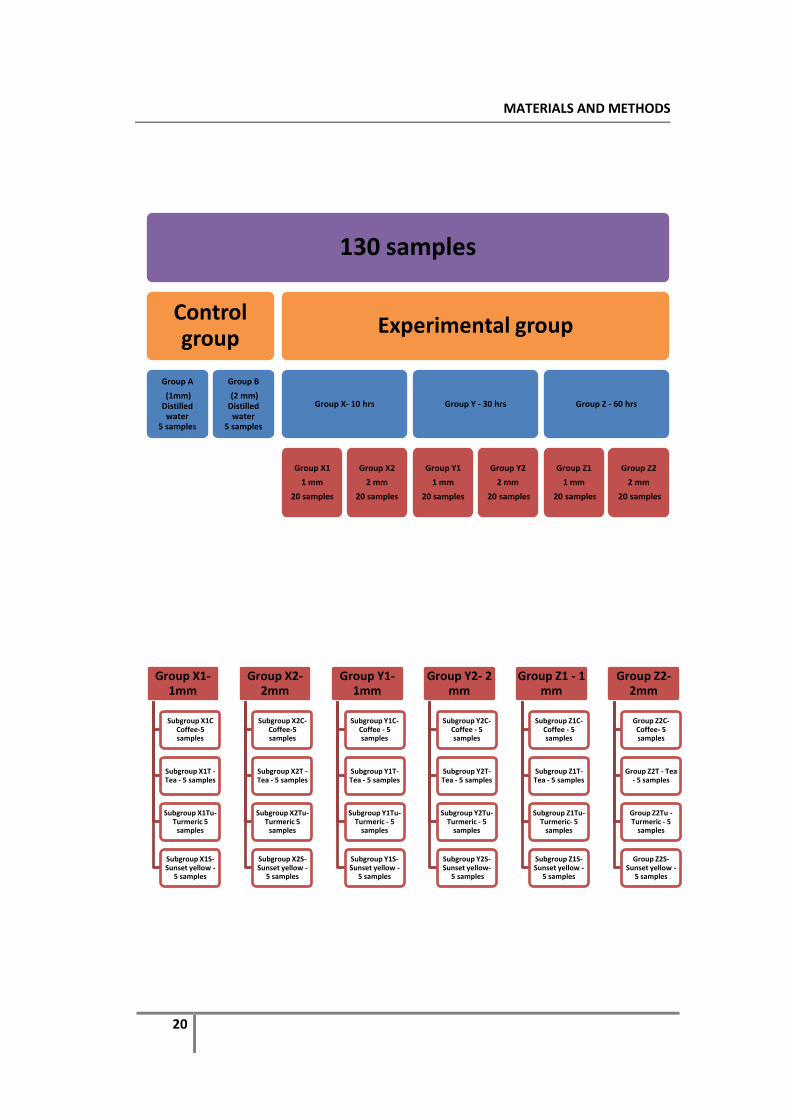
Grouping of the samples
A total of 130 samples were made. It was divided into control
group (10 samples) and experimental group (120 samples). The
control group was further divided into Group A (1mm – 5 samples)
and Group B (2mm-5 samples). The experimental group was divided
into Group X (10 hrs duration), Group Y (30 hrs duration), Group Z
(60 hrs duration).
MATERIALS AND METHODS
19
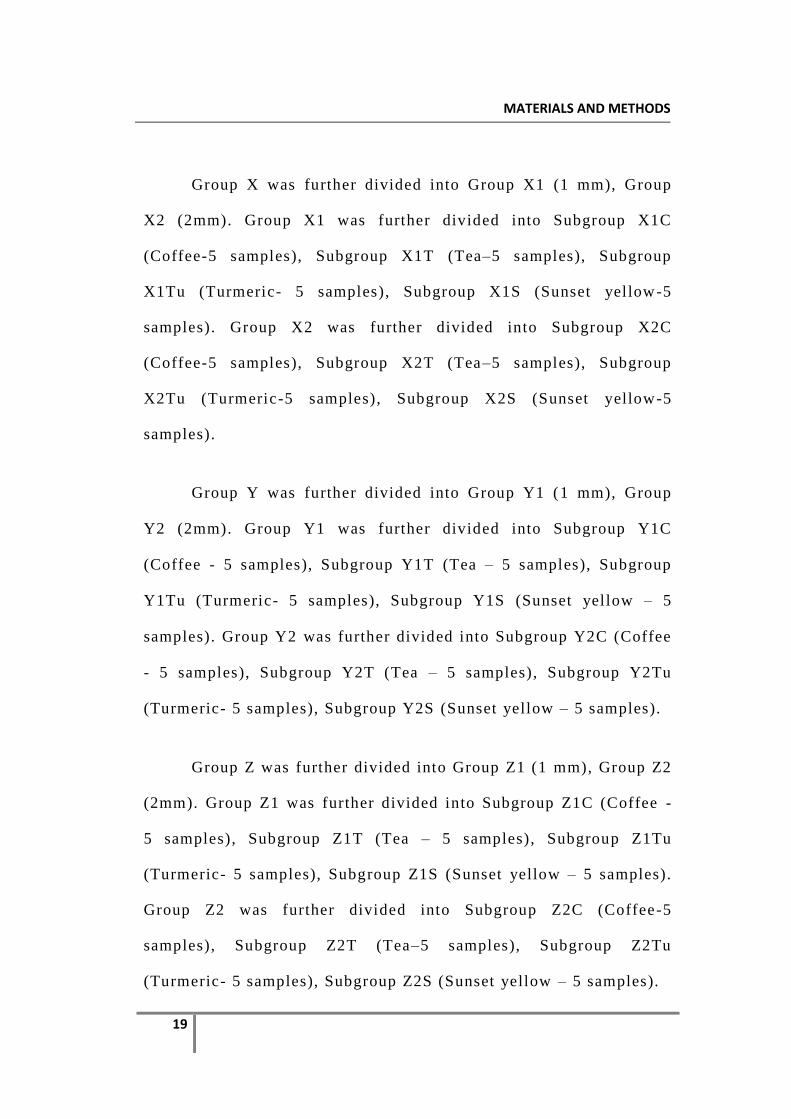
Group X was further divided into Group X1 (1 mm), Group
X2 (2mm). Group X1 was further divided into Subgroup X1C
(Coffee-5 samples), Subgroup X1T (Tea–5 samples), Subgroup
X1Tu (Turmeric- 5 samples), Subgroup X1S (Sunset yellow-5
samples). Group X2 was further divided into Subgroup X2C
(Coffee-5 samples), Subgroup X2T (Tea–5 samples), Subgroup
X2Tu (Turmeric-5 samples), Subgroup X2S (Sunset yellow-5
samples).
Group Y was further divided into Group Y1 (1 mm), Group
Y2 (2mm). Group Y1 was further divided into Subgroup Y1C
(Coffee - 5 samples), Subgroup Y1T (Tea – 5 samples), Subgroup
Y1Tu (Turmeric- 5 samples), Subgroup Y1S (Sunset yellow – 5
samples). Group Y2 was further divided into Subgroup Y2C (Coffee
- 5 samples), Subgroup Y2T (Tea – 5 samples), Subgroup Y2Tu
(Turmeric- 5 samples), Subgroup Y2S (Sunset yellow – 5 samples).
Group Z was further divided into Group Z1 (1 mm), Group Z2
(2mm). Group Z1 was further divided into Subgroup Z1C (Coffee -
5 samples), Subgroup Z1T (Tea – 5 samples), Subgroup Z1Tu
(Turmeric- 5 samples), Subgroup Z1S (Sunset yellow – 5 samples).
Group Z2 was further divided into Subgroup Z2C (Coffee-5
samples), Subgroup Z2T (Tea–5 samples), Subgroup Z2Tu
(Turmeric- 5 samples), Subgroup Z2S (Sunset yellow – 5 samples).
MATERIALS AND METHODS
20
130 samples
Control group
Group A
(1mm) Distilled
water 5 samples
Group B
(2 mm) Distilled
water 5 samples
Experimental group
Group X- 10 hrs
Group X1
1 mm
20 samples
Group X2
2 mm
20 samples
Group Y - 30 hrs
Group Y1
1 mm
20 samples
Group Y2
2 mm
20 samples
Group Z - 60 hrs
Group Z1
1 mm
20 samples
Group Z2
2 mm
20 samples
Group X1- 1mm
Subgroup X1C Coffee-5 samples
Subgroup X1T - Tea - 5 samples
Subgroup X1Tu- Turmeric 5
samples
Subgroup X1S- Sunset yellow -
5 samples
Group X2- 2mm
Subgroup X2C- Coffee-5 samples
Subgroup X2T - Tea - 5 samples
Subgroup X2Tu- Turmeric 5
samples
Subgroup X2S- Sunset yellow -
5 samples
Group Y1- 1mm
Subgroup Y1C- Coffee - 5 samples
Subgroup Y1T- Tea - 5 samples
Subgroup Y1Tu- Turmeric - 5
samples
Subgroup Y1S- Sunset yellow -
5 samples
Group Y2- 2 mm
Subgroup Y2C- Coffee - 5 samples
Subgroup Y2T- Tea - 5 samples
Subgroup Y2Tu- Turmeric - 5
samples
Subgroup Y2S- Sunset yellow-
5 samples
Group Z1 - 1 mm
Subgroup Z1C- Coffee - 5 samples
Subgroup Z1T- Tea - 5 samples
Subgroup Z1Tu-Turmeric- 5
samples
Subgroup Z1S- Sunset yellow -
5 samples
Group Z2- 2mm
Group Z2C- Coffee- 5 samples
Group Z2T - Tea - 5 samples
Group Z2Tu - Turmeric - 5
samples
Group Z2S- Sunset yellow -
5 samples

MATERIALS AND METHODS
21
Preparation of the staining solutions
The colour stability was assessed in four commonly used food
ingredients.
Table 2
Food substances Manufacturer
Coffee, Bru Hindustan Unilever Ltd,
Mumbai, Maharashtra, India
Tea, Three Roses Brooke Bond Pvt Ltd,
Kolkata, West Bengal, India
Turmeric, Sakthi Sakthi Pvt Ltd,
Erode, Tamil Nadu, India
Sunset yellow Venus Chemicals and
flavours,
Chennai, Tamil Nadu, India
Distilled water Prasad Associate,
Coimbatore, Tamil Nadu,
India.
Coffee solution was prepared by dissolving 2 g of coffee
(Bru) in 200 ml of distilled boiling water for 2 minutes. Tea
solution was prepared by dissolving 2 g of Tea (Three Roses) in 200
ml of distil led boiling water for 2 minutes. Turmeric solution was
prepared by dissolving 1 g of turmeric (Sakthi) in 200 ml of
distilled boiling water for 2 minutes. Sunset yellow solution was
prepared by dissolving 0.05 g of sunset yellow dye in 200 ml of
distilled boiling water for 2 minutes. The solutions were fi ltered to
remove the dust. Fresh solutions were prepared once in a week.

MATERIALS AND METHODS
22
Staining procedure
The control group samples (Group A and Group B) were
stored in distilled water in separate glass jars. The staining
solutions prepared were allowed to cool to room temperature and
stored in glass jars in dark. The solutions for the three groups -
Group X, Y and Z, were stored in separate containers. The glass jars
were labelled indicating the solution, duration and the thickness of
the samples. Holes were made in all the 130 samples and they were
suspended by means of threads in the solutions. They were
immersed in the test solution for a period of one hour /day after
which the specimens were removed, rinsed in dist illed water and
stored in distilled water in dark at room temperature to simulate the
oral conditions. This procedure was done for 10 days, 30 days and
60 days for Groups X, Y and Z respectively.
Schematic representation of the staining procedure
A-Control – 1 mm
B-Control – 2 mm
X- 10 hrs Y- 30 hrs Z- 60 hrs
X1–1mm X2–2mm Y1–1mm Y2–2 mm Z1-1mm Z2–2 mm
C-Coffee T – Tea Tu – Turmeric S- Sunset yellow

MATERIALS AND METHODS
23
Group A Group B

MATERIALS AND METHODS
24

MATERIALS AND METHODS
25
Spectrophotometric colour analysis of colour stability
On the day of evaluation, the samples were removed from
distilled water, and packed in plastic bags, labelled and taken for
colour analysis. The colour analysis of the samples was done with
ultraviolet visible recording spectrophotometer (Macbeth 7000A)
using the CIE colour lab system.
Basic principle of spectrophotometer
To perceive colour accurately, three elements are required:
light source, sample and observer. The spectrophotometer contains
art ificial daylight D65 that is used as the standard l ight source for
colour evaluation. The opera tor measures a standard colour through
the lens of the spectrophotometer. The instrument then reports the
results to the computer , which, in turn, performs a mathematical
calculation. The sample colour to be evaluated is then analysed by
the same process and compared to the standard. The instrument used
to view the sample is the observer, i .e the lens of the
spectrophotometer.
Group Y
Group Z
Z1Tu Z1T Z1C
Z2Tu

MATERIALS AND METHODS
26
Schematic representation of the spectrophotometer – front view
Colour analysis of Valplast samples
Each sample was dried thoroughly by blotting with tissue
paper before colour analysis. It was placed in the view port of the
spectrophotometer and L, a and b values of each sample were
measured. Three readings were made for each sample and the
average output per sample was given automatically by the
spectrophotometer using the CIE colour lab system.3 1
A total of 130
readings were taken, 10 readings for the control group and 120
readings for the experimental group.

MATERIALS AND METHODS
27
The values of the control group were taken as L1 (standard),
a1 (standard) and b1 (standard) for 1 mm samples and L2
(standard), a2 (standard) and b2 (standard) for 2 mm samples.
Similarly values of the test sample was taken as L1 (sample), a1
(sample) and b1 (sample) for the 1 mm samples and L2 (sample), a2
(sample) and b2 (sample) for the 2 mm samples .
The colour difference ∆ E for 1mm sample was calculated
using the formula:
∆ E (1mm) = [(∆L) ²+(∆a)²+ (∆b)²]½
where ∆L = L1 (sample) – L1 (standard), ∆a = a1 (sample) – a1
(standard), ∆b = b1(sample) - b1( standard)
The colour difference ∆ E for 2mm samples w as calculated using the
formula:
∆ E (2mm) = [(∆L) ²+(∆a)²+ (∆b)²]½
and ∆L = L2 (sample) – L2 (standard), ∆a = a2 (sample) – a2
(standard), ∆b = b2 (sample)- b2 (standard).

MATERIALS AND METHODS
METAL DIE
Lid part
Base part
Base and lid interlocked

MATERIALS AND METHODS
Group A (Control- 1mm)
Group B (Control – 2 mm)
STAINING PROCEDURE
Group A and Group B (Immersion in distilled water)

MATERIALS AND METHODS
Group X1(10 hrs – 1mm)
Group X2(10 hrs – 2 mm)
MATERIALS AND METHODS
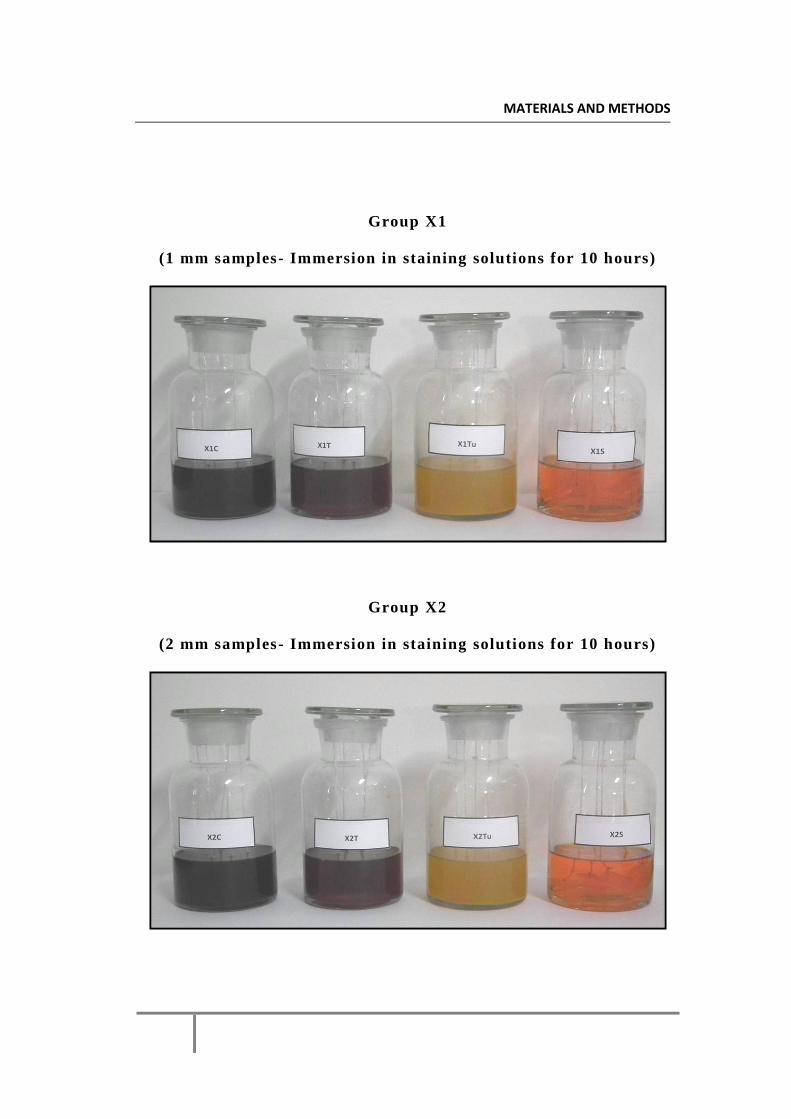
Group X1
(1 mm samples- Immersion in staining solutions for 10 hours)
Group X2
(2 mm samples- Immersion in staining solutions for 10 hours)
MATERIALS AND METHODS
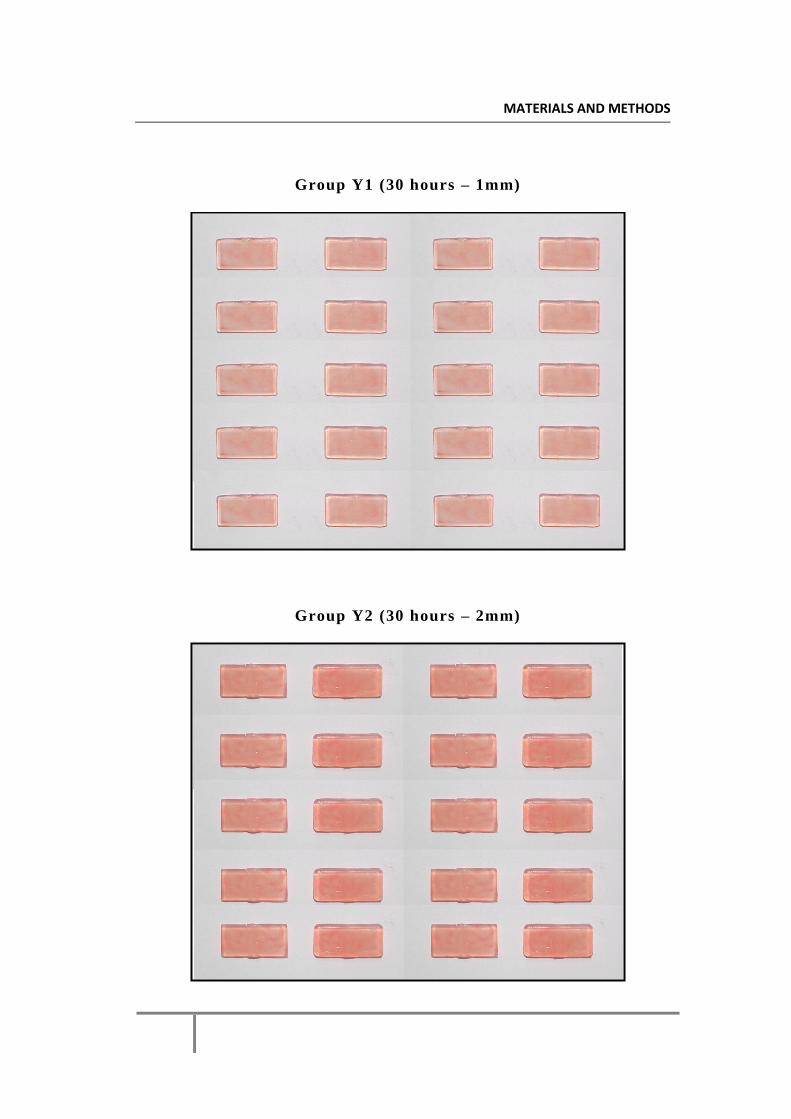
Group Y1 (30 hours – 1mm)
Group Y2 (30 hours – 2mm)

MATERIALS AND METHODS
Group Y1
(1 mm samples- Immersion in staining solutions for 30 hours)
Group Y2
(2 mm samples- Immersion in staining solutions for 30 hours)

MATERIALS AND METHODS
Group Z1 (60 hours – 1mm)
Group Z2 (60 hours – 2 mm)

MATERIALS AND METHODS
Group Z1
(1 mm samples- Immersion in staining solutions for 60 hours)
Group Z2
(2 mm samples- Immersion in staining solutions for 60 hours)

MATERIALS AND METHODS
Macbeth 7000 A spectrophotometer
Spectrophotometric colour analysis of the samples
MATERIALS AND METHODS
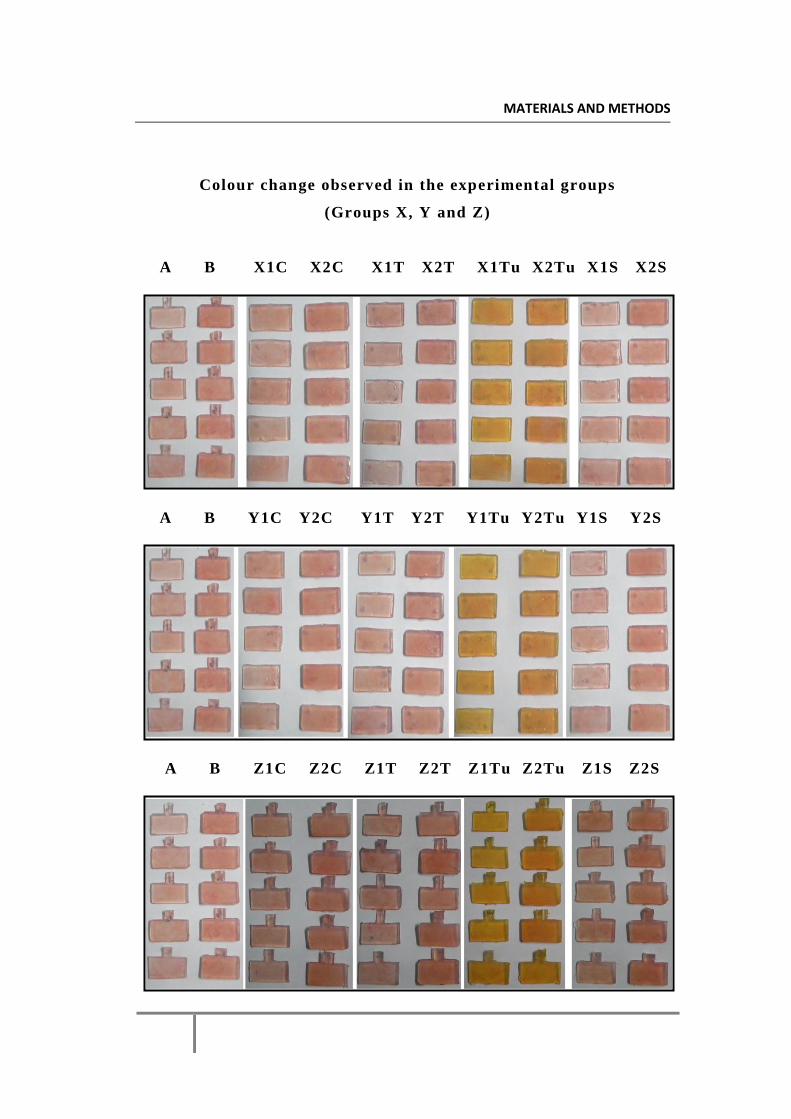
Colour change observed in the experimental groups
(Groups X, Y and Z)
A B X1C X2C X1T X2T X1Tu X2Tu X1S X2S
A B Y1C Y2C Y1T Y2T Y1Tu Y2Tu Y1S Y2S
A B Z1C Z2C Z1T Z2T Z1Tu Z2Tu Z1S Z2S

RESULTS
28
RESULTS
The colour difference ∆ E values of 120 samples (Group X,
Group Y, Group Z) are presented .
Table 3
10 hrs group Coffee
1mm 2 mm
Tea
1mm 2 mm
Turmeric
1mm 2 mm
Sunset yellow
1 mm 2 mm
1 1.30 3.14 0.93 2.65 21.19 20.57 1.13 3.18
2 1.79 2.19 2.33 2.04 22.42 20.41 1.29 2.88
3 1.59 4.39 0.65 2.13 21.47 16.88 1.36 2.39
4 1.55 2.12 1.54 2.83 20.26 18.95 1.36 2.36
5 1.5 3.11 1.96 2.14 21.33 18.98 1.35 4.25
30 hrs group
1 2.68 3.65 1.35 2.63 19.40 18.76 1.02 3.92
2 2.21 3.61 1.74 3.05 19.08 22.75 1.61 2.20
3 1.70 3.34 2.20 3.50 20.0 23.87 1.70 2.21
4 2.19 2.70 1.96 3.51 19.40 22.40 2.34 2.97
5 2.19 3.03 2.44 2.68 19.42 22.37 1.01 2.39
60 hrs group
1 1.62 3.13 0.97 2.62 18.16 18.81 2.20 2.23
2 1.16 4.18 1.33 3.04 17.89 18.19 1.98 2.87
3 1.21 4.17 1.37 2.94 17.14 18.83 1.52 2.89
4 0.65 2.08 1.50 2.65 17.31 18.52 1.65 3.16
5 1.11 1.46 1.45 2.63 16.27 18.55 1.83 3.18

RESULTS
29
Statistical Analysis
The mean and standard deviations of the colour change ∆E of
valplast material of two thicknesses in coffee, tea, turmeric and
sunset yellow solutions are as follows
Table 4
Thickness 1mm 2 mm
Duration Solution Mean Std.
Deviation
Std.Error
of Mean Mean
Std.
deviation
Std.Error
of Mean
10 hrs
Coffee 1.55 0.18 0.08 2.99 0.92 0.41
Tea 1.48 0.70 0.31 2.36 0.36 0.16
Turmeric 21.33 0.77 0.34 19.16 1.49 0.66
Sunset
Yellow 1.30 0.10 0.04 3.01 0.77 0.35
Total 6.42 8.85 1.98 6.88 7.33 1.64
30 hrs
Coffee 2.19 0.35 0.16 3.27 0.40 0.18
Tea 1.94 0.42 0.19 3.07 0.43 0.19
Turmeric 19.46 0.33 0.15 22.03 1.93 0.86
Sunset
yellow 1.54 0.55 0.25 2.74 0.73 0.33
Total 6.28 7.82 1.75 7.78 8.50 1.90
60 hrs
Coffee 1.15 0.35 0.15 3.0 1.22 0.55
Tea 1.32 0.21 0.09 2.78 0.20 0.09
Turmeric 17.35 0.73 0.33 18.58 0.26 0.12
Sunset
yellow 1.84 0.27 0.12 2.87 0.38 0.17
Total 5.42 7.09 1.58 6.81 7.00 1.57

RESULTS
30
The mean and standard deviation was calculated and subjected
to One-Sample Kolmogorov-Smirnov Test. This test was done to
find out whether the given distribution is normal or not. To test
this, a null hypothesis was formed that the observed data followed
normal probability distributions.
Table 5
One-Sample Kolmogorov-Smirnov Test
Solution
Coffee Tea Turmeric Sunset
yellow
Delta E Delta E Delta E Delta E
N 30 30 30 30
Normal
Parameters
(a, b)
Mean 2.3582 2.1587 19.6527 2.2143
Std.
Deviation 1.01784 .75496 1.90189 .84199
Most Extreme
Differences
Absolute .158 .129 .149 .117
Positive .158 .094 .149 .117
Negative -.079 -.129 -.090 -.082
Kolmogorov-Smirnov Z .865 .709 .814 .643
Asymp. Sig. (2-tailed) .443 .696 .521 .803
a Test distribution is Normal.
b Calculated from data.
RESULTS
31
From table 5 it was inferred that all asymptotic significance
values were greater than 0.05 (5% level of significance), so the null
hypothesis was accepted for all sets of data. The results obtained
were normally distributed for all groups of solution and analysis of
variance technique could be used for this data set.
Univariate analysis of variance
Analysis of variance (ANOVA) is used to uncover the main
and interaction effects of categorical independent variables (called
"factors") on an interval dependent varia ble. In this study ANOVA
test was used to determine the effect of duration of the study,
solution and thickness of the material on the colour differenc e ∆ E
values.
To determine the relation between the variables, the following null
hypotheses were generated.
Null hypothesis H0 1 : There is no significant effect of DURATION,
on the mean values of colour difference .
Null hypothesis H 0 2 : There is no significant effect of the type of
SOLUTION on the mean values of colour difference .

RESULTS
32
Null hypothesis H0 3 : There is no significant effect of difference in
THICKNESS on the mean values of colour difference .
Null hypothesis H0 4 : There is no significant interaction between
DURATION and SOLUTION on the mean values of colour
difference.
Null hypothesis H 0 5 : There is no significant interaction between
DURATION and THICKNESS on the mean values of colour
difference.
Null hypothesis H 0 6 : There is no significant interaction between
SOLUTION and THICKNESS on the mean values of colour
difference.
Null hypothesis H 0 7 : There is no significant interaction between
TIME, THICKNESS AND SOLUTION on the mean values of colour
difference.

RESULTS
33
Table 6-Univariate analysis of variance
Tests of Between-Subjects Effects
Dependent Variable: Delta E
Source Type III Sum
of Squares Df
Mean
Square F Sig.
Corrected Model 6940.843(a) 23 301.776 568.843 .000
Intercept 5220.800 1 5220.800 9841.135 .000
DURATION 17.026 2 8.513 16.047 .000
SOLUTION 6819.741 3 2273.247 4285.039 .000
THICKNESS 37.403 1 37.403 70.504 .000
DURATION *
SOLUTION 31.274 6 5.212 9.825 .000
DURATION *
THICKNESS 6.433 2 3.217 6.063 .003
SOLUTION *
THICKNESS 3.666 3 1.222 2.304 .082
DURATION *
SOLUTION *
THICKNESS
25.299 6 4.217 7.948 .000
Error 50.929 96 .531
Total 12212.572 120
Corrected Total 6991.772 119
a R Squared = .993 (Adjusted R Squared = .991)

RESULTS
34
From table 6 it was inferred that:
For the variable DURATION Sig. values were less than 0 .01,
so the null hypothesis H 0 1 was rejected. Therefore the effect of
DURATION was statistically significant in colour difference at 1%
level of significance.
For the variable SOLUTION Sig. values were less than 0.01,
the null hypothesis H 0 2 was rejected. Therefore the effect of
SOLUTION is statistically significant in colour difference at 1%
level of significance.
For the variable THICKNESS Sig. values were less than 0.01,
the null hypothesis H 0 3 was rejected. Therefore the effect of
THICKNESS was statistically significant in colour difference at 1%
level of significance.
For the variables DURATION and SOLUTION Sig. values
were less than 0.01, the null hypothesis H 0 4 was rejected. Therefore
the interaction effect of DURATION and SOLUTION was
statistical ly significant in colour difference at 1% level of
significance.
For the variables DURATION and THICKNESS, Sig. values
were less than 0.01, the null hypothesis H 0 5 was rejected. Therefore
RESULTS
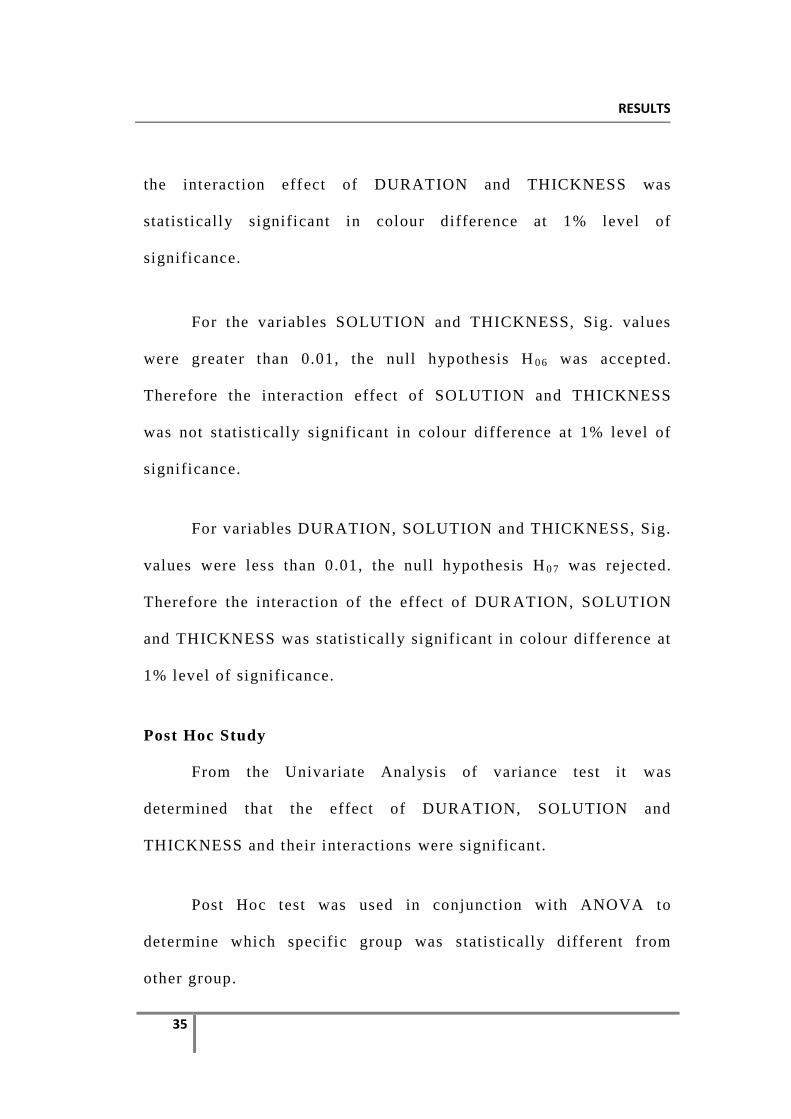
35
the interaction effect of DURATION and THICKNESS was
statistically significant in colour difference at 1% level of
significance.
For the variables SOLUTION and THICKNESS, Sig. values
were greater than 0.01, the null hypothesis H 0 6 was accepted.
Therefore the interaction effect of SOLUTION and THICKNESS
was not statistically significant in colour difference at 1% level of
significance.
For variables DURATION, SOLUTION and THICKNESS, Sig.
values were less than 0.01, the null hypothesis H 0 7 was rejected.
Therefore the interaction of the effect of DUR ATION, SOLUTION
and THICKNESS was statistically significant in colour difference at
1% level of significance.
Post Hoc Study
From the Univariate Analysis of variance test it was
determined that the effect of DURATION, SOLUTION and
THICKNESS and their interactions were significant.
Post Hoc test was used in conjunction with ANOVA to
determine which specific group was statist ically different from
other group.

RESULTS
36
Duration of the study
In Post Hoc test for the duration of the study, the following
pairs were compared.
10 hrs and 30 hrs, 10 hrs and 60 hrs , 30 hrs and 60 hrs.
Table 7
Multiple Comparisons
Dependent Variable: Delta E
Scheffe
PAIRS Mean
Difference
(I-J)
Std.
Error Sig.
95%
Confidence
Interval
(I)
Duration
of Study
(J)
Duration
of Study
Lower
Bound
Upper
Bound
10 hrs 30 hrs -.3822 .16287 .069 -.7872 .0227
60 hrs .5361(*) .16287 .006 .1312 .9411
30 hrs 60 hrs .9184(*) .16287 .000 .5134 1.3233
The mean difference is significant at the .05 level.

RESULTS
37
Homogenous subsets
Table 8
Delta E
Scheffe
N Subset
Duration of Study 1 2
60 hrs 40 6.1111
10 hrs 40 6.6473
30 hrs 40 7.0295
Sig. 1.000 .069
From table 7 and 8, it was inferred that colour difference at
60 hours duration was lower than that of the other durations.

RESULTS
38
Type of Solution
In Post hoc test for the four solutions (Coffee, Tea, Turmeric
and Sunset Yellow) used in the study, the effect of each solution
was compared with the other three solutions.
Table 9
Multiple Comparisons
Dependent Variable: Delta E
Scheffe
PAIRS Mean
Difference
(I-J)
Std.
Error Sig.
95% Confidence
Interval
(I)
Solution
(J)
Solution
Lower
Bound
Upper
Bound
Coffee
Tea .1995 .18806 .771 -.3357 .7347
Turmeric -
17.2945(*) .18806 .000
-
17.8297
-
16.7593
Sunset
yellow .1438 .18806 .900 -.3913 .6790
Tea
Turmeric -
17.4940(*) .18806 .000
-
18.0292
-
16.9588
Sunset
yellow -.0557 .18806 .993 -.5908 .4795
Turmeric Sunset
yellow 17.4383(*) .18806 .000 16.9032 17.9735
The mean difference is significant at the .05 level.

RESULTS
39
Homogenous subsets
Table 10
Delta E
Scheffe
N Subset
Solution 1 2
Tea 30 2.1587
Sunset yellow 30 2.2143
Coffee 30 2.3582
Turmeric 30 - 19.6527
Sig. .771 1.000
From table 9 and 10 it is inferred that turmeric solution
produces greater colour change than the other solutions.
The NBS parameter is important to relate the amount of
colour change (ΔE) recorded by the spectrophotometer to a clinical
environment. The data were converted to National Bureau of
Standards units (NBS units) through the equation, NBS units=ΔE
×0.92, where critical remarks of colour differences could be
expressed in terms of NBS units.1 0

RESULTS
40
The colour change values of experimental valplast samples
exposed to food colorants for 10 hrs, 30 hrs and 60 hrs duration
according to National Bureau of Standards Unit system
Table 11
Coffee Tea Turmeric Sunset
yellow
1mm 2mm 1mm 2mm 1 mm 2 mm 1mm 2mm
Group X
( 10 hrs ) 1.43 2.75 1.36 2.17 19.62 17.63 1.19 2.77
Group Y
( 30 hrs ) 2.01 3.0 1.78 2.82 17.90 20.27 1.42 2.52
Group Z
( 60 hrs) 1.06 2.76 1.21 2.56 15.96 17.09 1.69 2.64
Trace – 0.0 – 0.5
Slight – 0.5- 1.5
Noticeable – 1.5- 3.0
Exceeding noticeable range - > 3.0
From Table 11 it was inferred that subgroups coffee, tea and
sunset yellow of 1mm thickness in Group X, subgroup sunset yellow
of 1mm thickness in Group Y, subgroups coffee and tea of 1mm
thickness in Group Z produced slight colour change values.
(0.5- 1.5)

RESULTS
41
The subgroups coffee, tea and sunset yellow of 2 mm in
Group X, subgroups coffee and tea of 1mm, coffee, tea and sunset
yellow of 2 mm in group Y, subgroups sunset yellow of 1mm,
coffee, tea and sunset yellow of 2 mm in Group Z produced
noticeable colour change values. (1.5-3.0)
The subgroup turmeric of group X, group Y and group Z
exceeded the noticeable range. (>3.0)

RESULTS
Graphs
Colour difference (∆ E) of experimental valplast samples
(1 mm) exposed to food colorants for 10 hrs, 30 hrs and 60 hrs
duration.

RESULTS
Colour difference (∆ E) of experimental valplast samples
(2mm) exposed to food colorants for 10 hrs, 30 h rs and 60 hrs
duration

DISCUSSION
42
DISCUSSION
The aim of this study was to evaluate the colour stability of
the flexible denture base material valplast of two thicknesses
(1-1.5mm) and (2-2.5mm) in commonly used food substances in
India. The application of nylon -like materials for the fabrication of
dental appliances is seen as an advance in dental materials. These
flexible denture base materials are stable and exhibit high creep
resistance, high fatigue endurance, excellent wear characteristics
and solvent resistance1 6
. Thermoplastic resins typically have very
little or almost no free monomer in the material. A significant
percentage of the population is allergic to free monomer and these
materials offer an alternative treatment for these individuals2 8 ,9
. In
addition, thermoplastic materials have almost no porosity, which
reduces biologic material build up, odours, stains and exhibit higher
dimensional stability. All of these factors become important when
producing long-term provisional prostheses during implant or
complex restorative cases, or when used for permanent removable
appliances2.
Goiato M C et al6 evaluated the possible chromatic and
microhardness alterations of the flexible resins and concluded that
Valplast presented the greatest chromatic alteration value after

DISCUSSION
43
accelerated aging, which was significantly different from those of
the other resins tested.
Typically, the thermoplastic resins are more flexible and
stronger than their traditional counterparts, but their colour stabili ty
has to be evaluated over time.
The interactions of the factors influencing the colour stability
in this study were analyzed in the following manner.

DISCUSSION
44
Overall interaction of factors influencing colour stability
The results from this study showed that the effect of the
overall interaction of the duration of immersion of the samples, the
solution used and thickness of the sample were statistically
significant in determining the colour stabili ty of valplast material
(p< 0.01).
Paired interaction of factors influencing colo ur stability
When the factors were compared in pairs to find out further,
their interaction in determining the colour stability of valplast
material , the following findings were noticed.
The interaction effect of DURATION AND SOLUTION was
statistically significant (p< 0.01) in producing colour change.
The interaction effect of DURATION AND THICKNESS was
also statistically significant (p< 0.01) in producing colour
change.
But the interaction effect of SOLUTION AND THICKNESS was
not statistically significant (p> 0.01).
Individual interaction of factors influencing colour stability
Duration
The effect of DURATION was statist ically significant in
producing colour change (p<0.01). Group X, Y and Z showed the
following feature:
DISCUSSION
45
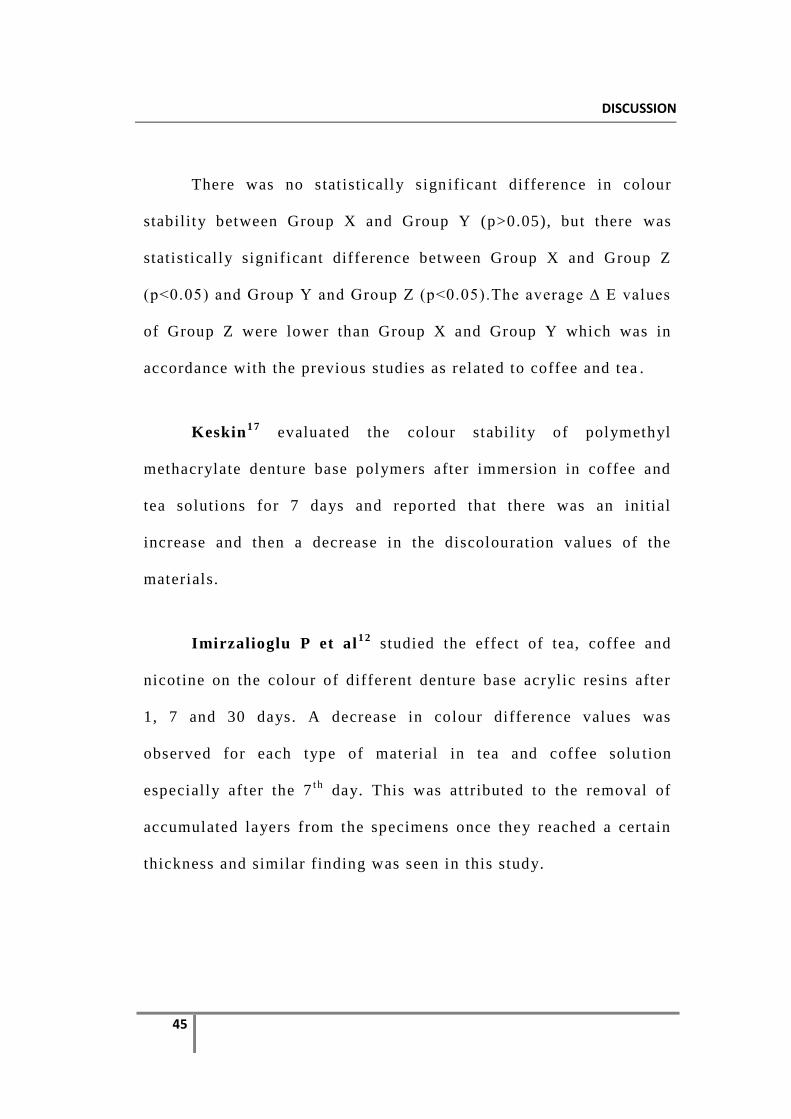
There was no statistically sign ificant difference in colour
stability between Group X and Group Y (p>0.05), but there was
statistically significant difference between Group X and Group Z
(p<0.05) and Group Y and Group Z (p<0.05).The average ∆ E values
of Group Z were lower than Group X and Group Y which was in
accordance with the previous studies as related to coffee and tea .
Keskin1 7
evaluated the colour stability of polymethyl
methacrylate denture base polymers after immersion in coffee and
tea solutions for 7 days and reported that there was an initial
increase and then a decrease in the discolouration values of the
materials.
Imirzalioglu P et al1 2
studied the effect of tea, coffee and
nicotine on the colour of different denture base acrylic resins after
1, 7 and 30 days. A decrease in colour difference values was
observed for each type of material in tea and coffee solu tion
especially after the 7t h
day. This was attributed to the removal of
accumulated layers from the specimens once they reached a certain
thickness and similar finding was seen in this study.

DISCUSSION
46
Solution
The effect of the type of SOLUTION was statistically
significant in producing colour change (p<0.01).
The results have also shown that there was no statistically
significant difference between subgroups coffee, tea and sunset
yellow solution (p> 0.05), where as the difference between turmeric
solution and each of the other solution was statistically significant
(p< 0.05). So turmeric solution produced greater colour change than
the other solutions.
Thickness
The effect of THICKNESS was statistically significant in
producing colour change (p<0.01).
This was an important finding in this study that suggested
that the thickness of the material influenced the colour stabil ity of
valplast material. The average ∆ E of the 1mm samples was
6.037667 and the average of the 2 mm samples was 7.15425.
The colour change could be caused by intrinsic and extrinsic
factors. The intrinsic factors involve discoloration of the materials
itself with alteration in its matrix. It occurs with aging as a result of
physical-chemical conditions such as thermal and humidity chang es.

DISCUSSION
47
Extrinsic factors such as absorption and adsorption of stains may
also cause discolouration.3 6
The denture base materials absorb liquid slowly over a period
of time due to the polar properties of the resin molec ules. However
it has been proved that the mechanism is diffusion of water
molecules that penetrate according to the laws of diffusion. Other
factors responsible for colour instability are, infil tration, surface
roughness, chemical degradation by use, oxidation during double
carbon reactions, producing peroxide compounds and continuous
formation of pigments due to degradation of products2 0
.
Goiato M C et al
6 reported that Valplast presented a greater
amount of reagents such as benzoyl peroxide. Some studies that
compared the chromatic alterations of auto-polymerizing and heat -
polymerized acrylic resins observed greater chromatic instabil ity for
the auto-polymerizing resins since these present a great amount of
additional reagents such as benzoyl peroxide. This reagent remains
after polymerization and may alter the material 's color.
Takayabashi Y et al3 5
reported that valplast materials exhibit
less contact angle and are hydrophilic. Polyamides tended to have
inherently high water sorption that occurred among the molecular
chains due to the high hydrophilicity of the numerous amide bonds
DISCUSSION
48
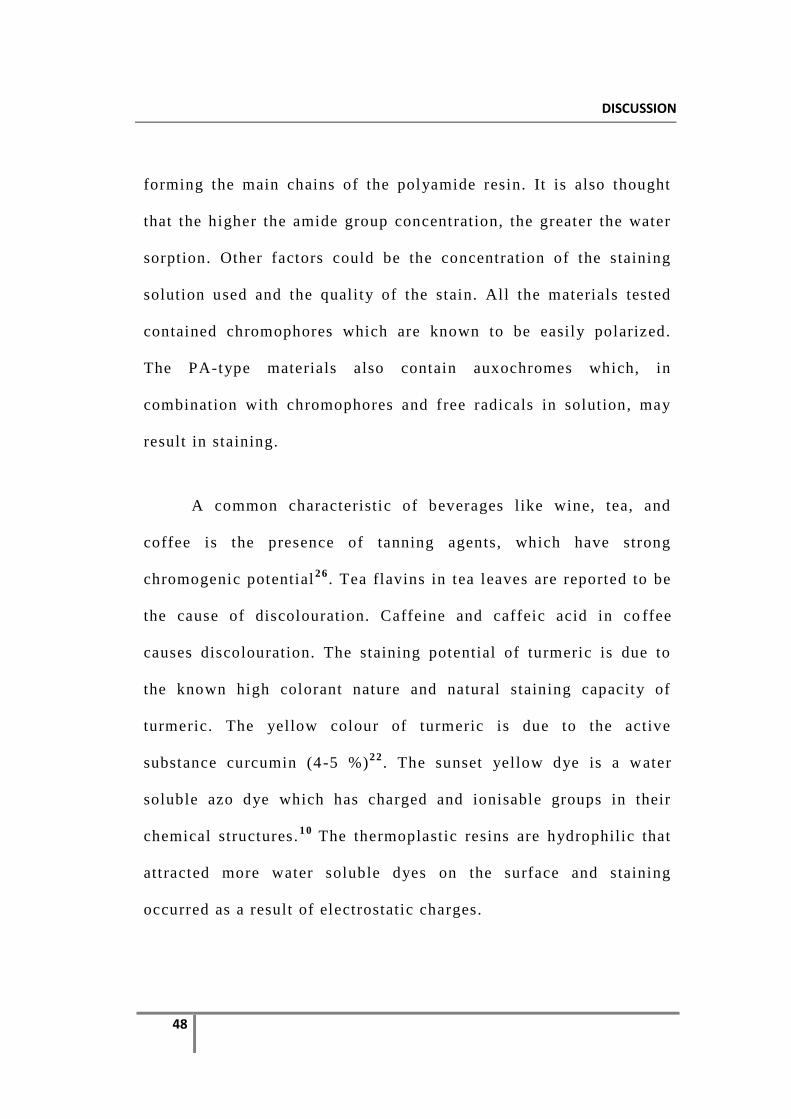
forming the main chains of the polyamide resin. It is also thought
that the higher the amide group concentration, the greater the water
sorption. Other factors could be the concentration of the staining
solution used and the quali ty of the stain. All the materials tested
contained chromophores which are known to be easily polarized.
The PA-type materials also contain auxochromes which, in
combination with chromophores and free radicals in solution, may
result in staining.
A common characteristic of beverages like wine, tea, and
coffee is the presence of tanning agents, which have strong
chromogenic potential2 6
. Tea flavins in tea leaves are reported to be
the cause of discolouration. Caffeine and caffeic acid in co ffee
causes discolouration. The staining potential of turmeric is due to
the known high colorant nature and natural staining capacity of
turmeric. The yellow colour of turmeric is due to the active
substance curcumin (4-5 %)2 2
. The sunset yellow dye is a water
soluble azo dye which has charged and ionisable groups in their
chemical structures.1 0
The thermoplastic resins are hydrophilic that
attracted more water soluble dyes on the surface and staining
occurred as a result of electrostatic charges.

DISCUSSION
49
In this study the dimension of the samples were determined to
meet the requirements of the measuring instrument, ultraviolet
visible recording spectrophotometer as done in a previous study1 0
that tested polymethylethacyrlate resin in three food colorants.
The concentration of the solution was based on an average
intake of coffee, tea, turmeric and sunset yellow per day. The
average intake of coffee and tea were 500 mg twice or thrice per
day. The concentration used was 1% for coffee and tea which was in
accordance with the previous studies1 2
. The maximal intake of
sunset yellow in various food substances is 1 mg/ kg body weight.1 3
The normal intake level of turmeric is 400 - 600 mg twice or thrice
per day.
The samples were immersed in the solutions for a period of 1
hour per day, for 10 days, 30 days and 60 days for the groups X,
Y and Z that simulated the clinical use of 1 month, 3 months and 6
months by the patient.
Color changes were characterized using the Commission
Internationale d’Eclairage L*a*b* color sp ace (CIE L*a*b*)3 3
.
Basically, the CIELAB system compares a sample to a standard and
makes a numerical determination based on the perceived color
difference. The "lightness" of a sample is represented by the symbol

DISCUSSION
50
"L*" and this value is based on the perce nt of light reflectance. The
"a·" value refers to the red shade/green shade color difference. The
yellow shade/blue shade value is designated by the letter "b*.The
colour difference is calculated by the formula ∆ E = [(∆L) ²+(∆a)²+
(∆b)²]½ where ∆L = L (sample) – L (standard), ∆a = a (sample) – a
(standard), ∆b = b(sample) - b( standard).3 1
Johnson and Kao1 5
stated that if ∆ E is less than 1, the
chromatic alteration is slight, and between 1 and 2 is considered as
clinically acceptable. Goldstein and Schmitt7 reported that when ∆
E is more than 3.7, the colour change could b e visually detected and
becomes clinically unacceptable. Ruyter et al3 0
has reported ∆ E
values higher than 3.3 to be clinically unacceptable1 2
.
In this study turmeric solution produced the greatest colour
change values with ∆ E greater than 3.3 in 10 hours, 30 hours and
60 hours duration in both 1 mm and 2mm thicknesses and exhibited
visual detectability and was therefore considered to be clinically
unacceptable. All the other solutions except turmeric produced ∆ E
values less than 3.3 and were considered to be in the clinically
acceptable range.

SUMMARY AND CONCLUSION
51
SUMMARY AND CONCLUSION
The objective of this study was to evaluate the colour
stability of flexible denture base resin (Valplast) in two different
resin thicknesses (1-1.5 mm and 2.0- 2.5 mm) in four commonly
used food substance such as coffee, tea, turmer ic and sunset yellow
dye.
Within the limitations of the study, the following conclusions
were drawn,
1. The thickness of the sample, duration of immersion of the
samples, the solut ion used, and their interactions were
significant in producing colour change.
2. Though there was an initial increase in colo ur difference
values, there was a gradual decrease after 30 hour duration.
∆ E values of the 60 hours group were lower than 10 hours
and 30 hours group suggesting a gradual increase in colour
stability from 30 hours to 60 hours duration.
3. The turmeric solution produced greater colour change than the
other solutions (∆ E >3.3 )

SUMMARY AND CONCLUSION
52
4. According to the National Bureau of Standards units, samples
of 1 mm thickness immersed in coffee, tea and sunset yellow
for 10 hours, sunset yellow for 30 hours and in coffee and tea
for 60 hours showed slight colour change values.(0.5- 1.5)
The samples of 1 mm thickness immersed in coffee and tea
for 30 hours, sunset yellow for 60 hours and the samples of 2
mm thickness immersed in coffee, tea and sunset yellow for
10 hours, coffee, tea and sunset yellow for 30 hours , coffee,
tea and sunset yellow for 60 hours showed noticeable colour
change values. (1.5 – 3.0)
The samples of both 1mm and 2mm thicknesses immersed in
turmeric solution for 10 hours, 30 hours and 60 hours
exceeded the noticeable range.(>3.0) and considered to be
clinically unacceptable.
The present study is an invitro study where the interaction of
saliva with the food colorants was not examined. Furth er research is
required to evaluate the colou r stability in invivo situation and in
longer durations of clinical use.

BIBLIOGRAPHY
53
BIBLIOGRAPHY
1. Anusavice KJ. Philips science of dental materials, Eleventh
edition, 143-166, Elsevier Inc, 2008.
2. A.Autorzy et al , Ageing process influence on mechanical
properties of polyamide - glass composites applied in dentistry.
Journal of Achievements in Materials and Manufacturing
Engineering 2010;38:49-55.
3. Chowdhary R, Nagalakshmi Chowdari . Need of implant
dentistry in undergraduate curriculum in Indian dental colleges .
Indian Journal of Dental Research 2011;22:436- 439.
4. Crispin BJ et al . Colour stability of temporary restorative
materials. J Prosthet Dent 1979;42:27 -33.
5. Daniela M et al . Colour stabil ity, surface roughness, surface
porosity of acrylic reins for eye sclera polymerized by different
heat sources. Journal of Prosthodontics 2010;19:52-57.
6. Goiato MC et al. Effect of accelerated aging on the
microhardness and color stability of flexible resins for dentures .
Braz. oral res 2010;24:114-9
7. Goldstein GR, Schmitt GW . Repeatabili ty of a specially
designed intraoral colorimeter . J Prosthet Dent 1993;69:616-9.
8. Gotusso MJ et al . Sorption of heat cured acrylic resins
chemically polished. J Dent Res 1969;6:1072 .

BIBLIOGRAPHY
54
9. Gregor M et al . Recent experiences with denture polymers.
Journal of dentistry 1984;12:14 –157.
10. Hersek N et al . Colour stability of denture base acrylic resins in
three food colorants . J Prosthet Dent 1999;81:375-9.
11. Ilmaz B et al . Colour stability of denture base polymers . Int
J Proshtodont 1994;7:372-382.
12. Imirzalioglu P et al . Color Stabil ity of Denture Acrylic Resins
and a Soft Lining Material Against Tea, Coffee, and Nicotine .
Journal of Prosthodontics 2010;19: 118–124.
13. Jacob J. Scientific opinion on the re - evaluation of Sunset
yellow FCF as a food additive . EFSA Journal 2009; 7(11):1330 .
14. John J et al . Flexural strength of heat -polymerized polymethyl
methacrylate denture resin reinforced with glass, aramid, or
nylon fibers. J Prosthet Dent 2001;86:424-7.
15. Johnston W M, Kao. EC Assessment of appearance match by
visual observation and clinical colorimetry . J Dent Res
1989;68:819-822.
16. Katsumata Y et al . Bonding strength of autopolymerizing resin
to nylon denture base polymer . Dental Materials Journal
2009;28:409-418.
17. Keskin S. The treatment of prosthetic dental materials with
hypochlorite. MSc thesis, 2002 Middle east technical university
Ankara, Turkey.

BIBLIOGRAPHY
55
18. Khan Z et al . The staining characterist ics, transverse strength,
and microhardness of a visible light -cured denture base material .
J Prosthet Dent 1987;57:384- 386.
19. Koksal T et al . Colour stability of different denture teeth
materials against various staining agents . Dental materials
journal 2008;27:139-144.
20. Koumjian JH, Firtell DN, Nimmo A . Colour stabili ty of
provisional materials invivo . J Prosthet Dent 1991;65:740-742.
21. Lai Y et al . In vitro color stabil ity, stain resistance, and wa ter
sorption of four removable gingival flange materials . J Prosthet
Dent 2003;90:293-300.
22. Malhotra N et al . Effect of three indigenous food stains on resin
based microhybrid and nanocomposites . J Esthet Restor Dent
2011;23:250-259.
23. May KB et al . Denture base resins: Comparitive study of colour
stability. J Prosthet Dent 1992;68:78-82.
24. May KB et al . Colour stability of denture base resins processed
with microwave method. J Prosthet Dent 1996;76:581-589.
25. Navarro WFS et al . Color Stability of Resins and Nylon as
Denture Base Material in Beverages . Journal of Prosthodontics
2011;00:1-7.
BIBLIOGRAPHY
56
26. Nordbo H, Attramadal A, Eriksen HM. Iron discolouration of
acrylic resin exposed to chlorhexidine or tannic acid - a model
study. J Prosthet Dent 1983;49:126 -9.
27. O’ Brein WJ Dental Materials and their Selection . 3 rd edition,
24-30, Quintessence Publishing Co, Inc 2002.
28. Pfeiffer P et al Residual methyl methacrylate monomer, water
sorption, and water solubili ty of hypoallergenic denture base
materials. J Prosthet Dent 2004;92:72-8.
29. Rodrigues M et al . The effect of polymerization cycles on the
colour stabili ty of microwave processed denture base resin.
Journal of Prosthodontics 2009;18: 432-437.
30. Ruyter IE, Nilner K, Moller B . Colour Stability of dental
composite resin materials for c rown and bridge veneers. Dent
Mater 1987;3:246-251.
31. Seghi RR, Johnston WM, O’ Brein WJ . Spectrophotometric
analysis of colour differences between porcelain systems
J Prosthet Dent 1986;56:35-40.
32. Shot well et al . Colour stability of long term soft denture liners .
J Prosthet Dent 1992;68:836-838.
33. Silva JDD et al . Clinical performance of a newly developed
spectrophotometric system on tooth colour reproduction .
J Prosthet Dent 2008;99:361-368.

BIBLIOGRAPHY
57
34. Stafford GD et al . The use of Nylon as a denture base material .
Journal of dentistry 1986;14:18 -22.
35. Takabayashi Y et al . Characteristics of denture thermoplastic
resins for non metal clasp dentures . Dental Materials Journal
2010;29:353-361.
36. Villalta P et al . Effects of staining and bleaching on color
change of dental composite resins . J Prosthet Dent 2006;95:
137-42.
37. Winkler S . Denture base resins . Dent Clin North Am
1984;28:287-297.
38. Wang X et al . Colour stabil ity of heat activated and chemically
activated fluid resin acrylics. Journal of Prosthodontics 1996;5:
266- 269.
39. Yannikakis SA et al . Colour stabili ty of provisional resin
restorative materials . J Prosthet Dent 1998;80:533-9.
40. Yunus et al . Some flexural properties of a nylon denture base
polymer. Journal of Oral Rehabilitation 2005;32:65-71.

ANNEXURE
58
ANNEXURE
The L, a, b values of Control group and Experimental group
(130 samples)
Group L value a value b value
Group A
1 35.29 7.62 0.53
2 34.29 5.74 0.10
3 35.61 6.52 0.15
4 35.37 6.69 0.17
5 35.02 6.48 0.09
Average L1-35.11 a1-6.61 b1- 0.2
Group B
1 32.27 9.29 -0.62
2 32.27 9.29 -0.63
3 32.31 9.50 -0.45
4 32.97 8.93 -0.84
5 32.56 9.95 0.06
Average L2-32.46 a2-9.39 b2-0.52

ANNEXURE
59
Group X1C
1 34.87 8.32 -0.49
2 36.53 8.30 -0.74
3 35.93 8.53 -0.60
4 35.70 7.80 -0.98
5 36.62 7.26 0.05
Group X2C
1 35.14 8.04 -0.33
2 34.34 8.57 -0.69
3 36.62 9.82 -0.80
4 34.30 8.85 -0.20
5 35.37 9.30 -0.95
Group X1T
1 35.18 8.21 -0.09
2 36.70 5.97 -0.06
3 35.53 7.89 -0.06
4 36.34 6.64 0.13
5 36.66 6.51 -0.18

ANNEXURE
60
Group X2T
1 34.62 8.24 -1.27
2 34.13 8.55 -0.18
3 34.36 9.09 -0.98
4 34.62 8.17 0.51
5 34.27 9.29 0.15
Group X1Tu
1 38.43 -0.87 19.28
2 38.65 -2.53 20.19
3 39.17 0.44 19.93
4 37.66 -1.39 18.48
5 41.43 -0.21 23.13
Group X2Tu
1 39.47 -0.45 18.23
2 37.92 0.59 17.14
3 35.84 2.12 14.19
4 36.29 2.94 9.49
5 37.23 0.07 15.17

ANNEXURE
61
Group X1S
1 35.41 8.58 -0.06
2 36.05 8.05 -0.43
3 34.92 7.00 -0.63
4 36.49 8.11 0.13
5 35.30 7.54 -0.83
Group X2S
1 34.98 10.34 0.66
2 34.89 8.44 0.05
3 33.60 9.59 -0.31
4 34.49 10.01 -0.07
5 36.48 9.81 -0.95
Group Y1C
1 36.50 5.43 -0.27
2 36.66 7.07 -1.07
3 35.96 8.18 -1.00
4 36.00 7.93 -0.32
5 36.33 7.13 -1.34

ANNEXURE
62
Group Y2C
1 35.63 10.67 -0.18
2 34.24 8.89 -0.64
3 35.38 9.78 0.49
4 34.27 10.60 0.64
5 35.00 8.32 -1.53
Group Y1T
1 34.43 8.64 0.33
2 35.86 6.38 -0.56
3 33.74 9.09 0.02
4 36.46 5.68 -0.37
5 35.48 7.76 -0.18
Group Y2T
1 34.70 8.48 -0.04
2 35.29 8.85 -0.59
3 35.58 8.14 -0.67
4 33.48 9.39 -0.03
5 34.91 8.87 -0.45

ANNEXURE
63
Group Y1Tu
1 37.65 -0.70 17.90
2 35.76 0.38 18.18
3 37.47 -1.20 18.34
4 35.55 0.79 18.68
5 35.72 0.48 18.13
Group Y2Tu
1 36.16 1.93 16.19
2 38.01 -0.84 18.92
3 38.57 -2.54 19.13
4 37.40 -0.41 18.91
5 34.79 3.19 14.98
Group Y1S
1 36.11 7.13 0.12
2 36.17 6.49 -0.23
3 36.23 8.08 -0.81
4 34.45 6.02 -0.96
5 36.01 7.02 0.15

ANNEXURE
64
Group Y2S
1 35.88 8.19 -1.71
2 34.41 9.36 -1,16
3 34.23 10.01 0.12
4 34.94 9.70 -1.87
5 34.56 8.85 -0.10
Group Z1C
1 35.99 6.93 1.01
2 35.35 6.79 0.57
3 35.31 6.98 0.32
4 35.01 6.48 0.25
5 36.08 6.22 0.63
Group Z2C
1 29.51 4.51 -0.71
2 33.81 8.39 -0.97
3 36.23 8.19 0.15
4 34.32 9.07 -0.91
5 34.22 8.93 -0.52

ANNEXURE
65
Group Z1T
1 35.89 7.26 -0.15
2 35.67 6.43 0.06
3 35.61 6.36 0.95
4 35.63 6.48 -0.39
5 35.85 6.28 0.59
Group Z2T
1 34.73 8.51 -0.17
2 35.20 8.48 -0.62
3 34.87 7.99 -0.13
4 35.03 8.41 -0.59
5 34.78 8.22 -0.66
Group Z1Tu
1 37.72 -1.72 15.92
2 37.29 -0.13 15.63
3 38.14 -1.39 14.89
4 37.01 -0.26 14.66
5 37.28 -0.68 16.83

ANNEXURE
66
Group Z2 Tu
1 32.29 -1.90 14.50
2 36.87 0.60 14.02
3 32.28 -1.89 14.50
4 36.19 -0.43 14.64
5 37.58 -0.18 16.83
Group Z1S
1 36.17 6.50 2.17
2 35.49 6.13 1.62
3 36.75 6.38 2.30
4 35.74 7.32 2.09
5 36.68 6.60 1.16
Group Z2S
1 33.38 9.39 1.02
2 34.40 7.99 0.79
3 34.40 7.94 0.81
4 32.25 6.31 0.48
5 26.86 3.13 -0.34