EVALUATION OF CHLORIDE USING EMBEDDED SYSTEM...
233
EVALUATION OF CHLORIDE USING EMBEDDED SYSTEM BASED ANALYSER AND ARTIFICIAL NEURAL NETWORK COMPUTATION IN BIOLOGICAL AND ENVIRONMENTAL SAMPLES A THESIS SUBMITTED TO BHARATHIDASAN UNIVERSITY, TIRUCHIRAPPALLI FOR THE AWARD OF THE DEGREE OF DOCTOR OF PHILOSOPHY IN PHYSICS By R.VASUMATHI A.V.V.M SRI PUSHPAM COLLEGE (AUTONOMOUS) (AFFILIATED TO BHARATHIDASAN UNIVERSITY) POONDI – 613503 THANJAVUR DISTRICT TAMILNADU, INDIA AUGUST 2011
Transcript of EVALUATION OF CHLORIDE USING EMBEDDED SYSTEM...

EVALUATION OF CHLORIDE USING EMBEDDED SYSTEM BASED
ANALYSER AND ARTIFICIAL NEURAL NETWORK COMPUTATION IN
BIOLOGICAL AND ENVIRONMENTAL SAMPLES
A THESIS SUBMITTED TO
BHARATHIDASAN UNIVERSITY, TIRUCHIRAPPALLI
FOR THE AWARD OF THE DEGREE OF
DOCTOR OF PHILOSOPHY
IN
PHYSICS
By R.VASUMATHI
A.V.V.M SRI PUSHPAM COLLEGE (AUTONOMOUS) (AFFILIATED TO BHARATHIDASAN UNIVERSITY)
POONDI – 613503 THANJAVUR DISTRICT TAMILNADU, INDIA
AUGUST 2011

Dr. P. Neelamegam
Reader in Physics(Retd),
Department of Physics,
A.V.V.M Sri Pushpam College,
Poondi – 613 503,
Tamil Nadu, India.
CERTIFICATE
Certified that this thesis entitled “EVALUATION OF CHLORIDE
USING EMBEDDED SYSTEM BASED ANALYSER AND ARTIFICIAL
NEURAL NETWORK COMPUTATION IN BIOLOGICAL AND
ENVIRONMENTAL SAMPLES” is the bonafied work of Mrs. R.VASUMATHI
who carried out the research under my supervision. Certified further, that to the best of
my knowledge the contents of this thesis have not formed the basis for the award of any
degree, diploma, or other similar title of any University or Institution.
Poondi. (Dr.P.NEELAMEGAM)
Date: Research supervisor/Guide

CONTENTS Page No
Preface Acknowledgements List of publications CHAPTER – I INTRODUCTION 1-18
1.1 Chloride 1 1.1.1 Pivotal Roles of Chloride in human body 2 1.1.2 Sources of Chloride 2
1.2 Roles of Chloride in biological samples 3 1.3 Roles of Chloride in environmental samples 4
1.3.1 Soil Chloride importance in plants 4 1.3.2 Yield and quality response of Chloride 5 1.3.3 Sea water Chloride importance in marine organism 5 1.3.4 Chloride influence on corrosion 7
1.4 Embedded system 8 1.5 Artificial Neural Network 10 1.6 Scope of the research work 12 References 13
CHAPTER – II MICROCONTROLLERS AND ARTIFICIAL NEURAL NETWORK 19-56 2. Basic concept of Measurement 19
2.1.1 Microcontrollers 19 2.1.2 Microcontroller Peripherals 21 2.2 Microcontroller P89C668 25 2.21 Pin descriptions 28
2.3 Microcontroller PIC16F877 29 2.3.1 Pin descriptions 32 2.4 Microcontroller P89C51RD2 33 2.4.1 Pin descriptions 36 2.5 Microcontroller ATmega32 37 2.5.1 Pin descriptions 40
2.6 Microcontroller PSoC CY8C27443 41 2.6.1 Pin descriptions 43 2.7 Artificial Neural Network 45 2.7.1 Introduction 45 2.7.2 Transfer function 46 2.7.3 Training of Artificial Neural Networks 47 2.8 Back Propagation Algorithm 49 2.8.1 Derivation for Back propagation algorithm 49
2.9 Genetic Algorithm 53 References 55

CHAPTER – III MEASUREMENT AND ANALYSIS OF CHLORIDE IN BIOLOGICAL SAMPLES 57-88
3.1 Renal physiology 57 3.1.1 Colorimetry principle 58 3.1.2 Proportionality between color and concentration 58 3.1.3 Stability of the color and clarity of the solutions 59 3.1.4 Analytical studies of the Instrument system 59
3.2 Measurement of Chloride in human urine using Microcontroller P89C668 62
3.2.1 System Architecture 62 3.2.2 Instrumental 63 3.2.3 Software 64
3.3 Materials and Method 64 3.3.1 Principle of color complex 65 3.3.2 Reagents 65 3.3.3 Measurement 65
3.4 Results and Discussion 66 3.4.1 Clinical Significance 66 3.4.2 Statistical Analysis 67 3.4.3 Detection and quantification limits 67 3.4.4 Precision 67 3.4.5 Recovery 67 3.4.6 Linear regression analysis 68
3.5 Analysis of Chloride in pharmaceutical sample - Oral Rehydration Salts 76
3.5.1 Introduction 76 3.5.2 Electrolyte supplements 76
3.6 Instrumental 77 3.6.1 Description of the Microcontroller based system 77 3.6.2 Software 78
3.7 Materials and Method 78 3.7.1 Measurement 78 3.8 Results and Discussion 79
3.8.1 Linearity and sensitivity 79
3.8.2 Recovery 79
3.8.3 Linear Regression analysis 80
3.8.4 Statistical analysis 80
References 87
CHAPTER – IV PERFORMANCE AND ANALYSIS OF THREE EMBEDDED BASED BIO-ANALYSERS IN MEASURING SERUM CHLORIDE 89-118

4.1 Introduction 89 4.2 Circuit description of three embedded based bio-analysers 90
4.2.1 P89C668 Microcontroller based bio-analyser 90 4.2.2 Bio-analyser using microcontroller PIC16F877 91 4.2.3 PSoC CY8C27443 microcontroller based bio-analyser 92 4.2.4 Software 93
4.3 Materials and Method 93 4.3.1 Measurement 94 4.4 Results and Discussion 95 4.4.1 Linearity and sensitivity 96 4.4.2 Precision 96 4.4.3 Recovery 96 4.4.4 Linear regression analysis 97 4.4.5 Statistical analysis 97
4.4.6 Interferences 97 4.5 Conclusion 97
CHAPTER – V ELECTRICAL CONDUCTIVITY AS A SURROGATE FOR CHLORIDE DETERMINATION 119-140
5.1 Introduction 119 5.1.1 Electrical Conductivity as a surrogate
for Chloride concentration 120 5.2 Agricultural Soil 120 5.3 Design and development of Electrical Conductivity Measurement set up using Microcontroller Atmega32 121
5.3.1 Design of the measurement system 121 5.3.2 AC modified Wheatstone bridge network 122 5.3.3 Microcontroller and interfacing circuit 123 5.3.4 Software 123
5.4 Materials and Method 124 5.4.1 Sampling Field 124 5.4.2 Sample Collection 124 5.4.3 Sampling procedure 125 5.4.4 Measurement 125 5.4.5 Development of regression Model 126
5.5 Results and Discussion 126 5.5.1 Analytical performance of the system 127 5.5.2 Analysis of Chloride concentration at various locations and plants 127 References 140
CHAPTER – VI COMPUTATION OF CHLORIDE IN ENVIRONMENTAL SAMPLES 141-171
Prediction of Chloride in soil samples using Artificial Neural Network 141
6.1 Introduction 141

6.2 Soil sampling 142 6.3 Implementation of Neural Network 142
6.3.1 Training phase 142 6.3.2 Validation of the developed Neural Network 143 6.3.3 Testing phase 143
6.4 Results and discussion 144 6.5 Prediction of Chloride in sea water
using Artificial Neural Network 154 6.5.1 Selection of input parameters 154
6.6 Sampling field description 154
6.6.1 Measurement 154
6.7 Back propagation Neural Network training 155
6.7.1 Genetic Algorithm based Back propagation Neural Network Training 155
6.7.2 Validation and testing pattern 156 6.8 Results and Discussion 157
6.8.1 Adaptiveness of the model 157 6.8.2 Comparison between the results obtained using Genetic and Back propagation algorithm 158 6.8.3 As an effective tool 158 6.8.4 Chloride influence for aquatic organisms 158
6.9 Conclusion 160 References 171
CHAPTER – VII PREDICTION OF RATE OF CORROSION USING CHLORIDE CONCENTRATION IN MILD STEEL 172-191
7.1 Introduction 172 7.2 Experimental procedures 174 7.2.1 Materials 174 7.2.2 Method - Rate of Corrosion by Weight Loss measurement 174 7.3 Explicit Neural Network formulations for Rate of Corrosion 174 7.3.1 Training Pattern 175 7.3.2 Validation of the proposed NN model 175 7.3.3 Testing Pattern 175
7.4 Results and Discussion 176 7.4.1 Performance of the developed model 176 7.4.2 Effect of Chloride content 176 7.4.3 Effect of pH and temperature 176
7.5 Conclusion 177 References 191
SUMMARY OF THE PRESENT WORK AND SUGGESTIONS FOR
FUTURE WORK 192-195
PUBLICATIONS

PREFACE
Chloride is one of the most eminent electrolytes required for all living cells. It is
abundant in nature and plays a vital role in biological and environmental samples. In
biological consideration, Chloride electrolyte is 70% of the body’s total negative ion
content, which is maintaining a proper balance of fluids inside and outside of human
body cells. It has a pivotal role in renal function, neurophysiology and nutrition. While
considering the environment, it influences greatly soil and sea water. Soil Chloride has
high degree of impact on plant growth and is readily taken up by the roots. It is essential
to the proper function of the plants stomatal openings and photosynthesis. It diminishes
the fungal infections of plants. Sea water contains naturally occurring Chloride which is
essential to the aquatic organisms that live there. In ocean, higher Chloride concentrations
can reduce the toxicity of Nitrite to aquatic life. In negative aspects, Chloride causes
corrosion on materials (Stainless steel, Mild steel and Concrete structures) which
produces cracks, blow holes and finally reduces the life span.
Because of the vital role of Chloride in biological and environmental samples, it
is aimed to perform the analytical studies by less expensive way. Previous research works
have suggested that the analytical method using embedded system to measure Chloride
anion in biological samples is very few. The computation of Chloride using Artificial
Neural Network (ANN) is also less compared to that of other analytical studies. Hence,
the research work is mainly focused on the evaluation of Chloride using the designed and
developed low cost embedded system in biological samples and computation of Chloride
using neural network in environmental samples.
This research report consists of seven chapters.
Chapter I explains the need for measuring Chloride electrolyte in biological and
environmental samples. It also delivers the various techniques used to measure the
Chloride electrolyte in various samples.

Chapter II presents the features of different microcontrollers used in this research
work. It also describes Artificial Neural Network and various algorithms, learning rules
related to the neural network.
Chapter III consists of the design and development of biomedical Analyser using
microcontroller P89C668 (Philips) to measure the human urinary Chloride and the
obtained results are analysed. The effect of hyperchloremia and hypochloremia are
discussed based on the results. The design and development of microcontroller
P89C51RD2 based instrument to find the concentration of Chloride in Oral Rehydration
Salts is also presented in this chapter. The recovery values of added Chloride ranged
from 98.13% to 99.15% with an average recovery of 98.42%, which indicates the
suitability of the designed instrument for bulk drugs and assay tests.
Chapter IV presents the design and implementation of Chloride analyzer to
measure Chloride in serum using the microcontrollers, (i) P89C668 (Philips) with
external peripherals, (ii) PIC16F877 (Microchip) with built in ADC, (iii) PSoC
(Programmable System on Chip- which integrates all the peripherals) - CY8C27443
(Cypress) with built in ADC, MUX, PGA etc. A comparative study has been made based
on the performance of three biomedical analysers using three microcontrollers. The
power consumption, processing time and analytical parameters of three embedded based
bio-analysers have been evaluated.
Chapter V explains the Electrical Conductivity measurement as a surrogate for
Chloride concentration measurement. The development of ATmega32 (Atmel)
microcontroller based Electrical Conductivity measurement set up has been explained.
The obtained results are compared with the EL1CO CM 180 conductivity meter to check
the accuracy of the designed instrument, which gives a correlation coefficient of R =0.98.
It is observed that the range of Electrical Conductivity of soil samples are varied from 45
to 109 mS/cm and the Chloride concentration is maximum at Ramarmadam, (1010 ppm)
and minimum at Kattuthottam (140 ppm), Tamilnadu, South India.
Chapter VI deals the Artificial Neural Network (ANN) with Back Propagation
Algorithm (BPA) to compute the Chloride concentration in soil samples. ANN has also
been used to compute the Chloride concentration in sea water samples using back
propagation algorithm neural network and Genetic Algorithm (GA) based back

propagation neural network. The training pattern consists of temperature (15 to 45° C),
pH (8.1 to 9.3) and Electrical Conductivity (25 to 34 mS/cm) as input parameters and
Chloride concentration as output parameter. The adaptiveness is checked for various
seasonal conditions by varying the input parameters.
Chapter VII presents the negative effect of Chloride concentration which induces
corrosion that reduces the life span of the materials. It explains the corrosion behavior of
mild steel in hydro chloric acid by weight loss measurements method is explained. The
rate of corrosion of mild steel at various aqueous environments by varying Chloride ion
concentration (HCl acid - 0.1N to 0.75 N), pH (0.12 to 1) and temperature (290K to
333K) is modeled by means of Artificial Neural Network is also presented in this chapter.
The summary of the present work along with the suggestions for the future
work are given in brief.

ACKNOWLEDGMENTS
I am deeply indebted to my Research Advisor, Dr.P.Neelamegam for his
guidance and kind encouragement throughout the course of my research work. His keen
interest and support are pivotal to the successful completion of my research.
I wish to thank Shriman.K. Thulasi Ayya Vandayar, Secretary and
Correspondent, A.V.V.M. Sri Pushpam College (Automonous), Poondi, Thanjavur.
I want to thank Dr.S.Chinnaian, Principal, A.V.V.M. Sri Pushpam College
(Automonous), Poondi, Thanjavur.
I owe my gratitude to Dr. A. Thayumanavan, Dean of Sciences and
Dr.P.Philominathan, Head of the Department and staff members, Department of
Physics, A.V.V.M. Sri Pushpam College (Automonous), Poondi, Thanjavur.
I wish to express my sincere thanks to the Doctoral committee members of my
research work, Dr.A. Venkatesan, Assistant professor, Department of Physics, Nehru
Memorial College, Puthanampatti and Dr.R. Radhakrishnan, Assistant professor,
Department of Physics, Jamal Mohamed College, Tiruchirappalli for all the fruitful
discussions and suggestions during the various stages of the work carried out.
I extend my sincere thanks to Dr.A.Rajendran, Assistant professor, Department
of Physics, Nehru Memorial College, Puthanampatti and Mr.R.Raghunathan,
Mr.K.Murugananthan and Mr.A.Jamaludeen for their constant interaction and
support.
I also deliver my heartfelt thanks to Mrs. N.Azhagusavithri and Mr.N.
Keerthivasan for giving a constant support during my research work.
Finally, I would like to express my thanks to my husband Mr.S.Sriram and my kid
S.Sree Krishniga for being my strength through the entire journey.
R.VASUMATHI

List of Publications
Papers Published in International Journals
1. Development of bio-analyzer for the determination of urinary Chloride –
R. Vasumathi, P. Neelamegam – Sensors & Transducers, 119, (8), 2010.
2. ATmega32 microcontroller based Conductivity measurement system as a
surrogate for Chloride estimation of soil samples - P. Neelamegam, R. Vasumathi
- Instrument and Experimental Techniques, Springer publications, No 6, 2010.
3. Measuring Chloride in serum using single Programmable System on Chip
(PSoC), P. Neelamegam, R. Vasumathi – Instrument and Experimental Techniques,
Springer publications, No 3, 2011.
4. Colorimetric determination of Chloride ion in Oral Rehydration Salts using
microcontroller P89C51RD2 - P. Neelamegam, R. Vasumathi – International Journal
of Pharmacy and Pharmaceutical Sciences, Vol 3, (2), 2011.
Papers Communicated to the Journals
1. Artificial Neural Network as a prediction tool for mild steel corrosion -
Communicated to International Journal of Pure and Applied Chemistry.
2. Prediction of Chloride in sea water of Tamil Nadu, India - Communicated to
Australian Journal of Basic and Applied Sciences.
Conference Attended/ paper presented
1. Paper presented in “National workshop on thin film preparation and
Characterisation techniques for energy conversion” 22-26th Nov 2004. Alagappa
University, karaikudi 630 003.
2. Poster presentation in “National symposium on instrumentation”
Cochin University of Science and Technology, Cochin. Nov 30th – Dec 2nd 2005.
3. Paper presented in “National conference on intelligent instrumentation”,
Department on Instrumentation Technology of Dayananda Sagar College of
Engineering, Bangalore. 7-8thApril 2006.
4. Paper presented in “5th International conference on trends in industrial
measurements and automation”, NIT, Trichy.Jan 4th-6th, 2007.


1
CHAPTER I
INTRODUCTION
Chloride is a vital mineral required for both human and animal life. All the living
things require a subtle and complex electrolyte balance between the intracellular and
extra cellular milieu. In particular, the maintenance of precise osmotic gradients of
electrolytes is important. Such gradients affect and regulate the hydration of the body,
blood pH, and are critical for nerve and muscle function. Various mechanisms exist in
living species that keep the concentrations of different electrolytes under tight control.
Both muscle tissue and neurons are considered electric tissues of the body. Muscles and
neurons are activated by electrolyte activity between the extra-cellular fluid or interstitial
fluid, and intra-cellular fluid. Electrolytes may enter or leave the cell membrane through
specialized protein structures embedded in the plasma membrane called ion channels.
Electrolytes are ions which are having electric charge. Positively charged ions are called
cations. Negatively charged ions are called anions. In physiology, the primary ions of
electrolytes are Sodium(Na+), Potassium (K+), Calcium (Ca2+), Magnesium (Mg2+),
Chloride (Cl−), Hydrogen phosphate (HPO42−), and Hydrogen carbonate (HCO3
−).
Among these, Chloride anion is an essential electrolyte for all living and nonliving
things. This chapter presents the roles of Chloride in biological and environmental
samples and the literature survey for the previous research work carried out is also
discussed.
1.1 Chloride
Chloride is a major mineral nutrient that occurs primarily in body fluids. It is a
prominent negatively charged ion of the blood, where it represents 70 percent of the
body’s total negative ion content. On average, an adult human body contains
approximately 115 grams of Chloride, making up about 0.15 percent of total body weight
[1]. The suggested amount of Chloride intake ranges from 750 to 900 milligrams (mg)
per day, based on the fact that total obligatory loss of Chloride in the average person is
close to 530 mg per day.

2
As the principal negatively charged ion in the body, Chloride serves as one of the
main electrolytes of the body. Chloride, in addition to Potassium and Sodium, assists in
the conduction of electrical impulses when dissolved in bodily water. Potassium and
Sodium become positive ions as they lose an electron when dissolved, and Chloride
becomes a negative ion as it gains an electron when dissolved. A positive ion is always
accompanied by a negative ion; hence there is close relationship between Sodium,
Potassium, and Chloride. Electrolytes are distributed throughout all body fluids including
the blood, lymph, and the fluid inside and outside cells [2]. The negative charge of
Chloride balances against the positive charges of Sodium and Potassium ions in order to
maintain serum osmolarity.
1.1.1 Pivotal roles of Chloride in human body
In addition to its functions as an electrolyte, Chloride combines with hydrogen in
the stomach to make hydrochloric acid—a powerful digestive enzyme responsible for the
breakdown of proteins, the absorption of other metallic minerals, and activation of
intrinsic factor, which, in turn, absorbs vitamin B12. Chloride is specially transported into
the gastric lumen, in exchange for another negatively charged electrolyte (bicarbonate) in
order to maintain electrical neutrality across the stomach membrane. After utilization in
hydrochloric acid, some Chloride is reabsorbed by the intestine, back into the
bloodstream where it is required for maintenance of extra cellular fluid volume [2]. For
Chloride is both actively and passively absorbed by the body, depending on the
current metabolic demands. A constant exchange of Chloride and bicarbonate between
red blood cells and the plasma helps govern pH balance and transport carbon dioxide, a
waste product of respiration, from the body. With Sodium and Potassium, Chloride works
in the nervous system to aid in the transport of electrical impulses throughout the body, as
movement of negatively charged Chloride into the cell propagates the nervous electrical
potential. Deficiency of Chloride results in a life threatening condition known as
alkalosis, in which the blood becomes overly alkaline.
1.1.2 Sources of Chloride
Healthier sources of Chloride include kelp (seaweed), ionic trace minerals, olives,
rye, tomatoes, lettuce, celery, beef liver, breads, salmon (canned), veal liver, cheese,

3
vegetables (canned), chicken liver, clams, dried beef, eggs, frankfurters, olives (green),
milk, oysters, peanut butter, table salt, tomato juice and turkey liver [3].
1.2 Roles of Chloride in biological samples
Measurement of urinary Chloride is most useful in the differential diagnosis of
persistent metabolic alkalosis [4]. Metabolic alkalosis can be classified as Chloride
responsive or resistant. Chloride responsive alkalosis is due to loss of hydrogen ion and
Chloride containing extra-cellular fluid, such as occurs with vomiting, nasogastric suction
and diuretic therapy. Chloride resistant alkalosis results from excessive secretion of
mineralcorticoid hormones, which causes bicarbonate reabsorption. The most common
causes are hyperaldosteroism, Cushing's syndrome, exogenous steroid administration,
licorice ingestion and alkali ingestion. The reference range for a 24 hour human urine
collection is 20-250 mmol/day.
The serum Chloride value is a concentration measurement (e.g., the amount of
Chloride/liter of plasma water). Therefore, the serum Chloride concentration can be
elevated above the normal range (98 - 108 mmol/l)—hyperchloremia—either by the
addition of excess Chloride to the Extra Cellular Fluid (ECF) compartment or by the loss
of water from this compartment, and vice versa. The serum Chloride concentration can be
reduced below the normal range—hypochloremia—by the loss of Chloride from the ECF
or the addition of water to this compartment. This means that one cannot evaluate total
body Chloride stores from the serum Chloride concentration. Clinical parameters must be
used in conjunction with serum Chloride values to assess the significance of
hypochloremia or hyperchloremia.
Hypochloremia is due to total body Chloride depletion through, extrarenal,
inadequate NaCl intake, losses of gastrointestinal fluids, vomiting, nasogastric suction,
small bowel fistulas, burns, renal, diuretic abusers, salt-losing nephropathy, interstitial
nephritis, adrenal insufficiency, increased effective circulatory blood volume, drugs and
nicotine.
Conditions associated with Hyperchloremia are fever, hyper metabolic states
increased ambient room temperature, inadequate water intake, loss of thirst perception

4
renal losses, central diabetes insipidus, nephrogenic diabetes insiuidos, early renal failure
and primary hyperparathyroidism.
1.3 Roles of chloride in environmental samples
1.3.1 Soil Chloride importance in plants
One of the Chloride influenced environmental samples is soil. Soil is defined as a
thin layer of earth's crust which serves as a natural medium for growth of plants. They
serve as a reservoir of nutrients and water for crops, provide mechanical anchorage and
favourable tilth. The components of soil are mineral matter, organic matter, water and air,
the proportions of which vary and which together form a system for plant growth. The
soil Chloride is readily taken up by the plants. The effect of Chloride, soil fertility and
plant nutrition on plant diseases has been the subject of numerous investigations over the
past two-decades.
Chloride is a nutrient which is important for plant growth. In the mid-1800's
Totingham, 1919 [5] reported that barley top dressed with NaCl (common table salt) is
helpful in stiffening straw and that Chloride is the active ingredient in this fertilizer. The
essentiality of Chloride for plant growth is confirmed during the 1950's. Broyer et al
(1954) [6] is generally considered to be the first study to demonstrate a requirement for
Chloride in higher plants. Growing Marglobe tomato plants in a hydroponic culture
depleted of Chloride, they found growth (dry matter production) is retarded up to 65%
compared to plants receiving adequate Chloride. Deficient plants resumed satisfactory
growth after Chloride is added to the nutrient solutions, or injected into the plants via a
hypodermic needle. Deficiency symptoms are characterized by wilting of leaflets in the
early stages, followed by chlorosis, bronzing, and necrosis in areas proximal to the
wilting. Following this initial study, Chloride requirement are demonstrated in number of
other plant species, including alfalfa, barley, bean, buckwheat, cabbage, carrot, corn,
lettuce, potato, squash, and sugarbeet (Ulrich and Ohki,1956; Johnson et al., 1957;
Ozanne, 1958; Gausman et al., 1958) [7, 8, 9, 10].

5
1.3.2 Yield and quality response of Chloride
Chloride deficiencies in plants generally occur in inland soils (Fixen, 1987) [11].
Substantial responses to Chloride containing fertilizers have been reported for different
crops in many parts of the world; e.g.,Coconut (Von Uexkull and Sanders, 1986) [12],
Corn (Heckman, 1995) [13], Kiwifruit (Smith et al., 1987) [14], Oil palm (Von Uexkull,
1990) [15], Potato (Gausman et al., 1958a) [16], Spring wheat and Barley (Fixen et al.,
1986; Engel et al., 1994) [17, 18], Tobacco (Li et al., 1994) [19], and sugarbeet (Zhou
and Zhang, 1992) [20]. Typical symptoms of Chloride deficiency include wilting of
leaves, curling of leaflets, bronzing and chlorosis similar to those seen with Mn
deficiency and severe inhibition of root growth (Ozanne et al., 1957 [21]; Smith et al.,
1987) [14].
The concentration range of Chloride deficiency in plants varies between 0.13 and
5.7 mg/g for spinach and sugarbeet respectively. In wheat, the Chloride concentration of
leaf tissue at heading is a good predictor of the response to Chloride fertilization (Engel
et al., 1998) [22]; the critical range is between 1.5 and 4 mg/g above which no further
response is expected.
In pot experiments, positive responses to Chloride at 100-200mg/kg soil are
reported for white potato, peanut, tomato and at 100-1600mg/kg soil for sugarbeet (Jing
et al., 1992) [23]. On a sandy loam soil, Chloride applications of up to 400kg/ha yielded
500- 1500kg/ha more corn gain than is obtained in the control (Heckman, 1995) [13].
Grain yields of corn are correlated positively with increases in Chloride concentrations in
the leaf ears. Yields of sugarcane fertilized with Ammonium Chloride exceeded or
equaled those of Ammonium Sulfate at 67-225 kg N/ha (about 170- 570 kg Cl/ ha) (Veda
Narayanan, 1990) [24].
1.3.3 Sea water Chloride importance in marine organism
“Life is evolved from water”[25]. The ocean holds all of the Chloride that we
need. Chloride is an essential element for aquatic and terrestrial biota, representing the
main extra-cellular anion in animals. Although Chloride is an essential element for
maintaining normal physiological functions in all aquatic organisms, elevated or
fluctuating concentrations of this substance can be detrimental. More specifically,
exposure to elevated levels of Chloride in water can disrupt osmoregulation in aquatic

6
organisms leading to impaired survival, growth, and/or reproduction. Because excess
Chloride is most frequently actively excreted from animal tissues via the kidneys or
equivalent renal organs to achieve osmoregulatory balance, the bioaccumulation potential
of Chloride is low.
Since 1977 Nitrite toxicity has been known to depend greatly on the salinity of the
water in which the Nitrite exposure took place (Crawford and Allen, 1977) [26].
Mortality in seawater occurred at Nitrite concentrations 50 to 100 times higher than in
fresh water (Crawford and Allen, 1977) [26]. The effect of Chloride on the toxicity of
Nitrite is now known to be so great that experiments in which Chloride concentrations are
not documented are of very low value because they cannot be meaningfully compared
with the results of other studies. According to Eifac (1984) [27] recommendation, it is
very important to monitor the Chloride-Nitrate ratio in aquaculture. The ratio of 17 and 8
is recommended for salmon and rough fish, respectively. In the case of Nile tilapia
(Oreochromis niloticus) health impairment without symptoms of toxicity, the ratios
ranged between 50 and 150 (Svobodova et al., 2005a) [28]. The experiments conducted
on rainbow trout and fathead minnow (Pimephales promelas) showed that the
relationship between Nitrite toxicity and Chloride concentration is linear (Russo and
Thurston, 1977; Palachek and Tomasso, 1984b; McConnell, 1985) [29, 30, 31]. Machova
et al. (2004) [32] also proved the linear relationship between lethal concentration and
Chloride concentration in water for ornamental fish (Poecilia reticulate). The most
sensitive species benefit from Chloride addition to the least extent although the benefit is
large even for sensitive fish (Lewis and Morris, 1986) [33].
Nitrite has an affinity for the active Chloride uptake mechanism by Chloride cells
in the gills (Maetz, 1971) [34]. Chloride cells excrete ammonia or H+ ions for Na+ ions
and bicarbonate (HCO3-) for Chloride ions (Love, 1980) [35]. Nitrite has affinity to
Chloride/ HCO3- exchanging. Part of Chloride demand is replaced by Nitrite when it is in
water. Fish with higher speed of Chloride uptake by gills (rainbow trout, perch, pike) are
more sensitive to Nitrites then fish with lower speed of Chloride uptake (eel, common
carp, tench) (Williams and Eddy, 1986) [36]. The competition between Chloride and
Nitrite ions transport across the gill membrane explains because the higher concentration
of Chloride protects fish against toxic impact of nitrite (Jensen, 2003) [37]. The positive

7
effect of Chloride for fish tolerance to Nitrites has been demonstrated in other studies in
fish (Svobodova et al., 1987; Hilmy, 1987; Atwood et al., 2001; Huertas et al., 2002;
Tavares and Boyd, 2003; Fuller et al., 2003) [38, 39, 40, 41, 42, 43] and for crayfish
(Jeberg and Jensen, 1994; Beitinger and Huey, 1981) [44, 45].
1.3.4 Chloride influence on Corrosion
In negative aspects, Chloride causes corrosion on steels and concrete. The
research field on evaluation of Chloride diffusion in concrete is growing with
consideration for diffusion, permeation [46] and binding capacity of Chloride ions [47,
48]. Recently, numerical techniques covering Chloride diffusion in partially saturated
condition [49], Chloride behavior in concrete with early-age cracking [50], and micro
structures formation modeling in high performance concrete [51, 52] are proposed based
on behavior in early-age concrete considering hydration and micro pore structure. The
most significant environmental condition which influences the pitting corrosion behavior
of austenitic stainless steels is the Chloride ion concentration to initiate corrosion-induced
deterioration [53]. Chloride ion causes local destruction of the passive film leading to
localised corrosion.
Since the Chloride electrolyte plays a vital role in biological and environmental
samples, measurement of Chloride is necessary. Classical research lines in the sensors
field have pursued the achievement of ever more selective devices towards a particular
chemical species, and at the same time sensitive to its lower concentrations. Several
analytical methods are available to estimate the Chloride concentration in various
samples.
From the Literature survey, it is observed that the various analytical methods used
for the determination of Chloride in biological sample of blood are iodometric procedure
(Geoffrey Arthur, D and Earl Judson King, 1936) [54], Potentiometry ISE (A. Scheipers
et al., 2001) [55], in serum are Direct potentiometry method (M. Panteghini et al., 1986)
[56], Rayleigh light scattering technique (Jing wen Chen et al., 2007) [57], Colorimetry
method (R.G. Schoenfeld et al.,) [58], Enzymatic assay method (Toehihlro Ono et al.,
1988) [59], Chloride ion selective electrode method (G. Dimeski and AE. Clague, 2004,
W.Hubl et al., 1994) [60, 61], Apple computer (Paul J.Taylor and Rosalie A. Bouska,
1988) [62], Cyclic voltametry (Kensuke Arai, 1996) [63], Flow injection analysis (S.

8
Alegret et al., 1988) [64], Optical sensors (Huber Christial et al., 2003) [65] in another
biological sample of urine are colorimetry (Katsuhiko Yokoi, 2002, Wilbur L. Reimers
and Robert M. Zollinger, 1951) [66, 67], Potentiometric method (P.H. Anderson, 1952)
[68], Screen printed silver strip sensor (2009) [69], in sweat by Electrochemical method
(Javier Gonzalo Ruiza et al., 2009) [70] and so on.
Considering the environmental sample of soil, the Chloride concentration is
determined using Electrical Conductivity measurement which can be used as a surrogate
for Chloride concentration (Hamid Zare Abyaneh et al.,2005) [71]. The measurement of
Electrical Conductivity has been made by four point probe method (Makoto Ishikawa et
al., 2006, S.P.S. Badwal et al., 1991) [72, 73], Analog interface (Diego Ramirez Munoz
and Silvia Casans Berga., 2005) [74], Microcontroller AT89C55WD (A. Rajendran and
P.Neelamegam., 2004) [75], Conducting sensors (X.Li et al., 2002) [76], Optimal
frequency range in aqueous solutions (Ferrara L. Callegaro and F. Durbiano, 2000) [77].
The effect of Chloride application in soil and influence on plants (Hiroyuki
Hattori et al., 2006, Karin wiggler et al., 2004) [78, 79], Effect of soil Chloride on
Cadmium concentration in sunflower kernels (Yin Ming Li et al., 1994) [80], on yield
quality of strawberry fruits (Mahmood Esna Ashari and Mansour Gholami, 2010) [81],
on wheat (Dr. W.M. Stewart, 2002, W.A. Norvell et al., 2000) [82, 83] have been
investigated.
From the Literature survey very few works have been done using embedded
system to perform the analytical studies which consists of Microcontroller, having many
peripherals on chip that reduces the cost, size and increases the reliability and
performance.
1.4 EMBEDDED SYSTEM
Modern analytical instruments generally employ one or more sophisticated
electronic devices such as op- amp, integrated circuits, ADC, DAC, counters,
microprocessors and computers. An embedded system is some combination of hardware
and software, either fixed in capability or programmable, that is specifically designed for
a particular function. Industrial machines, automobiles, medical equipment, cameras,
household appliances, airplanes, vending machines and toys (as well as the more obvious
cellular phone and PDA) are among the myriad possible hosts of an embedded system.

9
Embedded systems are controlled by one or more main processing cores that are typically
either microcontrollers or digital signal processors (DSP) [84]. The key characteristic,
however, is being dedicated to handle a particular task, which may require very powerful
processors. Since the embedded system is dedicated to specific tasks, design engineers
can optimize it to reduce the size and cost of the product and increase the reliability and
performance.
Physically, embedded systems range from portable devices such as digital
watches and MP3 players, to large stationary installations like traffic lights, factory
controllers, or the systems controlling nuclear power plants. Complexity varies from low,
with a single microcontroller chip, to very high with multiple units, peripherals and
networks mounted inside a large chassis or enclosure. Home automation uses wired- and
wireless-networking that can be used to control lights, climate, security, audio/visual,
surveillance, etc., all of which use embedded devices for sensing and controlling.
Characteristics
1. Embedded Systems are designed to do some specific task, rather than be a general
purpose computer for multiple tasks.
2. Embedded Systems are not always separate devices. Most often they are
physically built-in to the devices they control.
3. The software written for embedded systems is often called firmware, and is stored
in read-only memory or Flash memory chips rather than a disk drive. It often runs
with limited computer hardware resources: small or no keyboard, screen, and little
memory.
4. Safety: No harm to be caused.
5. Security: Confidential and authentic communication. Even perfectly designed
systems can fail if the assumptions about the workload and possible errors turn
out to be wrong.
6. Must be efficient:
Energy efficient
Code-size efficient (especially for systems on a chip)
Run-time efficient

10
Weight efficient
Cost efficient
7. Dedicated towards a certain application. Knowledge about behavior at design
time can be used to minimize resources and to maximize robustness.
8. Dedicated user interface. (No mouse, keyboard and screen)
9. Many embedded system must meet real-time constraints.
10. Frequently connected to physical environment through sensors and actuators.
1.5 ARTIFICIAL NEURAL NETWORK
In recent years, Artificial Neural Networks (ANNs) have been used successfully
in various fields like biology, Engineering, pattern recognition, financial analysis and so
on, because of their merits such as self learning, self adapting, good robustness and
capability of dealing with non- linear problems. The parallel and distributed structure of
Neural Networks along with their capabilities of generalization, fault tolerance, adaptive
and associative performance, ability to perform dynamic and real time functions and their
limited requirement of software, ensure their appropriateness for many practical
environmental applications.
Artificial neural network technique is particularly suited for the problem that
involves non-linear interpolation [85]. The basic advantage of ANN is that it does not
need any mathematical model; an ANN learns from examples and recognizes patterns in
input–output data without need for any prior assumptions about their nature and
interrelations. Ability to learn by example makes neural networks flexible and powerful
[86]. Provision of data error tolerance [87] and built-in dynamism makes an ANN model
more attractive.
Artificial Neural Networks have been used in waste water quality monitoring
(Ayan Hore et al., 2008) [88], urban storm water quality prediction (Daniel B. May and
Muttucumaru Sivakumar 2009) [89], to predict the dielectric constant – water content
relationship (Magnus person et al., 2002) [90], to estimate of biological oxygen demand
(Emrah Dogan et al., 2007) [91], to model Nitrate concentration river (Suen . JP et al.,
2003) [92], to predict the water quality parameters of Axio river, Northern Greece
(Diamond Poulou et al., 2005) [93] and to predict COD in waste water (Azedine Charef
et al., 2000) [94].

11
Artificial Neural Networks have been applied to predict the Rate of Corrosion in
stainless steels of nuclear reactor (Hilde M.G. Smets et al., 1995) [95], Mild steel in
acidic media (Wanlin wang and Michael L.Free, 2000) [96], steel 3 in Chloride solution
(Kiselev V.D et al 2006) [97], AISI type 316 L stainless steel (K.V.S. Ramana et al.,
2009) [98], Steel in concrete (Parthiban Thirumalai et al., 2005) [99], Mild steel in 1N
H2SO4, ( S.Saratha and V.G. Vasudha, 2009) [100], Stainless steel type AISI 304 L
(Mandal Sumantra et al., 2009) [101], Austenic stainless steel (H.M.G Smets and W.F.L.
Bogaerts, 1992) [102].
Several studies of corrosion analyses have been made in Chloride media, like
corrosion behavior of mild steel in HCl (Ehterum A. Noor et al., 2008) [103], the
prevention of corrosion of carbon steel in Chloride containing solution (Ayse Tosun and
Mubeccel ergun, 2006) [104], Corrosion performance of reinforcing bars embedded in
concrete structures exposed to Chloride environments ( David Trejoa et al, 2005) [105],
Chloride induced corrosion on steels and concrete (Shahzma J. Jaffer, 2009, GK.Glass
and NR. Buenfeld, 2000, A. O. James et al., 2007) [106, 107, 108] have also been
analysed.
In the present research work, ANN is used to compute the Chloride
concentration in environmental samples of soil, sea water and rate of corrosion of mild
steel.

12
1.6 SCOPE OF THE RESEARCH WORK
The Research work is undertaken for the evaluation of Chloride using the
embedded system and computation of Chloride using neural network in biological and
environmental samples.
The objectives of the Research work
To develop a biomedical analyser using Microcontroller P89C668 for measuring
urinary Chloride.
To analyse the effects of elevated Chloride concentration (hyper chloremia) and
low Chloride concentration (hypo Chloremia) in human body using the measured
urinary Chloride concentration.
To measure Chloride in serum using Microcontrollers, P89C668 (Philips),
PIC16F877 (Microchip) and PSoC-CY8C27443 (Cypress).
To investigate the performances of different Microcontroller based Chloride
analysers.
To determine the Chloride concentration in Oral Rehydration Salts (ORS) - a
pharmaceutical sample, using Microcontroller P89C51RD2.
To check whether the value of Chloride in ORS is within the limit of World
Health Organisation (WHO) certified values.
To explore the Chloride concentration in agricultural soil using the developed
Electrical Conductivity measurement set up.
To study the soil Chloride and its effects on plant growth using the observed
results.
To compute Chloride concentration in soil samples using Artificial Neural
Network with back propagation algorithm.
To predict the concentration of Chloride in sea water using ANN with back
propagation algorithm and Genetic Algorithm based back propagation neural
network.
To compute the Rate of corrosion in mild steel using a three layered neural
network model.
To explain the effect of Chloride, effect of pH and temperature on mild steel
using the computed results.

13
References
1. Wesson L.G., Physiology of the human kidney, New York, NY, Grune and Stratton,
(1969) 591.
2. Weast R.C., ed. CRC handbook of chemistry and physics, 67th ed. Boca Raton, FL,
CRC Press (1986).
3. Altschul A.M., Grommet J.K., Hypertension, 4(5Pt 2): III (1982) ,116-120.
4. Seldin D.W., Rector R.C Jr., The generation and maintenance of metabolic alkalosis.
Kidney Int., 1(1972), 306–21.
5. Tottingham W.E., J. Amer. Soc. Agron, 11(1919), 1-32.
6. Broyer T.C., Carlton A.B., Johnson A.B., Stout. P.R., Plant Physiol., 29(1954),
526-532.
7. Ulrich A ., Ohki K., Plant Physiol., 31(1956), 171-181.
8. Johnson C.M., Stout P.R., Broyer T.C., Carlton A.B., Plant Soil, 8(1957), 37-353.
9. Ozanne P.G., Nature, 182(1958), 1172-1173.
10. Gausman H.W., Corbett E.G., Struchtemeyer R.A., Agron. J., 50(1958), 403.
11. Fixen P.E., Crops Soils Manag., 39(1987), 14-16.
12. Von Uexküll H.R., Sanders J.L., (T.L.Jackson, ed.), Potash & Phosphate
Institute, Atlanta, Georgia., 2(1986),84-99
13. Heckman J.R. , Agron. J. 87(1995), 415-419.
14. Smith G.S., Clark C.J., Holland P.T., New Phytol., 106(1987), 71-80.
15. Von Uexkull H.R., Proceedings of the International Symposium on Balanced
Fertilization, China, (1990) 223-231.
16. Gausman H.W., Corbett E.G., Struchtemeyer R.A., Agron. J., 50(1958a), 403.
17. Fixen P. E., Gelderman R. H., Gerwing J., Cholick F. A., Agron. J., 78(1986)
664–668.
18. Engel S. A., Rumelhart D. E., Wandell B. A., Lee A. T., Glover G. H.,
Chichilnisky E. J., Nature, 369 (1994), 525.
19. Li L.T., Yuan D.H., Sun Z.J., J. Southwest Agric. Univ., 16(1994),
415-418. (Chinese)
20. Zhou B.K., Zhang X.Y. , Soil Fert. , 3(1992) 41-43. (Chinese)
21. Ozanne P.G., Woolley J.T., Broyer T.C., Aust. J. Biol. Sci., 10(1957), 66-79.

14
22. Engel R.E., Bruckner P.L., Eckhoff J. , Soil Sci. Soc. Am. J., 62(1998),
401-405.
23. Jing A.S., Guo B.C., Zhang X.Y. , Chin. J. Soil Sci., 33(1992), 257-259.
24. Veda Narayanan P.N., Handbook of Ammonium Chloride Fertilizer. McMillan,
India, (1990).
25. Selinus O. Essentials of Medical Geology. Elsevier Academic Press. Boston,
(2005).
26. Crawford R.E., Allen G.H., Transactions of the American Fisheries Society,
106( 1977), 105–109.
27. Water quality criteria for European freshwater fish: Report on nitrite and freshwater
fish ,EIFAC Technical Paper, 46(1984), 19.
28. Svobodova Z., Machova J., Poleszczuk G., Huda J., Hamackova J., Kroupova H.,
Acta Veterinaria Brno, 74(2005), 129–137.
29. Russo R.C., Thurston R.V., The acute toxicity of nitrite to fishes. In: Tubb R.A. (ed.):
Recent Advances in Fish Toxicity. EPA-600/3-77-085. US Environmental protection
Agency, Corvallis, OR., (1977), 118–131.
30. Palachek R.M., Tomasso J.R., Bulletin of Environmental Contamination and
Toxicology, 32(1984b), 238– 242.
31. McConnell R., Toxicity of nitrite to the fathead minnow. Colorado Department of
Health File Report, Denver, (1985).
32. Machova J., Kroupova H., Piackova V., Hamackova J., Valentova O.,
In :Ochrona zdrowiaryb-aktualne problemy., (2004), 275.
33. Lewis W.M., Morris D.P., Transactions of the American Fisheries Society,
115(1986), 183–195.
34. Maetz J, Philosophical Transactions of the Royal Society of London Series B
Biological Sciences, 262(1971), 209-249.
35. Love R.M., The chemical biology of fishes, vol.2, Academic Press, New York,
(1980).
36. Williams E.M., Eddy F.B., J. Comp. Physiol., B, 156(1986), 867–872.
37. Jensen F.B., Comparative Biochemistry and Physiology – Part A, 135-1(2003), 9-24.
38. Svobodova Z, Toxicology of Aquatic Animals., (1987), 231. (in Czech)

15
39. Hilmy A.M., EL-Domiaty N.A., Wershana K., Water, Air, Soil Pollut., 33(1987),
57-63.
40.Atwood H.L., Fontenot Q.C., Tomasso J.R., Isely J.J., N. Am. J. Aquacult.,
63-1(2001),49-51.
41. Huertas M., Gisbert E., Rodriguez A., Williot P., Castello-Orvay F., Aquatic
Toxicology, 57-4(2002), 257- 266.
42. Tavares L.H.S., Boyd C.E., J. World Aquacult. Soc., 34- 2 (2003), 217-222.
43. Fuller S.A., Henne J.P., Carmichael G.J, Tomasso J.R., N., Am. J. Aquacult., 65-2
(2003), 162-164.
44. Jeberg M.V., Jensen F.B., Aquatic Toxicology, 29(1994), 65-72.
45. Beitinger T.L., Huey D.W., Environ. pollut. ser. A, 29-4(1981), 305- 311.
46. Nagesh M., Bishwajit B., ACI Mater. J., 92(1998), 113–120.
47. Tang L., Division of Building Materials, Chalmers University of Technology,
Sweden (1996), 96-96.
48. Tang L., Nilsson L.O., Cem. Concr. Res., 23(1993), 347–353.
49. Maekawa K., Ishida T., Kishi T., J. Adv. Concr. Technol., 1(2003), 91–126.
50. Song H.W., Back S.J., Lee C.H., Kwon S.J., J. Restor. Build. Monum., 12-4(2006),
265–284.
51. Song H.W., Jang J.C., Saraswathy V., Byun K.J., Build. Environ. , 42-3(2007),
1358–1367.
52. Ishida T., Maekawa M., Rilem Proceedings PRO 29: Life Prediction and Aging
Management of Concrete Structures, (2003), 39–49.
53. Schiessl P., Raupach M., Corrosion of Reinforcement in Concrete. London: Elsevier
Applied Science, (1974), 83–92.
54. Geoffrey Arthur, Earl Judson King D., Biochem, (1936), 902-905.
55. Scheipers A, Wabmusa O., Sundermeier C., Eshold J., Analytica Chimica Acta,
439(2001), 29–38.
56. Panteghini M., Bonora R., Malchiodi A., Calarco M., Clin Biochem, 19-1(1986),
20-5.
57. Jing Wen Chen, Chun Sheng Yang, Feng Lian Ren, Jian Bo Xiao, Ming Xu ,
Meas. Sci. Technol, 18(2007), 2043

16
58. Schoenfeld R. G. , Lewellan C. J., Clinical Chemistry, 10(1964), 533-539.
59. Toehihlroono, Junichi Taniguchi, Hlroshi Mftsumalcl, Fujiya Takahata,
Akihiko Shibuya, Voehihiko Kasahara, Fusaya Koshlmlzu, Clinical Chemistry,
34(1988), 552-553.
60. Dimeski G., Clague AE., Clin Chem, 50(2004), 1106–1107.
61. Hubl W., Wejbora R., Shafti-Keramat I., Haider A., Hajdusich P., Bayer P.M.,
Clinical Chemistry, 40(1994), 1528-1531.
62. Paul J. Taylor, Rosalie A. Bouska, J Automat Chem, 10-1(1988), 10–14.
63. Kensuke Arai, Fumiyo Kusu, Naohito Noguchi, Kiyoko Takamura , Hisao Osawa,
Analytical Biochemistry, 240(1996), 109-113.
64. Alegret S., Alonso J., Bartroli J., Garcia-Raurich J., Martinez-Fàbregas E.J., J Pharm
Biomed Anal, 6(1988) , 749-55.
65. Huber Christian, Krause Christian, Werner Tobias, Wolfbeis Otto S., Microchim. Acta., 142(2003), 245-253. 66. Katsuhiko Yokoi , Biological Trace Element Research, 85(2002), 87-94.
67. Wilbur L. Reimers, Robert M. Zollinger, AMA Arch Surg, 63-1(1951), 70-77.
68. Sanderson P. H., J. Biochem. 52(1952), 502-505.
69. Mei-Hsin Chiu, Wan-Ling Cheng, Govindan Muthuraman, Cheng-Teng Hsu, Hsieh-
Hsun Chung, Jyh-Myng Zen, Biosensors and Bioelectronics, 24(2009), 3008–3013.
70. Javier Gonzalo-Ruiza, Roser Masa, Carmen De Haroa, Enric Cabrujaa, Rafael
Camerob, Asuncion Alonso-Lomilloc M., Javier Munoza F., Biosensors and
Bioelectronics, 24(2009), 1788– 1791.
71. Hamid Zare Abyaneh, Nazemi A.H., Neyshabori M.R., Mohammadi K.,
Majzoobi G. H., TarimBilimleri Dergisi ,11-1(2005), 110-114.
72. Makoto Ishikawa, Masamichi Yoshimura, Kazuyuki Ueda, e-J. Surf. Sci. Nanotech.
4(2006), 115-117.
73. Badwal S. P. S., Ciacchi F. T., Ho D.V., Journal of applied electrochemistry,
21 (1991), 721-728.
74. Diego Ramirez Munoz, Silvia Casans Berga, Measurement, 38(2005), 181– 187.
75. Rajendran.A, Neelamegam P., Measurement, 35(2004), 59–63.
76. Li X., Meijer G.C.M., 19th IEEE Instrumentation and Measurement Technology
Conference, Anchorage, AK, USA, May (2002).

17
77. Ferrara L., Callegaro F., Durbiano, 17th IEEE Instrumentation and
Measurement Technology Conference, Baltimore, May (2000).
78. Hiroyuki Hattori, Kouki Kuniyasu, Kaori Chiba, Mitsuo Chino, Soil Science & Plant
Nutrition, 52(2006), 89 – 94.
79. Karin Weggler, Michael J. Mclaughlin, Robin D. Graham, J. Environ. Qual.
33(2004), 496-504.
80. Yin-Ming Li, Rufus L. Chaney , Albert A. Schneiter, J. plant and soil, 167(1994),
275-280.
81. Mahmood Esna Ashari , Mansour Gholami, Journal of Fruit and Ornamental Plant
Research, 18-1(2010), 37-44.
82. Stewart W.M., “Chloride Fertilization of Wheat: Profit Waiting to Happen”,
Fertilization Facts, Fall (2002).
83. Norvell W.A., Wu J., Hopkins D.G., Welch R.M., Soil Science Society of America
Journal, 64(2000), 2162-2168.
84. Bill Giovino, "Microcontroller.com - Embedded Systems supersite".
http://www.microcontroller.com.
85. Sha.W, Edwards K.L., Mater Design, 28(2007), 1747.
86. Yilmaz Muharrem, Metin Ertunc H., Mater Design, 28 (2007), 599.
87. Guo Z., Malinov S, Sha W., Comput Mater Sci, 32(2005), 1.
88. Ayan Hore, Suman Dutta, Siddhartha Datta, Chiranjib Bhattacharjee, International
journal of Nuclear Desalination, 3(2008), 160-174.
89. Daniel B., Ma Y., Muttucumaru Sivakumar, Environmental Modelling & Software,
24(2009), 296-302.
90. Magnus Persson, Bellie Sivakumar, Ronny Berndtsson, Ole H.Jacobsen,
Per Schjonning, Soil Science Society of America Journal, 66(2002), 1424-1429.
91. Emrah Doğan, Rabia Köklü, Bülent Şengörür, International earthquake
symposium Kocaeli, (2007).
92. Suen J.P., Eheart, J.W., Asce M., Journal of Wat. Res. Plan. And Man, 129(2003),
505-510.
93. Diamonto Poulou M.J., Antonopoulos V.Z, Papamichail D.M., , European water,

18
11-12(2005), 55-62.
94. Azedine Charef, Antoine Ghauch, Patrick Bauss, Michel Martin-Bouyer,
Measurement, 28-3,(2000), 219-224.
95. Hilde M.G. Smets, Walter F.L. Bogaerts, Fuzzy Sets and Systems, 74(1995),
153-162.
96. Wanlin Wang, Michael L. Free, Anti Corrosion Methods and Materials, 50(3)
(2000), 186-192.
97. Kiselev V.D, Ukhlovtsev S. M, Podobaev, A. N, Reformatskaya, I., Protection of
Metals, 42(2006).
98. Ramana K.V.S., Anita T., Sumantra Mandal, Kaliappan S., Shaikh H., Sivaprasad
P.V., Dayal R.K., Khatak H.S., Materials and Design, 30(2009), 3770–3775.
99. Parthiban Thirumalai, Ravi R., Parthiban G.T., Srinivasan S., Ramakrishnan K.R.,
Raghavan M. , Corros Sci, 47(2005),625.
100. Saratha R., Vasudha V.G., E-Journal of Chemistry, 6-4(2009), 1003-1008.
101. Mandal Sumantra, Sivaprasad P.V., Venugopal S., Murthy K.P.N., Appl Soft
Computing, 9(2009), 237.
102. Smets H.M.G., Bogaerts W.F.L., Corrosion, (1992), 618~23.
103. Ehteram A. Noor, Aisha H. Al-Moubaraki, Int. J. Electrochem. Sci., 3(2008),
806 – 818.
104. Ayse Tosun, Mubeccel Ergun, G.U. Journal of Science, 19-3(2006),
149-154.
105. David Trejoa, Paulo J. Monteirob, Cement and Concrete Research,
35(2005), 562–571.
106. Shahzma J. Jaffer, Carolyn M. Hansson, Cement and Concrete Research, 39(2009),
116–125.
107. Glass G.K, Buenfeld N.R, Progress in Structural Engineering and Materials, 2(4)
(2000), 448-458.
108. Jamesb A. O., Oforkab N. C., Olusegun K. Abiolaa, Int. J.Electrochem. Sci.
2(2007), 278 – 284.


19
CHAPTER II
MICROCONTROLLERS AND ARTIFICIAL NEURAL NETWORK
This chapter explains the basic concept of measurement, microcontroller
architecture and various features of different Microcontrollers P89C668 (Philips),
PIC16F877 (Microchip), P89C51RD2 (Philips), ATmega32 (Atmel) and PSoC
CY8C27443 (Cypress) which are used to design the embedded based bio-analysers for
the study of Chloride in biological samples. It also explains the basics of Artificial Neural
Network, Back Propagation Algorithm and Genetic Algorithm which are employed in the
computation of Chloride in environmental samples.
2.1 Basic concept of Measurement
The measuring system can be considered to consist of three basic steps. (i) The
primary element that senses the quantity under measurement. (ii) The intermediated
means that modifies suitably the output of primary element and (iii) The end device that
renders for indication possible on a calibrated scale.
The primary element must sense and measure the quantity and sets the limit for
the subsequent finding or achievement. The accuracy of the measured value may be less
than the reality if handled by some intermediate systems. Whatever signal amplitude is
produced by a detector, it is processed in the processing module. After adequate
amplification, there is a decision to be taken about whether to carry out processing with
the signal still in analog form or to convert it to digital form by use of an A/D converter.
This conversion ordinarily given higher precision and accommodates to use
Microprocessors/ Microcontrollers/ Computers for further processing.
2.1.1 Microcontrollers
In this age of information technology it is hard to find a product around us that has
not been manufactured without the use of a computer in some form. While manufacturing
tools and processes are heavily dependent on computers for their control, smaller
appliances are more dependent on a smaller version of the computer. Termed as
microprocessors, these semiconductor devices are the heart of any computer. The
advances in microelectronics have led to the growth of single chip computers for a
variety of applications.

20
A microprocessor is a central processing unit fabricated on a silicon substrate. It is
the heart of every computer, laptop or server. The first portable embedded system built
using the Intel 4004 microprocessor was a calculator. Microprocessors are conventionally
programmed using assembly language. Assembly language refers to the list of
instructions provided to the microprocessor to perform arithmetic/logical operations on a
given set of data. Assembly language is usually converted to machine language, which
consists of binary numbers using software called the assembler. Based on the list of
machine language instructions, a microprocessor would perform the following
operations:
Arithmetic operations such as addition, subtraction, multiplication and division.
Logical operations like AND, OR, NOT, EXOR.
Transfer data between memory locations.
Decision control based on the results of the mathematical/logical operations.
The present trend in microprocessor architecture design is to implement 32 bit
ALU with in-built floating point math co-processors. Pipelined execution based on RISC
(Reduced Instruction Set Computer) architecture and special instructions based on CISC
(Complex Instruction Set Computer) designs are inter-mixed to deliver one billion
instructions per second. The availability of cache memory on the chip combined with
multi million transistors packed in silicon power the latest hand held computing
applications.
These microprocessors do not have built in memory, input or output functions
such as parallel ports or serial ports etc. They are optimized to provide only the raw
arithmetic and logic functions required by the operating system at the highest speed. All
other components required to make the computer such as memory, input/output ports,
serial, parallel, and mass storage are provided by external chips and devices. But a
Microcontroller contains its own memory, parallel ports, clock and very often a good
number of peripheral functions not found on a microprocessor.
A microcontroller consists of a microprocessor, memory and all input/output
peripherals on a single silicon chip. The microcontroller with software loaded in the
internal memory is commonly referred to as an embedded chip. An application such as
the cell phone implemented with the embedded chip as the heart of the system is termed

21
as an embedded system application. Figure 2.1 shows the block diagram of a
microcontroller.
The following features are usually included in the design for a microcontroller:
Arithmetic and logic unit
Memory for storing program
EEPROM memory for non-volatile data storage
RAM memory for storing variables and special function registers
Input-Output ports
Timers and counters
Analog to Digital converter
Circuits for reset, power up, serial programming, debugging
Instruction decoder and timing control unit
Serial communication port
The design for a microcontroller has evolved from the design of an embedded
system application using a microprocessor. In order to implement a small control system
with the microprocessor, peripherals such as timers, input ports, output ports and serial
communication driver hardware need to be interfaced. Over a period of time it has been
found that several control applications can be implemented with the same framework of
interfaces. With the advances in large scale integration of transistors, the microcontroller
evolved into its present form integrating these interfaces onto a single chip solution. But
all the microcontrollers will not have the same peripherals in it. Each one is from
different family and they have different peripherals with in it.
2.1.2 Microcontroller Peripherals
Read Only Memory (ROM): Read Only Memory (ROM) is a type of memory used to
permanently save the program being executed. The size of the program that can be
written depends on the size of this memory. ROM can be built in the microcontroller or
added as an external chip, which depends on the type of the microcontroller.

22
Random Access Memory (RAM): Random Access Memory (RAM) is a type of
memory used for temporary storing data and intermediate results created and used during
the operation of the microcontrollers.
Electrically Erasable Programmable ROM (EEPROM): The EEPROM is a special
type of memory not contained in all microcontrollers. Its contents may be changed during
program execution (similar to RAM), but remains permanently saved even after the loss
of power (similar to ROM).
Special Function Registers (SFR): Special function registers are part of RAM memory.
Their purpose is predefined by the manufacturer and cannot be changed therefore.
Program Counter: Program Counter is an engine running the program and points to the
memory address containing the next instruction to execute. After each instruction
execution, the value of the counter is incremented by 1.
Input/output ports (I/O Ports): In order to make the microcontroller useful, it is
necessary to connect it to peripheral devices. Each microcontroller has one or more
registers (called a port) connected to the microcontroller pins.
Oscillator: It is usually configured as to use quartz-crystal or ceramics resonator for
frequency stabilization. Accordingly, if the system uses quartz crystal with a frequency of
20MHz, the execution time of an instruction is not expected 50nS, but 200, 400 or even
800 nS, depending on the type of the microcontroller.
Timers/Counters: Timer is used to measure the time of the events. If the registers use
pulses coming from external source, then such a timer is turned into a counter.
Interrupt: In order to prevent the microcontroller from spending most of its time
endlessly checking for logic state on input pins and registers, an interrupt is generated. It
is the signal which informs the central processor that something attention worthy has
happened.
23
ADC: Analog to Digital converter is a device which converts the analog input into digital
number which is proportional to the magnitude of the analog input.
DAC: Digital to Analog converter is a device which converts a digital code to analog
signal.
PWM: Pulse Width Modulation is a commonly used technique for controlling power to
inertial electrical devices made practical by modern electronic power switches.
The demand from several industries for a variety of such interfaces with different
precision has resulted in several families of microcontrollers.
Accordingly there are 8 bit, 16 bit and 32 bit microcontrollers in the market today.
In addition to this there are several choices of packages starting from 6 pin
microcontrollers to around 156 pin implementations. The differentiation in the
microcontrollers would be in the presence of the number of I/O ports, availability of
multiple timers, precision of A/D converters and special functions like high speed serial
communications.

24
Figure 2.1 Block diagram of a Microcontroller

25
2.2 MICROCONTROLLER P89C668
Microcontroller P89C668 from ‘Philips’ is a single chip 8-Bit Microcontroller
manufactured in advanced CMOS process and is a derivative of the 80C51
microcontroller family. It contains a non-volatile 64 kbytes Flash program memory that is
both parallel programmable and serial In-System Programmable. It has the same
instruction set as the 80C51. It also has four 8-bit I/O ports, a multi-source, four-priority-
level, nested interrupt structure, an enhanced UART and on-chip oscillator and timing
circuits [1].
The microcontroller P89C668 has 80C51 Central Processing Unit, On-chip Flash
Program Memory and can be programmed by the end-user application (IAP) , Parallel
programmed with 87C51 compatible hardware interface to programmer, Speed up to 20
MHz with 6 clock cycles per machine cycle, Full static operation , RAM expandable
externally to 64 kbytes, 8 interrupt sources, Power control modes, Programmable clock
out and I2C serial interface.
The architecture of Microcontroller P89C668 is shown in figure 2.2.1. It
consists of Port0, Port1, Port2 and Port3, RAM, Register B, Accumulator, stack pointer,
ALU (Arithmetic and Logical Unit), PSW (Program Status Word), SFRs (Special
Function Registers), Timers, PCA (The Programmable Counter Array available on the
Microcontroller P89C668 is a special 16-bit Timer that has five 16-bit capture/compare
modules associated with it. Each of the modules can be programmed to operate in one of
four modes: rising and/or falling edge capture, software timer, high-speed output, or
pulse width modulator), Timing and control unit, Instruction register, Oscillator (XTAL1
and XTAL2 are the input and output, respectively, of an inverting amplifier. The pins can
be configured for use as an on-chip oscillator), program counter and Program Address
register.
The pin diagram of microcontroller P89C668 is shown in figure 2.2.2 and
their pin descriptions are explained in 2.2.1.

26
Figure 2.2.1 Architecture of Microcontroller P89C668

27
Figure 2.2.2 Pin diagram of Microcontroller P89C668
Pin Function Pin Function Pin Function
1 P1.5/CEX2 16 VSS 31 P0.6/AD6 2 P1.6/SCL 17 NIC* 32 P0.5/AD5 3 P1.7/SDA 18 P2.0/A8 33 P0.4/AD4 4 RST 19 P2.1/A9 34 P0.3/AD3 5 P3.0/RxD 20 P2.2/A10 35 P0.2/AD2 6 NIC* 21 P2.3/A11 36 P0.1/AD1 7 P3.1/TxD 22 P2.4/A12 37 P0.0/AD0 8 P3.2/INT0 23 P2.5/A13 38 VCC 9 P3.3/INT1 24 P2.6/A14 39 NIC* 10 P3.4/T0/CEX3 25 P2.7/A15 40 P1.0/T2 11 P3.5/T1/CEX4 26 PSEN 41 P1.1/T2EX 12 P3.6/WR 27 ALE 42 P1.2/ECI 13 P3.7/RD 28 NIC* 43 P1.3/CEX0 14 XTAL2 29 EA/VPP 44 P1.4/CEX1 15 XTAL1 30 P0.7/AD7

28
2.2.1 PIN DESCRIPTIONS
MNEMONIC
PIN NUMBER
NAME AND FUNCTION
VSS VCC P0.0–0.7 P1.0–P1.7 P2.0–P2.7 P3.0–P3.7 RST ALE PSEN
16 38 37–30 40–44, 1–3 40 41 42 43 44 1 2 3 18-25 5, 7–13 5 7 8 9 10 11 12 13 4 27 26
Ground: 0 V reference. Power Supply: This is the power supply voltage for normal, idle, and power-down operation. Port 0: Port 0 is an open-drain, bidirectional I/O port. Port 0 pins that have 1s written to them float and can be used as high-impedance inputs. Port 1: Port 1 is an 8-bit bidirectional I/O port with internal pull-ups on all pins except P1.6 and P1.7 which are open drain T2 (P1.0): Timer/Counter 2 external count input/Clockout T2EX (P1.1): Timer/Counter 2 Reload/Capture/Direction Con ECI (P1.2): External Clock Input to the PCA CEX0 (P1.3): Capture/Compare External I/O for PCA module 0 CEX1 (P1.4): Capture/Compare External I/O for PCA module 1 CEX2 (P1.5): Capture/Compare External I/O for PCA module 2 SCL (P1.6): I2C bus clock line (open drain) SDA (P1.7): I2C bus data line (open drain) Port 2: Port 2 is an 8-bit bidirectional I/O port with internal pull-ups. Port 2 pins that have 1s written to them are pulled high by the internal pull-ups and can be used as inputs. Port 3: Port 3 is an 8-bit bidirectional I/O port with internal pull-ups. Port 3 pins that have 1s written to them are pulled high by the internal pull-ups and can be used as inputs. RxD (P3.0): Serial input port TxD (P3.1): Serial output port INT0 (P3.2): External interrupt INT1 (P3.3): External interrupt CEX3/T0 (P3.4): Timer 0 external input; Capture/Compare External I/O for PCA module 3 CEX4/T1 (P3.5): Timer 1 external input; Capture/Compare External I/O for PCA module 4 WR (P3.6): External data memory write strobe RD (P3.7): External data memory read strobe Reset: A high on this pin for two machine cycles while the oscillator is running, resets the device. An internal diffused resistor to VSS permits a power-on reset using only an external capacitor to VCC. Address Latch Enable: Output pulse for latching the low byte of the address during an access to external memory. Program Store Enable: When executing code from the external program memory, PSEN is activated twice each machine cycle.

29
2.3 MICROCONTROLLER PIC16F877
The Microcontroller PIC16F877 from ‘Microchip’ is a low power, high
performance RISC CPU 8 bit microcontroller. Figure 2.3.1 shows the block diagram of
microcontroller PIC16F877. It consists of 8KW (Kilo Word) of flash programmable and
erasable memory together with 368 bytes of RAM. It has four I/O ports, Timer0(8 bit
timer/counter with 8bit prescaler), Timer1(16 bit timer/counter with prescaler), and
Timer2 (8 bit timer/counter with prescaler)two capture (capture is 16bit, maximum
resolution is12ns), compare (compare is 16 bit, maximum resolution is 200ns), PWM
modules (maximum resolution is 10 bit), synchronous serial port with SPI and I2C,
Universal synchronous asynchronous receiver, parallel slave port 8 bits wide, brown out
detection circuitry for brown out reset. It also consists of parallel ports, chip oscillator,
programmable code protection, 14 interrupt sources, 10 bit 8 channel A/D converter and
low power consumption [1].
The Microcontroller PIC16F877 has 100,000 erase/write cycle enhanced FLASH
program memory typical, 1,000,000 erase/write cycle data EEPROM memory typical,
Self-reprogrammable under software control, Fully static design, wide operating voltage
range (2 to 5.5v), commercial and industrial temperature ranges, Only 35 single word
instructions to learn, operating speed DC-20MHz clock input, DC-200ns instruction
cycle, In-circuit serial programming, Watchdog timer with its own on-chip RC oscillator
for reliable operation, Programmable code protection, Power saving SLEEP mode,
Selectable oscillator options and In-circuit debug via two pins.
The pin diagram of microcontroller PIC16F877 is shown in figure 2.3.2 and their
pin descriptions are explained in 2.3.1.

30
Figure 2.3.1 Block diagram of Microcontroller PIC16F877

31
Figure 2.3.2 Pin diagram of Microcontroller PIC16F877

32
2.3.1 PIN DESCRIPTIONS
Pin# Pin Name Description
1 ~MCLR 2 RA0/AN0 PORTA.0 /Analog Channel 0 3 RA1/AN1 PORTA.1 /Analog Channel 1 4 RA2/AN2 PORTA.2 /Analog Channel 2 5 RA3/AN3 PORTA.3 /Analog Channel 3 6 RA4/T0CK1 PORTA.4 / External Clock for Timer 0 7 RA5/AN4 PORTA.5 /Analog Channel 4 8 RE0/AN5 PORTE.0 /Analog Channel 5 9 RE1/AN6 PORTE.1 /Analog Channel 6 10 RE2/AN7 PORTE.2 /Analog Channel 7 11 Vdd +3 ~ +5V 12 Vss GND 13 OSC1/CLKIN Oscillator Connection /Clock In 14 OSC2/CLKOUT Oscillator Connection / Clock Out 15 RC0/T1CK1 PORTC.0 /External Clock for Timer 1 16 RC1/CCP2 PORTC.1 /CCP2 17 RC2/CCP1 PORTC.2 /CCP1 18 RC3/SCK/SCL PORTC.3 /SCK(for SPI)/SCL(for I2C) 19 RD0 PORTD.0 20 RD1 PORTD.1 21 RD2 PORTD.2 22 RD3 PORTD.3 23 RC4/SDI/SDA PORTC.4/SDI(for SPI)/SDA(for I2C) 24 RC5/SDO PORTC.5 /SDO (for SPI) 25 RC6/TX PORTC.6 /TX (for Serial Com.) 26 RC7/RX PORTC.7 /RX (for Serial Com.) 27 RD4 PORTD.4 28 RD5 PORTD.5 29 RD6 PORTD.6 30 RD7 PORTD.7 31 Vss GND 32 Vdd +3 V ~ +5 V 33 RB0/INT PORTB.0/External Interrupt 34 RB1 PORTB.1 35 RB2/PGM PORTB.2 /Programming Input 36 RB3 PORTB.3 37 RB4 PORTB.4 38 RB5 PORTB.5 39 RB6/PGC PORTB.6 /Debugger/ICSP 40 RB7/PGD PORTB.7 /Debugger/ICSP

33
2.4 MICROCONTROLLER P89C51RD2
A Single-Chip 8-Bit Microcontroller P89C51RD2 from ‘Philips’ is
manufactured in advanced CMOS process. Figure 2.4.1 shows the block diagram of
microcontroller. It contains a non-volatile 64kB Flash program memory that is both
parallel programmable and serial In-System and In-Application Programmable. In-
System Programming (ISP) allows the user to download new code while the
microcontroller sits in the application. In-Application Programming (IAP) means that the
microcontroller fetches new program code and reprograms itself while in the system.
This allows for remote programming over a modem link. The instruction set is 100%
compatible with the 80C51 instruction set. It also has four 8-bit I/O ports, three 16-bit
timer/event counters, a multi-source, four-priority-level, nested interrupt structure, an
enhanced UART and on-chip oscillator and timing circuits [1]. Boot ROM contains low
level flash programming routines for downloading via the UART, can be programmed by
the end-user application (IAP), 6 clocks per machine cycle operation (standard), 12
clocks per machine cycle operation (optional), Speed up to 20 MHz with 6 clock cycles
per machine cycle (40 MHz equivalent performance); up to 33 MHz with 12 clocks per
machine cycle, Fully static operation, Power control modes, Programmable clock out,
Second DPTR register, synchronous port reset, Low EMI (inhibit ALE) and
Programmable Counter Array (PCA) [1]. Figure 2.4.2 shows the pin diagram of
Microcontroller P89C51RD2 and their pin descriptions are given in 2.4.1.

34
Figure 2.4.1 Block diagram of Microcontroller P89C51RD2

35
Figure 2.4.2 Pin diagram of Microcontroller P89C51RD2

36
2.4.1 PIN DESCRIPTIONS MNEMONIC
PIN NUMBER
NAME AND FUNCTION
VSS VCC P0.0–0.7
P1.0–P1.7
P2.0–P2.7
P3.0–P 3.7
RST ALE
PSEN
EA/VPP
XTAL1 XTAL2
20 40 39–32
1–8 1 2 3 4 5 6 7 8 21–28 10–17 10 11 12 13 14 15 16 17 9 30 29 31 19 18
Ground: 0 V reference. Power Supply: This is the power supply voltage for normal, idle, and power-downoperation. Port 0: Port 0 is an open-drain, bidirectional I/O port. Port 0 is also the multiplexed low-order address and data bus during accesses to external program and data memory. Port 1: Port 1 is an 8-bit bidirectional I/O port with internal pull-ups on all pins except P1.6 and P1.7 which are open drain. As inputs, port 1 pins that are externally pulled low will source current because of the internal pull-ups. (See DC Electrical Characteristics: IIL). T2 (P1.0): Timer/Counter 2 external count input/Clockout (see ProgrammableClock-Out) T2EX (P1.1): Timer/Counter 2 Reload/Capture/Direction ECI (P1.2): External Clock Input to the PCA CEX0 (P1.3): Capture/Compare External I/O for PCA CEX1 (P1.4): Capture/Compare External I/O for PCA CEX2 (P1.5): Capture/Compare External I/O for PCA CEX2 (P1.5): Capture/Compare External I/O for PCA CEX3 (P1.6): Capture/Compare External I/O for PCA Port 2: Port 2 is an 8-bit bidirectional I/O port with internal pull-ups. As inputs, port 2 pins that are externally being pulled low will source current because of the internal pull-ups. (See DC Electrical Characteristics: IIL). Port 3: Port 3 is an 8-bit bidirectional I/O port with internal pull-ups. As inputs, port 3 pins that are externally being pulled low will source current because of the pull-ups. RxD (P3.0): Serial input port TxD (P3.1): Serial output port INT0 (P3.2): External interrupt INT1 (P3.3): External interrupt T0 (P3.4): Timer 0 external input T1 (P3.5): Timer 1 external input WR (P3.6): External data memory write strobe RD (P3.7): External data memory read strobe Reset: A high on this pin for two machine cycles while the oscillator is running, resets the device. In normal operation, ALE is emitted twice every machine cycle, and can be used for external timing or clocking. Note that one. ALE can be disabled by setting SFR auxiliary.0. With this bit set, ALE will be active only during a MOVX instruction. Program Store Enable: The read strobe to external program memory. When executing code from the external program memory, PSEN is activated twice each machine cycle. External Access Enable/Programming Supply Voltage: EA must be externally held low to enable the device to fetch code from external program memory locations. Crystal 1: Input to the inverting oscillator amplifier Crystal 2: Output from the inverting oscillator amplifier.

37
2.5 MICROCONTROLLER ATmega32
ATmega32 Microcontroller from ‘Atmel’ company is a high-performance, Low-
power AVR® 8-bit Microcontroller. The block diagram of microcontroller is shown in
figure 2.5.1. It has advanced RISC architecture, 31 Powerful Instructions, Most Single-
clock Cycle Execution,32 x 8 General Purpose, Working Registers, Fully Static
Operation, up to 16 MIPS Throughput at 16 MHz, On-chip 2-cycle Multiplier, High
Endurance Non-volatile Memory segments,32K Bytes of In-System Self-programmable
Flash program memory,1024 Bytes EEPROM, 2K Byte Internal SRAM [1]. It consists of
32 K Bytes in System Programmable Flash, one 16-bit Timer/ Counter and two 8-bit
Timer/ Counter, an eight Channel 10 bit ADC, 32 programmable I/O lines in four I/O
ports (Port A, Port B, Port C and Port D) and 2k Bytes of SRAM [1]. It has high
endurance non-volatile memory segments, In-System Programming by On-chip boot
program, True Read-While-Write Operation, JTAG Interface, On-chip analog
comparator, power-on reset and programmable brown-out detection, 40-pin PDIP, 44-
lead TQFP, and 44-pad QFN/MLF.
Figure 2.5.2 shows the pin diagram of Microcontroller ATmega32 and their pin
functions are explained in 2.5.1.

38
Figure 2.5.1 Block diagram of ATmega32

39
Figure 2.5.2 Pin diagram of Microcontroller ATmega32

40
2.5.1 PIN DESCRIPTIONS
VCC: Digital supply voltage.
GND: Ground.
Port A (PA7-PA0): Port A serves as the analog inputs to the A/D Converter. Port A also
serves as an 8-bit bi-directional I/O port, if the A/D Converter is not used. The Port A
output buffers have symmetrical drive characteristics with both high sink and source
capability.
Port B (PB7-PB0): Port B is an 8-bit bi-directional I/O port with internal pull-up
resistors (selected for each bit). The Port B output buffers have symmetrical drive
characteristics with both high sink and source capability.
Port C (PC7-PC0): Port C is an 8-bit bi-directional I/O port with internal pull-up
resistors (selected for each bit). The Port C output buffers have symmetrical drive
characteristics with both high sink and source capability. PC5 (TDI), PC3(TMS) and
PC2(TCK) will be activated even if a reset occurs. The TD0 pin is tri-stated unless TAP
states that shift out data are entered.
Port D (PD7-PD0): Port D is an 8-bit bi-directional I/O port with internal pull-up
resistors (selected for each bit). The Port D output buffers have symmetrical drive
characteristics with both high sink and source capability.
RESET:. A low level on this pin for longer than the minimum pulse length will generate
a reset, even if the clock is not running.
XTAL1: Input to the inverting Oscillator amplifier and input to the internal clock
operating circuit.
XTAL2: Output from the inverting Oscillator amplifier.
AVCC: It is the supply voltage pin for Port A and the A/D Converter. It should be
externally connected to VCC, even if the ADC is not used. If the ADC is used, it should
be connected to VCC through a low-pass filter.
AREF: It is the analog reference pin for the A/D Converter.

41
2.6 MICROCONTROLLER PSoC CY8C27443
Microcontroller PSoC (Programmable System on Chip) CY8C27443 from
‘Cypress’ consists of many mixed signal array with on-chip controller device. Figure
2.6.1 shows the block diagram of microcontroller ATmega32. It is a low cost single chip
programmable device with powerful Harvard Architecture processor. It has low power,
high speed, operating voltages down to 1.0V using On-chip Switch Mode Pump (SMP),
industrial temperature range: -40°C to +85° and 3.0 to 5.25V operating voltage. The 12
Rail-to-Rail analog PSoC blocks provides 14-Bit ADCs, 9-Bit DACs, Programmable
Gain Amplifiers (PGA) and Programmable Filters and Comparators. The 8 digital PSoC
blocks have 8- to 32-Bit Timers, Counters, PWMs, CRC and PRS Modules, 2 Full-
Duplex UARTs, Multiple SPI Masters or Slaves and Connectable to all GPIO Pins. The
precision, programmable clocking of PSoC has internal 2.5% 24/48 MHz Oscillator and
24/48 MHz with Optional 32 kHz Crystal. The flexible On-chip memory of PSoC has
16K flash program storage 50,000 Erase/ Write Cycles, 256 Bytes SRAM data storage
and In-System Serial Programming. Additional system resources of PSoC are I2C Slave,
Master, and Multi-Master to 400 kHz, Watchdog and Sleep Timers and User-
Configurable low voltage detection.
The PSoC consists of digital systems comprising of digital blocks and analog
systems comprising of analog blocks. Using the development tools, library elements can
be configured to provide analog functions (from Analog blocks), such as Programmable
Gain amplifiers, filters, ADCs with exceptionally low noise, input leakage and voltage
offset, DACs, comparators, Modulators, Correlators and Peak detectors. Digital
functions such as timers, counters, PWMs, SPI and UARTs can be configured from the
digital blocks of Digital systems. There is no other microcontroller that has
programmable voltage, instrumentational, inverting, and non-inverting amplifiers.
Hardware generators of pseudorandom and CRC code, as well as analog modulators, are
unique to PSoC families [1]. Figure 2.6.2 shows the pin diagram of Microcontroller PSoC
CY8C27443 and their pin functions are given in 2.6.1.

42
Figure 2.6.1 Block diagram of Microcontroller PSoC CY8C27443

43
Figure 2.6.2 Pin diagram of Microcontroller PSoC CY8C27443

44
2.6.1 CY8C27443 28-Pin PSoC Device Pin Pin Description No. Name 1 P0[7] Analog column mux input. 2 P0[5] Analog column mux input and column output. 3 P0[3] Analog column mux input and column output. 4 P0[1] Analog column mux input. 5 P2[7] 6 P2[5] 7 P2[3] Direct switched capacitor block input. 8 P2[1] Direct switched capacitor block input. 9 SMP Switch Mode Pump (SMP) 10 P1[7] I2C Serial Clock (SCL) 11 P1[5] I2C Serial Data (SDA) 12 P1[3] 13 P1[1] Crystal Input (XTALin), I2C Serial Clock (SCL) 14 Vss Ground connection. 15 P1[0] Crystal Output (XTALout), I2C Serial Data(SDA) 16 P1[2] 17 P1[4] Optional External Clock Input (EXTCLK) 18 P1[6] 19 Input XRES Active high external reset with internal pull down. 20 P2[0] Direct switched capacitor block input. 21 P2[2] Direct switched capacitor block input. 22 P2[4] External Analog Ground (AGND) 23 P2[6] External Voltage Reference (VRef) 24 P0[0] Analog column mux input. 25 P0[2] Analog column mux input and column output. 26 P0[4] Analog column mux input and column output. 27 I P0[6] Analog column mux input. 28 Vdd Supply voltage.

45
2.7 ARTIFICIAL NEURAL NETWORK
2.7.1 Introduction
Neural networks are being applied to an increasing large number of real world
problems. The human brain consists of about ten billion neurons and a neuron is, on
average, connected to several thousand other neurons. By way of these connections,
neurons both send and receive varying quantities of energy. One very important feature
of neurons is that they don't react immediately to the reception of energy. Instead, they
sum their received energies, and they send their own quantities of energy to other neurons
only when this sum has reached a certain critical threshold. The brain learns by adjusting
the number and strength of these connections. This biological fact is sufficiently powerful
to serve as a model for the neural net. The primary advantage of neural network is that
they can solve problems that are too complex for conventional technologies; problems
that do not have an algorithmic solution or for which an algorithmic solution is too
complex to be defined. In algorithmic approach, the computer follows a set of
instructions in order to solve a problem. Unless the specific steps that the computer needs
to follow are known, the computer cannot solve the problem. That restricts the problem
solving capability of conventional computers to problems that we already understand and
know how to solve. The versatility of the problems [2 - 5] in which Artificial Neural
Networks have been used are yielding promising results. ANN implementations have
been widely used over the last years on such applications as aerospace,
telecommunications [6], robotics [7], image processing [7, 8], applied mathematics [9,
10], financial analysis [11], intrusion detection systems and others.
The architecture of ANN (Figure 2.7) generally consists of three layers. An input
layer with input neurons, where the data are introduced, the hidden layer with hidden
neurons, where the data are processed and the output layer with output neurons, where
the results for the given inputs are produced. It also consists of weights between neurons,
a transfer function that controls the generation of output in a neuron, and learning laws
that define the relative importance of weights for input to a neuron [12]. Each neuron
receives a signal from the neurons in the previous layer, and each of those signals is
multiplied by a separate weight value. The weighted inputs are summed, and passed

46
through a transfer function which scales the output to a fixed range of values. The output
of the limiter is then broadcast to all of the neurons in the next layer. So, to use the
network to solve a problem, we apply the input values to the inputs of the first layer,
allow the signals to propagate through the network, and read the output values.
Figure 2.7 Architecture of Neural Network
2.7.2 Transfer Function
The behavior of an ANN depends on both the weights and the input – output
function (transfer function) that is specified for the units.
This function typically falls into one of three categories:
Linear: For linear units, the output activity is proportional to the total weighted output.
Threshold: For threshold unit, the output is set at one of two levels, depending on
whether the total input is greater than or less than some threshold value.
Sigmoid: For sigmoid units, the output varies continuously but not linearly as the input
changes. Sigmoid units bear a greater resemblance to real neurons than linear or
threshold units, but all three must be considered rough approximations.

47
2.7.3 Training of Artificial Neural Networks
A neural network has to be configured such that the application of a set of
inputs produces (either 'direct' or via a relaxation process) the desired set of outputs.
Various methods to set the strengths of the connections exist. One way is to set the
weights explicitly, using a priori knowledge. Another way is to 'train' the neural network
by feeding it teaching patterns and letting it change its weights according to some
learning rule.
We can categorise the learning situations in two distinct sorts. These are:
Supervised learning or Associative learning (Figure 2.8) in which the network is trained
by providing it with input and matching output patterns. These input-output pairs can be
provided by an external teacher, or by the system which contains the neural network
(self-supervised).
Figure 2.8 Training of Neural Network with supervised learning algorithm
Unsupervised learning or Self-organisation in which an (output) unit is trained to
respond to clusters of pattern within the input. In this paradigm the system is supposed to
discover statistically salient features of the input population. Unlike the supervised

48
learning paradigm, there is no a priori set of categories into which the patterns are to be
classified; rather the system must develop its own representation of the input stimuli.
Reinforcement Learning is another type of learning may be considered as an
intermediate form of the above two types of learning. Here the learning machine does
some action on the environment and gets a feedback response from the environment. The
learning system grades its action good (rewarding) or bad (punishable) based on the
environmental response and accordingly adjusts its parameters. Generally, parameter
adjustment is continued until an equilibrium state occurs, following which there will be
no more changes in its parameters. The self organizing neural learning may be
categorized under this type of learning.
Once the relationship between the input pattern and prediction is “learned”, an
expert system might be constructed around the neural network to provide a frame work
for the rules necessary to deduce the final prediction from the “interpreted” pattern. For
example the output from a neural network is numerical, not textural. These numbers need
to be translated into ‘n’ predictions. The rule based expert system provides for
incorporation of the rules needed to interpret the numerical output so as to present the
final predictions in a readily usable form.
Learning during the training stage consists of modifying the values of the synaptic
weights between neurons in such a way that ANN’s output confirms to the targets
suggested by the specific problem. Learning rules are the algorithms according to which
ANNs are trained. Unless the correlation between input data and desired outputs is high,
ANN will not converge [13]. Combining ANN architectures with different learning
schemes, results in a variety of ANN systems.
The neural network model having the steps of database collection, training of the
neural network which includes the choice of architecture, training functions, training
algorithm and parameters of the network; testing of the trained network and using the
network for prediction.

49
2.8 Back propagation algorithm (BPA)
The standard back propagation algorithm is the most thoroughly investigated
Artificial Neural Network algorithm. The success of this algorithm is solving large scale
problems critically depends on user specified learning rate and momentum parameters
and, there are no standard guideline for choosing these parameters.
When the training pattern is given, the network produces some output based on
the current state of it’s synaptic weights. This output is compared to the known output,
and a mean squared error is calculated. The error value is then ‘back propagated’ through
the network and small changes are made to the weights in each layer. The weight
changes are calculated to reduce the error signal. The cycle is repeated until the desired
output is reached. The learning process, or training, forms the interconnection between
neurons and is accomplished by known inputs and outputs, and presenting these to the
ANN in some ordered manner. Due to the interconnection, signals are sent from the
input layer to the output layer through the hidden layer. The intensity of the transmitted
signal is determined by the weight of the interconnections. It is used to properly obtain
the model by iteratively adjusting the values of interconnections between the neurons
while the sum of squared residuals between calculated and expected values are
minimized [14, 15]. The BPA is a supervised learning algorithm that aims at reducing
overall system error to a minimum.
2.8.1 Derivation for Back Propagation Algorithm
1. Propagates inputs forward in the usual way
All outputs are computed using sigmoid there holding of the inner product of the
corresponding weight and input vectors.
All outputs at stage n are connected to all the inputs at stage n+1.
2. Propagates the errors backwards by apportioning them to each unit according to the
amount of error.
Let, xj = Input vector for unit j (xji = ith input to the jth unit)
wj =Weight vector for unit j (wji = weight on xji)
zj = wj .xj , the weighted sum of inputs for unit j.

50
oj = Output of unit j. [oj = (zj)]
tj = target for unit ]
Downstream (j) = set of units whose immediate inputs include the outputs of j.
Outputs = set of output units in the final year.
To update the output for each training, let us consider the error can be denoted by E.
Now we have to calculate the value of for each input weight wji regardless of
where in the network unit j is located
= .
= ji
Furthermore, is the same regardless of which input weight of unit j we are trying to
update so we denote this quantity by δj
Consider the case when j outputs.
We know
Since the outputs of all units k j are independent of wji, we can drop the summation and
consider just the contribution to E by j.
δ j = =
=

51
=
=
=
Thus,
Now consider the case when j is a hidden unit Like before, we make the following two
important observations.
1. For each unit K downstream from j, zK is a function of zj
2. The contribution to error by all units l in the same layer as j is independent of
wji
We want to calculate for each input weight wji for each hidden unit j. Note that
wji influences just zj which influences Oj which influences zk downstream (j)
each of which influence E. So we can write,
Again note that all the terms except in the above product are the same regardless of
which input weight of unit j we are trying to update.
Like before, we denote this common quantity by j . Also note that
, , .

52
Substituting,
Thus,
Formal statement of the algorithm:
Back propagation (training examples, ,ni, nn , no).
Each training example in of the form < x, t >where x is the target vector.
rate (e.g. 0.05) ni nh, no, are number of input, hidden and output
nodes respectively. Input from unit I to unit j is denoted xji and its weight is denoted by
wji
Create a network with ni inputs, nh hidden units, and no output units.
Initialize all the weights to small random values (e.g.9 between – 0.05 and 0.05).
Until termination condition is met, Do.
For each training example < x, t >, Do
1. Input the instance x and compute the output ou of every unit.
2. For each output unit k, calculate
3. For each hidden limit h. calculate

53
4. Update each network weight wji as follows:
2.9 Genetic Algorithm
Genetic algorithms (GAs) are search algorithms based on the mechanics of
natural selection and genetics as observed in the biological world [16]. They use both
direction (``survival of the fittest'') and randomisation to robustly explore a function.
Importantly, to implement a genetic algorithm it is not even necessary to know the form
of the function; just its output for a given set of inputs (Figure 2.9).
Once a neural network model has been created, it is frequently desirable to use
the model backwards and identify sets of input variables which result in a desired output
value. The large numbers of variables and non-linear nature of many materials models
can make finding an optimal set of input variables difficult.
Figure 2.9 Genetic algorithm with inputs and output
Evolution - using genetic algorithms
To start with, it is necessary to encode the parameter set for a model into a
chromosome, Xi. This is a way of expressing the information that allows for various

54
forms of mutation to occur in the parameter set, and consists of a set of genes, [xi1, xi2,
xi3, xi4, ...]. This set of genes, when given to the model as inputs, will give the output fi.
The chromosomes are then ranked according to a fitness factor, Fi, describing how well
they perform relative to expectation and each other. The chromosomes are then allowed
to breed (with likelihood proportional to fitness) and mutate. In practice, evolution occurs
in two ways - crossover and random variation [17, 18]. In this example, mutation would
be represented by flipping a randomly chosen bit. In a neural network optimisation GA,
mutation would involve a small variation - plus or minus - in a randomly chosen gene.
To summarise, the procedures are:
1. Convert the chromosomes to a set of neural network inputs by combining them
with the fixed inputs.
2. Make predictions on each set of inputs, and convert the predictions and
uncertainties to fitnesses.
3. Rank the chromosomes by fitness.
4. Preserve the best chromosome (elitism).
5. Create new chromosomes by uniform crossover.
6. Create one new chromosome at random (within appropriate limits for each gene).
7. Mutate one randomly chosen gene in the entire population by adding or
subtracting a small amount (1% of the training database range for that input). If
the mutation makes the gene non-physical (less than zero in this case), set it to a
default physical value (zero in this case).
8. Return to (1) with the new population.
This Genetic Algorithm is used for the selection of Input nodes to get the best
predicted output.

55
References
1. www.datasheet.com.
2. Dayhoff J., DeLeo J., Cancer Supplement, 91- 8 (2001), 1615-1635.
3. Nayak R., Jain L., Ting B., Proc. 1st Asian-Pacific Congr. Computational Mechanics,
(2001), 887-892.
4. Perantonis S.J., Ampazis N., Varoufakis S., Antoniou G., Neural Processing Lett.,
l.- 7(1998), 5–14.
5. Huang D.S., Ma S.D., J. Intelligent Syst., 9(1999), 1–38.
6. Murillo-Fuentes J.J., González-Serrano F.J., Proc. of the IEEE Int. Conf. on
Acoustics, Speech, and Signal Processing (ICASSP’99). V(1999), 2575-2578.
7. Carnimeo L., Proceedings of the 3rd WSEAS Int.Conf. on Neural Network and
Applications, (2002), 107-111.
8. Rowley H., Baluja S., Kanade T., IEEE Transactions on Pattern Analysis and Machine
Intelligence, 20-1(1998), 23 – 38.
9. Kinderman L., Lewandowski A., Protzel P., Proc. Neural Information Processing,
ICONIP’01, 2(2001), 1075–1078.
10. Huang D.S., IEEE Transactions on Neural Networks, 15-2(2004), 477 – 491.
11. Papadourakis G.M., Spanoudakis G., Gotsiass A., Proceedings of 1st International
Workshop Neural Networks in the Capital Markets, (1993).
12. Suen, J.P., Eheart J.W., Asce M., Journal of Wat. Res. Plan. And Man, 129(2003),
505-510.
13. Anderson D., McNeil G., Kaman Science Corporation, (1992).
14. Kartalopoulos, S.V, Understanding Neural Networks and Fuzzy Logic- Basic
Concepts and Applications, Prentice Hall, New Delhi, ( 2000).
15. Ramana K.V.S, Anitha T., Sumantra Mandal, Kaliappan S., Shaikh H., Sivaprasad
P.V., Dayal R.K., Khatak H.S., Materials and design, 30(2009), 3770-3775.
16. Goldberg D.E., Genetic algorithms in search, optimisation, and machine learning.
Addison Wesley, 1989.

56
17. Shah I., Tensile Properties of Austenitic Stainless Steel, I. Shah, M.Phil. Thesis,
University of Cambridge. (2002)
18. Delorme A., Genetic Algorithm for Optimization of Mechanical Properties,
Technical report, University of Cambridge.(2003)


57
CHAPTER III
MEASUREMENT AND ANALYSIS OF CHLORIDE IN BIOLOGICAL
SAMPLES
This chapter presents the basic principle, design and development of
microcontroller P89C668 based bio-analyser to measure Chloride concentration in human
urine samples. The performance of the developed instrument is investigated by analytical
parameters and the results obtained which includes high (hyperchloremia) and low urine
chloride (hypochloremia) is also discussed. This chapter also explains the measurement
of concentration of Chloride in pharmaceutical sample of Oral Rehydration Salts using
the microcontroller P89C51RD2 based Chloride analyzer. The results are verified with
the WHO (World Health Organisation) certified values and it is found that the values are
well agree with the charted values.
3.1 Renal Physiology
Urine is a liquid product of the body that is secreted by the kidneys by a process
called urination and excreted through the urethra. Cellular metabolism generates
numerous waste compounds, many rich in nitrogen that require elimination from the
bloodstream. This waste is eventually expelled from the body in a process known as
micturition, the primary method for excreting water-soluble chemicals from the body.
These chemicals can be detected and analysed by urinalysis. Amniotic fluid is closely
related to urine, and can be analyzed by amniocentesis. A typical nephron, the functional
unit of the kidney is composed of a capillary bed for filtration, called the glomerulus and
tubule segments located in the cortex and medulla of the kidney. Chloride is both actively
and passively transported in various segments of the tubules. The kidneys are responsible
for the maintenance of total body Chloride balance. Several studies have suggested that
the Chloride ion may play a more active and independent role in renal function,
neurophysiology and nutrition. Body Chloride concentrations are regulated by excretions,
primarily via the kidneys [1, 2]. Normal urine density or specific gravity values vary
between 1.003–1.035 (g cm−3) and any deviations may be associated with urinary

58
disorders [3]. The presence of specific clinical disorders can affect the ability of the
kidneys to maintain Chloride balance. The result is hyperchloremia or hypochloremia.
Colorimetry is one of the simplest and best techniques, which is widely used for
the clinical routine assays compare to that of other analytical methods. It requires the
maintenance, portable and allows on-site testing. The amount of sample required is small.
If a unit cell is utilized through which light is passed, it is generally simple, little in size
and low in cost. Sample testing in the laboratory can take minutes to hours for sample
preparation testing to be run, but colorimetry using hand-held devices can take minutes or
even seconds to run. Hence, an attempt is made to develop a simple, accurate and low
cost embedded based bio-medical analyser based on colorimetry principle.
3.1.1 Colorimetry principle
According to this principle, a colorimeter measures the intensity of light shining
through a coloured solution compared to the intensity of light passing into the solution.
A detector measures the transmittance (T) (% of light passing through) of the solution.
This is mathematically converted to absorbance (A= -log 10 T). The absorbance is
directly proportional to the concentration (Beer-Lambert law) [4, 5]. Beer’s law describes
that the plot of absorbance ‘A’ against concentration, a straight line passing through the
origin should be obtained. The presence of small amount of colorless electrolytes, which
do not react chemically with the colored components, normally does not affect the light
absorption.
3.1.2 Proportionality between color and concentration
For, colorimeters, it is important that color intensity should increase linearly with
concentration of the compound to be determined. This is not necessary for photoelectric
colorimeters or spectrophotometers. Since, a calibration curve may be constructed
relating the instrumental reading of the color with the concentration of the solution. It is
desirable that the system follows Beer’s law even when photoelectric colorimeters are
used.

59
3.1.3 Stability of the color and clarity of the solutions
The color produced must be stable so as to allow accurate readings to be taken.
The periods over which maximum absorbance remains constant must be long enough for
precise measurement to be made. The solution must be free from precipitate if
comparison is to be made with a clear standard. Turbidity scatters as well as absorbs the
light.
3.1.4 Analytical studies of the Instrument system
The following parameters are the important analytical factors to be considered for
the instrument analytical performance.
(i) Accuracy and precision
The accuracy and precision of colorimetric method instrument set up depends on
three major factors.
a) Instrumental limitations
b) Chemical variables
c) Operator’s skill
Instrumental limitations are often determined by the quality of the instruments,
optical, mechanical and electronic systems. Chemical variables are determined by purity
of standards, reagents and reaction rates. These factors are usually determined by the
methodology chosen for the analysis. Under ideal conditions it is possible to achieve
relative standard deviations in concentrations as low as about 0.5%, which enables the
determination of micro quantities of components.
The precision of colorimetric method also depends on concentration of the
determinant. Visual methods generally give results with a precision of 1-10%. The
precision of the method is of course, higher and varies from 0.5 – 2% under suitable
measuring conditions.
Precision describes the reproducibility of results where accuracy denotes the
nearness of a measurement to its accepted value. The precision attainable is a function of
the absorbance measured. The error observed is, as expected very large on lower side of
concentrations. When intensely colored solutions are measured, only an insignificant
part of the radiation is transmitted and on logarithmic absorbance scale the gradations are
so close that the reading error is very high.

60
Precision is conveniently expressed in terms of the average deviation from the
mean or in terms of standard deviation. The standard deviation is the most reliable
estimate of the indeterminate uncertainty. When the standard deviation turns out to be
approximately proportional to the amount present in the formation on the precision can
be expressed in percent by using the coefficient of variation. Mathematical equation for
the coefficient of variation is
C.V = S × 100 / x
Where s – standard deviation
x - Arithmetic mean of a series of measurement.
(ii) Detection Limit
Detection limit is the smallest concentration of a solution of an element that can
be detected with 95% certainty [6, 7]. This is the quantity of the element that gives a
reading equal to twice. The standard deviation of a series of any least ten determinations
taken with solutions of concentrations are close to the level of the blank. Several
approaches for determining the detection limit are possible, depending on whether the
procedure is a non – instrumental or instrumental. Based on the standard deviation of the
bland samples and the slope of the calibration curve of the analyte, the detection limit (D)
may be expressed as:
D = 3.3σ / S
Where σ – standard deviation of the reagent blank.
S- Slope of the calibration curve.
The slope S may be estimated from the calibration curve of the analyte. The estimate of
σ may be measured based on the standard deviation of the reagent blank.
(iii) Comparison of the Results
The comparison of the values obtained from a set of results with either a) the true
value or b) other sets of data makes it possible to determine whether the analytical
procedure has been accurate and / or precise, or if it is superior to another method. There
are two common methods for comparing results: i) t- Test [8, 9] and ii) the variance test
[F-test].

61
(a) t- Test: t- test is used to compare the mean from a sample with some standard values
and to express some level of confidence in the significance of the comparison [9]. It is
also used to test the difference between the means of the two sets of data.
(b) F- test: F – Test is used to compare the precisions of two sets of data of two different
analytical methods are calculated from the following equations [8, 9].
F= SA2 / SB
2
The larger value of S is always used as the numerator so that the value of F is
always greater than unity. The value obtained for F is then checked for its significance
against values in the F- table calculated from the F-distribution [8, 9] corresponding to
the numbers of degrees of freedom for the two sets of data
(iv) Linear regression analysis
Linear Regression Analysis attempts to model the relationship between two
variables by fitting a linear equation that closely fits a collection of data points. All the
points fall into the linear range, and there is sufficient precision in the data to continue
with the linearity study. There will be no outliner for the data sets. The strength of the
linear association between two variables is quantified by the correlation coefficient. The
regression line equation arrived is,
y - y = bxy ( x – x )
Where bxy = r (σx / σy ); x and y are data sets.
x and y are mean of the σx and σy are standard Deviation of the data sets.
(v) Recovery
Recovery is the test performed to check the reproducibility of the instrument. It is
performed by adding the known concentration solution with the known concentration
sample. The resultant concentration should be the addition of those two concentration
values.
(vi) Quantification limit
The quantification limit is generally determined by the analysis of samples with
known concentrations of analyte with those of blank samples and by establishing the
minimum level at which the analyte can be quantified with acceptable accuracy and
precision [10, 11]. Based on the standard deviation of the blank samples and the slope of
the calibration curve of the analyte, the quantification limit (QL) may be expressed as:

62
QL = 10 σ / S
Where σ – the standard deviation of the reagent blank
S – the slope of the calibration curve.
The slope S may be estimated from the calibration curve of the analyte. The estimate of
σ may be measured based on the standard deviation of the reagent blank.
3.2 Measurement of Chloride in human urine using Microcontroller P89C668
3.2.1 System Architecture
The functional block diagram of Microcontroller based Instrument set up to
measure and analyse urinary Chloride with different blocks is shown in figure 3.1. Light
Emitting Diodes (LEDs) as quasi monochromatic light source have been used for
absorbance measurements. Block 1 represents Green LED, which acts as an illumination
source with a dominant wavelength of 480nm. It optically illuminates the sample solution
to measure the Chloride concentration. The photo detection assembly is well insulated
from outer light. Block 2 indicates the sample holder to hold the solutions of blank,
standard, and sample solution tube with a diameter of 1cm. Block 3 is a Photo Diode
GASPG1124 used to detect the amount of light falling on the sample, which acts as a
photo detector. This ideal detector has the characteristics of long term stability, short
response and high sensitivity to allow the detection of low level radiant energy [12]. The
output signals are fed to op-amp LM108 which is kept in Block 4. The LM108 is a
precision operational amplifier from National semiconductor having maximum input bias
current of 3.0 nA, Offset current less than 400 pA and supply current of only 300 μA.
The temperature sensor LM35D kept in Block 5 is a precision semiconductor temperature
sensor giving an output of 10mV per degree centigrade. It is capable of measuring
temperature between +2°C and +100°C. The output is proportional to degree centigrade.
It has low current drain and low self-heating. Block 6 indicates the multiplexer CD4051
to receive the signals from the op-amp and the temperature sensor. Block 7 is heater
controller to control and maintain temperature at 37°C for the incubation of sample. ADC
MCP3201 is represented by the Block 8 to convert Analog to Digital values [13]. IC
MCP3201 is a successive approximation type 12 bit serial A/D converter compatible with
the SPI protocol, sample rate of 100ksps at clock rate of 1.6 MHz and operates over

63
broad voltage range of 2.7-5.5 V. The Microcontroller P89C668, which is kept in Block
9, reads data from ADC for processing. Block 10 represents the keypad to give data for
processing and to compute the Chloride concentration. Block 11 is LCD, used to display
the output of microcontroller (Chloride concentration in Urine samples) [14]. The data
are transmitted from the microcontroller to the computer represented by Block 13 via
RS232 denoted by Block 12.
3.2.2 Instrumental
The microcontroller P89C668 and interfacing circuit to measure urinary Chloride
is shown in figure 3.3. Signal conditioning circuit which is used to isolate, convert and to
amplify the transducer signals is shown in figure 3.2. The photo diode used as a sensor is
connected to the input of op-amp LM108 to measure the amount of light absorbed by the
sample. The current output signal from the photo diode is converted to voltage. The
voltage output of op-amp is connected to the pin 13 of multiplexer CD4051. The
temperature sensor LM35D used to measure the temperature of the sample is connected
to the pin 14 of CD4051 (figure 3.2). The multiplexer (pin 3) is connected to pin 2 of
ADC MCP3201, to convert analog signals to 12 bit digital value. The pin 10 (A) and 11
(B) of multiplexer are connected to pin 18 (P2.0) and 19 (P2.1) of Microcontroller
P89C668 to select either temperature or absorbance of solution. The ADC is interfaced
with pin 42, 43, 44 of Microcontroller P89C668 to convert analog voltage into
corresponding digital values for processing and to compute urinary Chloride
concentration. The heater controller circuit is connected to pin 23 (P2.5) of
microcontroller and it is implemented with opto isolator (IC MOC3041), Triac
(GDA40AT6), to control and maintain the Temperature of sample at 37ºC. A special zero
crossing detector circuit in the optocoupler ensures that the connected triac is only
triggered when the alternating mains voltage goes through zero. During zero crossing
time, commands are given to the heater circuit to switch on/off. Hence, the desired
temperature is achieved. The opto isolator IC MOC3041 (Global suppliers of opto
electronic solutions) has a reverse leakage current of 10 μA, forward voltage of 1.5v and
LED triggering current of 30mA. The triac BTA126 has on-state RMS current of 40
amps and storage temperature range of -40 to 125 ºC. A keypad is interfaced with Port2

64
of the microcontroller as shown in figure 3.3. The LCD is interfaced to display the
results. The data lines (D7 to D0), RS (Register Select) and EN (Enable) of LCD are
connected with Port 0 and Port 3 of microcontroller as shown in figure 3.3. Data from
microcontroller is transferred to PC for further processing through the TXD and RXD
lines of the microcontroller by interfacing RS232 peripheral to achieve the necessary
level shifting for communication between PC and microcontroller. After the power on
reset the program will be executed from memory address 0000 onwards. A 24C16
EEPROM (Electrically Erasable Programmable Read Only Memory) of 16k bit is
interfaced with microcontroller to store the patient i.d and test result (Chloride
concentration). The 24C16 features a low power standby mode which is enabled, upon
power-up and after the receipt of the STOP bit and the completion of any internal
operations. It is a low cost and low voltage 2 wire serial EEPROM. The SCL (Serial
Clock Line) is connected to pin 2 and the SDA (Serial Data Line) is connected to pin 3 of
the microcontroller so that the data can be transmitted and received.
3.2.3 Software
Using C language, software is developed to configure the serial and parallel port to
read data from keyboard, to initialize LCD, to initialize timer1 interrupt, to initialize
enable interrupt, to select light intensity or temperature using multiplexer, to start A/D
conversion, to receive 12 bit data from A/D converter for temperature and light intensity,
to measure and control the temperature for incubation, to measure the voltages for blank,
standard, and sample solutions, to compute absorbance and hence concentration, to store
the data, and to display user information and the results (Keil software is used for the
development of programs). The flowchart for performing the above tasks is shown in
figure 3.4.
3.3 Materials and Method
Samples are collected from the patients whose urinary Chloride has to be
measured. Urine specimen is collected in a container without preservative. The samples
are maintained at 37°C temperature. The solution of blank, standard and sample are
prepared to measure the concentration of electrolyte.

65
3.3.1 Principle of color complex
Chloride is mixed with a solution of undissociated mercuric thiocyanate, the
Chloride preferentially combines with the mercury to form mercuric Chloride. The
thiocyanate that is released combines with ferric ions present in the reagent to form ferric
thiocyanate, which can be measured spectrophotometrically. The mercuric nitrate binds a
fixed amount of Chloride ion and therefore makes them unavailable for reaction with
mercuric thiocyanate. Only the Chloride present in excess of that bound by the mercury
from mercuric nitrate is reacted with mercuric thiocyanate and produced a color complex
(red ferric thiocyanate) that absorbs light at 480 nm. According to Beer-Lambert’s law,
the intensity of the color produced is directly proportional to the Chloride concentration.
[15].
2Cl- + Hg(SCN)2 HgCl2 + 2SCN- (1)
3SCN- +Fe +++ 4Fe (SCN)++ + (2)
3.3.2 Reagents
Two reagents R1 and R2 are used in this method. The reagent R1 consists of
mercuric thiocyanate (2m mol/l), ferric nitrate (20m mol/l) and nitric acid (29m mol/l).
The reagent R2 is Chloride standard solution [16, 17]. All the solutions are prepared in a
well cleaned dried test tube of same diameter. Blank solution is prepared by mixing 1 ml
of reagent R1 with 10 µl of distilled water. To prepare standard, 1 ml of reagent R1 is
added with 10 µl of standard (R2). For sample preparation, 1 ml of reagent R1 is added
with 10 µl of urine sample. The above solutions are thoroughly mixed and left for
incubation for 5 min at 37 ° C, before the absorbance is measured at 480nm.
3.3.3 Measurement
The test tube labeled blank is placed in a sample holder and the measured voltage
is noted as Vo. By holding the standard solution test tube in a sample holder, the voltage
Vstd is taken. To find the absorbance of sample solution, the sample solution is placed in
a sample holder and voltage measured is noted as Vt. The concentration of urinary
Chloride is determined using the formula,
Concentration of Chloride ion = log (Vo/Vt) / log (Vo/Vstd) x 100 (3)

66
Where, log (Vo/Vt) = Absorbance of sample, log (Vo/Vstd) =Absorbance of standard
100 is the concentration of standard Chloride.
The concentrations of urinary Chloride measurements are made for 40 urine
samples using the developed instrument. The same urine samples are tested using the
commercial clinical analyser. The absorbance of sample solution is measured and
repeated for five times to check the reproducibility.
3.4 Results and Discussion
The performance of the Microcontroller P89C668 based electrolyte bio-analyser
using colorimetry principle is investigated by comparing its results with the results
obtained by other clinical analyser (ST 100 analyser) which is given in table 3.1. It can
be seen that there is no obvious difference between the results obtained by two analysers.
3.4.1 Clinical Significance
The normal range of urinary excretion is 20 to 250 milliequivalents per day
(mEq/day). [18]. From table 3.1, it is observed that for patient i.d No, 20, 35 and 39, they
are suffered by hyperchloremia (Increased Chloride levels). This is because of
adrenocortical insufficiency, increased salt intake, inflammation of the kidney that results
in salt loss and Production of an unusually large amount of urine. It is evident that they
are suffered by vomiting (or nasogastric suction), diuretic therapy, or diarrhea due to a
villous adenoma. In this setting, the most likely diagnosis is surreptitious vomiting or
diuretic therapy or one of the causes of mineralocorticoid excess (such as primary
hyperaldosteronism) [19]. The first two disorders induce effective volume depletion,
whereas hyperaldosteronism is usually associated with mild volume expansion due to the
stimulatory effect of aldosterone on sodium reabsorption. It is noted that the drugs that
increases the level of Chloride in the urine are corticosteroids and diuretics (patient i.d
20). It is observed that there are no patients suffered from hypochloremia and it may due
to that the people are taking food regularly with adequate amount of Chloride in their
(NaCl – table salt) daily diet.

67
3.4.2 Statistical Analysis
Statistical analysis is carried out for the results obtained from the developed
instrument to check the accuracy of the instrument. The table 3.2 represents the statistical
reports for the developed instrument and the commercial clinical analyser. It is noted that
the values of standard deviation, mean value, median value, mean dev, Co-efficient of
variation and standard error of Co-efficient of variation for the designed analyser is close
to the clinical analyser. The less residual between the two analysers confirms the
accuracy of the microcontroller based instrumentation set up.
3.4.3 Detection and quantification limits
The detection and quantification limits are calculated as sb + 3s, where sb is the
average signal of blank solutions and s is the standard deviation. For the wavelength of
480nm, the absorbance change of 0.1119 typically corresponds to Chloride concentration
of 30 m mol/l of the sample solution, which gave the sensitivity of the electrolyte bio-
analyser. As the absorbance increases the Chloride concentration also increases, which
shows the linearity of the instrument up to 300 m mol/l.
3.4.4 Precision
To determine the reproducibility and accuracy of the instrument run to run and
within run tests are investigated. Run-to-run precision is obtained by assaying
commercial human control serum AccutrolTM Normal (Sigma – certified value – 102
mmol/l) gave the results of Mean 104.4, S.D. 4.0, C.V (%) 3.3 and elevated results for a
period of thirty (30) days produced the results of Mean 91.7, S.D.3.8, C.V(%)4.1. Within
run precision is obtained by assaying control normal serum twenty (20) times having
Mean 86.9 (104.4), S.D. 1.3 (4.0), C.V. (%) 1.0(3.3).
3.4.5 Recovery
To determine the feasibility of the developed instrument recovery test is
performed in pooled serum by the addition of known amount of Sodium Chloride
solution. Recovery of Chloride added to pool human urine is given in table 3.3. Pooled
urine is diluted approximately two-fold with distilled water. To 0.5ml of diluted urine,
various amounts of 0.1N Sodium Chloride (NaCl) solutions are added to bring the total
Chloride concentration within normal range. Using the developed instrument the

68
recovery values of added Chloride ranged from 98.1% to 99.3% with an average recovery
of 98.65%, which indicates the suitability of the designed instrument for biomedical tests.
3.4.6 Linear regression analysis
Linear regression analysis attempts to model the relationship between two
variables by fitting a linear equation that closely fits a collection of data points. Figure
3.5 shows a linear regression between the designed electrolyte bio-analyser and the
commercial clinical analyser which is used to determine the correlation between the two
instruments. The value of slope 0.97 and the intercept 5.2 (close to ideality) indicated
that the developed instrumentation system is well correlated with the clinical analyzer.
The correlation coefficient between the two method is R=0.99. The implemented
instrument is well suited to determine the concentration of Chloride in urine sample.

69
Table 3.1
Urinary Chloride Concentration (m mol/day)
S.No of
patients
By
developed
instrument
By
clinical
analyzer
S.No of
patients
By developed
instrument
By clinical
analyser
1
2
3
4
5
6
7
8
9
10
11
12
13
14
15
16
17
18
19
20
102.79
106.55
96.85
82.99
108.58
111.15
120.43
150.12
92.81
130.86
180.14
120.52
200.11
104.09
98.71
182.35
123.53
156.18
230.28
260.92
105
103
101
92
110
120
128
162
102
142
193
134
194
110
92
176
133
142
225
258
21
22
23
24
25
26
27
28
29
30
31
32
33
34
35
36
37
38
39
40
89.42
156.62
186.87
96.23
145.78
210.45
232.98
88.32
154.84
190.17
100.74
98.15
101.36
115.64
290.85
210.92
84.74
168.12
301.56
142.28
95
144
190
95
140
218
225
85
158
182
93
105
108
111
292
202
78
172
305
152

70
Table 3.2
Statistical Reports for the two analysers
Variable Mean Value
Median Value
Mean Deviation
Coeff of Variance
SE of Coeff of Variation
Sample Std Deviation
Developed Instrument Clinical analyzer
145.75 149.05
127.19
137
44.28 45.46
37.47 37.53
4.18 4.19
54.61 55.94
Table 3.3
Recovery of added Chloride from pooled urine Chloride (mmol/day)
S.No In pooled
Serum
Added Total
Content
Total
Determined
Difference Recovery %
1. 82 40 122 120 2.0 98.3
2. 86 45 131 130 1.0 99.2
3. 90 50 140 138 2.0 98.5
4. 96 55 151 150 1.0 99.3
5. 104 55 159 156 3.0 98.1

71
Figure 3.1 Block diagram of Microcontroller P89C668 based Bio-analyser

72
Figure 3.2 Signal conditioning circuit of the developed Bio-analyser

73
Figure 3.3 Microcontroller and interfacing circuit for the developed Bio-analyser

74
Figure 3.4 Flow chart

75
Figure 3.5 Linear regression between the Microcontroller P89C668 based developed
instrument and clinical analyser

76
3.5 Analysis of Chloride in pharmaceutical sample- Oral Rehydration Salts
3.5.1 Introduction
The human body needs various kinds of salts to be healthy and to function
normally. Serious salt imbalances occur with dehydration, may lead to heart and nervous
system problems that, unless they are rapidly resolved, can result in a medical
emergency. Dehydration is a major cause of electrolyte imbalance in human beings
which occurs whenever water is lost from the body. When fluids are lost, electrolytes in
those fluids are lost too, increasing the risk of electrolyte imbalance. Dehydration can be
caused by heavy exercise, especially in hot weather, severe vomiting and diarrhea. Large
amounts of water and many electrolytes that would normally be absorbed in the intestines
are lost with diarrhea and vomiting. Dehydration is a real threat to children, especially
infants and toddlers. Small children with diarrhea can become seriously dehydrated in
less than one day. Infants can become dehydrated within hours, and Severe burns. Parents
should be alert to dehydration caused by illness or athletic activity and begin oral fluid
and electrolyte replacement therapy immediately. Athletes and trainers know that the
body loses salt through sweat and that it's important to replace it. Hence, many athletes
drink sports drinks that contain salts before, during and after exercise to minimize things
like muscle cramps that are associated with salt imbalance.
3.5.2 Electrolyte supplements
Most people get all the electrolytes from a normal diet. Short-term therapy often
quickly restores electrolyte balances. Persons suffering from dehydration are recovered
by the electrolyte replacement supplements by prescription which can be given by mouth
or intravenously under supervision of a physician [21, 22, 23, 24].
The Dietary supplements are popular among athletes who participate in endurance
sports which can be in the form of tablets and powders. Some also contain herbs and
flavorings. They are regulated by the United States Food and Drug Administration (FDA)
as dietary supplements. Electrolyte replacements for children are Pedialyte, Naturalyte, or

77
Rehydralyte and are available in supermarkets and pharmacies. Children should not be
given sports drinks for vomiting and diarrhea.
Medicinal rehydration sachets and drinks are available to replace the key
electrolyte ions lost during diarrhea and other gastro-intestinal distresses. The science of
Oral Rehydration Salts (ORS) is advanced when Phillips and colleagues determined the
composition of fluid lost in diarrhea [24, 25]. Oral rehydration therapy is proposed as a
viable alternative for cholera in areas of the world with short supplies of intra-venous
fluids and needles forcing clinicians to deliver oral solutions to those with cholera. This
reduced mortality rates to only 3% compared to 30% of those treated in other camps with
intravenous fluids. Based on this evidence, WHO and UNICEF recommended a single
standard ORS formula for all ages. There are lot of brands of ORS therapy is available in
local pharmacy. The accurate analysis of minerals in drugs is very important in
medications.
Hence, a study is undertaken to analyse Chloride in ORS therapy using a
Microcontroller P89C51RD2 and the results are compared with the other analytical
technique (Ion Selective Electrode method).
3.6 Instrumental
3.6.1 Description of the Microcontroller based system
The Microcontroller P89C51RD2 and interfacing circuit is shown in figure 3.6.
The output signals from photodiode are connected to the input of op-amp LM108 (Figure
3.2) for current to voltage conversion and for amplification. The output of op-amp is
connected to the pin 35 of ADC 7109 through 1 MΩ resistance to convert analog to
digital value. ADC 7109 is a low power integrated device providing high accuracy, low
drift and dual slope integrator with 12 bits parallel outputs. The lower and higher bytes
of ADC 7109 are interfaced with port 2 and Port 0 of Microcontroller P89C51RD2 as
shown in figure for computing Chloride concentration. LBEN and HBEN which are used
to select lower and higher byte are connected to pin 36 and 37 of microcontroller. The
RUN and STATUS pins of ADC are connected to 38 and 39 of microcontroller. The pin
29 of ADC 7109 generates the internal reference voltage. A tap from preset is given to

78
pin 36 of ADC 7109, the reference input pin. By adjusting this preset it is possible to get
a full scale, which means that inputs between –4 and +4 can be converted. A reset switch
is provided at pin 9 of the microcontroller, so that the program can be executed from
0000 after the power is switched on. A two row Alphanumeric LCD is interfaced to Port
1 to display the measured concentration of Chloride.
3.6.2 Software
Fully dedicated Software for the data acquisition and computing the Chloride
concentration in different ORS samples is developed in C and assembly language and
linked to the application program. The structure of the software is elaborated as
flowchart in figure 3.7. Software for the implemented system is written to initialize LCD,
to start ADC (Analog to Digital conversion), to check EOC (End of Conversion) to read
lower byte enabling LBEN signal, to read higher byte enabling HBEN signal, to measure
the readings for blank, standard, and sample, to compute absorbance and Chloride
concentration, to display the result in the LCD and to get data from the keyboard.
3.7 Materials and Method
Oral Rehydration Salts of six different brands are collected from local
pharmaceuticals in Thanjavur, Tamil Nadu, South India. The samples of ORS are
dissolved in 1L of deionized water without any precipitation. The colorimetry principle is
used for the measurement of absorbance and concentration of Chloride electrolyte
The principle and the reagent used to measure Chloride in ORS are same as 3.3.1
and 3.3.2. The sample is prepared by adding 1 ml of reagent R1 with 10 µl of prepared
ORS sample.
3.7.1 Measurement
The prepared solutions of blank, standard and sample are placed in sample holder
to measure the voltages of blank, standard and sample. The absorbance and hence
Chloride concentration is determined using the formula (3) in 3.3.3. The concentration of
Chloride for six different brands of ORS samples is made using the developed
instrument. The same samples are tested using the Chloride Ion Selective Electrode
(ISE). The absorbance of sample solution is measured and repeated for five times to
check the reproducibility.

79
3.8 Results and Discussion
The Microcontroller P89C51RD2 based Instrument set up to measure the
concentration by colorimetry method in ORS samples is designed and developed. The
table 3.4 shows the readings for blank and standard of Chloride reagent. The measured
readings of absorbance and concentration of Chloride in different ORS samples are given
in table 3.5. The table 3.6 gives the concentration of Chloride measured using the
developed instrument and ISE method in different ORS samples. The concentration of
Chloride is varied from (61.87-64 mmol/l). The certified concentration of Chloride in
ORS is 65mmol/l [26]. It is found that the range is well within the safe limits and also it
is observed that there is no significant difference between the concentration values of
different samples, which depicts that they are prepared by following the ORS formula
given by W.H.O. The people who have suffered by dehydration having symptoms like
dry mouth, loss of body weight greater than 10%, extreme thirst, sunken eyes, no tears
when crying, decreased urination, fussiness, weakness, skin that stayed compressed and
pinched should have the habit of in taking ORS to avoid some chronic condition. The
dosage of ORS depends on age and severity of dehydration. The dosage for infants and
children is 1-2 litres over a period of 24 hours. For adults it differs from 2-4 litres over a
period of 24 hours.
3.8.1 Linearity and Sensitivity
As the absorbance increases the Chloride concentration also increases, which
shows the good fit of colorimetry principle. To check the linearity of the developed
instrument set up various samples having different Chloride concentration have been
measured at the wavelength of 480nm. The absorbance change of 0.1 typically
corresponds to Chloride concentration of 42 m mol/l of the sample solution, which gave
the sensitivity of the developed Instrument.
3.8.2 Recovery
To test the feasibility of the procedure and instrument, the recovery of the
developed Instrument is studied by the standard addition method. To 0.5ml of ORS
sample, various amounts of 0.1N Sodium Chloride (NaCl) solutions are added to bring
the total Chloride concentration within normal range. The table 3.7 shows the recovery

80
values of added Chloride ranged from 98.13% to 99.15% with an average recovery of
98.42%, which indicates the suitability of the designed instrument for bulk drugs and
assay tests.
3.8.3 Linear regression analysis
Linear regression is plotted for the results obtained using designed Instrument and
the ISE method which is shown in figure 3.8. The strength of the linear association
between two variables is quantified by the correlation coefficient. The regression line
equation arrived is y = 0.92X+4.43, the value of slope and the intercept indicated that
the developed instrumentation system is well suited to determine the Chloride in ORS
samples. The correlation coefficient R=0.99 (n=6), shows that the designed instrument
is well correlated with the Chloride ISE method.
3.8.4 Statistical Analysis
The statistical reports of Chloride electrolyte in different brands of ORS samples is
given in table 3.8. It is noted from the table that the mean value 63.30 and median value
63.43 are also within the safe limits. The data reported in this study refers that the
concentration levels of electrolytes are fairly within the recommended levels, which
confirms the pharmaceutical integrity. There is no considerable difference between the
results obtained (Mean value, Std Err of Mean value, Median value, Std Err of Median
value, S.D, Std Err of S.D, Mean Deviation, Coefficient of Variation, Std Err of Coeff of
Variation) using the designed instrument and the ISE method which corroborates the
validity of the implemented instrument set up. The accuracy of the microcontroller based
instrument is confirmed by the less residual between the two methods.

81
Table 3.4
Voltage of blank and standard
S.No Blank Vo (mV) Standard (mV) 1
0.22
0.32
Table 3.5
Absorbance and concentration of Chloride in Oral Rehydration Powder
S.No Types of
sample Sample
(VT) Absorbance Chloride
Concentration m mol/l
1 ORS 1 0.175 0.099 61.87 2 ORS 2 0.174 0.101 63.12 3 ORS 3 0.174 0.101 63.12 4 ORS 4 0.173 0.104 64 5 ORS 5 0.173 0.104 64 6 ORS 5 0.175 0.099 61.8

82
Table 3.6
Comparison of results obtained using the developed instrument and Chloride ISE
Table 3.7
Recovery of added Chloride from ORS Chloride (mmol/l)
S.No In ORS sample
Added Total
Content
Total
DeterminedDifference
Recover %
1. 62 40 102 100.5 1.5 98.52
2. 62 45 107 105 2.0 98.13
3. 63 50 113 111 2.0 98.23
4. 63 55 118 117 1.0 99.15
5. 63 45 108 107 1.0 98.07
Chloride concentration (m mol/l) Sample id Developed
Instrument Chloride ISE
ORS 1 61.87 62 ORS 2 63.12 63 ORS 3 63.12 63 ORS 4 64 64 ORS 5 64 64 ORS 6 61.87 63

83
Table 3.8
Statistical analysis for the data arrived using developed instrument and the ISE
Variables Developed Instrument Chloride ISE
Mean 62.99 63.16
Std err of mean 0.356 0.280
Median 63.12 63
Std err of median 0.445 0.350
S.D 0.873 0.687
Std err of S.D 0.252 0.187
Mean deviation 0.751 0.555
Coefficient of variation 1.38 1.08
S.E of Coeff of Variation 0.400 0.314

84
Figure 3.6 Microcontroller P89C51RD2 and interfacing circuit

85
Figure 3.7 Flow chart

86
Figure 3.8 Linear regression between the developed instrument and the Chloride
Ion Selective Electrode

87
References
1. Weast R.C., 3 ed: CRC handbook of Chemistry and Physics 67th ed Boca Raton
FL CRC press (1986).
2. Kuleita T.A., Pediatrics, 78(1986), 714-5.
3. Narins R.G., Emmett M., Medicine., 50(1980), 161–87.
4. Wolfbeis O.S., Fiber Optic Chemical Sensors and Biosensors Analytical Chemistry,
72(2000), 81-89.
5. Rakow N.A., Suslick K.S.A., Nature, 406(2000), 710-712.
6. Green J.M., Anal.Chem., News& features, (1996), 305.
7. Renger B., Jehle H., FisherM., Funk W., J.Planar Chrom., (1995), 269.
8. Skoog D.A., West D.M., Holler F.J., Fundamentals of Analytical chemistry,
Saunders college publishing, Philadelph1ia, 7th Edn., (1996).
9. Jeffery G.H., Bassett J., Mehdham J., Denney R.C., Vogel’s Text book of
quantitative chemical analysis, 6th Edn., (2000).
10. Vessman J, J. Pharm. Biomed. Anal., 14(1996), 867.
11. Marr D., Horvoth P., Clark B.J., Fell A.F., Anal Proceed., 23(1986), 254.
12. Cooper W.D., Electronic Instrumentation and Measurement techniques, Practice hall
of India private Ltd, New Delhi.(1987).
13. Wobschall D., In Circuit design for Electronic Instrumentation -Analog and Digital
devices from sensor to display, Second edition, McGraw-Hill Book Company, NY,
(1987), 367-368.
14. Morvis Alan S., Principles of Measurement and Instrumentation, New York. (1988).
15. De Jong E.B., Goldschmidt H.M., Van Alphen A.C. , Loog J.A., Clin Chem, 26-8
(1980),1233-1234.
16. Yokoi K., Biol Trace Elem Res., 85-1(2002), 87-94.
17. Feldkamp, J Chem Clin Biochem., 12(1974), 146-150.
18. Bishop M. L., Clinical Chemistry: Principles, Procedures, Correlations
(4th ed.). Philadelphia, PA: Lippincott Williams & Wilkins. (2000).
19. Rose B.D., Post T.W., Clinical Physiology of Acid-Base and Electrolyte Disorders,
5th ed, McGraw-Hill, New York, (2001), 565-567.
20. Kotchen T., Hypertension, 45(2005), 849–850.

88
21. Armon K., Stephenson T., MacFaul R., Arch Dis Child., 85(2001), 132-142.
22. Lieberman S., Bruning N., The Real Vitamin & Mineral Book, Avery Publishing,
Garden City, NY, (1990), 91-181.
23. Harrison H.E., Pediatr Clin North Am, 1(1954),335-348.
24. Phillips R.A., Ann Rev Med, 19(1968),69-80.
25. Hirschhorn N., Greenough W.B., III., Cholera. Sci Amer., 225(1971),15-21.
26. World Health Organization. Oral Rehydration Salts (ORS), A new reduced
Osmolarity formulation (Version current at September 12 (2006)).


119
CHAPTER V
ELECTRICAL CONDUCTIVITY AS A SURROGATE FOR CHLORIDE
DETERMINATION
This chapter presents the design and development of Microcontroller
ATmega32 based Instrument set up to determine the Electrical Conductivity in soil
samples. The Electrical Conductivity of the soil samples measured by the implemented
embedded based Electrical Conductivity instrument is comparable with that of the
commercial instrument (ELICO CM 180). Since, Electrical Conductivity can be used as
a surrogate for Chloride concentration measurement, a linear regression model is
developed between Electrical Conductivity and Chloride concentration of soil samples.
The Chloride concentration of the soil samples collected at various samples and their
plant cultivation is also discussed.
5.1 Introduction
Electrical conductivity is an inherent property of most materials, and ranges from
extremely conductive materials like metals to very non-conductive materials like plastics
or glass. In metals, the electrical current is carried by electrons, while in water it is
carried by charged ions. In both cases, the conductivity is determined by the number of
charge carriers, how fast they move and how much charge each one carries. Conductivity
(G), the inverse of resistivity (R) is determined from the voltage and current values
according to Ohm's law. Using Ohm’s Law, V= iR and knowing conductivity G=
(1/R)*k, where k=cell constant =length (d, spacing between two electrodes)/area of
electrodes then G can be determined as G= (1/R)*k = (i/V)*k. When resistance is
measured in ohms, conductance is measured in siemens (formerly known as a mho).
Since 1 siemens is a very large unit, aqueous samples are commonly measured in micro
siemens μS. Metals are extremely conductive because electrons move almost with the
speed of light, while in water ions move much slower and the conductivity is much
lower. Raising the temperature makes water less viscous and the ions can move faster.
Because the ions are of different sizes and carry different amounts of water with them as
they move, the temperature effect is different for each ion.

120
5.1.1 Electrical Conductivity as a surrogate for Chloride concentration
Electrical Conductivity (EC) is usually a representation of salinity and it can
be measured with a simple device. Chloride ion is an important element among dissolved
solids which can limit plant growth, decrease yields and reduce quality of drinking water.
Chloride is highly soluble and remains in the soil solution, while other ions such as
sulphate and bicarbonate combine with calcium and magnesium, are present, to form
calcium sulphate and calcium carbonate, which are sparingly soluble compounds.
Chloride concentration typically is measured by titration of aqueous samples using
standard AgNO3
solution. Chloride analysis thus is time consuming and expensive,
compared to EC measurement which is fast and inexpensive (Hajrasuliha, S et al) [1].
Since Chloride is a major constitute of saline waters and soils and it directly affects EC, a
close correlation between EC and Chloride can be obtained. Maas et al., [2] suggested
that if Chloride is the predominant anion in a soil solution, the Chloride concentration in
molm-3
would be approximately equal to 10 times the EC
measured in dSm-1
.
Observations of Chloride concentration and Electrical Conductivity delivered the
possibility of a generelised empirical relationship between these two factors. Therefore it
is conceivable that the Chloride concentration can simply be estimated from Electrical
Conductivity measurement. The concept of computation of Chloride concentration is, to
correlate Electrical Conductivity with the Chloride Concentration of the soil samples
using regression model, which validates Electrical Conductivity as a surrogate for
Chloride estimation.
5.2 Agricultural soil
All soils contain some water soluble salts which include essential nutrients for
plant growth. When the level of water soluble salts exceeds a certain level, harmful
effects on plant growth occur. A soil with excess total soluble salts is referred to as a
saline soil. The influence that a certain level of soluble salt will have on crop growth
depends upon several factors such as climatic condition, soil texture, distribution of salt
in the profile, salt composition and plant species ( Milne, R.A et al) [3]. The areal extent
and depth of a salt problem is usually irregular. Soil sampling on a grid system may be
necessary to map the extent of the problem. Soluble salts are most commonly detected by
measuring the soil solution’s ability to conduct an electric current, referred to as

121
Electrical Conductivity. The common unit of measurement for EC has been mmhos/cm.
The official international unit of measurement is siemen/ m (S/m). One mmhos/cm is
equal to 0.1S/m or 1.0 ds/m.
5.3 Design and development of Electrical Conductivity measurement set up using
Microcontroller Atmega32
Soil Chloride analysis has been conducted primarily for the purpose of salinity
and irrigation management. Presently, it has become highly advantageous to carry out
information processing and control using microcontroller. It is also a well known fact that
the microcontroller system can offer high accuracy and high speed response. Hence, these
reasons infuse a strong motivation for the design and implementation of the automatic
measurement system based on microcontroller. An embedded systems controlled by
microcontrollers consist of not only a digital part, used for control and data processing,
but also an analog part mostly used for adjustment of input signals e.g. from sensors. In
this experimental study, to decrease the test cost, it is proposed to use ATmega32
microcontroller mounted in the system and the developed system is used for in-situ
measurement of the conductivity.
5.3.1 Design of the measurement system
The block diagram of microcontroller based Electrical Conductivity measurement
set up is shown in figure 5.1. The conductivity cell made up of platinum which is used to
measure the conductivity of the samples is kept in Block 1. The cell constant (K) is
related to the physical characteristics of the measuring cell. K is defined for two flat,
parallel measuring electrodes as the electrode separation distance (d) divided by the
electrode area (A). Thus, for a 1 cm cube of liquid, K = d/A = 1 cm–1. Its determination is
much more convenient by calibration with pattern solutions (Braunstein et al.,) [4].
Polarizing the conductance cell by an external DC potential VDC produces some
undesirable effects (double-layer capacitance, electrolysis, ohmic resistance and
electrolytic saturation). On the other hand, it is proved that the electrolytic saturation is
reduced considerably if the AC polarization frequency is high enough. Hence, a fixed
sinusoidal excitation voltage of 1V is applied to the bridge. The Conductivity cell is
connected to one arm of a modified Wheatstone’s bridge network. The Block 2 consists
of precision rectifier to rectify the output of Bridge network. Block 3 represents the

122
temperature sensor Chromel alumel thermocouple to measure the temperature of the
sample. The effect of temperature is important when an electric conductivity of a liquid
or solution must be done. A solution at a higher temperature will present higher quantity
of ions dissociated, therefore the concentration of electric charges will raise and as a
consequence, conductivity will be higher. On the contrary, the same solution at low
temperature will have a low conductivity due to the low quantity of ions present, which
results in lower electric conductivity. From an application point of view, conductivity is
given at a certain temperature, which has been stated as a reference to better compare the
measurements at different times and locations. This temperature is usually 25°C. Block 4
indicates keypad to give input data to the Microcontroller for processing. Block 5 consists
of ATmega32 microcontroller from Atmel company, is a low power, high performance 8
bit AVR microcontroller. Block 6 is a four rows twenty characters LCD (Liquid Crystal
Display) from Hitachi, to display the experimental results. Block 7 consists of MAX232
(dual RS232 transmitter/receiver interface), which is used to communicate with PC kept
in Block 8.
5.3.2 AC modified Wheatstone bridge network
A modified AC Wheatstone bridge network is shown in figure 5.2. The most
accurate methods of measurement of unknown impedance are the bridge methods, whose
accuracy is basically limited only by the accuracy of the known values of the various
elements constituting the bridge. A modified approach of the balancing techniques of AC
Wheatstone’s bridge network has been reported to achieve high accuracy in
measurement. In the developed Instrument, two high gain operational amplifiers
(CA3041) IC1 and IC2 are connected with the bridge network with the non-inverting
terminal connected to the ground circuit. The bridge output nodal points B and D almost
at the same potentials with respect to the ground and hence the effect of stray capacitance
that will exist between them and also between them and ground is assumed to be
minimized. Since, B and D are at virtual ground, the sinusoidal supply voltage,
V= V sin ωt, the current through the bridge impedances are Z1, Z2, Z3 and Z4
respectively. The output voltage of the circuit is [5]
Vo= Rf [Z2Z3 – Z1 Z2] V (1)

123
At balance condition of the bridge, Vo=0 which is identical with the conventional bridge
network. The conductivity cell is connected instead of Z3. The conductivity of a sample
is determined by,
Vo= Bridge output Voltage, Vi= input excitation voltage, Z1, Z2, Z4=known resistances,
Rf =Feed back resistance and Gc = Conductivity of a sample.
The output of the Amplifier IC2 is given to input of the precision rectifier constructed
with operational amplifiers IC3 and IC4 as shown in Figure 5.2.
5.3.3 Microcontroller and interfacing circuit
The circuit diagram of the Microcontroller based instrumentation set up to
measure the Electrical Conductivity of the sample is shown in figure 5.3. In the designed
circuit, the output from the modified Wheatstone’s bridge network (figure 5.2) is given to
pin 38 (ADC 2) of microcontroller. The Thermocouple which is used to measure the
temperature of the sample is connected to pin 39 (ADC 1) of Port A. The signal
generated by the junction of the thermocouple due to thermal changes is fed to an
amplifier circuit specially designed for very low signal amplification as shown in figure
5.4 (Temperature measurement). The output signal is amplified to a suitable level by
using an instrumentation amplifier read by the microcontroller through A/D converter. A
semiconductor temperature sensor AD590 is used to simulate a reference junction
(Neelamegam et al., 1992) [6]. A crystal oscillator of 8MHz is connected between pin 12
and 13 of microcontroller as shown in figure 5.3. Three keys are connected to PC0, PC1,
and PC2 Port C. A four rows twenty characters LCD is connected with Port D, to display
the measured data and the computed results. MAX232 (dual RS232 transmitter/receiver
interface) is connected with pin 14 and 15 of Port D to transmit/ receive data from PC.
5.3.4 Software
Software is developed in C and assembly language to initialize LCD, to start
ADC, to check End of Conversion, to read 10bits of data from ADC, to measure the
temperature, to compute Conductivity, to compute Chloride concentration using

124
regression model, to display the results in LCD and to send data to PC for further
processing. The flowchart for performing the above tasks is shown in figure 5.5.
5.4 Materials and Method
5.4.1 Sampling Field
Soil samples are collected from thirty paddy field sites originated from
Thanjavur- Nagapattinam Delta districts, TN, South India, where rice is the main crop of
several agricultural products (Figure 5.6). The field chosen is located on the eastern coast
of TN, between 9o 50’ and 11o 25’ of the north latitude and 78o 45’ and 70o 25’ of the
East. The samples are collected at every 3 kms from Thanjavur to Nagapattinam over
90kms, during the major cropping season of spring-summer (March- June), which
produces about 56% of the Nations total production.
5.4.2 Sample Collection
Sampling areas of paddy fields are selected by avoiding tracks, drainage lines,
sheep camp, or influences other than effluent irrigation. During collection, the size of the
sample (Volume or weight), identification of sample (unique labeling), special packaging
and storage are noted. After collection of the samples, they are air-dried to remove
moisture. Samples are commonly collected from the soil surface or from boreholes
drilled with a hollow stem auger equipped with a split-spoon or core barrel sampler. The
sample is placed in a mixing bowl and organic matter such as roots discarded. Rock and
gravel larger than small pebbles are commonly removed. Homogenize the sample by
thoroughly mixing it prior to weighing or placement in a sample jar (if laboratory
analysis is to be performed). To the extent possible the material placed in a sample jar for
laboratory analysis should be as much like the sample selected for field determination. In
addition coordinate with the analytical laboratory to ascertain if they have a standard
protocol for selection of small volume samples (e.g. a maximum size of pebbles in the
sample).
5.4.3 Sampling procedure
The collected soil samples are assigned a number, transferred to a paper bag,
and then placed in a metal tray. These samples are dried overnight in a cabinet equipped
with a heating element and an exhaust fan to remove moisture. The temperature in the
cabinet does not exceed 36oC in order to approximate air drying conditions. Samples are

125
crushed with a mechanical grinder equipped with porcelain mortar and stainless steel 10
mm mesh sieve to remove larger clods and unwanted debris. Since the material from the
particle sizing 2mm and smaller are most important in making an inventory of the
mineral constituents of the soil and in evaluating EC, the sample is crushed again and the
particles sizing 2mm and less than 2mm are sieved using 2mm mesh. The sample is
prepared as given below to measure the conductivity. Three 10 gram scoops of soil and
30 ml of deionized water are taken in a large test tube and shaken well for 30 min to get
1:1 suspension of soil sample. After initial shaking, the suspension is allowed to stand,
with intermittent shaking for 30 minutes [7]. The supernatant solution is then filtered and
it is used for the measurement of Electrical Conductivity.
5.4.4 Measurement
To measure the Electrical conductivity of the sample, the conductivity cell is
connected at one arm of the modified AC Wheatstone bridge and selecting the resistance
value Z1 (100 Ω or 1 kΩ), Z2 (1 kΩ), and Z4 (1 kΩ). A fixed sinusoidal excitation
voltage of 1V with frequency 1 KHz is applied to the bridge. For the calibration of the
instrument, the known concentrations of NaCl are prepared and the Conductivity is
measured before using the Soil samples. The solution is maintained at 25° C. Initially, the
Conductivity cell is kept in the solution of NaCl having concentration of 0.1N, and the
Electrical Conductivity is measured using the developed Instrument. Then the probe is
washed with deionised water and the Electrical Conductivity for various concentrations
of NaCl (0.2N, 0.3N, 0.4N and 0.5N) is measured using the microcontroller based
instrument. The calibration curve is drawn between NaCl concentrations versus
Conductivity (figure 5.7). Then, the conductivity cell is immersed in the prepared soil
sample and the measurements are made for Electrical Conductivity. A graph is drawn
between soil samples and their corresponding Electrical Conductivity as shown in Figure
5.8. At the same time, Chloride concentration of the prepared soil samples is determined
using the titration method for the development of regression model.
5.4.5 Development of regression Model
Regression analysis is the statistical technique that identifies the relationship
between two or more variables. The technique is used to find the equation to evaluate the
relation between the two and to predict the unknown value from the developed equation.

126
A simple regression analysis can show that the relations between an independent variable
X and a dependent variable Y is linear, using the simple linear regression equation.
Y= a + mX (where a is an intercept and m is a slope).
The Chloride concentration of the sample is strongly related to the Electrical
Conductivity of the sample, a relation between them is evaluated using linear regression
model (using software ULTIMACALC). It can be seen that from the figure 5.9, as the
Chloride concentration increases the Electrical Conductivity of the soil sample also
increases. The regression line equation is arrived by using the following statistical
equation,
y - y = b xy ( x- x )
where b xy = r ( x / y ).
The regression line equation y = -517.80+14.02x is obtained for that line, using the above
relation. The concentration of Chloride for the soil sample can be determined if the
conductivity of the soil sample is known. The correlation coefficient between the
Electrical Conductivity and the Chloride concentration is R= 0.96 (n=30) which enables
the value of Electrical Conductivity can be used as a surrogate for Chloride estimation.
A regression line also drawn between the Electrical Conductivity measured using
the developed instrument and the commercially available ELICO CM 180 instrument to
check the correlations between the two, which is shown in figure 5.10. The regression
line equation arrived is y= 5.85 + 0.94x, and correlation coefficient R = 0.97 (n=30).

127
5.5 Results and Discussion
The developed microcontroller based instrument is used to measure the
Conductivity of the soil samples. The empirical relationship between the Electrical
Conductivity and the Chloride concentration has been developed using linear regression
model to determine the Chloride concentration of the sample. The performance of the
designed instrument is investigated by comparing the results with the standard instrument
(ELICO CM 180).
5.5.1 Analytical performance of the system
The calibration curve is obtained by plotting the concentration of Chloride against
the Electrical Conductivity of prepared NaCl Solutions at various concentrations as
shown in figure 5.7. The reproducibility of the instrument is tested by taking five
replicate readings for soil sample and it is found to agree well within the limits. The
statistical analysis is made for the results obtained using the developed instrument and the
standard instrument to compare the relative accuracies in average Electrical Conductivity
for soil samples. The values (n=30) of Mean=72.06, Median value=62, Standard
Deviation= 20.45, Coefficient of Variation =28.38 and Standard Error of Coefficient of
variation= 3.66 for the Conductivity measured using the designed instrument and for the
standard one, the values of mean=73.83, Median value=64, S.D=19.69, Coeff of
Variation= 26.68 and Std Err of Coeff of variation= 3.44 which shows that there is no
significant difference between the two methods. The accuracy of the developed
instrument is confirmed by the absence of large exceptional errors which allows the
suitability of microcontroller based instrument for Electrical Conductivity measurement.
5.5.1 Analysis of Chloride concentration at various locations and plants
In this study, it is observed (Figure 5.8) that the range of Electrical Conductivity
of soil samples varies from 45mS/cm to 109mS/cm and the Chloride concentration
(Figure 5.11) is maximum at Ramarmadam (1010 ppm) and minimum at Kattuthottam
(140ppm). It is also to be noted that all the collected paddy field soil samples are having
the Chloride concentration within the maximum tolerable limit (1050 ppm).
The concentration of Chloride varies from 140ppm to 210ppm for the particular
places like Kattuthottam (140ppm), Pulavarnatham (210ppm), Athanur (210ppm),
Needamangalam (210ppm), and Kilerium (175ppm). It is observed from the literature

128
survey (Jing et al., 1992) [8], that the places having Chloride concentration from
100ppm-200ppm are suitable for the cultivation of white potato, peanut, tomato and
sugarcane. Hence, the research report suggests that the above places are suitable for the
cultivation of the above plants with other necessary minerals.
The Chloride concentrations are ranged from 820ppm to 1010ppm for the places
like Aandipalayam (985ppm), Kurukkathi (930ppm), Koothanur (820ppm), Kilvelur
(860ppm), Aazhiyur (980ppm), Ramarmadam (1010ppm), Sikkal (965ppm) and
Nagapattinam (985ppm). These places are suitable for paddy field which is confirmed by
the literature survey (Zhu, Q.S., and Yu,B.S,1991)[9]. It is also observed that the above
places are already cultivating rice only. Hence, it is concluded that the Chloride
concentration is also very important for the paddy growth in addition to other necessary
minerals (rice).
Tomatoes are sensitive to salinity. The test has been conducted to know the effect
of Chloride on tomato plant which is planted at Thanjavur (Tamil Nadu, South India)
having deep, loamy, well-drained soil. The value of soil pH is about 6.2 to 6.8 and the
direct sun light on plant is around 6 hours. The test is performed on the plant during the
ripening stage of tomato fruit. It is observed that irrigating tomato plant with 1N of NaCl
once in a day for the period of 1 month (1.09.2010 to 30.09.2010) increases the total
soluble solids rather than the normal irrigation.
Chloride plays a vital role in stomatal movement in the palm. It is observed that
healthy coconut palms along seashores (Nagapattinam, Tamil Nadu, South India)
Chloride at a concentration of 7-10mg/g DM in their foliage. The optimal Chloride
concentration is usually in the range of 3.8 to 6.4 mg/g.
An embedded based Electrical Conductivity measurement set up has been
designed and developed and a regression model is developed between Conductivity and
Chloride concentration of soil samples. The Chloride concentration of soil samples at
various locations is measured and their plant cultivation is also discussed.

129
Figure 5.1 Block diagram of Microcontroller ATmega32 based Electrical
Conductivity instrument set up.

130
Figure 5.2 AC modified Wheatstone’s bridge network with precision rectifier

131
Figure 5.3 Microcontroller ATmega32 and interfacing circuit

132
Figure 5.4 Temperature measurement circuit

133
Figure 5.5 Flowchart

134
Figure 5.6 Site map

135
Figure 5.7 Electrical Conductivity measured for known concentration of NaCl
Solution using developed instrument.

136
Figure 5.8 Graph drawn between collected soil samples versus Electrical
conductivity

137
Figure 5.9 Linear regression drawn between Electrical Conductivity versus
Chloride concentration

138
Figure 5.10 Linear regression for Electrical Conductivity of the soil samples drawn
between the developed instrument and standard instrument.

139
Figure 5.11 Graph drawn between collected soil samples versus Chloride
concentration

140
References 1. Hajrasuliha S., Cassel D. K., Rezainejad Y., 49(1991), 117-127.
2. Maas E. V., Chloride and crop production. (Eds.: T.L. Jackson). Potash and
Phosphate Institute. Atlanta, GA, (1986), 4-20.
3. Milne R.A, E.Rapp, Soil salinity and drainage problems, Canada
Dept. of Agric, Ottawa, (1968), 1314
4. Braunstein J., Robbins G.D., Journal of Chemical Education, 48 -1 (1981), 52–59.
5. Rajendran A., Neelamegam P., Measurement, 35(2004), 59–63.
6. Neelamegam P., Padmanabhan K., Selvasekarapandian S., Meas. Sci. Technol,
3(1992) 581.
7. Recommended Chemical Soil Test Procedures for the North Central Region,
North Central Regional Publication No. 221. NDSU Bull. No. 499, (1988).
8. Jing A.S., Guo B.C., Zhang X.Y., Chin.J.Soil Sci, 33(6) (1992), 257-259.
9. Zhu Q.S., Yu B.S., Wubei Agric. Sci. 5(1991), 22-26. (Chinese)


141
CHAPTER VI
COMPUTATION OF CHLORIDE IN ENVIRONMENTAL SAMPLES
SOIL AND SEAWATER
This chapter presents the computation of Chloride in environmental samples of soil
and sea water using Artificial Neural Network. A three layered neural network is
employed for the computation of Chloride in environmental samples. Soil samples are
collected at thirty various places from Thanjavur to Nagapattinam, Tamil Nadu, South
India. In the prediction of soil Chloride, distance is used as an input parameter and
Chloride concentration is used as output parameter. Computation of Chloride in sea water
is made using Back Propagation Algorithm Neural Network and Genetic Algorithm
based Back Propagation Neural Network to identify the best technique that could
adequately predict the Chloride concentration to a desired accuracy. Sea water samples
are collected from Middle East coastal region of Tamil Nadu. Temperature, pH and
Electrical Conductivity are used as input parameters in the Chloride prediction system.
The adaptiveness is checked for various seasonal conditions by varying the input
parameters. The prediction accuracy is improved by using various numbers of hidden
neurons and training iterations.
Prediction of Chloride in Soil samples using Artificial Neural Network
6.1 Introduction
Neural Networks are among current Artificial Intelligence (AI) research areas of
interest to the environmental studies. In order to obtain an ANN with the proper
modelling ability, a number of internal parameters that rule its training and operation
must be correctly configured. These are related to the ANN topology and to the learning
algorithm used for its training. In this study, neural network is trained to learn the
distance as input and Chloride concentration of soil samples as output vector by using the
back propagation algorithm. The output parameter (Chloride concentration) is measured
using titrimetry method to obtain the training data for neural network. After the training,
the validation is performed for verification and testing is done to compute the output
(Chloride concentration) of the soil samples using the trained neural network.

142
In this study, 30 soil samples are collected at every 3 kms from Thanjavur to
Nagapattinam, Tamil Nadu, South India. Out of thirty data set, twenty data set are used to
train the neural network and ten data set are used for testing the neural network model.
6.2 Soil sampling
The soil sample collection and the sampling have been done as per the procedure
given in Chapter V (5.4.2 and 5.4.3). The prepared soil samples are used to measure the
Chloride concentration. Using the standard titration method, the Chloride concentration is
measured for the collected samples. In this method, titrant solution of Silver Nitrate
(0.01N) and indicator of Potassium Chromate is used with the reddish brown color end
point.
Chloride in ppm = ml of titrant used x N x 35.46 x 1000 / ml of seawater sample. Where
N = Normality of titrant.
6.3 Implementation of neural network
Neural Network with back propagation algorithm is used to compute the Chloride
concentration of the soil samples. The architecture of ANN consists of three layers. The
input layer consists of one neuron (distance), six neurons in the hidden layer and one
neuron (Chloride concentration) in the output layer are used for the architecture. Twenty
data set are used as a training pattern.
6.3.1 Training phase
During the training, the signal from the input vector propagates through the
network layer till the output layer is reached. The output vector represents the predicted
output of the ANN and has a node for each variable that is being predicted. The task of
training the ANN is to find the most appropriate set of weights for each connection which
minimises the output error. All weighted inputs are summed at the neuron node and this
summed value is then passed to a transfer function. The back propagation algorithm
(BPA) or the generalized delta rule uses sigmoid activation function f(x) = 1/(1+e-x). The
BPA is a supervised learning algorithm that aims at reducing overall system error to a
minimum. In this learning procedure, an initial weight vectors w0 is updated,

143
Wij (t+1) = Wij (t) + η δj xi + α (Wij (t) - Wij (t-1)) (6.1)
Where, Wij (t) = connection weight from a node i in one layer at time t; xi = input or
output of the hidden node i; δj = error term for node j; η = learning rate factor; α =
momentum factor.
If j is an output node, then, δj = yj (1- yj) (dj - yj)
where, dj – desired output of node j; yj – actual output.
If j is hidden node, the computation of error becomes, δj = xj (1- xj) Σ δk Wj k
where, k is summed over all nodes in the layer above node j.
The learning rate parameter took the value of 0.03 and the training pattern data is
given in table 6.1. Prior to the execution of the training process of neural network, the
input and output parameters were normalized in order to acquire accurate results.
6.3.2 Validation of the developed neural network
In this part of the study, the trained network model is used to compute the
concentration of Chloride for the input parameter. For this 10 distances are randomly
selected from the trained pattern and their soil Chloride concentrations are computed as
seen in table 6.2. To demonstrate the generalization capability of the model, the statistical
test results of validation data set are given in table 6.3. It is observed that there is a
significantly high compromise between the experimental and the proposed model
indicating the powerful performance of NN.
6.3.3 Testing Phase
Once the neural network is trained, testing is required to check the effectiveness or
accuracy of the network. During the testing (external validation), the NN model is used to
compute the Chloride concentration of soil samples, which are not involved in training
pattern. The results are given in table 6.4 and the performance of the network on this test
set is in good agreement with the measured results. The statistical results of the test data
set are given in table 6.5. Hence, it is confirmed that the neural network is properly
trained.

144
6.4 Results and Discussion
The predictability of the developed model has been quantified in terms of
correlation coefficient (R). The correlation between experiments and predicted results for
both the validation and test dataset has been shown by regression analysis in figure 6.1
and 6.2 respectively. It could be observed that a very good correlation between
experimental and predicted data set is obtained. No scattering in the data points could be
observed through out the whole data range, which shows the excellent predictability of
the model.
The table 6.6 gives the parameters of the designed neural network which is used to
predict the concentration of Chloride in soil samples. One hidden layer is found to be
adequate for the present problem. Neurons in the hidden layer are varied from 3 to 9.
Neurons more than 9 are not tried in order to avoid overfitting. The performance of the
model at different hidden neurons is shown in table 6.7. It could be observed that ANN
model with 6 hidden neurons produced best performance and is considered to be the
optimal configuration for the present problem.
Optimum number of neurons in the hidden layer plays a vital role in the Root
Mean Square Error (RMSE). Selection of neuron number based on the criteria of a
minimum divergence of training and test data during training curves and the lowest value
for RMSE of the test data. The RMS error for the neuron number in the hidden layer is
plotted in figure 6.3. From the figure, low RMS errors are observed if the neuron
numbers are six in the hidden layer. When this number exceeds, high RMS errors are
observed. More the RMS error, the predicted outputs are far away from the true or
measured value. Hence, six neurons are chosen in the hidden layer to reduce the RMS
error. This network needs 10,000 iterations to reach RMS error of 0.005 of the training
data, 0.003 for validation and 0.006 for the test data respectively.
The table 6.3 and 6.5 compares the statistical reports of the validation and testing
pattern computed using the neural network with that of measured results. The values of
Mean (±0.3), Standard error of mean (±0.05), Median (±0.25), Standard error of Median
(±0.05), Mean Deviation (±2.5), Standard Deviation (±4), Standard error of Standard

145
Deviation (±0.1), Coefficient of Variation (±0.1) and Standard error of Coefficient of
Variation (±0.02) of the predicted results are very close to the values of the measured
results.
Table 6.1 Training pattern for soil Chloride computation
Distance
(km)
Soil Chloride
concentration
(ppm)
3 140
6 280
9 210
12 280
15 560
18 385
21 245
24 280
27 315
30 210
33 210
36 175
39 315
42 245
45 350
48 385
51 490
54 280
57 560
60 280

146
Table 6.2 Validation data – Comparison between computed and measured results
Distance
(km)
Computed Chloride
concentration (ppm)
Measured Chloride
concentration (ppm)
9 208 210
15 557 560
21 242 245
24 279 280
30 208 210
39 311 315
42 242 245
48 384 385
51 486 490
57 557 560

147
Table 6.3 Statistical reports of validation data set and measured results
Variables Validation Measured
Std.Dev 132.47 132.81
Std.Err of Std.Dev 29.62 29.69
mean value 347.4 350
Std.Err of Mean 41.89 42
median value 295 297.5
Std.Err. of Median 52.36 52.5
Mean Dev 118.88 119
Co-eff of variation 38.13 37.94
S.E of Co-eff of variation 8.52 8.48

148
Table 6.4 Testing pattern – Comparison between computed and measured results
Distance
(km)
Computed Chloride
concentration (ppm)
Measured Chloride
concentration (ppm)
63 581 585
66 674 680
69 982 985
72 923 930
75 812 820
78 854 860
81 977 980
84 1002 1010
87 961 965
90 982 985

149
Table 6.5 Statistical reports of testing data set and measured results
Table 6.6 Parameters used for the designed neural network
Variables Testing Measured
Std.Dev 137.97 137.73
Std.Err of Std.Dev 30.85 30.79
mean value 874.8 880
Std.Err of Mean 43.63 43.55
median value 942 947.5
Std.Err. of Median 54.54 54.44
Mean Dev 115.64 115
Co-eff of variation 15.77 15.65
S.E of Co-eff of
variation
3.52 3.49
Parameters Developed NN model
Topology 1- 6-1
Algorithm Back Propagation
Transfer function Sigmoid Activation
Epochs 10000
Validation Testing
RMSE 0.003 0.006
Correlation cofeeicient
(R)
0.99 0.98

150
Table 6.7 Hidden neurons versus accuracy of the predicted results
Topology Accuracy of the
predicted results
(%)
1 – 3 - 1 97.5
1 – 4 – 1 97.9
1 – 5 – 1 98.3
1 – 6 – 1 99.1
1 – 7 – 1 98.9
1 – 8 – 1 98.2
1 – 9 - 1 97.8

151
Figure 6.1 Linear regression between the validation results and measured results

152
Figure 6.2 Linear regression between the testing results and measured results

153
Figure 6.3 RMSE value for 1-6 neurons in hidden layer

154
6.5 Prediction of Chloride in sea water using Artificial Neural Network
6. 5.1 Selection of input parameters
Two of the most important properties of sea water are temperature and salinity,
which have a major influence on ocean currents and behavior. Since Chloride is a major
constitute of saline water, and it directly affects Electrical conductivity, a close
correlation between the Electrical Conductivity and Chloride concentration is obtained
[1, 2]. Along with the physical parameters of temperature and Electrical conductivity, pH
has an important role in water quality measurements. To validate salinity, in this study,
the estimation of Chloride concentration in seawater is done, and it is computed with the
help of three physico- chemical parameters using Artificial Neural Network as a
prediction tool.
6.6 Sampling field description
The experimental site chosen is located at Manora (Thanjavur District) – Mimisal
(Pudukkottai District), Middle East coastal region, Tamil Nadu, South India (Figure 6.4).
The average temperature over the year varies from 26°c to 35°c and rainfall of 279mm. It
has a dry climate, with a long frost-free period and relatively high summer temperatures.
The water samples are collected at every 2kms from Manora over 100kms to Mimisal.
6.6.1 Measurement
The seawater samples are collected at the located sites and packed in an air
tightens PVC bags. To carry out the known input and output for training the neural
network model, measurements of pH and temperature are made in- situ using HI96107
(HANNA instruments) and thermometer respectively for the samples. To monitor the pH
value of seawater samples, the pH probe is calibrated using distilled water for all the
samples. After calibration, the probe is dipped into the sample and then the value is
taken. The Electrical Conductivity of the samples is measured using conductivity meter
(ELICO CM 180) and it is reported in terms of milli siemens per centimeter (mS/cm).
The Chloride concentration for the samples is measured using standard method of
titration.

155
6.7 Back propagation neural network training
In this study, the neural network model with back propagation algorithm is used
to predict the concentration of Chloride. It has three input neurons, one output neuron and
hidden layer with five neurons. In the data used, pH varied from 8.1 to 9.3, the
temperature lies between 28ºC to 30ºC while the EC took the values of 25mS/cm to 34
mS/cm.
The back propagation algorithm uses sigmoid activation function f(x) = 1/(1+e-x).
The training is achieved using the equation 6.1 and the training pattern data is given in
table 6.8. Before the training of the neural network, the input and output parameters are
normalized. The transference functions used within each neuron layer were preset as
sigmoidal and linear for the hidden and output layers, in that order.
6.7.1 Genetic Algorithm based back propagation neural network training
Genetic algorithm based back propagation neural network offer good
generalization ability although it is difficult to determine the optimal network
configuration and network parameters. The architecture of GA based BPNN consists of
input layer with three neurons (pH, temperature, Conductivity), hidden layer with five
neurons and output layer with one neuron.
Genetic Algorithms (GAs) are search algorithms based on the mechanics of the
natural selection process (biological evolution) [3, 4]. During each temporal increment
(called a generation), the structures in the current population are rated for their
effectiveness as domain solutions, and on the basis of these evaluations, a new population
of candidate solutions is formed using specific genetic operators such as reproduction,
crossover, and mutation. The most basic concept is that the strong tend to adapt and
survive while the weak tend to die out. That is, optimization is based on evolution, and
the "Survival of the fittest" concept. GAs has the ability to create an initial population of
feasible solutions, and then recombine them in a way to guide their search toonly the
most promising areas of the state space. Each feasible solution is encoded as a
chromosome (string) also called a genotype, and each chromosome is given a measure of
fitness via fitness (evaluation or objective) function [5, 6]. In this method, the Neuro

156
solution software is used for the training and is done by selecting GA search for the input
parameters.
The various learning rules used to train the neural networks are Conjugate
Gradient method, Deltabardelta method, Momentum and Levenberg Marquadt method.
The data in Table 6.8 is trained using the above learning rule to find the better, which
reduces the error. In the case of conjugate gradient method the input gets diverged which
resulted in large error. The network when trained using delta bar delta and Levenberg
method converged quickly not able to result in minimum error. The only leaning rule,
which got converged quickly and resulted in minimum error, is momentum and hence
this is used to find the Chloride concentration. An iterative search for the optimum
learning rate and momentum is done in table 6.10. A suitable learning rate and
momentum factor can prevent the network from being trapped in local minimum error
surface. From table 6.10 the best learning rate and momentum are found to be 0.6 and
0.7 respectively with a hidden layer for various numbers of epochs.
6.7.2 Validation and testing pattern
The (internal) validation process is used to internally evaluate the fitness degree,
and it is used to stop training if the sum of residuals for this set, increases. This
precaution is aimed to prevent over fitting, and so, to accomplish good generalisation
ability, that is, good prediction ability for points not participating in training. In this
validation process, the trained network model is used to compute the concentration of
Chloride for the known input parameters. In table 6.9 (validation data), the input
parameters (pH, temperature, Electrical conductivity) for the seawater samples and their
Chloride concentration computed by the two models are compared with the measured
results. It is found that the computed results agree with the conventional method
(Titration), which shows the efficiency of the Artificial Neural Network model. During
the Testing (external validation), these simulated models are used to compute the
Chloride concentration of seawater samples, which are not involved in training pattern.
These results are plotted in a graph (Figure 6.5 - Testing pattern for 20 samples using GA
based BPNN vs Measured and Figure 6.6 - Testing pattern for 20 samples using BPA NN
versus Measured) with the measured results. The prediction method developed using

157
Genetic Algorithm based Back propagation Neural Network is well suited for the
Chloride estimation of seawater and the prediction accuracy is proved with the help of
statistical studies.
6.8 Results and Discussion
The table 6.8 gives the Input and output data for thirty samples of sea water which
are used for training pattern. Table 6.9 gives the cross validation set of data where the
trained data are internally tested to check the ability of producing the output data. It is
found that the Chloride concentration computed using GA based BPNN method is in
good agreement with the measured results than that of BPA NN method. The testing
patterns of Chloride concentration of 20 seawater samples using the developed models
are shown in figure 6.5 and 6.6. It can be seen that there is no obvious difference
between those the predicted and measured results for GA based back propagation neural
Network.
6.8.1 Adaptiveness of the model
To check the adaptiveness of the model for various seasonal conditions, the
Chloride concentration is computed at various input parameters. The temperature input is
varied from 15° C to 45° C and the corresponding changes in pH and Electrical
conductivity are monitored by the use of probes. The Concentration also measured at
that particular variation in the inputs. As the temperature increases the Electrical
Conductivity and relatively Chloride Concentration also increases. But there is no
considerable variation is observed in the value of pH for the sample. It has to be noted
that during summer season (when the temperature is high) the concentration of Chloride
increases relatively with the Electrical conductivity and the reverse is observed during
winter season (when the temperature is low). The predicted Chloride concentrations for
various temperatures using the two methods are shown in figure 6.7 and figure 6.8. The
corresponding variation in Electrical conductivity is also plotted in figure 6.9 and Figure
6.10 for these methods. The continuous line (predicted) in the graph matched with the
dotted line (measured) for the method using GA based BPNN than that of Back
propagation Neural Network.

158
6.8.2 Comparison between the results obtained using Genetic and Back propagation
algorithm
The table 6.11 compares the statistical reports of the testing pattern computed
using two models with that of measured results. The values of statistical parameters for
the GA based BP NN Method approaches the conventional method than the other
Method. The linear regression equation between the predicted and measured for GA
based back propagation Neural Network gave the slope of 1.07 and intercept of -1205 for
testing and for another model 1.07 and -1075. The Genetic Algorithm based BPNN well
correlated R= 0.98 (n=20) with that of the conventionally measured Chloride
Concentration than that of another model R= 0.85.
6.8.3 As an Effective Tool
The ANN method is a good prediction tool for the estimation of Chloride
concentration in seawater samples over the other methods like Chloride ISE, titrations,
and Ion chromatography which are time consuming and expensive. ISEs are accurate
when recently calibrated, but are sensitive to drift, and are not ideal for field monitoring.
Titrimetry methods can generate hazardous wastes that require proper disposal. Ion
Chromatography is an accurate laboratory method, but cannot produce real time data
needed for rapid decisions in the field. Using NN model, estimation of Chloride
concentration offers several advantages over currently available Chloride analysis
methods. This model provides more robust data sets for long-term projects such as salt-
water intrusion studies of coastal aquifers, salinity studies, salt marsh studies and coastal
wet lands monitoring projects.
6.8.4 Chloride Influence for aquatic organisms
Chloride concentration of sea water collected at various places varies from
14,000 to 16,900 ppm. It is maximum at Kattumavadi (Pudukkottai, Tamil nadu, South
India) and minimum at Mimisal (Pudukkottai, Tamil Nadu, South India). Chloride is a
common component of waters and is beneficial to fish in maintaining their osmotic
balance. In commercial fish production Chloride is often added to waters to obtain a

159
minimum concentration of 60 mg/l. This is done because fish are susceptible to “brown
blood” disease caused by excess Nitrite in the water. A ratio of Chloride to Nitrite of 10:
1 reduces Nitrite poisoning. High Chloride levels are a concern only if the water is also
used to irrigate sensitive land based crops.
Eels plasma Chloride ion concentration is easy to measure and is often used as an
indication of osmoregulatory status, on the assumption that it is proportional to total ionic
concentration. The plasma Sodium concentration minus Chloride concentration
difference is often used as a rough approximation to calculate strong ion difference (SID).
The gram positive, aerobic, moderately halophilic bacterium Halobacillus halophilus
(marine organism) is challenged in its environment by frequently changing salt
concentrations. H.halophilus is shown to be the first prokaryote that is dependent on
Chloride for growth. In a search for the biological function of Chloride in this prokaryote
different Chloride dependent processes are identified, which suggests a more general role
for Chloride in the metabolism of H. halophilus. In addition to growth, endospore
germination, activation of transport of the compatible solute glycine betaine, motility and
flagulum production has been identified as Chloride dependent processes. These very
different functions of Chloride suggest a more general role for Chloride in the physiology
of H.halophilus such as involvement in regulatory processes or interaction with the
environment.
The transformation from salt stressed halo tolerant organism to moderate
halophile was accompanied by the change of an inducible stress regulon to a constitute
regulon strictly required for growth; gene expression and protein production can now
occur optimally only at “high” salt concentrations, which results in the strict salt
dependence of growth. If the salt concentration falls below a certain threshold, then
growth is impaired due to the lack of gene expression.

160
6.9 Conclusion
The neural network with back propagation algorithm is designed to compute
Chloride concentration in soil samples which are collected from Thanjavur to
Nagapattinam, Tamil Nadu, South India. The accuracy of the computed results is
confirmed by the comparison of statistical reports between the measured data and the
computed data. The soil salinity can be determined using the soil Chloride concentration
and it is used for the plantation and cultivation of proper crops, vegetables and fruits.
The Electrical Conductivity, pH, temperature are measured and the data are used
for training the neural networks (GA based BPNN and BPA NN). From the trained neural
network, the Chloride concentration of sea water samples of Middle East coastal region,
Tamil Nadu, South India is computed. It is observed that the Genetic algorithm based
back propagation neural network method tracked the experimental data very closely than
back propagation algorithm to estimate the Chloride concentration. The performance of
the network is obviously dependent on the quality and completeness of data provided for
system training. Using Chlorinity, it is easy to determine the salinity of the seawater,
which took great effect on ocean environmental monitoring system. It is observed that,
BPA NN learning is very fast, but the accuracy is inadequate. Whereas, GA based BPNN
iteration took long time compared to that of BPA, but the accuracy is good enough
having the learning rate of 0.6 and momentum of 0.7 layer for 30 000 epochs.

161
Table 6.8 Training pattern of 30 samples for GA based BPNN method and BPA NN
method
Sample
i.d
pH T
(° C)
EC
(mS/cm)
Cl- Con
(ppm)
Sample
i.d
pH T
(° C)
EC
(mS/cm)
Cl- Con
(ppm)
1 8.1 30 30 15744 16 8.8 30 30 16173
2 8.6 28 29 15035 17 9.0 30 30 15957
3 8.8 30 28 16311 18 9.0 30 30 15937
4 8.6 30 30 16382 19 9.0 30 30 16453
5 8.8 30 32 16666 20 8.8 30 28 15531
6 8.8 30 29 16169 21 8.9 30 29 15460
7 8.8 30 31 15957 22 9.3 28 29 16098
8 9.0 30 31 15531 23 9.2 28 29 15247
9 9.2 30 33 15460 24 9.1 28 30 16670
10 9.2 30 33 15389 25 9.1 28 28 16878
11 8.6 30 28 15673 26 9.1 28 29 15460
12 8.7 30 34 16169 27 9.1 28 29 15035
13 8.7 28 28 16453 28 9.1 28 27 14983
14 8.8 28 28 16595 29 9.1 28 26 14751
15 8.8 28 29 16524 30 9.0 28 25 14254

162
Table 6.9 Validation (Internal) using GA based BPNN method and BPA NN method
Chloride Concentration (ppm) Input Parameters Sample
i.d
pH T(° C) EC
(mS/cm)
Measured Using GA
based BPNN
method
Using
BPA NN
method
3 8.8 30 28 16311 16248 15981
7 8.8 30 31 15957 15906 16356
14 8.8 28 28 16595 16515 16466
17 9.0 30 30 15957 16099 16126
23 9.2 28 29 15247 15167 15223
29 9.1 28 26 14751 14758 14862
Table 6.10 Hidden Layer with various learning rates and epochs for GA based
BPNN
Hidden Layer S.No
Learning rate Momentum
Epochs Error
Percentage
1 1 0.7 1,000 27.8
2 0.4 0.7 20,000 24.4
3 0.4 0.7 30,000 2.7
4 0.5 0.7 30,000 3.5
5 0.3 0.7 30,000 2
6 0.4 0.7 30,000 0.5
7 0.5 0.7 30,000 0.47
8 0.6 0.7 30,000 0.37

163
Table 6.11 Statistical Results of the computed data (Testing) for 20 samples
Parameters Measured GA based BPNN
Method
BPA NN Method
Mean Value 16059 15961 15861
Std Err of Mean 145.22 143.53 136.66
Median Value 16204.5 16079.5 16112.5
Std Err of Median 181.52 179.42 170.83
Mean Dev 503.805 473.8 500.82
S. D 649.44 641.91 611.19
Std err of S.D 102.68 101.49 96.63
Co-eff of Variation 4.04 4.02 3.85
S.E of Co-eff of Var 0.639 0.635 0.609

164
Figure 6.4 Site map for sampling field

165
Figure 6.5 Testing pattern for 20 samples using GA based BPNN vs Measured
12500
13000
13500
14000
14500
15000
15500
16000
16500
17000
17500
1 2 3 4 5 6 7 8 9 10 11 12 13 14 15 16 17 18 19 20
No of Samples
Chl
orid
e C
once
ntra
tion(
ppm
)
Computed
Measured

166
Figure 6.6 Testing pattern for 20 samples using BPA NN versus Measured
12500
13000
13500
14000
14500
15000
15500
16000
16500
17000
17500
1 2 3 4 5 6 7 8 9 10 11 12 13 14 15 16 17 18 19 20
No of Samples
Chl
orid
e C
once
ntra
tion(
ppm
)
Computed
Measured

167
Figure 6.7 Prediction of Chloride concentration for various temperatures using GA
based BPNN method (Sample id: 5)

168
Figure 6.8 Prediction of Chloride concentration for various temperatures using BPA
NN method (Sample id: 5)

169
Figure 6.9 Prediction of Chloride concentration for various Electrical Conductivity
using GA based BPNN method (Sample id: 5)

170
Figure 6.10 Prediction of Chloride concentration for various Electrical Conductivity
using BPA NN method (Sample id: 5)

171
References
1. Cristina Windsor, Rob Mooney, Verifying the use of specific conductance
as a surrogate for Chloride in seawater marices. Naples, Florida, USA, June (2008).
2. Hamid Zare Abyaneh, Nazemi A.H., Neyshabori M.R., Mohammadi K.,
Majzoobi G.H., Tarim bilimleri dergisi, , 11-1(2005), 110-114.
3. Asif Ullah Khan T. K., Bandopadhyaya , Sudhir Sharma, IJCSNS International
Journal of Computer Science and Network Security, 8-7(2008).
4. Diamonto poulou M.J., Antonopoulos V.Z., Papamichail D.M., European water,
11-12(2005), 55-62.
5. Whitley, A Genetic Algorithm Tutorial, Technical report CS, Dept of Comp Sci,
Colorado State University, (1993), 93-103.
6. Azedine Charef, Antoine Ghauch, Patrick Baussand, Michel Martin-Bouyer,
Measurement , 28 (2000), 219-224.


172
CHAPTER VII
PREDICTION OF RATE OF CORROSION IN MILD STEEL
In this chapter, the negative effect of Chloride which causes corrosion on the
surface of steels is explained. The corrosion behavior of mild steel in hydrochloric acid is
investigated by the use of Weight loss measurement method. A neural network with back
propagation algorithm is employed to compute the Rate of Corrosion for mild steel at
various aqueous environments (pH, temperature, Chloride concentration). Fifty data set
are used for training, validation and testing of neural network. The effect of pH,
temperature and Chloride concentration on corrosion also discussed.
7.1 Introduction
The corrosion of metals remains a world-wide scientific problem as it affects the
metallurgical, chemical and oil-industries. The increasing interest in the manufacture of
hydrochloric acid has created the need for obtaining information on the corrosion
resistance of mild steel to hydrochloric acid attack [1, 2]. Mild steel corrosion in acid
solution has been effectively controlled by the use of organic substances containing
nitrogen, oxygen, or sulphur in the conjugated system as inhibitors [2-4].
Mild steel finds application in many industries due to its easy availability, ease of
fabrication, low cost and good tensile strength besides various other desirable properties.
It suffers from severe corrosion when it comes in contact with acid solutions during acid
cleaning, transportation of acid, de-scaling, storage of acids and other chemical
processes. The heavy loss of metal as a result of its contact with acids can be minimized
to a great extent by the use of corrosion inhibitors. Hydrochloric acid is the most difficult
of the common acids to handle from the standpoints of corrosion and materials of
constructions. Extreme care is required in the selection of materials to handle the acid by
itself, even in relatively dilute concentrations or in process solutions containing
appreciable amount of hydrochloric acid. This acid is very corrosive to most of the
common metals and alloys. Metals are exposed to the action of acids in many different
ways and for many different reasons. Processes in which acids play a very important part
are [4], Acids pickling, industrial acid cleaning and oil well acidizing in order to

173
stimulate of oil well. One of the most commonly used acids in today’s industrialized
world is hydrochloric acid HCl, where some of its applications include chemical cleaning
and processing, acid treatment of oil wells and other applications.
Corrosion by Chloride can occur by the following ways: (i) Chlorides are held
to pass through the protective oxide film, which exists on the steel surface in a high pH
environment, hence, depassivating the steel (ii) adsorption of Chlorides on the steel
surface and thus promoting the hydration of metal ions and facilitating depassivation and
(iii) it is supposed that Chlorides are able to compete with hydroxyl ions for the ferrous
ions produced by corrosion process. The effect of temperature on a chemical reaction is
of practical and theoretical important. Like most chemical reactions, the rate of corrosion
of iron and steel increases with temperature especially in media in which evolution of
hydrogen a companies corrosion, e.g. during corrosion of steel in acids. With increasing
temperature, the contribution of Chloride increases but the effect of hydrogen decreases
due to its increased mobility in the ferrite matrix. The most significant environmental
conditions, which influence the corrosion behavior of steels, are the Chloride ion
concentration, temperature and pH. Reliable prediction of the Rate of corrosion behavior
is the fundamental step towards effective control of Corrosion.
Artificial Neural Network (ANN) technique [5] is suited for the problem that
involves non linear interpolation. Ability to learn by example makes neural network
flexible and powerful [6]. In recent past, ANN has been successfully applied to model
various corrosion behaviors [7-10]. A neural network model using back propagation
algorithm has been used to predict the Rate of corrosion of mild steel with three input
neurons of pH, temperature and Chloride concentration. Out of Fifty data set, thirty data
set of Rate of corrosion of mild steel (by Weight Loss measurement) has been taken for
training set. Nine data set are used for validation from the training pattern. Twenty data
set is used for testing pattern. A good correlation between experimental and predicted
data is obtained, which shows a high prediction capability of neural network.

174
7.2 Experimental procedures
7.2.1 Materials
Mild Steel specimens are cut to size of 5 x 1 cm from mild steel sheets having the
percentage composition: Fe = 99.686, Ni =0.013, Cr=0.043, S=0.014, P=0.009, Si=0.007,
Mn=0.196 and C = 0.017. The surfaces of specimens are polished with emery papers
ranging from 110 to 410 grades. The hydrochloric acid with various concentrations of
0.1N, 0.15N, 0.2N, 0.25N, 0.3N, 0.35N, 0.4N, 0.5N and 0.75N with pH from 0.12 to 1
are prepared. All the solutions are prepared with AR grade chemicals in double distilled
water.
7.2.2 Method- Rate of corrosion by Weight loss measurement
Weight loss measurements are performed as per American Society for Testing
and Materials (ASTM) method [11] to determine the Rate of corrosion. The polished
mild steels are initially weighed in an electronic balance. After that the specimens are
suspended with the help of thread and glass rod in 100 ml beaker containing hydrochloric
acid having concentration range from 0.1N to 0.75N with pH (0.12-1) at different
temperature varied from 290K to 333K. The specimens are removed after 4 hours
exposure period. They are dried and reweighed to determine the Rate of corrosion.
Rate of corrosion (mmpy) = Density of mild steel x loss in weight (mg) x time (h)
Area of mild steel (cm2)
Density of mild steel = 87.6
Loss in weight = Final weight (mg) – Initial weight (mg)
Time (h) = 4 hours; Area of mild steel = 5 x 1 cm
7.3 Explicit Neural Network formulation for Rate of Corrosion
The neural network architecture that proved able to solve the problem has three
input neurons, one output neuron and one hidden layer with ten processing elements
(neurons). In the input data used, the temperature lies in the interval of 290K to 333k, the
Chloride concentration ranges from 0.1N to 0.75N while the pH values are in the range of
0.12 to 1. The Rate of corrosion calculated from weight loss measurements method is
used as output parameter. The input – output neuron architecture is shown in figure 7.1.
Out of 50 data set, 30 data set are used to train the NN while the remaining is used for
testing. Since test data set are not used for training, it essentially verified the ability of

175
any ANN model to associate and generalize a true physical response, which is unknown
to the network.
7.3.1 Training pattern
Before the execution of the training process of neural network, the input and
output parameters were normalized in the range of (-0.95; 0.95) via in order to acquire
accurate results. The generalized delta rule uses sigmoid activation function f(x) = 1/
(1+e-x). The learning is achieved through the equation 6.1 (Chapter VI). The training
pattern is given in table 7.1.
The error between computed results and expected results are decreased with
increasing epochs and training for learning is finished within a target convergence. One
hidden layer is found to be adequate for the present problem. Neurons in the hidden layer
more than 12 are not tried in order to avoid overfitting. It could be observed that ANN
model with 10 hidden neurons produced best performance and is considered to be the
optimal configuration for the present problem. An iterative search for the optimum
learning rate and epochs is done in table 7.2. A suitable learning rate can prevent the
network from being trapped in local minimum error surface. From table 7.2, the best
learning rate is found to be 0.6 with a hidden layer for 30,000 epochs.
7.3.2 Validation of the proposed NN model
In this part of the study, the developed NN model is verified through the relevant
data obtained from experimental. For this, 9 data are selected randomly from the trained
data (Table 7.1) as seen in table 7.3. Then, these data are evaluated using the developed
model. To demonstrate the robustness and generalization capability of the model, the
statistical test results of validation data set are also given in table 7.4. It is observed that
there is a significantly high compromise between the experimental and the developed
model indicating the powerful performance of NN Model.
7.3.3 Testing pattern
To make sure that the network has not just memorized the training data but really
extracted the general features of the problem, new test data which are not included in the
training set, are presented to the NN. If the performance of the network on this test data
set is satisfactory, the network can be assumed properly trained and is ready to be used.
During the testing (external validation), the simulated model is used to compute the Rate

176
of corrosion of mild steel samples for various pH and Chloride Concentration at the
temperatures of 318K and 333K, which are not involved in training pattern. These results
are plotted in a linear regression pattern (Computed versus Experimental Results) which
is shown in figure 7.2 and figure 7.3 for the temperatures 318K and 333K respectively.
7.4 Results and Discussion
7.4.1 Performance of the developed model
A high prediction capability is achieved for testing data set even though it is not
employed in the training of the NN. The overall performances of validation data set and
testing data set are evaluated via mean absolute percentage error and the correlation
coefficient R which is shown in table 7.5. As seen in table 7.5, high correlation
coefficient 0.99 is achieved for both validation and testing data sets. Moreover the model
provided highly reasonable mean absolute percentage errors 1% and 2% for the
validation and testing data sets respectively. The results of testing phase in figure 7.2 and
7.3 indicated that the NN appears to have a high generalization capability between the
input variables and the output response.
7.4.2 Effect of Chloride content
Weight loss measurement has been used in the present study to determine the Rate
of corrosion. The variation of corrosion rate of mild steel with Chloride ion
concentration in acidic environment is shown in figure 7.4, which shows that Rate of
corrosion increases with increase in Chloride concentration at 290K temperature. It is
because of Chloride ions are highly aggressive for mild steel due to very high solubility
of iron Chloride. In this study, the range of Rate of corrosion varied from 1.396 mmpy to
507.91mmpy by varying Chloride concentration from 0.1N to 0.75N and temperature
from 290K to 333K. It has been suggested that corrosion occurred as a result of
adsorption of aggressive anions on film followed by penetration of this film under the
influence of an electrostatic field [12].
7.4.3 Effect of pH and temperature
Figure 7.5 shows the dependence of corrosion on the pH at 290K temperature. It
could be observed that the Rate of corrosion increases with decrease in pH. This strong
influence of pH on the Rate of corrosion of mild steel could be attributed to the result of
acceleration of Cathodic reaction due to high concentration of hydrogen ions.

177
Figure 7.6 shows that corrosion increases with increase in temperature (290K,
303K, 310K, 318K and 333K) at 0.75N Chloride concentration. The results indicate the
possibility of a temperature induced change in the mild steel surface. The defect
structure of semiconductor Fe-Cr-Ni alloys may change from p-type to n-type with
temperature. It has been argued that n-type films could be more susceptible to corrosion
initiation than p-type films due to the existence of oxygen vacancies. This may enhance
the transport of Chloride ions through the oxide lattice [13, 14]. It could be observed that
almost a linear relationship has been obtained between Rate of corrosion and
temperature. The gradient of the Rate of corrosion versus temperature curves varied
between 1.39 Mmpy to 507 mmpy over the whole range of Chloride concentration and
pH. The combined influence of Chloride concentration and pH on Rate of corrosion at
the temperatures 290K, 303K and 310K is shown in figure 7.7, figure 7.8 and figure 7.9
respectively. It could be observed that the Rate of corrosion increases with the decrease
in pH, and increase in Chloride concentration.
The above analysis suggests that the developed ANN model can efficiently
simulate the intricate inter relationship between the Rate of corrosion and various
environmental parameters viz. Chloride concentration, pH and temperature. The model
in turn would help to predict the Rate of corrosion of mild steel as a function of the above
environmental parameters with a high degree of accuracy and reliability.
7.5 Conclusion
Mild Steel is subjected to Weight loss measurement tests in various aqueous
environments by varying Chloride concentration (0.1N to 0.75N), pH (0.12 to 1) and
temperature 290K to 333K. A three layer neural network model with back propagation
algorithm is employed to predict the Rate of corrosion of mild steel with three input
parameters (pH, Chloride Concentration and Temperature). The developed model is fast
and is able to produce an output that has minimum error. On modeling with neural
network, a good correlation between experimental and predicted data is obtained. The
correlation coefficient of the validation and test data is 0.998 and 0.99 respectively,
which reflects the excellent predictability of the model. Besides, it is seen that by
increasing Chloride concentration and temperature and decreasing pH are found to
increase the Rate of corrosion.

178
Table 7.1 Input and output data base of training set
Temperature
(K)
pH Chloride
concentration (N)
Rate of corrosion
(mmpy)
1 0.1 1.39 290
0.82 0.15 1.54
0.69 0.2 1.78
0.60 0.25 1.92
0.52 0.3 2.12
0.45 0.35 2.24
0.39 0.4 2.39
0.34 0.45 2.46
0.30 0.5 2.52
0.12 0.75 3.86
1 0.1 2.56 303
0.82 0.15 2.71
0.69 0.2 2.89
0.60 0.25 3.18
0.52 0.3 3.34
0.45 0.35 3.51
0.39 0.4 3.72
0.34 0.45 4.08
0.30 0.5 4.27
0.12 0.75 6.46
1 0.1 63.74 310
0.82 0.15 78.23
0.69 0.2 85.56
0.60 0.25 93.87
0.52 0.3 116.52
0.45 0.35 125.86
0.39 0.4 138.29

179
0.34 0.45 146.48
0.30 0.5 152.32
0.12 0.75 225.18
Table 7.2 Hidden Layer with various learning rates and epochs for BPA NN method
Learning Rate Epochs Error
Percentage
1 1,000 24.8
0.4 20,000 21.4
0.5 30,000 3.7
0.5 30,000 1.5
0.3 30,000 3
0.4 30,000 0.5
0.5 30,000 0.46
0.6 30,000 0.33

180
Table 7.3 Validation set of the developed NN model
Rate of Corrosion (mmpy) Temperature (K)
pH Chloride Concentration (N) By
Experimental By Neural Network
290 0.60 0.25 1.92 1.98
0.12 0.75 3.86 3.78
0.34 0.45 2.46 2.16
303 0.69 0.2 2.89 2.83
0.39 0.4 3.72 3.66
0.30 0.5 4.27 4.47
310 1 0.1 63.74 63.66
0.52 0.3 116.52 115.91
0.45 0.5 152.32 151.87
Table 7.4 Statistical results for the validation data set
Statistical parameters Experimental results Neural network results
Mean 39.07 38.92
Std Err of Mean 18.31 18.25
Median 3.86 3.78
Std Err of Median 22.89 22.81
Std Dev 54.93 54.75
Std Err of Std Dev 12.94 12.90
Mean Deviation 47.85 47.70
Coeff of Variation 140.58 140.66
S.E of Coeff of Variation 33.13 33.15

181
Table 7.5 Performance of the NN model
Parameters Validation Test set
Error% 1% 2%
R 0.99 0.99
Slope - 0.991 at 318K 0.995 at 333K
Intercept - 2.66 at 318K 0.818 at 333K

182
Figure 7.1 Input – Output neuron architecture

183
Figure 7.2 Predicted Rate of Corrosion from the Neural Network versus
Experimental results at 318K

184
Figure 7.3 Predicted Rate of Corrosion from the Neural Network versus
Experimental results at 333K

185
Figure 7.4 Variation of Rate of Corrosion with Chloride concentration at 290K
0
0.5
1
1.5
2
2.5
3
0.1 0.15 0.2 0.25 0.3 0.35 0.4 0.45 0.5
Chloride Concentration (N)
Rat
e of
Cor
rosi
on (
mm
py)

186
Figure 7.5 Variation of Rate of Corrosion with pH at 290K
0
0.5
1
1.5
2
2.5
3
1 0.82 0.69 0.6 0.52 0.45 0.39 0.34 0.3
pH
Rat
e of
Cor
rosi
on (
mm
py)

187
Figure 7.6 Variation of Rate of Corrosion with Temperature at 0.75N
0
100
200
300
400
500
600
290 303 310 318 333
Temperature
Rea
te o
f C
orro
sion
(m
mpy
)

188
Figure 7.7 Combined influence of pH and Chloride concentration on Rate of
Corrosion at 290K

189
Figure 7.8 Combined influence of pH and Chloride concentration on Rate of
Corrosion at 303K

190
Figure 7.9 Combined influence of pH and Chloride concentration on Rate of
Corrosion at 310K

191
References
1. Abiola O. K., Oforka N. C., Corrosion Science and Engineering, 3(2002), 1.
2. Noor E. A., Corrosion Science, 47(2005), 33
3. Langrenee M., Mernari B., Bauanis M., Traisnel M., Bertiss F., Corrosion Science,
44 (2002), 573.
4. Libin Tang, Xueming Li, Guannan Mu, Lin Li and Guangheng Liu, Applied Surf. Sci.,
253(2006), 2367-2372.
5. Sha W., Edwards K.L., Mater Design, 28(2007), 1747.
6.Yilmaz Muharrem, Metin Ertunc H., Mater Design, 28(2007),599.
7.Cottis R.A., Qing Li , Owen G., Gartland S.J., Helliwell I.A., Turega M., Mater Design,
20(1999),169.
8. Smets H.M.G., Bogaerts W.F.L., Mater Design, 13(1992), 149.
9. Malinov S., Sha W., Mater Sci Eng A, 365(2004), 202.
10.Parthiban Thirumalai, Ravi R., Parthiban G.T., Srinivasan S., Ramakrishnan K.R.,
Raghavan M., Corros Sci, 47(2005),625.
11. Saratha R., Vasudha V.G., E-Journal of Chemistry, 6-4(2009), 1003-1008,
12. Hoar T.P., Mears D., Rothwell G., Corros Sci, 5(1965), 279.
13. Manning P.E., Duquette D.J., Corros Sci, 20(1980), 597.
14. Bianchi G., Cerquetti A., Mazza F., Torchio S., International conference on localized
corrosion, (Stachie R.W., Brown B.F., Kruger J., Agrawal A. editors), NACE,
Houston TX, (1974)., 399.


192
SUMMARY, CONCLUSION AND SUGGESTIONS FOR FUTURE WORK
Summary and Conclusion
Measurement and analysis using embedded system is the ever-growing
phenomenon in the field of research and development. Advances in electronics
technology and innovative manufacturing processes have driven the semiconductor
industry towards extensive miniaturization and ever greater integration of chip design.
Embedded systems have three common principles: real-time performance, low power
consumption and low price (limited hardware). Embedded computers use chip
microprocessors (CMPs) to meet these expectations. The aim of this study is to explore
various ways to increase performance, as well as reducing resource usage and energy
consumption for embedded systems. In this thesis, a primary anion Chloride, an essential
electrolyte has been measured and analysed using the designed and developed
Microcontroller based bio-analyser. The biological and environmental samples are taken
for the Chloride measurement and analysis. The microcontroller P89C668 based bio-
analyser is used for the determination of Chloride in human urine samples. After
measurement using embedded system, the effect of hyperchloremia and hypochloremia
are discussed using the obtained results. An implementation of embedded based bio-
analyser (P89C51RD2) has been used to determine the Chloride concentration in
pharmaceutical sample of Oral Rehydration Salts (ORS) too. The results arrived are
compared with the other analytical technique (ISE) to confirm the accuracy of the
developed embedded based bio-analyser.
Designing high performance and low power embedded systems with various
constraints and limited resources has become an important research problem. Three
embedded based bio-analysers using three different microcontrollers (P89C668,
PIC16F877 and PSoC CY8C27443) are designed and developed and their performance is
studied. A comparative study has been done to find the high performance and low power
bio-analyser to measure serum Chloride. The Microcontroller P89C668 (Philips) with
external Amplifier (LM108), Analog to Digital converter (MCP3202), the
microcontroller PIC16F877 (Microchip) with external Amplifier (LF353) and built – in

193
Multiplexer and Analog to Digital Converter and the microcontroller PSoC CY8C27443
(Cypress) with built in Amplifier, Multiplexer and Analog to Digital converter are the
three different microcontrollers which are taken for the comparative study. The accuracy
of the developed embedded based bio-analysers is analysed by evaluating various
analytical parameters (linearity, sensitivity, precision, recovery, statistical analysis). In
addition to the various features of the microcontrollers their power consumption and their
processing time (speed) also compared. From the comparative study, it is found that the
power consumption is less for PSoC (CY8C27443) (recent breakthrough in technology)
based bio-analyser because of built-in digital and analog peripherals. PIC16F877 based
bio-analyser consumes more power than the other two bio-analysers. The power
consumption of P89C668 based bio-analyser is slightly higher than that of PSoC based
bio-analyer. Considering the processing time, it is high for PSoC which means less speed
bio-analyser comparing with that of the other two. But the processing time is less (high
speed) for PIC16F877 based bio-analyser. For P89C668 based bio-analyser the
processing time is slightly higher than that of PIC16F877 based bio-analyser.
The designed Instruments are user friendly, economic, sensitive, reliable and easy
to adaptive for the measurement of Chloride in samples. The implemented system is
employed for the measurement of Chloride on laboratory standard with 96% confidence
level.
Electrical conductivity can be used as a surrogate for the Chloride concentration
determination. Hence, a linear regression model is developed correlating Electrical
conductivity and Chloride concentration. In this case, soil sample is taken for the
determination of Chloride which played an important role in the plant growth. Linear
regression model is developed by collecting 30 soil samples at every 3 kms from
Thanjavur to Nagapattinam over 90kms. The Electrical Conductivity is measured by
using ATmega32 microcontroller based instrument set up. The results obtained are
verified with the commercial instrument. The Chloride concentration can be determined
using the linear regression equation. The Chloride concentration of soil samples at
various places and their plant growth are discussed. The Electrical Conductivity
determination has replaced the tedious Chemical methods for the Chloride determination
and can be easily handled by irrigators and farm managers.

194
The Artificial Neural Network technology is a robust Artificial Intelligence
technology that can handle Non-linear problems. In this research work ANN is used for
the computation of Chloride in environmental samples. The proposed ANN implements a
Multilayer perceptron architecture featuring an input layer, hidden layer and output layer.
In order to find the optimum topology of the ANN model, several parameters have been
changed during the training process including the number of hidden layers, number of
neurons, learning factor, and number of training iterations. The Neural Network is trained
with the data is verified by performing validation and testing. The results of the testing
pattern are compared with the measured (conventional method) results. The predicted
results and the measured results have clearly demonstrated that ANNs are not only
promising but also an acceptable approach for the prediction of Chloride in samples.
ANNs have been used for the prediction of Chloride in environmental samples of soil and
sea water. In the case of soil samples, 30 samples are collected at every 3 kms from
Thanjavur to Nagapattinam over 90kms. The ANN architecture consists of one neuron in
Input layer, 6 neurons in hidden layer and one neuron in output layer. ANN computation
with distance as input parameter and Chloride concentration as output parameter. It is
found that ANN model with 6 neurons in the hidden layer produced the best performance
and is considered to be the optimal configuration for the prediction of Chloride in soil
samples. This network needs 10,000 iterations to reach RMS Error of 0.005 for the
training data and 0.006 for the test data respectively.
In the case of sea water samples, pH, Electrical Conductivity and Temperature are
used as input parameters and Chloride concentration as output parameter. The sea water
samples are collected at every 2kms from Manora (Thanjavur District) over 100kms to
Mimisal (Pudukkottai District), Middle East coastal region, Tamil Nadu, South India.
The NN is trained with Genetic Algorithm based Back propagation Neural Network and
Back Propagation algorithm. The prediction using GA based BPNN is well suited for the
Computation of Chloride in sea water. The adaptiveness of the model is checked by
varying the input parameters. As the temperature increases Electrical Conductivity and
relatively Chloride concentration also increases. But there is no considerable variation is
observed in the value of pH of the sample. Statistical studies and Linear regression
analysis are performed to confirm the accuracy of the predicted results.

195
Considering the negative aspects of Chloride, it causes corrosion on materials. In
this study, the corrosion effect on Mild steel is observed. For that, the corrosion behavior
of mild steel in Hydro Chloric Acid is investigated by weight loss method. The Rate of
corrosion is computed for the Input parameters of Chloride concentration, pH and
Temperature. ANN with BPA is used for the prediction of rate of corrosion. Effect of
Chloride concentration, Effect of pH and temperature are also discussed. The correlation
coefficient of validation and test data is 0.99 and 0.98 reflects the excellent predictability
of the NN model.
Suggestions for future work
In future, the developed bio-analyser can be used to measure other cations of
Sodium, Potassium, Calcium and Magnesium by changing the source and reagent. It is
also aimed that the developed instrument can be used to determine the cation and anion in
all biomedical samples like plasma, blood, sweat and Cerebro spinal fluid (CSF) etc as an
in-situ measurement system. The sensitivity of the instrument can be increased by using
higher ADC. In the case of Neural Network computation, the number of input data can
be increased for training to improve the prediction accuracy. The learning time can be
reduced by using various learning algorithms. Further, it is also decided that the
developed Neural Network can be used to compute the analyte concentration over wide
area of the country.


Sensors & Transducers Journal, Vol. 119, Issue 8, August 2010, pp. 142-150
142
SSSeeennnsssooorrrsss &&& TTTrrraaannnsssddduuuccceeerrrsssISSN 1726-5479© 2010 by IFSA
http://www.sensorsportal.com
Development of Bio-analyzer for the Determinationof Urinary Chloride
1R. Vasumathi , 2*P. Neelamegam 1Department of Physics, A.V.V .M Sri Pushpam College,
Poondi, Thanjavur, Tamilnadu India, 613503 2*Department of Electronics and Instrumentation Engineering, SASTRA University,
Thanjavur, Tamilnadu, India*E-mail: [email protected]
Received: 5 March 2010 /Accepted: 17 August 2010 /Published: 31 August 2010
Abstract: A high performance Microcontroller P89C668 based Biomedical Analyzer to measure the Urinary Chloride Concentration is designed and developed. The implemented system incorporates light source, Photodiode GASPG1104, Sample holder, LCD for displaying patient test results and key board for executing functions. The details of the interfacing circuit and the software to compute the concentration of Chloride ion is explained in this paper. To determine the run to run precision of the implemented system, human control serum AccutrolTM Normal (Sigma) is analyzed and the Chloride concentration is found to be 10 4± mmol/l (mean ± SD, n=5), which closes to the certified value. Goodrecovery results are obtained with the range of 98 % to 99 %. The results obtained using the designed instrument is in agreement with those obtained by the clinical analyzer. The sensitivity and linearity of the microcontroller based instrument are high enough to determine the concentration of Chloride ion without any significant interference. Copyright © 2010 IFSA.
Keywords: Chloride ion, Colorimetry, Bio-analyzer, Urine sample.
1. Introduction
Chloride is an essential electrolyte for human which occurs primarily in body fluids. This anion is specially transported into the gastric lumen, in exchange for another negatively charged electrolyte (bicarbonate) in order to maintain electrical neutrality across the stomach membrane. After utilization in hydrochloric acid, some Chloride ion is reabsorbed by the intestine, back into the blood stream

Sensors & Transducers Journal, Vol. 119, Issue 8, August 2010, pp. 142-150
143
where it is required for maintenance of extra cellular fluid volume [1]. Since, Chloride is a highly mobile ion that easily crosses cell membranes and is involved in maintaining proper osmotic pressure, water balance and acid–base balance. Several studies have suggested that the Chloride ion may play a more active and independent role in renal function, neurophysiology and nutrition. Body Chloride concentrations are regulated by excretions, primarily via the kidneys [2, 3]. Assessing the urinary composition is an important aid in the diagnostic evaluation of metabolic alkalosis.
Over the years, numerous analytical methods for Chloride in a variety of samples have been developed. Such as Ion Chromatography [4, 5], near infrared Spectrometry [6], Spectroscopy [7], Ion Selective electrode method [8], turbidimetric method [9] and so on. Among these methods, the turbidimetric method was popular and regarded relatively reliable for the quantification of Chloride. Although it often provided very accurate results, it suffered from the long experimental time, lower sensitivity, and complexity. Partly, because of lower sensitivity, few of the above methods were applied to determine Chloride in biological systems. The ISE is currently used in Chloride analysis in Biological samples. Nevertheless, these methods suffered from the drawbacks of time consuming, expensive and inapplicability to low Chloride containing samples. Colorimetry is one of the simplest and best techniques which have been used for the clinical routine assays. Hence, an inexpensive, simple and accurate Microcontroller P89C668 based Instrument has been designed and developed to measure the absorbance and hence the concentration of Chloride in Serum samples, with the results comparable with a commercial Clinical analyzer.
2. Instrumental
The signal conditioning circuit of the P89C668 microcontroller based instrumentation system is shown in Fig. 1, which measures the concentration of Chloride ion based on colorimetry principle.
According to this principle, a colorimeter measures the intensity of light shining through a coloured solution compared to the intensity of light passing into the solution. A detector measures the transmittance (T) (% of light passing through) of the solution and it is mathematically converted to absorbance (A= -log 10 T). The absorbance is directly proportional to the concentration (Beer-Lambert law) [10, 11]. The developed instrumentation system incorporated with Green LED (480 nm) as the source for measuring Chloride ion concentration. The photo detection assembly is well insulated from outer light. It has a sample holder to hold the solutions like blank, standard and sample test tubes. A photo diode of GASPG 1124 is used to detect the amount of light falling on the sample. The output signals are fed to OP-AMP CA3041, which is connected to the pin 13 of multiplexer CD4051. The temperature sensor LM35D is connected to the pin 14 of CD4051 (Fig. 1). The LM35D is a precision semiconductor temperature sensor giving an output of 10mV per degree centigrade. It is capable of measuring temperature between +2 °C and +100 °C. The output is proportional to degree centigrade. It has low current drain and low self-heating. The multiplexer (pin 3) is connected to ADC MCP3201 through pin 2, to convert analog signals to digital value [12]. IC MCP3201 is a successive approximation type 12 bit serial A/D converter compatible with the SPI protocol, sample rate of 100ksps at clock rate of 1.6 MHz and operates over broad voltage range of 2.7-5.5 V. The pin 10 (A) and 11 (B) of multiplexer are connected to pin 18 (P2.0) and 19 (P2.1) of Microcontroller P89C668 to select either temperature measurement or concentration measurement. The ADC is interfaced with pin 42, 43, 44 of Microcontroller P89C668 for computing urinary Chloride concentration. The microcontroller P89C668 is a quad flat package (44pins) 8 bit controller which has four I/O ports and three 16bit timer/counters. The data lines of LCD display is interfaced with Port 0 of Microcontroller. RD and WR of the Microcontroller are connected to LCD as shown in Fig. 2.
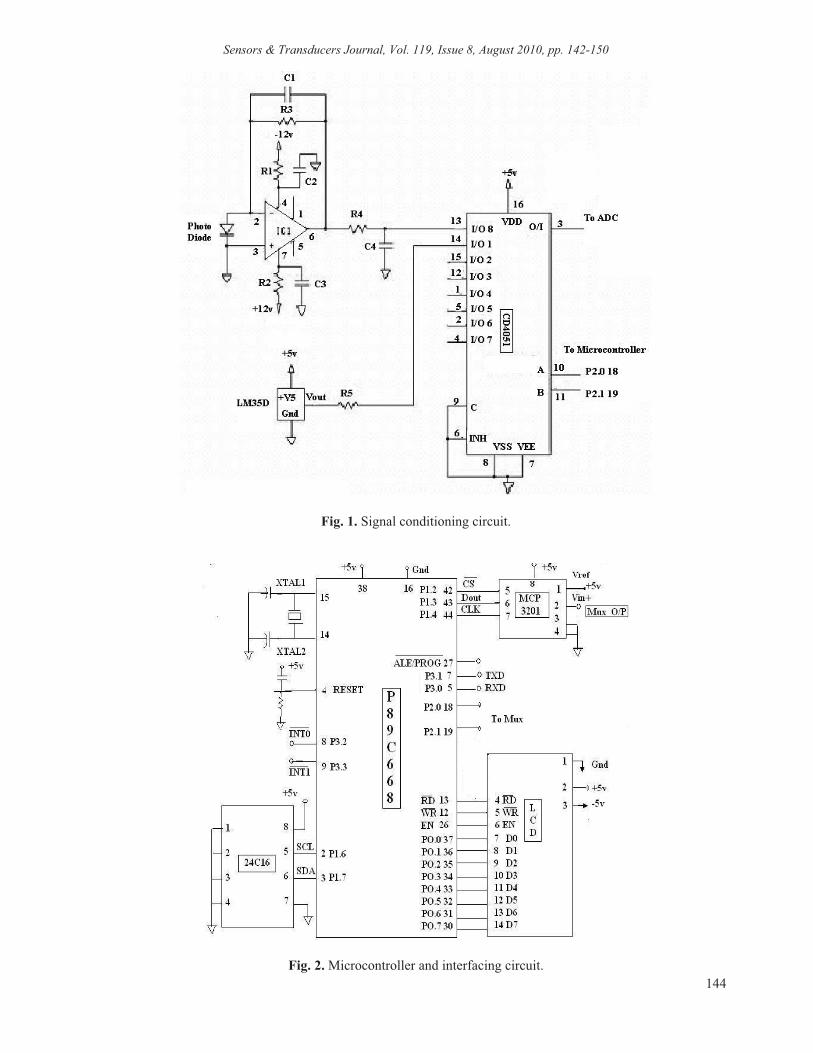
Sensors & Transducers Journal, Vol. 119, Issue 8, August 2010, pp. 142-150
144
Fig. 1. Signal conditioning circuit.
Fig. 2. Microcontroller and interfacing circuit.

Sensors & Transducers Journal, Vol. 119, Issue 8, August 2010, pp. 142-150
145
Data from Microcontroller is transferred to PC through the serial port of the Microcontroller by interfacing ICL232. A reset switch is provided so that the program is executed from 0000 after the power is switched on. A 24C16 EEPROM is interfaced with Microcontroller to store the patient i.d and test result (Chloride concentration). The 24C16 features a low power standby mode which is enabled, upon power-up and after the receipt of the STOP bit and the completion of any internal operations. It is a low cost and low voltage 2 wire serial EEPROM. The SCL (Serial Clock Line) is connected to pin 2 and the SDA (Serial Data Line) is connected to pin 3 of the Microcontroller.
2.1. Software
Software is developed in C, to initialize LCD, to start ADC conversion, to check EOC, to read 12 bit data signals, to measure and maintain temperature using ISR, to measure readings for blank, standard, and sample, to compute absorbance and concentration, to display the result in LCD and to get the data from the key board and to send data to PC for further processing. The implementation of the above tasks is given in the flowchart (Fig. 3).
Fig. 3. Flowchart.

Sensors & Transducers Journal, Vol. 119, Issue 8, August 2010, pp. 142-150
146
3. Materials and Methods
Samples are collected from the patients whose urinary Chloride has to be measured. The samples are maintained at room temperature. To measure the concentration of electrolyte, the solution of blank, standard and sample are prepared.
3.1. Materials
Chloride ion in acidic environment in presence of ferric nitrate forms a colored complex with mercuric thiocyanate. According to colorimetry principle, the intensity of the developed colour is proportional to the Chloride ion concentration in the sample [13].
2Cl- + Hg(SCN)2 AgCl2 + 2SCN-
SCN- +Fe +++ Fe(SCN)++
Two reagents R1 and R2 are used in this method. The reagent R1 consists of Mercuric thiocyanate (2m mol/l), Ferric Nitrate (20m mol/l) and Nitric acid (29m mol/l). The reagent R2 is Chloride standard solution [14, 15]. All the solutions are prepared in a well cleaned dried test tube of same diameter. Blank solution is prepared by mixing 1 ml of reagent R1 with 10 µl of distilled water. To prepare standard, 1 ml of reagent R1 is added with 10 µl of standard (R2). For sample preparation, 1 ml of reagent R1 is added with 10 µl of urine sample. The above solutions are thoroughly mixed and left for incubation for 5 min at 37 ° C, before the absorbance is measured at 480 nm.
3.2. Measurement
The test tube labeled blank is placed in a sample holder and the measured voltage is noted as Vo. By holding the standard solution test tube in a sample holder, the voltage Vstd is taken. To find the absorbance of sample solution, the sample solution is placed in a sample holder and voltage measured is noted as Vt. The concentration of urinary Chloride is determined using the formula,
Concentration of Chloride ion = log (Vo/Vt) / log (Vo/Vstd) x 100,
where, log (Vo/Vt) = Absorbance of sample, log (Vo/Vstd) =Absorbance of standard 100 is the concentration of standard Chloride.
The concentrations of urinary Chloride measurements are made for 40 urine samples using the developed instrument. The same urine samples are tested using the commercial clinical analyser. The absorbance of sample solution is measured and repeated for five times to check the reproducibility.
4. Results and Discussions
The performance of the Microcontroller P89C668 based electrolyte bio-analyser using colorimetry principle is investigated by comparing its results with the results obtained by other clinical analyser which is given in Table 1. It can be seen that there is no obvious difference between the results obtained by two methods.

Sensors & Transducers Journal, Vol. 119, Issue 8, August 2010, pp. 142-150
147
Table 1. Urinary Chloride Concentration (m mol/day).
S. No of patients
By developed instrument
By clinical analyzer
S. No of patients
By developed instrument
By clinical analyser
1 102.79 105 21 89.42 95 2 106.55 103 22 156.62 144 3 96.85 101 23 186.87 190 4 82.99 92 24 96.23 95 5 108.58 110 25 145.78 140 6 111.15 120 26 210.45 218 7 120.43 128 27 232.98 225 8 150.12 162 28 88.32 85 9 92.81 102 29 154.84 158
10 130.86 142 30 190.17 182 11 180.14 193 31 100.74 93 12 120.52 134 32 98.15 105 13 200.11 194 33 101.36 108 14 104.09 110 34 115.64 111 15 98.71 92 35 290.85 292 16 182.35 176 36 210.92 202 17 123.53 133 37 84.74 78 18 156.18 142 38 168.12 172 19 230.28 225 39 301.56 305 20 260.92 258 40 142.28 152
4.1 .Statistical Analysis
The Table 2 represents the statistical reports for the two methods. It is noted that the values of std. dev, mean value, median value, mean dev, Co-eff of variation and S.E of Co-eff of variation for the designed analyzer is close to the clinical analyzer [12]. The less residual between the two methods confirms the accuracy of the microcontroller based instrumentation set up.
Table 2. Statistical Reports for the two methods.
Variable MeanValue
MedianValue
MeanDeviation
Coeff. of Variance
SE of Coeff. of Variation
Sample Std. Deviation
DevelopedInstrument 145.75 127.19 44.28 37.47 4.18 54.61
Clinicalanalyzer 149.05 137 45.46 37.53 4.19 55.94
4.2. Detection and Quantification Limits
The detection and quantification limits are calculated as sb + 3 s, where sb is the average signal of blank solutions and s is the standard deviation. For the wavelength of 480 nm, the Absorbance change of 0.1119 typically corresponds to Chloride concentration of 68.81 m mol/l of the sample solution, which gave the sensitivity of the electrolyte bio-analyser. As the absorbance increases the Chloride concentration also increases, which shows the linearity of the instrument up to 300 m mol/l.

Sensors & Transducers Journal, Vol. 119, Issue 8, August 2010, pp. 142-150
148
4.3. Precision
Run-to-run precision is obtained by assaying commercial human control serum AccutrolTM Normal (Sigma) gave the results of Mean 104.4, S.D. 4.0, C.V (%) 3.3 and elevated results for a period of thirty (30) days produced the results of Mean 91.7, S.D. 3.8, C.V (%) 4.1. Within Run precision is obtained by assaying control Normal serum twenty (20) times having Mean 86.9 (104.4), S.D. 1.3 (4.0), C.V. (%) 1.0 (3.3).
4.4. Recovery
Recovery of Chloride added to pool human Urine is given in Table 3. Pooled Urine is diluted approximately two-fold with distilled water. To 0.5 ml of diluted Urine, various amounts of 0.1 N Sodium Chloride (NaCl) solutions are added to bring the total Chloride concentration within normal range. Using the developed Instrument the recovery values of added Chloride ranged from 98.1% to 99.3 % with an average recovery of 98.65 %, which indicates the suitability of the designed instrument for biomedical tests.
Table 3. Recovery of added Chloride from pooled Urine Chloride (mmol/day).
S. No In pooled Serum Added Total
ContentTotal
Determined Difference Recovery%
1. 82 40 122 120 2.0 98.3 2. 86 45 131 130 1.0 99.2 3. 90 50 140 138 2.0 98.5 4. 96 55 151 150 1.0 99.3 5. 104 55 159 156 3.0 98.1
4.5. Linear Regression Analysis
Linear regression analysis attempts to model the relationship between two variables by fitting a linear equation that closely fits a collection of data points. Fig. 4 shows a linear regression between the designed electrolyte bio-analyser and the commercial clinical analyser which is used to determine the correlation between the two methods. The value of slope 0.97 and the intercept 5.2 (close to ideality) indicated that the developed instrumentation system is well correlated with the clinical analyzer. The correlation coefficient between the two method is r2=0.99. The implemented method is well suited to determine the concentration of Chloride in Urine sample.
5. Conclusion
An inexpensive Electrolyte Bio-analyser has been fabricated using Microcontroller P89C688 to measure the Chloride concentration of urine. The developed system is a user friendly one, as no special training is required to use it. Normal spectrophotometers have optical lenses and filter which makes the system clumsy and difficult to use, as incandescent lamps are used as light sources, it generates lot of heat and consumes more power. All these problems are rectified in this system. Since the implemented instrument is based on colorimetry principle, any of the branded reagents which are available in local pharmaceuticals can be used. The designed instrument can be used to measure the Chloride concentration of other biological samples like serum, blood, plasma, CSF and also to measure the concentration of Sodium and Potassium by changing the source.

Sensors & Transducers Journal, Vol. 119, Issue 8, August 2010, pp. 142-150
149
Fig. 4. Linear regression between the developed instrument and clinical analyzer.
References
[1]. Wesson L. G., Physiology of the human kidney, New York Rune and Stratton, 1969, pp. 591. [2]. Weast R C, CRC handbook of Chemistry and Physics, 67th ed, CRC Press, Boca Raton, FL, 1986. [3]. Kuleita T A, Neurologic behavioral syndrome associated with ingestion of Chloride deficient infant
formula, Pediatrics, 78, 1986, pp. 714-715. [4]. J. B. Xiao, Determination of nine components in Bayer liquors by high performance ion Chromatography
with conductivity detector, Journal of the Chilean Chemical Society, Vol. 51, 2006, pp. 964-967. [5]. H. Cao and J. B. Xiao, Analysis of anions in alkaline solutions by ion Chromatography after solid phase
extraction, Annali di Chimica, Vol. 97, 2007, pp. 49-58. [6]. R. H. Wu and X. G Shao, Application of near infra red spextra in the determination of water soluble
Chloride ion in plant samples, Spectroscopy and Spectral Analysis, Vol. 26, 2006, pp. 617-619. [7]. M. Philippi, H. S. dos Santos, A. O. Martins, C. M. N. Azevedo, and M. Pires, Alternative
spectrophotometric method for standardization of Chloride solutions, Analytica Chimica Acta, Vol. 585, 2007, pp. 361-365.
[8]. T. V. Shishkanova, D. Sykora, J. L. Sessler, and V. Kral, Potentiometric response and mechanism of anionic recognition of heterocalixarene based ion selective electrodes, Analytica Chimica Acta, Vol. 587, 2007, pp. 247-253.
[9]. R. B. R. Mesquita, S. M. V. Fernandes, and A. O. S. S. Rangel, Turbidimetric determination of Chloride in different types of water using a single sequential injection analysis system, Environmental Monitoring,Vol. 4, 2002, pp. 458-461.
[10]. Wolfbeis O S, Fiber Optic Chemical Sensors and Biosensors Analytical Chemistry, 72, 2000, pp. 81-89. [11]. Rakow N A, Suslick K S A, Colorimetric sensor array for odor for Visualisation, Nature 406, 2000,
pp. 710-712. [12]. Wobschall D, In Circuit design for Electronic Instrumentation -Analog and Digital devices from sensor to
display, Second edition, McGraw-Hill Book Company, NY, 1987, pp. 367-368. [13]. De Jong, E B, Goldschmidt H M, Van Alphen A C, Loog J A, An improved automated method for serum
chloride, Clin Chem., 26, 8, 1980, pp. 1233-1234.

Sensors & Transducers Journal, Vol. 119, Issue 8, August 2010, pp. 142-150
150
[14]. Yokoi K, Colorimetric determination of chloride in biological samples by using mercuric nitrate and diphenylcarbazone, Biol Trace Elem Res, 85, 1, 2002, pp. 87-94.
[15]. Feldkamp et al, J Clin Chem Clin Biochem, 12, 1974, pp. 146-150.
___________________
2010 Copyright ©, International Frequency Sensor Association (IFSA). All rights reserved. (http://www.sensorsportal.com)

ISSN 00204412, Instruments and Experimental Techniques, 2010, Vol. 53, No. 4, pp. 591–595. © Pleiades Publishing, Ltd., 2010.
591
1 1. INTRODUCTION
Electrical conductivity is a general indicator ofwater quality, especially a function of the amount ofdissolved salt, and can be used to monitor processes inthe wastewater treatment that causes changes in totalsalt concentration and thus changes the conductivity.Recently different circuits have been presented tomeasure conductivity, from the application point ofview. In [1] a circuit model is presented whichresponds to the electric behavior in conductivity frequency. In [2] an analog interface is presented whichprovides good accurate results but with a fourelectrode cell. In [3] an electronic conditioning circuit,based on a variant of Wheatstone bridge is presentedwith the help of a digital processing stage based on amicrocontroller.
In the present work, option is provided for the conductivity temperature compensation by software orthe user can measure the conductivity by keeping thesample at a desired temperature for the analysis ofconductivity variation with temperature. The conductivity of a solution is proportional to its ion concentration, and if Chloride is the predominant anion in a soilsolution, the Chloride concentration in m mole wouldbe approximately equal to 10 times the electrical conductivity measured in dS/m [4, 5]. In this experimental study, we use the ATmega32 microcontrollermounted in the system, to correlate electrical conduc
1 The article is published in the original.
tivity with the Chloride concentration of the soil samples using regression model.
2. EXPERIMENTAL
2.1. Design of the Measurement System
The Block diagram of microcontroller based electrical conductivity measurement set up is shown inFig. 1. The conductivity cell made up of platinum isused to measure the conductivity of the samples is keptin Block 1. The cell constant is determined conveniently by calibration with pattern solutions [6].
Polarizing the conductance cell by an external DCpotential produces some undesirable effects (doublelayer capacitance, electrolysis, ohmic resistance andelectrolytic saturation). On the other hand, it is provedthat the electrolytic saturation is reduced considerablyif the AC polarization frequency is high enough. Practical values are (1–5 kHz) although those values mustnot be high in excess because it would appear the effectof the capacitance in parallel with the electrolyticsolution itself [7]. Hence, a fixed sinusoidal excitationvoltage of 1 V is applied to the bridge.
The conductivity cell is connected to one arm of amodified Wheatstone’s bridge network. The Block 2consists of precision rectifier to rectify the output ofbridge network. Block 3 represents the temperaturesensor LM35D to measure the temperature of thesample. Output of this sensor calibrated directly toCelsius does not require any external calibration. The
PHYSICAL INSTRUMENTS FOR ECOLOGY, MEDICINE, AND BIOLOGY
ATMEGA32 Microcontroller Based Conductivity Measurement System for Chloride Estimation of Soil Samples1
P. Neelamegama and R. Vasumathib
a Department of Electronic and Instrumentation Engineering, SASTRA University, Tanjore, Tamil Nadu, Indiab PG and Research Department of Physics, AVVM Sri Pushpam College, Poondi, Tanjore, Tamilnadu, 613503, India
email: [email protected] October 26, 2009
Abstract—This paper presents the development of an inexpensive and portable microcontroller based instrument set up to measure the electrical conductivity of the soil samples and hence to determine the Chlorideconcentration using empirical relation between the two parameters. A dedicated ATmega32 microcontrollerand its associated peripherals are employed to measure electrical conductivity and temperature. A special feature of the designed Instrument is that the conductivity temperature compensation can be achieved by software or the user can maintain the sample at desired temperatures by using the temperature controller.An empirical relationship between Chloride concentration and electrical conductivity of soil samples hasbeen developed using Linear Regression Model, which gave a Correlation Coefficient of R = 0.95 (n = 20),Slope = 14.95 and Intercept = –563.9. The obtained results are compared with the EL1CO CM 180 conductivity meter to check the accuracy of the designed instrument, which gives a correlation coefficient of R =0.98 (n = 20).
DOI: 10.1134/S0020441210040214

592
INSTRUMENTS AND EXPERIMENTAL TECHNIQUES Vol. 53 No. 4 2010
NEELAMEGAM, VASUMATHI
effect of temperature is important when an electricconductivity of a liquid or solution must be done.
Block 4 indicates keypad to give input data to themicrocontroller for processing. Block 5 consists ofATmega32 microcontroller from Atmel company. It isa low power, high performance 8bit AVR microcontroller with 32 Kbyte in System Programmable Flash,one 16bit Timer/ Counter and two 8bitTimer/Counter, an eight channel 10bit ADC [8], 32programmable I/O lines in four I/O ports and 2 Kbyteof SRAM. Temperature controller kept in the Block 6is used to keep the sample at a desired temperature.Block 7 is a four rows twenty characters LCD (LiquidCrystal Display) from Hitachi, to display the experimental results. Block 8 consists of MAX232 (dualRS232 transmitter/receiver interface), which is usedto communicate with PC kept in Block 9.
2.2. AC Modified Wheatstone’s Bridge Network
A modified AC Wheatstone bridge network isshown in Fig. 2. In the developed instrument, two highgain operational amplifiers (CA3041) IC1 and IC2 areconnected with the bridge network with the non
inverting terminal connected to the ground circuit.The bridge output nodal points B and D almost at thesame potentials with respect to the ground and hencethe effect of stray capacitance that will exist betweenthem and also between them and ground is assumed tobe minimized. Since, B and D are at virtual ground,the sinusoidal supply voltage, V = Vsinωt, the currentthrough the bridge impedances are Z1, Z2, Z3 and Z4respectively. The output voltage of the circuit is [3]
Vo = Rf(Z2Z3 – Z1Z2]V.
At balance condition of the bridge, Vo = 0 which isidentical with the conventional bridge network. Theconductivity cell is connected instead of Z3. The conductivity of a sample is determined by
1/Z3 = Gc = (Z1Z4/RiVi + VoZ1Z4/Z2)–1,
where Vo —bridge output voltage, Vi —input excitation voltage, Z1, Z2, Z4 —known resistances, Rf —feedback resistance and Gc —conductivity of a sample.
The output of the amplifier IC2 is given to input ofthe precision rectifier constructed with operationalamplifiers IC3 and IC4 as shown in Fig. 2.
1Conductivity
cell
2PrecisionRectifier
3LM35D
6Temperature
controller
5Micro
controller
4Keypad
7LCD
8MAX232
9PC
Fig. 1. Block diagram of microcontroller based electrical conductivity instrumentation set up.
ACinput
Z1
I1
Z2
I2
Z4
I4
Z3
I3
С
D
IС1
IС2
3
2
6
3
2
6
3
2
6
3
2
6
D1
D2
IС3 IС4
Rf R1
ВR2 R3 R4
R5
to pin 38 of MC
Fig. 2. AC modified Wheatstone’s bridge network with precision rectifier. (IC1 – IC4) CA3041.

INSTRUMENTS AND EXPERIMENTAL TECHNIQUES Vol. 53 No. 4 2010
ATMEGA32 MICROCONTROLLER BASED CONDUCTIVITY MEASUREMENT SYSTEM 593
2.3. Microcontroller and Interfacing Circuit
The circuit diagram of the microcontroller basedinstrumentation set up to measure the electrical conductivity of the sample is shown in Fig. 3. In this circuit, the output from the modified Wheatstone’sbridge network is given to pin 38 (ADC2) of microcontroller. The temperature sensor LM35D is connected to pin 39 (ADC1) of Port A. A crystal oscillatorof 8 MHz is connected between pin 12 and 13 ofmicrocontroller as shown in Fig. 3. Three keys areconnected to PC0, PC1, and PC2 Port C. A four rowstwenty characters LCD is connected with Port D, todisplay the measured data and the computed results.
The temperature controller built with optocouplertransistor and heater coil with battery (12 V, 7 A h),Exide power safe, ShinKobe Electric machinery Co.Ltd, Japan, and other associated components is alsoshown in Fig. 3. An opto transistor MCT2E is used toisolate temperature controller section from the microcontroller circuit. The opto coupler is activated/deactivated through the transistor BC547, which is connected to PA7 of microcontroller. By proper commands from the microcontroller, heater is switchedON/OFF to maintain the temperature of the sampleat desired temperature. MAX232 (dual RS232 transmitter/receiver interface) is connected with pin 14 and15 of Port D to transmit/receive data from PC.
2.4. Software
Software is developed in C and assembly languageto initialize LCD, to compute conductivity temperature compensation by software, to keep the sample atdesired temperature using temperature controller, tostart ADC conversion, to check End of conversion, toread 10 bit of data from ADC, to measure the temperature, to control the temperature, to compute conductivity, to compute Chloride concentration usingregression model, to display the results in LCD, and tosend data to PC for further processing.
3. SOIL SAMPLING
3.1. Field Description
Soil samples are collected from twenty paddy fieldsites originated from ThanjavurThiruvarur Delta districts, TN, South India, where rice is the main crop ofseveral agricultural products. The samples are collected at every 3 km from Thanjavur to Thiruvarur over60 km, during the major cropping season of springsummer (March–June), which produces about 56%of the National total production.
+5 V
+5 V
+12 V +5 V
+5 V
+5 V
1
4
8
40
39
38
37
36
35
34
33
1
2
3
4
5
6
7
8
9
13
12
32
30
31
22
23
24
25
26
27
28
29
14
15
16
17
18
19
20
21
+VS VoutGND
LM35D
VCC
R
R
R
R
Q
D
1
2
5
4
MCT2E
BDX33C
BC547
Heater coil
op
to t
ran
sist
or
O/P from AC Wheatstone’s bridge
ATmega32
PA0/ADC0
PA1/ADC1
PA2/ADC2
PA3/ADC3
PA4/ADC4
PA5/ADC5
PA6/ADC6
PA7/ADC7
PB0/T0
PB1/T1
PB2/AIN0
PB3/AIN1
PB4/SS
PB5/MOSI
PB6/MISO
PB7/SCK
RESET
XTAL1
XTAL2
AREF
AVCC
AGND
PC0/SCL
PC1/SDA
PC2/TCK
PC3/TMS
PC4/TD0
PC5/TD1
PC6/TOSC1
PC7/TOSC2
PD0/RXD
PD1/TXD
PD2/INT0
PD3/INT1
PD4/OC1B
PD5/OC1A
PD6/ICP1
PD7/OC2
Key p
ad
MAX232PC
LCD
D4
D5
D6
D7
RS
ENR/W
GND
11
C
X
Fig. 3. Microcontroller and interfacing circuit.

594
INSTRUMENTS AND EXPERIMENTAL TECHNIQUES Vol. 53 No. 4 2010
NEELAMEGAM, VASUMATHI
3.2. Soil Sample Collection
Sampling areas of paddy fields are selected byavoiding tracks, drainage lines, sheep camp, or influences other than effluent irrigation. During collection,the size of the sample (volume or weight), identification of sample (unique labeling), special packagingand storage are noted. After collection of the samples,they are airdried to remove moisture.
3.3. Sampling Procedure
The collected soil samples are dried overnight in acabinet equipped with a heating element and anexhaust fan to remove moisture. The temperature inthe cabinet does not exceed 36°C in order to approximate airdrying conditions. Samples are crushed with amechanical grinder equipped with porcelain mortarand stainless steel 10 mm mesh sieve to remove largerclods and unwanted debris. Since the material fromthe particle sizing 2 mm and smaller are most important in making an inventory of the mineral constituents of the soil and in evaluating EC, the sample iscrushed again and the particles sizing 2 mm and lessthan 2 mm are sieved using 2 mm mesh. The sample isprepared as given below to measure the conductivity.Three 10 g scoops of soil and 30 ml of deionized waterare taken in a large test tube and shaken well for 30 minto get 1:1 suspension of soil sample. After initial shaking, the suspension is allowed to stand, with intermittent shaking for 30 min [9]. The supernatant solutionis then filtered and it is used for the measurement ofelectrical conductivity.
3.4. Measurement
To measure the electrical conductivity of the sample, the conductivity cell is connected at one arm ofthe modified AC Wheatstone bridge and selecting theresistance value Z1 (100 Ohm or 1 kOhm), Z2
(1 kOhm), and Z4 (1 kOhm). A fixed sinusoidal excitation voltage of 1 V with frequency 1 kHz is applied tothe bridge. For the calibration of the instrument, theknown concentrations of NaCl are prepared and theconductivity is measured before using the soil samples.The solution is maintained at 25°C by means of temperature controller. Initially, the conductivity cell isimmersed into the solution of NaCl having concentration of 0.1N, and the electrical conductivity is measured. Then the probe is washed with deionised waterand the electrical conductivity for various concentrations 0.2N, 0.3N, 0.4N and 0.5N are measured. Then,the conductivity cell is immersed in the prepared soilsample and the measurements are made for electricalconductivity. The Chloride concentration of the prepared soil samples is determined using the titrationmethod for the development of regression model.
3.5. Development of Regression Model
The Chloride concentration of the sample isstrongly related to the electrical conductivity of thesample, a relation between them is evaluated using linear regression model (using software ULTIMACALC).
The regression line equation y = –563.9 + 14.95x isobtained and it is used by the microcontroller to compute Chloride concentration of the soil. The correlation coefficient between the electrical conductivityand the Chloride concentration is R = 0.95 (n = 20).
4. RESULTS AND DISCUSSION
The developed microcontroller based instrument isused to measure the conductivity of the soil samples.The empirical relationship between the electrical conductivity and the Chloride concentration has beendeveloped using linear regression model to determinethe Chloride concentration of the sample. The performance of the designed instrument is investigated bycomparing the results with the standard instrument(ELICO CM 180).
The calibration curve is obtained by plotting theconcentration of Chloride against the electrical conductivity of prepared NaCl solutions at various concentrations as shown in Fig. 4. From the figure, it isobserved that the developed instrument shows the linearity between the Chloride concentration and theelectrical conductivity. The regression line betweenthe electrical conductivity measured for soil samplesusing the developed instrument and the commerciallyavailable ELICO CM 180 instrument is: y = –1.10 +1.07x, and the correlation coefficient for this line isR = 0.98 (n = 20). The reproducibility of the instrument is tested by taking five replicate readings for soilsample and it is found to agree well within the limits.
In this study, it is observed that the range of electrical conductivity of soil samples are varied from 45 to74 mS/cm and the Chloride concentration is maxi
30
25
20
15
10
5
00.1 0.2 0.3 0.4 0.5
NaCl Concentration, N
Electrical Conductivity, mS/cm
Fig. 4. Electrical conductivity measured for known concentration of NaCl solution using developed instrument.

INSTRUMENTS AND EXPERIMENTAL TECHNIQUES Vol. 53 No. 4 2010
ATMEGA32 MICROCONTROLLER BASED CONDUCTIVITY MEASUREMENT SYSTEM 595
mum at Ammaiyappan (560 ppm) and minimum atKattuthottam (140 ppm). It is also to be noted that allthe collected paddy field soil samples are having theChloride concentration within the maximum tolerable limit (1050 ppm).
5. CONCLUSIONS
ATmega32 microcontroller based instrumentationsystem has been developed to compute Chloride concentration of the soil samples using electrical conductivity. The design allows an efficient and easy solutionto the thermal compensation needed in this type ofmeasurements. This system is a portable one and canbe easily handled by irrigators and farm managers. Theelectrical conductivity determination has replaced thetedious chemical methods for the Chloride determination. The results are comparable with the valuesreported using the standard method.
REFERENCES
1. Ferrara, E., Callegaro, L., and Durbiano, F., OptimalFrequency Range for the Measurement of AC Conduc
tivity in Aqueous Solutions, Proc. 17th IEEE Instrumentation and Measurement Technology Conference,Baltimore, 2000.
2. Li, X. and Meijer, G.C.M., A LowCost and AccurateInterface for Conductivity Sensors, Proc. 19th IEEEInstrumentation and Measurement Technology Conference, Anchorage, AK, USA, 2002.
3. Rajendran, A. and Neelamegam, P., Measurement,2004, vol. 35, p. 59.
4. Abyaneh, H.Z., Nazemi, A.H., Neyshabori, M.R.,et al., Tarim Bilimleri Dergisi, 2005, vol. 11, no. 1,p. 110.
5. Hajrasuliha, S., Cassel, D.K., and Rezainejad, Y., Geoderma, 1991, vol. 49, p. 117.
6. Braunstein, J., Robbins, G.D., J. of Chemical Education, 1981, vol. 48, no. 1, p. 52.
7. Gopel, W., Hesse, J., and Zemel, J.N., Eds., Sensors. AComprehensive Survey, Chemical and Biochemical Sensors, part I, vol. 2, Weinheim: VCH, 1991.
8. ATmega32 Microcontroller data sheet [www.atmel.com].
9. Recommended Chemical Soil Test Procedures for theNorth Central Region. North Central Regional Publication, no. 221, NDSVBull., 1988, no. 499.

ISSN 00204412, Instruments and Experimental Techniques, 2011, Vol. 54, No. 2, pp. 262–267. © Pleiades Publishing, Ltd., 2011.
262
1 1. INTRODUCTION
Chloride is an essential electrolyte for human,which occurs primarily in body fluids. This anion isspecially transported into the gastric lumen, inexchange for another negatively charged electrolyte(bicarbonate) in order to maintain electrical neutralityacross the stomach membrane. After utilization inhydrochloric acid, some chloride ion is reabsorbed bythe intestine, back into the blood stream where it isrequired for maintenance of extra cellular fluid volume [1]. A constant exchange of chloride and bicarbonate between red blood cells and the plasma helpsgovern pH balance and transport carbon dioxide, awaste product of respiration from the body.
Since, chloride is a highly mobile ion that easilycrosses cell membranes and is involved in maintainingproper osmotic pressure, water balance and acidbasebalance. Several studies have suggested that the chloride ion may play a more active and independent rolein renal function, neurophysiology and nutrition. Lowserum chloride values are found with extensive burns,excessive vomiting, intestinal obstruction, nephritis,metabolic acidosis, and in addisonian crisis. Elevatedserum chloride values seen in dehydration, hyperventilation, congestive heart valve, and prostatic or othertypes of urinary obstruction [2]. The clinical significance of tests for chloride in the serum are importantin the diagnosis and treatment of patients sufferingfrom hypertension, renal failure or impairment, car
1 The article is published in the original.
diac distress, disorientation, dehydration, nausea anddiarrhea.
Plasma or serum chloride is routinely assayed by aclinical chloride ion meter that uses a chloride ionselective electrode [3], or by cyclic voltametry [4].Because of the difficulty in tuning of the chloridemeter that is usually specialized for human serum orplasma in clinical laboratories, determination of urinary chloride is based on titration methods using thereaction between chloride and silver ions [5]. There isdifficulty in judging the correct end point, especiallyfor the silver nitrate method. The coulometric titrationsolved this problem but requires the special instrumentation [6].
Colorimetry is one of the simplest and best techniques, which have been used for the clinical routineassays. Hence, there is a need to develop a simple,accurate and inexpensive biomedical analyzer basedon colorimetry principle.
Modern embedded measurement and control systems incorporate a microcontroller as the principalcomponent. As well as the microcontroller, an embedded control system frequently uses external chips suchas peripheral device controllers and analog chips forprocessing input analog signals.
The new generation of reconfigurable PSoC controllers, which integrates all the above components,will become the dominant system architecture for themajority of microbased designs, by employingadvanced lithography and FLASHbased programming technology. A single PSoC device can integrate
PHYSICAL INSTRUMENTS FOR ECOLOGY,MEDICINE, AND BIOLOGY
Measuring Chloride in Serum Using Single Programmable System on Chip (PSoC)1
P. Neelamegama and R. Vasumathib
a Department of Electronics and Instrumentation Engineering, SASTRA University, Thanjavur, Tamil Nadu, Indiaemail: [email protected]
b Department of Physics, AVVM Sri Pushpam College, Poondi, Thanjavur, Tamil Nadu, India, 613503Received July 21, 2010
Abstract—PSoC devices are dynamically reconfigurable, versatile programming, lowpower consumptionand multiple interfacing, which motivates the design of portable and inexpensive instruments. The chlorideanalyzer is built around a cypress CY8C27443 PSoC with its analog and digital blocks, which is typically anembedded system, and it is configured for the measurement of chloride in serum. The principle of chloridemeasurement is based on colorimetry with LED as illuminating source and photodiode GASPG1104 as alight sensor. The run to run precision of the implemented system is determined by analysing human controlserum AccutrolTM Normal (Sigma) and the chloride concentration is found to be 104 ± 4 mmol/l (mean ±SD, n = 5), which is close to the certified value. This system has been used successfully for the routine assayof biomedical samples, with the results in good agreement with values obtained by the commercial clinicalanalyzer at 95% of confidence level.
DOI: 10.1134/S0020441211010258

INSTRUMENTS AND EXPERIMENTAL TECHNIQUES Vol. 54 No. 2 2011
MEASURING CHLORIDE IN SERUM USING SINGLE PROGRAMMABLE SYSTEM 263
as many as 100 peripheral functions with a microcontroller [7]; saving customers design time, board space,power consumption. Using the development tools,library elements can be configured to provide analogfunctions (from analog blocks), such as programmablegain amplifiers, filters, ADCs with exceptionally lownoise, input leakage and voltage offset, DACs, comparators, etc. Digital functions such as timers,counters, PWMs, SPI, and UARTs can be configuredfrom the digital blocks of digital systems.
Due to the flexibility of configuration (peripheralfeatures), low power and other advantages of PSoC, itis selected for the design of biomedical analyzer todetermine the chloride concentration in serum. Thisinstrument has been applied to measure the absorbance and hence the concentration of chloride inserum samples, with the results comparable with acommercial clinical analyzer.
2. INSTRUMENTATION
2.1. Design of the Implemented System
The design scheme of the implemented system isshown in Fig. 1. Block 1 represents the Green LED,which acts as an illumination source with a dominantwavelength of 480 nm. Block 2 indicates the sampleholder to hold the blank, standard, and sample solution tube with a diameter of 1 cm. Block 3 is a photodiode GASPG1124 used to detect the amount oftransmitted intensity of the sample. The temperaturesensor LM35D kept in block 4 is a precision semiconductor temperature sensor giving an output of 10 mVper degree centigrade. It is capable of measuring temperature between 2°C and 100°C. The output signalsare fed to the CY8C27443 microcontroller for signalamplification. After that the analog signals are converted into digital signals to compute absorbance andhence concentration of chloride.
Block 5 represents the microcontroller PSoCCY8C27443 [8]. It’s analog system is composed ofconfigurable blocks as programmable gain amplifiers(PGA) up to 4, with gain up to 48x and instrumentation amplifiers up to 2, with selectable gain up to 93x,analog to digital converters up to 4, with 6 to 14 bit res
olution, filters with 2, 4, 6, and 8 pole band pass, lowpass and notch, digital to analog converters with 6 to9 bit resolution and comparators up to 4, with 16selectable thresholds. It has configurable digital blocksof timers (8 to 32 bit), counters (8 to 32 bit), PWMs(8 to 32 bit). SPI slave and master up to 2, and 8 bitUART with selectable parity up to 2. It also contains16 KB of flash memory, 256 bytes of SRAM, an 8 × 8multiplier with 32bit accumulator, power and sleepmonitoring circuits, and hardware I2C communications.
A keypad denoted by block 6 is used to give inputdata to the microcontroller. Block 7 is LCD, a two rowalphanumeric display, which is used to displayPatient’s ID number, measured data and the results.The data are transmitted from the microcontroller tothe computer represented by block 9 via RS232denoted by block 8.
2.2. Description of the Microcontroller Based System
The microcontroller PSoC CY8C27443 and interfacing circuit of the developed instrument system,based on colorimetry principle is shown in Fig. 2. Herea colorimeter measures the intensity of light shiningthrough a coloured solution compared to the intensityof light passing into the solution. A detector measuresthe transmittance T (% of light passing through) of thesolution. This is mathematically converted to absor
bance (A = – ) and the absorbance is directlyproportional to the concentration (Beer–Lambertlaw). The photo detection assembly is well insulatedfrom outer light and the output signals are detected byphoto diode of GASPG1124.
The analog blocks in CY8C27443 are configured asprogrammable gain amplifier and ADC for the processing of analog signals (Fig. 3). The output signalsfrom the photodiode sensor are fed to analog inputP0(7) as shown in Fig. 2. The two stages of programmable gain amplifier (PGA) are used for amplifyingthe light sensor’s signals. The configured 12 bit dualADC is used for converting analog signals to digitalquantities.
The temperature sensor LM35D is connected topin P0(3), the other input for the 12 bit dual ADC of
Tlog
1LED
2Sampleholder
3Photodiode
4LM35D
5Micro
controller
6Key pad
7LCD
8RS232
9PC
Fig. 1. Block diagram of the implemented biomedical analyzer.

264
INSTRUMENTS AND EXPERIMENTAL TECHNIQUES Vol. 54 No. 2 2011
NEELAMEGAM, VASUMATHI
microcontroller (Fig. 2). The temperature controllercircuit is implemented with PWM (pulse width modulation), Opto isolator (IC MOC3021), and TRIAC(BT136), to control and maintain the temperature ofsample at 37°C for incubation. The IC MOC3021 isused to isolate low voltage section from high voltagesection.
The data lines of LCD are interfaced with port 2(Fig. 2) of microcontroller to display the patient IDnumber, user information, and results. A digital blockin the microcontroller is configured as UART forRS232 interface to transmit/receive data from the PC.
2.3. Software
In the present work, software is developed in C, toconfigure analog and digital blocks as peripherals, to
initialize LCD, to start ADC, to read 12 bit data signals, to measure and maintain temperature, to measure voltages for blank, standard, and sample, to compute absorbance and concentration, to display theresult in LCD, to get the data from the keyboard andto send data to PC for further processing. The implementation of the above tasks is given in the flowchart(Fig. 4).
3. MATERIALS AND METHOD
Serum samples are collected from the patients andare separated from the blood clot soon after drawing.Grossly hemolyzed serum should not be used, as it willcreate falsely decreased values. The collected serumsamples are stored at room temperature. The colorimetry principle is used for the measurement of absorbance and concentration of chloride electrolyte.
3.1. Principle
Chloride ions form a soluble, nonionized compound, with mercuric ions and will displace thiocyanate ions from nonionized mercuric thiocyanate. Thereleased thiocyanate ions react with ferric ions to forma color complex that absorbs light at 480 nm. According to Beer–Lambert’s law, the intensity of the colorproduced is directly proportional to the chloride concentration [9]
2Cl– + Hg(SCN)2 HgCl2 + 2SCN–,
3SCN– + Fe+++ 4Fe(SCN)+++.
FuseHeater
coll
ACInput TRIAC
Photodiac
R2
D
R1
P0(1)
P0(3)
P0(7)Photodiode
LM35D
1
4
CY8C27443
GND
VCC
28
+5 V
14
16
12
20
21
7
22
23
5
18
17
Key padP1(2)
P1(3)
P2(0)
P1(6)P1(4) RS232 PC
D7
D6
D5
D4
RS
EN
P2(2)
P2(3)
P2(4)
P2(6)
P2(7)
LCD
Fig. 2. Microcontroller and interfacing circuit.
Photodiode
LM35D
PSoC internal blocks
PGAMUX
PGA
12 bit dualADC
Fig. 3. Internal blocks of PSoC.

INSTRUMENTS AND EXPERIMENTAL TECHNIQUES Vol. 54 No. 2 2011
MEASURING CHLORIDE IN SERUM USING SINGLE PROGRAMMABLE SYSTEM 265
3.2. Reagents
Two reagents R1 and R2 are used in this measurement system. The reagent R1 consists of mercuricthiocyanate (2 mmol/l), ferric nitrate (20 mmol/l),and nitric acid (29 mmol/l). The reagent R2 is chloride standard solution (NaCl 100 mmol/l). Blanksolution is prepared by mixing 1 ml of reagent R1 with10 μl of distilled water. To prepare standard, 1 ml ofreagent R1 is added with 10 μl of standard (R2).For sample preparation, 1 ml of reagent R1 is addedwith 10 μl of serum sample. The above solutions arethoroughly mixed and left for incubation for 5 min at37°C, before the absorbance is measured at 480 nm.
3.3. Measurement
The designed instrument is used to measure theblank, standard and sample voltages and to computeabsorbance and concentration. The test tube labeledblank is placed in a sample holder and the measuredvoltage is V0. By holding the standard solution test tubein a sample holder, the voltage Vstd is read by themicrocontroller. The sample solution is placed in asample holder and voltage measured as Vtest. The con
centration of serum chloride is computed using theformula:
Concentration of chloride ion = log(V0/Vtest)/log(Vo/Vstd) × 100,
where log(V0/Vtest) is the absorbance of sample,log(V0/Vstd) is the absorbance of standard, and 100 isthe concentration of standard chloride.
The concentrations of serum chloride measurements are made for 20 patient’s sample using thedeveloped instrument. The same samples are testedusing the commercial clinical analyzer. The absorbance of sample solution is measured and repeated forfive times to check the reproducibility. Chloride is stable in serum for one day at room temperature, up toone week at refrigerator temperature and for threemonths frozen when stored as tightly capped.
4. RESULTS AND DISCUSSION
The absorption curve of the ferric thiocyanatecomplex formed is shown in Fig. 5. Since the curve hasa rather broad peak, the color can be read over a widespectral range. A wavelength of 480 nm is used in the
Start
IST
Imitalise port
Call IST
Measure and store V0using ADC
Measure and store Vstdusing ADC
Measure and store Vtestusing ADC
Read ST
Read MT
On
Yes
No
IsST = MT
Off
End
Display concentration
Clorideconcentration
(mmol/l)=
Abs of blank/Abs of testAbs of blank/Abs of std
× 100
ST = set temperatureMT = measure temperature
Fig. 4. Flowchart.

266
INSTRUMENTS AND EXPERIMENTAL TECHNIQUES Vol. 54 No. 2 2011
NEELAMEGAM, VASUMATHI
developed analyzer. However, any wavelength chosenbetween 450 and 480 nm gave satisfactory results.This is an advantage for laboratories using photometers with fixed filter systems.
The concentration of nitric acid (HNO3) in thecolor reagent has a marked effect on color development. When HNO3 is added to give a concentrationabove 0.25 N, proteins in the specimen are precipitated. A nitric acid concentration of approximately0.03 N gave optimum conditions for the determination of physiologic serum chloride levels.
4.1. Linearity and Sensitivity
To check the linearity of the designed instrument,different types of serum sample ranging between 90–150 mmol/l have been used. The absorbance increaseswith the chloride concentration, and shows the linearity of the instrument up to 150 mmol/l. For the wavelength of 480 nm, the absorbance change of 0.001 typically corresponds to chloride concentration of 0.25mmol/l, which gave the sensitivity of the analyzer.
4.2. Precision
Runtorun precision is obtained by assaying commercial human control serum AccutrolTM normal(Sigma) gave the results of mean 104.4, S.D. 4.0,C.V (%) 3.3 and elevated results for a period of thirty(30) days produced the results of mean 91.7, S.D. 3.8,C.V (%) 4.1. Within run precision is obtained by assaying control normal serum twenty (20) times havingmean 86.9 (104.4), S.D. 1.3 (4.0), C.V (%) 1.0 (3.3).
4.3. Recovery
To measure the recovery of chloride, pooled serumis diluted approximately twofold with distilled water.To 0.5 ml of diluted Serum, various amounts of 0.1 NSodium chloride (NaCl) solutions are added to bringthe total chloride concentration within normal range.Using the developed instrument the recovery values ofadded chloride ranged from 99.4 to 97.5% with anaverage recovery of 98.44%, this indicates the suitability of the designed instrument for biomedical tests.
4.4. Interferences
No significant interferences are observed with theexception of bromide and fluoride and they can causefalsely elevated chloride values. Bromide at 10 and20 mmol/l produced positive bias of 20 and42 mmol/l, respectively, for chloride measurements.However, the assays can be directly performed on rawbiological samples, i.e., in the presence of lipid, protein and minerals such as magnesium, iron and zincwithout any pretreatment. Lipemic and/or icteric serado not interfere in the reaction.
4.5. Linear Regression Analysis
To examine the accuracy of the developed instrument, linear regression is performed and tested for theresults obtained using designed biomedical analyzerand the other clinical analyzer. All the samples fall intothe linear range, and there is sufficient precision in thedata to continue with the linearity study. There is nooutlier in the data sets. The strength of the linear association between two variables is quantified by the correlation coefficient. The regression line equationarrived is,
y = 0.95x + 4.6,the value of slope m = 0.95 (close to ideality) and theintercept c = 4.6 indicated that the developed instrumentation system is well suited to determine the chloride in serum. The correlation coefficient R = 0.95(n = 20), shows that the present method is well correlated with the clinical analyzer.
4.6. Statistical Analysis
The performance of the PSoC based biomedicalanalyzer using colorimetry principle is investigated bycomparing its results with the results obtained by otherclinical analyzer. There is no obvious differencebetween the results obtained by two Instruments. Thetable represents the statistical reports for the resultsarrived using the developed instrument and the commercial clinical analyzer. It is noted that the values ofStandard deviation, standard error of standard deviation, mean value, standard error of mean, medianvalue. Standard error of mean, mean deviation, coef
400 420 440 460 480 500 520 540Wavelength, nm
0.40
0.35
0.30
0.25
0.20
0.15
0.10
Absorbance
Fig. 5. Absorption curve.

INSTRUMENTS AND EXPERIMENTAL TECHNIQUES Vol. 54 No. 2 2011
MEASURING CHLORIDE IN SERUM USING SINGLE PROGRAMMABLE SYSTEM 267
ficient of variation and standard error of coefficient ofvariation for the designed analyzer is close to the clinical analyzer.
5. CONCLUSION
A rapid, precise, and inexpensive programmablesystem on chip based biomedical analyzer has beenfabricated to measure the chloride concentration inserum. The PSoC design increases flexibility of configuration of peripherals, lower part count, and provides in system performance improvement, designsecurity, and field upgrades. The developed Instrument is sensitive and suitable for determining chlorideconcentration in serum and it is a user friendly one, asno special training is required to use it. Usual spectrophotometers have optical lenses and filter, whichmakes the system clumsy, and difficult to use, asincandescent lamps are used as light sources, it gener
ates lot of heat and consumes more power. All theseproblems are rectified in this PSoC based system andit can be used as an alternative to the commercial clinical analyzer. The instrument can be used to measurethe chloride concentration of other biological sampleslike serum, blood, plasma and cerebro spinal fluid bychanging reagents. Since, the method of measuringchloride in serum is based on colorimetry principle,any of the branded reagents, which are available inlocal pharmaceuticals, can be used. Comparing thepresent results on analytical performance with that ofother clinical analyzer, the developed Instrument givescompatible analytical results in all approaches.
REFERENCES
1. Wesson, L.G., Physiology of the Human Kidney, NewYork and London: Grune and Stratton, 1969, p. 591.
2. Tietz, N.W. and Saunders, W.B., Fundamentals of Clinical Chemistry, Philadelphia: PA, 1976, p. 897.
3. Külpmann, W.R., J. Clin. Chem. Clin. Biochem., 1989,vol. 27, p. 815.
4. Arai, K., Kusu, F., Noguchi, N., Takamura, K., andOsawa, H., Anal. Biochem., 1996, vol. 240, p. 109.
5. Annino, J.S., Chloride in Clinical Chemistry. Principleand Procedures, Little, Brown, Boston, 1964, pp. 98–104.
6. Scott, M.G., Heusel, J.W., LeGrys, V.A., and SiggaardAndersen, O., Electrolytes and Blood Gases, in Textbookof Clinical Chemistry, C.A. Burtis and E.R. Ashwood,Eds., Philadelphia: W.B. Saunders Company, 1999,pp. 1056–1092.
7. Sidek, O., Omar, M.G., Edin, H., et al., Eur. J. Sci.Res., 2009, vol. 33, no. 2, p. 249.
8. www. C Y8C27443.com
9. De Jong, E.B., Goldschmidt, H.M., van Alphen, A.C.,and Loog, J.A., Clin. Chem., 1980, vol. 26, no. 8,p. 1233.
Statistical analysis for the data arrived using developed instrument and the clinical analyzer
Variables Developed instrument
Clinicalanalyzer
Standard deviation 5.07 5.40
Standard error of standard deviation
0.82 0.85
Mean value 100.84 100.5
Standard error of mean 1.16 1.20
Median value 101 100.5
Standard error of median 1.45 1.51
Mean deviation 4.37 4.5
Coefficient of variation 5.02 5.38
Standard error of coefficient of variation
0.81 0.85

Research Article
COLORIMETRIC DETERMINATION OF CHLORIDE ION IN ORAL REHYDRATION SALTS USING MICROCONTROLLER P89C51RD2
P. NEELAMEGAMa, R. VASUMATHIb aDepartment of Electronic and Instrumentation Engineering, SASTRA University, Tanjore, Tamilnadu, India, b PG and Research
Department of Physics, AVVM Sri Pushpam College, Poondi, Tanjore, Tamilnadu, India 613503
Received: 01 Nov 2010, Revised and Accepted: 01 Dec 2010
ABSTRACT
A simple, precise and inexpensive Microcontroller P89C51RD2 based Instrument set up has been designed, developed and validated to find the Concentration of Chloride ion concentration in Oral Rehydration Salts (ORS). The present method is based on the quantitative reduction of thiocyanate ions by Chloride ions by means of Colorimetry principle. Hardware and software are developed for implementing the absorbance measurement and to calculate the Chloride concentration. There is statistically no significant difference between the results obtained with the developed Instrument and the Chloride Ion Selective Electrode (ISE). It is found that the Concentration of Chloride is well within that of World Health Organisation (WHO) certified values. The Correlation coefficient r= 0.99 (n=6) is obtained between the developed instrument and the Ion Selective Electrode method. The sensitivity and the precision are high enough to determine the concentration of Chloride ion without any significant interference. The developed Instrument could be routinely used for the determination of Chloride ion in bulk drugs.
Keywords: Chloride, Dehydration, ORS, drugs, Microcontroller P89C51RD2.
INTRODUCTION
Dehydration is one of the most common problems of infancy and early childhood. They are affected by dehydration during prolonged vomiting, diarrhea and in cases of some diuretic medications. Because vital body fluids and minerals are lost during the above illness. These fluids and minerals contain electrolytes. They must be replaced quickly in order to prevent dehydration. Dehydration affects the body’s electrolyte balance. Electrolytes give your body the electrical support necessary1 for your heart, muscles and nervous system to work properly. When electrolytes are out of balance many organs cannot function properly, and lead to life threatening condition. Chloride is the main extracellular anion. With Sodium it accounts for most of the osmotic pressure of plasma and contributes to maintenance of electroneutrality. Chloride ions are ingested with food and absorbed in the intestinal track. It absorbs minerals and vitamin B12, enables normal muscle contraction2, relaxation and nerve impulse transmission. Decreased levels of Chloride (Hypochloremia) occur with any disorder. It occurs with prolonged vomiting or gastric suction, chronic diarrhea, emphysema or other chronic lung disease. In order to Rehydrate, Doctors recommend ORS therapy immediately.
The modern era of oral replacement of fluid and electrolytes in pediatric diarrheas had its beginnings in reports from Baltimore using Sodium, Potassium, Chloride and lactate to replace losses in infantile diarrheas in the 1950’s with subsequent addition of sugar to spare protein3. The science of ORS is advanced when Phillips and colleagues determined the composition of fluid lost in diarrhea4, 5. Oral Rehydration Therapy is proposed as a viable alternative for cholera in areas of the world with short supplies of intra‐venous fluids and needles forcing clinicians to deliver oral solutions to those with cholera. This reduced mortality rates to only 3% compared to 30% of those treated in other camps with intravenous fluids. Based on this evidence, WHO and UNICEF recommended a single standard ORS formula for all ages. There are lot of brands of ORS therapy is available in local pharmacy. The accurate analysis of minerals in drugs is very important in medications.
Over the years, numerous analytical methods for Chloride in a variety of samples have been developed, such as Ion Chromatography6, 7, Spectroscopy8, Ion Selective Electrode (ISE) method9, Turbidimetric method10, and so on. Ion Chromatography is an accurate laboratory method, but cannot produce real time data needed for rapid decisions in the field. Spectroscopy is one of the tedious methods. ISEs are accurate when recently calibrated, but are sensitive to drift, fouling and are not ideal for field monitoring. Turbidimetric is popular and regarded relatively reliable for
quantification of Chloride. But it suffered from long experimental time, lower sensitivity and complexity. Hence, there is a need for an analytical tool to quantitate the Chloride ion concentration in an inexpensive way.
Moreover, low cost but powerful Microcontrollers are used in many types of portable and hand held Instruments. These electronic circuits can be programmed with the measurement algorithms and the calibration function needed for full instrument operation with the numeric result appearing on a screen at the end of the measurement process. Their internal memory, versatility of programming, possibility of multiple interfaces and low power function make it possible to design the system with high accuracy and high speed response.
In the present method, a Microcontroller P89C51RD2 based Instrument set up has been designed and developed with colorimetric principle to measure the absorbance and hence to determine the Concentration of Chloride in ORS samples, with the results comparable to the other analytical technique (Ion Selective Electrode method).
INSTRUMENTAL
Design scheme of the implemented system
The functional block diagram of Microcontroller based Instrument set up is displayed with a clear depiction of its different blocks is shown in figure 1.
LEDs have been widely studied and applied to this kind of Instruments as monochromatic light source and solid state photo detectors are used for absorbance measurements. The Block A in Figure 1 consists of Green LED with a wavelength of 480nm to optically illuminate the sample solution to measure the Chloride concentration. Block B represents sample holder, which is used to hold the Blank, Standard and Sample solutions. A photo diode (GASPG 1124) is used to detect the amount of light falling on the sample, which acts as a photo detector represented, by a Block C. This ideal detector has the characteristics of long term stability, Short response and high sensitivity to allow the detection of low level radiant energy11. Block D consists of OP‐AMP, which acts as an instrumentation amplifier that amplifies the weak signal. The output of instrumentation amplifier is connected to the 12 bit A/D converter, which is in Block E. The Microcontroller P89C51RD2, which is kept in Block F, reads data from ADC for processing. Block G represents the keypad to give data for processing and to compute the Chloride concentration. Block H represents LCD, which is used to display the output of Microcontroller (Chloride concentration in ORS samples)12.
International Journal of Pharmacy and Pharmaceutical Sciences
ISSN- 0975-1491 Vol 3, Suppl 2, 2011

Neelamegam et al. Int J Pharm Pharm Sci, Vol 3, Suppl 2, 2011, 7277
73
Fig. 1: Design of the implemented system
Fig. 2: Microcontroller and interfacing circuit
Description of the microcontroller based system
The Microcontroller and interfacing circuit is shown in Figure 2, which measures the concentration of Chloride ion based on colorimetry principle.
According to this principle, the absorbance of light (which passes through the colored solution) is proportional to the concentration of the ion. The Instrument system is incorporated with the Green LED source. A photodiode GASPG1124 is used as a sensor to detect the amount of light and convert into current. The output current of

Neelamegam et al. Int J Pharm Pharm Sci, Vol 3, Suppl 2, 2011, 7277
74
photo detector is converted into voltage by an operational amplifier. The output of OP‐AMP is connected to the pin 35 of ADC 7109 through 1 MΩ resistance to convert analog to digital value. The lower and higher bytes of ADC 7109 are interfaced with port 0 of Microcontroller. The pin 29 of ADC 7109 generates the internal reference voltage. The Microcontroller P89C51RD2 contains a non‐volatile 64KB flash program memory and 1 K bytes of RAM. It has four 8 bit I/O ports, three 16‐bit timer/counters, a multi‐source four‐priority‐level, nested interrupt structure, an enhanced UART and on‐chip oscillator and timing circuits13. A reset switch is provided at pin 9, so that the program can be executed from 0000 after the power is switched on. A tap from preset is given to pin 36 of ADC 7109, the reference input pin. By adjusting this preset it is possible to get a full scale, which means that inputs between –4 and
+4 can be converted. A two row Alphanumeric LCD is interfaced to port 0 to display the measured concentration of Chloride.
Software
Fully dedicated Software for the data acquisition and computing the Chloride concentration in different ORS samples is developed in C and assembly language and linked to the application program. The structure of the software is elaborated as flowchart in Figure 3. Digital conversion), to check EOC (End of Conversion) to read lower byte enabling LBEN signal, to read higher byte enabling HBEN signal, to measure the readings for blank, standard, and sample, to compute absorbance and Chloride concentration, to display the result in the LCD and to get data from the keyboard.
Fig. 3: Flow chart
Software for the implemented system is written to initialize LCD, to start ADC (Analog to It is observed that the minimum time for data acquisition and computation is 0.6 s, taking into account the implemented algorithm.
MATERIALS AND METHODS
Oral Rehydration Salts of six different brands are collected from local pharmaceuticals in Tanjore, Tamil Nadu, South India. The samples of ORS are dissolved in 1L of deionized water without any precipitation. Since the samples are colorless, there is no need to add any chemical reagent to remove the color. The colorimetry
principle is used for the measurement of absorbance and concentration of Chloride electrolyte
Principle
The Chloride reagent is based on the method of Zall, Fisher and Garner14. When Chloride is mixed with a solution of undissociated mercuric thiocyanate, the Chloride preferentially combines with the mercury to form mercuric Chloride. The thiocyanate that is released combines with ferric ions present in the reagent to form ferric thiocyanate, which can be measured spectrophotometrically. The procedure is very sensitive and needs to be reduced for routine

Neelamegam et al. Int J Pharm Pharm Sci, Vol 3, Suppl 2, 2011, 7277
75
clinical applications by the addition of mercuric nitrate. The mercuric nitrate binds a fixed amount of Chloride ion and therefore makes them unavailable for reaction with mercuric thiocyanate. Only the Chloride present in excess of that bound by the mercury from mercuric nitrate is reacted with mercuric thiocyanate and produced the red ferric thiocyanate.
2Cl‐ + Hg(SCN)2 HgCl2 + 2SCN‐
3SCN‐ +Fe +++ 4Fe (SCN)++ +
Reagents
In this measurement system, two reagents R1 and R2 are used. The reagent R1 consists of Mercuric thiocyanate (2mmol/l), Ferric Nitrate (20mmol/l) and Nitric acid (29mmol/l). The reagent R2 is Chloride standard solution (NaCl of 100 mmol/l). All the solutions are prepared in a well cleaned dried test tube of same diameter. Blank solution is prepared by mixing 1 ml of reagent R1 with 10 µl of distilled water. For the preparation of standard solution, 1 ml of reagent R1 is added with 10 µl of standard (R2). The sample is prepared by adding 1 ml of reagent R1 with 10 µl of prepared ORS sample.
Measurement
The designed Instrument is used to measure the blank, Standard and sample voltages and to compute absorbance and concentration of Chloride. The test tube labeled blank is placed in a sample holder and the measured voltage is Vo. By holding the standard solution test tube in a sample holder, the voltage Vstd is read by the Microcontroller. The sample solution is placed in a sample holder
and voltage measured as Vt. The concentration of Chloride is computed using the formula,
Concentration of Chloride ion = log (Vo/Vt) / log (Vo/Vstd) x 100
Where, log (Vo/Vt) = Absorbance of sample, log (Vo/Vstd) =Absorbance of standard
100 = Concentration of standard Chloride.
The concentration of Chloride for six different brands of ORS samples is made using the developed instrument. The same samples are tested using the Chloride Ion Selective Electrode (ISE). The absorbance of sample solution is measured and repeated for five times to check the reproducibility.
RESULTS AND DISCUSSION
This study reveals the development of Microcontroller based Instrument set up to measure the concentration by colorimetry method in ORS samples. The Table 1 shows the readings for blank and standard of Chloride reagent.
Table 1: Voltage of blank and standard
S.No Blank Vo (mV) Standard (mV)
1 0.22 0.32
The measured readings of absorbance and concentration of Chloride in different ORS samples are given in Table 2.
The Table 3 gives the concentration of Chloride measured using the developed instrument and ISE method in different ORS samples.
Table 2: Absorbance and concentration of chloride in oral rehydration powder
S.No Types of sample Sample (VT) Absorption Chloride concentration m mol/l
1 ORS 1 0.175 0.099 61.87 2 ORS 2 0.174 0.101 63.12 3 ORS 3 0.174 0.101 63.124 ORS 4 0.173 0.104 645 ORS 5 0.173 0.104 64 6 ORS 5 0.175 0.099 61.8
Table 3: Comparison of results obtained using the developed instrument and chloride ISE
Sample id Chloride concentration (m mol/l) Developed instrument Chloride ISE
ORS 1 61.87 62 ORS 2 63.12 63 ORS 3 63.12 63 ORS 4 64 64 ORS 5 64 64 ORS 6 61.87 63
The concentration of Chloride is varied from (61.87‐64 mmol/l). The Certified Concentration of Chloride in ORS is 65mmol/l15. It is found that the range is well within the safe limits and also it is observed that there is no significant difference between the concentration values of different samples, which depicts that they are prepared by following the ORS formula given by W.H.O. The people who have suffered by dehydration having symptoms like dry mouth, loss of body weight greater than 10%, extreme thirst, sunken eyes, no tears when crying, decreased urination, fussiness, weakness, skin that stayed compressed and pinched should have the habit of in taking ORS to avoid some chronic condition. The dosage of ORS depends on age and severity of dehydration. Generally, for infants and children 1‐2 litres over a period of 24 hours. For Adults it differs from 2‐4 litres over a period of 24 hours.
Linearity and sensitivity
As the absorbance increases the Chloride concentration also increases, which shows the good fit of colorimetry principle. To
check the linearity of the developed instrument set up various samples having different Chloride concentration have been measured at the wavelength of 480nm. The Absorbance change of 0.1 typically corresponds to Chloride concentration of 42 m mol/l of the sample solution, which gave the sensitivity of the developed Instrument.
Recovery
To test the feasibility of the procedure and instrument, the recovery of the developed Instrument is studied by the standard addition method. Because the samples may produce some interference during the color development. To 0.5ml of ORS sample, various amounts of 0.1N Sodium Chloride (NaCl) solutions are added to bring the total Chloride concentration within normal range. The Table 4 shows the recovery values of added Chloride ranged from 98.13% to 99.15% with an average recovery of 98.42%, which indicates the suitability of the designed instrument for bulk drugs and assay tests.

Neelamegam et al. Int J Pharm Pharm Sci, Vol 3, Suppl 2, 2011, 7277
76
Table 4: Recovery of added chloride from ORS chloride (mmol/l)
S.No In ORS sample Added Total content
Total determined
Difference Recover %
1. 62 40 102 100.5 1.5 98.52 2. 62 45 107 105 2.0 98.13 3. 63 50 113 111 2.0 98.234. 63 55 118 117 1.0 99.155. 63 45 108 107 1.0 98.07
Fig. 4: Linear regression between the developed instrument and the chloride ISE
Linear regression analysis
Linear regression is plotted for the results obtained using designed Instrument and the ISE method which is shown in Figure 4.
Linear regression analysis attempts to model the relationship between two variables by fitting a linear equation that closely fits a collection of data points. All the samples fall into the linear range, and there is sufficient precision in the data to continue with the linearity study. There is no outlier in the data sets. The strength of the linear association between two variables is quantified by the
correlation coefficient. The Regression line equation arrived is y = 0.92X+4.43, the value of slope and the intercept (closes to ideality) indicated that the developed instrumentation system is well suited to determine the Chloride in ORS samples. The Correlation Coefficient R=0.99 (n=6), shows that the designed Instrument is well correlated with the Chloride ISE method.
Statistical analysis
The Statistical reports of Chloride electrolyte in different brands of ORS samples is given in Table 5.
Table 5: Statistical analysis for the data arrived using developed instrument and the ise
Variables Developed instrument Chloride ISE Mean 62.99 63.16 Std err of mean 0.356 0.280 Median 63.12 63Std err of median 0.445 0.350 S.D 0.873 0.687 Std err of S.D 0.252 0.187 Mean deviation 0.751 0.555Coefficient of variation 1.38 1.08S.E of Coeff of Variation 0.400 0.314
It is noted from the table that the mean value 63.30 and median value 63.43 are also within the safe limits. The data reported in this study refers that the concentration levels of electrolytes are fairly within the recommended levels, which confirms the pharmaceutical integrity. There is no considerable difference between the results obtained (Mean value, Standard Error of Mean value, Median value, Standard Error of Median value, Standard Deviation, Standard Error of Standard Deviation, Mean Deviation, Coefficient of Variation, Standard Error of Coefficient of Variation) using the designed Instrument and the ISE method which corroborates the validity of the implemented Instrument set up. The accuracy of the Microcontroller based Instrument is confirmed by the less residual between the two methods.
CONCLUSION
The instrument fabricated has been used to measure the concentration of Chloride electrolyte, which uses the colorimetry principle. The implemented system requires simple and low cost
electronics component. Normal spectrophotometers have optical lenses and filter, which makes the system clumsy, and difficult to use, as incandescent lamps are used as light sources, it generates lot of heat and consumes more power. All these problems are rectified in this developed Instrument and it does not require any programming expertise. The measurement system is tested with different samples to check the reproducibility. The application of this Instrument for the determination of Chloride in ORS is very important, due to the high levels of production in the world where these therapies contain considerable amounts of this ion. The same instrument can be used to measure the other analytes like Sodium and Potassium in bulk drugs by changing the light sources.
REFERENCES
1. K.Armon, T.Stephenson, R.MacFaul, Arch Dis Child. 2001; 85 :132‐142.
2. S. Lieberman, N.Bruning, The Real Vitamin & Mineral Book, Avery Publishing, Garden City, NY, 1990; 91‐181.

Neelamegam et al. Int J Pharm Pharm Sci, Vol 3, Suppl 2, 2011, 7277
77
3. Harrison HE. The treatment of diarrhea in infancy. Pediatr Clin North Am, 1954; 1:335‐348.
4. Phillips RA. Asiastic cholera (with emphasis on pathophysiological effects of the disease). Ann Rev Med, 1968; 19:69‐80.
5. Hirschhorn N, Greenough WB III. Cholera. Sci Amer, 1971;225:15‐21.
6. J.B.Xiao, Journal of Chilean Chemical Society, 2006; 51(3): 964‐967,.
7. H.Cao and J.B.Xiao, Annali di Chimica, 2007;97(1‐2):49‐58. 8. M.Philippi, H.S. Dos Santos, A.O. Martins, C.M.N. Azeevedo, and
M.Pires, Analytica Chimica Acta, ,2007; 585(2) :361‐365 9. T.V. Shishkanova, D.Sykora, J.L.Sessler, and V.Kral, Analytica
Chimica Acta, 2007;587(2):247‐253,
10. R.B.R. Mesquita, S.M.V. Fernandes, and A.O.S.S. Rangel,Journal of environmental Monitoring, 2002;4(3):458‐ 461
11. Electronic Instrumentation and Measurement techniques And practice Cooper,W.D., ,hall of India private Ltd,New Delhi. 1987
12. Principles of Measurement and Instrumentation, by Morvis Alan,S., New York, 1988
13. P89C51RD2 Microcontroller data sheet, www.atmel.com. 14. Zall D, Fisher D and Garner M. Anal Chem 1956; 28:1665. 15. World Health Organization. Oral Rehydration Salts(ORS), A
new reduced osmolarity formulation. www.who.int/chldolescenthealth/New Publications/NEWS/Statment.htm (Version current at September 12 (2006)).