Evaluating individuals, institutions and nations using ...
28
Evaluating individuals, institutions and nations using advanced bibliometrics THOMSON REUTERS ROADSHOW AUSTRALIA 7 -11 September 2009 BERENIKA M. WEBSTER
Transcript of Evaluating individuals, institutions and nations using ...

Evaluating individuals, institutions and nations using advanced bibliometricsTHOMSON REUTERS ROADSHOWAUSTRALIA 7 -11 September 2009
BERENIKA M. WEBSTER

Agenda
• Domains of research performance evaluation -
what or who and why
• Advanced bibliometrics – data in context
• Tools to support publication and citation-based
research evaluation on individual, institutional and
national levels – some examples
2

Domains of research performance evaluation
Why?
Funding allocations
Grants and prizes
Staff hiring
Promotions and tenure
Science policy
What or who?
Organisational: Individuals
Groups and teams
Departments
Institutions
Regions
Countries
Cognitive: Networks
Disciplines

What do we want to evaluate?
Research
performance
Academic impact
Economic impact
Societal impact
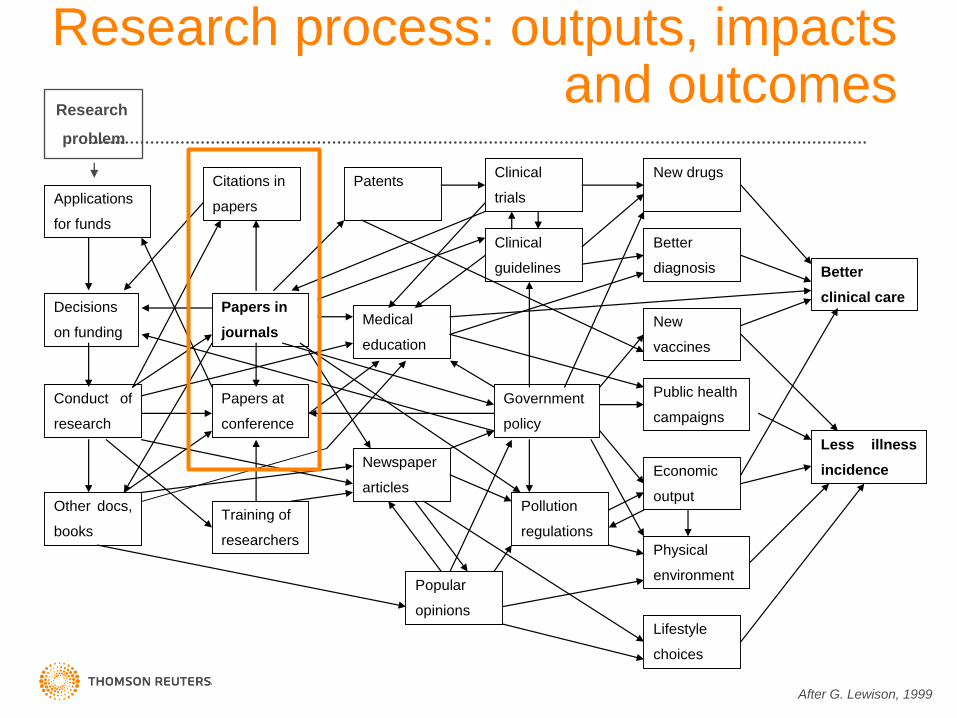
Research process: outputs, impacts and outcomes
Applications
for funds
New
vaccines
Better
diagnosis
New drugs
Less illness
incidence
Better
clinical care
Papers at
conference
s
Popular
opinions
Pollution
regulations
Lifestyle
choices
Physical
environment
Citations in
papers
Papers in
journals
Patents
Medical
education
Public health
campaigns
Government
policy
Clinical
guidelines
Decisions
on funding
Conduct of
research
Training of
researchers
Newspaper
articles
Clinical
trials
Economic
output Other docs,
books
Research
problem
After G. Lewison, 1999

What can be turned into indicators?
INPUTS OUTPUTS
Funding and
income
Publications
Workforce Patents, spin-offs,
commercialisation
income
Infrastructure
and facilities
Honours, kenyotes,
memberships, policy
impact
keynotes,

What questions can be answered using publication metrics?
Which programs are producing world class research?
Which researchers are standing out from the rest?
How does our research compare with our peer institutions?
Did our investments in new faculty or research facilities pay off?
How can we get more research funding?
7

8
Typology of indicators: from data to information
What Measures: Indicator
Output statistics
Productivity # of Papers
Recognition/Impact # of Citations
EfficiencyCitations per paper
H-index and its variants
Relative position
Direct comparison Ranking
Benchmark Baselines
Trend Growth rate Time Series
SpecialtyConcentration
Disciplinarity
Research Fronts
Disciplinarity Index

Thomson Reuters Expertise
and Processing
Research Analytics
ResourcesAddress Unification
Data Cleansing &
Standardisation
Normalisation
and Baselines
Web of Knowledge
Research Analytics: source and foundation data
Article Match Retrieve
Web Services
Researcher ID

Basic vs advanced bibliometrics
• Raw numbers – what do they mean?
– Numbers of papers
– Numbers of citations
– h-index
• Normalised data:
– Document type
– Subject category
– Journal
– Academic age
– Publication year

3 authors with 10 publications each and
h-index = 5
Citations Citations Citations
15 150 15
10 100 10
10 50 10
5 25 5
5 5 5
1 1 0
1 0 0
1 0 0
1 0 0
1 0 0
No normalisation for:
•citation characteristics of publication outlets
•citation characteristics of fields of science
•age of publications
•type of publications
•co-authorship
After Robert Tijssen, 2009

Alternatives
Contemporary H-index
• (Sidiropoulos et al., 2006) aiming to improve on the h-index by giving
more weight to recent articles
Individual H-index
• (Batista et al., 2006), divides the standard h-index by the average
number of authors in the articles that contribute to the h-index, in
order to reduce the effects of co-authorship
G-index
• (Egghe, 2006), aims to improve on the h-index by giving more
weight to highly-cited articles
Age-weighted citation rate (AWCR)
• The AWCR measures the average number of citations to an entire
body of work, adjusted for the age of each individual paper
12

Distribution of CPP per document type
13
National Citation Reports, Australia 2001-2007
Document type Papers Cites Avg. Cites/Paper
Review 11,051 165,621 14.99
Article 171,859 1,125,682 6.55
Editorial 8,777 20,887 2.38
News Item 150 229 1.53
Letter 7,779 9,044 1.16
Correction 611 254 0.42
Item About An Individual 338 51 0.15
Meeting Abstract 22,983 2,727 0.12
Book Review 8,509 113 0.01

14
Impact of publication year
%
Journal Citation Reports, 2008 Science edition
Essential Science Indicators , May 2009
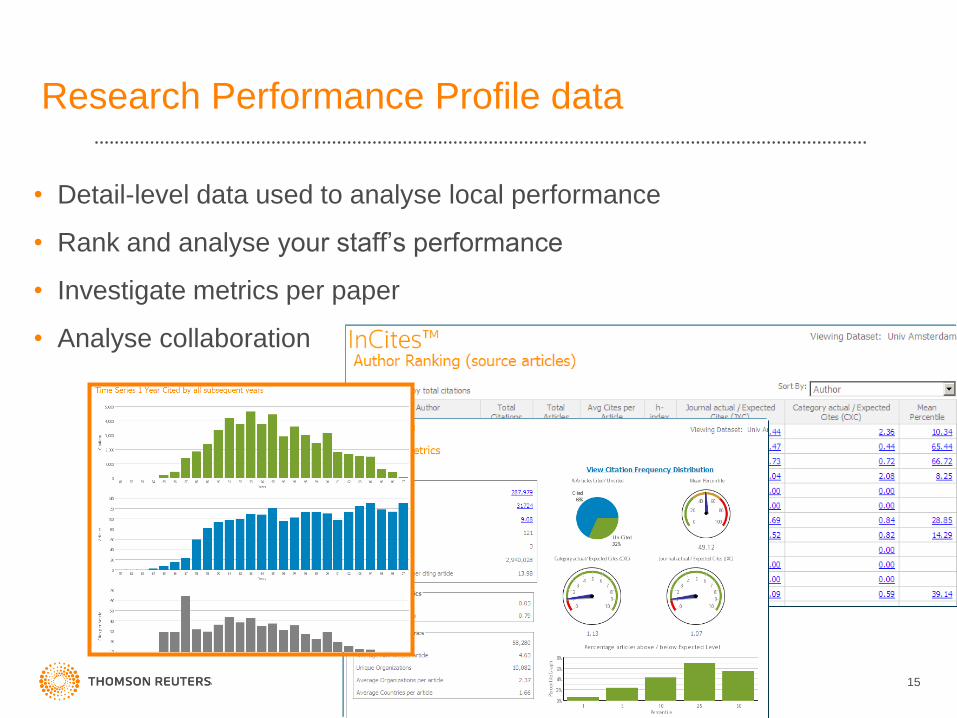
Research Performance Profile data
• Detail-level data used to analyse local performance
• Rank and analyse your staff’s performance
• Investigate metrics per paper
• Analyse collaboration
15

All metrics and analyses can be performed on any subset of the data
• Your entire institution
• One researcher
• Group of researchers (e.g. a department)
• Field of research within your institution
• Topic of research within your institution
• A collaboration partnership within your institution
and externally
• Cited and citing journals – aiding collection
development
16

How do I evaluate a researcher?
InCites, 2008
Example: Dr. Smith
Productivity # papers 140
Total
influence
# citations 5,047
% uncited 12.6
H-index 40
Efficiency Avg.
citation rate
36.05
Percent of
papers
cited
82.14
Relative
Impact/bench
marking
Journal
impact
Category
impact
1.29
1.04
Average
percentile
27.02
% papers in
top 10% of
their field
38%
Specialisation Disciplinarity
index
Interdisciplin-
arity Index
0.22
0.12
Total Papers Total Cites Avg. Cites per
Paper
H Index Jnl Category Avg.
Index Index Percentile
Dr. Smith
(biochem/mol bio)
140 5,047 36.05 40 1.29 1.05 27.02
Dr. Jones
(psychiatry)
17 481 28.29 8 1.81 1.55 21.22
Biochem/Mol Bio at
ABC University
3,505 52,351 14.94 87 1.04 0.98 44.35
ABC University 29,226 237,610 8.13 133 1.09 0.88 50.03

CPP/Cat avg < 0.80
significantly below world average (mediocre research?)
0.80 < CPP/Cat avg < 1.20
around world average (good ?)
1.20 < CPP/Cat avg < 2.00
significantly above average (very good?)
2.00 < CPP/Cat avg < 3.00
very high (national excellence?)
CPP/Cat avg > 3.00
extremely high (international excellence?)
Category-normalised citation impact indicator
CWTS classification
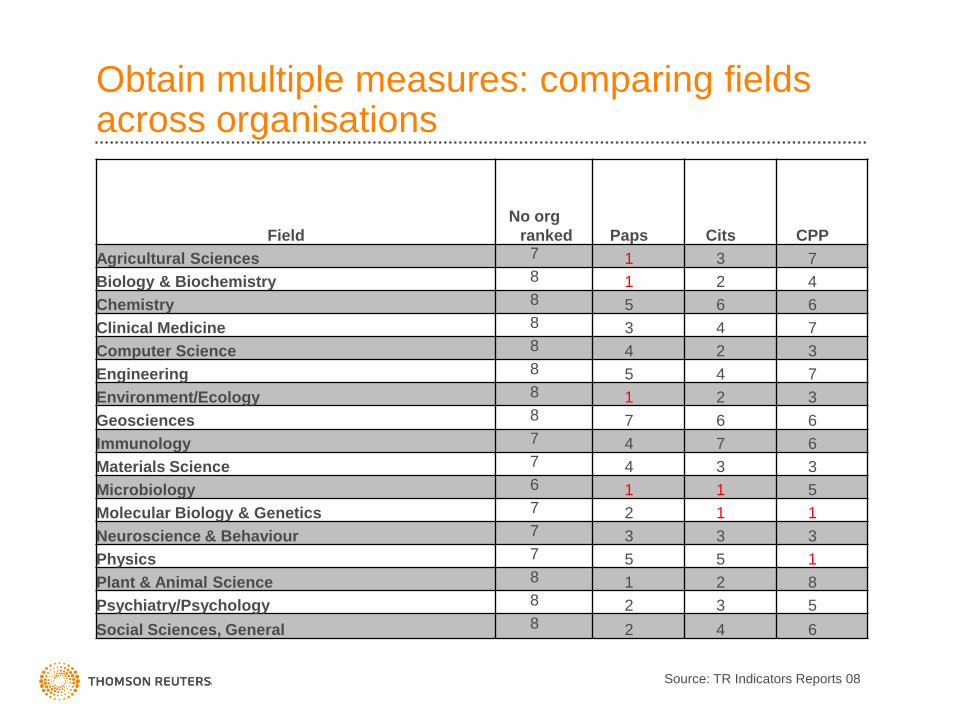
Obtain multiple measures: comparing fields across organisations
Field
No org
ranked Paps Cits CPP
Agricultural Sciences 7 1 3 7
Biology & Biochemistry 8 1 2 4
Chemistry 8 5 6 6
Clinical Medicine 8 3 4 7
Computer Science 8 4 2 3
Engineering 8 5 4 7
Environment/Ecology 8 1 2 3
Geosciences 8 7 6 6
Immunology 7 4 7 6
Materials Science 7 4 3 3
Microbiology 6 1 1 5
Molecular Biology & Genetics 7 2 1 1
Neuroscience & Behaviour 7 3 3 3
Physics 7 5 5 1
Plant & Animal Science 8 1 2 8
Psychiatry/Psychology 8 2 3 5
Social Sciences, General 8 2 4 6
Source: TR Indicators Reports 08

Trend analysis: do your institution’s policy changes correlate with a measureable result?
Changes in staffing/funding
might correlate with changes
in publication/citation counts

Managing research collaborations
21
Most frequent collaborators
Collaborations that receive the
most citations
What is the ROI for these collaborations?
Versus

Comparative data
• Rank and compare countries and institutions
• Drill down to a specific research discipline
22
00.5
11.5
2
Relative Impact: Clinical Medicine (2004-2008)

23
How does my organisation rank against peers?
University Science Indicators, 2007
Materials Science
papers and citations in
Australian institutions,
2003-2007
Institution Impact Citations Papers
AUSTRALIAN NATL UNIV 2.44 412 169
CURTIN UNIV TECHNOL 2.76 188 68
DEAKIN UNIV 2.5 443 177
MONASH UNIV 2.78 1362 490
QUEENSLAND UNIV TECHNOL 2.3 262 114
ROYAL MELBOURNE INST TECHNOL 2.05 272 133
SWINBURNE UNIV TECHNOL 1.97 114 58
UNIV MELBOURNE 6.6 1207 183
UNIV NEW S WALES 2.91 1583 544
UNIV NEWCASTLE 2.82 406 144
UNIV QUEENSLAND 3.29 1561 475
UNIV S AUSTRALIA 2.81 174 62
UNIV SYDNEY 3.29 1464 445
UNIV TECHNOL SYDNEY 3.82 313 82
UNIV WESTERN AUSTRALIA 2.93 387 132
UNIV WOLLONGONG 2.43 609 2510
0.5
1
1.5
2
2.5
AU
ST
RA
LIA
N N
AT
L U
NIV
CU
RT
IN U
NIV
TE
CH
NO
L
DE
AK
IN U
NIV
MO
NA
SH
UN
IV
QU
EE
NS
LA
ND
UN
IV
TE
CH
NO
L
RO
YA
L M
ELB
OU
RN
E
INS
T T
EC
HN
OL
SW
INB
UR
NE
UN
IV
TE
CH
NO
L
UN
IV M
ELB
OU
RN
E
UN
IV N
EW
S W
ALE
S
UN
IV N
EW
CA
ST
LE
UN
IV Q
UE
EN
SLA
ND
UN
IV S
AU
ST
RA
LIA
UN
IV S
YD
NE
Y
UN
IV T
EC
HN
OL
SY
DN
EY
UN
IV W
ES
TE
RN
A
US
TR
ALIA
UN
IV W
OLLO
NG
ON
G
Relative Impact of
Material Science
papers

24
ANU publications,
2003-2007
ANU relative impact, 2003-
2007 papers

InCites – national comparisons
25

Australia in context – subject fields
26
InCites, 2008
Number of papers, 2004-2008
Percentage of world output, 2004-
2008

MS Excel