Evaluating and Investing in Equity Mutual Fundsfaculty.chicagobooth.edu/finance/papers/eval3.pdf ·...
53
Evaluating and Investing in Equity Mutual Funds by * ˇ Lubo ˇ sP´astor and Robert F. Stambaugh First draft: March 15, 2000 Current version: May 18, 2000 Abstract Our framework for evaluating and investing in mutual funds combines observed returns on funds and passive assets with prior beliefs that distinguish pricing-model inaccuracy from managerial skill. A fund’s “alpha” is defined using passive benchmarks. We show that returns on non-benchmark passive assets help estimate that alpha more precisely for most funds. The resulting estimates generally vary less than standard estimates across alternative benchmark specifications. Optimal portfolios constructed from a large universe of equity funds can include actively managed funds even when managerial skill is precluded. The fund universe offers no close substitutes for the Fama-French and momentum benchmarks. JEL Classifications: G11, G12, C11 Keywords: performance evaluation, mutual funds, portfolio selection * Graduate School of Business, University of Chicago (P´astor) and the Wharton School, University of Pennsylvania and the National Bureau of Economic Research (Stambaugh). Research support from the Center for Research in Security Prices and Dimensional Fund Advisors is gratefully acknowledged (P´ astor). We are grateful to Andrew Metrick, Toby Moskowitz, and seminar participants at the Federal Reserve Bank of New York, Northwestern University, Ohio State University, University of Chicago, University of Pennsylvania, and Vanderbilt University for helpful comments.
Transcript of Evaluating and Investing in Equity Mutual Fundsfaculty.chicagobooth.edu/finance/papers/eval3.pdf ·...

Evaluating and Investing in Equity Mutual Funds
by*
Lubos Pastor
and
Robert F. Stambaugh
First draft: March 15, 2000Current version: May 18, 2000
Abstract
Our framework for evaluating and investing in mutual funds combines observedreturns on funds and passive assets with prior beliefs that distinguish pricing-modelinaccuracy from managerial skill. A fund’s “alpha” is defined using passive benchmarks.We show that returns on non-benchmark passive assets help estimate that alpha moreprecisely for most funds. The resulting estimates generally vary less than standardestimates across alternative benchmark specifications. Optimal portfolios constructedfrom a large universe of equity funds can include actively managed funds even whenmanagerial skill is precluded. The fund universe offers no close substitutes for theFama-French and momentum benchmarks.
JEL Classifications: G11, G12, C11
Keywords: performance evaluation, mutual funds, portfolio selection
*Graduate School of Business, University of Chicago (Pastor) and the Wharton School, University of
Pennsylvania and the National Bureau of Economic Research (Stambaugh). Research support from the
Center for Research in Security Prices and Dimensional Fund Advisors is gratefully acknowledged (Pastor).
We are grateful to Andrew Metrick, Toby Moskowitz, and seminar participants at the Federal Reserve
Bank of New York, Northwestern University, Ohio State University, University of Chicago, University of
Pennsylvania, and Vanderbilt University for helpful comments.

1. Introduction
Evaluating mutual fund performance combines data and judgment. The data typically con-
sist of returns on the funds and one or more benchmarks, and the judgment typically involves
specifying the benchmarks and their role in defining performance. Investing in mutual funds
also combines data and judgment. Rather than accept the standard performance measures
at face value, investors can allow their decisions to reflect doubts about either the adequacy
of the benchmarks or the stock-picking ability of fund managers.
In this study, we develop and implement a framework in which views about the ade-
quacy of the benchmarks–their ability to price other passive assets–can be incorporated
formally into both performance evaluation and the investment decision. The framework also
allows separate beliefs about potential managerial skill to enter the investment decision. To
accomplish these tasks, we introduce passive “non-benchmark” assets that are not used in
previous approaches. These assets provide information that can be used to estimate a fund’s
performance more precisely. They also allow beliefs that distinguish benchmark inadequacy
from managerial skill, and they help account for common variation in returns across funds
that is not captured by the benchmarks.
A mutual fund’s performance is often measured by alpha, the intercept in a regression of
the fund’s return on one or more passive benchmark returns.1 The choice of benchmarks is
often guided by a pricing model, as in Jensen’s (1969) pioneering use of the Capital Asset
Pricing Model (CAPM) of Sharpe (1964) and Lintner (1965) to investigate mutual fund
alphas relative to a single market-index benchmark. Other studies, beginning with Lehmann
and Modest (1987), examine fund alphas with respect to a set of multiple benchmarks viewed
as the relevant factors for pricing in a multifactor model, such as the Arbitrage Pricing Theory
of Ross (1976).
Alpha is typically computed by ordinary-least-squares (OLS) estimation of the regression
rA,t = αA + β 0ArB,t + ²A,t, (1)
where rA,t is the fund’s return in month t, rB,t is a k × 1 vector containing the benchmarkreturns, and αA denotes the fund’s alpha. This standard approach ignores information about
alpha provided by returns on other non-benchmark passive assets. Even though such assets
play no role in the definition of alpha in (1), they can play a useful role in its estimation.
1Throughout our discussion, “returns” are rates of return in excess of a riskless interest rate, or they arepayoffs on zero-investment spread positions.
1

To take one example, assume that the benchmark assets do indeed price other passive
assets. Consider the regression of a non-benchmark return rn,t on the benchmark returns,
rn,t = αn + β 0nrB,t + ²n,t, (2)
where the correlation between ²A,t and ²n,t is positive. If the benchmarks price other passive
assets, then αn = 0. Now suppose that over the same sample period used to obtain the OLS
estimate of αA, the OLS estimate of αn is less than its true value of zero. Given this outcome
and the positive correlation between ²A,t and ²n,t, the OLS estimate of αA is expected to be
less than its true value as well, and this information can be used in estimating αA.
Pricing models often motivate the choice of benchmarks, but non-benchmark assets can
provide additional information about a mutual fund’s alpha even with no assumption about
the benchmarks’ pricing ability. The explosive growth of the mutual fund industry in recent
years presents investors with many funds that have relatively short histories. Consider a
fund whose available return history is shorter than the histories of rn,t and rB,t. Suppose
that the OLS estimate of αn computed for the sample period of the fund’s available history
is less than the OLS estimate of αn computed for a longer sample period. Since the latter
estimate is more precise, the first estimate is more likely to be less than the true (unknown)
value of αn. Given the positive correlation between ²A,t and ²n,t, the same can be said of the
OLS estimate of αA relative to its true value, and this information can be used in estimating
αA. The additional information comes not through a pricing model, as in the first example,
but through the longer histories of the passive asset returns.
In the two examples described above, αn is assumed to be either zero or completely
unknown. One may well prefer an intermediate version in which the benchmarks are believed
to be relevant for pricing other passive assets, but not without error. In such a case, which we
handle in a Bayesian framework, non-benchmark assets can play a role that combines aspects
of both examples. Additional information about αA is provided by the extent to which the
short-history estimate of αn differs from zero as well as from its long-history estimate.
Our study does not recommend a particular set of benchmarks for defining alpha. Recent
academic studies compute mutual fund alphas with respect to a single market benchmark
(e.g., Malkiel (1995)) as well as sets of multiple benchmarks (e.g., Carhart (1997) and Elton,
Gruber, and Blake (1996)). We compute alphas in both single-benchmark and multiple-
benchmark settings. Alphas defined with respect to a single market benchmark may be of
interest whether or not one believes in the CAPM. We offer just two of many examples of
their use in practice: Morningstar, the leading provider of mutual fund information, reports
alphas computed with respect to one of several broad market indexes; Capital Resource
2

Advisors, one of the largest providers of performance information to institutional clients,
reports alphas computed with respect to the S&P 500 Index. Our approach allows one to
estimate alpha under various assumptions about whether the benchmarks that define alpha
price other passive investments.
We investigate the performance of a large sample of equity mutual funds and find that
the information about a fund’s alpha provided by non-benchmark returns can be substantial,
especially for certain types of funds. Suppose, for example, that one has no confidence in
the CAPM’s pricing ability but nevertheless wishes to report a small-company growth fund’s
traditional alpha defined with respect to a single market benchmark. The absolute difference
between the OLS estimate and an alternative estimate that incorporates information in non-
benchmark returns has a median value across such funds of 8.3% per annum. If instead one
has complete confidence in the CAPM’s pricing ability, then the median absolute difference
in estimates is 7.2%. In both cases the alternative estimate is more precise, and its variance
is only about one-third that of the OLS estimate for the median small-company growth fund.
A number of studies observe that OLS estimates of mutual fund alphas are sensitive to
the specification of the benchmarks that define those alphas.2 When the estimation of a
fund’s alpha incorporates non-benchmark assets, the definition of alpha typically becomes
less important and, in some cases, even irrelevant. We estimate alphas defined with respect to
the CAPM and with respect to the three Fama and French (1993) benchmark factors, which
include size and value factors in addition to the market factor. When estimated using OLS,
the median difference in alphas between the two models is 2.3% per annum for all funds and
8.1% for small-company growth funds. When the estimation incorporates non-benchmark
assets but does not rely on the benchmarks to price them, those values fall to 1.2% and 2.0%.
If the benchmarks are instead assumed to price the non-benchmarks exactly, the estimates of
a fund’s alpha are identical under the two models, even though the definitions of the alphas
differ. In general, if alphas are defined with respect to different benchmarks but estimated
using the same set of passive assets (benchmark and non-benchmark), then the estimates
are identical if in each case the benchmarks are assumed to price the non-benchmark assets
exactly. Loosely speaking, if you believe that some pricing model holds exactly and want a
fund’s alpha with respect to it, you need not identify the model.
As in numerous previous studies, we find that estimated alphas for the majority of equity
mutual funds are negative.3 For each investment objective and each age group, we find a
2An early example is the study by Lehmann and Modest (1987).3Grinblatt and Titman (1995) review the literature on mutual fund performance.
3

posterior probability near 100% that the average of the funds’ CAPM alphas is negative when
the non-benchmark assets are excluded. Alphas for most funds remain negative when defined
with respect to multiple benchmarks as well as when the information in the non-benchmark
assets is used the estimation.
Non-benchmark assets permit a framework for defining a measure of managerial skill
when a pricing model is viewed as possibly flawed but not useless. A common interpretation
of alpha is that it represents the skill of the fund’s manager in selecting mispriced securities.
That interpretation is subject to a number of potential complications, including a concern
that the benchmarks used to define alpha might not price all passive investments.4 This
concern can be addressed by defining skill with respect to an expanded set of passive assets,
thus weakening the link to a pricing model. Preserving some role for a pricing model can
still be useful to an investor, in that a somewhat inaccurate pricing model can be of some
help in identifying optimal portfolios. We allow an investor to have prior beliefs about a
skill measure defined as the intercept in a regression of the fund’s return on an expanded
set of passive assets that includes both non-benchmark assets as well as the benchmarks
relevant to a particular pricing model. At the same time, we allow the investor to have
prior beliefs about the potential mispricing of the non-benchmark assets with respect to the
benchmarks. In other words, an investor can have prior beliefs that distinguish managerial
skill from pricing-model inaccuracy.
Performance evaluation is a topic of long-standing interest in the academic literature, but
few if any studies have pursued its obvious practical motivation: constructing a portfolio of
mutual funds. We compute portfolios having the maximum Sharpe ratio constructed from
an investment universe of over 500 no-load equity funds. Optimal portfolios are obtained by
combining the information in historical returns with an investor’s prior beliefs, accounting
for parameter uncertainty. We entertain priors representing a range of beliefs about both
managerial skill as well as the accuracy of each of three pricing models: the CAPM, the
three-factor Fama-French model, and the four-factor model of Carhart (1997). The last
model supplements the three Fama-French benchmarks with a “momentum” factor, the
current month’s difference in returns between the previous year’s best- and worst-performing
stocks. Returns on passive benchmark and non-benchmark assets are used in the modeling
and estimation, but only the mutual funds are assumed to be eligible for investment. The
compositions of the optimal portfolios are influenced substantially by prior beliefs about
both managerial skill and pricing models. We also find that a “hot-hand” portfolio of the
4Other well-known complications include the possibility that the manager uses information to change thevalue of βA through time as conditional expected returns on the benchmarks fluctuate.
4

previous year’s best-performing mutual funds does not enter the optimal portfolio under any
set of prior beliefs considered, even if the investor has complete confidence in the four-factor
model, which contains the momentum factor. Real estate funds, interestingly, tend to exhibit
positive sensitivities to that factor as well as to the three Fama-French factors, so those funds
occupy much of the optimal portfolio for such an investor.
We find that when the passive benchmarks used to define αA are not available for invest-
ment, there need not exist close substitutes for them in the universe of mutual funds. For an
investor who believes completely in the accuracy of the Fama-French model and precludes
managerial skill, the perceived maximum Sharpe ratio is only 66 percent of what could be
achieved by direct investment in that model’s benchmarks. For a believer in the Carhart
four-factor model, the corresponding value is 54 percent. Interestingly, actively managed
funds can be better substitutes for the benchmarks than existing passive funds, so active
funds can be selected even by investors who admit no possibility of managerial skill.
Our investment problem is related to the recent study by Baks, Metrick, and Wachter
(2000), who also consider investment in mutual funds under prior beliefs about manager
skill. Their investment universe includes mutual funds as well as the passive benchmarks
used to define αA, and they do not include beliefs about possible pricing-model errors. In
their setting, an investor buys an actively managed fund only if it appears to have a positive
αA. Those authors do not construct optimal portfolios, but they conclude that unless one is
extremely skeptical about the possibility of managerial skill, some actively managed funds
would be selected by an investor who wants a high overall Sharpe ratio. Our investment
universe differs from theirs in that we do not assume the benchmark returns can be earned
costlessly. Rather than attempt to construct after-cost versions of those returns, we simply
confine investors to the universe of mutual funds.
Section 2 discusses the econometric issues and reports results from computing alternative
estimates of alpha for 2,609 equity mutual funds. Section 3 presents the results of the
investment problem, and Section 4 briefly reviews our conclusions.
2. Estimating alpha
This section begins with some basic concepts underlying the use of non-benchmark assets.
We then describe the construction of our data, explain our methodology, and report results
based on a large sample of equity mutual funds. In this section, dealing with estimation, the
5

prior beliefs about αA are “diffuse,” or completely non-informative. In the spirit of much of
the previous literature, the fund’s track record determines its estimated alpha without any
adjustment for what one might think to be reasonable magnitudes for that parameter. In
the next section, dealing with an investment problem, we consider the effects of informative
prior beliefs about managerial skill.
2.1. The role of non-benchmark assets
Let rN,t denote the m× 1 vector of returns in month t on m non-benchmark passive assets,
so the multivariate version of the regression in (2) is written as
rN,t = αN +BNrB,t + ²N,t, (3)
where the variance-covariance matrix of ²N,t is denoted by Σ. Let σ2² denote the variance of
the disturbance ²A,t in (1). Also define the regression of the fund’s return on all p (= m+ k)
passive assets,
rA,t = δA + c0ANrN,t + c
0ABrB,t + uA,t, (4)
where the variance of uA,t is denoted by σ2u. All regression disturbances are assumed to be
normally distributed, independently and identically across t. A key to understanding the
role of non-benchmark assets is given by the equality
αA = δA + c0ANαN , (5)
which follows by taking expectations in (1) and (4) and applying the relation
βA = B0NcAN + cAB, (6)
which is easily verified using standard regression theory.
Intuition for how non-benchmark assets can help to estimate αA in (1) is developed most
easily if the second-moment parameters βA, cAN , and cAB are viewed as known. Assume the
fund’s history contains S observations, and define estimators of the intercepts in (1), (3),
and (4) as
αA = (1/S)SXt=1
(rA,t − β 0ArB,t), (7)
αN = (1/S)SXt=1
(rN,t − BNrB,t), (8)
6

and
δA = (1/S)SXt=1
(rA,t − c0ANrN,t − c0ABrB,t). (9)
Note using (6) that αA is also equal to the result from substituting δA and αN into the
right-hand side of (5):
δA + c0AN αN = (1/S)
SXt=1
(rA,t − (B0NcAN + cAB)0rB,t)= αA. (10)
Suppose first that the benchmarks have no assumed pricing ability. Then αN is a vector
of unknown parameters, but it can be estimated more precisely than in (8) if the available
history of rN,t and rB,t is longer than the S observations in the fund’s history. Substituting
αN and δA into the right-hand side of (5) gives αA as an estimator of αA. Substituting the
more precise estimator of αN (along with δA) produces a more precise estimator of αA, since
δA is uncorrelated with either estimator of αN . Suppose instead that the benchmarks are
assumed to price the non-benchmark assets exactly, so αN = 0 and thus αA = δA. Then
both αA and δA are unbiased estimators of αA, but the sampling variance of δA, σ2u/S, is less
than or equal to the sampling variance of αA, σ2²/S. In this case, the non-benchmark asset
returns explain additional variance of the fund’s return and thereby provide a more precise
estimator of its alpha.
The basic idea is that a more precise estimator of αA is obtained by evaluating the right-
hand side of (5) at δA and a more precise estimator of αN than αN . That more precise
estimator of αN can be obtained by using a sample period longer than that available for
the fund, as in the case where the benchmarks are not assumed to have any pricing ability,
or by simply setting αN = 0, as in the case where the benchmarks are assumed to price
the non-benchmark assets perfectly. When ²A,t is correlated with the elements of ²N,t (i.e.
when cAN 6= 0), then the difference between αN and a more precise estimator of αN suppliesinformation about the likely difference between αA and αA. When the more precise estimator
of αN relies on a longer history, the additional information about αA is provided in essentially
the same way that sample means of long-history assets provide information about expected
returns on short-history assets, as in Stambaugh (1997).
Much of the intuition developed when βA, cAN , and cAB are known extends to the actual
setting in which those parameters must be estimated. Equation (5) also holds when all
quantities are replaced by OLS estimators based on the sample of S observations. That is,
αA = δA + c0AN αN , (11)
7

where αA, αN , and δA are the OLS estimates of the intercepts in (1), (3), and (4), respectively,
and cAN is the OLS estimate in (4). As before, the information in non-benchmark assets is
incorporated by replacing αN with a more precise estimator based either on a longer history
or some degree of belief in a pricing model. When all parameters are unknown, substituting
a more precise estimator of αN can in some cases produce an estimator of αA that is less
precise than the usual estimate of the fund’s alpha, αA. For example, if one assumes that
αN = 0 and substitutes that value into (11) in place of αN , the resulting alternative estimator
of αA is simply δA. The mean of δA is αA, but the variance of δA can exceed that of αA. Since
cAN must be estimated and δA and the elements of cAN are correlated, replacing αN with a
lower-variance quantity need not lower the variance of αA. Such an outcome is most likely
to occur as the number of non-benchmark assets increases without a sufficient increase in
the R-squared in (4). In essence, the degrees-of-freedom effect can outweigh the additional
explanatory power. We use between five and seven non-benchmark assets, depending on the
number of benchmarks, and we find that the information provided by those assets produces
a more precise estimate of αA for most funds in our sample. In the Bayesian framework
explained below, we also apply a moderate degree of shrinkage to the slope coefficients in
(4) to increase their precision and thereby enhance the information provided by the non-
benchmark assets. A potential direction for future research is the use of higher frequency
data to increase the precision of the slope coefficients.
Suppose two researchers agree on an overall set of p passive assets to include when
estimating αA, but they disagree about the subset of those passive assets to designate as
benchmarks for defining αA. Their chosen benchmark subsets might not even have any
members in common. Moreover, suppose each researcher believes his benchmarks price the
remaining passive assets perfectly. Then those researchers’ estimates of αA will be identical,
even though their definitions of αA are not. That is, the definition of αA is irrelevant to its
estimation if, for whatever benchmarks might be designated for defining αA, the remaining
non-benchmark assets would be assumed to be priced exactly by those benchmarks. Perhaps
ironically, if the benchmarks are not assumed to have perfect pricing ability, their designation
becomes relevant not only for defining αA but also for estimating it.
To understand the above statements, consider first the maximum-likelihood estimator
(MLE) of αA under the restriction that αN = 0. That estimator is given by δA, the OLS es-
timator of the intercept in (4), which does not depend on which of the p assets are designated
as the benchmarks. Note that the disturbances ²N,t and uA,t are by construction uncorrelated
and, given the normality assumption, independent. The likelihood function can therefore be
expressed as a product of two factors, one for each regression. The restriction on αN does
8

not affect the MLE of δA, which is δA, since αN appears in the other factor. Substituting
δA along with the restricted MLE of αN (the zero vector) into the functional relation in (5)
gives δA as the MLE of αA as well. It can also be verified that δA arises as the restricted
estimator in a seemingly-unrelated-regression model, or SURM.5 That is, let regressions (1)
and (3) jointly constitute a SURM, and consider the estimation of the model subject to the
restriction αN = 0. The restricted coefficient estimator requires the unknown joint covari-
ance matrix of (²A,t ²0N,t). If that matrix is replaced by the sample covariance matrix of the
residuals from the first-pass unrestricted OLS estimation, the resulting “feasible” restricted
SURM estimator of αA is again simply δA. With no restriction on αN , then of course both
the MLE and SURM estimator of αA is simply the usual estimator αA. When shrinkage is
applied to the slope coefficients in (4), as in the Bayesian setting described below, the same
type of result obtains. That is, the assumption αN = 0 implies that the posterior mean of
αA is equal to the posterior mean of δA, which doesn’t depend on the designation of the
benchmarks.
2.2. Data
Monthly returns on the benchmark and non-benchmark passive assets are constructed for
the 3512-year period from July 1963 through December 1998. The sample period for any
given fund, typically much shorter, is a subset of that overall period. We specify up to three
benchmark series, consisting of the three factors constructed by Fama and French (1993),
updated through December 1998.6 The first of these, MKT, is the excess return on a broad
market index. The other two factors, SMB and HML, are payoffs on long-short spreads
constructed by sorting stocks according to market capitalization and book-to-market ratio.
We estimate “Fama-French” alphas, defined with respect to all three benchmarks, as well as
“CAPM” alphas, defined with respect to just MKT.
When estimating CAPM alphas, SMB and HML become two of the non-benchmark
series. Five additional non-benchmark series are used in the estimation of both CAPM and
Fama-French alphas. The first of these, denoted as CMS, is the payoff on a characteristic-
matched spread in which the long position contains stocks with low HML betas (in a multiple
regression including MKT and SMB) and the short position contains stocks with high HML
betas. The long and short positions are matched in terms of market capitalization and book-
5Zellner (1962) introduces methods for estimating seemingly unrelated regressions. For a textbook treat-ment, including estimation under linear restrictions, see Theil (1971).
6We are grateful to Ken French for supplying these data.
9

to-market ratio, and the overall spread position is formed from a set of triple-sorted equity
portfolios constructed as in Pastor and Stambaugh (2000), who closely follow the procedures
of Daniel and Titman (1997) and Davis, Fama, and French (2000). At the end of June of
each year s, all NYSE, AMEX, and NASDAQ stocks in the intersection of the CRSP and
Compustat files are sorted and assigned to three size categories and, independently, to three
book-to-market categories. The nine groups formed by the intersection can be denoted by
two letters, designating increasing values of size (S, M, B) and book-to-market (L, M, H). We
then construct beta spreads within the four extreme groups of size and book-to-market: SL,
SH, BL, and BH. The stocks within each group are sorted by their HML betas and assigned
to one of three value-weighted portfolios.7 A spread within each group is constructed each
month (from July of year s through June of year s + 1) by going long $1 of the low-beta
portfolio and short $1 of the high-beta portfolio, and the value of CMS in month t is the
equally weighted average of the four spread payoffs in month t.
The second non-benchmark series, denoted as MOM, is the “momentum” factor con-
structed by Carhart (1997). At the end of each month t − 1, all stocks in the CRSP filewith return histories back to at least month t − 12 are ranked by their cumulative returnsover months t− 12 through t− 2. The value of MOM in month t is the payoff on a spread
consisting of a $1 long position in an equally weighted portfolio of the top 30% of the stocks
in that ranking and a corresponding $1 short position in the bottom 30%. This factor is
included as a fourth benchmark in some of the analysis in the next section, dealing with
investment, but this section confines the estimation of alphas to those based on the CAPM
and the three-factor Fama-French model.
The remaining three non-benchmark assets, whose returns are denoted as IP1, IP2,
and IP3, are portfolios constructed from a universe of 20 value-weighted industry portfo-
lios formed using the same classification scheme as Moskowitz and Grinblatt (1999). The
three portfolios mimic the first three principal components of the disturbances in multiple
regressions of the 20 industry returns on the other passive returns: MKT, SMB, HML, CMS,
and MOM. The vector of weights for IP1 is proportional to the eigenvector for the largest
eigenvalue of the sample covariance matrix of the residuals in those regressions, and the other
two portfolios are similarly formed using eigenvectors for the second and third eigenvalues.
7Using up to 60 months of data through December of year s − 1, the “pre-formation” HML betas arecomputed in a regression of the stock’s excess returns on “fixed-weight” versions of the FF factors, whichhold the weights on the constituent stocks constant at their June-end values of year s. Using the fixed-weightfactors, as suggested by Daniel and Titman (1997), increases the dispersion in the “post-formation” betasof the resulting portfolios.
10

The specification of non-benchmark assets must be somewhat arbitrary, but our selection
of the five described above is based on several considerations. Recall that non-benchmark
assets supply information about αA, the fund’s alpha, when they explain additional variance
of the fund’s returns, i.e. when cAN 6= 0. Also, except when the benchmarks are assumedto price the non-benchmark assets perfectly, the latter assets also provide information about
αA when they are mispriced by the benchmarks, i.e. when αN 6= 0. Our inclusion of
the three industry portfolios is motivated primarily by the first consideration, explaining
variance. Although we don’t dismiss the possibility of their being mispriced, those portfolios
are constructed to capture the most important sources of industry-related variation that is
not accounted for by the other passive assets. On the other hand, our inclusion of CMS and
MOM is motivated chiefly by the second consideration, mispricing. Evidence in other studies
indicates that those spread positions may not be priced completely by the three benchmark
factors, MKT, SMB, and HML. For example, Daniel and Titman (1997) conclude that,
during the post-1963 period, characteristic-matched spreads in HML beta produce nonzero
alphas with respect to the Fama-French three-factor model.8 Fama and French (1996) report
a large three-factor alpha for the momentum strategy of Jegadeesh and Titman (1993). Of
course, to be useful in estimating αA, CMS and MOM also have to explain additional variance
of the fund’s returns, and we find that to be the case for many funds.
Parsimony is a consideration limiting our number of non-benchmark assets to five. As
discussed earlier, the degrees-of-freedom effect in finite samples argues against indiscrimi-
nately specifying a large number of non-benchmark assets. One might instead include a
larger number of the characteristic-matched spreads, say one for each size/book-to-market
subgroup, or include all 20 industry portfolios instead of constructing the smaller set of three.
We tried such alternatives and found that they quite often produce estimates of αA similar
to those obtained using the smaller set of five, but the precision of the estimates based on the
larger set is lower. The OLS estimators of δA and cAN are undefined, or essentially infinitely
imprecise, when the total number of passive assets exceeds the length of the fund’s history.
The shrinkage estimator (explained below) can still be computed in that case, but it often
yields a less precise inference than when fewer non-benchmark assets are used. It is likely
that future research could refine the selection of non-benchmark assets and further increase
the precision of estimated alphas. For example, a different set of non-benchmark assets
could be specified for each fund, so that the assets have a high correlation with the specific
fund at hand. A larger number of non-benchmark assets could be used for a fund with a
longer history, since the degrees-of-freedom problem is then less severe. Our specification of
8Davis, Fama, and French (2000) find that a hypothesis of zero mispricing for such spreads cannot berejected within the longer 1929—97 period.
11

non-benchmark assets, motivated chiefly by simplicity, probably understates the potential
gains from using non-benchmark assets to help estimate fund performance.
The mutual-fund data come from the 1998 CRSP Survivor Bias Free Mutual Fund Data-
base.9 Our sample contains 2,609 domestic equity mutual funds.10 We exclude multiple
share classes for the same fund as well as funds with only a year or less of available returns.
Funds are assigned to one of seven broad investment objectives, using information that the
CRSP database provides about classifications by Wiesenberger, ICDI, and Strategic Insight.
Table 1 lists the number of funds in each objective, further classifying funds within each
objective by the number of months in the fund’s available return history. For each fund we
compute the monthly return in excess of that on a one-month Treasury bill.
2.3. The Bayesian framework
We compute the posterior mean of αA by computing posterior means for the parameters of
the regressions in (3) and (4). Recall from an earlier discussion that the likelihood function
for each fund can be expressed as a product of two factors, one for each regression. We assume
that the disturbances in (4) are uncorrelated across funds, which implies that the likelihood
functions across funds are independent. Non-benchmark assets thus play yet another role, in
that they account for covariance in fund returns that is not captured fully by the benchmarks.
We also specify prior beliefs in which the parameters of the regression in (3) are independent
across funds as well as independent of the parameters of (4). Given the latter property, the
posterior distribution of αN is independent of δA and cAN , so the posterior mean of αA is
obtained simply by evaluating the right-hand side of (5) at the posterior means of αN , δA and
cAN . The independence of the prior and the likelihood across funds allows us to conduct the
analysis fund by fund. We also examine the posterior standard deviations of αA, which can
be computed using the posterior first and second moments of αN , δA and cAN . Derivations
of the posterior moments are provided in the Appendix. The specification of prior beliefs is
discussed below.
First consider the parameters of the regression in (3). The prior distribution for Σ, the
covariance matrix of ²N,t, is specified as inverted Wishart,
Σ−1 ∼W (H−1, ν). (12)
9CRSP, Center for Research in Security Prices, Graduate School of Business, The University of Chicago1999, crsp.com. Used with permission. All rights reserved.10We are grateful to Thomas Knox and the authors of Baks, Metrick, and Wachter (2000) for providing
us with a number of corrections to the CRSP Mutual Fund Database.
12
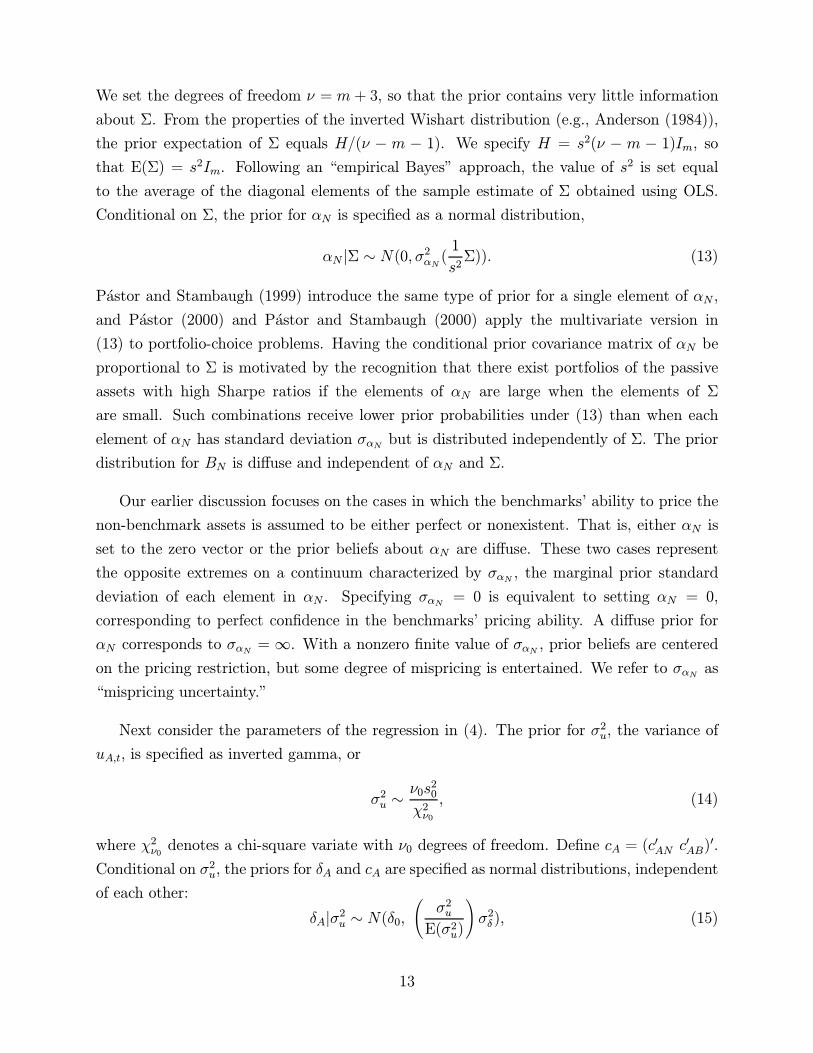
We set the degrees of freedom ν = m + 3, so that the prior contains very little information
about Σ. From the properties of the inverted Wishart distribution (e.g., Anderson (1984)),
the prior expectation of Σ equals H/(ν − m − 1). We specify H = s2(ν − m − 1)Im, sothat E(Σ) = s2Im. Following an “empirical Bayes” approach, the value of s
2 is set equal
to the average of the diagonal elements of the sample estimate of Σ obtained using OLS.
Conditional on Σ, the prior for αN is specified as a normal distribution,
αN |Σ ∼ N(0, σ2αN (1
s2Σ)). (13)
Pastor and Stambaugh (1999) introduce the same type of prior for a single element of αN ,
and Pastor (2000) and Pastor and Stambaugh (2000) apply the multivariate version in
(13) to portfolio-choice problems. Having the conditional prior covariance matrix of αN be
proportional to Σ is motivated by the recognition that there exist portfolios of the passive
assets with high Sharpe ratios if the elements of αN are large when the elements of Σ
are small. Such combinations receive lower prior probabilities under (13) than when each
element of αN has standard deviation σαN but is distributed independently of Σ. The prior
distribution for BN is diffuse and independent of αN and Σ.
Our earlier discussion focuses on the cases in which the benchmarks’ ability to price the
non-benchmark assets is assumed to be either perfect or nonexistent. That is, either αN is
set to the zero vector or the prior beliefs about αN are diffuse. These two cases represent
the opposite extremes on a continuum characterized by σαN , the marginal prior standard
deviation of each element in αN . Specifying σαN = 0 is equivalent to setting αN = 0,
corresponding to perfect confidence in the benchmarks’ pricing ability. A diffuse prior for
αN corresponds to σαN = ∞. With a nonzero finite value of σαN , prior beliefs are centeredon the pricing restriction, but some degree of mispricing is entertained. We refer to σαN as
“mispricing uncertainty.”
Next consider the parameters of the regression in (4). The prior for σ2u, the variance of
uA,t, is specified as inverted gamma, or
σ2u ∼ν0s
20
χ2ν0, (14)
where χ2ν0 denotes a chi-square variate with ν0 degrees of freedom. Define cA = (c0AN c
0AB)
0.
Conditional on σ2u, the priors for δA and cA are specified as normal distributions, independent
of each other:
δA|σ2u ∼ N(δ0,Ã
σ2uE(σ2u)
!σ2δ ), (15)
13

and
cA|σ2u ∼ N(c0,Ã
σ2uE(σ2u)
!Φc). (16)
The marginal prior variance of δA is σ2δ , and the marginal prior covariance matrix of cA is Φc.
In this section, focused on estimation, we set σ2δ =∞, which implies that the prior for αA isdiffuse and that δ0 is irrelevant. In the next section, dealing with investment, we set σ
2δ to
finite values and specify δ0 to reflect the fund’s costs. The conditional prior variance of δA is
positively related to σ2u for a reason similar to that given for the corresponding assumption
in (13). If the variation in the fund’s return is explained well by that of the benchmarks, so
that σ2u is low, then it is less likely that the fund’s manager can achieve a large value for δA.
Values for s0, ν0, c0, and Φc in (14) through (16) are specified using an empirical-Bayes
procedure. The basic idea is that a given fund is viewed as a draw from a cross-section of
funds with the same investment objective, so the prior uncertainty about a parameter for the
fund is governed by the cross-sectional dispersion of that parameter. The empirical-Bayes
procedure uses the data to infer those properties of the cross-section. The prior mean and
covariance matrix of cA, denoted by c0 and Φc, are set equal to the corresponding sample
cross-sectional moments of cA, the OLS estimate of cA, for all funds with at least 60 months
of data and the same investment objective as the fund at hand. (Recall that the investment
objectives are displayed in Table 1.) Setting Φc equal to the sample covariance matrix of
cA, without adjusting for the sampling variation in those estimates, overstates the dispersion
across funds in the true values of cA. In that sense, our use of this empirical-Bayes procedure
is conservative, in that it applies an intentionally modest degree of shrinkage toward the
cross-sectional mean of cA when computing the posterior moments of cA for a given fund.
With a diffuse prior on cA, or no shrinkage, the estimate (posterior mean) of cA is simply the
OLS value cA. The degree of shrinkage applied here, albeit conservative, gives a more precise
estimate of cA, especially for a short-history fund, and thereby allows the non-benchmark
assets to reveal more of their information about the fund’s alpha.
The inverted gamma prior density for σ2u implies (e.g., Zellner (1971, p. 372)),
E(σ2u) =ν0s
20
ν0 − 2 , (17)
and
ν0 = 4 +2(E(σ2u))
2
Var(σ2u). (18)
We substitute the cross-sectional mean and variance of σ2u for E(σ2u) and Var(σ
2u) in (17)
and (18). The value of ν0 is set to the next largest integer of the resulting value on the
14

right-hand side of (18), and then that value of ν0 implies the value of s20 using (17). Here
again, using the cross-sectional variance of σ2u without adjusting for sampling error produces
a conservative amount of shrinkage toward the cross-sectional mean of σ2u for funds with the
same objective.
Our framework assumes that funds’ sensitivities to passive assets are constant over time.
One way of relaxing this assumption is to model these coefficients as linear functions of state
variables, as for example in Ferson and Schadt (1996). In such a modification, passive asset
returns scaled by the state variables can be viewed as returns on additional passive assets
(dynamic passive strategies), and the approach developed here could be extended to such a
setting. Another approach to dealing with temporal variation in parameters could employ
data on fund holdings. Daniel, Grinblatt, Titman, and Wermers (1997) and Wermers (2000),
for example, use such data in characteristic-based studies of fund performance.
2.4. An alternative approach using GMM
The information in non-benchmark assets can also be incorporated in an estimate of the
fund’s alpha by using the generalized method of moments (GMM) of Hansen (1982). Let
γ denote the vector of parameters corresponding to the elements of δA, cAN , cAB, αN , and
BN . The estimate of γ can be obtained by minimizing g(γ)0Wg(γ), where g(γ) denotes the
vector of (1 +m+ k) +m(1 + k) moment conditions
g(γ) ≡
1S
Pt∈F (rA,t − δA − c0ANrN,t − c0ABrB,t)
1rN,trB,t
vec
(1T
PTt=1 (rN,t − αN − BNrB,t)
Ã1rB,t
!0) , (19)
and F denotes the subset of the periods {1, . . . , T} representing the fund’s return history oflength S. The first set of moment conditions in (19) corresponds to the regression in (4),
and the second set corresponds to the regression in (3). The weighting matrix W is block
diagonal, since the disturbance in (3) is uncorrelated with that in (4). GMM estimates of the
fund’s alpha can be constructed under two cases, corresponding to σαN =∞ and σαN = 0 in
the Bayesian framework. With no restriction on αN , the above moment conditions serve to
exactly identify γ. Using the GMM estimate γ, the fund’s estimated alpha can be computed
as αA = δA + c0AN αN . With the pricing restriction αN = 0, the second set of moment
conditions can be dropped and the fund’s alpha is estimated simply as αA = δA.
The above GMM approach incorporates the information in non-benchmark assets in
15

essentially the same manner as the Bayesian framework, but it permits a more general
stochastic setting. The disturbances in (3) and (4) are not assumed to obey a specific
distribution, and the weighting matrix W can be specified to allow non-i.i.d. behavior of
those disturbances. Moreover, it is straightforward to modify the above moment conditions
to allow the sensitivities (cA, BN) to be linear functions of state variables, as in Ferson and
Schadt (1996), whereas incorporating such an extension in the likelihood-based Bayesian
setting is more complicated. On the other hand, the Bayesian framework also offers some
advantages. First, it permits flexible non-extreme beliefs about pricing and skill, i.e., values
of σαN and σδ other than zero or infinity. Second, it provides finite-sample inference about
the funds’ alphas. Third, it increases the precision of the estimates of cA, particularly for
short-history funds, by shrinking the elements of cA to their cross-sectional averages. Finally,
as demonstrated in the next section, the Bayesian framework permits the data to be analyzed
in the context of mutual fund investment and accounts for parameter uncertainty in that
decision problem.
2.5. Results
Table 2 reports medians, within various fund classifications, of CAPM alphas (Panel A)
and Fama-French alphas (Panel B). The posterior mean of αA, denoted as αA, is computed
for σαN equal to zero, two percent (annualized), and infinity. Recall that the usual OLS
estimator, denoted as αA, makes no use of non-benchmark assets. Also reported are median
absolute differences between αA and αA. Not surprisingly, non-benchmark assets play a
greater role in the estimation of CAPM alphas, since two of the non-benchmark assets in
that case, SMB and HML, are already included as benchmarks when estimating Fama-French
alphas. Across all funds, the median value of |αA− αA| is two percent per annum for CAPMalphas but about one percent or less, depending on σαN , for Fama-French alphas. Note also
that |αA− αA| is typically smaller for the funds with longer histories. With a longer history,αA becomes more precise, so the additional information in non-benchmark returns has a
smaller impact.
The manner by which non-benchmark assets provide information is illustrated most dra-
matically in the case of CAPM alphas for small-company growth funds. For such funds,
incorporating the information in non-benchmark assets typically makes a difference of be-
tween 7.2% and 8.3% per annum when estimating the CAPM alpha, depending on σαN .
Nearly half of those 413 funds have track records of three years or less (see Table 1), and
the bulk of their track records fall toward the end of the overall period. In recent years,
16

small-firm indexes have underperformed their CAPM predictions, which is relevant when
σαN = 0, and they have also underperformed their long-run historical averages, which is
relevant when σαN = ∞. (Both statements are relevant when σαN = 2%.) Incorporating
that information is accomplished in either case largely by including the size factor SMB as
a non-benchmark asset.
An important issue in performance evaluation is whether the mutual fund industry adds
value beyond standard passive benchmarks. We address this issue by computing posterior
probabilities that average fund alphas within various fund classifications are negative. These
probabilities are computed based on 100,000 draws of the average alpha from its posterior
distribution. The probabilities are reported in Table 3, together with posterior means of
average CAPM alphas (Panel A) and Fama-French alphas (Panel B). Some differences be-
tween the average alphas in Table 3 and the median alphas in Table 2 reflect skewness in the
cross-sectional distribution of fund alphas. For example, the average of the OLS estimates
of the CAPM alphas across all funds is −3.83%, compared to their median of −2.13%.
With few exceptions, Table 3 supports the inference that average fund alphas are negative.
For example, for each investment objective and each age group, the average of the OLS
estimates of the CAPM alphas is negative with 100% probability. The averages of the
OLS estimates of the Fama-French alphas are mostly negative, although they are reliably
positive for funds with histories longer than 10 years. When the non-benchmark assets are
included, the average performance across all funds remains significantly negative, although
the performance of long-history funds and aggressive growth funds improves with skeptical
prior beliefs about pricing (σαN = ∞). The importance of beliefs about pricing can beillustrated by the average Fama-French alpha for small-cap growth funds. When the non-
benchmark assets are not used, there is a 50% probability that the average alpha for those
funds is negative. When the non-benchmark assets are included, the probability that the
average alpha is negative rises to 100% when those assets are believed to be exactly priced
by the benchmarks, but it drops to 9% when no pricing relation is used.
The alpha estimates in Tables 2 and 3 are generally higher for the funds with longer
histories. These patterns could reflect survival effects, although similar age-related patterns
emerge in the subsample of funds that existed at the end of 1998 (about 75% of our funds),
and the median CAPM αA’s for the shorter-lived funds are actually lower in that subsample
than in the overall sample that includes non-surviving funds. Nevertheless, at least part of
the age patterns could reflect survival effects, in that funds with poor track records are less
likely to be long lived.
17

To investigate whether including the non-benchmark assets leads to a more precise infer-
ence about a fund’s alpha, we examine the ratio of two posterior variances. The numerator
of the ratio is the posterior variance of αA under our model in which non-benchmark assets
are used and the prior variance for the elements of αN is as given in the column heading.
Recall that the posterior mean of αA in that case is denoted as αA. The denominator of
the ratio is the posterior variance of αA when the non-benchmark assets are not used and
diffuse priors are assigned to all parameters. The posterior mean of αA in that case is the
OLS estimate αA. For ease of discussion, we commit a slight abuse of notation and refer to
the posterior variances in the numerator and denominator as the “variances” of αA and αA.
These variances reflect the precision of inferences about αA in the sense generally associated
with standard errors in a frequentist setting. In fact, the denominator of the ratio equals
the squared standard error computed in the usual regression model.
For most funds, a more precise inference about alpha is obtained by including non-
benchmark assets. Table 4 reports the median ratio of the variance of αA to the variance
of αA. Also reported is the fraction of those ratios that are less than one. For the CAPM
alpha estimates, the median variance ratio across all funds is approximately 0.7, and the
ratio is less than one for roughly 90% of the funds. For Fama-French alphas, the ratio has
a median of about 0.85 and is less than one for roughly 80% of the funds. In general, the
median ratio is higher for the funds with longer histories. Note from Table 1 that funds with
track records of at least 20 years represent only about 5% or our sample (139 out of 2609).
For those funds, the OLS estimates of Fama-French alphas are typically about as precise
as the estimates that incorporate the non-benchmark assets: the median variance ratios are
1.00 or just slightly less, and the ratios cluster fairly tightly around that value. At the other
extreme lies the variance ratio associated with estimating CAPM alphas for small-company
growth funds. That variance ratio has a median between 0.33 and 0.39, depending on σαN ,
and the ratio is less than one for all such funds in our sample. Thus, for small-company
growth funds in particular, not only is the CAPM αA substantially higher than the CAPM
αA, it is also substantially more precise.
Recall that estimates of αA are identical across different specifications of the benchmarks
when one assumes the non-benchmark assets are priced exactly under each specification.
In Table 2, note that the median values of αA are indeed the same in Panels A and B
when σαN = 0 (which sets αN = 0). Table 5 compares estimates of CAPM and Fama-French
alphas when σαN = 2% (Panel A) and σαN =∞ (Panel B). As expected, the median absolute
differences between models are typically larger in the second case, but those differences are
still substantially less than the median absolute differences between OLS estimates (Panel
18

C). In other words, even when the non-benchmark assets are not believed to be priced
whatsoever by either model’s benchmarks, their presence in the estimation still makes the
definition of αA substantially less important than when they are not used at all. Across all
funds, the median absolute difference between estimated CAPM and Fama-French alphas is
0.42% (per annum) under σαN = 2% and 1.24% under σαN =∞, as compared to 2.28% for
the OLS estimates. For small-company growth funds, the median difference is 0.69% under
σαN = 2% and 2.03% under σαN =∞, as compared to 8.07% for the OLS estimates.
Table 6 compares alphas defined for a given set of benchmarks and estimated with or
without the pricing restriction imposed on the non-benchmark assets. That is, for αA defined
with respect to a given pricing model, we compare estimates under σαN = 0 to estimates
under σαN = ∞. Across all funds, the median difference is 0.94% for CAPM alphas and
0.68% for Fama-French alphas. Interestingly, the median differences display little if any
relation to the length of the fund’s history. Most of the median differences in the two-way
sort (by objective and age) are 2% or less, with the exception of sector funds. For the funds
with the longest histories, the effect of imposing the pricing restriction on the non-benchmark
assets is often as large as the effect of not including the non-benchmark assets at all (shown
earlier in Table 2). The latter effect is more important for history lengths of ten years or less
when estimating CAPM alphas and five years or less when estimating Fama-French alphas.
Note from Table 1 that about 85% of the equity funds in our sample have history lengths
less than 10 years, and about 60% have histories of five years or less.
3. Investing with priors about skill and pricing
Prior beliefs about pricing models can be useful to someone investing in mutual funds. A
pricing model implies that a combination of the model’s benchmark assets provides the
highest Sharpe ratio within a passive universe. That implication is useful to an investor
seeking a high Sharpe ratio, even if the investor has less than complete confidence in the
model’s pricing accuracy and cannot invest directly in the benchmarks. Prior beliefs about
managerial skill are also important in the investment decision. One investor might believe
completely in a model’s accuracy in pricing passive assets but believe active managers may
well possess stock-picking skill. Another investor might be skeptical about the ability of fund
managers to pick stocks as well as the ability of academics to build accurate pricing models.
This section applies the econometric framework described in the previous section to an
investment setting that allows an investor to combine information in the data with prior
19

beliefs about both pricing and skill. Non-benchmark assets allow us to distinguish between
pricing and skill, and they supply additional information about funds’ expected returns in
essentially the same manner as in the estimation problem of the previous section. In addition,
non-benchmark assets help account for common variation in funds, making the investment
problem feasible using a large universe of funds. We begin the section with a discussion of
skill and prior beliefs, and then we present and discuss portfolios constructed under a range
of priors about pricing models and skill.
3.1. Prior beliefs
In both commercial and academic settings, much interest attaches to alphas defined with
respect to small sets of benchmarks identified by pricing models. Estimating such alphas is
the subject of the previous section. Alpha is often interpreted as skill displayed by the fund’s
manager in selecting mispriced securities, but a nonzero alpha need not reflect skill if some
passive assets can also have nonzero alphas. For example, a manager who starts a new fund
investing in non-benchmark passive assets whose alphas have historically been positive can
have a positive alpha in the absence of any skill. To address such concerns, one could expand
the set of benchmarks to include more passive assets, even to the point of including all assets
available to the manager. Indeed, as observed by Grinblatt and Titman (1989, p.412), “...
the unconditional mean-variance efficient portfolio of assets that are considered tradable by
the evaluated investor provides correct inferences about the investor’s performance ... links
between performance measures and particular equilibrium models are not necessary.” Chen
and Knez (1996) adopt a similar approach in a conditional setting, in that they evaluate funds
with respect to a set of passive benchmarks selected without regard to a pricing model: “...we
argue that for application purposes, one does not need to rely on asset pricing models to
define an admissible performance measure” (p. 515).
In practice, the number of passive assets must be limited in some fashion. Our empirical
design includes p passive assets, consisting of k benchmarks and m non-benchmark assets,
and the benchmarks are associated with popular asset pricing models. Suppose one admits
the possibility that the benchmarks do not price the non-benchmark assets exactly, that is
αN 6= 0. Then δA, the intercept in (4), is a better measure of skill, in that it is defined withrespect to the more inclusive set of passive assets. Of course, that measure might still be
nonzero for passive assets omitted from the set of p. The point is simply that inadequacy of
δA as a skill measure implies inadequacy of αA, whereas δA can be adequate when αA is not.
20

The skill measure δA is defined with respect to the overall set of p assets, but the investor
nevertheless finds it useful to partition that set into k benchmark and m non-benchmark
assets. Even though the investor is unwilling to assume that the k benchmarks price the non-
benchmark assets exactly, he might nevertheless believe that the benchmarks possess some
pricing ability. That pricing ability, albeit imperfect, helps the investor identify portfolios
with high Sharpe ratios, as will be illustrated below. The investor’s prior beliefs about
pricing are represented as before, with a prior for αN characterized by σαN .
We assume that an investor selecting a portfolio of mutual funds generally has informative
prior beliefs about a fund manager’s ability to achieve a nonzero δA. Prior beliefs about δA,
given by (15), are characterized by the prior mean and standard deviation, δ0 and σδ. Recall
that in the estimation problem addressed in the previous section, the prior beliefs about δA
are diffuse (σδ =∞) and thus δ0 is irrelevant. In the investment problem addressed here, σδcan be finite, and even zero, so the prior mean δ0 must be specified as well.
If a fund manager possesses no skill, then δA should simply reflect costs, since the returns
on the p passive assets used to define δA have no costs deducted. To represent a prior belief
that precludes skill, we set σδ = 0 and specify
δ0 = − 112(expense + 0.01× turnover), (20)
where expense is the fund’s average annual expense ratio and turnover is the fund’s average
annual reported turnover. Multiplying the latter quantity by 0.01 is equivalent to assuming
a round-trip cost per transaction of one percent, approximately the 95 basis points estimated
by Carhart (1997) for the average fund in his sample. Carhart obtains that estimate as the
average slope coefficient in monthly cross-sectional regressions of fund return on “modified”
turnover (MTURN), which is reported turnover plus one-half the rate of change in total
net assets (TNA) adjusted for investment returns and mergers. Reported turnover is the
minimum of the fund’s purchases and sales divided by its average TNA. MTURN, which
essentially includes transactions arising from contributions and withdrawals, is the appropri-
ate measure for estimating transactions costs in Carhart’s regression. For example, a fund
that sells nothing in a year but experiences contributions doubling its size will have a value
of zero for turnover but a value of 0.50 for MTURN. The resulting purchases incur costs
impacting the fund’s return that year, and the year-by-year values of MTURN can better
explain that component of return variation and thereby provide an estimate of transactions
costs. In forecasting future transactions, however, it seems more reasonable to abstract from
growth or shrinkage of the fund and instead view a fund with either no sales or no purchases
as likely to be a low-turnover fund. Thus, we define turnover as the average of the reported
21

turnover values.
When one admits some possibility of skill, the link between turnover and prior expected
performance becomes less clear. If the manager does possess skill, then high turnover is
likely to be accompanied by positive performance. On the other hand, if the manager
possesses no skill, then high turnover can only hurt expected performance. If the investor is
uncertain about whether the manager has skill, that is if σδ > 0, then the relation between
expected turnover and expected performance is ambiguous. A similar ambiguity arises with
expense ratios. We follow an empirical Bayes approach in specifying how prior expected
performance depends on expense and turnover when σδ > 0.11 Specifically, we estimate a
cross-sectional regression of estimated δA on112expense and 1
12turnover, where the estimate
of δA is the posterior mean obtained with σδ =∞. Across a number of alternative methodsfor including funds (e.g., minimum history length) and estimating the coefficients (OLS or
weighted least squares), we find that the coefficient on 112expense is consistently about −1
and is at least twice its standard error. In contrast, the coefficient on 112turnover fluctuates
within an interval roughly between −0.005 and 0.005 and is generally less than its standarderror.12 Guided by this result, we specify
δ0 = − 112expense (21)
as the prior mean of δA when σδ > 0.
3.2. The investment problem
Under various prior beliefs about skill and pricing, we construct portfolios with the highest
Sharpe ratio, defined as expected excess return divided by the standard deviation of return.
The investment universe consists of 505 funds selected from the 2,609 equity mutual funds
analyzed in the previous section. The 505 funds are those that (i) charge no load fee, (ii)
exist at the end of 1998, (iii) have at least 36 months of return history under the most recent
manager, and (iv) have data on expense ratios and turnover rates. We exclude funds that
charge load fees simply because it is not clear how to treat the payment of such fees within
the single-period setting implicit in maximizing the Sharpe ratio. The p passive assets used
to define δA are included in the econometric specification, but since returns on those assets
11An alternative approach, proposed by Baks, Metrick, and Wachter (2000), is to specify a prior forperformance that is truncated below at a point that reflects expenses as well as an estimate of transactionscosts.12Wermers (2000) finds that turnover does not exhibit a significant relation to net performance after
adjusting for risk and asset characteristics.
22

do not include any implementation costs, only the mutual funds are assumed to be eligible
for investment. In addition, short positions in funds are precluded.
The stochastic setting is as defined in Section 2. Let R denote the sample data, consisting
of returns on passive assets and funds through month T , and let rT+1 denote the vector of
returns on the funds in month T + 1. In solving the investment problem, Sharpe ratios are
computed using moments of the predictive distribution of the funds’ returns,
p(rT+1|R) =Zθp(rT+1|R, θ) p(θ|R) dθ, (22)
where p(θ|R) is the posterior distribution of the parameter vector, θ.13 The first two momentsof this predictive distribution are derived in the Appendix. The fund’s history is used only
back to the month beginning the most recent manager’s tenure, whereas the return histories
of the p passive assets begin in July 1963.
A meaningful investment universe can include only those funds that exist at the end of the
sample period, December 1998, but this selection criterion raises the issue of survival bias.
In particular, under prior beliefs that admit the possibility of skill (σδ > 0), one might be
concerned that the posterior mean of a manager’s skill measure δA is overstated by a failure
to condition on the fund’s having survived. Baks, Metrick, and Wachter (2000) make the
interesting observation that, if a fund’s survival depends only on realized return histories,
then the posterior distribution of the parameters for the surviving funds is unaffected by
conditioning their survival. In other words, a sufficient assumption for this result is that once
one conditions on all the return histories, the probability of a fund’s surviving is unaffected
by further conditioning on the model’s unobserved parameters. The Bayesian posterior for
the parameters conditions on the return histories in any event, and with this assumption
those return histories subsume the information in knowing the fund survived. Like Baks,
Metrick, and Wachter, we find the notion that survival depends only on realized returns to
be plausible, and thus we proceed under that assumption.
3.3. Portfolio selections
Table 7 reports weights in the optimal portfolio for investors with various beliefs about man-
agerial skill and mispricing of passive assets under the CAPM. (The weights in each column
of Panel A add to 100 percent.) For convenience, we refer throughout to a portfolio having
13Early applications of Bayesian methods to portfolio choice, using diffuse prior beliefs, include Zellnerand Chetty (1965), Klein and Bawa (1976), and Brown (1979). Recent examples, using informative priors,include Pastor (2000) and Pastor and Stambaugh (2000).
23

the highest Sharpe ratio within a given universe as “optimal.” Mispricing uncertainty, σαN ,
is assigned values of zero, one percent, and two percent (per annum), while skill uncertainty,
σδ, is assigned values of zero, one percent, three percent, and infinity. Tables 8 and 9 report
corresponding results for two other pricing models, the Fama-French three-factor model (Ta-
ble 8) and the Carhart four-factor model (Table 9). Table 10 reports optimal weights for
σαN =∞, in which case the investor makes no use of the pricing models.
We stated earlier that a pricing model, even if not believed completely, helps identify the
portfolios with high Sharpe ratios. This point can be illustrated in Table 7, for example,
by examining the optimal portfolio’s correlation with the market index, MKT. Reported
in Panel B of Tables 7 through 10 is the optimal portfolio’s predictive correlation with the
portfolio having the highest Sharpe ratio among those that combine the factors of each
pricing model. The latter portfolio is optimal for an investor who believes completely in
the given pricing model and can invest only in the p passive assets. The investor here, in
contrast, can invest only in mutual funds and not in the p passive assets. An investor who
believes completely in the CAPM and in no possibility of fund-manager skill (σαN = σδ = 0)
selects a combination of market index funds that is virtually perfectly correlated with MKT.
A value of σαN = 1% means that, before examining the data, the investor assigns about a
five percent probability to the prospect that the expected return on a given non-benchmark
passive asset violates its CAPM prediction by more than 200 basis points per annum in
either direction. With that degree of mispricing uncertainty but the same belief about skill,
the optimal portfolio is still essentially composed of market index funds and has a correlation
with MKT that rounds to 1.00. With twice as much mispricing uncertainty (σαN = 2%),
the correlation with MKT is 0.89, which is still considerably higher than the value of 0.74
obtained in Table 10 when no pricing model is used.
The CAPM continues to influence portfolio choice when the investor admits the possibility
of managerial skill. A value of σδ = 1% means that, before examining a given fund’s track
record, the investor assigns about a 2.5% probability to the prospect that the fund’s manager
generates a positive skill measure gross of expenses of at least 200 basis points per year. (Of
course, given the symmetry of our prior, the investor assigns the same probability to a
negative skill measure of that magnitude, but the left tail is presumably less interesting with
short sales precluded.) With that amount of skill uncertainty, the CAPM can still help the
investor construct the portfolio with the highest Sharpe ratio, even with some uncertainty
about the CAPM’s ability to price passive assets. When σδ = 1%, the optimal portfolio has
a correlation of 0.92 with MKT when σαN = 2% (Table 7), as compared to a correlation of
only 0.76 when the CAPM is not used (Table 10). With three times as much skill uncertainty
24

(σδ = 3%), the optimal portfolio’s correlation with MKT is 0.93 when σαN = 2% and 0.87
when the model is not used. That is, even with a substantial degree of willingness to accept
the possibility of managerial skill and only modest confidence in the CAPM, the investor’s
portfolio selection is still influenced by the pricing model.
Portfolio choice is influenced by beliefs in the other pricing models in essentially similar
ways as noted above for the CAPM. For both the Fama-French and four-factor models,
however, perfect confidence in the model does not result in an optimal portfolio of funds that
mimics as closely the optimal combination of the benchmarks from the model. Table 8 reports
optimal portfolios for investors with varying degrees of confidence in the three-factor Fama-
French model. After seeing the data, an investor who has complete prior confidence in that
model and admits no possibility of manager skill (σαN = σδ = 0) believes that the optimal
portfolio constructed from our universe of 505 no-load mutual funds has a correlation of only
0.75 with the optimal combination of the Fama-French benchmarks (Panel B). Moreover,
as reported in Panel C, that investor judges the highest Sharpe ratio obtainable within the
fund universe to be only 0.66 times that of the highest Sharpe ratio obtainable by combining
the benchmarks.14 Under the four-factor model, as reported in Table 9, the correlation
between the optimal fund portfolio and the optimal combination of the four benchmarks is
0.61, and the Sharpe ratio of the first portfolio is only slightly more than half that of the
second. Evidently, close substitutes for the Fama-French and Carhart benchmarks cannot
be constructed with long positions in funds from our no-load universe.
The main reason for the lack of benchmark substitutes is our precluding short sales of
mutual funds. When the short-sale constraint is removed, the Sharpe ratio of the optimal
fund portfolio increases to 0.99 times the Sharpe ratio of the efficient benchmark combination
under the Fama-French model and to 0.94 times the maximum under the Carhart model.
Since only a relatively small subset of funds can be shorted in practice, precluding short
sales in our fund universe seems reasonable. We also redid the analysis with an expanded
investment universe of 919 funds that includes funds with load fees. The improvement from
including the load funds is surprisingly small, despite the fact that we ignore their load fees.
Under the four-factor model, the Sharpe ratio rises only to 0.55 times the maximum, as
compared to multiple of 0.54 in the original no-load setting. Under the Fama-French model,
the Sharpe ratio rises so little that it rounds, as before, to only 0.66 times the maximum.
14If δ0 were set to zero for each fund, the correlation between the two portfolios would equal the Sharperatio of the fund portfolio divided by the Sharpe ratio of the benchmark portfolio. In that case, the secondportfolio would have the highest possible Sharpe ratio for the overall universe of funds and passive assets withinvestment weights unconstrained (i.e., short sales permitted), and an exact relation between correlationsand Sharpe ratios applies (e.g., Proposition 1 of Kandel and Stambaugh (1987)).
25

We conclude that the universe of all equity mutual funds, including the load funds, provides
no close substitutes for the Fama-French and momentum benchmarks.
3.4. Portfolio comparisons
Differences in prior beliefs about pricing models and the potential for managerial skill can
lead to economically significant differences between optimal portfolios of mutual funds. Table
11 and Panels D and E of Table 10 present comparisons of portfolios constructed under
various specifications. The certainty-equivalent differences are computed for an investor
who maximizes the mean-variance objective,
Cp = Ep − 12Aσ2p, (23)
where EP and σ2p denote the mean and variance of the excess return on the investor’s overall
portfolio (including unrestricted riskless borrowing and lending). Risk-aversion, A, is set
to 2.75, which is the level at which an investor would allocate 100% to MKT if the invest-
ment universe contained just that single risky position in addition to the riskless asset. In
comparing portfolios obtained under different specifications, one portfolio is designated as
optimal and the other as suboptimal, where the suboptimal portfolio is optimal under the
alternative specification. We compare the certainty equivalent for the optimal portfolio, Co,
to the certainty equivalent for a suboptimal portfolio, Cs. Both certainty equivalents are
computed using the predictive moments obtained under the prior beliefs associated with the
optimal portfolio.
Panel A of Table 11 compares portfolios formed with the same σαN and σδ but under
different pricing models. The difference between any two models ranges between 1 and 61
basis points per month, depending on the prior uncertainty about mispricing and skill.15
In general, sample averages receive more weight in estimating expected returns when one’s
prior beliefs about pricing and skill become less informative. As mispricing uncertainty
increases, the portfolios formed with beliefs centered on different pricing models become more
alike: the certainty-equivalent difference drops and the correlation increases. An increase in
skill uncertainty also tends to make the cross-model difference less important, although not
monotonically. The largest certainty-equivalent differences, which can exceed 50 basis points
15The reported certainty-equivalent difference is actually the average of two differences, one for each of thetwo pricing models designated as producing the optimal portfolio. The correlation reported in Panel A issimilarly the average of two values, one for the predictive distribution associated with each model. Averagingin this fashion treats the pricing models symmetrically, although generally the two values being averaged areclose to each other.
26

per month, tend to occur between the CAPM and the four-factor model when σαN and σδ are
small. The smallest differences occur between the Fama-French and four-factor models when
σδ is large. When σαN and σδ are both one percent or less, however, the certainty-equivalent
difference between those two models is at least 19 basis points per month.
In Panel B of Table 11, the optimal portfolio under a given set of beliefs about skill and
mispricing is compared to the portfolio selected by an investor who rules out any ability of
academics to build models and any skill of portfolio managers to pick stocks. The portfolio
of this “completely skeptical” investor, for whom σαN = ∞ and σδ = 0, is designated as
the suboptimal portfolio in computing the pairwise comparisons described previously. (Its
weights are given in the first column of Table 10.) Suppose one forces that portfolio to be
held by an investor who has a modest degree of confidence in the CAPM, say σαN = 2%,
and who admits some possibility of managerial skill, say σδ = 1%. Then that investor suffers
a certainty-equivalent loss of 29 basis points per month, or about 3.5% per year. With
beliefs centered around the Fama-French model but again with σαN = 2% and σδ = 1%,
the certainty-equivalent loss falls to 15 basis points per month. When skill uncertainty is
one percent or less, complete belief in the four-factor model produces a portfolio quite close
to that obtained with no use of the model at all, with a certainty-equivalent difference of 6
basis points or less and a correlation of at least 0.97. As an investor’s willingness to accept
the prospect of managerial skill increases, so does the certainty-equivalent loss if forced to
hold the portfolio of the completely skeptical investor. With σδ = 3%, for example, the loss
is between 31 and 89 basis points per month with modest confidence (σαN = 2%) in one
of the three pricing models. With no use of a pricing model, the loss is 23 basis points, as
reported in Panel D of Table 10.
Even with no belief in a pricing model and no preconceived limit on the magnitude of
likely managerial skill, that is when both σαN and σδ are infinitely large, the investor is
generally ill-advised in using a fund’s historical average return as the input for its expected
return. If the fund’s history is shorter than those of the passive assets, then the histories of
the passive assets provide additional information about the fund’s expected return. Under
the above prior beliefs, the certainty-equivalent loss of holding the portfolio constructed
using sample-averages instead of holding the portfolio constructed using that additional
information about expected returns is 187 basis points per month, or more than 22 percent
annually (Panel D of Table 10). The predictive covariance matrix obtained when σαN =∞and σδ = ∞ is used to construct both portfolios. As prior beliefs about pricing or skill
become informative, the loss incurred by holding the portfolio based on sample averages
becomes even greater, as is apparent in Panel C of Table 11.
27

3.5. Who should buy actively managed funds?
One might presume that actively managed funds should be purchased only by those investors
who admit some possibility that active fund managers possess stock-picking skill. For in-
vestors presented with our universe of 505 no-load funds, that need not be the answer. An
investor who believes completely in the CAPM and admits no possibility of managerial skill
does indeed invest only in market-index funds (Table 7). As the investor’s beliefs depart
from complete confidence in the CAPM, however, actively managed funds enter the optimal
portfolio even if the investor still adheres to a belief that managerial skill is impossible. If
one can invest directly and costlessly in the p passive assets used to define the skill measure
δA, then indeed long positions in funds arise only when positive δA’s are thought possible.
Otherwise, one simply combines the passive assets to obtain the highest Sharpe ratio. Baks,
Metrick, and Wachter (2000) essentially pose their active management question in that con-
text. If instead the p passive assets are not available for investment, as in our setup, perfect
substitutes for them need not exist in the mutual fund universe, let alone in its passively
managed subset. As a result, some actively managed funds can become attractive even to
investors who admit no chance of managerial skill.
A striking example of the above possibility occurs in the first column of Table 8. The
investor in that case believes completely in the Fama-French model and in no chance of
managerial skill. Nevertheless, the bulk of that investor’s optimal portfolio is allocated to
actively managed value funds and real-estate specialty funds: Legg Mason Total Return,
Mutual Discovery, First American Investment Real Estate Securities and DFA AEW Real
Estate Securities. Table 12 reports posterior means and “t statistics” (posterior mean divided
by posterior standard deviation) of the intercept and slopes in (4) for all funds that receive at
least a ten percent allocation in any of the porfolios in Tables 7 through 10. The selection of
the above funds has nothing to do with their having superior historical performance. In fact,
three of the four funds listed above have negative δA’s. With σαN = σδ = 0, the expected
returns on these funds, gross of costs, are assumed to conform exactly to the Fama-French
model. The presence of these funds in the optimal portfolio is instead driven by their risk
characteristics. Note, for example, that all four funds have relatively large positive (and
“significant”) slopes on HML.
28

3.6. Hot hands?
To the universe of 505 no-load funds, we also add a portfolio of funds with recent high returns,
motivated by much previous research indicating short-run persistence in fund performance.16
At the end of each year, starting with December 1962, we sort all existing equity funds
by their total returns over the previous twelve months (including only funds with returns
reported for those months) and form the equally weighted “hot-hand” portfolio of the top
ten percent. As Carhart (1997) observes, this portfolio has a positive sensitivity to the
momentum factor MOM, which is confirmed by the results in Table 12. The hot-hand
portfolio appears in the last row of both panels, and the posterior mean of its coefficient on
MOM is 0.19 (with a t statistic of 13.5). This portfolio does not enter any of the optimal
portfolios reported in Tables 7 through 10. The same result occurs if the hot-hand portfolio
contains only no-load funds, as constructed by Hendricks, Patel, and Zeckhauser (1993).
As Carhart (1997) points out, the hot-hand portfolio is a kind of momentum play. Even
a strong belief in momentum, which in our setting amounts to a strong belief in Carhart’s
four-factor model, does not result in an allocation to the hot-hand strategy. As we discover,
one reason for this outcome is the existence of other funds that apparently offer even stronger
momentum plays, at least in the sense that they have higher coefficients on MOM. The first
column of Table 9 displays the portfolio selected by an investor who rules out skill and has
complete confidence in the four-factor model. Note that the bulk of this portfolio is invested
in real estate funds. The regression results in Table 12 reveal that the posterior means of the
MOM coefficients for many of these funds are higher than that for the hot-hand portfolio.
Perhaps as importantly, the coefficients on SMB, HML, and MKT for these funds are also
positive and relatively large.17 The highest-Sharpe-ratio portfolio of the benchmarks in the
four-factor model contains those three factors and MOM in positive amounts. In our sample,
real estate funds offer exposures to all four factors, and that feature makes them attractive
to investors who believe in that model. When prior beliefs admit the possibility of skill,
funds enter the optimal portfolio due to their average realized returns as well as their risk
characteristics. This doesn’t help the hot-hand portfolio, since the posterior mean of its δA
is only 1 basis point.18
16See, for example, Grinblatt and Titman (1992), Hendricks, Patel, and Zeckhauser (1993), and Brownand Goetzmann (1995)17This is consistent with the evidence in Sanders (1997), who reports significantly positive SMB, HML,
and MKT betas for real estate investment trust indices between 1978 and 1996.18The hot-hand porfolio has a positive alpha with respect to the Fama-French benchmarks and receives a
substantial positive allocation when the investment universe contains only those three benchmarks and thehot-hand portfolio. See Knox (1999) for a treatment of this case in a Bayesian portfolio-choice setting.
29

4. Conclusions
This study develops and applies a framework in which beliefs about pricing models and
managerial skill play roles in both performance evaluation and investment decisions. Non-
benchmark passive assets provide additional information about mutual funds’ performance
measures and expected returns, and they allow us to specify prior beliefs that distinguish
mispricing from skill. In addition, non-benchmark assets help account for common variation
in fund returns, making the investment problem feasible with a large universe of funds.
A mutual fund’s performance measure, alpha, is defined relative to a set of passive bench-
marks. The typically reported OLS estimate of alpha ignores information provided by returns
on non-benchmark assets. The non-benchmark assets help estimate alpha if they are priced
to some extent by the benchmarks or if their return histories are longer than the fund’s.
Using a sample of 2,069 U.S. equity mutual funds, we demonstrate that the returns on
non-benchmark assets contain substantial information about fund performance. For most
funds, the estimates of alpha that incorporate this information are more precise than the
standard estimates. In the case of small-company growth funds, for example, the non-
benchmark assets allow alphas defined with respect to the market benchmark to be estimated
with only one third of the variance associated with the usual OLS estimates of those alphas.
Compared to the usual estimates, the estimates of alpha that incorporate the information
in the non-benchmark assets tend to exhibit less variation across different specifications of
the benchmarks. At the extreme, if one believes that some subset of the passive assets used in
the estimation prices the other passive assets exactly, then the estimate of alpha is the same
regardless of which subset is designated as the benchmarks that define alpha. In other words,
if one believes dogmatically in a pricing model, it does not matter which model that is when
estimating alpha. For most funds, we find that including information in non-benchmark
assets is more important than specifying the degree to which the non-benchmark assets are
priced by the benchmarks. We also find that, across different beliefs about pricing, most
funds have underperformed the CAPM and Fama-French benchmarks.
An important practical motivation for mutual-fund performance evaluation is to help an
investor decide in which funds to invest. This study constructs portfolios with maximum
Sharpe ratios from a universe of 505 no-load equity mutual funds. We find that the optimal
portfolios are substantially affected by prior beliefs about pricing and skill as well as by
including the information in non-benchmark assets. A pricing model is useful to an investor
30

seeking a high Sharpe ratio, even if the investor has less than complete confidence in the
model’s pricing accuracy and cannot invest directly in the benchmarks. With investment
in the benchmarks precluded, even investors who believe completely in a pricing model and
rule out the possibility of manager skill can include active funds in their portfolios. The fund
universe offers no close substitutes for the Fama-French and momentum benchmarks, and
active funds can be better substitutes for the benchmarks than passive funds. We also find
that the “hot-hand” portfolio of the previous year’s best-performing funds does not appear
in the portfolio of funds with the highest Sharpe ratio, even when momentum is believed to
be priced. An investor who holds that belief and is skeptical about managerial skill instead
invests heavily in real estate funds, which have higher exposures to the momentum factor
and the Fama-French factors.
Maximizing the Sharpe ratio is only one of many investment objectives. With a mul-
tiperiod investment objective, for example, beliefs about pricing and skill could exhibit
different effects. A multiperiod setting could also allow a meaningful consideration of the
funds that charge load fees. Such extensions offer challenges for future research.
31

Appendix
This Appendix derives the posterior moments of αA used in Section 2 as well as the predictive
moments of the fund returns used in Section 3. The prior for the parameters of the regression
in (4) is independent of the prior for the parameters of the regression in (3). In addition,
both of those priors are assumed to be independent of the (diffuse) prior for EB and VBB,
the mean and covariance matrix of the normal distribution for rB,t. The independence of
the priors and the independence of uA,t and ²N,t imply that the posterior distribution for
the parameters of the regression in (3) and the predictive distribution for rN,T+1 and rB,T+1
depend only on the sample of passive asset returns, not the fund returns. We first provide the
moments of those distributions, relying on the derivations in Pastor and Stambaugh (2000),
henceforth referred to as PS. Those moments are then combined with the posterior moments
of δA and cA to obtain the the posterior moments of αA and the predictive moments of the
fund returns.
A.1. Posterior distribution for the parameters of (3)
Define Y = (rN,1, . . . , rN,T )0, X = (rB,1, . . . , rB,T )
0, and Z = (ιT X), where ιT denotes a
T -vector of ones. Also define the (k + 1) ×m matrix G = (αN BN)0, and let g = vec (G).
For the T observations t = 1, . . . , T , the regression model in (3) can be written as
Y = ZG+ U, vec (U) ∼ N(0,Σ⊗ IT ), (A.1)
where U = (²N,t, . . . , ²N,T )0. Define the statistics G = (Z 0Z)−1Z 0Y , g = vec (G), Σ =
(Y − ZG)0(Y − ZG)/T , EB = X 0ιT/T , and VBB = (X − ιT E0B)0(X − ιT E
0B)/T . Let θP
denote the parameters of the joint distribution of the passive asset returns (G, Σ, EB, and
VBB), and define the T × p sample matrix of passive returns, RP = (X Y ). The likelihood
function for the passive returns can be factored as
p(RP |θP ) = p(Y |θP , X) p(X|θP ), (A.2)
where
p(Y |θP , X) ∝ |Σ|−T2 exp
½−12tr (Y − ZG)0(Y − ZG)Σ−1
¾(A.3)
p(X|θP ) ∝ |VBB|−T2 exp½−12tr (X − ιTE
0B)0(X − ιTE
0B)V
−1BB
¾. (A.4)
The joint prior distribution of all passive-return parameters is
p(θP ) = p(αN |Σ) p(Σ) p(BN) p(EB) p(VBB), (A.5)
32

where
p(αN |Σ) ∝ |Σ|− 12 exp
(−12α0N(
σ2αNs2Σ)−1αN
)(A.6)
p(Σ) ∝ |Σ|− ν+m+12 exp
½−12trHΣ−1
¾(A.7)
p(BN ) ∝ 1 (A.8)
p(EB) ∝ 1 (A.9)
p(VBB) ∝ |VBB|−k+12 . (A.10)
The priors of BN , EB, and VBB are diffuse. The prior of Σ is inverted Wishart with a small
number of degrees of freedom, so that it is essentially noninformative. The prior on αN
given Σ is normal and centered at the pricing restriction. Let D denote a (k + 1)× (k + 1)matrix whose (1, 1) element is s2
σ2αNand all other elements are zero. Also let F = D + Z 0Z
and Q = Z 0(IT − ZF−1Z 0)Z. Applying the analysis in PS, the likelihood and the prior arecombined to obtain the following moments of the posterior distribution:
g = E(g|RP ) = (Im ⊗ F−1Z 0Z)g (A.11)
Σ = E(Σ|RP ) = 1
T + ν −m− k − 1(H + T Σ+ G0QG) (A.12)
Var(g|RP ) = Σ⊗ F−1 (A.13)
EB = E(EB|RP ) = EB (A.14)
VBB = E(VBB|RP ) = T
T − k − 2 VBB (A.15)
Var(EB|RP ) =1
T − k − 2 VBB. (A.16)
Posterior means are denoted using tildes for the remainder of the Appendix.
A.2. Predictive moments of the passive returns
These predictive moments are derived in PS. Define rP,T+1 = (r0N,T+1 r
0B,T+1)
0. Its predictive
mean is
E∗P = E(rP,T+1|RP ) =ÃαN + BNEB
EB
!, (A.17)
where αN and BN are obtained from Eq. (A.11) using g = vec ((αN BN)0).
Partition the predictive covariance matrix as
V ∗P = Var(rP,T+1|RP ) ="V ∗NN V ∗NBV ∗BN V ∗BB
#. (A.18)
33
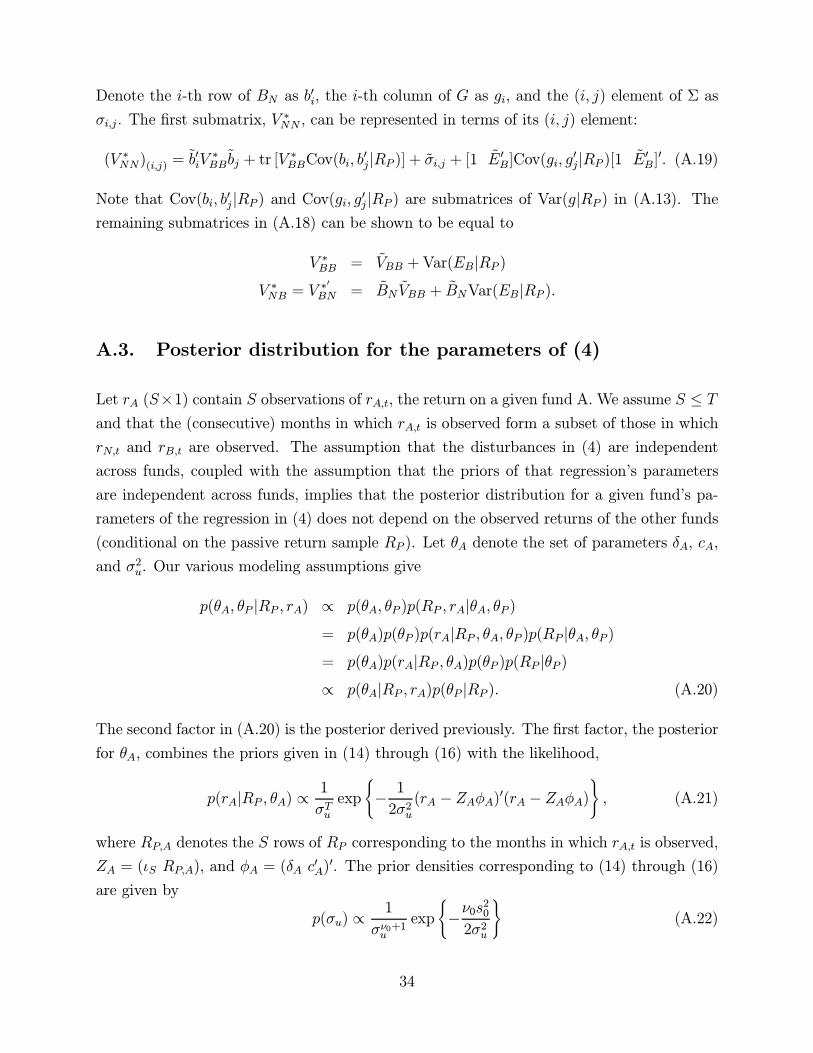
Denote the i-th row of BN as b0i, the i-th column of G as gi, and the (i, j) element of Σ as
σi,j . The first submatrix, V∗NN , can be represented in terms of its (i, j) element:
(V ∗NN)(i,j) = b0iV∗BB bj + tr [V
∗BBCov(bi, b
0j|RP )] + σi,j + [1 E 0B]Cov(gi, g
0j|RP )[1 E0B]
0. (A.19)
Note that Cov(bi, b0j|RP ) and Cov(gi, g0j|RP ) are submatrices of Var(g|RP ) in (A.13). The
remaining submatrices in (A.18) can be shown to be equal to
V ∗BB = VBB +Var(EB|RP )V ∗NB = V
∗0BN = BN VBB + BNVar(EB|RP ).
A.3. Posterior distribution for the parameters of (4)
Let rA (S×1) contain S observations of rA,t, the return on a given fund A. We assume S ≤ Tand that the (consecutive) months in which rA,t is observed form a subset of those in which
rN,t and rB,t are observed. The assumption that the disturbances in (4) are independent
across funds, coupled with the assumption that the priors of that regression’s parameters
are independent across funds, implies that the posterior distribution for a given fund’s pa-
rameters of the regression in (4) does not depend on the observed returns of the other funds
(conditional on the passive return sample RP ). Let θA denote the set of parameters δA, cA,
and σ2u. Our various modeling assumptions give
p(θA, θP |RP , rA) ∝ p(θA, θP )p(RP , rA|θA, θP )= p(θA)p(θP )p(rA|RP , θA, θP )p(RP |θA, θP )= p(θA)p(rA|RP , θA)p(θP )p(RP |θP )∝ p(θA|RP , rA)p(θP |RP ). (A.20)
The second factor in (A.20) is the posterior derived previously. The first factor, the posterior
for θA, combines the priors given in (14) through (16) with the likelihood,
p(rA|RP , θA) ∝ 1
σTuexp
(− 1
2σ2u(rA − ZAφA)0(rA − ZAφA)
), (A.21)
where RP,A denotes the S rows of RP corresponding to the months in which rA,t is observed,
ZA = (ιS RP,A), and φA = (δA c0A)0. The prior densities corresponding to (14) through (16)
are given by
p(σu) ∝ 1
σν0+1u
exp
(−ν0s
20
2σ2u
)(A.22)
34

and
p(φA|σu) ∝ 1
σp+1u
exp
(− 1
2σ2u(φA − φ0)
0Λ0(φA − φ0)
), (A.23)
where φ0 = (δ0 c00)0 and
Λ0 =
Ãν0s
20
ν0 − 2!"
σ2δ 00 Φc
#−1. (A.24)
The product of (A.21), (A.22), and (A.23) gives, after simplifying,19
p(φA, σu|RP , rA) ∝ 1
σp+1u
exp
(− 1
2σ2u(φA − φA)
0(Λ0 + Z 0AZA)(φA − φA)
)
× 1
σT+ν0+1u
exp
(− hA2σ2u
), (A.25)
where
φA = (Λ0 + Z0AZA)
−1(Λ0φ0 + Z 0ArA) (A.26)
hA = ν0s20 + r
0ArA + φ00Λ0φ0 − φ0A(Λ0 + Z
0AZA)φA. (A.27)
It follows from (A.25) that
φA|RP , rA,σu ∼ N(φA, σ2u(Λ0 + Z
0AZA)
−1) (A.28)
σ2u|RP , rA ∼ hAχ2T+ν0
, (A.29)
and hence
σ2u = E(σ2u|RP , rA) =
hAT + ν0 − 2 (A.30)
Var(φA|RP , rA) = σ2u(Λ0 + Z0AZA)
−1, (A.31)
where the last equation follows from variance decomposition.
A.4. Posterior moments of a fund’s alpha
Let αN and VαN denote the posterior mean and covariance matrix of αN , given by the ap-
propriate submatrices of the moments in (A.11) and (A.13), and let VφA denote the posterior
covariance matrix of φA given in (A.31). From the previous discussion recall that the pos-
teriors of φA and αN are independent. Thus, from equation (5), the posterior mean of the
fund’s alpha is given by
αA = δA + c0AN αN , (A.32)
19See Zellner (1971, pp. 75-76) for a similar derivation.
35

where δA and cAN are subvectors of the posterior mean of φA given in (A.26).
To obtain the posterior variance of αA, rewrite (5) as
αA = φ0Ad, (A.33)
where d = (1 α0N 0)0, and the posterior mean and covariance matrix of d are given by
d =
1αN0
, Vd =
0 0 00 VαN 00 0 0
. (A.34)
Let D denote the data, RP and rA, and note that by the variance-decomposition rule,
Var(αA|D) = E[Var(φ0Ad|D, d)|D] + Var[E(φ0Ad|D, d)|D]. (A.35)
Using the independence of φA and d, the first term in (A.35) can expressed as
E[Var(φ0Ad|D, d)|D] = E[d0VφAd|D]= E[tr (VφAdd
0)|D]= tr [VφAE(dd
0|D)]= tr (VφAVd) + d
0VφA d, (A.36)
and the second term can be expressed as
Var[E(φ0Ad|D, d)|D] = Var[φAd|D]= φ0AVdφA. (A.37)
A.5. Predictive moments of fund returns
The derivation of the predictive moments of fund returns closely parallels the derivation in
PS of the predictive moments of the non-benchmark returns, rN,T+1. Let R denote all of the
sample returns data on funds and passive assets through period T . Since cA and EP (the
mean of rP,t) are independent in the prior, the predictive mean of rA,T+1 is
E(rA,T+1|R) = E(δA + c0AEP |R) = δA + c0AEP . (A.38)
The predictive variance of rA,T+1 can be written as
Var(rA,T+1|R) = E(Var(rA,T+1|R,φA)|R) + Var(E(rA,T+1|R,φA)|R). (A.39)
36

To evaluate both terms on the right-hand side, first note that the regression in (4) implies
rA,T+1 = δA + c0ArP,T+1 + uT+1 (A.40)
= [1 r0P,T+1]φA + uT+1. (A.41)
To compute the first term on the right-hand side of (A.39), observe using (A.40) that
Var(rA,T+1|R,φA) = c0AV ∗P cA + σ2u, (A.42)
and taking expectations gives
E(Var(rA,T+1|R,φA)|R) = c0AV ∗P cA + tr [V ∗PCov(cA, c0A|R)] + σ2u. (A.43)
To compute the second term on the right-hand side of (A.39), observe using (A.41) that
E(rA,T+1|R,φA) = [1 E0P ]φA, (A.44)
so
Var(E(rA,T+1|R,φA)|R) = [1 E0P ]Cov(φA,φ0A|R)[1 E0P ]0. (A.45)
Note that the posterior covariance matrix Cov(φA,φ0A|R) and its submatrix Cov(cA, c0A|R)
are given in (A.31).
Computing the predictive covariance of rA,T+1 with the return on another fund J , rJ,T+1,
is simplified by the independence across funds of (i) the disturbances in (A.40) and (ii) the
posteriors for the coefficient vectors φA and φJ . Applying the same approach as used above
for the predictive variance gives
Cov(rA,T+1, rJ,T+1|R) = c0AV ∗P cJ . (A.46)
Computing the predictive covariance of rA,T+1 with the vector of returns on the passive
assets, rP,T+1, is simplified by the independence of the posterior for φA from that of EP and
VP . Let θ denote the union of θP and θA. Using the law of iterated expectations and the
variance decomposition rule gives
Cov(rA,T+1, rP,T+1|R) = E(Cov(rA,T+1, rP,T+1|R, θ)|R) + Cov(E(rA,T+1|R, θ),E(rP,T+1|R, θ)|R)= E(VP cA|R) + Cov(δA + c0AEP , EP |R)= VP cA +Cov(EP , E
0P |R)cA
= V ∗P cA. (A.47)
37

Table 1
Number of Equity Mutual Funds Classified byHistory Length and Investment Objective
The sample contains domestic equity mutual funds in the CRSP database with continuous return historieslonger than one year. Multiple share classes for the same fund are excluded. Funds are assigned to one ofseven broad investment objectives using information that the CRSP database provides about classificationsby Wiesenberger, ICDI, and Strategic Insight.
Length of fund’s return history (months)Investment objective 13—23 24—35 36—59 60—119 120—239 ≥ 240 All
Small-company growth 128 60 95 109 21 0 413Other aggressive growth 40 30 41 32 10 0 153Growth 213 130 226 251 92 60 972Income 36 35 38 47 14 4 174Growth and income 154 80 119 153 36 34 576Maximum capital gains 9 10 17 16 13 41 106Sector funds 61 37 45 68 4 0 215
All funds 641 382 581 676 190 139 2609
38

Table 2Estimates of Alpha for Equity Mutual Funds
Each value in the table is the median across the set of designated funds, expressed in percent per annum.Fund performance, denoted by αA, is defined as the intercept in the regression of the fund’s excess return,rA,t, on either the market benchmark index, MKTt, (Panel A) or that benchmark index plus the size andvalue benchmark indexes, SMBt and HMLt (Panel B). The OLS estimate of αA, denoted by αA, is based onthe fund’s available history and the corresponding history of the benchmarks. The posterior mean of αA,denoted by αA, is based on the fund’s available history as well as the returns from January 1963 throughDecember 1998 on the benchmarks and additional non-benchmark indexes. The quantity σαN , expressedin percent per annum, denotes the prior standard deviation of the intercept αN in a regression of a non-benchmark return on the benchmark indexes. The prior for αA is diffuse.
History length or αA for σαN of |αA − αA| for σαN ofinvestment objective αA 0 2% ∞ 0 2% ∞
A. rA,t = αA + βAMKTt + ²A,t13—23 months -4.81 -2.07 -1.87 -1.34 3.27 3.29 3.3324—35 months -2.85 -1.64 -1.53 -1.17 2.53 2.47 2.7236—59 months -2.87 -1.61 -1.35 -1.13 2.44 2.24 2.1060—119 months -1.49 -0.97 -0.91 -0.56 1.35 1.29 1.42120—239 months -0.84 -0.09 -0.08 0.03 1.29 1.04 0.96240 months and greater -0.53 -0.17 -0.26 -0.14 0.70 0.53 0.17
Small-company growth -8.45 -1.59 -0.97 -0.05 7.20 7.66 8.30Other aggressive growth -5.41 -0.97 -0.74 -1.06 4.80 4.65 4.58Growth -2.17 -0.97 -1.01 -1.17 1.64 1.48 1.52Income -0.39 -1.84 -1.40 -0.45 1.27 1.07 0.83Growth and income -0.51 -0.97 -0.87 -0.59 0.93 0.89 1.02Maximum capital gains -2.29 -1.47 -1.53 -1.95 2.16 1.75 1.34Sector funds -1.06 -3.96 -2.70 0.09 4.95 3.48 2.95
All funds -2.13 -1.25 -1.07 -0.74 2.05 1.87 1.90
B. rA,t = αA + bA,1MKTt + bA,2SMBt + bA,3HMLt + ηA,t13—23 months -1.68 -2.07 -1.96 -1.43 1.66 1.55 1.5924—35 months -1.63 -1.64 -1.52 -1.38 1.40 1.25 1.0136—59 months -1.29 -1.61 -1.46 -1.14 1.05 0.95 0.7860—119 months -0.92 -0.97 -0.94 -0.66 0.76 0.57 0.39120—239 months 0.07 -0.09 -0.06 0.08 0.64 0.42 0.24240 months and greater 0.12 -0.17 -0.13 0.17 0.76 0.50 0.05
Small-company growth -0.41 -1.59 -1.16 -0.08 1.45 1.15 0.92Other aggressive growth -0.37 -0.97 -0.45 0.08 1.76 1.34 0.96Growth -0.88 -0.97 -0.86 -0.72 0.90 0.78 0.59Income -2.03 -1.84 -1.90 -1.74 0.74 0.61 0.47Growth and income -1.19 -0.97 -1.00 -1.11 0.79 0.68 0.44Maximum capital gains -0.28 -1.47 -1.32 -0.34 1.40 1.03 0.45Sector funds -1.84 -3.96 -3.51 -2.48 3.18 2.44 1.35
All funds -1.07 -1.25 -1.14 -0.86 1.09 0.91 0.65
39

Table 3Average Equity-Fund Alphas
The table reports the posterior mean of αA, the average αA across the set of designated funds, expressed inpercent per annum. Also reported is the posterior probability (expressed in percent) that αA is negative.Fund performance, denoted by αA, is defined as the intercept in the regression of the fund’s excess return,rA,t, on either the market benchmark index, MKTt, (Panel A) or that benchmark index plus the size andvalue benchmark indexes, SMBt and HMLt (Panel B). The OLS estimate of αA, denoted by αA, is based onthe fund’s available history and the corresponding history of the benchmarks. The posterior mean of αA,denoted by αA, is based on the fund’s available history as well as the returns from January 1963 throughDecember 1998 on the benchmarks and additional non-benchmark indexes. The quantity σαN , expressedin percent per annum, denotes the prior standard deviation of the intercept αN in a regression of a non-benchmark return on the benchmark indexes. The prior for αA is diffuse.
Posterior mean of αA Prob( αA < 0)History length or αA for σαN of αA for σαN ofinvestment objective αA 0 ∞ αA 0 ∞
A. rA,t = αA + βAMKTt + ²A,t13—23 months -6.31 -1.67 -1.19 100 100 9824—35 months -4.77 -1.67 -1.29 100 100 9836—59 months -4.12 -1.78 -1.39 100 100 10060—119 months -2.13 -0.99 -0.66 100 100 94120—239 months -1.07 -0.08 0.11 100 72 42240 months and greater -0.50 -0.27 -0.26 100 99 70
Small-company growth -9.29 -1.28 0.01 100 100 50Other aggressive growth -6.79 -0.99 -1.39 100 98 89Growth -3.06 -1.00 -1.27 100 100 100Income -0.84 -1.56 -0.36 100 100 80Growth and income -1.02 -1.25 -1.01 100 100 100Maximum capital gains -4.74 -2.85 -3.01 100 100 100Sector funds -4.14 -2.45 -0.54 100 100 78
All funds -3.83 -1.33 -0.97 100 100 98
B. rA,t = αA + bA,1MKTt + bA,2SMBt + bA,3HMLt + ηA,t13—23 months -1.54 -1.67 -1.06 100 100 10024—35 months -1.22 -1.67 -1.02 100 100 10036—59 months -1.32 -1.78 -1.10 100 100 10060—119 months -0.66 -0.99 -0.44 100 100 99120—239 months 0.38 -0.08 0.46 0 72 1240 months and greater 0.15 -0.27 0.21 10 99 17
Small-company growth -0.00 -1.28 0.50 50 100 9Other aggressive growth 0.27 -0.99 0.29 30 98 30Growth -0.78 -1.00 -0.61 100 100 99Income -2.04 -1.56 -1.64 100 100 100Growth and income -1.76 -1.25 -1.43 100 100 100Maximum capital gains -1.67 -2.85 -1.64 100 100 100Sector funds -1.43 -2.45 -1.25 99 100 99
All funds -0.99 -1.33 -0.72 100 100 100
40

Table 4Relative Precision of Estimates of Alpha for Equity Mutual Funds
The table reports statistics for the ratio of variances, var(αA)/var(αA). Fund performance, denoted by αA,is defined as the intercept in the regression of the fund’s excess return, rA,t, on either the market benchmarkindex, MKTt, (Panel A) or that benchmark index plus the size and value benchmark indexes, SMBt andHMLt (Panel B). The OLS estimate of αA, denoted by αA, is based on the fund’s available history and thecorresponding history of the benchmarks. The posterior mean of αA, denoted by αA, is based on the fund’savailable history as well as the returns from January 1963 through December 1998 on the benchmarks andadditional non-benchmark indexes. The quantity σαN , expressed in percent per annum, denotes the priorstandard deviation of the intercept αN in a regression of a non-benchmark return on the benchmark indexes.The prior for αA is diffuse.
History length or σαN = 0 σαN = 2% σαN =∞investment objective median % < 1 median % < 1 median % < 1
A. rA,t = αA + βAMKTt + ²A,t13—23 months 0.62 83 0.62 83 0.63 8224—35 months 0.63 88 0.62 88 0.63 8936—59 months 0.65 90 0.65 92 0.68 9160—119 months 0.70 93 0.69 97 0.73 96120—239 months 0.76 93 0.77 97 0.84 98240 months and greater 0.84 88 0.87 92 0.98 74
Small-company growth 0.33 100 0.34 100 0.39 100Other aggressive growth 0.54 90 0.55 90 0.59 90Growth 0.76 87 0.76 89 0.80 87Income 0.75 84 0.75 89 0.77 89Growth and income 0.77 83 0.77 85 0.80 85Maximum capital gains 0.70 92 0.73 95 0.85 88Sector funds 0.62 96 0.63 96 0.66 95
All funds 0.68 89 0.68 91 0.72 89
B. rA,t = αA + bA,1MKTt + bA,2SMBt + bA,3HMLt + ηA,t13—23 months 0.70 81 0.69 81 0.69 8124—35 months 0.79 76 0.78 79 0.78 7736—59 months 0.85 80 0.84 83 0.83 8260—119 months 0.89 80 0.88 84 0.89 83120—239 months 0.95 75 0.93 88 0.94 91240 months and greater 1.00 53 0.98 71 0.99 83
Small-company growth 0.80 84 0.79 86 0.80 86Other aggressive growth 0.81 86 0.79 88 0.78 88Growth 0.88 78 0.86 82 0.88 82Income 0.88 79 0.87 83 0.86 82Growth and income 0.91 67 0.89 72 0.90 73Maximum capital gains 0.96 66 0.94 75 0.96 83Sector funds 0.74 95 0.74 95 0.76 95
All funds 0.86 78 0.84 82 0.85 82
41

Table 5
Comparison of Estimated CAPM and Fama-French Alphas underAlternative Roles for Non-Benchmark Assets
Each entry in Panels A and B is the median across funds of the absolute difference between posterior meansof a fund’s CAPM alpha and its Fama-French alpha, in percent per annum, under alternative prior beliefsabout the degree to which each model prices the non-benchmark assets. Each entry in Panel C is the medianabsolute difference of the OLS alpha estimates. Fund performance, denoted by αA, is defined as the interceptin the regression of the fund’s excess return, rA,t, on either the market benchmark index, MKTt, (CAPM)or that benchmark index plus the size and value benchmark indexes, SMBt and HMLt (Fama-French). TheOLS estimate of αA, denoted by αA, is based on the fund’s available history and the corresponding history ofthe benchmarks. The posterior mean of αA, denoted by αA, is based on the fund’s available history as wellas the returns from January 1963 through December 1998 on the benchmark and additional non-benchmarkindexes. The quantity σαN denotes the prior standard deviation of the intercept αN in a regression ofa non-benchmark return on the benchmark returns, and the table compares αA under a given non-zeroσαN but different specifications of the set of benchmark indexes. (The posterior means of the CAPM andFama-French alphas are identical under σαN = 0.) The prior for αA is diffuse.
Length of fund’s return history (months)Investment objective 13—23 24—35 36—59 60—119 120—239 ≥ 240 All
A. Mispricing uncertainty for the non-benchmark assets (σαN ) equal to 2% per annumSmall-company growth 0.58 1.01 0.74 0.67 0.70 na 0.69Other aggressive growth 0.69 0.43 0.74 0.60 0.69 na 0.67Growth 0.43 0.38 0.41 0.41 0.40 0.35 0.40Income 0.48 0.38 0.47 0.49 0.57 0.41 0.47Growth and income 0.18 0.20 0.26 0.19 0.33 0.23 0.20Maximum capital gains 0.64 0.35 0.43 0.66 0.46 0.37 0.45Sector funds 0.96 0.85 1.36 0.93 1.11 na 0.98
All funds 0.42 0.41 0.47 0.43 0.40 0.32 0.42
B. No reliance on the model to price the non-benchmark assets (σαN =∞)Small-company growth 1.69 2.72 2.11 1.89 2.02 na 2.03Other aggressive growth 2.10 1.29 2.38 1.75 2.20 na 1.89Growth 1.25 1.11 1.18 1.13 1.13 1.02 1.14Income 1.31 1.07 1.29 1.27 1.52 1.17 1.27Growth and income 0.53 0.63 0.74 0.54 0.89 0.61 0.59Maximum capital gains 2.00 1.16 1.64 2.15 1.30 1.12 1.34Sector funds 2.43 2.41 3.40 2.37 2.91 na 2.47
All funds 1.18 1.18 1.38 1.26 1.20 0.99 1.24
C. No use of non-benchmark assets (OLS estimates)Small-company growth 11.21 11.33 7.98 4.72 3.96 na 8.07Other aggressive growth 8.97 6.79 6.43 4.47 3.52 na 6.35Growth 3.60 1.97 1.91 1.28 1.33 1.13 1.81Income 1.80 1.43 1.30 1.44 1.62 0.93 1.44Growth and income 1.79 1.73 1.54 1.01 0.85 0.68 1.25Maximum capital gains 5.45 5.67 3.04 3.61 2.30 1.46 2.60Sector funds 5.08 5.08 1.51 2.90 3.60 na 3.29
All funds 3.88 2.93 2.47 1.67 1.53 1.07 2.28
42

Table 6
Comparison of Estimated Alphas With and Without the Pricing-ModelRestriction Applied to the Non-benchmark Assets
Each entry in the table is the median across funds of the absolute difference between posterior meansof a fund’s alpha, in percent per annum, under alternative prior beliefs about whether the pricing-modelrestriction applies to the non-benchmark assets. Fund performance, denoted by αA, is defined as the interceptin the regression of the fund’s excess return, rA,t, on either the market benchmark index, MKTt, (Panel A) orthat benchmark index plus the size and value benchmark indexes, SMBt and HMLt (Panel B). The posteriormean of αA, denoted by αA, is based on the fund’s available history as well as the returns from January1963 through December 1998 on the benchmarks and additional non-benchmark indexes. The quantity σαNdenotes the prior standard deviation of the intercept αN in a regression of a non-benchmark return on thebenchmark indexes, and the table compares αA under σαN = 0 versus σαN =∞. The prior for αA is diffuse.
Length of fund’s return history (months)Investment objective 13—23 24—35 36—59 60—119 120—239 ≥ 240 All
A. rA,t = αA + βAMKTt + ²A,tSmall-company growth 1.69 1.40 1.46 1.57 1.08 na 1.55Other aggressive growth 0.72 0.67 0.88 0.82 0.92 na 0.77Growth 0.78 0.75 0.85 0.84 0.91 0.83 0.83Income 1.32 1.00 1.30 1.23 1.56 1.19 1.28Growth and income 0.48 0.56 0.69 0.52 0.64 0.48 0.54Maximum capital gains 0.85 0.93 1.36 1.35 1.45 0.95 1.07Sector funds 3.31 2.94 6.22 3.61 4.78 na 4.31
All funds 0.90 0.89 1.01 1.00 0.99 0.80 0.94
B. rA,t = αA + bA,1MKTt + bA,2SMBt + bA,3HMLt + ηA,tSmall-company growth 1.58 2.05 1.39 1.62 1.76 na 1.62Other aggressive growth 1.88 1.20 1.90 1.78 1.19 na 1.63Growth 0.56 0.63 0.55 0.57 0.65 0.67 0.59Income 0.33 0.40 0.51 0.41 0.84 0.67 0.40Growth and income 0.34 0.37 0.41 0.36 0.46 0.36 0.37Maximum capital gains 1.49 1.33 1.91 1.41 0.89 1.30 1.29Sector funds 1.25 1.30 2.85 2.16 2.01 na 1.93
All funds 0.66 0.66 0.68 0.66 0.73 0.74 0.68
43

Table 7
Portfolios with the Highest Sharpe Ratio Under Priors for CAPMMispricing and Skill of Fund Managers
The investment universe consists of 505 no-load equity mutual funds with at least three years of return history throughDecember 1998. The benchmark factors are MKT, the excess return on the value-weighted stock market, SMB, thedifference between returns on small and large stocks, HML, the difference between returns on high and low book-to-market stocks, and MOM, the difference between returns on stocks with high and low returns over the previousyear (excluding the most recent month). The correlations and Sharpe ratios in Panels B and C are computed withrespect to the same predictive distribution used to obtain the optimal fund portfolio in the same column. The weightsin the combination of a given set of benchmarks with the highest Sharpe ratio are computed using the marginalpredictive distribution of those benchmarks under diffuse priors (which is equivalent to using sample moments of thethose benchmarks).
Mispricing uncertainty (σαN ) in percent per year: 0 0 0 0 1 1 1 1 2 2 2 2Skill uncertainty (σδ) in percent per year: 0 1 3 ∞ 0 1 3 ∞ 0 1 3 ∞
A. Portfolio Weights (×100)Ameristock Mutual Fund - - 22 - - - 22 - - - 20 -BT Institutional:Equity 500 Index Fund 23 41 - - 16 23 - - - - - -California Investment S&P 500 Index Fund 53 - - - 44 - - - 8 - - -Cohen & Steers Realty Shares - - - - - - - - 3 5 - -Century Shares Trust - - - - - - - - 11 - - -DFA AEW Real Estate Securities Portfolio - - - - - - - - 18 4 - -Elfun Trusts - - - - - 5 - - - - - -First American Investment:Real Est Sec/Y - - - - - - - - 11 5 - -First Funds:Growth and Income Portfolio/I - 6 - - - 5 - - - - - -Gabelli Asset Fund - - - - - - - - - - 5 -Galaxy Funds II:Utility Index Fund - - - - 8 - - - 32 18 - -IDS Utilities Income Fund/Y - - - - - - - - - 2 - -Legg Mason Eq Tr:Value Fund/Navigator - - 23 71 - - 17 67 - - 4 59MassMutual Instl Funds:Small Cap Value Eqty/S - - - - - - - - 5 - - -Oakmark Fund - - 1 - - - 4 - - - 8 -Robertson Stephens Inv Tr:Information Age/A - - - 15 - - - 11 - - - 5T. Rowe Price Dividend Growth Fund - - - - - - - - - 4 - -T. Rowe Price Equity Income Fund - 30 - - - 59 - - - 57 - -UAM Fds Tr:Heitman Real Estate Portfolio/Inst - - - - - - - - - 3 - -Vanguard Index Tr:Extended Market Port/Inv 24 - - - 32 - - - 12 - - -Vanguard PrimeCap Fund - 23 4 - - 9 - - - - - -Weitz Series Fund:Hickory Portfolio - - - - - - 3 2 - - 6 8Weitz Series Fund:Value Portfolio - - 51 14 - - 54 20 - 1 57 28
B. Correlation (×100) with the portfolio having the highest Sharpe ratioamong all portfolios that combine the benchmark factors shown
MKT 100 99 95 93 100 98 94 94 89 92 93 94MKT, SMB, HML 48 49 51 34 49 56 53 37 64 68 55 43MKT, SMB, HML, MOM 32 31 31 21 35 35 33 23 53 49 34 26
C. Sharpe ratio of the portfolio in Panel A divided by the highest Sharperatio for a portfolio that combines the benchmark factors shown (×100)
MKT 96 104 152 234 96 104 153 230 107 114 156 224MKT, SMB, HML 197 214 314 482 141 154 226 339 102 109 148 213MKT, SMB, HML, MOM 292 318 466 716 144 157 230 346 81 86 118 169
44

Table 8
Portfolios with the Highest Sharpe Ratio Under Priors for Fama-French-ModelMispricing and Skill of Fund Managers
The investment universe consists of 505 no-load equity mutual funds with at least three years of return history throughDecember 1998. The benchmark factors are MKT, the excess return on the value-weighted stock market, SMB, thedifference between returns on small and large stocks, HML, the difference between returns on high and low book-to-market stocks, and MOM, the difference between returns on stocks with high and low returns over the previousyear (excluding the most recent month). The correlations and Sharpe ratios in Panels B and C are computed withrespect to the same predictive distribution used to obtain the optimal fund portfolio in the same column. The weightsin the combination of a given set of benchmarks with the highest Sharpe ratio are computed using the marginalpredictive distribution of those benchmarks under diffuse priors (which is equivalent to using sample moments of thethose benchmarks).
Mispricing uncertainty (σαN ) in percent per year: 0 0 0 0 1 1 1 1 2 2 2 2Skill uncertainty (σδ) in percent per year: 0 1 3 ∞ 0 1 3 ∞ 0 1 3 ∞
A. Portfolio Weights (×100)Ameristock Mutual Fund - - 10 - - - 9 - - - 6 -CGM Realty Fund - 3 - - - 4 - - - 4 - -Cohen & Steers Realty Shares - - - - - - - - 6 5 - -Columbia Real Estate Equity Fund - - - - - - - - 3 3 - -DFA AEW Real Estate Securities Portfolio 13 1 - - 17 4 - - 21 8 - -DFA Invest Grp:US Large Cap Value Port 2 - - - - - - - - - - -First American Investment:Real Est Sec/Y 19 13 - - 20 15 - - 21 15 - -Galaxy Funds II:Utility Index Fund 8 5 - - 13 11 - - 22 18 - -Legg Mason Eq Tr:Total Return Fund/Navigator 40 10 - - 34 6 - - 21 - - -Legg Mason Eq Tr:Value Fund/Navigator - - - 44 - - - 43 - - - 41Mutual Discovery Fund/Z 18 39 37 26 15 35 34 24 6 25 28 18Oakmark Fund - - 2 - - - 3 - - - 4 -T. Rowe Price Equity Income Fund - 29 7 - - 25 8 - - 17 12 -UAM Fds Tr:Heitman Real Estate Portfolio/Inst - - - - - - - - - 3 - -Weitz Series Fund:Hickory Portfolio - - - 1 - - - 3 - - - 6Weitz Series Fund:Value Portfolio - - 45 29 - - 47 31 - - 50 35
B. Correlation (×100) with the portfolio having the highest Sharpe ratioamong all portfolios that combine the benchmark factors shown
MKT 88 89 89 94 87 89 89 94 83 86 90 94MKT, SMB, HML 75 74 66 55 75 75 65 55 73 74 64 54MKT, SMB, HML, MOM 52 47 38 32 54 50 38 32 57 55 37 32
C. Sharpe ratio of the portfolio in Panel A divided by the highest Sharperatio for a portfolio that combines the benchmark factors shown (×100)
MKT 137 147 180 234 139 147 179 232 146 151 176 229MKT, SMB, HML 66 70 86 112 66 70 85 111 70 72 84 109MKT, SMB, HML, MOM 99 106 130 169 89 94 114 149 75 78 91 118
45

Table 9
Portfolios with the Highest Sharpe Ratio Under Priors for Four-Factor-ModelMispricing and Skill of Fund Managers
The investment universe consists of 505 no-load equity mutual funds with at least three years of return history throughDecember 1998. The benchmark factors are MKT, the excess return on the value-weighted stock market, SMB, thedifference between returns on small and large stocks, HML, the difference between returns on high and low book-to-market stocks, and MOM, the difference between returns on stocks with high and low returns over the previousyear (excluding the most recent month). The correlations and Sharpe ratios in Panels B and C are computed withrespect to the same predictive distribution used to obtain the optimal fund portfolio in the same column. The weightsin the combination of a given set of benchmarks with the highest Sharpe ratio are computed using the marginalpredictive distribution of those benchmarks under diffuse priors (which is equivalent to using sample moments of thethose benchmarks).
Mispricing uncertainty (σαN ) in percent per year: 0 0 0 0 1 1 1 1 2 2 2 2Skill uncertainty (σδ) in percent per year: 0 1 3 ∞ 0 1 3 ∞ 0 1 3 ∞
A. Portfolio Weights (×100)Alpine US Real Estate Equity Fund/Y - 1 - - - 1 - - - 1 - -CGM Realty Fund 1 10 6 - - 9 6 - - 8 5 -Cohen & Steers Realty Shares 14 14 9 - 14 14 9 - 14 14 10 -Columbia Real Estate Equity Fund 11 12 6 - 10 12 6 - 9 11 7 -DFA AEW Real Estate Securities Portfolio 28 19 - - 27 19 - - 26 18 - -First American Investment:Real Est Sec/Y 20 16 4 - 19 16 5 - 18 15 5 -Gabelli Asset Fund - - 8 - - - 6 - - - 1 -Galaxy Funds II:Utility Index Fund 14 11 - - 17 13 - - 21 18 - -Legg Mason Eq Tr:Value Fund/Navigator - - - 48 - - - 46 - - - 44Lindner/Ryback Small Cap Fund/Investor - - - 2 - - - 2 - - - 1Morgan Stanley Dean Witter Ist:US Real Est/A - - 2 - - - 2 - - - 3 -Mutual Discovery Fund/Z - - 4 7 - - 3 6 - - 2 5T. Rowe Price Dividend Growth Fund - - 14 - - - 15 - - - 16 -UAM Fds Tr:Heitman Real Estate Portfolio/Inst 13 16 9 - 12 16 9 - 11 15 9 -Weitz Series Fund:Hickory Portfolio - - - 10 - - - 11 - - 1 12Weitz Series Fund:Value Portfolio - - 38 34 - - 39 35 - - 40 37
B. Correlation (×100) with the portfolio having the highest sample Sharperatio among all portfolios that combine the benchmark factors shown
MKT 75 75 89 94 75 75 89 94 75 75 89 94MKT, SMB, HML 67 68 66 51 67 68 65 51 67 68 65 51MKT, SMB, HML, MOM 61 62 50 30 61 62 50 30 61 62 50 30
C. Sharpe ratio of the portfolio in Panel A divided by the highest Sharperatio for a portfolio that combines the benchmark factors shown (×100)
MKT 175 178 177 222 176 179 178 222 179 181 179 221MKT, SMB, HML 84 85 85 106 84 85 85 106 85 86 86 106MKT, SMB, HML, MOM 54 55 55 69 54 55 55 69 55 56 55 68
46

Table 10
Portfolios with the Highest Sharpe Ratio Under Priors for Skillof Fund Managers and No Use of a Pricing Model (σαN =∞)
The investment universe consists of 505 no-load equity mutual funds with at least three years of return historythrough December 1998. The benchmark factors are MKT, the excess return on the value-weighted stock market,SMB, the difference between returns on small and large stocks, HML, the difference between returns on high andlow book-to-market stocks, and MOM, the difference between returns on stocks with high and low returns over theprevious year (excluding the most recent month). The correlations, Sharpe ratios, and certainty-equivalent differencesin Panels B through E are computed with respect to the same predictive distribution used to obtain the optimal fundportfolio in the same column. The weights in the combination of a given set of benchmarks with the highest Sharperatio are computed using the marginal predictive distribution of those benchmarks under diffuse priors (which isequivalent to using sample moments of the those benchmarks). The certainty-equivalent difference is computed withrelative risk aversion equal to 2.75.
Skill uncertainty (σδ) in percent per year: 0 1 2 3 ∞A. Portfolio Weights (×100)
CGM Realty Fund - 2 2 1 -Cohen & Steers Realty Shares 13 14 13 11 -Cappiello-Rushmore Trust:Utility Income Fund - 1 - - -Columbia Real Estate Equity Fund 7 9 9 7 -DFA AEW Real Estate Securities Portfolio 20 14 2 - -First American Investment:Real Est Sec/Y 14 12 11 6 -Galaxy Funds II:Utility Index Fund 37 32 21 8 -IDS Utilities Income Fund/Y - 5 5 - -Legg Mason Eq Tr:Value Fund/Navigator - - - - 32Morgan Stanley Dean Witter Ist:US Real Est/A - - 2 5 3Oakmark Fund - - - - 2T. Rowe Price Dividend Growth Fund - - - 6 -UAM Fds Tr:Heitman Real Estate Portfolio/Inst 9 12 11 8 -Weitz Partners Value Fund - - - - 2Weitz Series Fund:Hickory Portfolio - - - 6 18Weitz Series Fund:Value Portfolio - - 24 42 43
B. Correlation (×100) with the portfolio having the highest Sharpe ratioamong all portfolios that combine the benchmark factors shown
MKT 74 76 82 87 94MKT, SMB, HML 66 66 66 64 51MKT, SMB, HML, MOM 59 60 57 50 31
C. Sharpe ratio of the portfolio in Panel A divided by the highest Sharperatio for a portfolio that combines the benchmark factors shown (×100)
MKT 190 191 184 185 221MKT, SMB, HML 91 92 88 89 106MKT, SMB, HML, MOM 59 59 57 57 69
D. Comparison to the portfolio that is optimal under σδ = 0Certainty-equivalent difference (basis pts. per mo.) 0 1 6 23 133Correlation (×100) 100 100 97 89 71
E. Comparison to the portfolio that is optimalwhen expected returns equal sample means
Certainty-equivalent difference (basis pts. per mo.) 477 440 367 310 187Correlation (×100) 68 69 75 80 91
47

Table 11
Comparisons of Portfolios of No-Load Funds Formed Under VariousPrior Beliefs About Manager Skill and Pricing Models
All portfolios being compared are formed from an investment universe of 505 no-load equity mutual funds with atleast three years of return history through December 1998. The pricing models considered are the Capital AssetPricing Model of Sharpe (1964) and Lintner (1965), the three-factor Fama-French (1993) model, and the four-factormodel of Carhart (1997), which adds a momentum factor to the Fama-French model. All of the reported correlationsand certainty-equivalent differences are computed using the predictive distribution formed under the prior mispricinguncertainty (σαN ) and skill uncertainty (σδ) in the column heading. The certainty-equivalent difference is computedwith relative risk aversion equal to 2.75.
Mispricing uncertainty (σαN ) in percent per year: 0 0 0 0 1 1 1 1 2 2 2 2Skill uncertainty (σδ) in percent per year: 0 1 3 ∞ 0 1 3 ∞ 0 1 3 ∞
A. Comparison of the portfolios formed with the same σαN and σδ underdifferent pricing models
Certainty-equivalent difference (basis points per month)CAPM versus Fama-French 26 25 19 28 23 19 14 21 9 8 8 10CAPM versus four-factor 59 61 34 18 50 51 28 13 24 27 19 5Fama-French versus four-factor 24 29 19 3 19 23 17 2 10 13 13 1
Correlation (×100)CAPM versus Fama-French 87 89 93 94 87 91 95 96 97 96 97 98CAPM versus four-factor 73 71 91 96 76 75 92 97 94 89 93 99Fama-French versus four-factor 89 84 94 99 92 88 94 99 97 94 94 100
B. Comparison of the optimal portfolio to the portfolio that is optimal underσαN =∞ and σδ = 0
Certainty-equivalent difference (basis points per month)CAPM 71 74 138 299 53 57 121 275 26 29 89 232Fama-French 28 35 94 227 22 27 85 217 11 15 67 196Four-factor 4 6 35 153 3 5 34 151 2 3 31 147
Correlation (×100)CAPM 73 71 70 60 77 74 71 62 95 90 73 65Fama-French 87 82 73 69 91 86 73 69 96 93 73 70Four-factor 98 97 87 69 98 97 87 69 99 98 88 69
C. Comparison of the optimal portfolio to the portfolio that is optimal whenexpected returns equal sample means
Certainty-equivalent difference (basis points per month)CAPM 393 356 259 172 395 358 262 171 404 367 270 171Fama-French 414 380 281 171 417 383 282 172 426 390 285 174Four-factor 465 428 302 185 466 429 303 185 468 431 305 185
Correlation (×100)CAPM 95 95 94 94 94 94 93 95 83 87 89 95Fama-French 81 82 84 93 80 82 84 93 77 79 84 93Four-factor 67 67 82 94 67 68 82 94 68 68 81 93
48

Table 12
Coefficients in Regressions of Fund Returns on the Passive Asset Returns
The table reports posterior means and “t statistics” (posterior mean divided by posterior standard) of the intercept (δA) and slopecoefficients in a regression of the fund’s return on the returns of the eight passive assets. The passive assets are CMS, a spread betweenstocks with high and low HML betas but with both legs matched in terms of market capitalization (size) and book-to-market ratios,IP1—IP3, three portfolios formed by applying principal-component analysis to a set of 20 industry portfolios, MOM, the difference betweenreturns on stocks with high and low returns over the previous year (excluding the most recent month), SMB, the difference betweenreturns on small and large stocks, HML, the difference between returns on high and low book-to-market stocks, and MKT, the excessreturn on the value-weighted stock market.
δ CMS IP1 IP2 IP3 MOM SMB HML MKT
A. Posterior Mean (×100)Ameristock Mutual Fund 0.39 0 -0 -7 6 -6 -34 8 90BT Institutional:Equity 500 Index Fund 0.09 -1 0 1 1 -2 -25 -2 96CGM Realty Fund -0.14 4 -14 -21 3 19 58 63 109California Investment S&P 500 Index Fund 0.07 -1 0 1 1 -2 -24 -2 96Century Shares Trust -0.45 -10 2 -28 6 9 8 43 132Cohen & Steers Realty Shares -0.22 -13 -9 -41 17 28 69 53 102Columbia Real Estate Equity Fund -0.26 16 -10 -22 8 22 46 61 94DFA AEW Real Estate Securities Portfolio -0.59 7 -9 -24 9 23 57 64 99First American Investment:Real Est Sec/Y -0.29 21 -12 -25 5 16 47 71 106Galaxy Funds II:Utility Index Fund -0.57 38 -9 -48 -9 13 13 63 140Legg Mason Eq Tr:Total Return Fund/Navigator -0.16 11 1 3 8 -6 10 67 91Legg Mason Eq Tr:Value Fund/Navigator 0.84 -11 4 23 -2 -5 -24 -14 82Mutual Discovery Fund/Z 0.34 -18 6 7 2 -10 39 57 64Robertson Stephens Inv Tr:Information Age/A 1.13 55 -6 48 -21 8 32 -133 75T. Rowe Price Dividend Growth Fund 0.21 7 -1 -1 3 4 -3 20 78T. Rowe Price Equity Income Fund 0.16 17 1 3 3 -6 0 36 70UAM Fds Tr:Heitman Real Estate Portfolio/Inst -0.32 -17 -10 -40 15 31 70 52 107Vanguard Index Tr:Extended Market Port/Inv -0.08 -2 -1 2 -3 6 54 -3 103Vanguard PrimeCap Fund 0.44 -13 5 30 -10 -3 9 -32 68Weitz Series Fund:Hickory Portfolio 0.56 -11 7 -19 -8 0 61 18 108Weitz Series Fund:Value Portfolio 0.41 -0 2 -7 -9 -4 19 18 72
Hot-Hand Portfolio 0.01 -7 0 9 -4 19 48 -11 89
B. “t-statistic” (posterior mean divided by posterior standard deviation)Ameristock Mutual Fund 2.0 0.0 -0.1 -1.2 1.8 -1.6 -5.5 0.8 11.2BT Institutional:Equity 500 Index Fund 1.9 -0.3 0.5 0.6 1.2 -1.5 -12.0 -0.9 38.9CGM Realty Fund -0.7 0.2 -2.9 -1.2 0.3 2.3 4.0 2.9 4.8California Investment S&P 500 Index Fund 1.4 -0.5 0.5 0.6 0.9 -1.7 -11.6 -0.6 38.1Century Shares Trust -1.6 -0.7 0.7 -3.1 1.0 1.7 0.9 3.6 10.7Cohen & Steers Realty Shares -0.9 -0.6 -2.2 -2.7 2.1 3.7 5.2 2.8 5.5Columbia Real Estate Equity Fund -0.8 0.7 -2.3 -1.3 1.0 2.8 3.4 3.0 4.5DFA AEW Real Estate Securities Portfolio -2.1 0.4 -2.7 -2.0 1.3 3.7 5.3 4.1 6.5First American Investment:Real Est Sec/Y -1.2 1.0 -3.3 -1.7 0.6 2.5 4.2 4.0 5.9Galaxy Funds II:Utility Index Fund -2.2 2.6 -3.2 -4.8 -1.7 2.7 1.5 5.0 11.3Legg Mason Eq Tr:Total Return Fund/Navigator -0.2 1.0 0.6 0.4 1.8 -1.2 1.2 5.8 9.0Legg Mason Eq Tr:Value Fund/Navigator 2.8 -0.8 1.5 2.5 -0.3 -0.7 -2.4 -1.1 6.6Mutual Discovery Fund/Z 1.4 -1.8 3.1 1.0 0.5 -1.9 5.2 5.7 7.0Robertson Stephens Inv Tr:Information Age/A 1.6 1.4 -0.9 1.6 -1.5 0.6 1.5 -3.9 2.1T. Rowe Price Dividend Growth Fund 2.0 1.4 -1.6 -0.4 1.5 1.4 -0.7 3.9 17.0T. Rowe Price Equity Income Fund 2.1 3.7 1.9 1.3 1.7 -2.9 0.1 9.0 18.5UAM Fds Tr:Heitman Real Estate Portfolio/Inst -1.1 -0.8 -2.5 -2.6 1.8 4.0 5.3 2.8 5.8Vanguard Index Tr:Extended Market Port/Inv -0.8 -0.5 -1.5 0.9 -2.6 3.3 21.4 -0.9 33.4Vanguard PrimeCap Fund 2.8 -1.5 3.6 6.8 -3.4 -0.8 1.6 -4.7 10.3Weitz Series Fund:Hickory Portfolio 1.4 -0.5 1.9 -1.4 -1.0 0.0 3.9 0.9 5.9Weitz Series Fund:Value Portfolio 2.4 -0.0 1.3 -1.3 -2.6 -1.0 3.0 2.3 9.6
Hot-Hand Portfolio 0.2 -2.2 0.4 4.6 -3.4 13.5 22.4 -4.1 30.6
49

References
Anderson, T.W., 1984, An Introduction to Multivariate Statistical Analysis (John Wiley andSons, New York, NY).
Baks, Klaas P., Andrew Metrick, and Jessica Wachter, 2000, Should investors avoid allactively managed mutual funds? A study in Bayesian performance evaluation, Journalof Finance, forthcoming.
Brown, Stephen J., 1979. Optimal portfolio choice under uncertainty: a Bayesian approach.In V. S. Bawa, S. J. Brown, and R. W. Klein, eds.: Estimation Risk and Optimal PortfolioChoice (North Holland, Amsterdam).
Brown, Stephen J., and William N. Goetzmann, 1995, Performance persistence, Journal ofFinance 50, 679—698.
Carhart, Mark M., 1997, On persistence in mutual fund performance, Journal of Finance52, 57—82.
Chen, Zhiwu, and Peter J. Knez, 1996, Portfolio performance measurement: Theory andapplications, Review of Financial Studies 9, 511—555.
Daniel, Kent, and Sheridan Titman, 1997, Evidence on the characteristics of cross sectionalvariation in stock returns, Journal of Finance 52, 1—33.
Daniel, Kent, Mark Grinblatt, Sheridan Titman, and Russ Wermers, 1997, Measuring mutualfund performance with characteristic-based benchmarks, Journal of Finance 52, 1035—1058.
Davis, James L., Eugene F. Fama, and Kenneth R. French, 2000, Characteristics, covariances,and average returns: 1929 to 1997, Journal of Finance 55, 389—406.
Elton, Edwin J., Martin J. Gruber and Christopher R. Blake, 1996, The persistence Ofrisk-adjusted mutual fund performance, Journal of Business 69, 133—157.
Fama, Eugene F., and Kenneth R. French, 1993, Common risk factors in the returns onstocks and bonds, Journal of Financial Economics 33, 3—56.
Fama, Eugene F., and Kenneth R. French, 1996, Multifactor explanations of asset pricinganomalies, Journal of Finance 51, 55—84.
Ferson, Wayne E., and Rudi W. Schadt, 1996, Measuring fund strategy and performance inchanging economic conditions, Journal of Finance 51, 425-461.
Grinblatt, Mark, and Sheridan Titman, 1989, Portfolio performance evaluation: Old issuesand new insights, Review of Financial Studies 2, 393—421.
Grinblatt, Mark, and Sheridan Titman, 1992, The persistence of mutual fund performance,Journal of Finance 47, 1977—1984.
50

Grinblatt, Mark, and Sheridan Titman, 1995, Performance evaluation. In R. Jarrow, V.Maksimovic, and W. Ziemba, eds.: Handbook in Operations Research and ManagementScience, Vol. 9: Finance (Elsevier Science).
Hansen, Lars P., 1982, Large Sample Properties of Generalized Method of Moments Estima-tors, Econometrica 50, 1029—1054.
Hendricks, Darryll, Jayendu Patel, and Richard Zeckhauser, 1993, Hot hands in mutualfunds: Short-run persistence of relative performance, 1974—88, Journal of Finance 48,93—130.
Jegadeesh, Narasimham, and Sheridan Titman, 1993, Returns to buying winners and sellinglosers: Implications for stock market efficiency, Journal of Finance 48, 65—91.
Jensen, Michael C., 1969, Risk, the pricing of capital assets, and the evaluation of investmentportfolios, Journal of Business 42, 167—247.
Kandel, Shmuel, and Robert F. Stambaugh, 1987, On correlations and inferences aboutmean-variance efficiency, Journal of Financial Economics 18, 61—90.
Klein, Roger W., and Vijay S. Bawa, 1976, The effect of estimation risk on optimal portfoliochoice, Journal of Financial Economics 3, 215—231.
Knox, Thomas A., 1999, Statistical decision theory in portfolio choice, B.A. honors thesis,Harvard University.
Lehmann, Bruce N., and David M. Modest, 1987, Mutual fund performance evaluation: Acomparison of benchmarks and benchmark comparisons, Journal of Finance 42, 233—265.
Lintner, John, 1965, The valuation of risk assets and the selection of risky investments instock portfolios and capital budgets, Review of Economics and Statistics 47, 13—37.
Moskowitz, Tobias J., and Mark Grinblatt, 1999, Do industries explain momentum? Journalof Finance 54, 1249—1290.
Pastor, Lubos, 2000, Portfolio selection and asset pricing models, Journal of Finance 55,179—223.
Pastor, Lubos, and Robert F. Stambaugh, 1999, Costs of equity capital and model mispricing,Journal of Finance, 54, 67—121.
Pastor, Lubos, and Robert F. Stambaugh, 2000, Comparing asset pricing models: an invest-ment perspective, Journal of Financial Economics, forthcoming.
Ross, Stephen A., 1976, The arbitrage theory of capital asset pricing, Journal of EconomicTheory 13, 341—360.
Sanders, Anthony B., 1997, The historical behavior of REIT returns: A capital marketsperspective, The Handbook of Real Estate Investment Trusts, edited by R. Garrigan andJ. Parsons (Irwin Publishing Co.), 1997.
51

Sharpe, William F., 1964, Capital asset prices: A theory of market equilibrium under con-ditions of risk, Journal of Finance 19, 425—442.
Stambaugh, Robert F., 1997, Analyzing investments whose histories differ in length, Journalof Financial Economics, 45, 285—331.
Theil, Henri, 1971, Principles of Econometrics, Wiley, New York.
Wermers, Russ, 2000, Mutual fund performance: An empirical decomposition into stock-picking talent, style, transactions costs, and expenses, working paper, University of Col-orado at Boulder.
Zellner, Arnold, 1962, An efficient method of estimating seemingly unrelated regressions andtests for aggregation bias, Journal of the American Statistical Association 57, 348—368.
Zellner, Arnold, 1971, An Introduction to Bayesian Inference in Econometrics (John Wileyand Sons, New York, NY).
Zellner, Arnold, and V. Karuppan Chetty, 1965, Prediction and decision problems in re-gression models from the Bayesian point of view, Journal of the American StatisticalAssociation 60, 608—616.
52