ETHIOPIAN JOURNAL OF SCIENCE AND … No...ETHIOPIAN JOURNAL OF SCIENCE AND TECHNOLOGY VOLUME 8,...
66
Transcript of ETHIOPIAN JOURNAL OF SCIENCE AND … No...ETHIOPIAN JOURNAL OF SCIENCE AND TECHNOLOGY VOLUME 8,...


ETHIOPIAN JOURNAL OF SCIENCE AND TECHNOLOGY VOLUME 8, NUMBER 2 (JUNE, 2015)
EDITORIAL BOARD
EDITOR-IN-CHIEF Professor Mulugeta Kibret Bahir Dar University, Department of Biology Email: [email protected], [email protected]: +251-582-266597Fax: +251-582-264066Mailing address: P.O. Box 79Bahir Dar, Ethiopia
ASSOCIATE EDITORS Dr Abera Kechi, Ethiopian Institute of Textile and Fashion Technology, BDUDr Amare Benore, Department of Physics, Science College, BDUDr Awoke Andargie, Department of Mathematics , Science College, BDUMr Bayeh Abera, Department of Microbiology, Immunology and Parasitology, College of Medicine and Health Sciences, BDUDr Endalkachew Nibret, Department of Biology, Science College, BDUDr Eneyew Tadesse, School of Chemical and Food Engineering, BDUDr Essey Kebede, Department of Statistics, Science College, BDUDr Hailu Mazengia, Department, of Animal Science College of Agriculture and Environ-mental Sciences, BDUDr Meareg Amare, Department of Chemistry, Science College, BDUDr Solomon Tesfamariam, School of Mechanical and Industrial Engineering, BDUMr Zelalem Liyew, Department of Earth Science, Science College, BDU
ADVISORY BOARD
Professor Gezahegn Yirgu, Addis Ababa University, EthiopiaDr Gizaw Mengistu, Addis Ababa University, EthiopiaDr Habtu Zegeye, Botstwana University, Botswana Dr Melaku Walle, Bahir Dar University, EthiopiaDr Mesfin Tsige, University of Akron, Ohio, USADr Mohammed Tesemma, Spelman College, Atlanta, USADr Mulugeta Bekele, Addis Ababa University, EthiopiaDr Mulugeta Gebregziabher, University of Medical South Carolina, USAProfessor Murali Mohan, SP-Mahila University, India Professor Robert McCrindle, Tshwane University of Technology, South AfricaDr Semu Mitiku, Addis Ababa University, EthiopiaDr Solomon Harrar, University of Montana, USA Dr Solomon Libsu, Bahir Dar University, EthiopiaProfessor Srinivas Rao, Andhra University, IndiaProfessor Teketel Yohannes, Addis Ababa UniversityProfessor Temesgen Zewotir, University of KwaZulu Natal, South Africa Dr Tesfaye Baye, University of Cincinnati, USA
Dr Abebe Getahun, Addis Ababa University, Ethiopia Professor Abera Mogessie, Karl-Franzense University of Graz, AustriaProfessor Afework Bekele, Addis Ababa University, EthiopiaDr Berahnu Abraha, Bahir Dar University, EthiopiaProfessor Bhagwan Singh Chandravanshi, Addis Ababa University, EthiopiaDr Emmanuel Vreven, Royal Museum of Central Africa, BelgiumDr Endawoke Yizengaw, Institute for Scientific Research, Boston College, USADr Eshetie Dejen, Inter-governmental Authority onDevelopment(IGAD), DjiboutiDr Firew Tegegne, Bahir Dar University, EthiopiaDr Gebregziabher Kahsay, Bahir Dar University, Ethiopia Professor Geog Güebitz, University of NaturalResources and Life Science, Vienna, AustriaDr Getachew Adamu, Bahir Dar University, Ethiopia
© Science College, Bahir Dar University, 2015

ETHIOPIAN JOURNAL OF SCIENCE AND TECHNOLOGY VOLUME 8, NUMBER 2 (JUNE, 2015)
CONTENTS
© Science College, Bahir Dar University, 2015
Effect of co-pressing of niger (Guizotia abyssinica Cass.) and black cumin (Nigella sativa) seeds on yield, oxidative stability and sensory properties of cold pressed oil
Admasu Fanta
61
Evaluation of the quality of cow milk consumed by children in and around Bahir Dar
Fanaye Shiferaw, Ashenafi Mengistu, Getachew Terefe, Hailu Mazengia
71
Thymus species in Ethiopia: Distribution, medicinal value, economic benefit, current status and threatening factors
Destaw Damtie and Yalemtsehay Mekonnen
81
Multilevel random effect and marginal models for longitudinal data
Bedilu Alamirie Ejigu
93
Thermal analysis of shell and tube heat exchangers using artificial neural networks
Ananth S. Iyengar
107
Author Guidelines


Ethiop. J. Sci. & Technol. 8(2) 61- 70, 2015 61
Effect of co-pressing of niger (Guizotia abyssinica Cass.) and black cumin (Nigella sativa) seeds on yield, oxidative stability and sensory properties of cold pressed oil
Admasu Fanta
Bahir Dar University, Faculty of Chemical and Food Engineering P. O. Box 76 Bahir Dar, Ethiopia
Email: [email protected]
ABSTRACTOxidation is an important problem in edible oil industry. This is relevant when the edible oil is composed of poly unsaturated fatty acids that are prone to oxidation. This study was performed to investigate the ef-fectiveness of black cumin seed co-pressing on improving oxidative stability (OS) of niger seed oil (NSO) without adversely affecting its sensory quality. Four black cumin seed (BCS) with levels (0, 5, 10 & 15%) were co-pressed with niger seed (NS) at two screw speeds (SS) (28.9 and 46.6 rpm). Oil yield, Rancimat induction period (IP), and sensory attributes were measured. No significant interaction of SS and BCS lev-el was observed to influence oil yield (p>0.05). However, SS has imparted a significant influence on oil yield (p<0.05). The oil yield obtained by 28.9 rpm SS was found to be higher at all levels of BCS. IP was significantly affected by the interaction of SS and BCS level (α<0.05). Progressive increase of BCS level was more effective in improving IP at the 28.9 rpm SS than at 46.6 rpm. Most sensory attributes of BCS co-pressed NSO samples significantly deteriorated as BCS level was increased beyond 5% (α<0.05). Ap-plication of BCS co-pressed NSO in Shiro Wot preparation (cooked sample) however was best accepted by panelists at 10% BCS level in all sensory attributes. The present study suggested that BCS co-pressing at 5 and 10% levels improves the stability and sensory property of NSO for raw and cooked edible food appli-cation respectively.
Keywords: Black Cumin Seed, Co-pressing, Screw Speed, Oxidative Stability, Niger Seed Oil DOI: http://dx.doi.org/10.4314/ejst.v8i2.1
INTRODUCTIONDespite its unfamiliarity in the world oilseed trade as well as its being minor oil crop in India and other African countries, niger is one of the most important edible oil crops in Ethiopia providing 50 to 60 % of the indigenous edible oils (Dutta et al., 1994, Riley and Belayneh, 1989). Though it is considered by the international scientific community as a new non-con-ventional supply of seed oils due to its high linoleic acid content and high nutritional value (Remedan and Moersel, 2002), NS is an oil seed that humans have cultivated for approximately 5000 years (Ramadan et al., 2009). The use of niger as a source of edible oil, after pro-duction at household level through pounding it by wooden mortar and pestle of lightly roasted seed to-
gether with added boiling water and transferring the pounded mash into an earthen pot which is rotated manually in order to let the oil migrate to the top and separated by decanting the oil known by the name of Kiba Noug, has been practiced since time imme-morial. Kiba Noug preparation is still continued to be practiced at households of rural setting. Francis and Campbell (2003) described that the oil extracted from the seed of niger crop is the preferred food oil in Ethiopia. This long established use of fresh niger seed oil (NSO) in the Ethiopian cuisine could not be as advanced as it is demanded by consumers. This may be partly because of low stability nature of NSO against oxidation resulting in rapid development of rancid off odor upon relatively short storage period. The higher proportion of polyunsaturated fatty acids,
______________________________©This is an Open Access article distributed under the terms of the Creative Commons Attribution License (http://creativecommons.org/licenses/CC BY4.0).
62 Admasu Fanta
its relative low amount of unsaponifiable matter, its low total phenolics and polar lipids , have been re-ported to be among the possible reasons for NSO’s slow oxidative stability (Ramadan and Mörsel, 2004).Oxidized lipids not only result in objectionable flavors and odors, loss of color and nutrient val-ue, but also generate potentially toxic compounds which may be detrimental to the health of consum-ers (Luzia et al., 1997; Wsowicz et al., 2004). One of the most effective ways of retarding lipid oxida-tion and hence increasing shelf life of oils and oil products is to incorporate antioxidants which may be defined as substances that when present at low concentration compared with those of oxidizable substrates significantly delay or prevent the oxi-dation of that substrate. In doing so, antioxidants slow down the rate at which oxidation occurs. Wsowicz et al. (2004) indicated that much interest has developed recently in naturally occurring anti-oxidants. The appeal in application of natural anti-oxidants as food additives is also raised because of their potential health benefits. Shaker (2006) and Ramadan (2013) reported the importance of nat-ural antioxidants for human health in decreasing risks of heart disease, their anti-carcinogenic prop-erties and that they are safer than their synthetic counterparts. The well-known synthetic antioxi-dants such as butylated hydroxyanisole (BHA) and butylated hydroxytoluene (BHT) were reported by Jayaprakasha et al. (2001) to have a restricted usage in foods because they are suspected as being carcinogenic.Reports have pointed out that blending of edible oils has imparted improved healthiness and functionality to the blend. According to Toliwal et al. (2005) oils can be blended to derive the protective advantage due to the presence of specific ingredients that offer protection against oxidation to improve frying recy-clability. Researches indicated that BCS is among some oilseeds that possess remarkable antioxidant property making it a suitable candidate to be a com-
ponent in blending with other less stable edible oils to achieve improved oxidative stability among other nutritional advantages.In their oxidative stability investigation, Ramadan and Mörsel (2004), suggested BCS oil to be more stable than NSO. The higher oxidative stability of BCS was attributed to its high content of the essen-tial oil thymoquinone and related compounds such as thymol and dithymoquinone (Tekeoglu et al., 2007), which possess antioxidant activities such as quenching of reactive oxygen species (Kruk et al., 2000). Lutterodt et al. (2010) also indicated that cold pressed BCS oil contains significant antioxidant property and concluded that it may enhance the ox-idative stability of food products in addition to pro-vision of health benefit to consumers. Ramadan and Wahdan (2012) and Ramadan (2013) showed blend-ing BCS oil enhanced markedly the oxidative stabil-ity of sunflower and corn oils. Similarly, co-pressing of BCS and NS may enhance oxidative stability of the final oil either without noticeable change or with an extent towards improved sensory property. In the present study, the effect of co-pressing of NS with BCS on yield, oxidative stability and sensory prop-erty of the oil was investigated.
MATERIALS AND METHODS
Materials
Niger (Guizotia abyssinica Cass.) and black cumin (Nigella sativa) seeds were purchased from a local market (Bahir Dar, Ethiopia). The seeds were cleaned to be free of impurities before mixing them for pressing.
Methods
Experimental design
The experiment was a 2 x 4 x 3 factorial design with two screw speeds (28.9 and 46.6 rpm) and four BCS levels (0, 5, 10 and 15% w/w), and each factor-level

Ethiop. J. Sci. & Technol. 8(2) 61- 70, 2015 63
combination was replicated three times. Batches of one kilo gram blends of BCS and NS were used for pressing. The seed blends were mixed thoroughly and packed in screw capped glass bottle and kept in cool and dry place until pressing. The moisture contents of BCS and NS were 5.54 and 5.18%, respectively.
Pressing of oil
The oil seed blends were subjected to pressing using a bench top oil expeller (IBG MONFORTS Oekotec Company CA59G country). The machine was operated at the speeds of 28.9 and 46.6 rpm. The oil obtained after each pressing was collected and centrifuged at an rpm of 3500 for 20 minutes. The yield of the oil was calculated using the formula (Deli et al., 2011):
Where: Mo is weight of the extracted oil and
Ms is weight of the oil seed used
The oil obtained was contained in amber colored and capped glass bottle and was kept in a refrigerator until further tests.
Sample preparation for sensory analysis
Raw oil
The raw oil samples were prepared according to the recommended practice for panel sensory evaluation of edible vegetable oils by (AOCS-Cg2-83). Oil samples (20 mL) were kept in 50-mL closed beakers in an oven at 50 ± 1 OC for 30 minutes before subjected to sensory analysis.
Cooked oil
The oil samples have been used to prepare Shiro Wot following common procedures. Two hundred grams of chopped onions are toasted at low heat until golden brown. Fifty grams of the oil sample is then added to fry the onion for about five minutes. Twenty five grams of Ethiopian spiced pepper and a small amount of water were added and the mixture was cooked for 15 minutes. One hundred and ninety grams of the Shiro powder was then added bit by bit and with vigorous stirring to avoid lump formation. The stew was left on mild heat for additional 15 minutes and 10 grams of iodized salt has been stirred in it before it is removed from the heat. A table spoon of the stew was spread on a 10 cm2 Injera (Ethiopian traditional fermented flat bread made of tef flour), folded and pined together by a toothpick before it was served for panelists. The samples were coded with a three digit random number.
Determination of oxidative stability
The oxidative stability of the oil samples was deter-mined by the induction period (IP) on Rancimat 743 apparatus (Metrohm, Herisau, model Switzerland) at 110°C and an air flow rate of 18 l/h (ISO6886:2006). Three gram samples were carefully weighed into each of the eight reaction vessels and analyzed si-multaneously. Exhaust vapors were collected in de-ionized water where conductivity was measured until a sudden increase. The end of the induction period (IP), expressed in hours, was determined by the formation of volatile acids measured by a sudden increase of conductivity during a forced oxidation of the oil samples.
Sensory analysis
Sensory analysis of the oil samples was done main-ly to judge the influence of black cumin flavor and color on the acceptability of the NSO samples ob-

64 Admasu Fanta
tained after co-pressing at different BCS levels. The sensory analysis was conducted at two different conditions of the oil samples, raw and cooked. The cooked sample sensory analysis was done to exam-ine the residual black cumin sensory effect after the oil was used to prepare pea flour stew (Shiro Wot) which is one of the most frequently consumed Ethi-opian traditional dishes. It was carried out assuming that the strength of BCS pungency and bitterness, which becomes progressively intense as BCS level increases, would fade to be mellow and impart ac-ceptable spiciness to the food due to volatilization upon heating during preparation. The strength of the characteristic black cumin sensory property on NSO (raw) and as used in Shiro Wot preparation (cooked) was evaluated using a method outlined by Matthäus and Brühl (2003) with some modifica-tions. A five point hedonic scale was used where ‘1’ represented the expression of “dislike strongly” and ‘5’ represented that of “like strongly”. The attributes examined were ‘smell’, ‘taste’, ‘aftertaste’, ‘color’ and ‘overall acceptability’. The sensory analysis of both raw and cooked samples was conducted by a
five-membered panel of experienced and trained as-sessors who were women aged between 32 and 43 years of age and normally make decision on edible oil selection, and cook Shiro Wot for own household on regular basis.
Data analysis
Data was analyzed using ANOVA through the gen-eral linear model (GLM) procedure of the SPSS 20. Least significant difference was used to separate means at p <0.05.
RESULTS AND DISCUSSION
Oil yield
The mean oil yield obtained from co-pressing of NS and BCS blend at 28.9 and 46.6 rpm SS is shown in Figure 1. Only SS has significant influence on oil yield (p<0.05). The oil yield obtained by pressing at the lower SS (28.9 rpm) was found to be higher at all levels of BCS. The reduction of oil yield, as af-
Figure 1. Effect of SS and BCS level on oil yield. All values are means of three measurements and error bars are ±1standard deviation.

Ethiop. J. Sci. & Technol. 8(2) 61- 70, 2015 65
fected by the increased SS, is in agreement with pre-vious works. Evangelista (2009) reported that slow screw speed would probably extend the pressing process which may result in increased heating that in turn might result in ease of flow and hence higher oil yield. The decrease in oil yield at higher screw speed may be explained by the fact that higher screw speed increases throughput while leaving less time for the oil to flow out from the meal resulting in reduced extraction rate. Previous research publications also reported that a decrease of rotational speed of screw shaft causes an increase in pressure and a decrease in the efficiency or extraction rate of the screw press (Jacobsen and Backer, 1986, Vadke et al., 1988).
Oxidative stability of the oil
Both SS and BCS level have brought about significant effect on induction period (IP). Increasing BCS level improved the IP. The lower SS (28.9 rpm) has improved the IP better than that of the higher (46.6 rpm). The control sample (0% BCS) didn’t bring about significant change in IP irrespective of SS setting. IP was significantly affected by the interaction of SS and BCS level (α<0.05) suggesting that increasing BCS level was more effective in improving IP at 28.9 rpm SS compared to at that of 46.6 (Figure 2). The highest IP was recorded at 15% BCS level and 28.9 rpm SS (8.3 hrs.) which was79.7% more than the IP of the control. The least improvement of IP was observed at 5% BCS and 46.6 rpm SS (5.3 hrs.) which still was up by 16.2% compared to the control. The observed progressive improvement of OS of NSO as BCS level increased, which was more pronounced at 28.9 rpm SS, is believed to be associated with the consequent increased concentration of those BCS bioactive compounds responsible to act against the oxidation of NSO. Ramadan and Wahdan (2012) reported that addition of BCS oil to corn oil resulted
in a marked decline of peroxide value, which is used as an oxidative index during early stage of lipid oxidation. In addition, increased BCS oil proportion was reported to have further decreased peroxide value of the corn oil signifying its enhanced OS. This increased OS as the level of BCS increased is in line with Singh et al. (2014) who reported that ferrous ion chelating effect of BCS oil and its oleoresins, and its scavenging on DPPH radical were directly proportional to concentration. Poiana (2012) also noted the remarkable inhibitory effect of grape seed extract on primary lipid oxidation of sunflower oil upon heating under simulated frying conditions. The grape seed extract has shown progressive enhancement of the inhibitory effect upon increasing of its concentration.
The noticeable further OS improving effect of BCS level at 28.9 rpm SS than that of 46.6 may be associated with the increased extraction of BCS antioxidant components owing to the increased extraction rate at the reduced SS. Even though published research articles on conducting experiment to see the influence of screw speed on oxidative stability of oils were not found, , the increased yield upon pressing at the lower SS and the enhanced IP upon progressive BCS increase may explain the fact that more and more BCS antioxidant compounds were extracted into the NSO. This phenomenon may explain the significant interaction between BCS level and SS. Tasan et al. (2011) published a seemingly contrary report that sunflower crude oil extracted by full pressing, which corresponds to low rpm SS, was found out to be inferior in OS and other quality attributes compared to its corresponding pre-pressed sunflower oil expelled at higher SS. However, the result of the present study indicates the need to optimize SS for higher extraction rate of BCS co-pressed NSO while retaining antioxidant properties.

66 Admasu Fanta
Figure 2. Influence of SS and BCS levels on Induction Period (IP) of NSO. All values are means of three measurements and error bars are ±1 standard deviation.
Effect of BCS level and SS on NSO sensory characteristics
The more and more enhanced IP advantage obtained as the level of BCS increased was not always a phenomenon without adverse effects on the senso-ry property. The strong pungency and bitterness of BCS on the oil or foods made of it, was assumed to dwindle by the heat of cooking. For this reason, the sensory effect of BCS was studied in two indepen-dent conditions as raw and cooked sample.Only BCS level has brought about significant change on the sensory attributes studied (α<0.05).The result indicated that BCS co-pressing with NS has enhanced most sensory attributes at 5 % BCS level of the raw NSO samples (Table1). The highest acceptance of the NSO sample co pressed with 5% BCS may be attributable to the mild extent of pun-gency and bitterness which could be enough to be used in raw cold pressed oils as acceptable.Using the oil samples in cooking Shiro Wot has sig-nificantly improved most of the sensory attributes studied (α<0.05). As indicated on Figure 3 all the sensory attributes of Shiro Wot were best accepted at
10% BCS level and deteriorated when the BCS in-creased to 15%. Though it was seen that 15 % BCS has improved after cooking in all attributes com-pared to its raw counterpart, the extent of improve-ment was minimum and its acceptance was below average.
The shift in sensory acceptance from 5% (raw) to 10% (cooked) may be explained by the fact that the pungency and bitterness could have been reduced by the heating action that removes volatile com-pounds. The occurrence of 0.5-1.6 % volatile oil in BCS was reported by Ramadan (2007). Singh et al. (2014) and Burits and Bucar (2000) identified the volatile thymoquinone, p-cymene, 𝛼-thujene, thymohydroquinone, longifolene, and carvacrol as major compounds of BCS volatile oil which were pointed out by (Kiralan, 2012) to significantly dwin-dle upon microwave and conventional roasting.
There was significant difference between raw and cooked samples (p<0.05) for all sensory attributes and level of BCS, except for color which was not

Ethiop. J. Sci. & Technol. 8(2) 61- 70, 2015 67
investigated in cooked samples as it was not appli-cable owing to the little influence of NSO on the color of the Shiro Wot prepared by incorporation of many different ingredients in addition to the evolve-ment of color as a result of heat. The attribute smell was significantly different only at 5% BCS level in-dicating lower acceptance for the cooked sample in comparison to that of its raw counterpart. As the level of BCS was increased, it appeared that cooking didn’t affect the smell of the sample. The raw sam-
Table 1. Effect of BCS level and SS on Sensory characteristics of raw and cooked samples*
.
%BCS
Smell Taste Color Aftertaste Overall acceptability
28.9 rpm
46.6 rpm
28.9 rpm
46.6 rpm
28.9 rpm
46.6 rpm
28.9 rpm
46.6 rpm
28.9 rpm
46.6 rpm
Condition I: Raw NSO
0 3.2a± 0.8
3.4a ± 0.6
2.8a± 0.5
2.6a± 0.9 5.0a± 0.0 5.0a± 0.0 3.0a± 0.7 3.2a± 0.5 3.4a± 0.5 3.6a± 0.5
5 4.4b± 0.6 4.2b± 0.5 4.8b±
0.55.0b± 0.0 5.0a± 0.0 5.0a± 0.0 4.8b± 0.5 4.6b± 0.6 5.0b± 0.0 5.0b± 0.0
10 4.8b± 0.5 4.8b± 0.5 2.8a±
0.52.6a± 0.6 4.6b± 0.6 4.2b± 0.5 2.2c± 0.8 2.2c± 0.5 2.2c± 0.4 2.4c± 0.5
15 4.6b± 0.6 4.8b± 0.5 1.8c±
0.51.6c± 0.6 3.2c± 0.8 3.4c± 0.6 1.4d± 0.6 1.6d± 0.6 1.2d±0.4 1.0d± 0.0
Condition II: NSO cooked in Shiro Wot
0 3.2a± 0.8
3.4a ± 0.5
3.2a± 0.8
3.4a± 0.5 n/a n/a 3.0a± 0.7 3.2a± 0.8 3.2a± 0.8 3.2a± 0.4
5 3.2a± 0.4 3.4a± 0.5 3.4a±
0.53.4a± 0.5 n/a n/a 3.2a± 0.4 3.0a± 0.6 3.4a± 0.5 3.2a ±
0.8
10 5.0b± 0.0 5.0b± 0.0 5.0b±
0.05.0b± 0.0 n/a n/a 5.0b± 0.0 5.0b± 0.0 5.0b± 0.0 4.8b± 0.5
15 5.0b ± 0.0 5.0b± 0.5 4.2c±
0.84.0c± 0.7 n/a n/a 2.4c ±
0.5 2.2c± 0.8 2.2c± 0.8 2.2c± 0.4
*Values given are means of the scores given by 5 trained panelist’s ± standard deviation. Means in the same column within each condition and in the same row under same sensory attribute with different superscript letters are significantly different (α <0.05).
ple was significantly different from the cooked one in taste and aftertaste at all levels of BCS except for the control (0% BCS). Raw sample exhibited supe-rior acceptability at 5% BCS level while the cooked one was highly favored at 10 %. As indicated above, the loss of strength of the characteristic black cum-in flavor of the cooked sample of the present study may be associated with the loss of volatile oil com-ponents exposed to heating for a total of 35 minutes during the Shiro Wot preparation.

68 Admasu Fanta
CONCLUSION
Cold pressed NS oil co-pressed with BCS has better oxidative stability and organoleptic characteristics than its corresponding oil without BCS co-press-ing. The best black cumin seed level recommended to be co-pressed with NS depends upon its end-use application as raw or cooked. Cold pressed NSO co-pressed with 5% BCS would especially be best suit-ed for food preparation practiced without the need to apply heat. The level of BCS could be increased up to 10% for NSO that would be used in cooking.
REFERENCES
AOCS-CG2-83 Flavor panel evaluation of vege-table oils.
Burits, M and Bucar, F. (2000). Antioxidant activ-ity of Nigella sativa essential oil. Phytothera-py Research 14: 323-328.
Deli, S., Farah Masturah, M., Tajul Aris, Y and Wan Nadiah, W. A. (2011). The effects of physical parameters of screw press oil expeller on oil yield from Nigella sativa L Seeds. International Food Research Journal 18: 1367-1373.
Dutta, P. C., Helmersson, S., Kebede, E and Appelqvist, L. A. (1994). Variation in lipid composition of niger seed (Guizotia abyssinica Cass.) Samples collected from different regions in Ethiopia. Journal of the American Oil Chemists’ Society 71: 839-843.
Evangelista, R. L. (2009). Oil extraction from lesquerella seeds by dry extrusion and expelling. Industrial Crops and Products 29: 189-196.
Francis, C and Campbell, M. (2003). New High Quality Oil Seed Crops for Temperate and Tropical Australia. Rural Industries Research and Development Corporation.Publication No 03/045, RIRDC Project No UWA-47A. Can-berra.
Figure 3. Change of sensory properties of raw versus cooked NSO samples at different co-pressed BCS levels.

Ethiop. J. Sci. & Technol. 8(2) 61- 70, 2015 69
ISO6886:2006 Animal and vegetable fats and oils, Determination of Oxidative Stability (accelerated oxidation test).
Jacobsen, L and Backer, L. (1986). Recovery of sunflower oil with a small screw expeller. Energy in Agriculture 5: 199-209.
Jayaprakasha, G., Singh, R and Sakariah, K. (2001). Antioxidant activity of grape seed (Vitis vinifera) extracts on peroxidation models in vitro. Food Chemistry 73: 285-290.
Kiralan, M. (2012). Volatile compounds of black cumin seeds (Nigella sativa L.) from microwave heating and conventional roasting. Journal of Food Science 77: C481-C484.
Kruk, I., Michalska, T., Lichszteld, K., Kładna, A and Aboulenein, H. Y. (2000). The effect of thymol and its derivatives on reactions generating reactive oxygen species. Chemosphere 41: 1059-1064.
Lutterodt, H., Luther, M., Slavin, M., Yin, J.J., Parry, J., Gao, J.M and Yu, L. L. (2010). Fatty acid profile, thymoquinone content, oxidative stability, and antioxidant properties of cold-pressed black cumin seed oils. LWT-Food Science and Technology 43:1409-1413.
Luzia, M. R., Da Paixao, K. C., Marcilio, R., Trugo, L. C., Quinteiro, L and De Maria, C. A. (1997). Effect of 5‐caffeoylquinic acid on soybean oil oxidative stability. International Journal of Food Science and Technology 32:15-19.
Matthäus, B and Brühl, L. (2003). Quality of cold-pressed edible rapeseed oil in Germany. Food/Nahrung 47(6): 413-419.
Poiana, M.A. (2012). Enhancing oxidative stability of sunflower oil during convective and microwave heating using grape seed extract. International Journal of Molecular Sciences 13:9240-9259.
Ramadan, M., Moreau, R and Kamal-Eldin, A. (2009). Niger seed oil. Gourmet and health promoting speciality oils, pp 283-299.
Ramadan, M. F. (2007). Nutritional value, functional properties and nutraceutical applications of blackcumin (Nigella sativa L.): an overview.
International Journal of Food Science and Technology 42: 1208-1218.
Ramadan, M. F. (2013). Improving the stability and radical scavenging activity of sunflower oil uponblending with black cumin (Nigella sativa) and coriander (Coriandrum sativum) seed oils. Journal of Food Biochemistry 37: 286-295.
Ramadan, M. F and Moersel, J. T. (2004). Oxidative stability of black cumin (Nigella sativa L.), coriander (Coriandrum sativum L.) and niger (Guizotia abyssinica Cass.) crude seed oils upon Stripping. European Journal of Lipid Science and Technology 106: 35-43.
Ramadan, F. M and Moersel, J. T. (2002). Proximate neutral lipid composition of niger (Guizotia abyssinica Cass.) seed. Czech Journal of Food Science 20: 98-104.
Ramadan, M. F and Wahdan, K. M. M. (2012). Blending of corn oil with black cumin (Nigella sativa) and coriander (Coriandrum sativum) seed oils: Impact on functionality, stability and radical scavenging activity. Food Chemistry 132: 873-879.
Riley, K.W and Belayneh, H. (1989). Niger seed (Guizotia abyssinica Cass.). In: Oil Crops of the World, Their Breeding and Utilization. (Robbelen, G., Downey, R.K. , and Ashri, A. eds.). New York: McGraw-Hill, Inc.
Shaker, E. S. (2006). Antioxidative effect of extracts from red grape seed and peel on lipid oxidation in oils of sunflower. LWT-Food Science and Technology 39: 883-892.
Singh, S., Das, S., Singh, G., Schuff, C., De Lampasona, M. P and Catalan, C. A. (2014). Composition, in vitro antioxidant and antimicrobial activities of essential oil and oleoresins obtained from black cumin seeds (Nigella sativa L.). BioMed Research International 10.1155/2014/918209. 183–189.
Tasan, M., Gecgel, U and Demirci, M. (2011). Effects of storage and industrial oilseed extraction methods on the quality and stability characteristics of crude sunflower oil (Helianthus annuus L.). Grasas y Aceites 62:389-398.

70 Admasu Fanta
Tekeoglu, I., Dogan, A., Ediz, L., Budancamanak, M and Demirel, A. (2007). Effects of thymoquinone (volatile oil of black cumin) on rheumatoid arthritis in rat models. Phytotherapy Research 21: 895-897.
Toliwal, S., Tiwari, M and Verma, S. (2005). Studies on thermal stability of palm-corn oil blends. Oil Technologists Association of India 37:18-20.
Vadke, V. S., Sosulski, F and Shook, C. (1988). Mathematical simulation of an oilseed press. Journal of the American Oil Chemists’ Society 65:1610-1616.
Wsowicz, E., Gramza, A., Hes, M., Jelen, H. H., Korczak, J and Malecka, M. (2004). Oxidation of lipids in food. Polish Journal of Food Nutrition Sciences 13: 87-100.

Ethiop. J. Sci. & Technol. 8(2) 71-79, 2015 71
Evaluation of the quality of cow milk consumed by children in and around Bahir Dar
Fanaye Shiferaw1, Ashenafi Mengistu2, Getachew Terefe2, Hailu Mazengia3*
1Debre Birhan University, College of Agriculture and Natural Resource2Addis Ababa University, College of Veterinary Medicine and Agriculture
3Bahir Dar University, College of Agriculture and Environmental Sciences
ABSTRACT
The safety of dairy products with respect to food-borne diseases is a great public health concern around the world. The microbial load of milk is a major factor in determining its quality. Hence, this study was aimed to evaluate of the quality and hygienic practices of cow milk consumed by children in and around Bahir Dar. A total of 79 milk samples were collected and analyzed using standard bacteriological examination. The study revealed that the proportions of respondents who practice udder washing prior to milking were 56%, 22% and 2% in urban, periurban and rural areas, respectively. Moreover, 88.7%, 67.3% and 45.2% of respondents has a practice of milk boiling before feeding the milk to their children in the urban, peri-urban and rural ar-eas of the study, respectively. The majority of respondents in the urban (88%) and peri-urban (50%) areas wash milking, milk feeding and storing containers with detergents and boiled water. Higher (SPC/ml) was found in the rural 5x10⁵ areas of the study compared to the urban and peri-urban sites. Likewise, of SPC, higher CC (2.2x10⁵) was obtained in the rural area of the study without significant (p > 0.05) difference in mean SPC across location. Therefore, milk collected from all study sites does not meet the minimum quality standard as the coliform population was much higher than the value indicated. Therefore, further research works to address constraints and to improve child milk consumption are imperative.
Keywords: Bahir Dar, child milk consumption, milk qualityDOI: http://dx.doi.org/10.4314/ejst.v8i2.2
INTRODUCTION
Milk is one of the major products of livestock (cat-tle, camels and goat).In addition to serving as source of income for livestock owners; it can contribute to household food security especially for healthy child nutrition. Milk is a nutrient dense food and is known to contribute a high proportion of the nutrients, such as high quality protein and micronutrients (Barasa, 2008). However, milk provides are an ideal medium for growth of bacteria. The hygienic control of milk and milk product in Ethiopia is not usually conducted on routine bases (Bisrat Godefay and Bayleyegn Mol-la, 2000).The safety of dairy products with respect to food-borne diseases is of great concern around the world. The microbial load of milk is a major factor in deter-
*Corresponding author:[email protected]© This is an Open Access article distributed under the terms of the Creative Commons Attribution License (http://creativecommons.org/licenses/CC BY4.0)
mining its quality. It indicates the hygienic level exer-cised during milking, that is, cleanliness of the milk-ing utensils, condition of storage, manner of transport as well as the cleanliness of the udder of the individu-al animal (Parekin and Subhash, 2008).According to Bisrat Godefay and Bayleyegn Mol-la (2000), in Ethiopia the dairy hygiene is given less attention. They reported that, exogenous sources of milk contamination with bacteria are very common. According to Asaminew Tassew (2007), the overall milking hygienic practice followed by the farmers in Bahir Dar Zuria and Mecha Woreda is poor. But, provision of milk and milk products of good hygien-ic quality and quantity is desirable from consumer health point of view (Zelalem Yilma, 2010). There-fore; this study was conducted with objectives of evaluating quality of cow milk consumed by children in and around Bahir Dar.

72 Fanaye Shiferaw et al.
MATERIALS AND METHODS
Description of the study area
Bahir Dar is the capital of Amhara National Region-al State, located at about 565 km away from Addis Ababa (Figure 1). The Regional State covers a total area of 152,600 km2. The Region has 10.6 million cattle, 5.7 million sheep, 4 million goats, 2.1 million equines and 17,400 camels managed under extensive management system (BoFED, 2008). Bahir Dar City is located at 11” 38’N, 37” 10’E on the South of Lake Tana where Blue Nile River starts. The elevation re-ported for the City is about 1801m.a.s.l. There are 9 kebeles in the City (QCB, 2010). The area receives an average annual rainfall ranging between 850mm to 1250mm with the minimum and maximum aver-age daily temperatures of 100c and 320c, respectively (BoARD, 2006). According to the BCAO (2012/13), the population of Bahir Dar is about 220,344 (includ-
ing rural kebeles). When disaggregated by place of settlement, the rural population of Bahir Dar consti-tuted 40,250 while the urban population is 180,094. According to the ALZR (2012/13), the peri urban and rural area of Bahir Dar has 39 kebele administra-tions with total human population 230,432 (133,707 male and 96,725 females). These kebeles are located at an altitude of 1500-1800 m. a. s. l with mean an-nual rainfall of 800-1250 mm and mean annual tem-perature of 28-32
oC. The minimum and maximum av-
erage daily temperature of the kebeles is 100c and 320c, respectively (BZOARD, 2007). Uncultivated lands due to various reasons are estimated to 31, 271 km2. The livestock population of peri urban and rural areas of Bahir Dar is estimated to be 206,865 cattle, 14,329 sheep, 26,049 goats, 18,728 donkeys, 716 mule and 346,546 poultry. Furthermore, there are about 19,706 honeybee colonies found in the Woreda (CACC, 2003).
Figure 1. Map of Bahir Dar City and kebeles bound Bahir Dar (CACC, 2003)

Ethiop. J. Sci. & Technol. 8(2) 71-79, 2015 73
Study design and study populationA cross-sectional study design was conducted to as-sess household level milk hygienic practices and child milk consumption.
Sampling of milk and quality analysisA total of 30 milk samples were collected from each site based on primary survey (n=90). Therefore, a total of 79 samples were tested. Milk samples were collected from households producing milk that is pro-vided to their child based on the result of the prelimi-nary survey. The milk sample was taken from the cup that a child used to drink from, before it was boiled and the volume of milk was measured with measuring cylinder.
Sample collecting bottles and measuring cylinder were obtained from Andassa Livestock Research Center. The bottles and measuring cylinder were ster-ilized with autoclave by washing with detergent and boiled water. Sterilization of sample collecting bot-tle was performed before and after sample collection from each three sites. The collected milk samples were mixed together into sterilized universal bottles of about 1000 ml capacity and labeled the name of the site on the bottle. From each house 33 ml of milk was collected. The milk for from sub clinical mastitis test was taken directly from the cow while for quality analysis it was taken from the cup that the child used to drink from. The collected milk was delivered to Bahir Dar Regional Veterinary Laboratory 30 minute after collection in ice box, then the mastitis test was completed for 1 hour and 30 minutes then the milk samples which passed the mastitis test was delivered to Bahir Dar University Food and Biochemical Tech-nology Department within the ice box for milk qual-ity analysis. All milk quality analysis was performed immediately after delivery. Microbial counts were made after 24 hours.
The microbial tests considered Standard Plate Count (SPC), Coliform Count (CC), titratable acidity, alco-
hol test and lactometer test. The corresponding SPC and CC were computed from duplicate plates contain-ing between 25-250 colonies. Plates containing less than 25 colonies were taken as less than 25 estimated counts and plates containing greater than 250 colonies for all dilutions were recorded as Too numerous to count (TNTC). The colonies were counted with col-ony counter. For analysis purpose only counts in the normal (25-250) were taken directly. When all plates counted less than 25, the nearest count to 25 was tak-en and when all plates counted greater than 250 colo-nies for all dilutions, the nearest colony count to250 was taken (APHA, 1992). To avoid a fictitious im-pression of precision and accuracy when computing the counts, only the first two significant digits were reported by rounding up or down to the next num-ber. The following formula was used to calculate the counts (APHA, 1992).
ΣC N= _________________ [(1xn1) + (0.1xn2)] d
Where:N = Number of colonies per ml or g of product; Σ C = Sum of all colonies on all plates counted; n1 = Num-ber of plates in first dilution counted; n2 = Number of plates in second dilution counted d = Dilution from which the first counts were obtained.
Coliform count (CC)The CC was made by mixing 25 ml of milk sample into sterile stomacher bag having 225 ml peptone wa-ter (1%). After mixing, the sample was serially dilut-ed up to 10-4 in sterile test tubes having 9ml of pep-tone water and duplicate samples (1 ml) were plated using 15-20 ml Violet Red Bile Agar (VRBA) in sterile petri dish. After thoroughly mixing, the plated sample was allowed to solidify and then incubated at 30ºC for 24 hours. Finally, colony counts were made using colony counter. Typical dark red colonies were considered as coliform colonies (MMAF, 2012).
74 Fanaye Shiferaw et al.
Standard plate count (SPC)The SPC was made by adding 25 ml of milk sample into sterile stomacher bag having225ml peptone wa-ter (1%). After thoroughly mixing, the sample was se-rially diluted up to 10-4 in sterile test tubes having 9 ml peptone water and duplicate samples (1 ml) were pour plated using 15-20 ml SPC agar solution and mixed thoroughly. The plated sample was allowed to solidify and then incubated at 30ºC for 48 hours. Col-ony counts were made using colony counter (MMAF, 2012). After incubation, all colonies including those of pin point size in SPCA medium and purplish red colonies in VRBA medium.
Titratable acidity test
Titratable acidity is a measure of freshness and bac-terial activity in milk. The production of acid in milk is normally termed souring and the sour taste of such milk is due to production of lactic acid. The percent-age of acid present in dairy products at any time is a rough indicator of the age of the milk and the manner in which it has been handled (Monika and Poonam, 2013). Acidity was measured by titration with 0.1 N sodium hydroxide solutions and using 1% ethanol solution of phenolphthalein as indicator (O’Connor, 1994). The following formula was used to calculate the lactic acid percentage (O’Connor, 1995).
Lactic acid (%) = ml N/10 alkali x 0.009 x 100ml of sample
Alcohol test
Five ml of milk and 5 ml of 68% alcohol (ethanol) were placed in a test tube. The test tube was invert-ed several times with the thumb held tightly over the open end of the tube. The tubes were shaken to mix and any clot formation was noted (Ombui et al., 1995). Clot formation indicates absence of freshness of the milk
Specific gravity test
Milk sample was filled gently into a measuring cyl-inder at room temperature. Then alacto meter was placed to sink slowly into the milk. The reading was taken just above the surface of the milk. According to the method described by Kurwijila (2006), these cal-culations are done on the lactometer readings.
The following formula was used to calculate the milk specific gravity.
Where, Lc - Lactometer reading at a given tempera-ture, i.e., for every degree above 600F, 0.1 degree was added, but for every degree below 60OF, 0.1 degree was subtracted from the lactometer reading (O’Maho-ny, 1988).
Normal milk has specific gravity of 1.026–1.032 g/ml (or 26–32 on the lacto meter reading). If water has been added, the lactometer reading would be below 26. If any solid such as flour has been added, the reading will be above 32 (Kurwijila, 2006).
Statistical analysisThe collected data was directly entered to statistical package for social sciences version 20 software and were analyzed with this software. Descriptive statistics were employed to summarize milk handling and boiling practice. Analysis of variance (ANOVA) procedure was used to measure location effects on measured quality parameters. P-value ≤ 0.05 were considered to have significant difference.
RESULTSMilking, milk handling and boiling practicesIn the study area, cows were hand milked and calves are allowed to suckle their dams prior milking. The

Ethiop. J. Sci. & Technol. 8(2) 71-79, 2015 75
into the milking vessel and moistening teats of the cows to facilitate milking were practiced in the study area. In this finding, the use of towel and hand glove to clean the udder of the cow and to keep the milk quality is very limited. In this find-ing 88.7%, 67.3% and 45.2% of respondents has a practice of milk boiling before feeding the milk to their children in the urban, peri-urban and rural ar-eas of the study, respectively. On the other hand, 11.3% in the urban, peri-urban 32.7% and in the rural 54.8% of respondents do not have milk boil-ing practice before giving the milk to their children (Table 1).
usual practice is to let the calves suckle their dams for a few minutes to stimulate milk let down. Milking the cow was at a standing position with one knee raised to support the milking vessel on their lap while anoth-er person holding the calf from suckling.
According to this study, in the urban area, 56% of respondents’ wash the cow udder whereas the pro-portions of respondents who practice udder washing prior to milking were 22% and 2% in periurban and rural areas, respectively. All of the interviewed re-spondents wash hands and milking vessels before milking cows. However, dipping of milker’s fingers
Table 1. Milking procedure in and around Bahir Dar
Variables Urban (N= 50) Peri urban (N= 50) Rural (N=50)
% % %Milking procedureWash the hand and milking vessels 100 100 100Washing the udder before milking 56 22 2Do not wash the udder 44 78 98Use gloveGlove users for milking 20Do not use glove for milking 80 100 100
N=Number of respondents
Microbiological quality of milkHigher (SPC/ml) was found in the rural 5X10⁵ areas of the study compared to the urban and peri-urban sites. However, there was no significant difference in mean SPC/ml (p >0.05) across locations. Likewise, of SPC, high-er CC (2.2X10⁵) was obtained in the rural area of the study without significant (p > 0.05) difference across loca-tion (Table 2).
Table 2. Microbial quality of cow raw milk in and around Bahir Dar
Location SPC (CFU/ml) SPC (Log10) CC (CFU/ml) CC (Log10)
Urban 104 4 4.7 X 10³ 3.7
Peri urban 4.6 X 10⁴ 4.7 3.1 X 10⁴ 4.5
Rural 5 X 10⁵ 5.7 2.2 X 10⁵ 5.3
SPC= standard plate count, CC= coliform count, CFU= colony forming unit

76 Fanaye Shiferaw et al.
In this stud it was found that the milk in the urban area was under the range which indicates addition of water whereas, milk consumed by peri-urban and rural children was not adulterated. However, no significant difference was observed (p>0.05) in specific gravity across locations (Table 3).
Table 3. Physico-chemical quality of cow raw milk in and around Bahir Dar
Location Mean values of milk physico-chemical quality parameters across the studyworedas
Adulteration Acidity testMean ± SD Mean ± SD
Urban 25.00a ± 0.00 0.19a ± 0.01Peri-urban 26.67a ± 0.58 0.20a ± 0.10Rural 26.11a ± 0.58 0.23a ± 0.02Over all 26.11 ± 0.93 0.21 ± 0.02
SD= Standard Deviation, Means followed with different superscripts in a column are significantly different (P<0.05)
DISCUSSION
Provision of milk and milk products of good hygien-ic quality is desirable from consumer health point of view (Zelalem Yilma, 2010). The mean value of SPC/ml in urban, peri-urban and rural areas of the study was similar and was below the minimum quality stan-dard value (2 x 10⁶SPC/ml) established for Ethiopia (ES, 2009). The SPC obtained in this study was also lower than the report of Asaminew Tassew and Eyas-su Seifu(2007), Solomon et al. (2013), who reported in Bahir Dar zuria and Mecha woreda and selected dairy farms in Debre Zeit town, respectively. Similar-ly, the total coliform count did not vary between the three study sites. The CC which was obtained in the three sites of the study was lower than the report of Zelalem Yilma and Bernard (2006) done on different producers in the central highland of Ethiopia. How-ever, according to American and European communi-ty member states, the acceptable limit for CC for raw milk was 150cfu/ml (APHA, 1992). Therefore, milk collected from all study sites does not meet the min-imum quality standard as the coliform population is
much higher than the value indicated which may sug-gest the need for further investigation on the presence of human pathogenic bacteria in milk in the study ar-eas.The higher CC may be due to the initial contamina-tion of the milk samples either from the cows, milk-ers’ hands, milk containers or milking environment in general (Asaminew Tassew and Eyassu Seifu, 2007). In agreement with this suggestion, this study has es-tablished the presence of potential risk factors such as udder hygiene, proper hand washing and cleanness of milking and storage utensils that might predispose the milk to contamination. For example, maximum re-duction of teat contamination of 90% can be achieved with good udder preparation (washing with disin-fectant and drying with paper towel) before milking (Abebe et al., 2012). Before milking cows, dipping of milker’s fingers into the milking vessel and moisten-ing teats of the cows to facilitate milking is practiced in the study area. This practice may allow microbial contamination of the milk from the milker’s hand and thus should be discouraged (Asaminew Tassew and Eyassu Seifu, 2007).

Ethiop. J. Sci. & Technol. 8(2) 71-79, 2015 77
Titratable acidity is a measure of freshness and bac-terial activity in milk. Popescu and Angel (2009) re-ported that, high quality milk essentially needs to have less than 0.14% acidity. Therefore, milk collect-ed from all study sites does not meet the minimum quality standard of acidity as it was much higher than the value indicated. However, the overall mean ti-tratable acidity of cows’ milk produced in the study area was 0.21. This figure is lower than the finding of Asaminew Tassew and Eyassu Seifu (2007) who reported an average acidity of 0.23 in Bahir Dar and Mecha woreda. Similarly, this finding was lower than the report of Alganesh Tolla (2002) who reports 0.28 and 0.31for raw cows’ milk produced in BilaSayo and GutoWayu woredas of eastern Wollega, respectively. Acidity of the milk samples did not show significant variation (P > 0.05) by location. Fresh milk can have an initial acidity because of the buffering capacity (O’Mahony, 1988), but the milk tested was kept long at ambient temperature between milking and analy-sis attributing to high acidity. According to Monika and Poonam (2013), the percentage of acid present in dairy product at any time is a rough indication of the age of milk and the manner in which it has been han-dled.When milk contains more than 0.21% acid, or when calcium or magnesium compound are present in greater than normal compounds, it coagulates on the addition of alcohol. This fact is the basis of alcohol test, which furnishes a means of judging the quality of milk (Ombui et al., 1995). Therefore, children in the urban and peri urban area consumes fresh milk while, in the rural children consumes milk which is not fresh. Normal milk has specific gravity of 1.026–1.032 g/ml (or 26–32 on the lactometer reading). If the milk is adulterated, the lactometer reading will be below 26. If any solid such as flour has been add-ed, the reading will be above 32 (Kurwijila, 2006). Therefore, a child in the urban area consumes adul-terated milk whereas; milk consumed by peri-urban and rural children was not adulterated. Adulteration of milk reduces the quality of milk.
CONCLUSIONS
From this study, it was noted that the quality of milk fed to children by dairy cow owners was found to be affected by factors such as udder hygiene, cleanness of hands and utensils which might have ultimately re-sulted in higher coliform counts in milk of all study sites. Awareness should be created among households with dairy cow as to the importance of hygienic milk production, handling, feeding and processing. Areas of concern are proper washing and drying of the ud-der, hand washing before milking, proper cleaning of milking and storage vessels as well as child feed-ing utensils .Further study is required to investigate human pathogenic microbes in milk as the coliform level was found high. Moreover, similar study on the quality of milk provided to children in households without dairy cows is recommended.
REFERENCES
Abebe, B., Zelalem Yilma and Ajebu, N. (2012). Hygienic and microbial quality of raw whole cow’s milk produced in Ezha district of the Gurage zone, Southern Ethiopia. Wudpecker Journal of Agricultural Resources 1(11):459-465.
Alganesh Tola. (2002). Traditional milk and milk products handling practices and raw milk quality in Eastern Wollega. MSc. Thesis, Alemaya University, Dire Dawa, Ethiopia.
American Public Health Association (APHA) (1992): Standard Method for the Examination of Dairy Products. 16th Ed, American Public Health Association (APHA), Washington.
Amhara Livelihood Report Zone (ALZR). (2012/13). Bahir Dar Z woreda West Gojjam Administration Zone, Amhara Livelihood Zone Report (ALZR), Bahir Dar, Ethiopia.
Asaminew Tassew and Eyassu Seifu. (2007). Microbial quality of raw cow’s milk collected

78 Fanaye Shiferaw et al.
from farmers and dairy cooperatives in Bahir Dar Zuria and Mecha District, Ethiopia. Agriculture and Biology Journal of North America 2(1): 29-33.
Asaminew Tassew. (2007). Production, handling, traditional processing practices and quality of milk in Bahir Dar milk shed area. MSc. Thesis Haramaya University, Ethiopia.
Barasa, M. (2008). Foot-and-mouth disease vaccination in South Sudan: benefit-cost analysis and livelihoods impact. Trans-boundary Emerging Diseases 55: 339-351.
BCAO. (2012/13). Census data report on human, livestock population living in and around Bahir Dar, Bahir Dar City Agricultural Office (BCAO), Bahir Dar, Ethiopia.
Bisrat Godefay and Bayileyegn Molla. (2000). Bacteriological quality of raw cow’s milk from four dairy farms and a milk collection center in and around Addis Ababa. Berliner Und Münchener Tierärztliche Wochenschrift 113:276-278.
BoARD. (2006). Bureau of Agriculture and Rural Development (BoARD) Amhara Region, Statistics Section. Bahir Dar, Ethiopia.
BoFED. (2008): Amhara National Regional State. Annual Statistical Bulletin.Bureau of Finance and Economic Development (BoFED), Bahir Dar, Ethiopia.
BZOARD. (2007). Annual Budget Report of Bahir Dar Zuria Office of Agriculture and Rural Development (BZOARD), Bahir Dar, Ethiopia.
Central Agricultural Census Commission (CACC),. (2003). Ethiopian Agricultural Sample Enumeration, 2001/ 02. Results for Amhara Region, Statistical Reports on Livestock and Farm Implants (Part IV), Central Agricultural Census Commission (CACC), Addis Ababa, Ethiopia. Pp. 45-46.
Kurwijila, L. (2006). Hygienic milk handling, processing and marketing: reference guide for training and certification of small-scale milk
traders in Eastern Africa. ILRI (International Livestock Research Institute), Nairobi, Kenya.
Manuals of Methods of Analysis of Food (MMAF) (2012). Food Safety and Standards Authority of Indian Ministry of Health and Family Welfare Government of India New Delhi. Manuals of Methods of Analysis of Food (MMAF), Lab. Manual 14.
Monika, S and Poonam, R. (2013). Microbiological And Chemical Analysis Of Raw, Pasteurized And UHT Milk During Preservation In India.Department of Applied Chemistry, Bansal Institute of Research, Technology and Science, Bhopal, India. International Journal of Chemical Technology Resources 5(6):2804-2809.
O’Connor, C. (1994). Rural dairy technology. ILRI training manual No. 1.International Livestock Research Institute (ILRI), Addis Ababa, Ethiopia.Pp.133.
O’Connor, C. (1995). Rural Dairy Technology. ILRI Training Manual. ILRI, Addis Ababa, Pp. 29-30, 80, 85-86.
O’Mahony, F. (1988). Rural dairy technology experiences in Ethiopia. ILCA Manual No. 4.Dairy Technology Unit. ILCA, Addis Ababa, Ethiopia.Pp.64.
Ombui, J., Arimi, S., Mcdermott, J., Mbugua, S., Githua, A and Muthoni, J. (1995). Quality of raw milk collected and marketed by dairy cooperative societies in Kiambu Woreda, Kenya. Bulletin Animal, Health Production in Africa 43: 277-284.
Parekin, T and Subhash, R. (2008). Molecular and bacteriological examination of milk from different animals with special reference to coliforms. Current Research Bacteria 1(2):56-63.
Quantification and Characterization (QCB) (2010). Waste Quantification and Characterization – Bahir Dar, Quantification and Characterization –Bahir Dar (QCB), Bahir Dar, Ethiopia.

Ethiop. J. Sci. & Technol. 8(2) 71-79, 2015 79
Solomon Mosu, Mulisa Megersa, Yibeltal Muhie, Desalegn Gebremedin and Simenew Keskes
(2013). Bacteriological quality of bovine raw milk at selected dairy farms in Debre Zeit town, Ethiopia. Comprehensive Journal of Food Science and Technology Research 1(1):1 – 8.
Zelalem Yilma (2010). Microbial Properties of Ethiopian Marketed Milk and Milk Products and Associated Critical Points of Contamination: An Epidemiological Perspective, Addis Ababa, Ethiopia.
ZelalemYilma and Bernard, F. (2006). Handling and Microbial Load of Cow’s Milk and Irgo-fermented Milk Collected from Different Shops and Producers in Central Highlands of Ethiopia. Dairy Technol, Ethiopian Institute of Agric. Res., Holetta Agricultural Res. Center, Addis Ababa, Ethiopia. Ethiopian Journal Animal Production 6(2): 67-82.

80 Fanaye Shiferaw et al.

Ethiop. J. Sci. & Technol. 8(2) 81-92, 2015 81
Thymus species in Ethiopia: Distribution, medicinal value, economic benefit, current status and threatening factors
Destaw Damtie1* and Yalemtsehay Mekonnen2
1Biology Department, Bahir Dar University, Ethiopia. 2Microbial, Cellular and Molecular Biology Department, Addis Ababa University, Ethiopia.
ABSTRACTThe genus Thymus is one of the genera in the family Lamiaceae. In Ethiopia, it is represented by two en-demic species namely Thymus serrulatus and Thymus schimperi. The aims of this study were to identify the types of species from six geographically distant localities in Ethiopia, assess the ethnobotanical and so-cioeconomic information of these species in these localities and gather information about the current status and threatening factors of these species in the six localities. The plant specimens from these localities were authenticated by experts in the National Herbarium of Addis Ababa University as Thymus serrulatus and Thymus schimperi. The plants were rated by local informants as treatments for ailments like blood pressure (30.7%), general pain syndrome (10%), influenza (10%), abdominal pain (10%), ascariasis (2.9%), and in-testinal parasites (2.9%). The informants rated the economic value of these plants as animal forage (71.5%), bee forage (71.5%), condiments (68%), and washing and fumigation (46%). According to the informants, the status of Thymus species is declining from time to time due to overgrazing (80.7%), agricultural ex-pansion (64.2%), overharvesting (48.57%), uprooting during harvesting (14.2%), and lack of recognition (13.6%)
Keywords: Ethiopia, Thymus schimperi, Thymus serrulatus, threatening factorsDOI: http://dx.doi.org/10.4314/ejst.v8i2.3
Nigist Asfaw, 1994) and are restricted to the afromon-tane and afroalpine zones of the country (IBC, 2008). Thymus schimperi is widely distributed in central, eastern, and northern Ethiopia and T. serrulatus is re-stricted to northern parts of the country (Sebsebe De-missew and Nigist Asfaw, 1994). However, there are conflicting reports regarding the distributions of these species in Ethiopia. For example, T. serrulatus is re-ported to be found from Jimma (South West Ethiopia) (Parvez and Yadav, 2008; Mahbere Silassie, Alamata, and Ofla (Tigray, North Ethiopia) (Atey G/Medhin, 2008) and Yilmana Densa (Amhara Region, Norther West Ethiopia) (Collected and identified during this research). On the other hand, T.schimperi is widely distributed in Amhara, Oromia, and Southern Nations Nationali-ties and Peoples Regions. It is found in Denkoro For-
INTRODUCTIONThe Lamiaceae/Labiatae (WHO, 1999) is a large plant family represented by about 236 genera and above 7200 species (Hedberg et al., 2006). This fam-ily is much diverse in terms of ethnomedicine owing to its diverse chemical composition (Niculae et al., 2009) such as flavonoids, phenolic acids, terpenes, sa-ponins, polyphenols, tannins, iridoids, and quinones (Özgen et al., 2011).The genus Thymus under Lamiaceae is noteworthy for its numerous species and varieties (Boz et al., 2009). In Ethiopia, this genus is represented by two indigenous species namely T. serrulatus and T. schim-peri (Jaafari et al., 2007) both of which are locally named as Tosign (Amharic) and Tesni/Thasne (Tigri-gna). These species are endemic to Ethiopian high-lands (2200-4000 m. a.s.l.) (Sebsebe Demissew and
*Corresponding author:[email protected]© This is an Open Access article distributed under the terms of the Creative Commons Attribution License (http://creativecommons.org/licenses/CC BY4.0)

82 Destaw Damtie and Yalemtsehay Mekonnen
est (Abate Ayalew, 2013), Chancho (Dibaba Chewa-ka, 2009), Ankober (Doni et al., 2012), Menz Gera Midir (Guassa) (GAGMP , 2007), Tarma Ber wereda of North Shewa and Gondar areas (Nigist Asfaw et al., 2000). In Oromia Region, T.schimperi is found in Adaba Dodola area (Kunert, 2000), Dinsho (Ermias Dagne et al., 1998; Ermias Lulekal et al., 2011); Sanet-ti Mountains (Tariku Mekonnen et al., 2011); Goma (Behailu Etana, 2010), Asendabo (Parvez and Yadav, 2008); areas around Jimma (Jemal Hussien et al., 2011); Debre Zeyit (Mohammed Nasir, 2010), Awash National Park (Tinsae Bahru et al., 2010), and Me-nagesha Suba State Forest (Abate Zewdie, 2007). In the different parts of the world, Thymus extracts are traditionally used orally to treat dyspepsia and other gastrointestinal disturbances, bronchitis, pertus-sis, laryngitis and tonsillitis, and coughs due to colds (Belaqziz et al., 2010; Özgen et al., 2011). Topical applications of thyme extracts have been used in the treatment of minor wounds, the common cold, and disorders of the oral cavity, and as an antibacterial agent in oral hygiene (Özgen et al., 2011).
Traditionally, Thymus species in Ethiopia are used in a variety of forms (Malcolm and Zelalem Tefera, 2007). The fresh or dried leaves of these species are used locally as condiments and tea (Sebsebe Dem-issew and Nigist Asfaw, 1994); in the preparation of berbere and “shirro” (pepper and bean/pea powder) (Amare Getahun, 1976); for the preparation of Metata ayb (a traditional Ethiopian fermented cottage cheese) (Eyassu Seifu, 2013).
In traditional medicine, Thymus species in Ethiopia are used to treat different illnesses like gonorrhea, cough and liver disease (Kunert, 2000); renal diseas-es (Andemariam, 2010); Gara Bokoyso (Oromifa) (stomach pain) (Haile Yineger et al., 2008); hyper-tension (Nigist Asfaw et al., 2000); kidney problem (Behailu Etana, 2010) and dermal fungi (Doni et al.,
2012). They are checked to have antihelimenthic (Je-mal Hussien et al., 2011); antibacterial and fungicidal activities (Dibaba Chewaka, 2009; Mohammed Nasir, 2010; Pagiotti et al., 2010; Shewaye Lakew, 2011). The major constituents of T. schimperi and T. serrula-tus in Ethiopia are thymol and carvacrol (Nigist As-faw et al., 2000). All the pharmacological actions of thyme thus may be due mainly to the phenolic com-ponent thymol, which is a major component in their essential oils (Sebsebe Demissew and Nigist Asfaw, 1994). In addition to their medicinal values, Thymus species in Ethiopia have economic uses like animal feed and bee forage (Likawent Yeheyis et al., 2008). The present study thus was designed (1) to identify the types of Thymus species from six distant localities in Ethiopia (2) to collect information about their me-dicinal values, their economic benefits, their current status and pressures or threatening factors on these species.
METHODS
Study area Samples of Thymus species, ethnobotanical infor-mation, socioeconomic data, and threatening factors were collected from six localities of Ethiopia (Figure 1). These localities were Ofla and Alamata woredas (districts) of South Tigray (Tigray Region); Yilma-na Densa woreda of West Gojjam (Amhara Region); Mojana woreda of North Shewa (Amhara Region); Meskena Mareko woreda of Gurage (Southern Na-tions, Nationalities and Peoples Region); and Sinana Dinsho woreda ( Oromia region).
The specific areas for plant collection were: (1) Menkere (Ofla, South Tigray) 625 Kms North of Addis Ababa (Capital city of Ethiopia); Akojira (Alamata, Southern Tigray) 605 Kms North of Addis Ababa; Bir Adama mountain (Yilmana Densa, West Gojjam) 443 Kms North west of Addis Ababa; Tarma Ber (Mojana woreda, North Shewa) 190 Kms North east of Addis Ababa; Zebidar Mountain (Meskena

Ethiop. J. Sci. & Technol. 8(2) 81-92, 2015 83
Mareko woreda, Southern Nations Nationalities and Peoples Region) 135 Kms South west of Addis Ababa; and Dinsho (Bale Mountains National park, Oromia Region) which is 370 Kms away from Addis Ababa through Assela (Figure 1).
Ofla woreda has an altitudinal range of 1800–2440 m. Its mean annual rainfall is between 700–800 mm with mean daily temperatures ranging from 10–22 ºC. Rainfall is bimodal; a short rainy season “belg” between February and May, and a long rainy sea-son “meher” between June and September. Mixed crop-livestock production is the major activity of the farming system. Wheat, maize, barley, faba bean and sorghum are the major crops grown. The major livestock types reared in the district are cattle, sheep and chicken. Donkeys, goats and honeybees are also reared having lower shares (Girmay Tesfay et al., 2014).
Alamata woreda has an altitudinal range of 1178 to 3148 m a.s.l of which and 75% is low land (1500 m a.s.l or below) and 25% intermediate highlands (be-tween 1500 and 3148 m a.s.l). Eutric Vertisols, Lithic Leptosols (Cambic) and Lithic Leptosols (Orthic) are the soil types covering nearly 100% of the land in the woreda (IPMS, 2005). The annual temperature rang-es between 14.6 oc and 29.7 oc (Dawit Gebregziabher, 2010). Alamata has bimodal rainfall patterns; the belg (short rains) (from January to February) and the Me-her (long rains) (from July to August). The mean an-nual rainfall of the area is around 963.5 mm. Teff and sorghum are the dominant crops covering 75% of the woreda caltivated area. Currently field pea, faba bean, lentils (in high land) teff and pepper (in low land) are the most important marketable commodities in the woreda. Livestock production in the woreda involves cattle, sheep, goats, camel, poultry and bee produc-tion (IPMS, 2005; Dawit Gebregziabher, 2010).
Figure 1: Data/Sample Collection Sites of Thymus species for the present study (constructed from GPS data)

84 Destaw Damtie and Yalemtsehay MekonnenYilmana Densa woreda is one of the fifteen woredas of West Gojjam Administrative zone. Its capital town, Adet is found 42 km. from Bahir Dar on the south and 443 km from Addis Ababa through Mota. The average annual temperature ranges between 8.8°c-25.2°c, and the average annual rainfall ranges between 1100-1270 mms. The woreda has three types of soil: red (65%), brown (15%) and black (20%). Favorable climatic condition and fertile soil makes the woreda suitable for crop production and livestock husbandry. In the woreda, the rural people depend on crop production and livestock husbandry for their Livelihood. Cropping is predominantly rain fed. As part of mixed farming, the woreda possesses cattle, sheep, goats, equine poultry and bee hives. This woreda is one of the major maize producers followed by Teff, Barley and Wheat (Solomon Abie, 2011).
Tarmaber is located 190 km away from Addis and covers about 54,000 ha of lands. Agro climatologically 17% of the land is lowland, 28 % semi-arid (Woinadega) and 54.7 % is highland (Dega). Its altitude is ranging from 1500 to 3100 meter above sea level. The average annual temperature and the mean monthly rain fall are about 15.5 °C and 1200 mm respectively. The topography is dominated by chain of hills and rouged mountains; thereby 15.28 % of the woreda is mountainous, 32.78 % is plain lands, 6.29 % valleys and 45.65 % are rugged types (http://edaethiopia.org/index.php/where-we-work/amhara/tarma-ber).
Meskana Mareko is a district located in the Gurage zone, Southern Nations, Nationalities, and People’s Regional state (SNNPR) 135 km south of Addis Ababa. The dominant ethnic group is Gurage of meskan dialects. Farming is the main economic activity and the main cash crops are pepper, coffee and khat. The woreda lies at an average altitude of
1900 m above sea level, ranging from 1750 m a.s.l in the lowlands to 3400 m a.s.l in the mountains. Annual rainfall in Meskana Mareko area ranges between 700-1870 mm. Although the main rainy season is from June to September, light rains are common around March and April. The warmest months are between January and June with a maximum temperature of 30.4 °C in March during the last ten years. During the last decade the annual mean maximum temperature was 26.3 °C and minimum mean temperature was 11.1 °C (Solomon Tesfaye et al.,2012).
Dinsho Woreda is one of the districts in Oromia Re-gion. Dinsho is located at the northern edge of the Bale Mountains National Park (BMNP) 370 Kms South East from Addis Ababa. It has altitudinal rang-es from 2441-3600 m a.s.l. (Haile Yineger et al., 2008). Its mean annual temperature and rainfall are 10.26oC and 1218.64 mm respectively (Haile Yineg-er et al., 2008). The trend of the rainfall distribution is bimodal namely “belg” (small rains occurring from February to May) and “kiremt” (big rains occurring from August to October) (Luizza et al., 2013). Din-sho’s loamy, fairly fertile, and low-density Mollic An-dosol soils are results of extended weathering of lava outflows stemming from the Oligocene Epoch (33.9 - 23 million years B.P.) (Luizza et al., 2013). It has a typical vegetation type of undifferentiated Afrom-ontane forests. The predominant inhabitants are the Oromo people who use economic activities primari-ly based upon mixed farming that involves pastoral-ism and cultivation of crops such as wheat and barley (Haile Yineger et al., 2008).
Data collectionThis information about T. serrulatus and T. schim-peri species were collected from informants using semi-structured questionnaires. The development

Ethiop. J. Sci. & Technol. 8(2) 81-92, 2015 85
agents (DAs) in each study site were involved in the informant selection and data collection processes. The informants in each study site were farmers who had meetings with the DAs. A total of 140 male in-formants were randomly selected and asked about the medicinal value, economic advantage, current status, and threatening factors of Thymus species in their localities. Data collection took place from 28th July through 28th September 2013.
Plant material identificationSamples of the aerial parts of Thymus species were collected from 28th July through 28th September 2013 from the above mentioned districts and regions. The collected specimens were pressed and taken to Na-tional Herbarium of Addis Ababa University for au-thentication. They were identified by Mr. Melaku Wondafrash in the National Herbarium of Addis Aba-ba University. After identification, voucher specimens were deposited in the Natural Herbarium of Addis Ababa University with voucher numbers Ala-2013 (Thymus from Alamata district), But-2013 (Thymus from Butajira, Meskana Mareko woreda), Bal-2013 (Thymus from Dinsho, Bale Mountains National Park), Ofl-2013 (Thymus from Ofla district), Tar-2013 (Thymus from Tarma Ber, Mojana district) and Yil-2013 (Thymus from Yilmana Densa district).
RESULTS
Identified Thymes species collected from six
localities in EthiopiaOut of the Thymus species collected from six locali-ties, three of them (Ofl-2013, Ala-2013, and Yil-2013) were identified as T. serrulatus and the rest three (Tar-2013, But-2013, and Bal-2013) as T. schimperi (Table 1).
Medicinal value of T. schimperi and T. serrulatus
from EthiopiaThe majority of the respondents 43 (30.7%) have at least heard about the use of Thymus species as a treatment for blood pressure although a lot of them 33 (23.5%) have no information about the health significances of these species. On the other hand, 52 (30%) of the respondents have mentioned that these plants have applications to treat general pain syndrome, influenza and abdominal pain (Table 2). Some respondents from Tgray Region mentioned the ascaricidal 4 (2.9%) and intestinal paraciticidal 4 (2.9%) effects of T. serrulatus grown in Tigray. In almost all the localities, the respondents mentioned that it is the aerial parts of T. schimperi and T. serrulatus which are dried, crushed, made into tea and taken orally to treat the ailments mentioned.
Table 1. Thyme species identified from six localities
S.No. Voucher No. l Identified as the species1 Ofl-2013 Thymus serrulatus2 Ala-2013 Thymus serrulatus3 Yil-2013 Thymus serrulatus4 Tar-2013 Thymus schimperi5 But-2013 Thymus schimperi6 Bal-2013 Thymus schimperi
l Ofl- T.serrulatus from Ofla, Ala- T.serrulatus from Alamata, Yil- T.serrulatus from Yilmana Densa, Tar- T. schimperi from Tarmaber, But- T.schimperi from Butajira, Bal- T.schimperi from Bale.

86 Destaw Damtie and Yalemtsehay Mekonnen
Economic benefits of T. schimperi and T. serrulatus from Ethiopia
The respondents mentioned the economic uses of Thymus species in Ethiopia as honey bee forage, animal forage, food additives (condiments), and washing and fumigating household utensils such as buckets for milking and dough preparation (Table 3). The respondents further mentioned that such fumigation of milking jars and buckets for putting milk and dough of injera is important to maintain milk and injera with best flavors and without rancidity. According to the respondents, the honey from Thymus species has medicinal value and with special taste. Milk, yogurt, butter, and meat from
animals fed with Thymus species have special taste
and flavor. In addition, application of Thymus species
as food additives increases the flavor and shelf-life of
foods and sauces such as shiro, berbere, butter, Besso
etc. Furthermore, the respondents have mentioned
that Thymus as an animal forage is useful for
fattening. Furthermore fumigating the honey beehives
attracts honey bees and eliminates honey bee diseases
as was raised by the respondents from Southern
Tigray. During interview with the respondents, it was
clear that more people from other areas of the country
use Thymus species as food additives than people in
Southern Tigray. The people in Tigray know that it
can be used as tea but most of them do not use it.
Table 2. Human ailments reported to be treated by T. schimperi and T. serrulatus
Human Disease
Scientific name
Family Local name*Voucher l
No.Part used
Form used
Methods of preparation
Route of
admin-istration
Respon-dents
T. schipmeri +
T. serrulatusLamiaceae
Tosign (Amh), Toshigne (Gur), Tosigni (Oro)Teshne (Tig)
Ofl-2013, Ala-2013, Yil-2013, Tar-2013, But-2013, Bal-2013
Blood pressure ‘’ ‘’ ‘’
Leaves and
flowersDried Crushed and
drunk as tea Oral 43 (30.7%)
General pain syndrome
‘’ ‘’ ‘’ ‘’Leaves
and flowers
Dried Crushed and drunk as tea Oral 14 (10%)
Influenza ‘’ ‘’ ‘’ ‘’Leaves
and flowers
Dried Crushed and drunk as tea Oral 14 (10%)
Abdominal pain ‘’ ‘’ ‘’ ‘’ Aerial
parts Dried Crushed and drunk as tea Oral 14 (10%)
Ascariasis ‘’ ‘’ ‘’ ‘’ Leaves Dried Drunk as tea Oral 4 (2.9%)
Intestinal parasites ‘’ ‘’ ‘’ ‘’ Leaves Dried Drunk as tea Oral 4 (2.9%)
I don’t know ‘’ >> >> >> - - - - 33
(23.5%)*Amh- Amharic; Gur- Guragigna, Tig- Tigrigna, Oro- Oromiphal Ofl- T.serrulatus from Ofla, Ala- T.serrulatus from Alamata, Yil- T.serrulatus from Yilmana Densa, Tar- T.schimperi from Tarmaber,
But- T.schimperi from Butajira, Bal- T.schimperi from Bale.

Ethiop. J. Sci. & Technol. 8(2) 81-92, 2015 87
Current status and threatening factors of Thymus
species from Ethiopia
According to the respondents’ responses, Thymus
species endemic to Ethiopia (T. schimperi and T.
serrulatus) exist as wild species and their current
status is decreasing from year to year (Table 4). The
major threatening factors for these species were
identified to be overgrazing followed by agricultural
expansion, overharvesting, harvesting the whole
plant including the roots, and lack of recognition.
This reduction in Thymus species is high in North
Shewa and Gurage zone due to the mentioned
threatening factors. However, the situation is better
in Tigray (Alamata and Ofla), Yilmana Densa (West
Gojjam) and Dinsho (Bale) since the collection sites
are closed from human and animal encroachment.
Harvesting the whole plant including the roots is the
biggest problem in North Shewa due that the plant is
served as an income source for inhabitants there. It
is usual to see the youth and women selling the dried
plant parts to travelers on the highway from Addis
Ababa to North Ethiopia (Wello and Tigray).
Table 3. Report on other economic uses of T. schimperi and T. serrulatus
Scientific name FamilyLocal *name
Voucher l
No.Economic
UseRespondents
T. schimperi + T. serrulatus Lamiaceae
Tosign (Amh), Toshigne (Gur), Tosigni (Oro)Teshne (Tig)
Ofl-2013, Ala-2013, Yil-2013, Tar-2013, But-2013, Bal-2013
T. schimperi + T. serrulatus Lamiaceae ‘’ ‘’ Bee forage 100 (71.5 %)
T. schimperi + T. serrulatus Lamiaceae ‘’ ‘’ Animal forage 100 (71.5%)
T. schimperi + T. serrulatus Lamiaceae ‘’ ‘’
Condiment (additive to shiro, berbere, butter, Besso)
95 (68%)
T. schimperi + T. serrulatus Lamiaceae ‘’ ‘’ Drink (tea) 95 (68%)
T. schimperi + T. serrulatus Lamiaceae ‘’ ‘’
Washing and fumigating jars for milking and buckets for putting paste of injera
65 (46%)
*Amh- Amharic; Gur- Guragigna, Tig- Tigrigna, Oro- Oromiphal Ofl- T.serrulatus from Ofla, Ala- T.serrulatus from Alamata, Yil- T.serrulatus from Yilmana Densa, Tar- T.schimperi from Tarmaber, But- T.schimperi from Butajira, Bal- T.schimperi from Bale.
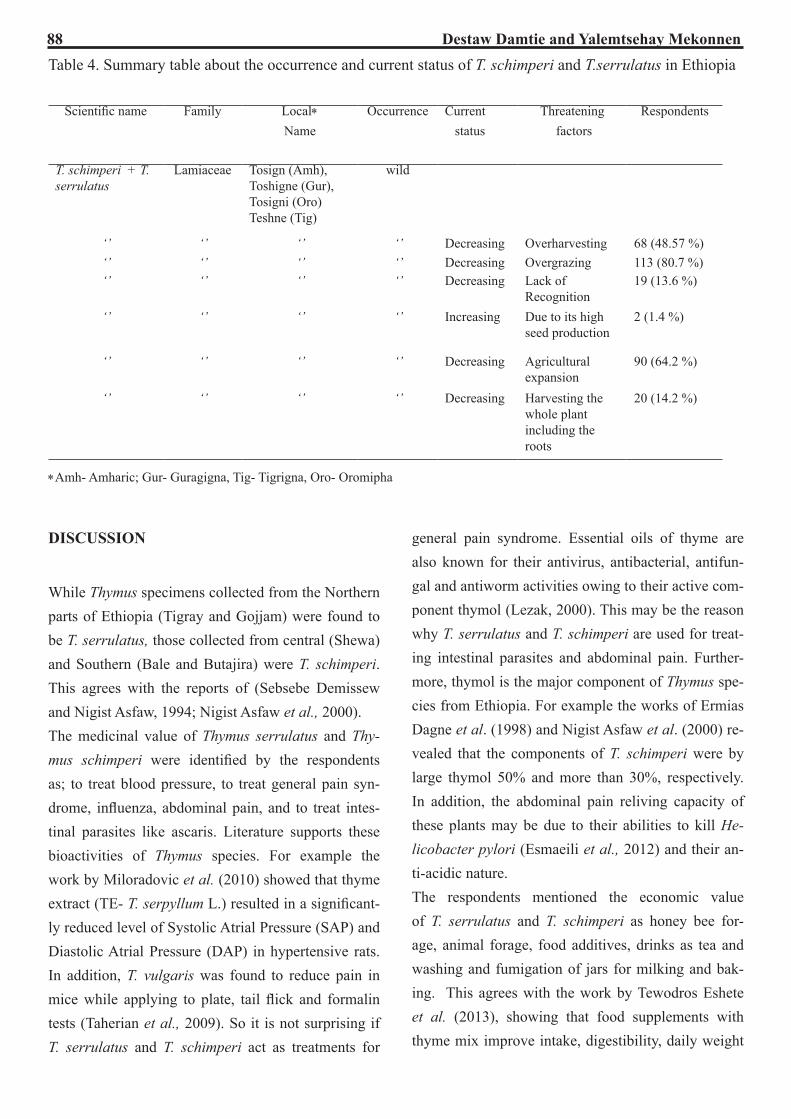
88 Destaw Damtie and Yalemtsehay MekonnenTable 4. Summary table about the occurrence and current status of T. schimperi and T.serrulatus in Ethiopia
Scientific name Family Local* Name
Occurrence Current status
Threatening factors
Respondents
T. schimperi + T. serrulatus
Lamiaceae Tosign (Amh), Toshigne (Gur), Tosigni (Oro)Teshne (Tig)
wild
‘’ ‘’ ‘’ ‘’ Decreasing Overharvesting 68 (48.57 %)‘’ ‘’ ‘’ ‘’ Decreasing Overgrazing 113 (80.7 %)‘’ ‘’ ‘’ ‘’ Decreasing Lack of
Recognition 19 (13.6 %)
‘’ ‘’ ‘’ ‘’ Increasing Due to its high seed production
2 (1.4 %)
‘’ ‘’ ‘’ ‘’ Decreasing Agricultural expansion
90 (64.2 %)
‘’ ‘’ ‘’ ‘’ Decreasing Harvesting the whole plant including the roots
20 (14.2 %)
*Amh- Amharic; Gur- Guragigna, Tig- Tigrigna, Oro- Oromipha
DISCUSSION
While Thymus specimens collected from the Northern parts of Ethiopia (Tigray and Gojjam) were found to be T. serrulatus, those collected from central (Shewa) and Southern (Bale and Butajira) were T. schimperi. This agrees with the reports of (Sebsebe Demissew and Nigist Asfaw, 1994; Nigist Asfaw et al., 2000). The medicinal value of Thymus serrulatus and Thy-mus schimperi were identified by the respondents as; to treat blood pressure, to treat general pain syn-drome, influenza, abdominal pain, and to treat intes-tinal parasites like ascaris. Literature supports these bioactivities of Thymus species. For example the work by Miloradovic et al. (2010) showed that thyme extract (TE- T. serpyllum L.) resulted in a significant-ly reduced level of Systolic Atrial Pressure (SAP) and Diastolic Atrial Pressure (DAP) in hypertensive rats. In addition, T. vulgaris was found to reduce pain in mice while applying to plate, tail flick and formalin tests (Taherian et al., 2009). So it is not surprising if T. serrulatus and T. schimperi act as treatments for
general pain syndrome. Essential oils of thyme are also known for their antivirus, antibacterial, antifun-gal and antiworm activities owing to their active com-ponent thymol (Lezak, 2000). This may be the reason why T. serrulatus and T. schimperi are used for treat-ing intestinal parasites and abdominal pain. Further-more, thymol is the major component of Thymus spe-cies from Ethiopia. For example the works of Ermias Dagne et al. (1998) and Nigist Asfaw et al. (2000) re-vealed that the components of T. schimperi were by large thymol 50% and more than 30%, respectively. In addition, the abdominal pain reliving capacity of these plants may be due to their abilities to kill He-licobacter pylori (Esmaeili et al., 2012) and their an-ti-acidic nature. The respondents mentioned the economic value of T. serrulatus and T. schimperi as honey bee for-age, animal forage, food additives, drinks as tea and washing and fumigation of jars for milking and bak-ing. This agrees with the work by Tewodros Eshete et al. (2013), showing that food supplements with thyme mix improve intake, digestibility, daily weight

Ethiop. J. Sci. & Technol. 8(2) 81-92, 2015 89
gain, final body weight, empty body weight, hot car-cass weight, and dressing percentage compared to non-supplemented group and improves the sensory quality of sheep meat. Furthermore, thyme honey has medicinal values. For example, the work by Tsiapara et al. (2009) showed that thyme honey reduces the vi-ability of prostate cancer cell line (MCF-7). Thus, the information from the informants is valuable.According to the informants, the status of T. serrula-tus and T. schimperi is declining mainly due to over-grazing followed by agricultural expansion, over-harvesting, harvesting the whole plant including the roots, and lack of recognition. The threatening factors for these plants are similar to those identified by Ka-layu Mesfin et al. (2013). Harvesting the whole plant including the root continuously is a dangerous prac-tice which interferes with the life cycle of the species and results in eradication of the whole plant (Wangc-huk et al., 2008). These plants are restricted to limited geographical regions (Alpine and Afroalpine) so that degradation of these areas may result in degradation of the whole species. Overgrazing of T. serrulatus and T. schimperi is a big challenge owing to their suitabil-ity as forages for cattle, sheep and goats as well as the beliefs of inhabitants that animals which fed these plants give tasty meat, mutton, and milk. The other problem is commercialization of these wild species without conserving them (Zuzarte et al., 2011). This may be due to the reason that wild species are com-munal and no one cares about them as private (culti-vated) species. Their multiple use as condiments, for-age, medicinal value, and tea increased the harvesting pressure on these plants and they are continuously declining. In the same way all these pressures may be indirectly caused by human population expansion and increased level of unemployment rate (Wangc-huk et al., 2008). In addition, there is continuous and bulk requirement of these herbs. To supply such large quantity of the herbs, large scale cultivation would be required, which in turn will generate good business opportunities and human resource development (Trip-athi et al., 2009).
CONCLUSIONS
The specimens of Thymus collected from South-ern Tigray (Alamata and Ofla) as well as from West Gojjam (Yilmana Densa) were found to be T. serru-latus while those collected from Tarma Ber, Buta Jira, and Bale were T. schimperi. Many of the informants agreed about the importance of these species to treat blood pressure followed by general pain syndrome, influenza, abdominal pain, and intestinal parasites like Ascaris in descending order. However great ma-jority of them especially those from Tigray do not know about the medicinal uses of these plants. Eco-nomically, these plants are important sources of ani-mal and honey bee forage, serve as condiments, tea, and fumigants. Despite their medicinal and econom-ic uses, these plants are highly diminishing due to overharvesting, overgrazing, agricultural expansion, whole plant harvesting including the roots, and lack of recognition.
REFERENCES
Abate Ayalew. (2013). Floristic Composition and Structural Analysis of Denkoro Forest, South Wello. MSc thesis, Addis Ababa University, Ethiopia.
Abate Zewdie. (2007). Comparative Floristic study on Menagesha Suba State Forest on Years 1980 and 2006. MSc Thesis, Addis Ababa University, Ethiopia.
Amare Getahun. (1976). Some Common Medicinal and Poisonous Plants Used in Ethiopian Folk Medicine. REGISTRATED IN THE DATA BANK PRELUDE ; REF : VG 07.
Andemariam, S.W. (2010). Legislative Regulation of Traditional Medicinal Knowledge in Eritrea vis-à-vis Eritrea’s Commitments under the Convention on Biological Diversity: Issues and Alternatives. Law, Environment and Development Journal 6(2): 133-162.

90 Destaw Damtie and Yalemtsehay Mekonnen
Atey G/Medhin. (2008). Local use of spices, condiments and non-edible oil crops in some selected woredas in Tigray, Northern Ethiopia. MSc Thesis, Addis Ababa University, Ethiopia.
Behailu Etana. (2010). Ethnobotanical Study of Traditional Medicinal Plants of Goma Wereda, Jima Zone of Oromia Region, Ethiopia. MSc thesis, Addis Ababa University, Ethiopia.
Belaqziz, R., Harrak , R., Romane, A., Oufdou, K and ElFels, M.A.E. (2010). Antimicrobial and Insecticidal Activities of the Endemic Thymus broussonetti Boiss and Thymus maroccanus Ball. Journal of Natural Products 4(4): 230-237.
Boz, I., Burzo, I., Zamfirache, M.M., Toma, C and Padurariu, C. (2009). Glandular and essential oil composition of Thymus pannonicus All. (Lamiaceae). Analele Universitatii din Oradea, Fascicula Biologie XVI (2): 36-39.
Dawit Gebregziabher. (2010). Market Chain Analysis of Poultry: The Case of Alamata and Atsbi-Wonberta woredas of Tigray Region. MSc thesis, Haramaya University, Ethiopia.
Dibaba Chewaka. (2009). Growth inhibition of grain spoilage fungi by some herb and spice essential oils grown in Ethiopia. MSc thesis, Addis Ababa University, Ethiopia.
Doni, N., Asticcioli, S., Baraldo, M., Tirillini, B., Lulekal, E and Murgia, V. (2012). Researching accessible and affordable treatment for common dermatological problems in developing countries. An Ethiopian experience. International Journal of Dermatology 51: 790–795.
Ermias Dagne, Solomon Hailu, Daniel Bisrat and Tadele Worku. (1998). Constituents of the Essential Oils of Thymus schimperi. Bulletin of the Chemical society of Ethiopia 12(1): 79-82.
Ermias Lulekal, Zemedie Asfaw, Ensermu Kelbessa and Damme, P.V. (2011). Wild edible plants in Ethiopia: a review on their potential to combat
food insecurity. Afrika Focus 24 (2): 71-121.
Esmaeili, D., Mobarez, A.M. and Tohidpour, A. (2012). Anti-Helicobacter pylori activities of shoya powder and essential oils of Thymus vulgaris and Eucalyptus globulus. The Open Microbiology Journal 6: 65-69.
Eyassu Seifu. (2013). Chemical composition and microbiological quality of Metata Ayib: a traditional Ethiopian fermented cottage cheese. International Food Research Journal 20(1): 93-97.
GAGMP (Guassa Area General Management Plan): General Management Plan 2007-2012 (2007). The community-managed Guassa Area Menz. Compiled and edited, with the support of the Amhara National Regional State, by Frankfurt Zoological Society.
Girmay Tesfay, Girmay Gebresamuel, Alem Gebretsadik, Abrhaley Gebrelibanos, Yemane Gebremeskel and Tesfay Hagos (2014). Participatory Rural Appraisal Report: Ofla woreda, Tigray Region. CASCAPE technical report.
Haile Yineger, Ensermu Kelbessa, Tamirat Bekele and Ermias Lulekal (2008). Plants used in traditional management of human ailments at Bale Mountains National Park, Southeastern Ethiopia. Journal of Medicinal Plants Research 2(6): 132-153.
Hedberg, I., Ensermu Kelbessa, Edwards, S., Sebsebe Demissew and Persson, E. (2006) (eds.). Flora of Ethiopia and Eritrea 5: 553-554.
http://edaethiopia.org/index.php/where-we-work/amhara/tarma-ber (accessed July11, 2015).
Improving productivity and market success (IPMS, 2005). Alamata Pilot Learning Site Diagnosis and Program Design.
Institute of Biodiversity Conservation (IBC, 2008). Ethiopia: Second Country Report on the State of PGRFA to FAO.

Ethiop. J. Sci. & Technol. 8(2) 81-92, 2015 91
Jaafari, A., Mouse, A., Rakib, HE-M., Ait M’barek, L., Tilaoui, M., Benbakhta, C., Boulli, A., Abbad, A and Zyad, A (2007). Chemical composition and antitumor activity of different wild varieties of Moroccan thyme. Brazilian Journal of Pharmacognosy 17(4): 477-491.
Jemal Hussien, Chalachew Teshale and Jemal Mohammed (2011). Assessment of the Antimicrobial Effects of Some Ethiopian Aromatic Spice and Herb Hydrosols. International Journal of Pharmacology 7(5): 635-640.
Kalayu Mesfin, Gebru Tekle and Teklemichael Tesfay (2013). Assessment of Threatening Factors of Medicinal Plant Species in Samre District, South-Eastern Tigray, Northern Ethiopia. Journal of Medicinal Plants Studies 1(4): 38-42.
Kunert, M. (2000). Integrated Forest Management Project Adaba-Dodola (IFMP). Deutsche Gesellschaft für Technische Zusammenarbeit (GTZ) GmbH.
Lezak, M. (2000). Herbal Antimicrobials for Intestinal Infections. ANSR–Applied Nutritional Science Reports. Advanced Nutrition Publications, Inc.
Likawent Yeheyis, Aschalew Tsegahun, Ameha Sebsibe, Tefera Mekonen, Nake Ziku and Agraw Amane (2008). Identified indigenous feed resources and their nutritive value in Menz-Gera district of Amhara Region. In Proceedings of the 3rd Annual Regional Conference on Completed Livestock Research Activities, pp. 1-10, Addis Ababa, Ethiopia.
Luizza, M.W., Young, H., Kuroiwa, C., Evangelista, P., Worede, A., Bussmann, R.W and Weimer, A. (2013). Local knowledge of plants and their uses among women in the Bale Mountains, Ethiopia. Ethnobotany Research and Applications 11: 315-339.
Malcolm, J.R and Zelalem Tefera (2007). Conservation of Afroalpine Areas. The Ethiopian Wolf, Status
Survey, and Conservation Action Plan, pp. 61-63.
Miloradovic, Z., Bugarski, B., Komes, D., Milanovic, J.G., Ivanov, M., Jovovic, D.J and Ihailovic-Stanojevic, N. (2010). Thyme extract improves blood pressure and oxidative stress in spontaneously hypertensive rats. Journal of Hypertension 28: 156.
Mohammed Nasir. (2010). The antmicrobial effect of essential oils on dermatophytes. MSc thesis, Addis Ababa University, Ethiopia.
Niculae, M., Spinu, M., Sandru, C.D., Brudasca, F., Cadar, D., Szakacs, B., Scurtu, I., Bolfa, P and Mates, C.I. (2009). Antimicrobial potential of some Lamiaceae essential oils against animal multiresistant bacteria. Lucrari Stiinufice Medicina Veterinara XLII (1): 170-175.
Nigist Asfaw, Storesund, H.J., Skattebol, L., Tonnesen, F and Aasen, A.J. (2000). Volatile oil constituents of two Thymus species from Ethiopia. Flavour and Fragrance Journal 15: 123-125.
Özgen, U., Mavi , A., Terzi, Z., Kazaz, C., Asçı, A., Kaya, Y and Seçen, H. (2011). Relationship between chemical structure and antioxidant activity of luteolin and its glycosides isolated from Thymus sipyleus subsp. sipyleus var. sipyleus. Records of Natural Products 5(1): 12-21.
Pagiotti, R., Angelini, P., Rubini, A., Tirillini, B., Granetti, B and Venanzoni, R. (2010). Identification and characterization of human pathogenic filamentous fungi and susceptibility to Thymus schimperi essential oil. Mycoses 54: e364–e376.
Parvez, N and Yadav, S. (2008). Ethnopharmacology of single herbal preparations of medicinal plants in Asendabo district, Jimma, Ethiopia. Indian Journal of Traditional Knowledge 9(4): 724-729.
Sebsebe Demissew and Nigist Asfaw. (1994). Some sseful indigenous labiates from Ethiopia. Lamiales Newsletter 3: 5-6.

92 Destaw Damtie and Yalemtsehay Mekonnen
Shewaye Lakew. (2011). Antifungal Substances from Essential Oils. MSc thesis, Addis Ababa University, Ethiopia.
Solomon Abie. (2011). Analysis of the Performance of Local Hybrid Maize Seed Production and Marketing in Marwoled and Goshyie, Womberma and Yilmandensa woreda, Amhara, Ethiopia. MSc thesis, Mekele University, Ethiopia.
Solomon Tesfaye, Yeshambel Belyhun, Takele Teklu, Girmay Medhin, Tesfaye Mengesha, Beyene Petros. (2012). Malaria pattern observed in the highland fringe of Butajira, Southern Ethiopia: a ten-year retrospective analysis from parasitological and metrological data. Malaria World Journal 3(5): 1-8.
Taherian, A.A., Babaei, M., Vafaei, A.A., Jarrahi, M., Jadidi, M and Sadeghi, H. (2009). Antinociceptive effects of hydroalcoholic extract of Thymus vulgaris. Pakistan Journal of Pharmaceutical Sciences 22 (1): 83-89.
Tariku Mekonnen, Afework Bekele and Malcolm, J. (2011). Population Estimates and Diet of Stark’s Hare (Lepus starcki Petter, 1963) in the Bale Mountains National Park, Ethiopia. Journal of the Ethiopian Wildlife and National History Society (Walia Special Edition on the Bale Mountains), pp. 53-60.
Tewodros Eshete, Solomon Gizaw and Eyassu Seifu. (2013). Effect of inclusion of tossign (Thymus serrulatus) in concentrate mix supplementation on performance and sensory quality of meat of Menz sheep. Tropical Animal Health and Production 45:177–184.
Tinsae Bahru, Zemede Asfaw and Sebsebe Demisew. (2010). Variation of indigenous botanical knowledge versus social characteristics between the Afar and Oromo Nations in and around the Semi-Arid Awash National Park. Ethiopian Journal of Agricultural Science and Technology 2(1): 1-13.
Tripathi, A., Upadhyay, S., Bhuiyan, M and Bhattacharya, P. (2009). A review on prospects of essential oils as biopesticide in insect-pest management. Journal of Pharmacognosy and Phytotherapy 1(5): 52-63.
Tsiapara, A.V., Jaakkola, M., Chinou, I., Graikou, K., Tolonen, T., Virtanen, V and Moutsatsou, P. (2009). Bioactivity of Greek honey extracts on breast cancer (MCF-7), prostate cancer (PC-3) and endometrial cancer (Ishikawa) cells: Profile analysis of extracts. Food Chemistry 116(3): 702-708.
Wangchuk, P., Ugyen and Olsen, A. (2008). Vulnerable Medicinal Plants and the Risk Factors for their Sustainable Use in Bhutan. Journal of Bhutan Studies 19: 66-90.
WHO. (1999). WHO monographs on selected medicinal plants. Geneva.
Zuzarte, M., Gonçalves, M.J., Canhoto, J and Salgueiro, L. (2011). Antidermatophytic activity of essential oils. Science Against Microbial Pathogens: Communicating Current Research and Technological Advances 1: 1167-1178.
Ethiop. J. Sci. & Technol. 8(2) 93-106, 2015 93
Multilevel random effect and marginal models for longitudinal data
Bedilu Alamirie EjiguDepartment of Statistics, Faculty of Natural and Computational Science,
Addis Ababa University, EthiopiaEmail: [email protected]
ABSTRACT
In many clinical trials, in order to characterize the safety profile of a subject with a given treatment, multiple measurements are taken over time. Mostly, measurements taken from the same subject are not independent. Thus, in cases where the dependent variable is categorical, the use of logistic regression models assuming independence between observations taken from the same subject is not appropriate. In this paper, marginal and random effect models that take the correlation among measurements of the same subject into account were fitted and extensions on the existing models also proposed. The models were applied to data obtained from a phase-III clinical trial on a new meningococcal vaccine. The goal is to investigate whether children injected by the candidate vaccine have a lower or higher risk for the occurrence of specific adverse events than children injected with licensed vaccine, and if so, to quantify the difference. Moreover, in the paper, ex-tensions for the random intercept partial proportional odds model and generalized ordered logit model which assumes identical variability for different category levels were extended by introducing category specific random terms. This is very appealing to study the association between different category levels. Instead of using the classical logistic regression, Generalized Estimating Equations (GEEs) and random effect models are appropriate when measurements taken from the same subject are not independent. The result reveals that, in both marginal and random effects model, significant difference between the two vaccines were found for pain and redness adverse event.Keywords: Generalized estimating equations, generalized linear mixed models, generalized ordered logit models, meningococcal vaccine, partial proportional odds modelsDOI: http://dx.doi.org/10.4314/ejst.v8i2.4
event outcomes such as pain, redness and irritability over time. In most cases, for ease of recording a stan-dard intensity scale that expresses the level of adverse event is often used and contains a certain number of possible intensity of the symptom. Subjects are then asked to fill in their maximum daily intensity of each reported solicited symptom during the entire solicited symptom follow-up period in the diary card. Based on such scales, one can then establish the vaccine and outcome relationship and test whether subjects inject-ed by the candidate vaccine have a lower or higher risk for the adverse event than subjects injected by the licensed vaccine.This paper will focus on the analysis of repeated cate-gorical measurements concerning solicited symptoms coming from vaccine clinical trials. Specifically, the safety profile of a candidate vaccine for meningococ-
INTRODUCTION
Pharmaceutical companies develop vaccines which contains an agent that resembles a disease-causing microorganism in order to improve immunity to a particular disease. When a company aims to bring a new vaccine product to market, the safety profile of the vaccine is assessed in different ways to ensure that it is safe. In most cases, the clinical safety evaluation of the vaccine is performed regarding two specific as-pects (Bergsma et al., 2013). First, the occurrences of a certain number of local or general symptoms are checked proactively via diary cards recording the oc-currence or absence of the symptom during a certain number of days after the injection. To properly assess the safety profile of the new vaccine, subjects inject-ed with the vaccine are evaluated for different adverse
© This is an Open Access article distributed under the terms of the Creative Commons Attribution License (http://creativecommons.org/licenses/CC BY4.0)

94 Bedilu Alamirie Ejigu
cal disease which is a life-threatening illness caused by strain of bacteria called Neisseria meningitides will be assessed.
Currently different vaccines such as Menactra, Menveo and Mencevax are available against Meningococcal infection (Food and Drug Administration (2014). The safety of the candidate vaccine for meningococcal disease is evaluated by comparing the level of redness, pain and irritability adverse events measured by ordinal scale at each follow up day to the one of a licensed vaccine. We will consider here a four-day follow-up period, the day of vaccination being denoted as day one and taken as a reference day in further analysis. Analysis methods presented hereafter will take the ordinal and correlated nature of the data due to repeated measures from the same subject using two model families: the marginal model family which is characterized by the specification of the mean function and the random effects family that focuses on the expectation conditional upon the random effects studied. The analysis will be done for primarily measured ordinal outcome as well as for the dichotomized outcome. Generalized estimating equations (Liang and Zeger, 1986) from marginal models are usually preferred to evaluate the overall adverse events as a function of treatment group and visiting day. While, in a random effects approach (Berslow and Clayton, 1993), the response rates are modeled as a function of covariates and parameters specific to a subject.
The two model families do not only differ in the ques-tions they address, but also in the way they deal with the dependencies between the observations. This difference way of handling the within child associa-tion leads the two models families for different pur-pose as mentioned by different authors (Laird and Ware, 1982; Agresti, 2002; Fitzmaurice et al., 2004). As a result, interpretations of the regression model
parameters are different. For the partial proportional odds random intercepts model which assume identical baseline variability within the subject being in differ-ent categories of the outcome, extensions that allow to have different random effect variability at each cat-egory proposed.
MATERIALS AND METHODS
Case study: Phase-III clinical trial
The data used in this paper come from a phase III clinical trial evaluating the safety profile of a new vaccine for meningococcal infection. In the study, children with ages from 12 to 15 months are random-ly assigned to the candidate and licensed vaccine with 3:1 ratio, respectively. Children after recruitment in the study were injected with the vaccine at the upper left thigh at day one, and the parents of the children were asked to fill in diary cards indicating whether or not their children experienced either pain, redness, or irritability during the follow-up period of four days (Bergsma et al., 2013). The levels of solicited symp-tom (Pain, Redness, or Irritability) were measured using ordinal scale. Pain and redness were measured only at injection site. Table 1 summarizes defini-tion of solicited adverse event intensities. The data used in this study was collected from 1,880 children, of which 1,381 (73.5%) were assigned to the active treatment group (candidate vaccine for meningococ-cal) and the remaining 499 (26.5%) were assigned to the control group (licensed vaccine). Data from differ-ent children were assumed to be independent, but due to repeated measurements (of same child) over time, correlation is expected to exist. The primarily col-lected data consist of ordinal outcomes Yij for the ob-served solicited symptoms (Table 1) where Yij is the outcome for the ith child (i=1, 2, ... 1,880) at measure-ment day j (j =1, 2, .., 4).

Ethiop. J. Sci. & Technol. 8(2) 93-106, 2015 95
In order to compare the effect of the treatment group at a certain level of intensity with the other level of intensity dichotomization will be done to the outcome variable Yij as follows.
• To model all observed symptom versus no symptom:
Wij = 1 if Yij is ≥ 1 0, otherwise
• Observing at least moderate intensity levels of the symptom versus less than moderate levels:
Xij = 1 if Yij is ≥ 2 0, otherwise
• Severe intensity level of the adverse event versus lower than severe adverse event:
Zij = 1 if Yij is ≥ 3 0, otherwise
Statistical methodology
The types of model for data analysis highly depend on the nature, and measurement scale of the outcome variable. In this study, the level of measurement for the variable of interest is ordinal. Ordinal data are specific forms of categorical data, where the order of the categories is of importance. Models for bina-ry data have been extended to ordinal categorical outcomes (Aitchison and Silvey, 1957; Genter and
Farewell, 1985; Agresti, 2002). Due to repeated mea-surements taken from the same child over time, ob-servations cannot be considered as independent. Thus, in such cases, the use of classical logistic regression model assuming independence of observations taken from the same child may not be appropriate. In the subsequent Sections, appropriate marginal and ran-dom effect models that account for the correlated na-ture of the data will be presented
Marginal models for ordered categorical data
In the marginal models settings, the responses are modelled marginalized over all other responses (Mo-lenberghs and Verbeke, 2005). Generalized estimat-ing equations (GEE) introduced by Liang and Zeger (1986) is an intuitively appealing way to model lon-gitudinal data in marginal models framework. The in-terest in standard GEE focuses on the relationship be-tween the covariates and the probability of response while response correlation is treated as a nuisance pa-rameter. When the response categories are ordered, the use of this ordering yield more parsimoniously parameter-ized models. Further, the resulting odds ratios based on the dichotomized outcome may depend on the cut point chosen to dichotomize the outcome (McCul-lagh, 1980; Hosmer and Lemeshow, 2000). Models
Table 1. Variable Description
Adverse Event Intensity Description
Pain
0 Absent1 Minor reaction to touch2 Cries/protests on touch3 Cries when limb is moved/spontaneously painful
Redness
0 Absent1 Diameter of redness 10 mm2 Diameter of redness 10 - 30 mm3 Diameter of redness 30 mm
Irritability0 Behavior as usual1 Crying more than usual/no effect on normal activities2 Crying more than usual/interferes with normal activities3 Crying that cannot be comforted/interferes with normal activities

96 Bedilu Alamirie Ejigu
subject is assigned to the candidate vaccine and zero otherwise. Dayij has four levels and equal to 1 when response observed at day j for subject i, zero other-wise (day one) taken as a reference day). The parame-ter β’s here have population averaged interpretations. Model (1) assumes an identical effect of the predic-tors for each cumulative probability. Specifically, the model implies that odds ratios for describing effects of explanatory variables on the response variable are the same for each of the possible ways of collapsing the response to a binary variable. Violation of this as-sumption leads to an incorrect model.
In GEE, estimates of the parameter β are obtained by solving the generalized estimating equations
where Ai is a diagonal matrix with the marginal variance (µi)=Var (wi) on the main diagonal and
is the working a correlation matrix that depend on the unknown parameter vector α.
Liang and Zeger (1986) showed that using the meth-od of moments concept, when the marginal mean has been correctly specified and when the mild regulari-ty condition hold, the estimator obtained by solving the score equation (2) is consistent and asymptotical-ly normally distributed with mean β and asymptotic variance covariance matrix var (β). In summary, marginal models for longitudinal data separately model the mean response, and within child association among the repeated responses. The aim is to make inference about the mean response, whereas the association is regarded as nuisance characteristics of the data that must be accounted for to make valid inferences about changes in the population mean response. This separate specification of the mean and within child association has an important implication on parameter interpretation. Since the GEE approach does not specify completely the joint distribution,
that use cumulative probabilities like proportional odds models, adjacent categories logits and Contin-uation ratio logits (McCullagh, 1980; Ananth and Kleinbaum, 1997; Agresti, 2002) are possible choices for modeling ordinal data. Continuation-ratio model is suited when the underlying outcome is irreversible and adjacent-category model designed for situations in which the subject must ’pass through’ one category to reach the next category (Liu and Agresti, 2005) are not used in this analysis. As a result, this paper will focus on ordinal logistic regression models under the GEE modeling framework.
Proportional odds model (POM)
The unique feature of proportional odds model (POM) is that the odds ratio for each predictor is taken to be constant across all possible collapsing of the response variable. When the assumption is met, odds ratios in a POM are interpreted as the odds of being lower or higher on the outcome variable across the entire range of the outcome (Scott et al., 1997). In POM, reversing the direction of the response levels will change the direction of the effects but not their magnitude or significance (McCullagh, 1980; Hosmer and Lemeshow, 2000).Let µijk be the probability of the ith subject at the jth visiting day being in the response category k, µijk=P(yij = k). Further, let the cumulative probability of the response in category k or above be represented by Πijk=P(Yij ≥ k). The lowest outcome which corresponds to a baseline level,
Πij0 = µij0 + µij1 + ...+ µijk =1; Πij1 = µij1 + ...+ µijk ; Πij2
= µij2 + ..+ µijk; Πijk = µijk.
The POM is represented as follows;
logit(Πijk) = β0k + β1jDayij + β2Trti (1) where, k is the level of the ordered category. The parameter β0k is the intercept for category k, usual-ly considered as nuisance parameters of little inter-est (Agresti, 2002). Trti takes the value 1 when the

Ethiop. J. Sci. & Technol. 8(2) 93-106, 2015 97
likelihood-based methods to compare models and to conduct inferences about the parameter are not available. To draw inference in a quasi-likelihood approach, Boos (1992), Rotnitzky and Jewel (1990) illustrate a generalization of score tests for different models including models based on GEE.
Generalized linear mixed models
In many clinical/biomedical researches the longitudinal responses are not necessarily continuous. As a result, the general linear models and general linear mixed models might not apply. Thus, when the longitudinal responses are discrete, Generalized Linear Models (McCullagh and Nelder, 1989) are required to relate changes in the mean responses to covariates. Generalized linear Mixed Models (Berslow and Clayton, 1993) are obtained from GLMs by incorporating random effects into the linear predictors. Such random effect models can account for a variety of situations, including child heterogeneity, unobserved covariates and have conditional interpretation with child-specific effects (Liu and Agresti, 2005). The assumptions made in GLMMs are (i) conditional on the child-specific random effect (bi) and covariates (Dayij, Trti) the distribution of Yij belongs to exponential family (ii) the random effect bi follows a normal distribution with a mean 0 and variance and (iii) conditional on bi the repeated measures Yij are independent. In the context of this case-study, the generalized linear mixed model formulations for ordinal outcomes are presented in the following Subsections.
Random effect models for ordinal outcomes
The unique feature of proportional odds model (POM) is that the odds ratio for each predictor is taken to be constant across all possible collapsing of the response variable (Scott et al., 1997). When proportional odds assumption is met and child
specific parameter estimates are of interest, partial ordinal model (POM) can be easily fitted in random effects modeling framework by introducing random effect terms (bi) specific to child i in model (1). In this model, the ordinal nature of the response is taken into account by considering the cumulative probabilities, 1= Πij0=P(yij) ≥0 ≥ Πij1=P(yij ) ≥ 1 ... ≥ Πijk=P(yij ) ≥ k. The random effect POM is written as follows;
(3) where Πijk is the cumulative probability of the outcome (Yij k) conditional upon other covariates, k is the level of the ordered category, is the intercept for category k, the parameters and
represents conditional log-odds ratios of the grouped categories superior to the cutoff (k) compared to the categories inferior to k, and bi is child specific parameter to the ith child. To relax the strong assumption of identical log-odds ratio for the outcome by the covariate association in POM, partial proportional odds model (PPOM) and generalized ordered logit model (GOLM) have been considered, and can be easily fitted using NLMIXED procedure in SAS.
Partial proportional odds model (PPOM)
When the proportional odds assumption applies to some but not all of the covariates, the partial proportional odds model (4) can be used. In this model only the effect of treatment allowed to vary across the category levels, while the effects of day fixed at each category as done in POM (Model 3).
(4)
where, Πijk is the cumulative probability of the outcome (Yij k) conditional upon other covariates, k is the level of the ordered category, is the

98 Bedilu Alamirie Ejigu
effect of the Dayij at the kth category level of the outcome and measures the log odds effect of the treatment at kth category level of the outcome given children in both treatment groups having identical covariate and random-intercept, bi is child specific parameter to the ith child and is the intercept for category k. The covariates and random effects determine conditional mean Πijk and the regression coefficients can be therefore interpreted as conditional effects of covariates (child-specific), given the random effects bi. For instance, the parameter interpreted as the log odds ratio comparing a child injected with the candidate vaccine with another child injected by the licensed vaccine, both having identical covariate and random-intercept values on the kth category of the outcome.
Generalized ordered logit model (GOLM)
This general model permits to each covariate to have different effect at each category of the outcome. For the ordinal outcome variable Yij with predictors treatment group (Trti) and the measurement day (Dayij), the cumulative log odds are modeled as follows:
(5)
where, Πijk, , and bi have the same meaning as mentioned under model (4), now has also category specific estimate like .
Model (4) is special cases of model (5) when the effect of day is similar at each category. The disadvantage of model (5) is the larger number of parameters to be estimated as compared with previous one. But, this higher in number of parameter cannot be considered as a disadvantage in a situation when model (5) better fits the data.
Relationship between marginal and random effect model parameters
Zeger et al. (1988) derived an approximate relation-ship for the population averaged parameters (from GEE) and subject specific parameters with random effect in the linear predictor given by:
(6)
where and are parameter estimates based on random effect and marginal models, respective-ly. is the variance of the random intercepts and,
. Hence from this relationship it is clear that conditional effects are usually larger than marginal effects, and increase as the variance increase.
The estimated standard deviation ( ) for the random intercept model is used as a summary of heterogeneity for the study population. The estimated standard deviation ( equal to zero implies that the random intercept proportional logistic model (3) simplifies to a simple proportional logistic regression model treating all observations as independent. The size of estimated variance used to determine the scale on which the fixed effects should be judged. Moreover, the random part can be interpreted using measures of dependence. This is due to the fact that, unobserved heterogeneity between subject induces within subject dependence. Thus, in logit random intercept model, correlation ( of the latent responses at any two occasion i and j given by
(Fitzmaurice et al., 2009).
Proposed Extensions
Random effect models for ordinal outcome proposed by Harville and Mee (1984), Jansen (1990), Ezzet and Whitehead (1991) are restricted only to one random effect for all category. The

Ethiop. J. Sci. & Technol. 8(2) 93-106, 2015 99
RESULTS OF THE CASE STUDY
Recall that the aim of the study is to test whether there is a difference between the candidate and li-censed vaccine in terms of percentage of children’s who showed any level of solicited symptom (Pain, Redness, Irritability) taking into account the correlat-ed nature of the data, and if there is a difference, to describe how does this difference between treatment groups develops over time.
Marginal models
When the responses are ordinal the usual test of independence ignores the ordering information to test whether there is association between the response and treatment. To test the general association between the two treatment groups and their response at the end of the study, a general Cochran-Mantel-Haenszel statistics had been performed and significant (p-value=0.001) result was obtained. The assumption of proportional odds (identical log odds ratios across different categories) was tested using score test and significant result was observed (x2
(8)= 34.07, p-value=0.0001). Furthermore, from a separate analysis, it was found that the effect of the candidate vaccine on the outcome vary across different categories (Table 2) which is an indication for the violation of proportional odds assumption.
Therefore, drawing valid inference based on parameter estimates obtained by fitting model (1) may not be valid. For instance, based on POM, subjects injected with the licensed vaccine are 1.30 (1/0.77) times more likely to show pain adverse event than subjects injected with the candidate vaccine controlling other factors. While, based on a separate analysis, this odds ratio increases to 1.56 (1/0.64) and 3.03 (1/0.33) to observe at least moderate and severe intensity levels of pain, respectively (Table 2). Since the procedure PROC GENMOD in the current
question is why we assume only one and similar random effect for different categories? To overcome such problems, we extend models (3) and (4) which assume identical baseline variability within the child being in either of the categories, by allowing to have different random effects at each category.
(7)
where is the random intercepts for each cate-gory of the model and the vector of these random effects assumed to follow a multivariate normal dis-tribution with mean vector zero and (co)variance matrix D (i.e. bik N (0,D)).
(8)
where D is k x k general covariance matrix with elements drs. The elements of the matrix, drs represents the (co)variance between bir and bis (r=1, 2, 3; s=1, 2, 3).
The advantage of the extended model over model (3) and (4) is that, it enables us to study the association between different category levels using bik covariance matrix. All the considered random-effects models are fitted by maximization of the marginal likelihood, obtained by integrating out the random effects. Since the likelihood function does not have a closed form in this case, model fitting is not an easy task. Numerical approximations will be used (Molenberghs and Verbeke, 2005) to maximize the marginal likelihood. In GLMMs, although in practice one is usually primarily interested in estimating the parameters in the marginal distribution for Yij, it is often useful to calculate estimates for the random effects bi as well. They reflect between-child variability, which makes them helpful for detecting special profiles (i.e. outlying individuals). Moreover, estimates for the random effects are needed whenever interest is in prediction of child-specific evolutions.

100 Bedilu Alamirie Ejigu
version of SAS 9.2.1 does not allow to deal with partial POM and GOLM in the marginal modelling framework, model (4) and model (5) will be fitted using NLMIXED procedure in SAS. Hence, analysis
for a more general ordinal model that allow the effect of the vaccine to vary across different category levels as needed will be done under Section 3.2 in the random effects model framework.
Table 2. Estimated odds ratio for the candidate vaccine at different level of intensity.
Modeled Level of Intensity
All Moderate Severe POM
Adverse Event OR 95%CI OR 95%CI OR 95%CI OR 95%CI
Pain 0.86 (0.72,1.02) 0.64 (0.52,0.80) 0.33 (0.21,0.54) 0.77 (0.65,0.91)
Redness 0.77 (0.66,0.91) 0.70 (0.54,0.91) 0.96 (0.58,1.59) 0.75 (0.64,0.88)
Irritability 0.86 (0.72,1.02) 0.78 (0.58,1.03) 0.79 (0.46,1.36) 0.85 (0.72,1.02)
Figure 1. Percentage of solicited symptoms by treatment group at each visiting day

Ethiop. J. Sci. & Technol. 8(2) 93-106, 2015 101
Generalized random effect models
In this section results based on an alternative ap-proach using child (cluster) level terms in the model will be discussed. Given the discrete nature of time varying covariate (day) a random intercept model which adjusts only the intercept but does not modify the fixed effects was considered.
Random effect models for ordinal outcomes
The assumption of proportional odds across different categories was tested using the likelihood ratio test, by comparing model (3) with model (4) and model (5). In line with the marginal model results, the test suggests that, proportional odds assumption was not satisfied (p-value=0.0015). Therefore, partial propor-tional odds model (4) and generalized ordered logit model (5) were fitted for the ordered outcomes. The estimated OR’s with their respective 95% CI ob-tained by fitting model (3), model (4) and model (5) are summarized in Table 3. The results showed that,
when we fitted the extended model (7) in the case of PPOM using category specific random effect terms, over model (4) which assumes only the same baseline variability at each category, the difference between the two treatment groups increase for high cutoff points (Table 3).
For instance, based on model (4), the odds ratio comparing a child injected with the candidate vaccine with another child injected by the licensed vaccine, both having identical covariate and random-intercept values at 3rd category of the outcome is 0.329, while based on model (7) it is 0.065. The results for the fixed effect parameters from the three models generally agree in terms of indicating children injected with candidate vaccine are less likely to show at least moderate and severe intensity levels of pain as indicated by less than one odds ratio (Table 3). Since, the 95% CI does not include one for the effect of treatment at category one and three, this differences between
Table 3. Maximum Likelihood Estimates and Approximate 95% Confidence Intervals for PPOM based on model (4), and model (5) and GOLM with random intercept for pain adverse event
Model (4) Model (5) Model (7) for PPOMParameters OR (95%CI) OR (95%CI) OR (95%CI)
Fixed Effect: Odds Ratiosβ21 Treatment at category 1 0.750 (0.561, 1.003) 0.751 (0.562, 1.001) 0.765 (0.545,1.073)β22 Treatment at category 2 0.513 (0.367, 0.719) 0.523 (0.371, 0.732) 0.401 (0.239,0.672)β23 Treatment at category 3 0.329 (0.188, 0.576) 0.344 (0.198, 0.593) 0.065 (0.015,0.292)Random Effects: Variances
Var(bi) 5.46 5.55
Var(bi1) 7.618
Var(bi2) 12.710
Var(bi3) 40.468
Treatment at category k (k =1,2,3) refers OR of the candidate vaccine on outcome category k

102 Bedilu Alamirie Ejigu
the two treatment groups are statistically significant at 5% level of significance. Approximately, similar residual intra-class correlation was obtained for the latent responses and was estimated as 0.63 (
for both model (4) and model (5).
Extensions for random effect models with ordinal outcomes
Even though, it is very computationally intensive due to the increased number of random effects, to allow different category specific random terms and to study the association between category levels, the extended model (7) is fitted for pain adverse event. A significant (p-value=0.001) positive association ( = 0.33) between the first and the second category level random effects was observed from the estimated (co)variance matrix. This suggests that the correlation between the first category (all intensity levels of pain) and the second category (at least moderate intensity levels of pain) for child i at visiting day j less or equal to the correlation between the two random effects (
= 0.33). While, since the third random effect term is independent (with p-value ≥ 0.39) with the first and the second category level random effects term, significant association between severe intensity level with the other category levels were not observed. The estimated random effects (co) variance matrix which reflects the baseline heterogeneity between children at each category of the outcome is given by the following matrix (* refers significantly different from zero at 5% level of significance).
The variability between children at severe intensity level of pain ( =40.468) is higher as compared with the variability observed in at least moderate ( =12.71) and all intensity levels of pain (=7.618).
This relatively large baseline heterogeneity between children implies that, there is substantial category specific variability in the propensity to experience a certain levels of adverse event. For instance, approx-imately 95% of the children have a baseline risk of showing at least moderate levels and severe level of pain symptoms that vary from (0.007% to 98.83%) and (0% to 99.86%), respectively. Based on the es-timated category specific variance of the random in-tercepts, the estimated intraclass correlation for the latent responses becomes 0.70, 0.79 and 0.93 at cat-egory one (all), category two (at least moderate) and category 3 (severe), respectively.
DISCUSSION
In this paper, marginal and random effect models were used to analyze repeated categorical measure-ments concerning solicited symptoms coming from vaccine clinical trials. In case of marginal models the correlated nature of the data is acknowledged in-side the estimating equation, while for random effects model it is done through the random effect part. Even though, both the considered marginal and random effect models are extensions of generalized linear model (McCullagh and Nelder, 1989), the different way of accounting within child association has a con-sequence for the interpretation of the regression mod-el parameters. In the random effect approach the goal is to determine child specific changes in the risk of observing solicited symptoms over the courses of the study, while in the marginal model the emphasis is to determine the overall change.
To fix ideas, let us reconsider the estimated effect of the candidate vaccine under different random effect model formulation (Table 4).
The estimated treatment effect 0.449 and 0.162 from the random effect model describes how the odds of observing at least moderate and severe levels of pain

Ethiop. J. Sci. & Technol. 8(2) 93-106, 2015 103
increase for any child treated with the candidate vac-cine. Note that, the same odds ratio is significant across both the random effects model and marginal models, but the magnitude of the effect can differ.
Therefore, the answer for the question “how the can-didate vaccine is beneficial?” will depend on whether the interest is in its impact on the study population or on an individual drawn from that population. The es-timated treatment effect difference from the marginal model somewhat smaller than the estimated treatment effect from random effect model (equation 6), and this discrepancy becomes high when the estimated variance for the random intercept based on the ran-dom effect models becomes large. These differences in the estimated coefficients and odds ratios are due to different interpretations of in the two model fami-lies, which are these two classes of models estimate parameters that address substantively different ques-tions. More precisely, the estimates of fixed effects of the treatment in model (5) describe the effect of the treatment on a specific child to observe solicit-ed symptom. While, the corresponding effects in the
Table 4. Summary of estimated odds ratios (95%CI) of the candidate vaccine based on random effects model for the three adverse events
Fitted Adverse Modeled intensity level of adverse event AIC
Model Event All Moderate Severe
Model (4) Pain 0.75(0.56,1.00) 0.51(0.37,0.72) 0.33(0.19,0.58) 10266
Redness 0.61(0.46,0.79) 0.61(0.43,0.85) 1.22(0.68,2.18) 11472
Irritability 0.76(0.53,1.09) 0.78(0.51,1.22) 0.80(0.41,1.53) 10355
Model (5) Pain 0.75(0.56,1.00) 0.52(0.37,0.73) 0.34(0.20,0.59) 10261
Redness 0.60 (0.45,0.79) 0.61(0.43,0.86) 1.21(0.67,2.17) 11334
Irritability 0.76(0.52,1.09) 0.79(0.51,1.23) 0.80(0.42,1.53) 10270
Modela(7) Pain 0.77(0.55,1.07) 0.40(0.24,0.67) 0.07(0.02,0.29) 10087
Modelb (7) pain 0.77(0.56,1.07) 0.38(0.22,0.68) <0.01(0.00,0.003) 10029
AIC=Aikakes Information Criterion, Modela (7)=non-proportional odds only for treatment, Modelb (7)=non-proportional odds for both treatment and visiting day
marginal model (1) describe the effects of treatment on the prevalence of observing solicited symptom in the population of children injected by the candi-date vaccine. The approximate relationship between the two model parameters mentioned in Section 2.3 highlights how the parameters estimates for margin-al model are attenuated relative to the corresponding fixed effects in model (5).
If the interest is to model the heterogeneity among children and to draw likelihood based inferences, we prefer to fit random effect models over GEE. In ran-dom effects model, each child is assumed to have its own level of adverse event. Thus, it is well known that fixed effects parameters do not maintain their in-terpretation when random effects are introduced in the model. Therefore the fixed effects odds ratio no lon-ger is an odds ratio between any two children as men-tioned by Zeger et al. (1988).Among the considered models that account the ordi-nal nature of the data, the extended model (7) with category specific random terms better fits the data (Table 5) for pain adverse event.

104 Bedilu Alamirie Ejigu
Further, since the considered random effects model accounts only baseline heterogeneity, it is also possible to extend those models by introducing visiting day specific random effects bij, where bij is the random effect for subject i at occasion day j (j =1 to 4) and vector of bij follows a multivariate normal distribution with mean vector 0 and (co)variance matrix D. But, in practice, when the number of visiting days increases, it is difficult to introduce more than few random effects due to computational intensive integration methods. Even the result presented in Table 4 for modela(7) and modelb(7) with three random effect terms took approximately 470:18 hour and 774:37 hour on 2.5GHz PC, respectively. Moreover, NLMIXED procedure fails to integrate the likelihood for less than 20 quadrature points. Among the considered optimization techniques (Levenberg-Marquardt Method, Newton-Raphson, Trust-Region Method), all the presented parameter estimates were obtained using Newton-Raphson optimization techniques.
CONCLUSION
Both marginal and random effect modeling approaches provide similar conclusions about the significant difference between the two vaccines. A significance difference between the candidate and licensed vaccine in terms of percentage of children who showed at least moderate and severe intensity levels of pain, all and at least moderate intensity levels of redness were found in both modeling
approaches. The difference between the two treatment groups become high for severe intensity level of pain as compared with the other intensity levels of solicited symptoms. In both marginal and random effect models, significant difference between the two treatment groups were not found for all intensity levels of pain symptom and severe intensity level of redness. Further, in all analyses, significant difference was not observed between the two treatment groups for all, at least moderate and severe intensity levels irritability. Moreover, non-significant interaction effect in all the considered adverse event models implies that, the difference between the two treatment groups can be considered constant over the follow-up period. In addition to this, the extended models better fits the data than the existing methods.
REFERENCES
Agresti, A and Liu, I. M. (1999). Modeling a categorical variable allowing arbitrarily many category choices. Biometrics 55:936-943.
Agresti, A. (2002). Categorical Data Analysis, (2nd edition). New York: Wiley.
Aitchison, J and Silvey, S. D. (1957). The generalization of probit analysis to the case of multiple responses. Biometrika 44:131-140.
Ananth, C.V and Kleinbaum, D. G. (1997). Regression models for ordinal responses: A review of methods and applications. International journal of Epidemiology 26:1323-1333.
Table 5. Summary of Goodness of fit measures for the fitted ordinal random effect models for pain adverse event
Measure One Random effect Based on extended models(Three random effect)
POM PPOM GOLM POM PPOM GOLM-2loglik 10250 10246 10229 10069 10057 10029No. Parameters 8 10 16 13 15 21AIC 10275 10266 10261 10095 10087 10071R2
ms 0.430 0.431 0.433 0.450 0.450 0.453

Ethiop. J. Sci. & Technol. 8(2) 93-106, 2015 105
Bergsma, W.P., Aris, E. M. D and Tibaldi, F.S. (2013). Linear categorical marginal modeling of solicited symptoms in vaccine clinical trials. Statistics in Biopharmaceutical Research 5: 27-37.
Boos, D. (1992). On Generalized score tests. American Statistician 46: 327-333.
Diggle, P. J., Heagerty, P. J., Liang, K. Y and Zeger, S. L. (2002). Analysis of Longitudinal Data (2nd edition). Oxford: Oxford University Press.
Fitzmaurice, G. M. (1995). A caveat concerning independence estimating equations with multiple multivariate binary data. Biometrics 51: 309-317.
Fitzmaurice, G. M., Laird, N. M and Ware, J.H. (2004). Applied Longitudinal Analysis. John Wileyand Sons, Inc., Hoboken, New Jersey.
Fitzmaurice, G., Davidian, M., Verbeke, V and Molenberghs, M. (2009). Longitudinal Data Analysis: Handbooks of Modern Statistical Methods. Chapman and Hall/CRC
Food and Drug Administration (2014). www.fda.gov/.../BiologicsBloodVaccines/Vaccines/ ./UCM201349.pdf.
Frees, E.W. (2004). Longitudinal and Panel Data: Analysis and Application in the Social Sciences. Cambridge University Press.
Genter, F. C and Farewell, V. T. (1985). Goodness-of-link testing in ordinal regression models. Canada Journal of Statistics 13: 37-44.
Klaus Larsen, K., Petersen, H.J., Jorgensen, B.E and Endahl, L. (2000). Interpreting parameters in the logistic regression model with random effects. Biometrics 56: 909-914.
Laird, N. M and Ware, J. H. (1982). Random-effects models for longitudinal data. Biometrics 38: 963-974.
Lin, K. C. (2010). Goodness of fit tests for modeling longitudinal ordinal data. Computational Statistics and Data Analysis 54:1872-1880.
Liu, I and Agresti, A. (2005). The Analysis of Ordered Categorical Data: An overview and a survey of recent developments. Sociedad de Estadistica e Investigacion Operativa Test. 14:1-73.
McCullagh, P and Nelder, J.A. (1989). Generalized Linear Models, 2nd Edition, and London: Chapman and Hall.
Molenberghs, G and Verbeke, G. (2005). Models for Discrete Longitudinal Data. New York: Springer-Verlag.
Nick, R.P., Matthew, L.C., Juul, A and Nigel, S. (2009). Repeated measures proportional odds logistic regression analysis of ordinal score data in the statistical software package R. Computational Statistics and Data Analysis 53:632-641.
Pollard, A. J and Maiden, M. C. J. (2001). Meningococcal Vaccines: Methods and protocols. Humana Press.
Rotnitzky, A and Jewell, N. P. (1990). Hypothesis testing of regression parameters in semi-parametric generalized linear models for cluster correlated data. Biometrika 77:485-497.
SAS Institute Inc. 2008. SAS/STAT 9.2 Users Guide. Cary, NC: SAS Institute Inc.
Scott, S.C., Goldberg, M.S and May, N. E. (1997). Statistical assessment of ordinal outcomes in comparative studies. Journal of Clinical Epidemiology 50:45-55.
Verbeke, G. and Molenbergs, G. (2000). Linear Mixed Models for Longitudinal data. Spring-er-Verlag, Berlin.

106 Bedilu Alamirie Ejigu

Ethiop. J. Sci. & Technol. 8(2) 107-120, 2015 107
Thermal analysis of shell and tube heat exchangers using artificial neural networks
Ananth S. IyengarM.S.Ramaiah University of Applied Sciences
#470-P, Peenya Industrial Area, Peenya 4th Phase, Bengaluru, Karnataka, India Email: [email protected]
ABSTRACTThe shell and tube heat exchangers are most commonly used industrial equipment to transfer heat from one fluid to another. The design process is specified by Tubular Exchanger Manufacturers Association (TEMA). The initial de-sign has to be iteratively optimized for increasing the heat transfer, minimize the pressure drop and reduce the fluid pumping power. LMTD method is chosen for its simplicity and quick analysis. The design procedure if approached by Finite element method, needs high computing power and tedious to converge. A feed-forward artificial neural network is set up to simplify the iterative nature of the design process. This also gives the necessary quick design iteration cycles to reach the optimized design. A design space is created with heat exchanger parameters, and the feed forward network is trained with semi-empirical data. The trained network is used in the design performance evaluation. This approach shows promise of quick design changes and can accommodate variable thermo-physical properties of fluids, and can be trained for different fouling patterns in the heat exchangers from real time data. The neural network can predict the steady state performance within the design space and results match well with LMTD calculations. Subse-quent to the steady state analysis, dynamic modeling is attempted. A neural network method is used to reduce the com-plication of the model. Simplified mathematical model is used initially to train the network. It is found that the feed forward networks can predict the dynamic behavior, but it needs additional parameters to improve its predictions.
Keywords: Shell and tube heat exchanger, feed forward, artificial neural network DOI: http://dx.doi.org/10.4314/ejst.v8i2.5
INTRODUCTION
Efficient transfer of heat between two non-mixing fluid streams is a basic requirement in many pro-cess industries. Heat exchangers are proven choice for heat transfer between liquids, gases and their multiphase mixtures. The heat exchangers also can be used either to condense a vapor stream or to va-porize a liquid stream. Among the various types of heat exchangers, shell and tube heat exchangers are the most commonly employed devices in industries. The thermal characteristics of such a heat exchang-er depends on the tube side design, shell design, the thermo-physical properties of fluids, and the phase change during heat transfer if any. Tube design in-cludes choice of tube dimensions and number, tube material, arrangement of tubes. The design param-eters are chosen to accommodate the steady and
© This is an Open Access article distributed under the terms of the Creative Commons Attribution License (http://creativecommons.org/licenses/CC BY4.0)
unsteady heat transfer processes during the regular working of the heat exchanger. Other consideration during the initial design includes the fouling factor that tends to reduce the heat transfer rate between fluids.There are two common methods of steady state heat exchanger design namely, Log Mean Tempera-ture Difference (LMTD) method and Effectiveness ‒ Number of Transfer Units (ε-NTU) technique. LMTD method is an iterative process that involves recalculation of design steps to get the best over-all design. Although LMTD method is simpler, it involves several challenges such as complicated geometries like finned tubes, fouling patterns and phase change. These complications can be simpli-fied using some common assumptions in the shell and tube heat exchanger design:

108 Ananth S. Iyengar
• constant thermo-physical fluid properties,
• semi-empirical correlations for complex flow patterns in the shell flow streams
• Negligible heat loss from the shell to
environment
Accurate design optimization of heat exchangers is in particular more mathematically involved and time consuming process. A quick optimization rou-tine that can be further improved to include the re-al-time data is needed. Artificial Neural Network (ANN) can be used for thermal design optimization of heat exchangers. This paper implements simple feed-forward ‒back-propagation technique to heat exchanger thermal design.
The aim of the thermal design of heat exchangers is to calculate the heat transfer area. The heat transfer area is the outer tube surface. This area can be cal-culated by the number of tubes, the tube diameters.
The heat transfer also is dependent on the shell pa-rameters like shell diameter, tube spacing, length of heat exchanger. Figure 1 shows some of these param-eters, and in this research we investigate the accuracy of artificial neural networks compared to the kern’s method routinely used in the thermal design of heat exchangers.
Artificial neural networks in thermal design
The design and prediction of heat exchanger be-havior are too complicated to mathematically mod-el and solve using analytical solution. Closed form solutions are available only in situations where the model has several simplifying assumptions (Gvozdenac and Mitrovic, 2012). Heat exchanger design based on these assumptions has errors that make the prediction of thermal behavior challeng-ing. The design challenges are multiple objectives with several constraints to be fulfilled simultane-ously. Advanced mathematical techniques such as
Figure 1. A two pass shell and tube heat exchanger (adapted from Wikipedia.org)
Baffle spacing
Tube velocity
Tube diameter Tube pitch

Ethiop. J. Sci. & Technol. 8(2) 107-120, 2015 109
regression, simulated annealing, genetic algorithms and neural networks are being employed to solve these multi-objective design problems. Artificial Neural Networks (ANN) is a network of simple functional nodes that can correlate the inputs to the outputs for complicated mathematical model in most engineering situation. The heat exchang-er performance calculation and control of dynamic behavior requires the temporal prediction of fluid properties, fluid flow behavior and surface proper-ties of solid boundaries. The use of ANN either as a single network or network of networks can ac-complish this as a ‘black box’ approach, with all the network constants and connections hidden from user. The recent increase in the use of ANN for thermal design is due to its simplicity and versatil-ity.
ANN as a mathematical tool is employed in a va-riety of heat exchanger related solutions. It is used in thermal performance prediction for compact heat exchangers (Tan et al., 2003), performance of cross flow heat exchanger (Gerardo et al., 1999), dynam-ic prediction and control of heat exchanger (Wolff et al. 1991), dynamic prediction and control of heat exchanger networks (Gerardo et al., 2001), pre-diction of fouling factor (Riverol and Nepolitano 2005), heat rate prediction (Pacheco et al. 2001), prediction and control of non-linear heat exchang-er process (Jalali et al., 2004; Vasičkaninováet al., 2011), heat exchanger functional control based on fuzzy model (Duran et al., 2008), and cost estima-tion of shell and tube heat exchangers (Costaa and Queiroz, 2008). ANN algorithms is used to mini-mize the thermal exchange surface (Ponce-Ortega et al., 2009), other researchers have reported the use of genetic algorithm in the design of shell-and-tube heat exchanger (Selbaşet et al., 2006). In this paper, ANN is used to predict the heat exchanger steady state behavior after the conventional design process.
Feed forward neural networks
Feed forward neural network is one of the many available mathematical goal seeking or optimiza-tion programs. The mathematical setup consists of interconnected virtual or artificial neurons. In Fig-ure 2there are three columns of neurons. Towards the left there are four input neurons corresponding to the four input parameters chosen. The middle column is the hidden set neurons that can act as a combined function connecting the input neurons to output neurons. The output neurons are three in number showing the three design calculated val-ues. All the neurons, input, hidden and output have a threshold value and a function associated with it. The connections between the artificial neurons depicted by arrows have weight associated with them. The Feed forward back propagation meth-od will train the predetermined set of neurons and connections to have a particular value for the neu-ron threshold and weights of the connections. This training of network is based on the set of training data set provided to the ANN. The trained network now is capable of predicting the pattern in the in-put signals and provides the required outputs based on the patterns in the inputs. In the current research, the input data consists of velocity, baffle distance, pipe thickness and tube pitch. The set of output pa-rameters are overall heat transfer coefficient, pres-sure drop in pipes and pressure drop in shell. Ideal-ly the training data set is to be measured using data loggers from a working heat exchanger. But for this study, correlations in Kern’s method are used for training set of data. The training data set consisted of 1080 data points. The ANN program was setup on a personal computer and it was possible to train the program for this moderate training data with the resources available. The trained data set was then used for intermediate values from the input parame-ter values and found to be good agreement.

110 Ananth S. Iyengar
The project was implemented using a JAVA code titled ENCOG available under GPL license at Hea-ton Research. ENCOG contains several neural net-work codes including genetic algorithm, simulat-ed annealing and feed forward network. The feed forward network code is given below that shows the scaled input vector and the function The actual JAVA program is given below, suitable comments are provided in the code snippet to show the steps in the ANN training and testing procedure.
packageorg.encog.examples.neural.xor;
importorg.encog.Encog;importorg.encog.engine.network.activation.ActivationSigmoid;importorg.encog.ml.data.MLData;importorg.encog.ml.data.MLDataPair;importorg.encog.ml.data.MLDataSet;importorg.encog.ml.data.basic.BasicMLDataSet;importorg.encog.neural.networks.BasicNetwork;importorg.encog.neural.networks.layers.BasicLayer;import org.encog.neural.networks.training.propagation.resilient.ResilientPropagation;
public class HexDesign4 { /** * The Heat Exchanger design based on LMTD method. Idea is to also include the * actual data to predict the dynamic behavior, and finish the network of * networks concept. */ /* DBL data for the hyperbolic tan results */
public static double XOR_INPUT[][] = {{1,0.6,0.6,0.8}, {0,0.8,0.6,0.8}, {0.2,0.8,0.6,0.8}, {1,1,0,1}};
Figure 2. Schematic of a feed forward neural network
public static double XOR_IDEAL[][] = {{0.2553269181,0.8829513006,0.0397375121}, {0.3510574885,0.0176696858,0.0012199421}, {0.3097410109,0.8288364047,0.0819828444}};
/** * The Test data necessary for XOR. */ public static double XOR_TEST[][] = {{1,0.6,0.6,0.8}, {0,0.8,0.6,0.8}, {1,1,0,1}};
public static void main(final String args[]) {
// create a neural network, without using a factory BasicNetwork network = new BasicNetwork(); // create input nodes // created // created 4 input nodes (velocity,pipethickness,bafflespacing,tube pitch) // created 6 hidden nodes // created 3 output node(U_overall, Tube prdrop,Shellpr drop) network.addLayer(new BasicLayer(null, true, 4)); // create hidden nodes network.addLayer(new BasicLayer(new ActivationSigmoid(), true, 6)); // create output nodes network.addLayer(new BasicLayer(new ActivationSigmoid(), false, 3)); network.getStructure().finalizeStructure(); network.reset();
// create training data MLDataSettrainingSet = new

Ethiop. J. Sci. & Technol. 8(2) 107-120, 2015 111
BasicMLDataSet(XOR_INPUT, XOR_IDEAL); MLDataSettestingSet = new BasicMLDataSet(XOR_TEST, XOR_IDEAL);
// train the neural network finalResilientPropagation train = new ResilientPropagation(network, trainingSet);
int epoch = 1;
do { train.iteration(); System.out.println(“Epoch #” + epoch + “ Error:” + train.getError()); epoch++; } while (train.getError() > 0.001);
// test the neural network System.out.println(“Epoch #” + epoch + “ Error:” + train.getError()); System.out.println(“\n”); System.out.println(“Neural Network Validation:” + “\n”); for (MLDataPair pair : trainingSet) { finalMLData output = network.compute(pair.getInput()); //System.out.println(output.getData(0));// + “,” + output.getData(1)); } System.out.println(“\n” + “Neural Network Results:” + “\n”); for (MLDataPair pair : testingSet) { finalMLData output = network.compute(pair.getInput()); System.out.println(output.getData(0) + “,” + output.getData(1)+ “,” + output.getData(2)); }
Encog.getInstance().shutdown(); }
}
THERMAL DESIGN OF SHELL AND TUBE
HEAT EXCHANGER
Heat exchanger design is extensively discussed in Kakac and the neural networks approach for the thermal system design is given in Jaluria. ANN be-ing an advanced mathematical tool helps us quickly optimize the designs. The choices during the initial design have to satisfy the allowable pressure drop requirements. The shell design involves the baffle shape and number, shell clearances that accommo-date the shell-side pressure drop and pumping pow-er requirements. Thermal design based on LMTD
method of shell and tube heat exchangers can be accomplished by two methods namely the Kern’s method and the Bell Delaware method. The funda-mental steps in both these methods remain the same with differences in the design calculations for shell side fluid flow. In the Kern’s method, simple cor-relations are assumed for the shell side heat transfer and fluid flow. In reality the shell side fluid flow is more complicated due to the cross flow, baffle win-dow flow, flow in the baffle-shell region, and bun-dle-shell bypass streams. Separate correlations are to be used to account for these complex flow pat-terns that affect the thermal characteristics of the designed heat exchanger. Bell - Delaware meth-od is especially necessary in the case of two phase flow on the shell side flow. For this study the Kern’s method is employed because the chosen problem from the literature (Rajiv, 1998) does not contain two phase flow. As it can be observed from the lat-er sections of this paper, the choice of the method does not affect the results from the artificial neural network and Bell-Delaware technique can be easily incorporated into the thermal analysis without ma-jor modification to the overall design approach. The brief steps in Kern’s method are given in the subse-quent sections for completeness.
Several assumptions are made in the steady state
analysis and transient analysis:
• In both steady state and transient analysis, no heat loss from the shell
• No phase change either in steady state or transient analysis
• Flow rate remains constant in both cases, temperature rise is imposed in the transient
analysis
Design problem from literature
Table 1 shows the design parameters taken from one of the design case study from literature (Rajiv, 1998).

112 Ananth S. Iyengar
The data from the reference is converted to SI units and reproduced in table 1 for completeness. Since the aim of the present paper is the validation and checks the prediction capability of artificial neural networks, an already validated thermal design data sample was selected and the prediction from the ANN was com-pared to the existing design solutions.The data for the ANN is prepared using design of ex-periments process for 4 input parameters namely, ve-locity of the fluid in the tubes, tube thickness, ratio of baffle spacing to shell diameter and ratio of tube pitch to tube outer diameter. The total discharge of fluid on the tube side remains constant, by having different ve-locity values, the number of tubes varies. This change in the number of tubes indicates the diameter of tubes change. All the above parameters were chosen be-cause of their direct influence on the performance of the shell and tube heat exchangers. The values for the above 4 input parameters were first calculated from the design data available from the literature are given in table 1. The outer diameter of the tubes is assumed
Table 1. The specification of heat exchanger
Parameters Shell side Tube side UnitsFluid type Crude oil Heavy gas oil ---Flow rate 77 111.064 kg/sTemperature(in/out) 227 / 249 302 / 275 ᵒCOperating pressure (abs) 28.848 13.251 kPaAllowable pressure drop 1.223 0.713 kPaFouling resistance 0.0006 0.0005 s m2 K/JViscosity 0.664/0.563 0.32/0.389 centi PoiseDesign pressure 44.852 17.329 kPa
to be 26 X 10-3 m (26 mm) and the inner diameter of the tubes is altered to get the desired thickness of tubes. Similarly, other parameter value variations were based on calculations of Kerns method. The total number of design calculations with the data shown in the table 2 is 1080, which is the number of training data available for the ANN routine.The specific heat values and the thermal conductivi-ty values were calculated with the following formu-lae given in Mansure and Speight, respectively. The correlations are given below,
(1)
where, is the specific heat of oil, is the
specific gravity of the oil and is the temperature
in ᵒC
(2)
where, is the thermal conductivity of oil, is the specific gravity of the oil and is the tem-perature in ᵒF
Table 2. Training data set design of experiments
Parameters Data values UnitsTube flow velocity 0.9, 1.2, 1.6, 2, 2.4 m/sTube thickness 1.5, 1.7, 1.9, 2.1, 2.3, 2.5 X 10⁻³ m
Ratio of baffle spacing to shell diameter 0.15, 0.2, 0.25. 0.3, 0.35, 0.4 ---
Ratio of tube pitch to tube outer diameter 1.25, 1.3, 1.35, 1.4, 1.45, 1.5 ---

Ethiop. J. Sci. & Technol. 8(2) 107-120, 2015 113
DESIGN OF EXPERIMENTS PARAMETER
VALUE
Kerns method of heat exchanger design
Figure 3. The cross section of a shell and tube heat exchanger showing the pitch, flow direction of the shell side fluid, and the tube pitch
In the shell and tube heat exchanger, it is better to reduce heat loss by passing the hot fluid through the tubes while the cold fluid absorbs heat on the shell side. Using the energy balance equation and the de-sign heat duty we first verify the given data is record-ed at steady state operation. The simple Kern’s meth-od of design of heat exchangers starts with the choice of the tubes. The inner or outer diameters and the thickness are first assumed and the number of tubes is fixed based on the designed mass flow rate and the velocity of the fluid flow in the tubes. Subsequently the tube side Reynolds number and Prandtl number is calculated.
(3)
(4)
(5)
From these calculations Nusselt number for the fluid flow inside the tube can be calculated using
Petukhov ‒ kirillov correlations as shown below. The Reynolds number and Prandtl number range for these equations are 104< < 5 x 10⁶ and 0.5 < < 2000.
(6)
where, (7)
The heat transfer coefficient on the inside of the tube can be calculated using the Nusselt number.
(8)
Shell-side calculations can now begin by first finding the cross flow equivalent diameter (hydraulic diame-ter) at the diameter of the shell. The equivalent diam-eter is given by:
(9)
For triangular arrangement of tubes the equivalent
diameter is given by
(10)
Using the equivalent diameter we can calculate the Reynolds number on the shell-side fluid flow as shown below

114 Ananth S. Iyengar
(11)
(12)
The shell-side area perpendicular to the fluid flow (area of heat transfer) can be calculated using fol-lowing steps. First, the projected area of the tubes is calculated, and the total area of the shell is found by accounting for the number of tube in the design. And finally the total shell side heat transfer is calculated using the shell diameter. The ratio of baffle spacing and the shell diameter is used for convenience to cal-culate the area of shell-side heat transfer area.
(13)
where, for triangular arrange-ment of tubes.
(14)
where, CTP = 0.9 for two tube passes in shell.(15)
where, the ratio of baffle spacing to the shell diameter is one of the parameters to the input to the design.
The outer heat transfer coefficient can be calculated using the Nusselt number correlation for Reynolds number and Prandtl number.
(16)
The overall heat transfer coefficient is then calculated as shown below
(17)
In the above equation, the heat transfer resistance due to fouling factor is not accounted. This can be ac-counted in the equation shown below:
(18)
Using the overall heat transfer coefficient, the area of the heat transfer in the heat exchanger is calculated by the LMTD and the heat duty of the heat exchanger.
(19)
The log mean temperature difference (LMTD) is giv-en by:
Figure 4. The configuration of tubes in the shell and tube heat exchanger

Ethiop. J. Sci. & Technol. 8(2) 107-120, 2015 115
(20)
where, and
The length of the heat exchanger can be calculated from the heat transfer area by:
(21)
The tube side pressure drop is
(22)
(23)
The shell side pressure drop is calculated by
(24)
(25)
(26)
where, is the viscosity of the fluid at the wall temperature . The wall temperature is calculat-ed by
(27)
Dynamic behavior of heat exchangers
The shell and tube heat exchangers undergo temperature variations in their routine operations. These temperature variations could be a simple step rise or fall or can be more complex temperature function with time. In particular, a simple mathematical model is developed and coded in Libre Office Calcworksheet to describe the temperature at various points in the heat exchanger. The conduction in the direction of fluid flow is neglected and the tube is divided into several segments. And the individual segments are modeled using the equations shown below.
(28)
A of 5 deg C step rise in the hot fluid is assumed and the model predicts the temperature rise to move as a wave from the inlet to outlet side as shown in the graph below. It can be seen that the step takes about 240 seconds to reach the outlet side. Figure 5a shows the temperature variation in the cold fluid side. The cold fluid side does not show the temperature wave instead gradually increases in temperature with time as can be observed in figure 5b. The rise in temperature takes approximately 240 minutes to reach from inlet to outlet on the hot fluid. But the sudden jump in temperature behavior is not clearly shown on the cold side because of higher turbulence and mixing of fluids.

116 Ananth S. Iyengar
Figure 5a. Transient behavior on the tube side fluid
Figure 5b. Transient behavior on the shell side fluid

Ethiop. J. Sci. & Technol. 8(2) 107-120, 2015 117
Figure 5c. Overall heat transfer coefficient comparison between ANN prediction and Kern’s method value
Figure 5d. Shell side pressure drop comparison between ANN prediction and Kern’s method value
Figure 5e. Tube side pressure drop comparison between ANN prediction and Kern’s method value

118 Ananth S. Iyengar
RESULTS AND CONCLUSIONS
Heat exchanger design consists of both thermal and structural (vibrational) design and testing. Compu-tational fluid dynamic simulation is used to find the flow structures, major and minor losses in the heat exchanger, along with the heat transfer coefficients and the pressure drop across the tubes and that for the shell. CFD simulation of shell and tube heat exchangers is very cumbersome and needs high power computing facilities. The motivation for this research is to find the suitability of artificial neural networks in estimation of heat transfer coefficient, tube side and shell side pressure drop. Since Feed forward Neural Networks can easily accommodate a large input and output parameters with sufficient training data, additional input and output param-eters can be easily incorporated. These quantities are calculated by experimental correlations, and are best suited for ANN estimation. With the current ANN calculations, the values of heat-exchanger heat transfer coefficient, pressure drop in tube and shell can be estimated rapidly. This method speeds up the thermal design iteration and in particular best thermal designs can be selected from a large number of preliminary trial and error designs.Results from the ANN simulation prediction is shown in figure 5c, 5d, and 5e. It can be observed from fig-ure 5c that the overall heat transfer coefficient predic-tion is close, with R2 value of 0.96. All the predicted points are equally spaced, and the chosen data values in design of experiments are well suited for the over-all heat transfer ANN prediction. The shell side pres-sure drop ANN prediction is compared with Kern’s method calculations in Figure 5d. At higher pressure drops, ANN over predicts the pressure drop. Also the prediction values are clumped together and further study is necessary. Figure 5e, is the pressure drop prediction on the tube side. The plot has evenly dis-tributed values in the lower set of pressure drop while there are data points forming groups; this shows that the input parameter combination (velocity, tube diam-eter, tube pitch and baffle spacing) needs to be closely
spaced for future ANN calculations. But just based on the R2 values for the figure 5c, 5d, and 5e it can be safely said that the ANN predictions are acceptable and further improvements should include more num-ber of input variables, and closely spaced design of experiment values for these inputs. Alternate neural network methods such as unsupervised methods can also be used in the future.
Temperature versus the heat exchanger length during the step increase in the inlet temperature is shown in the Figure 4a and 4b. This dynamic behavior plots shows a marked difference between the shell side shown in figure 4b and the tube side (Figure 4a). The step increase of 5˚C in temperature at the tube inlet shows up as step in progressive fluid flow direction in consecutive iterations. This thermal behavior of tube side fluid is expected since the flow tubes have a lower heat transfer coefficient compared to that on the shell side. The shell side fluid does not show the step increase in the temperature because of higher heat transfer coefficient and in a shell and tube heat exchanger, the flow of fluid is a combination of cross flow and counter flow direction. The shell side fluid temperature rises evenly and reaches the maximum increase of about 4.5˚C.
REFERENCES
Costaa, A. L. H and Queiroz, E.M. (2008). Design optimization of shell-and-tube heat exchangers. Applied Thermal Engineering 28:1798‒1805.
Duran, O., Nibaldo, R and Luis, A. C. (2008). Neural Networks for Cost Estimation of Shell and Tube Heat Exchangers.”In Proceedings of the International Multi-Conference of Engineers and Computer Scientists, Hong Kong.
Gerardo, D., Sen, M., Yang, K.T and McClain.R.L., (2001). Dynamic prediction and control of heat exchangers using artificial neural networks. International Journal of Heat and Mass Transfer 44: 1671‒1679.

Ethiop. J. Sci. & Technol. 8(2) 107-120, 2015 119
Gerardo, D., Sen, M., Yang, K.T and McClain, R. L. (1999). Simulation of heat exchanger performance by artificial neural networks. HVAC and Refrigeration Research 5(3): 195‒208.
Gvozdenac, D and Mitrovic, J. (2012). Analytical Solution of Dynamic Response of Heat Exchanger, in Heat Exchangers - Basics Design Applications, In Tech, DOI: 10.5772/35944.
Jalili-Kharaajoo, M and Araabi, B. N. (2004). Neural network based predictive control of a heat exchanger nonlinear process. Journal of Electrical and Electronics Engineering 4:1219‒1226.
Jaluria, Y. (2007). Design Optimization of Thermal Systems, CRC Press.
Kakac, S and Liu, H. (2012). Heat Exchangers Selection, Rating, and Thermal Design, CRC Press.
Mansure, A. J. (1996). Hot Oiling Spreadsheet, Sandia National Laboratory Report, SAND96-2247 UC-122,
Pacheco-Vega, .A., Dıaz, G., Sen, M., Yang, K.T and McClain, R.L. (2001). Heat rate predictions in humid air-water heat exchangers using correlations and neural networks. Journal of Heat Transfer 123: 348-354.
Ponce-Ortega, J. M., Serna-González, M and Jiménez-Gutiérrez, A. (2009). Use of genetic algorithms for the optimal design of shell-and-tube heat exchangers. Applied Thermal Engineering 29: 203‒209.
Rajiv, M. (1998). Effectively Design Shell-and-tube Heat Exchangers. Chemical Engineering Process.
Riverol, C and Napolitano, V. (2005). Estimation of fouling in a plate heat exchanger through the application of neural networks. Journal of Chemical Technology and Biotechnology 80:594‒600.
Selbaş, R., Kiilkana, O and Reppich, M. (2006). A new design approach for shell-and-tube heat exchangers using genetic algorithms from economic point of view. Chemical Engineering and Processing: Process Intensification 45: 268‒275.
Skrjanc, I and Drago, M. (2000). Predictive functional control based on fuzzy model for heat exchanger pilot plant. IEEE Transactions on Fuzzy Systems 8(6):705‒712.
Speight, J. G. (2006). The Chemistry and Technology of Petroleum. CRC Press.
Tan, C.K., Ward, J., Wilcox S. J and Payne R. (2009). Artificial neural network modeling of the thermal performance of a compact heat exchanger. Applied Thermal Engineering 29: 3447-3722.
Vasičkaninová, A., Bakošová, M., Mészáros, A and Klemeš, J. J. (2011). Neural network predictive control of a heat exchanger. Applied Thermal Engineering. doi: 10.1016/j.applthermaleng.2011.01.026.
Wolff, E. A., Mathisen, K. W and Skogestad, S. (1991). Dynamics and Controllability of Heat Exchanger Networks. Proceedings of COPE, Barcelona, Spain.

120 Ananth S. Iyengar
NOMENCLATURE
Specificheatatconstantpressure
Specificgravity
Temperature
Thermalconductivityoffluid
Number of tubes
tubesidemassflowrate
velocityoffluid
density
tube diameter
Reynolds number
Prandtl number
Nusselt number
frictionfactor
dynamicviscositycentipoise
kinematicviscosity
thermaldiffusivity
heattransfercoefficient
shell diameter
Pressure
flowarea
clearance length
connected tube passes
Projected area on shell side as seen by theflowingfluid
Total shell area
overallheattransfercoefficient
pressure drop
massflowrate
enthalpyoffluid
Subscripts
tube
shell
hotfluidside
coldfluidside
inlet
outlet
wallproperties
indicesfordiscretenumericalequation

Ethiop. J. Sci. & Technol. 8(2), 2015
Author Guidelines
Manuscript Submission: Manuscripts should be submitted to the Editorial office of EJST e-mail: [email protected] letter signed by all authors declaring that the manuscript has not been published or submitted for publication elsewhere should accompany the manuscript. Authors should state that they have agreed to its submission and are responsible for its contents. This statement should preferably be signed by all au-thors. The cover letter should also indicate the name and ad-dress of the corresponding author.
Article content and formatManuscripts should be written in English and typed one and half-spaced, on A4size pages, with margins of 1.75 cm on each side of the paper (top, bottom, left, and right sides). A font size of 12 points (Times New Roman) should be used throughout. The major headings of the manuscript such as ABSTRACT IN-TRODUCTION, MATERIALS AND METHODS, RESULTS AND DISCUSSION, CONCLUSION, ACKNOWLEDGE-MENTS, and REFERENCES should be left aligned and writ-ten in UPPERCASE letters. The title of the manuscript should be centered at the top of page and written in sentence case with bold face font. All pages in papers must be numbered consecutively. The main text should be typed flush left with no indents and double line spaced. Insert one return between paragraphs, and a double re-turn between paper title, and authors’ names and addresses on the first page.ABSTRACT The abstract of the manuscript should not exceed 250 words.
REFERENCES References should be cited in the text as follows:1. Single author: the author’s name (without initials, unless there is ambiguity) and the year of publication e.g. (Williams, 2013). Except Ethiopian names which should be cited in full i.e. the first name followed by father’s name.2. Two authors: both authors’ names and the year of publica-tion e.g. (Williams and David, 2013).3. Three or more authors: first author’s name followed by ‘et al.’ and the year of publication e.g. Williams et al., 2013). 4. Citations may be made directly or in parenthesis. Groups of references should be listed first chronologically then, alphabet-ically. Example (Girma Adugna et al., 2000; Girma Adugna et al., 2001; CABI, 2003; Girma Adugna, 2004; Oduor et al., 2004).More than one reference from the same author(s) in the same year must be identified by the letters ‘a’, ‘b’, ‘c’, etc., placed after the year of publication. Examples: ‘as demonstrated (Al-lan, 2000a; Allan, 2000b, Allan, 1999; Allan and Jones, 1999). Kramer et al. (2010) have recently shown ....’ According to Berdy (1995), around 11,900 antibiotics had been discovered by 1994 …….
Reference styleThe references should be arranged alphabetically by author’s last name then chronologically per author. Publications by the same author(s) in the same year should be listed by year fol-lowed by the letters a. b. c. etc. (e.g. 2002a. 2002b, 2002c.).
Journal article Author (s), year of publication (in parenthesis), title of the arti-cle (sentence case), full name of journal (in italic font) , vol-ume (bold), number (in parenthesis), and page numbers in full.
Examples: Shukla, G.K. (1972). Some statistical aspects of partitioning genotype-environmentalcomponents of variability. Heredity 29: 237-245.
For a bookAuthor (s), year of publication (in parenthesis), title of the book (bold), publisher and place of publication.ExampleSteel, R. G and Torrie, J. H. (1980). Principles and Proce-dures of Statistics. McGraw-Hill, New York.Pages in a publication prepared by one or more editors Author (s), year of publication (in parenthesis), title of the pub-lication, name of the publication (bold), pages, Editors (in pa-renthesis), publisher, place of publication.ExampleLechevalier, M.P and Lechevalier, H.A. (1980). The chemo-taxonomy of Actinomycetes.In: Actinomycete Taxonomy, Society for Industrial Micro-biology, pp. 227-291 (Dietz, X. and Thayer, Y., eds.). Arling-ton, VA.
ProceedingsAuthor (s), year of publication (in parenthesis), Title of the publication, Name of the proceeding (Bold font) , pages, Place (City/town, Country) Example Eshetu Derso, Teame Geberzgi and Girma Adugna (2000). Significance of minor diseasesof Coffea arabica in Ethiopia. In: Proceedings of the Work-shop on Control ofCoffee Berry Disease (CBD) in Ethiopia, pp. 35-46, Addis Ababa, Ethiopia.
For a ThesisAuthor (s), year of publication (in parenthesis), title of the the-sis, type (MSc or PhD), University, Country. ExampleAlberts, M.J.A. (2004). A comparison of statistical methods to describe genotype xenvironment interaction and yield stability in multi-location maize trials. M. Sc. Thesis, University of the Free State, South Africa.
Web references Toni, R.L and Culvert, L.L. (2003). Safer Hospital Stay and Reducing Hospital-Born Infections. Health Scout News. http://www.healthscout.com, (accessed January 9, 2010).
Tables, figures and scientific measurements Tables and figures should be of reproducible quality, include comprehensive captions and not duplicate material presented in the text. Tables should bear Arabic numerals and be referred to in the text by their numbers e.g. Table 1. Each table must be typed on a separate sheet and should be placed at the end of the manuscript. Vertical lines should not be used to separate col-umns; instead extra space should be left between the columns. Footnotes in tables should be indicated by superscript letters beginning with ‘a’ in each table. Descriptive material not des-ignated as a footnote may be placed under a table as a NOTE.All illustrations should be given separately. They should be numbered as figures in sequence with Arabic numerals e.g. Figure 1. Each figure should have a descriptive legend. All illustrations (tables and figures) must be cited consecutive-ly in the text.

ETHIOPIAN JOURNAL OF SCIENCE AND TECHNOLOGY VOLUME 8, NUMBER 2 (JUNE, 2015)
CONTENTS
© Science College, Bahir Dar University, 2015
Effect of co-pressing of niger (Guizotia abyssinica Cass.) and black cumin (Nigella sativa) seeds on yield, oxidative stability and sensory properties of cold pressed oil
Admasu Fanta
61
Evaluation of the quality of cow milk consumed by children in and around Bahir Dar
Fanaye Shiferaw, Ashenafi Mengistu, Getachew Terefe, Hailu Mazengia
71
Thymus species in Ethiopia: Distribution, medicinal value, economic benefit, current status and threatening factors
Destaw Damtie and Yalemtsehay Mekonnen
81
Multilevel random effect and marginal models for longitudinal data
Bedilu Alamirie Ejigu
93
Thermal analysis of shell and tube heat exchangers using artificial neural networks Ananth S. Iyengar
107
Author Guidelines