
ESTIMATION OF RICE GROWTH PARAMETER AND CROP PHENOLOGY...
6
ESTIMATION OF RICE GROWTH PARAMETER AND CROP PHENOLOGY WITH CONJUNCTIVE USE OF RADARSAT AND ENVISAT Indrani Choudhury, M.Chakraborty and J.S. Parihar Remote Sensing Applications and Image Processing Area Space Applications Centre Indian Space Research Organization Ahmedabad-380 015, Gujarat, India e- mail: Indrani Choudhury ([email protected]) M.Chakraborty ([email protected]) J.S.Parihar ([email protected]) ABSTRACT This paper assesses the synergy of RADARSAT and ENVISAT data for rice monitoring. Crop growth profile derived from the analysis of temporal backscatter of RADARSAT SCNB (July-August) and ENVISAT of IS4 and IS5 (September-November) enables to classify early, normal and late sown crop with 10-12 dB difference throughout the growth cycle. An inversion algorithm relating backscatter and plant height was used to retrieve transplantation date whereas the peak vegetative stage was retrieved from peak backscatter value of the temporal profile. Good correlation was observed between backscatter and crop growth parameters obtained from field measurements. Linear relation between polarization ratio (HV/HH) and fresh biomass indicated that even though ENVISAT data were acquired during vegetative stage, rice biomass could be retrieved with less uncertainty. Rice map was generated using decision rule algorithm with 94.8% accuracy. The results appear promising and increase the possibility of acquiring higher temporal data for rice crop research. 1. INTRODUCTION Paddy rice accounts for over 11 percent of global cropland area [14]. Rice is the staple food for majority of the population living in Asia, which accounts for over half of the world’s population and it represents over 35 percent of their daily caloric intake [9]. Hence, monitoring of rice agriculture in timely and efficient manner is very important for agricultural and environmental sustainability, food and water security, green house gas emissions. Wetland rice monitoring is of particular significance to India, as the crop grown in the monsoon season occupies the largest share of the food grains. Since the launch of the ERS-1/2 from Europe and RADARSAT from Canada, a number of studies have demonstrated the usefulness of C band Synthetic Aperture Radar (SAR) data for monitoring of rice crop [1, 5, 7, 12, 13, 15]. They reported results on various aspects including experimental SAR data analysis as a function of rice biophysical parameters and their temporal change, interpretation of the observations by theoretical modeling, determination of classifiers, development of classification methods and rice growth models for crop yield prediction. Efforts are now also concentrated on the possibility of retrieving rice growth parameters such as plant age, height, biomass, Leaf Area Index (LAI) etc. that are the basic inputs in crop yield and condition models [2]. Reference [12] first showed a clear relationship between SAR backscatter and rice growth parameters using ERS SAR data. Since then studies had confirmed the growth relationship between SAR backscatter and crop growth parameters. Understanding of the SAR backscatter of rice fields as a function of crop growth is essential for the development of reliable and robust methods to retrieve crop growth parameters and crop phenology. A large dynamic range of backscatter (-16 to -8dB), which varied from transplanting to pre- harvest stage was observed in case of rice crop, and found largest among all agricultural crops when imaged with ERS SAR data [1]. Successful crop identification using Earth Observation (EO) satellite data relies on image acquisitions during key crop phenological stages. Thus a necessary component of the methodology is the integration of data from multiple sensors in particular the exploitation of data from SAR satellites for crop monitoring studies. This paper presents the results of the conjunctive use of two microwave sensors i.e. RADARSAT and ENVISAT, which acquired data from puddling/transplanting to maturity stage of the crop to retrieve crop phenology and crop growth parameter. 2. STUDY AREA AND DATA USED The study area lies in the Bardhaman District of West Bengal, India that extends from 22°52’45” to 23°29’35” N and 87°34’33” to 88°16’34” E. The study area is predominantly agricultural and rice is the major crop, which is grown in two distinct seasons, monsoon (June-October) and summer (February-May). Rice crop in the monsoon season i.e. kharif season, is of particular importance as the crop grown in this season is the main crop covering around 90 percent of the agricultural area. The study addresses the main season crop, which is having a wide transplantation calendar extending from June end to August. The area has a gentle slope and the field bunds vary from 5-50 cm in height. Transplanting of 20-day old seedlings is the _____________________________________________________ Proc. ‘Envisat Symposium 2007’, Montreux, Switzerland 23–27 April 2007 (ESA SP-636, July 2007)
Transcript of ESTIMATION OF RICE GROWTH PARAMETER AND CROP PHENOLOGY...

ESTIMATION OF RICE GROWTH PARAMETER AND CROP PHENOLOGY WITH CONJUNCTIVE USE OF RADARSAT AND ENVISAT
Indrani Choudhury, M.Chakraborty and J.S. Parihar Remote Sensing Applications and Image Processing Area
Space Applications Centre Indian Space Research Organization Ahmedabad-380 015, Gujarat, India
e- mail: Indrani Choudhury ([email protected]) M.Chakraborty ([email protected]) J.S.Parihar ([email protected])
ABSTRACT
This paper assesses the synergy of RADARSAT and ENVISAT data for rice monitoring. Crop growth profile derived from the analysis of temporal backscatter of RADARSAT SCNB (July-August) and ENVISAT of IS4 and IS5 (September-November) enables to classify early, normal and late sown crop with 10-12 dB difference throughout the growth cycle. An inversion algorithm relating backscatter and plant height was used to retrieve transplantation date whereas the peak vegetative stage was retrieved from peak backscatter value of the temporal profile. Good correlation was observed between backscatter and crop growth parameters obtained from field measurements. Linear relation between polarization ratio (HV/HH) and fresh biomass indicated that even though ENVISAT data were acquired during vegetative stage, rice biomass could be retrieved with less uncertainty. Rice map was generated using decision rule algorithm with 94.8% accuracy. The results appear promising and increase the possibility of acquiring higher temporal data for rice crop research.
1. INTRODUCTION Paddy rice accounts for over 11 percent of global cropland area [14]. Rice is the staple food for majority of the population living in Asia, which accounts for over half of the world’s population and it represents over 35 percent of their daily caloric intake [9]. Hence, monitoring of rice agriculture in timely and efficient manner is very important for agricultural and environmental sustainability, food and water security, green house gas emissions. Wetland rice monitoring is of particular significance to India, as the crop grown in the monsoon season occupies the largest share of the food grains. Since the launch of the ERS-1/2 from Europe and RADARSAT from Canada, a number of studies have demonstrated the usefulness of C band Synthetic Aperture Radar (SAR) data for monitoring of rice crop [1, 5, 7, 12, 13, 15]. They reported results on various aspects including experimental SAR data analysis as a function of rice biophysical parameters and their temporal change, interpretation of the observations by theoretical modeling, determination of classifiers, development of classification methods and
rice growth models for crop yield prediction. Efforts are now also concentrated on the possibility of retrieving rice growth parameters such as plant age, height, biomass, Leaf Area Index (LAI) etc. that are the basic inputs in crop yield and condition models [2]. Reference [12] first showed a clear relationship between SAR backscatter and rice growth parameters using ERS SAR data. Since then studies had confirmed the growth relationship between SAR backscatter and crop growth parameters. Understanding of the SAR backscatter of rice fields as a function of crop growth is essential for the development of reliable and robust methods to retrieve crop growth parameters and crop phenology. A large dynamic range of backscatter (-16 to -8dB), which varied from transplanting to pre-harvest stage was observed in case of rice crop, and found largest among all agricultural crops when imaged with ERS SAR data [1]. Successful crop identification using Earth Observation (EO) satellite data relies on image acquisitions during key crop phenological stages. Thus a necessary component of the methodology is the integration of data from multiple sensors in particular the exploitation of data from SAR satellites for crop monitoring studies. This paper presents the results of the conjunctive use of two microwave sensors i.e. RADARSAT and ENVISAT, which acquired data from puddling/transplanting to maturity stage of the crop to retrieve crop phenology and crop growth parameter. 2. STUDY AREA AND DATA USED The study area lies in the Bardhaman District of West Bengal, India that extends from 22°52’45” to 23°29’35” N and 87°34’33” to 88°16’34” E. The study area is predominantly agricultural and rice is the major crop, which is grown in two distinct seasons, monsoon (June-October) and summer (February-May). Rice crop in the monsoon season i.e. kharif season, is of particular importance as the crop grown in this season is the main crop covering around 90 percent of the agricultural area. The study addresses the main season crop, which is having a wide transplantation calendar extending from June end to August. The area has a gentle slope and the field bunds vary from 5-50 cm in height. Transplanting of 20-day old seedlings is the
_____________________________________________________
Proc. ‘Envisat Symposium 2007’, Montreux, Switzerland 23–27 April 2007 (ESA SP-636, July 2007)

common method of planting. A semi-dwarf variety (Lal Swarna) with life span of 120 days is the most common variety grown in the district.
Three-date RADARSAT ScanSAR Narrow Beam B (SCNB) C-band (5.3 GHz, HH polarization and 31-46° incidence angle) were acquired during July-August with 24-days repitivity. The first date was acquired on July 12, 2005, coinciding with puddling/transplanting stage. The other two dates (August 5 and August 29, 2005) were acquired that covered till vegetative stage of the crop. Multi-parametric ENVISAT data of alternating polarization (APP) mode i.e. HV/HH were acquired during September 13 (IS4, incidence angle 31-36°) and September 29 and November 7 (IS5, incidence angle 35.8-39.4°), 2005 covering peak vegetative to maturity stage of the crop.
3. METHODOLOGY 3.1. Collection of ground truth (GT) data Hardcopy of enhanced FCC (False Colour Composite) RADARSAT image of previous year was selected as the reference map to mark the GT sites in 18 villages. GPS receiver was used to locate the GT sites. Within each village, rice fields of size >0.5 ha were selected for intensive collection of GT data synchronous with the SAR passes. 50 per cent of the data were used for data analysis and the rest were used for accuracy analysis. Soil and crop parameters include soil condition (water layer, moist, wet and dry soil), land category (upland, medium and low land), water depth, field bund height, and its utilization, crop parameters include crop type (irrigated/rainfed), variety, growth stages, general vigour, date of sowing, expected date of harvest, wet biomass of paddy plants (gm/m2), the plant structural parameters such as canopy structural parameters (planting distance, plant distribution (random/row), plant height (above water surface), plant/m2 and leaf parameters (number of leaves/plant, number of leaf/stem, leaf length). This was repeated for all the sites and for all the passes. 3.2. Pre-processing of RADARSAT-1 data The processing of three-date RADARSAT SCNB data were carried out using “SARCROPS” developed around EASI/PACE image processing software [4]. The steps include: i) Data download: Transferring image and header data to hard disk from CDROM; ii) Speckle suppression: Enhanced Lee filter with 5*5 window size was used; iii) Data calibration: The digital numbers (DN) were first converted to backscatter co-efficient (σ0) in decibel using Eq.1:
where σ0
ij is the output backscatter co-efficient for scan
line i and pixel j, DN ij is the input image value for scan line i and pixel j, A0 is the fixed gain offset, Aj is the
scaling gain value, Ij is the incidence angle at the jth range pixel.
The σ0 thus computed was then linearly scaled back to 8-bit (0-255) and written in the same image channel. In this process, the range of backscatter values stored was –26 to -0.5 dB, which contains all information required for agriculture and landcover classes. The dB thus recoded can be read out from 8-bit coded DN; iv) Image georeferencing: SCNB data were georeferenced using Ground Control Points (GCP) from header and few additional GCP from field observation using GPS. First date image was used as master image and other two dates were co-registered with the first date data.
3.3. Pre-processing of ENVISAT data
ENVISAT images were processed using BEST (Basic Envisat and ERS SAR Tool) Software. It comprises 6 steps: (i) Header analysis: To extract the information data from the file; ii) Full Resolution Extraction: To extract the 16 bit unsigned image from the ESA file; ii) Image filtering: Gamma filter of 5*5 window size was used; iii) Conversion from amplitude to power; iv) Generation of backscatter image using Eq.1; v) Image flipping: dB image is horizontally flipped to generate a calibrated dB image. Multi-channel ENVISAT APP (HV/HH) datasets was generated, which were imported to .pix format compatible with the EASI/PACE software to carry out further analysis. Datasets were truncated to 8 bit. Using RADARSAT data as the master image, the three ENVISAT images were co-registered using image-to-image registration with accuracy less than sub pixel level. Datasets were resampled to 25 m that is equivalent to the pixel size of RADARSAT in order to bring all the datasets into the same frame. Georeferenced calibrated image of RADARSAT and ENVISAT is depicted in Figure 1.
3.4. Signature extraction of rice and non-rice area:
To study the temporal behaviour of rice crop planted at different times, samples (GT sites) were selected on multi-date SAR images by drawing polygons. Temporal SAR signature (mean backscattering and dispersion around it) was generated for each class to depict the crop growth profile from puddling/transplanting to maturity stage. The logic used is that early sown rice shows dip at the first date of SAR acquisition, normal sown rice shows dip at the second date and the late sown rice shows dip at the third date. Similarly, for non-rice areas (urban, homestead and inland water body) temporal backscatter profile was generated based on GT and temporal SAR signature.
3.5. Rice mapping with RADARSAT
A hierarchical decision rule algorithm was used
( )[ ]jj
jiji I
A
ADNsinlog10log10 10
0
2
10
0 +!!
"
#
$$
%
& +=' (1)

Figure 1a: Multi-date RADARSAT HH Figure 1b: Multi-date ENVISAT HH Figure1c: Multi-date ENVISAT HV
to map rice-growing areas planted at different times as well as non-rice areas [7]. Decision tree was designed based on the information provided by each pixel in each image with its typical temporal behaviour (i.e. crop phenology and flood condition of rice field), the resulting dominant interaction mechanisms (SAR signal-vegetation-water) and the corresponding backscattering co-efficient. For classification of rice pixels, the logic used the characteristic decrease in SAR backscatter that is associated with the puddle/transplanted field (i.e. the low backscatter value at the initial period is due to the specular reflection as little crop biomass was exposed) with increase in backscatter as the growth progresses (i.e. volume scattering and multiple interactions between SAR-vegetation-water) to classify early, normal and late sown crop whereas non-rice pixels showed almost constant backscatter in multi-date image. Classification thresholds were established based on GT information and SAR signature investigation at each site. 3.6. Retrieval of crop phenology To retrieve date of transplantation (DOT) of each rice class, an inversion algorithm [6] was used, which relates plant height and the corresponding backscatter co-efficient as given in Eq. 2: h=-b/2a-√[(b/2a)2-{(c-σ°)/a}]……..(2) where σ°= backscatter co-efficient (dB); h=height of the crop (cm); a=-0.002; b=0.335; c=-18.93 are the polynomial fit co-efficients of the model. This relationship was developed earlier using RADARSAT SCNB data over Bardhaman districts of West Bengal using intensive GT over the entire growing season [3]. The predicted plant height retrieved from the model was related to the days since transplantation from GT and the corresponding backscatter co-efficient (Table 1) [6]. Same model was found applicable in the present study due to same dataset (SCNB) and study area. DOT was computed for each date of RADARSAT acquisition i.e. D1, D2 and D3 using Eq.3. DOT=Di-[(-b/2a)-√{(b/2a)2-(c-σi
0)/a}]----------(3)
where i= 1,2,3 i.e. first, second and third date of SCNB data. While calculating the DOT, Di should follow immediately after transplantation.
Backscatter co-efficient
(dB)
Predicted plant height
(cm)
Days since transplantation
(days) -18.5 1.3 1 -18 2.8 3 -17 6.0 6 -16 9.3 9 -15 12.8 13 -14 16.4 16 -13 20.3 20 -12 24.4 24 -11 28.9 29 -10 33.8 34 -9 39.4 39 -8 45.7 46 -7 53.7 54 -6 65.5 65
Table 1: Relation between backscatter co-efficient, plant height and days since transplantation [6]. Generally, peak vegetative stage (PVS) of the crop is characterized by increase in plant height, an increase in the number of tillers and development of leaves where the clusters cover nearly totally the area between plants, which is attained around 65 days after transplantation for 120 days variety [9]. The PVS of the crop was retrieved from peak backscattering value of the temporal crop growth profile. 3.7. Correlation analysis Correlation analysis of crop growth parameters and σ° was carried out using multiple regression techniques using Eq 4: σ° = ax2+bx+c------------------------ (4) where x= crop growth parameters viz. plant height; crop biomass; crop age; a,b,c are polynomial fit co-efficients. ‘c’ represents the backscatter from water filled field (puddle i.e. 0th height) and can provide a threshold to discriminate the just-transplanted field
Temporal growth profile of Normal Rice
-20
-18
-16
-14
-12
-10
-8
-6
-4
-2
0
0 30 60 90 120 150 180
June 1=1
Backscatt
er
co
-eff
icie
nt
(dB
)
Rice1
Rice2
Rice3
Temporal growth profile of Late Sown Rice
-20
-18
-16
-14
-12
-10
-8
-6
-4
-2
0
0 30 60 90 120 150 180June 1=1
Backscatt
er
co
-eff
icie
nt
(dB
)
Rice1
Rice2
Rice3
from puddle field and the linear term gives the sensitivity of SAR to the exposed crop growth parameters, co-efficient ‘b’ represents the initial response of backscatter increase to crop growth parameters (dB/cm). 119 data points collected in each growing stage of the crop corresponding to SAR passes were used for analysis.
4. RESULTS AND DISCUSSIONS 4.1. Mapping of Rice and non-rice area Three-date RADARSAT data were used to generate rice and non-rice area map using decision rule algorithm (Figure 1). Rice area classified as early sown rice was transplanted before the first date of SAR acquisition as indicated by low backscatter around -15 to -14 dB at that date followed by an increase in backscatter till PVS. For normal sown rice, the low backscatter around -16 dB was observed near the second date followed by an increase in backscatter till PVS. For late sown crop, around -14 to -12 dB was observed at the third date. The lowest backscatter (≤ -19.5 dB) characterized the water bodies and highest backscatter (> -5dB) as urban area whereas homestead was characterized by an intermediate backscatter value (≥ -10 dB).
Figure 1: Classified map of rice and non-rice area using three-date RADARSAT SAR. 4.2. Accuracy assessment
GT sites were used as reference data for computation of error matrix. Using maximum Likelihood report (MLR), the rice and non-rice area was classified with 94.8 % (Kappa Coefficient= 0.93) as given in Table2.
Class
GT
Ea No La Ur Hs Wa
Ea 93.2 6.5 0.0 0.0 0.3 0.0 No 2.6 95.4 2.1 0.0 0.0 0.0 La 0.0 4.0 95.7 0.0 0.2 0.0 Ur 0.0 0.0 0.0 96.6 3.4 0.0 Hs 0.0 1.2 2.8 6.1 89.9 0.0 Wa 0.0 1.4 0.9 0.0 0.0 97.7
Table2: Error matrix of rice and non-rice area (Ea=Early, No=Normal, La= Late, Ur=Urban, Hs=Homestead, Wa=Water).
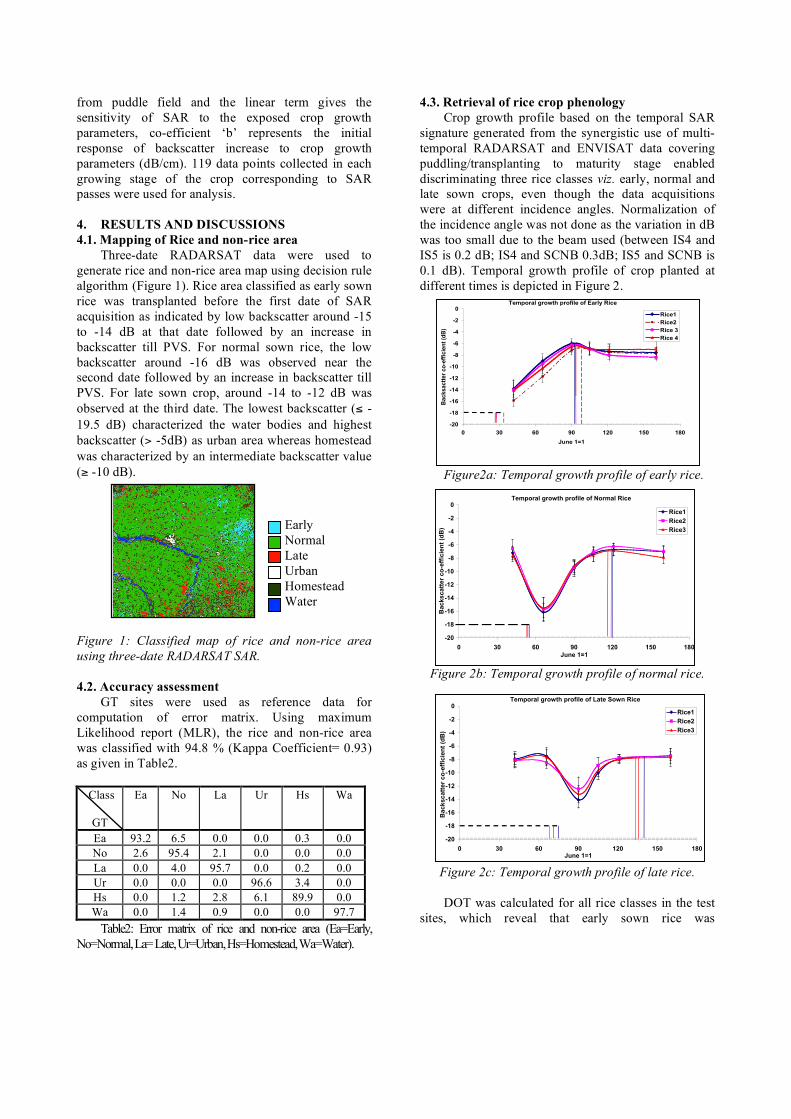
4.3. Retrieval of rice crop phenology Crop growth profile based on the temporal SAR
signature generated from the synergistic use of multi-temporal RADARSAT and ENVISAT data covering puddling/transplanting to maturity stage enabled discriminating three rice classes viz. early, normal and late sown crops, even though the data acquisitions were at different incidence angles. Normalization of the incidence angle was not done as the variation in dB was too small due to the beam used (between IS4 and IS5 is 0.2 dB; IS4 and SCNB 0.3dB; IS5 and SCNB is 0.1 dB). Temporal growth profile of crop planted at different times is depicted in Figure 2.
Figure2a: Temporal growth profile of early rice.
Figure 2b: Temporal growth profile of normal rice.
Figure 2c: Temporal growth profile of late rice. DOT was calculated for all rice classes in the test
sites, which reveal that early sown rice was
Early Normal Late Urban Homestead Water
Temporal growth profile of Early Rice
-20
-18
-16
-14
-12
-10
-8
-6
-4
-2
0
0 30 60 90 120 150 180
June 1=1B
acksactt
er
co
-eff
icie
nt
(dB
)
Rice1
Rice2
Rice 3
Rice 4

y = -0.5566x
2 + 5.0489x - 17.449
R2 = 0.8481; SEOE = 1.315
-20
-18
-16
-14
-12
-10
-8
-6
-4
-2
0
0.00 1.00 2.00 3.00 4.00 5.00
Fresh plant biomass (kg/m2)
Backscatt
er
co
-eff
icie
nt
(dB
)
y = -0.0014x2 + 0.263x - 19.923
R2 = 0.8469; SEOE = 1.290
-20
-18
-16
-14
-12
-10
-8
-6
-4
-2
0
0 20 40 60 80 100 120
Plant height (cm)
Backscatt
er
co
-eff
icie
nt
(dB
)
y = -0.0016x2 + 0.3399x - 24.222
R2 = 0.9048; SEOE = 1.017
-20
-18
-16
-14
-12
-10
-8
-6
-4
-2
0
0 20 40 60 80 100 120 140
Crop age (days)
Backscatt
er
co
-eff
icie
nt
(dB
)
transplanted during June 26-July 3 and attained PVS during September 2-12 (Figure 2a). Normal sown rice was transplanted during July 26-28 and attained PVS during September 28-October 1 (Figure 2b). Late sown rice was transplanted during August 7-14 and attained PVS during October 11-14 (Figure 2c). It has been observed that all the three classes attain PVS in 65 days with σ° corresponding to -7 to -6 dB. After reaching PVS, the temporal curve reaches a plateau followed by slight decrease in backscatter profile indicating maturity stage. In all the three cases, an increase of 11-12 dB was observed from transplanting to peak vegetative stage of the crop. 4.4. Correlation analysis Radar backscatter was found to be strongly correlated to key growth parameters i.e. crop age, plant height and biomass [10,12,13,15]. Backscatter of rice fields increases quickly during the vegetative stage and then reaches a saturation level. This temporal change has proved to be effective for rice crop growth monitoring. Backscatter can increase by more than 10 dB from the beginning of the crop growth (flooded fields) to the saturation level [10, 15]. 4.4.1 Temporal backscatter with crop age Transplantation takes place when the crop age is around 20 days (GT) and σ° at this stage is around –18 dB. The crop shows maturity, when the age becomes 100 days with σ° around –6.2 dB (Figure 3a) followed by slight decrease in σ° that is corresponding to the plant drying before harvest [13]. An increase of 11.8 dB was observed from transplanting to maturity stage. The model predicted that at the 0th height, σ° from the puddle field with water surface is around –24 dB as represented by co-efficient ‘c’ and an increase of 0.34 dB/crop age (in days) as represented by co-efficient ‘b’.
Figure 3a: Backscatter vs. crop age 4.4.2 Temporal backscatter with plant height For a rice crop of 120 days duration, plant attains maximum height till initiation of heading stage followed by slight decrease in height due to panicle emergence [8]. The fitted curve shows an increasing trend in σ° as the crop growth progresses till first head
emergence (initiation of panicle emergence) i.e. around 90th day from date of transplantation with backscatter value around –7.6 dB at plant height of 90 cm and then shows a plateau till plant attains a height of 100 cm followed by a decrease in σ° at the maturity stage corresponding to the increase in grain weight, size and drying of plant before harvesting. Before transplanting i.e. at 0th height, the σ° from the puddle field is around –19.6 dB as represented by co-efficient ‘c’ followed by transplanting of crop (-18.4 dB) with height increases at 0.25 dB/cm as resented by co-efficient ‘b’ and reaches around –7.5dB (90th day) at the maximum height (Figure 3b). An increase of around 11 dB was observed from transplanting to panicle emergence.
Figure 3b: Backscatter vs. plant height 4.4.3 Temporal backscatter with plant biomass An increasing trend was observed when correlating fresh plant biomass and σ° (Figure 3c). At the initial growth stages i.e. just after transplantation, the σ° is –17.4 dB and it increases till it reaches saturation at –6.1 dB when biomass is 5kg/m2. An increase of 11.3 dB was observed from transplanting to maturity stage. A linear relation was obtained between HV/HH ratio and fresh biomass (Figure 3d) indicated that even though ENVISAT data were acquired during vegetative stage, rice biomass could be retrieved with less uncertainties. This finding can act as major input for yield prediction as HH alone shows saturation before maturity stage.
Figure 3c: Backsactter vs. fresh plant biomass

y = 0.2649x + 1.4144
R2 = 0.6905; SEOE = 0.1810
0.00
0.50
1.00
1.50
2.00
2.50
3.00
0.00 1.00 2.00 3.00 4.00 5.00
Fresh plant biomass (kg/m2)
Po
lari
zati
on
rati
o (
HV
/HH
)
Figure 3d: Polarization ratio vs. fresh plant biomass. 5. CONCLUSION
This study demonstrates the potential of combined sensors approach to retrieve rice crop phenology and growth parameters. Temporal radar signature generated from RADARSAT SCNB during puddling/transplanting to peak vegetative stage (July-August) and ENVISAT (IS4&IS5) during vegetative to maturity stage (September-November) enables to classify rice classes (early, normal and late sown) planted at different times. Second order multiple regression approach shows promising results of deriving crop growth parameters from multi-sensor C-band SAR data. Linear relationship between polarization ratio (HV/HH) and crop biomass indicated that even though ENVISAT data were acquired during vegetative stage, rice biomass can be retrieved with good confidence, the major input for yield prediction as HH alone shows saturation before maturity stage. These crop growth parameters can be an important input to rice crop yield model and condition assessment models. It is important to note that the data acquired during initial crop growth period and extending to the maturity stage results in achieving high accuracy for estimation of crop bio-physical parameter. Results illustrate that the radar sensors can be used in combination when calibrated. This increases the possibility of acquiring higher temporal coverage for rice growth monitoring. 6. References 1.Aschbacher,J.,Pongsrihadulchai,A.,Karnchanasutha-
m,S., Rodprom, C., Paudyal, D.R. & Le Toan, T. (1995).Assessment of ERS-1 data for rice crop mapping and monitoring. Proc. IGARSS, Florence, Italy, July 1995, pp. 2183-2185.
2.Brisco, B. & Brown, R.J. (1998). Agricultural applications with radar. Principles and Applications of Imaging Radars (3rd Edn.). Manual of Remote Sensing, Vol. 2. John Wiley and Sons, Inc., New York, PP. 381-406.
3.Chakraborty, M. (2002). Algorithms and software packages for the analysis of SAR data. Monitoring and Assessment of Rice Crop in the ESCAP
region. Lecture Note:SAC/RESA/ARG/LN/01/02, pp. L16.1-L16.13.
4.Chakraborty, M. & Panigrahy, S. (2000). A processing and software system for rice crop inventory using multi-date RADARSAT ScanSAR data. ISPRS J. Photogramm. Remote Sen. 55(2), 119-128.
5.Chakraborty, M., Manjunath, K.R., Panigrahy,S., Kundu, N. & Parihar, J.S. (2005). Rice crop parameter retrieval using multi-temporal, multi-incidence angle Radarsat SAR data. ISPRS J. Photogramm. Remote Sen. 59, 310-322.
6.Choudhury, I. & Chakraborty, M. (2002). An empirical approach to retrieve the transplantation date of rice crop using RADARSAT SAR data. Proc. ISPRS, Hyderabad, India, 2002.
7.Choudhury, I. & Chakraborty, M. (2006). SAR signature investigation of rice crop using RADARSAT data. Int. J. Remote Sens. 27 (3-4), 519-534.
8.De Datta, S.K. (1981). Principles and practices of rice production. John Wiley & Sons, pp. 221-228.
9.FAO. (2004). Statistical database of the Food and Agricultural Organization of the United Nations.
10.Inoue,Y., Kurosu,T., Maeno, H., Uratsuka, S., Kozu,T., Dabrowska Zielinska, K. & Qi,J. (2002). Season-long daily measurements of multi-frequency (Ka, Ku, X, C, and L) and full-polarization backscatter signatures over paddy rice field and their relationship with biological variables. Remote Sens. Env.81, 194– 204.
11.Kurosu, T. & Fujita, M. (1997). The identification of rice fields using multi temporal ERS-1 C band SAR data. Int. J. Remote Sens. 18 (19), 2953-2965.
12.Kurosu, T., Fujita, M. & Chiba, K. (1995). Monitoring of rice crop growth from space using the ERS-1C-bandSAR. IEEE Trans. Geosci. Remote Sens. 33 (4), 1092-1096.
13.Le Toan, T., Ribbes, F., Wang, F.L., Floury, N., Ding, K.H., Kong, J.A. & Fujita, M. (1997). Rice crop mapping and monitoring using ERS-1 data based on experiment and modeling results. IEEE Trans. Geosci. Remote Sens. 35(1), 41-56.
14.Maclean, J.L., Dawe, D.C., Hardy, B. & Hettel, G.P. (2002). Rice almanac: Source book for the most important economic activity on earth (3rd Edn.) CABI Publishing.
15. Ribbes F. & Toan Le.T. (1999). Rice field mapping and monitoring with RADARSATdata Int. J. Remote Sens. 20(4), 745-765.
Acknowledgement Authors are grateful to Dr. R.R.Navalgund, Director, SAC for his constant encouragement and guidance. The authors thank Dr. K.L. Majumdar, then Deputy Director, RESIPA, for his necessary support. Ground truth data collected by Dr. Nitai Kundu and his team at IES&WM is thankfully acknowledged.


