ESTIMATION OF NEAR-WELLBORE RELATIVE … 54th Annual Logging Symposium, June 22-26, 2013 1...
13
SPWLA 54 th Annual Logging Symposium, June 22-26, 2013 1 ESTIMATION OF NEAR-WELLBORE RELATIVE PERMEABILITY FROM SIMULATION AND INVERSION OF TIME-LAPSE MULTIPHASE PRODUCTION LOGS Amir Frooqnia, Carlos Torres-Verdín, Kamy Sepehrnoori, Rohollah A-Pour, and Saeedeh Mohebbinia, The University of Texas at Austin Copyright 2013, held jointly by the Society of Petrophysicists and Well Log Analysts (SPWLA) and the submitting authors. This paper was prepared for presentation at the SPWLA 54th Annual Logging Symposium held in New Orleans, Louisiana June 22-26, 2013. ABSTRACT Laboratory measurements of saturation-dependent relative permeability are commonly used to construct reservoir models. However, because of sample size and paucity, their reliability to predict real-time production behavior of heterogeneous formations remains questionable. This paper introduces a new method to estimate near-wellbore hydrocarbon-water relative permeability from measurements acquired with production logging tools (PLT). Production logs (PL) are simulated in time-lapse mode by effectively coupling fluid flow regimes taking place in both wellbore and hydrocarbon-producing formations. To simulate production logs, the reservoir-borehole coupled flow model assumes slightly compressible oil bubbles flowing through the incompressible phase of water in the wellbore. We apply a one- dimensional isothermal two-fluid formulation to calculate wellbore fluid properties in the presence of velocity differences between fluid phases. Subsequently, a nonlinear inversion algorithm estimates saturation-dependent relative permeability by minimizing quadratic differences between borehole measurements of velocity, pressure, and holdup of the two phases, and their numerical simulations. Estimations of relative permeabilities using the new method are within 5% of actual values in various synthetic cases. Estimation accuracy decreases to 30% in the presence of 5% additive Gaussian noise for intervals where phase saturation is close to the end-point value of relative permeability. Additionally, ignoring low-pressure compartments in multilayer reservoirs with differential depletion causes underestimation of relative permeability. We also examine time-lapse production logs acquired in multilayer reservoirs supported by an active aquifer. Incremental water production over time enables the inference of layer-by-layer relative permeability. Feasibility studies with synthetic measurements indicate that relative permeability can be estimated with errors lower than 10%. However, the reliability of the estimation method is limited by the effective water saturation window monitored in the wellbore during the life of producing reservoirs. INTRODUCTION Saturation-dependent relative permeability is a dynamic petrophysical property of rock formations that quantifies the effective permeability of immiscible fluid phases in porous media. Recently, downhole measurements acquired with well testing, well logging, and formation testing have been considered for estimation of saturation- dependent relative permeability. Alpak et al. (2008) developed a method to estimate relative permeability curves from in-situ formation-tester measurements. Angeles et al. (2010) extended Alpak et al.’s work by incorporating resistivity logs to increase the reliability and stability of the estimation. By matching well-test measurements, Chen et al. (2008) also introduced a method to calculate relative permeability curves. This paper investigates the possibility of estimating relative permeability curves from time-lapse measurements of multiphase production logs. Production logs provide valuable dynamic information about wellbore fluid properties such as fluid-phase velocity, pressure, temperature, density, and holdup. Furthermore, production logging measurements have been traditionally used for time-lapse monitoring with limited attempts to quantitatively interpret them in terms of dynamic petrophysical properties. Recently Frooqnia et al. (2011) introduced a new PL application for estimation of absolute permeability by coupling a wellbore flow model to a reservoir flow model
Transcript of ESTIMATION OF NEAR-WELLBORE RELATIVE … 54th Annual Logging Symposium, June 22-26, 2013 1...

SPWLA 54th Annual Logging Symposium, June 22-26, 2013
1
ESTIMATION OF NEAR-WELLBORE RELATIVE PERMEABILITY FROM SIMULATION AND INVERSION OF TIME-LAPSE
MULTIPHASE PRODUCTION LOGS
Amir Frooqnia, Carlos Torres-Verdín, Kamy Sepehrnoori, Rohollah A-Pour, and Saeedeh Mohebbinia, The University of Texas at Austin
Copyright 2013, held jointly by the Society of Petrophysicists and Well Log Analysts (SPWLA) and the submitting authors. This paper was prepared for presentation at the SPWLA 54th Annual Logging Symposium held in New Orleans, Louisiana June 22-26, 2013.
ABSTRACT
Laboratory measurements of saturation-dependent relative permeability are commonly used to construct reservoir models. However, because of sample size and paucity, their reliability to predict real-time production behavior of heterogeneous formations remains questionable. This paper introduces a new method to estimate near-wellbore hydrocarbon-water relative permeability from measurements acquired with production logging tools (PLT). Production logs (PL) are simulated in time-lapse mode by effectively coupling fluid flow regimes taking place in both wellbore and hydrocarbon-producing formations.
To simulate production logs, the reservoir-borehole coupled flow model assumes slightly compressible oil bubbles flowing through the incompressible phase of water in the wellbore. We apply a one-dimensional isothermal two-fluid formulation to calculate wellbore fluid properties in the presence of velocity differences between fluid phases. Subsequently, a nonlinear inversion algorithm estimates saturation-dependent relative permeability by minimizing quadratic differences between borehole measurements of velocity, pressure, and holdup of the two phases, and their numerical simulations.
Estimations of relative permeabilities using the new method are within 5% of actual values in various synthetic cases. Estimation accuracy decreases to 30% in the presence of 5% additive Gaussian noise for intervals where phase saturation is close to the end-point value of relative permeability. Additionally, ignoring low-pressure compartments in multilayer reservoirs with differential depletion causes underestimation of
relative permeability. We also examine time-lapse production logs acquired in multilayer reservoirs supported by an active aquifer. Incremental water production over time enables the inference of layer-by-layer relative permeability. Feasibility studies with synthetic measurements indicate that relative permeability can be estimated with errors lower than 10%. However, the reliability of the estimation method is limited by the effective water saturation window monitored in the wellbore during the life of producing reservoirs.
INTRODUCTION
Saturation-dependent relative permeability is a dynamic petrophysical property of rock formations that quantifies the effective permeability of immiscible fluid phases in porous media. Recently, downhole measurements acquired with well testing, well logging, and formation testing have been considered for estimation of saturation-dependent relative permeability. Alpak et al. (2008) developed a method to estimate relative permeability curves from in-situ formation-tester measurements. Angeles et al. (2010) extended Alpak et al.’s work by incorporating resistivity logs to increase the reliability and stability of the estimation. By matching well-test measurements, Chen et al. (2008) also introduced a method to calculate relative permeability curves.
This paper investigates the possibility of estimating relative permeability curves from time-lapse measurements of multiphase production logs. Production logs provide valuable dynamic information about wellbore fluid properties such as fluid-phase velocity, pressure, temperature, density, and holdup. Furthermore, production logging measurements have been traditionally used for time-lapse monitoring with limited attempts to quantitatively interpret them in terms of dynamic petrophysical properties. Recently Frooqnia et al. (2011) introduced a new PL application for estimation of absolute permeability by coupling a wellbore flow model to a reservoir flow model
SPWLA 54th Annual Logging Symposium, June 22-26, 2013
2
under the assumption of single-phase fluid flow. This paper extends that application to two-phase immiscible fluid flow and estimates near-wellbore, saturation-dependent relative permeability from numerical simulation and inversion of two-phase production logs. Specifically, time-lapse measurements acquired with PLTs are used to estimate spatial distributions of relative permeability in hydrocarbon-producing depth intervals.
Fig. 1. Workflow for the coupled wellbore-reservoir flow model used to simulate production logs.
Estimation of formation relative permeability from two-phase production logs requires effective time and space coupling formation and wellbore flow models. This paper develops a novel wellbore model effectively interfaced to a three-phase reservoir flow model developed by the University of Texas at Austin (Pour, 2011 and 2008). Interfacing of the two models is carried out with a successive iterative algorithm. Pour’s (2008) reservoir model was developed in cylindrical coordinates for isothermal conditions; it has been applied for simulation of mud-filtrate invasion and formation testing (Hadibeik et al. 2012a and 2012b). The new wellbore model is a one-dimensional isothermal three-phase compositional simulator that invokes a two-fluid formulation to mechanistically simulate wellbore fluid flow. The mechanistic approach considers each fluid phase as a continuum and solves mass and momentum conservation equations to calculate wellbore fluid properties such as fluid velocity, pressure, and holdup.
A nonlinear inversion algorithm is developed to estimate relative permeability from production measurements. For hydrocarbon-water producing rock systems, the algorithm defines a region of unknown relative permeability in the vicinity of the wellbore. Beyond the near-wellbore region, production logs are assumed to be unaffected by relative permeability curves. Consequently, by refining the near-wellbore region, the algorithm generates a sufficient number of numerical layers and estimates the relative permeability of each layer. The required number of numerical layers is determined from the spatial variations of near-wellbore water saturation. Furthermore, a linear relationship between relative permeability and water saturation is assumed to estimate later-by-layer relative permeability.
A reliable PL interpretation depends on proper estimation of pressure and water saturation during measurement acquisition. We assume the availability of cased-hole production logs (e.g. Sigma logs) and well-testing measurements to reproduce near-wellbore water saturation and formation pressure prior to acquiring production logs. Clearly, because production logs investigate large-scale formation behavior, uncertainty associated with petrophysical properties such as formation pressure, permeability, and porosity will have a detrimental effect on the accuracy and reliability of relative permeability estimates.
The remaining parts of this paper describe the method developed to simulate two-phase production logs together with the underlying assumptions for wellbore modeling. We apply the inversion algorithm to study the sensitivity of measurements to petrophysical properties of fluid-producing rock formations. Finally, time-lapse production measurements acquired in hydrocarbon-water producing rock systems are analyzed to estimate near-wellbore, saturation-dependent relative permeability.
SIMULATION METHOD
Simulation of multiphase production logs requires a multiphysics approach to simultaneously model fluid flow in both reservoir and wellbore. Such a model enables the association of the wellbore flowing conditions with petrophysical properties of hydrocarbon-producing formations. The following section briefly introduces the new coupled wellbore-reservoir model.

SPWLA 54th Annual Logging Symposium, June 22-26, 2013
3
A multiphysics model. Because of pressure and temperature differences in a reservoir-borehole producing system, borehole fluid properties such as fluid velocity and pressure are considerably different from those within the reservoir. Dissimilarity between wellbore and reservoir flowing conditions gives rise to different physics of flow in the two spatial domains. While the wellbore flow domain is governed by the well-known Navier-Stocks equations, Darcy’s equations describe fluid flow in the porous media. By introducing a successive iterative approach, we effectively couple the wellbore and reservoir flow equations.
As illustrated in Fig. 1, the successive iterative algorithm separates the wellbore and reservoir flow domains and relates them through their boundary conditions. The algorithm initializes the model using available data, determines the reservoir time step according to current material balance errors, and solves the reservoir fluid flow equations. Based on the calculated reservoir properties, both wellbore boundary conditions and wellbore time step are determined and flow equations are solved to compute wellbore fluid pressure, velocity, and holdup. A variable time-step enforced in the reservoir and wellbore ensures acceptable error bounds for the mass and momentum conservation equations.
Fig. 2. Schematic of the two-fluid model for two-phase bubbly flow behavior in the wellbore.
Wellbore flow model. The available flow area in the wellbore is drastically restricted, thereby resulting in a significant increase in wellbore fluid velocity. Furthermore, density contrast between phases causes the heavier phase to flow at a lower velocity compared to the lighter phase. This study implements a two-fluid formulation to simulate flow of two-phase immiscible fluids in the wellbore. Figure 2 illustrates a one-dimensional
representation of the two-fluid model for bubbly flow patterns. This approach considers bubbles of the same phase as a continuum which exchanges mass, momentum, and energy with other fluid phases. As described by Ishii (1975), Yeoh and Tu (2010), and Kolev (2007), interfacial mass, momentum, and energy transfer are modeled by adding extra source terms to the wellbore conservation equations.
The two-fluid model is implemented to compute fluid-phase velocity, pressure, and holdup in the wellbore. By neglecting interfacial tension, the two immiscible fluids share the same pressure yet different velocities and holdups. The wellbore flow equations are given by
∂ αiρi
∂t+ . αiρiVi =Mi , (1)
∂ αiρiVi
∂t+ . αiρiViVi =
MiVinf- αi P - .τ̿i + αiρig + FD,i, (2)
τ̿i = - αiμi Vi + ViT
, (3)
and
αi =1,
NP
i=1
(4)
where, P is pressure, αi is phase holdup, Vi is phase velocity, ρi and μi are phase density and viscosity respectively, FD,i is drag forces accounting for the interphase momentum transfer, Mi is the mass influx of phase i from the reservoir, and Vinf is phase velocity at the interface. Equations 1 through 4 are solved with a numerical method called Inter-Phase Slip Algorithm (IPSA). As described by Kleinstreuer (2003) and Ishii (1975), the IPSA solves the momentum equation for velocity and an overall mass conservation equation for pressure.
Wellbore fluid flow equations are numerically solved using a finite-volume discretization with a staggered gridding system. The flow pattern for the entire wellbore domain is assumed to be bubbly flow where slightly compressible oil bubbles flow through the continuous phase of incompressible

SPWLA 54th Annual Logging Symposium, June 22-26, 2013
4
water. Oil bubbles contain different components whose velocities are assumed to be equal to that of the oil phase. Density and viscosity of oil bubbles are calculated using Peng-Robinson’s equation of state under isothermal conditions. Figure 3 shows a schematic of the developed wellbore flow model including boundary conditions. At each time step, the iterative coupling algorithm solves the reservoir flow equations and determines the fluid-phase pressure and velocity at the boundaries of the wellbore flow domain.
Fig. 3. Description of the wellbore flow model including boundary conditions.
INTERPRETATION METHOD
Wellbore flowing conditions are directly influenced by the petrophysical properties of producing rock formations, including absolute and relative permeability, pressure, and fluid saturation. To study the relationship between petrophysical and wellbore fluid properties, we interface the reservoir-borehole coupled model to a nonlinear Gauss-Newton minimization algorithm. The algorithm minimizes differences between production measurements and their numerical simulations in order to estimate near-wellbore relative permeability. The quadratic cost function
Ctotal x = ‖wde x ‖2 + α‖x‖2 (5)
is constructed for minimization of production measurements and their numerical simulations, with
Fig. 4. Spatial distribution of water saturation for a single-layer formation shouldered by shale.
x =Ps- Pm
‖Pm‖2 , Vos- Vom
‖Vom‖2 ,Vws- Vwm
‖Vwm‖2 , αos- αom
‖αom‖2 , (6)
and
x = [kro,krw], (7)
where ‖ ‖2 denotes for 2-norm function, Ctotal is total quadratic cost function, x is the vector of unknown layer relative permeabilities (the subject of the minimization), wd is a data weighting matrix to enforce the relative importance of production data, e x is the vector of residuals, and α is a regularization parameter that controls the instability of the minimization. The value of α is determined by applying Hansen’s L-curve regularization criterion described by Aster et al. (2005).
Fig. 5. Near-wellbore distributions of (a) saturation and (b) relative permeabilities to oil (green) and water (blue) for a single-layer formation.
(a) (b)
e
e

SPWLA 54th Annual Logging Symposium, June 22-26, 2013
5
The inversion algorithm initializes the near-wellbore fluid flow model using available information about borehole and formations properties. Specifically, a one-dimensional distribution of water saturation is generated to honor the available near-wellbore water saturation log. Furthermore, by dividing the near-wellbore region into a sufficient number of numerical layers, the inversion algorithm estimates a linear behavior for layer-by-layer, saturation-dependent relative permeability.
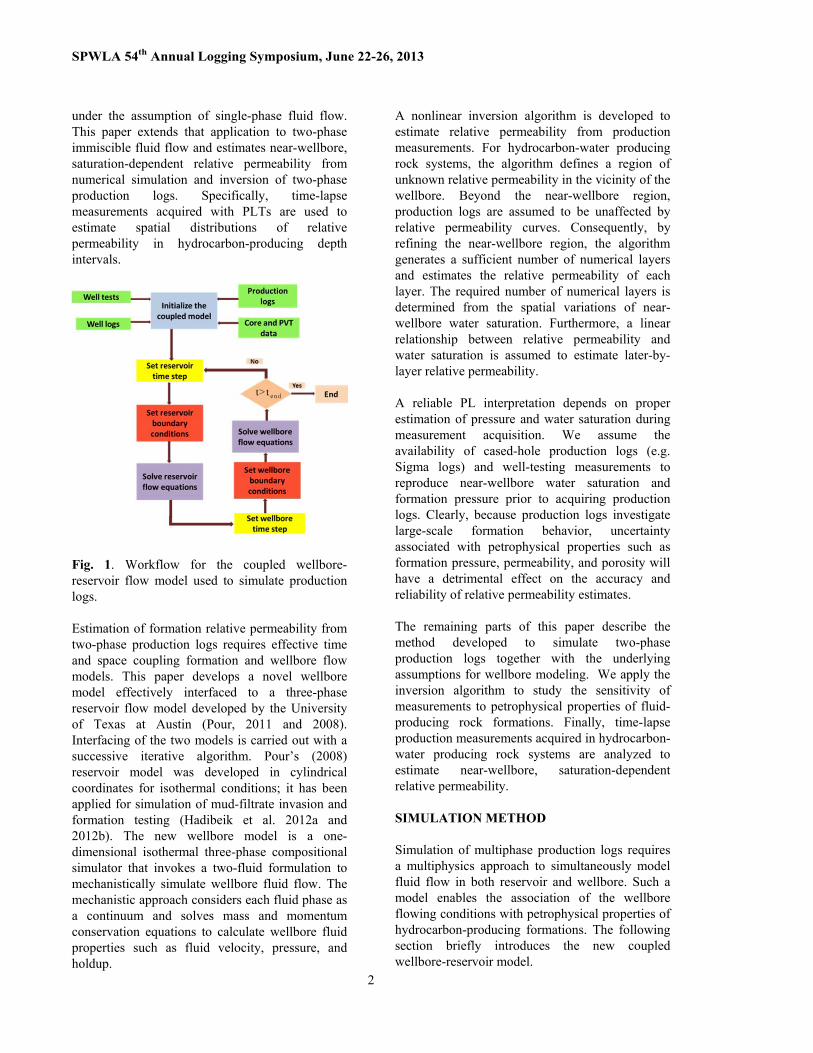
A single-layer model is constructed to examine the accuracy and reliability of the new inversion method. Figures 4 and 5 show distributions of water saturation for the reservoir model; the water-oil contact (WOC) is initially located at the bottom of the formation and water saturation is populated in the model by honoring the assumed capillary pressure. Table 1 defines other formation and wellbore properties. After 0.1 day of constant-flow-rate production, production logs are acquired and perturbed with 5% additive, zero-mean Gaussian noise to account for tool movement and other unpredictable downhole conditions. Figure 6 shows the perturbed measurements for fluid velocity, pressure, and holdup. To estimate relative permeabilities, the inversion algorithm first divides
the fluid-producing interval into 4 numerical layers and subsequently refines the layers into 8, 16, and 32 layers to improve estimation accuracy. As indicated in Fig. 7, the 4-layer model does not accurately predict relative permeability curves, whereas refinement of the forward model does improve the estimation of relative permeability. At the same time, refining the numerical layers involves additional model unknowns to the minimization thereby increasing non-uniqueness and instability of the estimation.
UNCERTAINTY ANALYSIS
Various assumptions on static and dynamic formation petrophysical properties must be made to construct a realistic fluid flow model and reliably estimate near-wellbore relative permeability. The reliability and accuracy of PL interpretation depends on the level of uncertainty associated with the implicit assumptions about formation properties. A small inaccuracy in assumed formation properties could significantly affect PL interpretation and cause erroneous estimation of relative permeability. This section quantifies the sensitivity of relative permeability estimation to formation petrophysical properties.
Fig. 6. Multiphase production logs for (a) velocity, (b) pressure, and (c) holdup with 5% additive Gaussian noise.
Property K [mD Φ[pu] Pres [psia] Tres [ Fo ] S [ ] μo [cp] ρo [lb /ft3] co [1/psi] μ [cp] ρw [lb /ft3]
Value 300 25 5200 150 0 0.835 46.8 1.3×10⁻⁶ 1.0 62.4
Table 1. Assumed formation and wellbore properties for a single-layer model during PL acquisition.
(a) (b) (c)
SPWLA 54th Annual Logging Symposium, June 22-26, 2013
6
Fig. 7. Actual (solid curves) and estimated water-oil relative permeabilities (dotted lines) for (a) 4, (b) 8, (c) 16, and (d) 32 numerical layers.
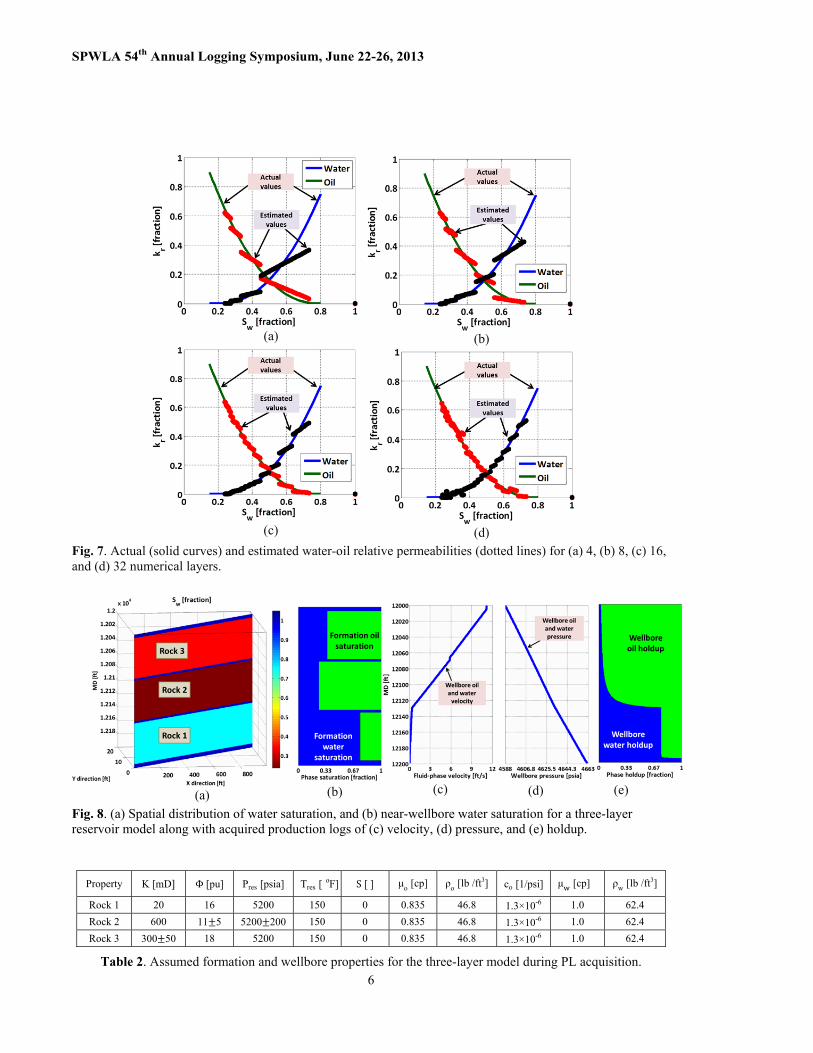
Fig. 8. (a) Spatial distribution of water saturation, and (b) near-wellbore water saturation for a three-layer reservoir model along with acquired production logs of (c) velocity, (d) pressure, and (e) holdup.
Property K [mD Φ[pu] Pres [psia] Tres [ Fo ] S [ ] μo [cp] ρo [lb /ft3] co [1/psi] μ [cp] ρw [lb /ft3]
Rock 1 20 16 5200 150 0 0.835 46.8 1.3×10⁻⁶ 1.0 62.4
Rock 2 600 11 5 5200 200 150 0 0.835 46.8 1.3×10⁻⁶ 1.0 62.4
Rock 3 300 50 18 5200 150 0 0.835 46.8 1.3×10⁻⁶ 1.0 62.4
Table 2. Assumed formation and wellbore properties for the three-layer model during PL acquisition.
(a) (b)
(c) (d)
(a) (b) (c) (d) (e)

SPWLA 54th Annual Logging Symposium, June 22-26, 2013
7
Fig. 9. (a) Assumed water-oil relative permeability and (b) capillary pressure curves for Rocks 1, 2, and 3.
The sensitivity of PL interpretation is investigated by constructing the multilayer model shown in Fig. 8. In three separate simulations, permeability and average pressure of Rock 2, and porosity of Rock 3 are perturbed to study the uncertainty of relative permeability estimation. Figure 9 and Table 2 summarize the assumed reservoir and wellbore properties and their perturbed values. Final interpretation results together with their associated error bars are shown in Figs. 10, 11, and 12. While uncertainty in porosity does not significantly affect the final estimates, 15% uncertainty in absolute permeability causes more than 20% error in relative permeability estimates. On the other hand, for the average pressure of Rock 2, 5% uncertainty gives rise to more than 30% error in relative permeability estimates.
Fig. 10. Uncertainty analysis for (a) oil and (b) water relative permeabilities due to uncertainty associated with permeability of Rock 2.
The above results indicate that errors in the assumed average layer pressure causes errors in the calculation of fluid velocity, thereby decreasing the estimated relative permeability. Similarly, a lower-than-actual assumed absolute permeability gives rise to a lower-than-actual value of relative permeability. Such a behavior implies that reliable interpretation of production logs requires the incorporation of auxiliary measurements to reduce the deleterious effect of uncertainty associated with formation properties. In particular, (a) well-log interpretation reduces uncertainty about bed boundaries, porosity, and permeability; (b) history-matching of large-scale reservoir models estimates near-wellbore pressure; (c) laboratory measurements provide PVT properties of borehole and reservoir fluids; (d) cased-hole production logs yield information about near-wellbore water saturation; and (e) well-testing results estimate near-wellbore skin factor.
TIME-LAPSE PRODUCTION LOGS
Production logging is customarily regarded as a method to survey downhole flowing conditions to monitor dynamic wellbore fluid dynamics over time. At various time lapses, production logs are also acquired to monitor incremental fluid production and secure information about fluid displacement within hydrocarbon-producing formations. By incorporating measurements acquired at various production times, in what follows we introduce a new application of PLTs for estimating near-wellbore, saturation-dependent relative permeability.
(a) (b)
(a) (b)

SPWLA 54th Annual Logging Symposium, June 22-26, 2013
8
Fig. 11. Uncertainty analysis for (a) oil and (b) water relative permeabilities due to uncertainty associated with average pressure of Rock 2.
Fig. 12. Uncertainty analysis for (a) oil and (b) water relative permeabilities due to uncertainty associated with porosity of Rock 3.
Figure 13 shows a synthetic reservoir model with multiple layers crossing a wellbore at an angle of 20o. The wellbore is placed at the center of the reservoir producing at a constant-flow-rate condition. An infinite active aquifer, located at the bottom of the reservoir, supports the producing system. Remaining reservoir and wellbore properties are listed in Table 2. In addition, each layer exhibits a different set of capillary pressure and relative permeability curves defined in Fig. 9. Figure 14 shows a region of 30ft radius around the wellbore that exhibits different relative permeability curves. The reservoir is produced for 2 years while every 6 months, multiphase production logs are acquired and analyzed to
estimate saturation-dependent relative permeability in the near-wellbore region.
Fig. 13. Initial spatial distribution of water saturation for the three-layer model with 20o dip.
The interpretation algorithm invokes a forward model to numerically simulate two-phase production measurements. It divides the near-wellbore region into various numerical layers and estimates a linear dependency between relative permeability and water saturation for each layer (Fig. 15). The inversion algorithm explicitly assumes the availability of the following information for inversion of production logs: (a) depth of the near-wellbore region, (b) relative permeability curves beyond the near-wellbore region, and (c) spatial distributions of near-wellbore water saturation and pressure.
As shown in Fig. 16, the advancement of the water-oil contact (WOC) over time causes a continuous increase of water holdup in the wellbore. Figure 17 shows numerically simulated production logs for velocity, holdup, and pressure acquired at 5 different times during production. Measurements of oil velocity and holdup exhibit larger slopes in front of the center layer (Rock 2), indicating high permeability for that layer in comparison to other fluid-producing rock units in the same model.
The interpretation algorithm contaminates time-lapse production logs with 5% additive, zero-mean Gaussian noise and estimates near-wellbore relative permeabilities by minimizing the quadratic
(a) (b)
(b) (a)

SPWLA 54th Annual Logging Symposium, June 22-26, 2013
9
cost function defined in Eq. 5. At month 0, estimated values of relative permeability for all layers are limited to a narrow window of saturation observed in the wellbore (Fig. 18). However, as the displacement front reaches the wellbore, the algorithm obtains inputs additional information about fluid flow and accurately predicts a wider range of near-wellbore relative permeability curves. Specifically, for Rock 3, it is shown that by integrating measurements acquired at different times, the method accurately estimates near-wellbore relative permeabilities. By contrast, as shown in Fig. 19, refining the number of numerical layers increases the sensitivity of relative permeability estimates to presence of noise and decreases the accuracy of the estimates.
Fig. 14. Assumed water-oil relative permeabilities in the near-wellbore region of the multilayer reservoir.
CONCLUSIONS
We introduced a new method to quantitatively interpret multiphase production logs by effectively coupling time-lapse fluid behavior taking place in both borehole and reservoir. The coupling of the two spatial domains via numerical simulation enables the estimation of dynamic petrophysical properties of hydrocarbon-producing formations. Specifically, it was shown that time-lapse borehole production measurements can be used to estimate saturation-dependent relative permeability. This estimation was possible in cases where hydrocarbon-producing formations experience measurable variations in water production over time.
Examples of verification with synthetic (numerically simulated) measurements indicate that accurate and reliable estimation of relative permeability from noisy borehole production measurements requires proper selection of the number of petrophysical layers within the depth zone of interest. It was shown that measurement noise and uncertainty in assumed formation petrophysical properties decreases the accuracy of estimated relative permeabilities. Estimations were most sensitive to formation average pressure, where the introduction of 5% perturbations in formation average pressure gave rise to more than 30% error in relative permeability estimates. This analysis confirmed that additional external information and measurements (e.g. well tests and well logs) must be integrated with production logs to reduce uncertainty associated with the estimation of saturation-dependent relative permeability.
The estimation of saturation-dependent relative permeability was further verified for the case of immiscible hydrocarbon displacement in a multilayer reservoir supported by an active aquifer. Simulated time-lapse production logs in this model yielded relative permeability curves within 10% of original values. However, depending on formation petrophysical properties, the accuracy and reliability of estimation results were limited by the effective water saturation window observed in the wellbore during production. The most favorable conditions to estimate relative permeability were
Fig. 15. Spatial distribution of rock types used to estimate near-wellbore relative permeabilities for month 18.

SPWLA 54th Annual Logging Symposium, June 22-26, 2013
10
Fig. 16. Spatial distributions of water saturation for months (a) 6, (b) 12, (c) 18, and (d) 24.
Fig. 17. (a) Oil and (b) water inflow rates together with corresponding production logs for (c) velocity, (d) holdup, and (e) pressure at different acquisition times.
(a) (b)
(c) (d)
(c) (b) (a) (d) (e)
Month 6 Month 12
Month 18 Month 24

SPWLA 54th Annual Logging Symposium, June 22-26, 2013
11
Fig. 18. Actual and estimated water-oil relative permeabilities for months (a) 0, (b) 6, (c) 12, and (d) 18.
Fig. 19. Estimated water-oil relative permeabilities together with their associated uncertainty for month 0: (a) oil and (b) water, and for month 24: (c) oil and (d) water.
(a) (b) (c) (d)
(c) (d)
(a) (b)
Month 0 Month 6
Month 12 Month 18
Month 0 Month 24
SPWLA 54th Annual Logging Symposium, June 22-26, 2013
12
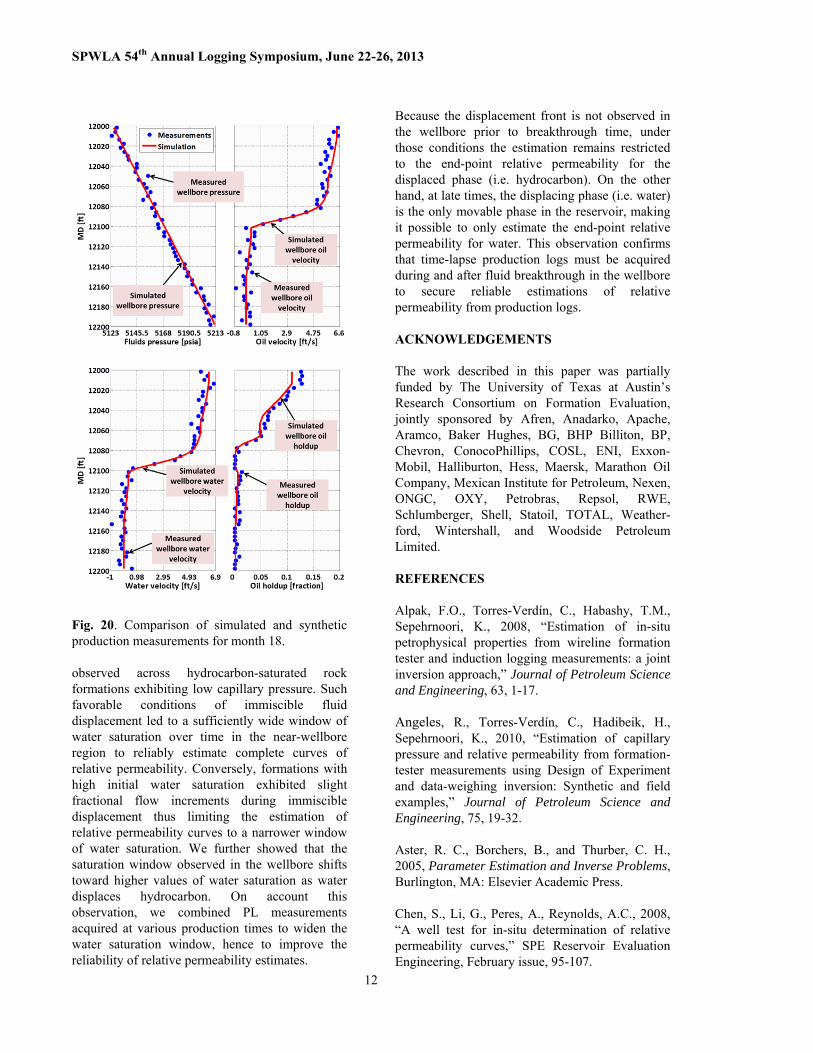
Fig. 20. Comparison of simulated and synthetic production measurements for month 18.
observed across hydrocarbon-saturated rock formations exhibiting low capillary pressure. Such favorable conditions of immiscible fluid displacement led to a sufficiently wide window of water saturation over time in the near-wellbore region to reliably estimate complete curves of relative permeability. Conversely, formations with high initial water saturation exhibited slight fractional flow increments during immiscible displacement thus limiting the estimation of relative permeability curves to a narrower window of water saturation. We further showed that the saturation window observed in the wellbore shifts toward higher values of water saturation as water displaces hydrocarbon. On account this observation, we combined PL measurements acquired at various production times to widen the water saturation window, hence to improve the reliability of relative permeability estimates.
Because the displacement front is not observed in the wellbore prior to breakthrough time, under those conditions the estimation remains restricted to the end-point relative permeability for the displaced phase (i.e. hydrocarbon). On the other hand, at late times, the displacing phase (i.e. water) is the only movable phase in the reservoir, making it possible to only estimate the end-point relative permeability for water. This observation confirms that time-lapse production logs must be acquired during and after fluid breakthrough in the wellbore to secure reliable estimations of relative permeability from production logs.
ACKNOWLEDGEMENTS The work described in this paper was partially funded by The University of Texas at Austin’s Research Consortium on Formation Evaluation, jointly sponsored by Afren, Anadarko, Apache, Aramco, Baker Hughes, BG, BHP Billiton, BP, Chevron, ConocoPhillips, COSL, ENI, Exxon-Mobil, Halliburton, Hess, Maersk, Marathon Oil Company, Mexican Institute for Petroleum, Nexen, ONGC, OXY, Petrobras, Repsol, RWE, Schlumberger, Shell, Statoil, TOTAL, Weather-ford, Wintershall, and Woodside Petroleum Limited.
REFERENCES
Alpak, F.O., Torres-Verdín, C., Habashy, T.M., Sepehrnoori, K., 2008, “Estimation of in-situ petrophysical properties from wireline formation tester and induction logging measurements: a joint inversion approach,” Journal of Petroleum Science and Engineering, 63, 1-17.
Angeles, R., Torres-Verdín, C., Hadibeik, H., Sepehrnoori, K., 2010, “Estimation of capillary pressure and relative permeability from formation-tester measurements using Design of Experiment and data-weighing inversion: Synthetic and field examples,” Journal of Petroleum Science and Engineering, 75, 19-32.
Aster, R. C., Borchers, B., and Thurber, C. H., 2005, Parameter Estimation and Inverse Problems, Burlington, MA: Elsevier Academic Press.
Chen, S., Li, G., Peres, A., Reynolds, A.C., 2008, “A well test for in-situ determination of relative permeability curves,” SPE Reservoir Evaluation Engineering, February issue, 95-107.

SPWLA 54th Annual Logging Symposium, June 22-26, 2013
13
Frooqnia, A., Pour, R., Torres-Verdín, C., and Sepehrnoori, K., 2011, “Numerical Simulation and Interpretation of Production Logging Measure-ments Using a New Coupled Wellbore-Reservoir Model,” paper 2011-VV presented at the SPWLA 52nd Annual Logging Symposium, Colorado Springs, CO, May 14-18.
Hadibeik, H., Proett, M., Chen, D., Eyuboglu, S., Torres-Verdín, C., and Pour, R., 2012a, “Formation-Tester Pulse Testing in Tight Formations (Shales and Heavy Oil): Where Wellbore Storage Effects Favor the Determination of Reservoir Pressure,” paper 155037 presented at the Society of Petroleum Engineers Americas Unconventional Resources, Pittsburgh, PA, June 5-7.
Hadibeik, H., Proett, M., Chen, D., Eyuboglu, S., and Torres-Verdín, C., 2012b, “Petrophysical Properties of Unconventional Low-Mobility Reservoirs (Shale Gas and Heavy Oil) by Using Newly Developed Adaptive Testing Approach,” paper 159172 presented at the Society of Petroleum Engineers Annual Technical Conference and Exhibition, San Antonio, TX, October 8-10.
Ishii, M., 1975, Thermo-Fluid Dynamic Theory of Two-Phase Flow, Paris, France: Evrolles.
Kleinstreuer, C., 2003, Two-Phase Flow: Theory and Application, London, Great Britain: Taylor and Francis Book Inc.
Kolev, N.I., 2007, Multi-Phase Flow Dynamics I, Third Edition. New York City, NY: Springer-Verlag.
Pour, R., 2011, Development and Application of a 3D Equation-Of-State Compositional Fluid-Flow Simulator in Cylindrical Coordinates for Near-Wellbore Phenomena, Ph.D. Dissertation, The University of Texas at Austin, December, Austin, TX.
Pour, R., 2008, Equation-of-State, Compositional, One-Dimensional Radial Flow Method to Simulate Invasion and Fluid Withdrawal in the Presence of Oil- or Water-Base Muds, M.Sc. Thesis, The University of Texas at Austin, Austin, TX.
Yeoh, G.H. and Tu J., 2010, Computational Techniques for Multi-Phase Flows, Burlington, MA: Butterworth-Heinemann.
LIST OF ACRONYMS IPSA Inter-Phase Slip Algorithm MD Measured Depth PL Production Logging PLT Production Logging Tools PVT Pressure-Volume-Temperature WOC Water-Oil Contact
LIST OF SYMBOLS
CtotalTotal cost function, [fraction] c Compressibility, [1/psi] e Vector of residuals, [fraction] g Gravitational acceleration, [ft/sec2] FD,i Interfacial drag forces, [lbf] K Permeability, [mD] kr Relative permeability, [fraction] MD Measured depth, [ft] Mi Mass Influx of phase , [lb/sec] NP Number of phases P Pressure, [psia] Pc Capillary pressure, [psi] P Vector of borehole fluid pressure, [psia] Pres Reservoir pressure, [psia] rwell Wellbore radius, [in] S Skin factor Sw Water saturation, [fraction] Tres Reservoir temperature, [ Fo ] Vi Phase velocity, [ft/sec] Vinf Phase velocity at the interface, [ft/sec] V Vector of borehole fluid velocity, [ft/sec] t Time, [sec] wd Data weighting matrix x Vector of relative permeabilities, [fraction] α Regularization parameter αi Wellbore phase holdup, [fraction]
Vector of borehole fluid holdup, [fraction] Φ Formation porosity, [pu] ρi Wellbore phase density, [lb /ft3] μi Phase viscosity, [cp] τ̿i Stress tensor, [psia] Subscripts m Simulated measurements o Oil s Simulations w Water