Estimation of relative phycoerythrin concentrations from ... · Estimation of relative...
13
Estimation of relative phycoerythrin concentrations from hyperspectral underwater radiance measurements––A statistical approach Bettina B. Taylor, 1 Marc H. Taylor, 1 Tilman Dinter, 2 and Astrid Bracher 1,2 Received 22 August 2013 ; revised 11 April 2013 ; accepted 15 April 2013. [1] Phycobiliproteins are a family of water-soluble pigment proteins that play an important role as accessory or antenna pigments and absorb in the green part of the light spectrum poorly used by chlorophyll a. The phycoerythrins (PEs) are one of four types of phycobiliproteins that are generally distinguished based on their absorption properties. As PEs are water soluble, they are generally not captured with conventional pigment analysis. Here we present a statistical model based on in situ measurements of three transatlantic cruises which allows us to derive relative PE concentration from standardized hyperspectral underwater radiance measurements (L u ). The model relies on Empirical Orthogonal Function (EOF) analysis of L u spectra and, subsequently, a Generalized Linear Model with measured PE concentrations as the response variable and EOF loadings as predictor variables. The method is used to predict relative PE concentrations throughout the water column and to calculate integrated PE estimates based on those profiles. Citation : Taylor, B. B., M. H. Taylor, T. Dinter, and A. Bracher (2013), Estimation of relative phycoerythrin concentrations from hyperspectral underwater radiance measurements––A statistical approach, J. Geophys. Res. Oceans, 118, doi:10.1002/jgrc.20201. 1. Description of Phycoerythrins [2] The phycobiliproteins, a group of water-soluble, brightly colored proteins, are the major light-harvesting pigments of cyanobacteria, red algae and cryptophytes [Sidler, 1994; Zhao et al., 2011]. They consist of open- chain tetrapyrroles known as phycobilins or bilins, that are covalently bound to the apoproteins via thioether bonds and they efficiently absorb light in the green part of the light spectrum poorly used by chlorophyll a (chl a)[French and Young, 1952; Glazer et al., 1982; Kronick, 1986]. The colors of the phycobiliproteins originate mainly from the tetrapyrrole chromophores [Sidler, 1994]. In intact cells of cyanobacteria and chloroplasts of red algae, the phycobili- proteins are generally assembled in structures called phyco- bilisomes which are attached in regular arrays to the external surface of the thylakoid membranes [Gantt and Conti, 1966 ; Glazer, 1988 ; Sidler, 1994]. [3] Phycobiliproteins are usually classified according to their spectral properties and phylogenetic occurrence, although the classifications are constantly revised and dis- cussed in the literature due to great spectral diversity and variation [e.g., Glazer, 1999 ; Hill and Rowan, 1989 ; Sidler, 1994; Six et al., 2007 ; Zhao et al., 2011]. In addition to the covalently bound chromophores, several noncovalent inter- actions between the apoprotein and the chromophores are essential for the light-harvesting function and influence the spectral properties of the proteins. Generally, four types of phycobiliproteins are distinguished on the basis of their absorption maxima (Abs max ): phycoerythrocyanins (PEC, Abs max 575 nm), phycoerythrins (PE, Abs max 495–575 nm), phycocyanins (PC, Abs max 615–640 nm) and allo- phycocyanins (APC, Abs max 650–655 nm). Cryptophyte biliproteins are often classified as a separate group. In this paper, we will concentrate on the PEs. [4] PEs carry only one or two chromophore types, phy- coerythrobilin (PEB, Abs max 545 nm) and phycourobilin (PUB, Abs max 495 nm). They exhibit very diverse spec- tral characteristics depending on their molecular structure which varies among phytoplankton species and with envi- ronmental conditions such as light and nutrient availability [Haverkamp et al., 2009; Hoge et al., 1998; Lantoine and Neveux, 1999; Palenik, 2001; Sidler, 1994]. The spectral characteristics of PEs are strongly influenced by the num- ber and proportions of PUB and PEB, the chemical struc- ture and geometry of the molecule, and their direct local environment, which can lead to varying absorption maxima [MacColl, 1998]. PEB is found in all PEs, whereas PUB is present in varying concentrations in some forms of PE [Glazer, 1999; Six et al., 2007, Wood et al., 1998]. Generally, species with high-PUB content are more abun- dant in clear oligotrophic waters of the open ocean, whereas low-PUB or no-PUB PEs characterize species that are native in more eutrophic coastal waters [Chekalyuk and Hafez, 2008; Lantoine and Neveux, 1999; Wood et al., 1998]. PEs generally have a single fluorescence emission 1 Alfred Wegener Institute for Polar and Marine Research, Bremerhaven, Germany. 2 Institute of Environmental Physics, University of Bremen, Bremen, Germany. Corresponding author: B. B. Taylor, Department of Climate Dynamics, Alfred Wegener Institute for Polar and Marine Research, Bussestrasse 24, Bremerhaven D-27570, Germany. ([email protected]) ©2013. American Geophysical Union. All Rights Reserved. 2169-9275/13/10.1002/jgrc.20201 1 JOURNAL OF GEOPHYSICAL RESEARCH : OCEANS, VOL. 118, 1–13, doi :10.1002/jgrc.20201, 2013
Transcript of Estimation of relative phycoerythrin concentrations from ... · Estimation of relative...
Estimation of relative phycoerythrin concentrations fromhyperspectral underwater radiance measurements––A statisticalapproach
Bettina B. Taylor,1 Marc H. Taylor,1 Tilman Dinter,2 and Astrid Bracher1,2
Received 22 August 2013; revised 11 April 2013; accepted 15 April 2013.
[1] Phycobiliproteins are a family of water-soluble pigment proteins that play an importantrole as accessory or antenna pigments and absorb in the green part of the light spectrumpoorly used by chlorophyll a. The phycoerythrins (PEs) are one of four types ofphycobiliproteins that are generally distinguished based on their absorption properties. AsPEs are water soluble, they are generally not captured with conventional pigment analysis.Here we present a statistical model based on in situ measurements of three transatlanticcruises which allows us to derive relative PE concentration from standardized hyperspectralunderwater radiance measurements (Lu). The model relies on Empirical OrthogonalFunction (EOF) analysis of Lu spectra and, subsequently, a Generalized Linear Model withmeasured PE concentrations as the response variable and EOF loadings as predictorvariables. The method is used to predict relative PE concentrations throughout the watercolumn and to calculate integrated PE estimates based on those profiles.
Citation: Taylor, B. B., M. H. Taylor, T. Dinter, and A. Bracher (2013), Estimation of relative phycoerythrin concentrations fromhyperspectral underwater radiance measurements––A statistical approach, J. Geophys. Res. Oceans, 118, doi:10.1002/jgrc.20201.
1. Description of Phycoerythrins
[2] The phycobiliproteins, a group of water-soluble,brightly colored proteins, are the major light-harvestingpigments of cyanobacteria, red algae and cryptophytes[Sidler, 1994; Zhao et al., 2011]. They consist of open-chain tetrapyrroles known as phycobilins or bilins, that arecovalently bound to the apoproteins via thioether bondsand they efficiently absorb light in the green part of thelight spectrum poorly used by chlorophyll a (chl a) [Frenchand Young, 1952; Glazer et al., 1982; Kronick, 1986]. Thecolors of the phycobiliproteins originate mainly from thetetrapyrrole chromophores [Sidler, 1994]. In intact cells ofcyanobacteria and chloroplasts of red algae, the phycobili-proteins are generally assembled in structures called phyco-bilisomes which are attached in regular arrays to theexternal surface of the thylakoid membranes [Gantt andConti, 1966; Glazer, 1988; Sidler, 1994].
[3] Phycobiliproteins are usually classified according totheir spectral properties and phylogenetic occurrence,although the classifications are constantly revised and dis-cussed in the literature due to great spectral diversity andvariation [e.g., Glazer, 1999; Hill and Rowan, 1989; Sidler,
1994; Six et al., 2007; Zhao et al., 2011]. In addition to thecovalently bound chromophores, several noncovalent inter-actions between the apoprotein and the chromophores areessential for the light-harvesting function and influence thespectral properties of the proteins. Generally, four types ofphycobiliproteins are distinguished on the basis of theirabsorption maxima (Absmax): phycoerythrocyanins (PEC,Absmax � 575 nm), phycoerythrins (PE, Absmax � 495–575nm), phycocyanins (PC, Absmax � 615–640 nm) and allo-phycocyanins (APC, Absmax � 650–655 nm). Cryptophytebiliproteins are often classified as a separate group. In thispaper, we will concentrate on the PEs.
[4] PEs carry only one or two chromophore types, phy-coerythrobilin (PEB, Absmax � 545 nm) and phycourobilin(PUB, Absmax � 495 nm). They exhibit very diverse spec-tral characteristics depending on their molecular structurewhich varies among phytoplankton species and with envi-ronmental conditions such as light and nutrient availability[Haverkamp et al., 2009; Hoge et al., 1998; Lantoine andNeveux, 1999; Palenik, 2001; Sidler, 1994]. The spectralcharacteristics of PEs are strongly influenced by the num-ber and proportions of PUB and PEB, the chemical struc-ture and geometry of the molecule, and their direct localenvironment, which can lead to varying absorption maxima[MacColl, 1998]. PEB is found in all PEs, whereas PUB ispresent in varying concentrations in some forms of PE[Glazer, 1999; Six et al., 2007, Wood et al., 1998].Generally, species with high-PUB content are more abun-dant in clear oligotrophic waters of the open ocean,whereas low-PUB or no-PUB PEs characterize species thatare native in more eutrophic coastal waters [Chekalyuk andHafez, 2008; Lantoine and Neveux, 1999; Wood et al.,1998]. PEs generally have a single fluorescence emission
1Alfred Wegener Institute for Polar and Marine Research, Bremerhaven,Germany.
2Institute of Environmental Physics, University of Bremen, Bremen,Germany.
Corresponding author: B. B. Taylor, Department of Climate Dynamics,Alfred Wegener Institute for Polar and Marine Research, Bussestrasse 24,Bremerhaven D-27570, Germany. ([email protected])
©2013. American Geophysical Union. All Rights Reserved.2169-9275/13/10.1002/jgrc.20201
1
JOURNAL OF GEOPHYSICAL RESEARCH: OCEANS, VOL. 118, 1–13, doi:10.1002/jgrc.20201, 2013
maximum regardless of the presence or absence of PUB,indicating that only PEB chromophores fluoresce, althoughthe presence of PUB can influence the emission wavelengthof PEB. PEB fluorescence peaks at � 580 nm, but can beshifted to shorter wavelengths for PUB-containing PEs[Chekalyuk and Hafez, 2008; Falkowski and Raven, 1997;Hoge et al., 1998; Lantoine and Neveux, 1997; Ong andGlazer, 1991].
1.1. Phycoerythrins in the Marine Environment
[5] Our understanding of the functioning of marine eco-systems starts with the phytoplankton because of their fun-damental role in the marine food web and carbon cycle.PE-containing species of the phytoplankton are a globallyimportant group of photosynthetic organisms and are dis-tributed ubiquitously throughout oceanic regions, rangingfrom polar through temperate to tropical waters in coastaland open ocean regions [Hoef-Emden, 2008; Partensky etal., 1999; Scanlan and West, 2002; Wood et al., 1998].Within the picophytoplankton (cells< 2 mm), the PE-richcyanobacteria are a widely recognized and studied phyto-plankton group in the marine environment [Carr andMann, 1994; Everroad and Wood, 2012; Partensky et al.,1999; Scanlan and West, 2002]. They have been shown tobe important primary producers ; species of the genus Syne-chococcus, for example, have been estimated to account for64% of total photosynthesis in the North Pacific [Iturriagaand Mitchell, 1986]. Other picocyanobacterial strains suchas a PE-containing Cyanobium, a Cyanobium-like lineageand species of the genus Synechocystis can occur alongsideSynechococcus in open ocean areas [Everroad and Wood,2006; Waterbury and Rippka, 1989]. Another importantPE-containing genus is Trichodesmium, a group of filamen-tous cyanobacteria that forms extensive colonies in surfacewaters of oligotrophic, tropical and subtropical oceans[Capone et al., 1997; Staal et al., 2007; Subramaniam etal., 1999]. The two eukaryotic PE-containing groups (cryp-tophytes and red algae) are more prevalent in coastal,brackish, and freshwater environments; red algae occurmainly as macroalgae [Clay et al., 1999; Cole and Sheath,1990; Gabrielson et al., 1989; Gillot, 1989; Hoef-Emden,2008].
1.2. Challenges of Phycoerythrin Measurement
[6] PEs seem to be ideal marker pigments for PE-con-taining cyanobacteria. However, contrary to all other algalpigments which are soluble in organic solvents, measure-ments of phycobiliproteins are still scarce. A number ofmethods have been proposed to measure PEs in water sam-ples [e.g., Algarra et al., 1988; Downes and Hall, 1998;Kim et al., 2011; Lantoine and Neveux, 1997; Ong et al.,1984] or in vivo [Beutler et al., 2002; Chekalyuk andHafez, 2008; Chekalyuk et al., 2012; Cowles et al., 1993;Hoge et al., 1998], but none are routinely used in oceanog-raphy, thus leaving PEs often undetected in pigment analy-sis. The most commonly used method, which detects PEsthrough its orange fluorescence, is flow cytometry. Never-theless, these methods need discrete water samples andinvolve a certain amount of, often complex and time con-suming, sample preparation. Very detailed informationabout spatial and spectral variability and distribution ofPEs without the need of discrete water samples can be
obtained from methods such as laser-induced emissionmeasurements from airborne platforms [Hoge et al., 1998]or as shipboard-device [Chekalyuk and Hafez, 2008; Che-kalyuk et al., 2012]. However, these measurements requirevery sophisticated instrumentation that is not easilyacquired and handled and have been confined to underwaysurface measurements or water samples from discretedepths. Automated submersible flow cytometers have beendeveloped [Dubelaar et al., 1999; Olson et al., 2003] andused as moored devices measuring time series, but, as faras we are aware, not for profiling. Some submersible andprofiling fluorometers exploiting the fingerprints of the spe-cific excitation spectra of PE-containing phytoplanktonhave been designed [Beutler et al., 2002, 2004; Cowles etal., 1993; Desiderio et al., 1997; Horiuchi and Wolk,2008] and some of these PE fluorometers are commerciallyavailable. These profiling fluorometers have been mainlydeployed in freshwater environments [Beutler et al., 2002;Leboulanger et al., 2002; Proctor and Roesler, 2010].Thus, even though PEs and PE-containing phytoplanktonhave been subject to many studies, there is still a lack of in-formation about the depth distribution in marine ecosys-tems and the deep maxima are often overlooked. Here wedemonstrate a method which deduces profiles of total PEdown to the depth of measurable light availability.
[7] The spectral diversity of the PEs opens many possi-bilities to distinguish between PE-containing groups as hasbeen shown with many of the methods mentioned above,but also carries many difficulties, when only specific wave-lengths are used for the excitation and detection of the dif-ferent groups. Ample research has shown that PE contentand spectral properties can vary with light availability (thusalso with depth) and nutrient status [Lantoine and Neveux,1999; Wood et al., 1998; Wyman et al., 1985]. For exam-ple, in some species PE is not only used in photosynthesis,but also as nitrogen storage [Wyman et al., 1985]. All themethods mentioned above use some kind of fluorescenceexcitation to detect PEs; some methods use only one exci-tation and emission wavelength (for example many flowcytometers), others use several excitation and/or emissionwavelengths to distinguish between spectral varieties ofPE. As input parameter into our model, we use PE values,determined by a method that takes the whole diversity ofPEs into account and thus, on the expense of losing the in-formation about specific spectral types of PE, measurestotal PE.
[8] Building on the fact that PE absorption and fluores-cence have an impact on the underwater light field, we pro-pose a statistical method that allows for the prediction ofrelative PE concentrations from underwater upwelling radi-ance (Lu) measurements. Several studies have shown thatPE-containing phytoplankton influence the submarine lightfield due to absorption, scattering and fluorescence proc-esses [Hoge and Swift, 1990; Kirk, 1986; Morel, 1997].Taking advantage of this fact, we apply Empirical Orthogo-nal Function (EOF) analysis to decompose a matrix of cor-responding Lu spectra, as this method has been shown to beparticularly useful for assessing variance structure in spec-tral measurements such as remote sensing reflectance[Craig et al., 2012; Lubac and Loisel, 2007; Mueller,1976; Toole and Siegel, 2001]. So far, the idea to retrieveinformation about pigments from radiometric data has been
TAYLOR ET AL.: ESTIMATING PHYCOERYTHRIN FROM RADIANCE
2

mainly applied to the main photosynthetic pigment chl aand has been successfully extended to retrieve global chl aconcentrations from satellite data [e.g., Gordon et al.,1980; McClain, 2009].
[9] The method presented here is used to predict PE pro-files and values of integrated PE based on upwelling radi-ance spectra. The aim was to develop a method that can beeasily applied to radiometric measurements and thus is ap-plicable to measurements at all depths as long as light is de-tectable. With only a few discrete water samples and PEmeasurements, information about whole profiles of total PEcan be extracted.
2. Methods
2.1. Sample Collection
[10] Samples were collected during three cruises: theANT-XXIV/4 expedition of the RV Polarstern in April/May2008 along a South-to-North transect through the AtlanticOcean from Punta Arenas (Chile) to Bremerhaven (Ger-many), the ANT-XXV/1 expedition of the RV Polarstern inNovember 2008 along a North-to-South transect through theeastern Atlantic Ocean from Bremerhaven (Germany) toCape Town (South Africa) and the ANT-XXVI/4 expeditionof the RV Polarstern in April/May 2010 along a South-to-North transect through the Atlantic Ocean from Punta Are-nas (Chile) to Bremerhaven (Germany). For convenience thecruises will be called C1 (ANTXXIV/4), C2 (ANTXXV/1)and C3 (ANTXXVI/4) (Figure 1). Sampling stations gener-ally coincided once a day at noon local time and involvedCTD casts with water samplers as well as above- and below-water radiance and irradiance measurements. Water sampleswere filtered on 0.4 mm polycarbonate filters for PE analysisand on GF/F filters for analysis of other pigments, shock-fro-zen in liquid nitrogen and stored at �80�C. Samples for flowcytometry were preserved with 0.1% glutaraldehyde (final
concentration), shock-frozen in liquid nitrogen and stored at�80�C. A total of 131 water samples were taken (26, 62, and43 on C1, C2, and C3, respectively) and 59 radiance profileswere measured (13, 22, and 24 on C1, C2, and C3, respec-tively) at the same time as the water samples. At each station,we took at least two water samples at the surface and the chla maximum; if possible a third sample was taken at 100 m.
2.2. Phycoerythrin Measurements
[11] PE measurements were based on the in vivo methodby Wyman [1992] and the spectrofluorometric assay byLantoine and Neveux [1997] and Neveux et al. [2006]. Indetail, the polycarbonate filters were placed into 3 ml of50/50 mixture of glycerol and phosphate buffer (0.1 molL�1 NaH2PO4 (pH¼ 6.5)) and the cells on the filters wereresuspended by vigorous shaking on a lab bench vortexmixer. The choice of filters and buffer was made followingextensive tests with different methods and personal com-munication with J. Neveux. Samples were kept on ice andin the dark for 1h and vortexed again before fluorescencewas measured with a Fluorolog FL3–22 spectrofluorometer(Horiba). We performed an excitation scan from 450 to 560nm (emission: 575 nm). Excitation slits were set to 5 nm.As we were not able to purify PEs for calibration purposes,our results remain relative values and could not be con-verted into absolute concentrations. The relative PE con-centration per L seawater was calculated from theintegrated area below the blank-subtracted excitation spec-tra between 450 and 560 nm. Spectra were normalized tothe Raman scatter [e.g., Coble et al., 1993; Sepp€al€a et al.,2005] and the fluorometer was equipped with a referencedetector to monitor and compensate for variations in the xe-non lamp output; thus even though the concentrations arerelative, they are comparable between samples and cruises.
2.3. Pigment Analysis
[12] The composition of pigments which are soluble inorganic solvents was analyzed by High Performance LiquidChromatography (HPLC) following a method described byHoffmann et al. [2006] adjusted to our instruments asdetailed by Taylor et al. [2011].
2.4. Flow Cytometry
[13] Phytoplankton cells were enumerated from pre-served and frozen, unstained samples by using their specificchl a and PE autofluorescence as described by Marie et al.[2005]. Flow cytometry was performed on a FACScaliburwith an excitation beam of 488 nm, two light scatter detec-tors at 180� (forward scatter) and at 90� (side scatter) andseveral photomultipliers detecting at 530 6 15 nm (greenfluorescence), 585 6 21 nm (orange fluorescence) and>670 nm (red fluorescence). Phytoplankton groups wereseparated according to their red and orange fluorescenceand scattering characteristics. Yellow-green FluoresbriteVR
Microspheres with a diameter of 1 mm (Polysciences) wereused as an internal standard. The data were analyzed withthe instrument software ‘‘CellQuest.’’
2.5. Radiometric Measurements
[14] Underwater optical light fields were measured withhyperspectral radiometers (RAMSES, TriOS GmbH, Ger-many) measuring radiance profiles. The instrument coversa wavelength range of 320–950 nm with an optical
Figure 1. Map of the Atlantic Ocean with tracks of thethree cruises. Points show all stations where concurrentmeasurements of PE and Lu were conducted.
TAYLOR ET AL.: ESTIMATING PHYCOERYTHRIN FROM RADIANCE
3

resolution of 3.3 nm and a spectral accuracy of 0.3 nm. Allmeasurements were collected with sensor-specific auto-matically adjusted integration times (between 4 ms and 8s). Radiometric profiles measuring upwelling radiance (Lu)[W m�2 nm�1 sr�1] were collected at the same time as theCTD profiles on a second winch down to a maximum depthof 190 m. Irradiance at the surface (Ed
þ) [W m�2] wasmeasured as a reference with a second sensor placedabove-water and was utilized to normalize the measuredunder-water data to a maximum value of Ed
þ as describedby Smith and Baker [1984]. The radiance sensor had a fieldof view of 7�, while the irradiance sensor had a cosine col-lector fixed in front of the instrument. The in-water sensorwas equipped with an inclination and a pressure sensor. Toavoid ship shadow, the ship was oriented such that the sunwas illuminating the side where the measurements weretaking place. The pitch and roll data measured by the shipdid not exceed values larger than 5�. For the in-water data,the inclination in either dimension was smaller than 14�
[Matsuoka et al., 2007].
2.6. Statistical Methods
[15] We first processed the data of all cruises together,followed by the analysis of each cruise separately. Ascruise C3 yielded different results than the two othercruises (possible reasons will be discussed below), we alsoanalyzed a data set consisting of the data of cruisesC1þC2 only.2.6.1. Empirical Orthogonal Function Analysis
[16] All analyses were conducted using the statisticalcomputing software ‘‘R’’ [R Development Core Team,2011]. Spectral data were subjected to an Empirical Or-thogonal Function (EOF) analysis (sometimes referred toas Principal Component Analysis) in order to reduce thehigh dimensionality of the data and derive the dominantsignals (‘‘modes’’) that best describe variance within thedata set. We averaged the Lu spectra within one cast thatwere measured within 61 m depth of the respective dis-crete PE measurement. The sampling rate of the radiometerdepended on integration time, which is affected by lightavailability. As a result, the number of sampled spectradecreased with depth and the number of spectra used forthe average ranged from 3 to 10 samples. The averaged Lu
spectra were used to create a data matrix X consisting of Mrows of Lu radiances, from 350–800 nm in 1 nm incre-ments, by N sample columns. The resulting data matrixconsisted of M¼451 rows (nm), while the number of N col-umns (samples) varied between models. Prior to analysis,the Lu spectra were standardized by first subtracting themean (centering) and then dividing by the standard devia-tion (scaling), in order that each spectral sample (columns)had a mean of zero and standard deviation of one (i.e.,dimensionless). This standardization step allowed us tofocus on spectral shape rather than magnitude. All resultsshown in this paper are from standardized spectra. Subse-quently, a covariance matrix was calculated:
C¼ 1
MXTX Cjl ¼ X:J X:l : ð1Þ
[17] The covariance matrix C was then subjected to anEigen decomposition:
C¼EKET C¼XN
k¼1ek�keT
k ; ð2Þ
[18] with EOFs equaling the Eigenvectors E, and Kbeing a diagonal matrix containing the eigenvalues, bywhich the explained variance of each EOF can be calcu-lated. E is an N�N matrix containing loadings for eachsample by mode. EOF expansion coefficients Z (i.e., ‘‘prin-cipal components’’) are then calculated as the projection ofthe data X onto E :
Z¼XE Zik ¼XN
j¼1Xijejk ; ð3Þ
where Z is an M�N matrix carrying the loadings for eachradiance wavelength (nm) by mode.2.6.2. Generalized Linear Model
[19] The number n of significant EOF modes was deter-mined according to North’s Rule-of-Thumb [North et al.,1982]. The significant EOF modes from E were then usedas covariates in the prediction of measured PE concentra-tions using a multiple Generalized Linear Model (GLM):
loge E PEð Þð Þ ¼ �þ �1e1 þ �2e2 þ � � � þ �nen; ð4Þ
where e1;2;:::n are the leading n significant EOF modes fromE, � is the intercept, and �1;2;:::n are the regression coeffi-cients. The GLM assumed a Gaussian error distribution andused a log-normal link function for the expectation of PE,E(PE). The model assumes that error dispersion is constantand independent of PE, which is consistent with the errorof the method used to determine its concentration [Lantoineand Neveux, 1997]. The log-link function GLM provided abetter fit over that of a simple linear model (in terms ofsum of squared differences) and also had the advantage ofpreventing the prediction of negative values.
[20] A stepwise routine was used to search for smallermodels based on fewer terms, through minimization of theAkaike information criterion (AIC). Once the best modelwas determined, the significance of included terms wasdefined by the change in AIC (�AIC) following eachterm’s removal. This is an appropriate test for the compari-son of nested models because it includes a penalty for thenumber of parameters in the model.
2.6.3. PE Prediction[21] The model was applied to spectra from depths that
did not have corresponding PE measurements in order tocreate profiles of estimated PE. This new set of radiancespectral data Y was first projected onto the EOF domainusing the EOF coefficients Z :
Z�1Y� �T ¼ F; ð5Þ
where F is an N�N matrix giving the loadings for eachsample, as with E. Predicted PE is then calculated using thebest fitted GLM and the new EOF loadings F :
log e E PE pred
� �� �¼ aþ b�1f1 þ �2f2 þ :::þ b�nfn; ð6Þ
where PEpred equals the predicted relative PE concentra-tions and f1;2;:::n are the EOF loadings F that correspond tothe significant terms of the multiple regression model
TAYLOR ET AL.: ESTIMATING PHYCOERYTHRIN FROM RADIANCE
4

(equation (4)). Confidence intervals were calculated foreach PEpred based on the standard error of the GLMcoefficients.2.6.4. Integrated PE
[22] Using the above procedure, PE concentration waspredicted from radiance spectra throughout each station’ssampled profile. A spline function was fitted to the pre-dicted values by depth and used for the calculation of inte-grated values for each profile (in relative PE concentrationm�2). In order to include a majority of stations in the com-parison, integrated values were calculated down to a depthof 95 m, since most station profiles were sampled to at leastthis depth.
3. Results
3.1. EOF Analysis of Lu Spectra
[23] The decomposition of the standardized spectra bythe EOF analysis returned between 5 and 9 significantEOFs explaining most of the variance of the data matrix(Table 1). Figure 2 illustrates the 3 dominant EOF coeffi-cients for each of the cruises (for visual comparison, wehave removed the eigenvalue units in order to present allcoefficients on a similar scale). The shapes of these 3 EOFcoefficients were similar in all analyses and explained mostof the variance (> 98%). EOF coefficients four to nine gen-erally added less than 1% and thus are not discussed indetail in this paper. The gray area in the plots indicates thearea where the main signal of PEs is to be expected due totheir absorption and fluorescence features in the spectralrange of 450–600 nm. EOF coefficient 1 shows positive
values in the wavelength region of 400–500 nm with noother conspicuous effects in the region above 550 nm. EOFcoefficient 2 also showed main deviations (positive andnegative) in the region of 400–500 nm, while EOF mode 3showed a negative peak between 450 and 500 nm and posi-tive values in the wavelength region of 500–600 nm.
3.2. Generalized Linear Models
[24] Figure 3 shows the predicted versus the measuredPE values for each analysis. The models show better fits fordata sets of individual cruises than when all cruises weregrouped together. In particular, adding C3 to the modelusing only data from C1 and C2 lowered R2 substantially,although the correlation was still highly significant atp<0.0001. All cruises showed a large range of PE values;however C3 had very low-PE values compared to the twoother cruises. Reasons for these variations will be discussedbelow.
[25] In order to estimate the importance of each EOF inthe best model, we used the �AIC as a measure of eachsmaller model (without the respective EOF) relative to thebest model. The bigger the �AIC, the greater the impor-tance of the removed EOF (Table 2). In all models EOF 3was the most significant predictor of PE concentrations.
3.3. PE Prediction
[26] Using the regression models we predicted PE pro-files and integrated PE values from the radiance measure-ments. Figure 4 shows the integrated PE (relativeconcentration m�2) for all stations of C1, C2, and C3 ofwhich we had Lu profiles down to 95 m. The profiles werecalculated with the models of the respective cruises and the
Table 1. Percent of Total Variance Explained by the Significant EOFs Derived from Radiance Spectra from Various Combinations ofCruise Data
Cruise EOF1 EOF2 EOF3 EOF4 EOF5 EOF6 EOF7 EOF8 EOF9
C1 82.3 12.1 4.4 0.9 0.1C2 86.6 9.9 2.6 0.5 0.2 <0.1C3 81.0 13.0 5.2 0.5 0.1 <0.1 <0.1 <0.1 <0.1C1þC2 85.1 10.6 3.2 0.6 0.2C1þC2þC3 83.5 11.4 4.1 0.6 0.2
Figure 2. Leading three EOF coefficients (scaled) as calculated from the standardized Lu spectra forthe single cruise models. Each cruise is designated by a color. The gray area indicates the wavelengthrange where the main influence of PEs is to be expected (450–600 nm).
TAYLOR ET AL.: ESTIMATING PHYCOERYTHRIN FROM RADIANCE
5

gray areas around the profiles show the 95% confidenceintervals of the predictions. The cumulative error of themultiple regression EOF terms increases the confidenceinterval for the higher range of predicted PE concentra-tions. Integrated PE values are highest in the Bay of Biscay,off the West coast of Portugal, in the Mauritanian upwell-ing and off the coast of Namibia. Seven example PE pro-files from stations of different biogeographical regions ofthe Atlantic Ocean are depicted in the figure. The profilesshow that PE distribution by depth can be very different,ranging from the main concentration residing in surfacewaters to deep maxima at >50 m. See Figure A1 in the Ap-pendix for all predicted profiles.
4. Discussion
[27] EOF analysis is a statistical method that has proveduseful in extracting information about water constituentsfrom spectral data since the 1970s [Craig et al., 2012;Lubac and Loisel, 2007; Mueller, 1976; Toole and Siegel,2001]. Most authors used this method on ocean color re-
flectance data to derive information about chl a, particulatebackscattering, nutrients or other biochemical or optical pa-rameters. We have applied this method to upwelling under-water radiance in the hope to be able to use underwaterlight measurements for the estimation of pigment profileswhich cannot be measured easily in the same resolutionwith common laboratory methods.
[28] PEs and PE-containing cyanobacteria have beenstudied extensively. Especially the genus Synechococcus, agroup of small unicellular cyanobacteria with a wide geo-graphical distribution and considerable impact on theglobal carbon cycle, has been the interest of many researchprojects since its discovery in the late 1970s [Waterbury etal., 1979]. Most data on the depth distribution are stillbased on discrete water samples and laborious measure-ment techniques involving a great amount of sample prepa-ration and instrumentation, thus often relying on a smallnumber of samples only. More recently, some specific PEsensors have been developed, which estimate PE fluores-cence using one or several excitation and emission wave-lengths (see section 1.3.).
Figure 3. Observed versus predicted PE values for models based on various combinations of cruisedata. All models are highly significant at p< 0.0001. The 1:1 line is shown in gray for reference.
Table 2. Change in the Akaike Information Criterion (�AIC) Following Individual Term Removals from the Best Multiple RegressionModels
Cruise EOF1 EOF2 EOF3 EOF4 EOF5 EOF6 EOF7 EOF8 EOF9
C1 73 22C2 11 95 25 25 29C3 10 35 45 8 4 18C1þC2 40 129C1þC2þC3 17 18 71 19
TAYLOR ET AL.: ESTIMATING PHYCOERYTHRIN FROM RADIANCE
6

[29] The presented results show a clear relationshipbetween PE concentrations and the spectral shape of Lu,especially for the data sets of the single cruises, thus cor-roborating the fact that PE influences the surroundingunderwater light field, by absorption and scattering proc-esses, and also by fluorescence emission. In order to focuson changes in spectral shape of the Lu spectra rather thanmagnitude, the spectra were standardized to minimize thecomponent of variability due to spectral amplitude thusaccounting for the inclusion of samples from differentdepths with different light availability. We tried the sameanalysis with nonstandardized data and got relatively poormodel fits, compared to the standardized data set. Craig et
al. [2012] also used a type of spectral scaling in order tofocus their analysis on shape rather than magnitude. Theysuggest that the use of normalized spectra emphasizes thecolor of the water carrying most of the information aboutchl a and phytoplankton absorption.
[30] The same analysis was conducted with flow cytome-try data (i.e., cell counts of orange fluorescing cells andtotal orange fluorescence as measured by the flow cytome-ter) instead of PE data, but the relationships were not asstrong as with the PE data. We suggest two possible rea-sons for the better performance with PE data:
[31] (1) Sample volume: The flow cytometry data arederived from measurements of very small sample volumes
Figure 4. Map of the Atlantic Ocean with all stations of which a value of integrated PE could be calcu-lated from the Lu profiles. The integrated values were calculated with the single cruise models. Eachcruise is designated by a color. Arranged around the map are seven examples of predicted PE profiles,including the values of measured PE (open circles) and the depth of the chl a maximum (hatched band).The gray areas around the profiles show the 95% confidence intervals of the predictions. Confidenceintervals are narrow for low concentrations and cannot always be visualized.
TAYLOR ET AL.: ESTIMATING PHYCOERYTHRIN FROM RADIANCE
7

(<0.0005 L) whereas for the PE measurements the samplevolume was generally between 1 and 4 L. This large differ-ence in sample volume could account for the fact that theLu estimates provide a better fit to the PE data than to thecell counts.
[32] (2) Excitation wavelengths: From our own analysisof PE excitation spectra and other publications we knowthat the excitation of 488 nm used in the flow cytometricanalysis is not optimal for all samples [e.g., Olson et al.,1988]. Samples dominated by low-PUB species have theirexcitation maximum at �550 nm, for no-PUB species thispeak can even be shifted to 560 nm, whereas high-PUBspecies generally have two maxima at �495 nm and at�550 nm [Hoge et al., 1998; Lantoine and Neveux, 1999;Olson et al., 1988]. It has been demonstrated before [Olsonet al., 1988] that high-PUB cells show higher fluorescencewhen excited by a 488 nm laser than low-PUB cells. Thelow-fluorescence response of low- or no-PUB cells to the488 nm laser of the flow cytometer might explain whysome cells could be missed in this method, whereas the rel-ative PE concentrations measured with the fluorometrictechnique are based on excitation scans ranging from 450to 560 nm.
[33] Another fact that will add to the differences betweenflow cytometry and PE measurements, but also between PEand Lu measurements, is the species composition. Notewor-thy species such as Trichodesmium, which form filamentsand colonies, will probably not be detected in flow cytome-try samples due to the size of the filaments and the smallsample volume. There is a greater chance to encounter Tri-chodesmium filaments in a larger water sample, as wastaken for the PE measurements; however, even the largeNiskin bottles might miss the naturally buoyant colonies.Although we never detected any visible filaments on thesample filters or colonies in the surface waters, we cannotbe sure that they were not present. The radiometer, how-ever, would detect the spectral impact of a Trichodesmiumbloom.
[34] For all data sets, EOF modes 1–3 explained between98 and 99% of the total variance of standardized spectra.EOF mode 1 showed one main feature in the region of400–500 nm probably due to chl a and other accessory pig-ments, while EOF mode 2 showed positive and negativespectral features in the same wavelength region, possiblydue to a mixed effect of absorption and backscattering onthe underwater light field. EOF mode 3 explained variationin the spectral region of 450–600 nm. As described in detailin the introduction, absorption spectra of PEs cover thespectral region of �475–580 nm (with absorption maximaat �495 nm and �545 nm for the PUB and PEB chromo-phores, respectively), and fluoresce at �580 nm, dependingon various factors such as taxonomy, pigment composition,light availability and nutrients [Falkowski and Raven,1997; Glazer and Stryer, 1984; Glazer et al., 1982; Hogeet al., 1998; Lantoine and Neveux, 1999]. As a result ofthese spectral properties, we would expect that the presenceor absence of PE would coincide with deviations in the Lu
spectra in the spectral range of approximately 450–600 nm.This spectral region is generally known as the ‘‘green gap’’as all other known photosynthetic pigments do not absorbor absorb only weakly in this region. Thus, we can assumethat the interference from other pigments would be smallest
here. The spectral variability of PE in terms of the twochromophores PUB and PEB which absorb at �495 nmand �545 nm respectively will extend the influence of PEtoward shorter wavelengths when high PUB-species arepresent, whereas no-PUB species would not influence thelight spectrum below �500 nm.
[35] As indicated by �AIC, the predictor that explainedthe variance in the data best was EOF coefficient 3, whichexplains the variance in the spectral region of 450–600 nmwhere we expect the main influence of PEs on the under-water light field, corroborating the validity of our model.The fact that we cannot explain the influence of PE on theLu spectra by EOF mode 3 only, but also need to includeother modes for a better correlation, is probably a functionof the spectral variability of PEs and of the other pigmentspresent in the cells. High-PUB PEs will have an impact onthe underwater light field in the spectral region below 500nm and the variance in this region is also described by EOFcoefficients 1 and 2. The variability in the PUB/PEB ratioas well as the composition of accessory pigments couldalso be the reason that the number of EOF coefficientsincluded in the models varies depending on the cruiseswhich were included. It emphasizes the fact that the effectof PE on the underwater light field is apparent within abroad wavelength range and not only at the peaks ofabsorption or fluorescence.
[36] Using the GLMs based on EOFs, we could predictPE profiles based on radiance spectra for each station. Inte-grated values and seven example profiles are shown in Fig-ure 4, with measured PE and the depth of the chl amaximum provided as reference. In open ocean regions,the PE signal can be linked to Synechococcus distributionpatterns as published in the literature: Synechococcus isknown to be more abundant in areas which are seasonallyor permanently enriched with nutrients by strong upwellingor coastal inputs [Olson et al., 1990; Partensky et al.,1996, 1999; Zubkov et al., 1998]. Highest integrated valuesare found in association with the Mauretanian upwellingand off the coasts of Western Europe and South WestAfrica. At stations near the coast the detection of themarker pigment alloxanthin (pigment data not shown here)suggests the presence of cryptophytes which are probablyresponsible for the PE signal in these environments lesstypical for cyanobacteria.
[37] The predicted PE profiles generally reproduce themeasured PE values well and the bands of 95% confidenceintervals show the predictions to be robust. The GLM thatwe apply assumes a constant error across the range of meas-ured PE concentrations. Translated to error as a percent ofthe concentration, the model is less sensitive in identifyingvariation at the lower range of PE concentrations and ismore appropriate for identifying profile features at higherconcentrations. The profiles show varying vertical distribu-tions, which is not surprising as vertical profiles are influ-enced by numerous physico-chemical factors such asstability of the water column, light, temperature or nutrients,hence making it difficult to predict which profiles should befound in which region at a certain point in time. We oftenfind that the PE-maximum is closely linked to the chl a max-imum (see Figure A1 of the Appendix), a relationship thathas been reported before [Partensky et al., 1996]. However,exceptions exist where the PE maximum is located slightly
TAYLOR ET AL.: ESTIMATING PHYCOERYTHRIN FROM RADIANCE
8

below the chl a maximum (for example profiles A and B inFigure 4). In some cases (as in profile C in Figure 4) thereare two PE maxima and only one of them matches the chl amaximum. Profile F is an example where the PE maximumwould have been missed entirely if samples had been takenonly in the chl a maximum.
[38] The fact that we use relative PE concentrations limitsour ability to compare with other PE quantifications. How-ever, the aim of this study is not to show a distribution ofabsolute values of PE, but to demonstrate a method, whichallows us to deduce PE values from radiometric measure-ments. The PE determination chosen as input parameter forthe model dictates the output. Thus, should we or other labo-ratories have the possibility to quantify PE in absolute val-ues, the output of the model would also be in absoluteconcentrations. However, purifying phycobiliproteins is nota straight forward procedure and, more importantly for thequantification of PEs, purified proteins often have differentspectral properties than the proteins in vivo, as their spectralproperties are strongly influenced by interactions in the com-plex assemblages of the phycobilisomes [Glazer, 1988].
[39] In our GLMs, we found the strongest relationshipfor the single cruise models and for the model with pooleddata of C1þC2. However, the third cruise (C3), did notimprove the correlation although within the cruise itselfthere was a strong relationship between Lu and PE measure-
ments. However, the range of relative PE concentrations ofC3 was restricted to a much smaller range than in the twoother cruises (0.001–0.25 relative units/L for C3, asopposed to 0.001–0.89 relative units/L and 0.001–0.72 rela-tive units/L for C1 and C2, respectively). The cruises C1and C3 were conducted on nearly the same cruise track andin the same season, with 2 years between them. To investi-gate possible reasons for these low-PE values, we looked atthe pigment analysis and flow cytometry data of all threecruises (Figure 5). The amount of total pigment gives ageneral idea of the phytoplankton biomass present at eachstation and the flow cytometry data shown here gives thenumber of cells per milliliters of Synechococcus species,the most abundant phytoplankton with PE-containing phy-cobilisomes in open ocean waters. For comparison, thethird plot in Figure 5 shows the measured PE concentration(relative units/L). Both C1 and C2 encountered major phy-toplankton blooms with a high percentage of PE-containingphytoplankton in the Mauritanian upwelling, whereas C3does not show any elevated pigment or PE levels at that lat-itude. C3 only encountered higher pigment concentrationnorth of Spain and the percentage of PE-containing phyto-plankton was very low in that area. These differences inpigment composition might explain why we obtain differ-ent models from the different cruises. They emphasize howimportant the input data are for the model output and how
Figure 5. Concentrations of total pigments [mg/m3] measured by HPLC, Synechococcus [cells/ml]measured by flow cytometry and PE [relative concentration/L] measured by a spectrofluorometricmethod by latitude. Each cruise is designated by color. Values are given for surface (left plots) and at thedepth of the chl a maximum (right plots).
TAYLOR ET AL.: ESTIMATING PHYCOERYTHRIN FROM RADIANCE
9

crucial it is to have a broad set of data encompassing awide range of pigment concentrations. Large interannualchanges in (pico-) phytoplankton composition and dynam-ics have been reported previously [Dandonneau et al.,2004; Head and Pepin, 2010a, 2010b; Partensky et al.,1996] and should be taken into account.
5. Conclusions and Further Research
[40] We have developed a statistical approach to derivePE concentrations from underwater radiance measure-ments, which enables us to obtain a broader PE data set of
depth profiles than could be acquired through measure-ments of discrete water samples. We have shown that theinfluence that PE-containing phytoplankton has on theunderwater light field can be exploited to calculate PE con-centrations from Lu measurements. For any cruise or sitewhere Lu and concurrent PE measurements are available,we can derive a model for PE estimation. There is still aneed for discrete water samples for PE measurements asinput and validation data for the model, but with our model,the resolution of the output data is much higher than itwould ever be with discrete water samples and laboratorymeasurements.
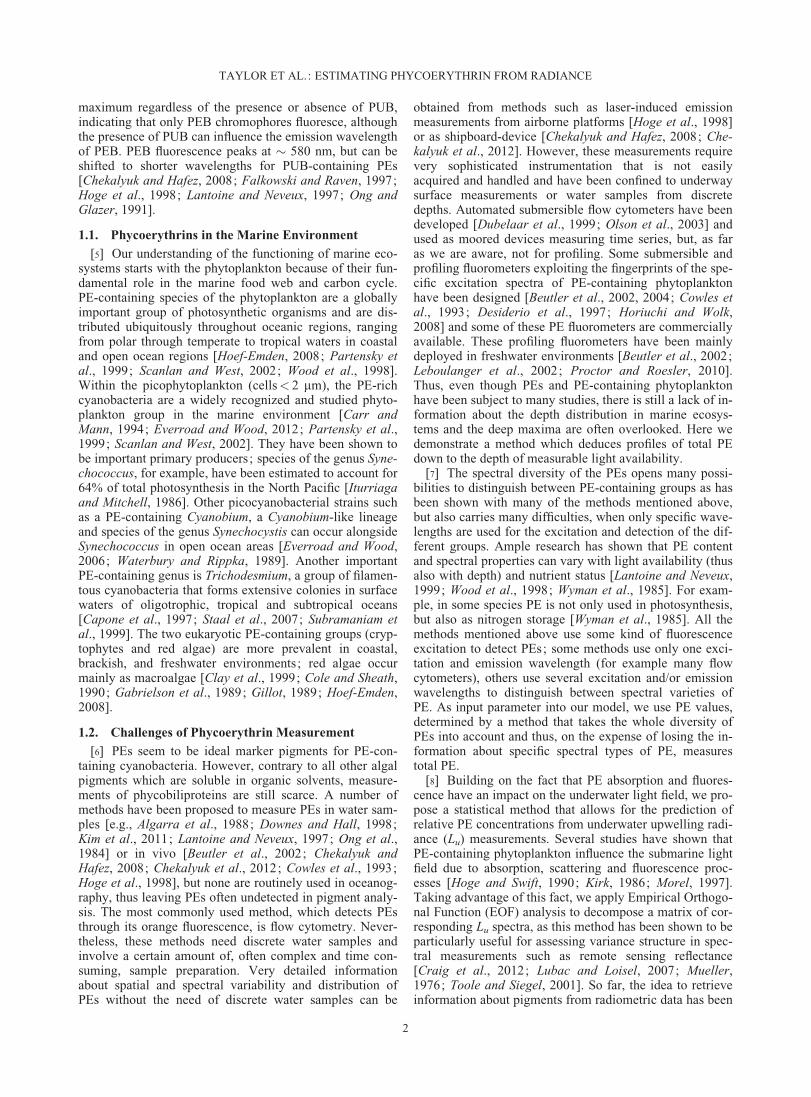
Figure A1. Predicted PE profiles for all stations, calculated with the single cruise models, includingthe values of measured PE (open circles) and the depth of the chl a maximum (hatched band). The grayareas around the profiles show the 95% confidence intervals of the predictions. Confidence intervals arenarrow for low concentrations and cannot always be visualized.
TAYLOR ET AL.: ESTIMATING PHYCOERYTHRIN FROM RADIANCE
10
[41] From our results, we conclude that, for the bestapproximation to reality, each cruise would need its ownmodel to accommodate seasonal and interannual changes.Another possibility, which could be tested with more data,would be a separation of the data sets according to biogeo-graphical regions or provinces instead of cruises and com-pare the model outcomes. We would also welcome acomparison of our model output with the output data set ofspecific PE sensors that are commercially available.
Appendix A
[42] Figure A1 shows calculated profiles of phycoerythrin(PE) distribution for all stations of the three cruises. Valuesof measured PE and the depth of the chlorophyll a (chl a)maximum are included for reference. We often find that thePE-maximum is closely linked to the chl a maximum.
[43] Acknowledgments. We would like to thank four anonymousreviewers for very helpful comments. We thank AWI, Helmholtz ImpulseFond (HGF Young Investigators Group Phytooptics) and OCEANET forfunding. M.H.T. was supported by the German Research Foundation, pro-ject BiPhyCoSi (ID: LO-1143/6). We also thank the remote sensing groupat the Helmholtz-Zentrum Geesthacht, Allan Cembella and his group at the
AWI as well as Oliver Zielinski and his group at the ICBM in Oldenburgfor the use of their equipment. We are grateful to Erika Allhusen, MirkoLunau, Anja Bernhardt and Sonja Wiegmann for help with the laboratorywork and the crew, principal investigators and other scientists on board theRV Polarstern for support on board and fruitful discussions afterward.
ReferencesAlgarra, P., M. Estrada, and F. X. Niell (1988), Phycobiliprotein distribu-
tion across the Western Mediterranean divergence, Deep Sea Res. PartA, 35(8), 1425–1430.
Beutler, M., K. H. Wiltshire, B. Meyer, C. Moldaenke, C. Luring, M.Meyerhofer, U. P. Hansen, and H. Dau (2002), A fluorometric methodfor the differentiation of algal populations in vivo and in situ, Photo-synth. Res., 72(1), 39–53.
Beutler, M., K. H. Wiltshire, C. Reineke, and U. P. Hansen (2004), Algo-rithms and practical fluorescence models of the photosynthetic apparatusof red cyanobacteria and Cryptophyta designed for the fluorescencedetection of red cyanobacteria and cryptophytes, Aquat. Microbial Ecol.,35(2), 115–129.
Capone, D. G., J. P. Zehr, H. W. Paerl, B. Bergman, and E. J. Car-penter (1997), Trichodesmium, a globally significant marine cyano-bacterium, Science, 276(5316), 1221–1229, doi :10.1126/science.276.5316.1221.
Carr, N. G., and N. H. Mann (1994), The oceanic cyanobacterial picoplank-ton, in The Molecular Biology of Cyanobacteria, edited by D. A. Bryant,pp. 27–48, Kluwer Acad., Dordrecht.
Figure A1. (continued)
TAYLOR ET AL.: ESTIMATING PHYCOERYTHRIN FROM RADIANCE
11
Chekalyuk, A. M., and M. Hafez (2008), Advanced laser fluorometry ofnatural aquatic environments, Limnol. Oceanogr., 6, 591–609.
Chekalyuk, A. M., M. R. Landry, R. Goericke, A. G. Taylor, and M. A.Hafez (2012), Laser fluorescence analysis of phytoplankton across afrontal zone in the California current ecosystem, J. Plankton Res., 34(9),761–777, doi:10.1093/plankt/fbs034.
Clay, B. L., P. Kugrens, and R. E. Lee (1999), A revised classification ofCryptophyta, Bot. J. Linnean Soc., 131(2), 131–151, doi:10.1111/j.1095–8339.1999.tb01845.x.
Coble, P. G., C. A. Schultz, and K. Mopper (1993), Fluorescence contour-ing analysis of DOC intercalibration experiment samples––A compari-son of techniques, Mar. Chem., 41(1–3), 173–178, doi:10.1016/0304–4203(93)90116-6.
Cole, K. M., and R. G. Sheath (Eds.) (1990), Biology of the Red Algae,Cambridge Univ. Press, Cambridge, U.K.
Cowles, T. J., R. A. Desiderio, and S. Neuer (1993), Insitu characterizationof phytoplankton from vertical profiles of fluorescence emission-spectra,Mar. Biol., 115(2), 217–222, doi:10.1007/Bf00346338.
Craig, S. E., C. T. Jones, W. K. W. Li, G. Lazin, E. Horne, C. Caverhill,and J. J. Cullen (2012), Deriving optical metrics of coastal phytoplank-ton biomass from ocean colour, Remote Sens. Environ., 119, 72–83,doi:10.1016/j.rse.2011.12.007.
Dandonneau, Y., P. Y. Deschamps, J. M. Nicolas, H. Loisel, J. Blanchot,Y. Montel, F. Thieuleux, and G. Becu (2004), Seasonal and interan-nual variability of ocean color and composition of phytoplanktoncommunities in the North Atlantic, equatorial Pacific and South Pa-cific, Deep Sea Res. Part II, 51(1–3), 303–318, doi :10.1016/j.dsr2.2003.07.018.
Desiderio, R. A., C. Moore, C. Lantz, and T. J. Cowles (1997), Multiple ex-citation fluorometer for in situ oceanographic applications, Appl. Optics,36(6), 1289–1296, doi:10.1364/Ao.36.001289.
Downes, M. T., and J. A. Hall (1998), A sensitive fluorometric techniquefor the measurement of phycobilin pigments and its application to thestudy of marine and freshwater picophytoplankton in oligotrophic envi-ronments, J. Appl. Phycol., 10(4), 357–363.
Dubelaar, G. B. J., P. L. Gerritzen, A. E. R. Beeker, R. R. Jonker, and K.Tangen (1999), Design and first results of CytoBuoy: A wireless flowcytometer for in situ analysis of marine and fresh waters, Cytometry,37(4), 247–254.
Everroad, R. C., and A. M. Wood (2006), Comparative molecular evolutionof newly discovered picocyanobacterial strains reveals a phylogeneti-cally informative variable region of beta-phycoerythrin, J. Phycol.,42(6), 1300–1311, doi:10.1111/j.1529–8817.2006.00282.x.
Everroad, R. C., and A. M. Wood (2012), Phycoerythrin evolution anddiversification of spectral phenotype in marine Synechococcus andrelated picocyanobacteria, Mol. Phylogenet. Evol., 64(3), 381–392,doi:10.1016/j.ympev.2012.04.013.
Falkowski, P. G., and J. A. Raven (1997), Aquatic Photosynthesis, Black-well Sci, Malden, Massachusetts.
French, C. S., and V. K. Young (1952), The fluorescence spectra of redalgae and the transfer of energy from phycoerythrin to phycocyanin tochlorophyll, J. Gen. Physiol., 35(6), 873–890.
Gabrielson, P. W., D. J. Garbary, M. R. Sommerfeld, R. A. Townsend, andP. L. Tyler (1989), Phylum Rhodophyta, in Handbook of Protoctista:The Structure, Cultivation, Habitats and Life Histories of the EukaryoticMicroorganisms and Their Descendants Exclusive of Animals, Plantsand Fungi, edited by L. Margulis, J. O. Corliss, M. Melkonian and D. J.Chapman, pp. 102–118, Jones and Barlett, Boston.
Gantt, E., and S. F. Conti (1966), Phycobiliprotein Localization in Algae,Brookhaven Symp. Biol., 19, 393–405.
Gillot, M. (1989), Phylum Cryptophytoa (Cryptomonads), in Handbook ofProtoctista: The Structure, Cultivation, Habitats and Life Histories ofthe Eukaryotic Microorganisms and Their Descendants Exclusive of Ani-mals, Plants and Fungi, edited by L. Margulis, J. O. Corliss, M. Melko-nian, and D. J. Chapman, pp. 139–151, Jones and Barlett, Boston.
Glazer, A. N. (1988), Phycobilisomes, Methods Enzymol., 167, 304–312.Glazer, A. N. (1999), Cyanobacterial photosynthetic apparatus: An over-
view, in Marine Cyanobacteria, special issue 19, edited by L. Charpyand A. W. D. Larkum, pp. 419–430, Bull. de l’Inst. oc�eanographique,Monaco.
Glazer, A. N., and L. Stryer (1984), Phycofluor Probes, Trends Biochem.Sci., 9(10), 423–427, doi:10.1016/0968-0004(84)90146-4.
Glazer, A. N., J. A. West, and C. Chan (1982), Phycoerythrins as chemo-taxonomic markers in red algae––A survey, Biochem. Syst. Ecol., 10(3),203–215.
Gordon, H. R., D. K. Clark, J. L. Mueller, and W. A. Hovis (1980), Phyto-plankton pigments from the Nimbus-7 coastal zone color scanner––Comparisons with surface measurements, Science, 210(4465), 63–66,doi:10.1126/science.210.4465.63.
Haverkamp, T. H. A., D. Schouten, M. Doeleman, U. Wollenzien, J. Huis-man, and L. J. Stal (2009), Colorful microdiversity of Synechococcusstrains (picocyanobacteria) isolated from the Baltic Sea, ISME J., 3(4),397–408, doi:10.1038/ismej.2008.118.
Head, E. J. H., and P. Pepin (2010a), Monitoring changes in phytoplanktonabundance and composition in the Northwest Atlantic: A comparison ofresults obtained by continuous plankton recorder sampling and coloursatellite imagery, J. Plankton Res., 32(12), 1649–1660, doi:10.1093/plankt/fbq120.
Head, E. J. H., and P. Pepin (2010b), Spatial and inter-decadal variability inplankton abundance and composition in the Northwest Atlantic (1958–2006), J. Plankton Res., 32(12), 1633–1648, doi:10.1093/plankt/fbq090.
Hill, D. R. A., and K. S. Rowan (1989), The biliproteins of the Cryptophy-ceae, Phycologia, 28(4), 455–463, doi:10.2216/i0031–8884-28-4-455.1.
Hoef-Emden, K. (2008), Molecular phylogeny of phycocyanin-containingcryptophytes: Evolution of biliproteins and geographical distribution, J.Phycol., 44(4), 985–993, doi:10.1111/j.1529–8817.2008.00530.x.
Hoffmann, L. J., I. Peeken, K. Lochte, P. Assmy, and M. Veldhuis (2006),Different reactions of Southern Ocean phytoplankton size classes to ironfertilization, Limnol. Oceanogr., 51(3), 1217–1229.
Hoge, F. E., and R. N. Swift (1990), Photosynthetic Accessory Pigments -Evidence for the Influence of Phycoerythrin on the Submarine Light-Field, Remote Sens. Environ., 34(1), 19–35.
Hoge, F. E., C. W. Wright, T. M. Kana, R. N. Swift, and J. K. Yungel(1998), Spatial variability of oceanic phycoerythrin spectral typesderived from airborne laser-induced fluorescence emissions, Appl.Optics, 37(21), 4744–4749, doi:10.1364/Ao.37.004744.
Horiuchi, T., and F. Wolk (2008), Multispectral measurements of fluores-cence and phytoplankton, Sea Technol., 49(9), 15–19.
Iturriaga, R., and B. G. Mitchell (1986), Chroococcoid cyanobacteria - asignificant component in the food web dynamics of the open ocean, Mar.Ecol. Prog. Ser., 28(3), 291–297, doi:10.3354/meps028291.
Kim, J. J., Y. M. Jeon, J. H. Noh, and M. Y. Lee (2011), Isolation and char-acterization of a new phycoerythrin from the cyanobacterium Synecho-coccus sp ECS-18, J. Appl. Phycol., 23(1), 137–142, doi:10.1007/s10811-010-9554-2.
Kirk, J. T. O. (1986), Optical properties of picoplankton suspensions, inPhotosynthetic Picoplankton, edited by T. Platt and W. K. W. Li, vol.214, pp. 501–520, Can. Bull. of Fish. and Aquat. Sci., Ottawa.
Kronick, M. N. (1986), The use of phycobiliproteins as fluorescent labels inimmunoassay, J. Immunol. Methods, 92(1), 1–13.
Lantoine, F., and J. Neveux (1997), Spatial and seasonal variations in abun-dance and spectral characteristics of phycoerythrins in the tropical north-eastern Atlantic Ocean, Deep Sea Res. Part I, 44(2), 223–246.
Lantoine, F., and J. Neveux (1999), Phycoerythrins in the sea: Abundanceand spectral diversity, in Marine Cyanobacteria, special issue 19, editedby L. Charpy and A. W. D. Larkum, pp. 443–450, Bull. de l’Inst.oc�eanographique, Monaco.
Leboulanger, C., U. Dorigo, S. Jacquet, B. Le Berre, G. Paolini, and J. F.Humbert (2002), Application of a submersible spectrofluorometer forrapid monitoring of freshwater cyanobacterial blooms: A case study,Aquat. Microb. Ecol., 30(1), 83–89, doi:10.3354/Ame030083.
Lubac, B., and H. Loisel (2007), Variability and classification of remotesensing reflectance spectra in the eastern English Channel and southernNorth Sea, Remote Sens. Environ., 110, 45–48.
MacColl, R. (1998), Cyanobacterial phycobilisomes, J. Struct. Biol.,124(2–3), 311–334, doi:10.1006/jsbi.1998.4062.
Marie, D., N. Simon, and D. Vaulot (2005), Phytoplankton cell counting byflow cytometry, in Algal Culturing Techniques, edited by R. A. Ander-sen, pp. 253–268, Elsevier Acad. Press, Amsterdam.
Matsuoka, A., Y. Hout, K. Shimada, S. Saitoh, and M. Babin (2007), Bio-optical characteristics of the western Arctic Ocean: Implications forocean color algorithms, Can. J. Remote Sens., 33(6), 503–518.
McClain, C. R. (2009), A decade of satellite ocean color observations,Annu. Rev. Mar. Sci., 1, 19–42, doi:10.1146/annurev.marine.010908.163650.
Morel, A. (1997), Consequences of a Synechococcus bloom upon the opti-cal properties of oceanic (case 1) waters, Limnol. Oceanogr., 42(8),1746–1754.
Mueller, J. L. (1976), Ocean color spectra measured off oregon coast––Characteristic vectors, Appl. Optics, 15(2), 394–402.
TAYLOR ET AL.: ESTIMATING PHYCOERYTHRIN FROM RADIANCE
12

Neveux, J., M. M. B. Tenorio, C. Dupouy, and T. A. Villareal (2006), Spec-tral diversity of phycoerythrins and diazotroph abundance in tropicalwaters, Limnol. Oceanogr., 51(4), 1689–1698.
North, G. R., T. L. Bell, R. F. Cahalan, and F. J. Moeng (1982), SamplingErrors in the Estimation of Empirical Orthogonal Functions, Mon.Weather Rev., 110(7), 699–706.
Olson, R. J., S. W. Chisholm, E. R. Zettler, and E. V. Armbrust (1988),Analysis of Synechococcus pigment types in the sea using single anddual beam flow cytometry, Deep Sea Res. Part A, 35(3), 425–440,doi:10.1016/0198-0149(88)90019-2.
Olson, R. J., S. W. Chisholm, E. R. Zettler, and E. V. Armbrust (1990), Pig-ments, size, and distribution of Synechococcus in the North Atlantic andPacific Oceans, Limnol. Oceanogr., 35(1), 45–58.
Olson, R. J., A. Shalapyonok, and H. M. Sosik (2003), An automated sub-mersible flow cytometer for analyzing pico- and nanophytoplankton:FlowCytobot, Deep Sea Res. Part I, 50(2), 301–315.
Ong, L. J., and A. N. Glazer (1991), Phycoerythrins of marine unicellularcyanobacteria: 1. Bilin types and locations and energy-transfer pathwaysin Synechococcus spp phycoerythrins, J. Biol. Chem., 266(15), 9515–9527.
Ong, L. J., A. N. Glazer, and J. B. Waterbury (1984), An unusual phycoery-thrin from a marine Cyanobacterium, Science, 224(4644), 80–83.
Palenik, B. (2001), Chromatic adaptation in marine Synechococcus strains,Appl. Environ. Microbiol., 67(2), 991–994, doi:10.1128/aem.67.2.991–994.2001.
Partensky, F., J. Blanchot, F. Lantoine, J. Neveux, and D. Marie (1996),Vertical structure of picophytoplankton at different trophic sites of thetropical northeastern Atlantic Ocean, Deep Sea Res. Part I, 43(8), 1191–1213.
Partensky, F., J. Blanchot, and D. Vaulot (1999), Differential distributionand ecology of Prochlorococcus and Synechococcus in oceanic waters:A review, in Marine Cyanobacteria, edited by L. Charpy and A. W. D.Larkum, vol. 19, pp. 457–475, Bull. de l’Inst. oc�eanographique,Monaco.
Proctor, C. W., and C. S. Roesler (2010), New insights on obtaining phyto-plankton concentration and composition from in situ multispectral Chlo-rophyll fluorescence, Limnol. Oceanogr., 8, 695–708, doi:10.4319/lom.2010.8.695.
R Development Core Team (2011), R: A Language and Environment forStatistical Computing. R Found. for Stat. Comput., Vienna, Austria,ISBN 3–900051-07-0. [Available at http://www.R-project.org, accessed9 May 2013.].
Scanlan, D. J., and N. J. West (2002), Molecular ecology of the ma-rine cyanobacterial genera Prochlorococcus and Synechococcus,FEMS Microbiol. Ecol., 40(1), 1–12, doi :10.1016/s0168–6496(01)00217-3.
Sepp€al€a, J., P. Ylostalo, and H. Kuosa (2005), Spectral absorption and fluo-rescence characteristics of phytoplankton in different size fractionsacross a salinity gradient in the Baltic Sea, Int. J. Remote Sens., 26(2),387–414, doi:10.1080/01431160410001723682.
Sidler, W. A. (1994), Phycobilisome and Phycobiliprotein structures, inThe Molecular Biology of Cyanobacteria, edited by D. A. Bryant,Kluwer Acad., Dordrecht.
Six, C., J. C. Thomas, L. Garczarek, M. Ostrowski, A. Dufresne, N. Blot,D. J. Scanlan, and F. Partensky (2007), Diversity and evolution of phyco-bilisomes in marine Synechococcus spp.: A comparative genomicsstudy, Genome Biol., 8(12), doi:10.1186/Gb-2007-8-12-R259.
Smith, R. C., and K. S. Baker (1984), The analysis of ocean optical data,Proc. Soc. Photo Opt. Instrum. Eng., 489, 119–126.
Staal, M., S. T. Hekkert, G. J. Brummer, M. Veldhuis, C. Sikkens, S. Per-sijn, and L. J. Stal (2007), Nitrogen fixation along a north-south transectin the eastern Atlantic Ocean, Limnol. Oceanogr., 52(4), 1305–1316,doi:10.4319/lo.2007.52.4.1305.
Subramaniam, A., E. J. Carpenter, D. Karentz, and P. G. Falkowski (1999),Bio-optical properties of the marine diazotrophic cyanobacteria Tricho-desmium spp. I. Absorption and photosynthetic action spectra, Limnol.Oceanogr., 44(3), 608–617.
Taylor, B. B., E. Torrecilla, A. Bernhardt, M. H. Taylor, I. Peeken, R.Röttgers, J. Piera, and A. Bracher (2011), Bio-optical provinces in theeastern Atlantic Ocean and their biogeographical relevance, Biogeo-sciences, 8(12), 3609–3629, doi:10.5194/bg-8–3609-2011.
Toole, D. A., and D. A. Siegel (2001), Modes and mechanisms of oceancolor variability in the Santa Barbara Channel, J. Geophys. Res.,106(C11), 26,985–27,000.
Waterbury, J. B., and R. Rippka (1989), Subsection I. Order Chroococ-cales, in Bergey’s Manual of Systematic Bacteriology, edited by J. T.Staley, M. P. Bryant, N. Pfennig and J. G. Holt, pp. 1728–1746, Williams& Wilkins, Baltimore, MD.
Waterbury, J. B., S. W. Watson, R. R. L. Guillard, and L. E. Brand (1979),Widespread occurence of a unicellular, marine, planktonic cyanobacte-rium, Nature, 277(5694), 293–294, doi:10.1038/277293a0.
Wood, A. M., D. A. Phinney, and C. S. Yentsch (1998), Water columntransparency and the distribution of spectrally distinct forms of phycoer-ythrin-containing organisms, Mar. Ecol. Prog. Ser., 162, 25–31,doi:10.3354/Meps162025.
Wyman, M. (1992), An in vivo method for the estimation of phycoerythrinconcentrations in marine cyanobacteria (Synechococcus spp.), Limnol.Oceanogr., 37(6), 1300–1306.
Wyman, M., R. P. F. Gregory, and N. G. Carr (1985), Novel role for phy-coerythrin in a marine Cyanobacterium, Synechococcus strain DC2, Sci-ence, 230(4727), 818–820, doi:10.1126/science.230.4727.818.
Zhao, K.-H., R. J. Porra, and H. Scheer (2011), Phycobiliproteins, in Phyto-plankton Pigments––Characterization, Chemotaxonomy and Applica-tions in Oceanography, edited by S. Roy, C. A. Llewellyn, E. S. Egelandand G. Johnson, pp. 375–411 Cambridge Univ. Press, Cambridge.
Zubkov, M. V., M. A. Sleigh, G. A. Tarran, P. H. Burkill, and R. J. G. Leakey(1998), Picoplanktonic community structure on an Atlantic transect from50 degrees N to 50 degrees S, Deep Sea Res. Part I, 45(8), 1339–1355.
TAYLOR ET AL.: ESTIMATING PHYCOERYTHRIN FROM RADIANCE
13