
Estimating the Ability of Gamblers to Detect Differences ...
20
17 UNLV Gaming Research & Review Journal ♦ Volume 15 Issue 1 Estimating the Ability of Gamblers to Detect Differences in the Payback Percentages of Reel Slot Machines: A Closer Look at the Slot Player Experience Anthony F. Lucas A. K. Singh The authors made equal contributions to the production of this article. Abstract The results of play on 60 different computer simulated reel slots challenge the widely held theory that frequent slot players are able to detect changes in a slot machine’s house advantage as slight as 1 to 2%. These findings affect the formulation of critical and capital-intensive customer retention strategies and brand positioning campaigns within the gaming industry. An overwhelming majority of 10,000 virtual players were not able to reject the hypothesis of equal payback percentages after playing both a 3% game and a 12% game (i.e., a 400% increase in the house advantage). This result held across three levels of pay table variance and five levels of trials or spins. The differences in house advantages examined herein ranged from 33% to 400%, across the various 2-game comparisons. The results also fail to support those who argue or fear that frequent slot players are able to detect changes in the house advantage over time. Profits from slot operations are critical to the success of most casino resorts, making this research into the slot player experience a valuable contribution to both the literature and casino management. Key words: Casino operations analysis, casino operations management, slot player experience. Introduction In spite of a vast array of gaming and nongaming profit centers, even massive integrated resorts rely heavily on cash flows produced by casino operations (Kale, 2006; MacDonald & Eadington, 2008). However, most casinos around the globe are not housed within integrated resorts, nor are they located in destination markets. Without the diversified revenue base of an integrated resort, gaming operators increasingly depend upon profit contributions from slot machines. Within the U.S., slot operations are particularly critical to the success of nearly all gaming resorts. In 2010, slot revenues comprised 64% of Nevada’s gross gaming revenue and 70% of Atlantic City’s gross gaming win (Nevada Gaming Control Board, 2011; New Jersey Casino Control Commission, 2011). Slot revenues are even more crucial to less established markets. In 2009, slot machines accounted for 88% of the gross gaming win produced by Illinois riverboats (Illinois Gaming Board, 2010). Iowa riverboats posted similar results in fiscal year 2010, with 92% of gross gaming win coming from slots (Iowa Racing & Gaming Commission, 2010). From a cash flow perspective, slot Anthony F. Lucas* Associate Professor William F. Harrah College of Hotel Administration University of Nevada, Las Vegas 4505 Maryland Parkway Box 456021 Las Vegas, NV 89154-6021 E-mail:[email protected] Phone: 702-300-6064 * Corresponding author A.K. Singh Professor William F. Harrah College of Hotel Administration University of Nevada, Las Vegas 4505 Maryland Parkway Box 456021 Las Vegas, NV 89154-6021 E-mail: [email protected] Phone: 702-845-0391
Transcript of Estimating the Ability of Gamblers to Detect Differences ...

17UNLV Gaming Research & Review Journal ♦ Volume 15 Issue 1
Estimating the Ability of Gamblers to Detect Differences in the
Payback Percentages of Reel Slot Machines: A Closer Look at the
Slot Player ExperienceAnthony F. Lucas
A. K. Singh
The authors made equal contributions to the production of this article.
Abstract The results of play on 60 different computer simulated reel slots challenge the widely held theory that frequent slot players are able to detect changes in a slot machine’s house advantage as slight as 1 to 2%. These findings affect the formulation of critical and capital-intensive customer retention strategies and brand positioning campaigns within the gaming industry. An overwhelming majority of 10,000 virtual players were not able to reject the hypothesis of equal payback percentages after playing both a 3% game and a 12% game (i.e., a 400% increase in the house advantage). This result held across three levels of pay table variance and five levels of trials or spins. The differences in house advantages examined herein ranged from 33% to 400%, across the various 2-game comparisons. The results also fail to support those who argue or fear that frequent slot players are able to detect changes in the house advantage over time. Profits from slot operations are critical to the success of most casino resorts, making this research into the slot player experience a valuable contribution to both the literature and casino management.
Key words: Casino operations analysis, casino operations management, slot player experience.
Introduction In spite of a vast array of gaming and nongaming profit centers, even massive integrated resorts rely heavily on cash flows produced by casino operations (Kale, 2006; MacDonald & Eadington, 2008). However, most casinos around the globe are not housed within integrated resorts, nor are they located in destination markets. Without the diversified revenue base of an integrated resort, gaming operators increasingly depend upon profit contributions from slot machines. Within the U.S., slot operations are particularly critical to the success of nearly all gaming resorts. In 2010, slot revenues comprised 64% of Nevada’s gross gaming revenue and 70% of Atlantic City’s gross gaming win (Nevada Gaming Control Board, 2011; New Jersey Casino Control Commission, 2011). Slot revenues are even more crucial to less established markets. In 2009, slot machines accounted for 88% of the gross gaming win produced by Illinois riverboats (Illinois Gaming Board, 2010). Iowa riverboats posted similar results in fiscal year 2010, with 92% of gross gaming win coming from slots (Iowa Racing & Gaming Commission, 2010). From a cash flow perspective, slot
Anthony F. Lucas*Associate Professor
William F. Harrah College of Hotel Administration
University of Nevada, Las Vegas4505 Maryland Parkway
Box 456021Las Vegas, NV 89154-6021
E-mail:[email protected]: 702-300-6064
* Corresponding author
A.K. SinghProfessor
William F. Harrah College of Hotel Administration
University of Nevada, Las Vegas4505 Maryland Parkway
Box 456021Las Vegas, NV 89154-6021
E-mail: [email protected]: 702-845-0391

18 UNLV Gaming Research & Review Journal ♦ Volume 15 Issue 1
operations grow in importance. For example, a Nevada casino might expect to produce a profit margin between 60% and 70% in slots, as opposed to an expected profit margin of 10% to 15% in table games (Kilby, Fox, & Lucas, 2004)1. To highlight this disparity, one major U.S. gaming operator reported that more than 80% of its overall operating profits stemmed from slot operations (McDonald, 2001). Given the importance of slots to the success of many casino resorts, a deep understanding of the slot player experience is equally vital. That said, there are many widely held theories related to slot management, which for the most part have escaped academic scrutiny. One of these theories is related to the effects of changes in the house advantage of reel slot machines. There is a strong belief, especially among casino operators and gaming pundits, that frequent slot players are able to detect even slight changes in the house advantage (Higgins, 2010; Klebanow, 2006; Velotta, 2009). This is a controversial subject, given that most gaming operators around the world cater to some form of frequently visiting clientele. These patrons go by a variety of names such as day-trippers, drive-in players, repeaters, or simply frequent visitors. By any name, they are crucial to the success of many casino operators. Given the steady interaction of frequent slot players, it is reasonable to question whether they would be able to detect changes in the house advantage of the games they play. If players do have this ability, any increases in par could certainly damage their perceptions of the offending operator’s gaming value. That is, no operator wants their slot floor to be thought of as a place in which it is exceedingly difficult to win. The concern here is that brand damage (in terms of gaming value) would eventually result from identified increases in the house edge. The reality is that frequent slot players endure many losing trips. As a result, abstract measures of gaming value such as time on device (TOD) have emerged to gauge the “success” of a player’s experience, in the absence of a winning trip. Many operators struggle to position themselves as generous providers of TOD. Such efforts are aimed at retaining and attracting players by way of marketing communications that tout gaming value. One way that operators choose to communicate this message is to offer games with low house advantages. After all, if you believe that a low house advantage leads to greater TOD, then what better way is there to communicate value? On the flip side, what if players cannot easily detect or identify changes in the house advantage? Should management be less concerned with the house advantage? Are there other pay table parameters that have a greater affect on the player’s TOD? Maybe management is paying too much attention to house advantage based on the assumptions that (1) players are hypersensitive to changes in the house advantage and that (2) house advantage drives TOD, which leads to perceptions of gaming value. It might appear obvious that increases in the house advantage would be detectable by veteran slot players and that such increases would burn through a player’s bankroll faster, leading to noticeable decreases in TOD. However, the house edge represents the mean of the slot machine’s outcome distribution. The house advantage is a measure of central tendency and does not express the extent to which possible outcomes vary. Slot machines have remarkably skewed outcome distributions. Further, the house advantage represents the game’s expected value over the long-run, but what is the duration of a typical gaming session for a frequently visiting player? Does it is still seem obvious that players would be able to detect changes in the house advantage?
Terms of the Trade Prior to any detailed discussion of casino operations, most require the definition of a few key terms. The following paragraphs define industry terms central to this study. Payback percentage is the percentage of units wagered that is refunded to the player. This metric is stated in terms of a long-run perspective. That is, if a player wagers 100 units through a 99%-payback slot machine, there is no guarantee that the game will return 99 1 Profit margins include slot and table game marketing expenses.

19UNLV Gaming Research & Review Journal ♦ Volume 15 Issue 1
Estimating the Ability of Gamblers to Detect Differences in the Payback Percentages of Reel Slot Machinesunits to the player. In fact, it is quite likely that it will not. However, after many wagers (usually millions), the prediction interval for the payback percentage will close-in on the game’s programmed mark of 99%. If the payback percentage of a game is subtracted from one, the difference is referred to as the par (a.k.a. the house advantage or house edge). For example, if a game has a payback percentage of 99, its par is 1%. (i.e., 1.00 – 0.99 = 0.01). In other words, in the long-run, management can expect to win 1% of all wagers placed on such a game. To complicate matters, some slot machines have multiple payback percentages. For example, the payback percentage on maximum-coin wagers is sometimes greater than it is on all other wagers. This structure provides an incentive for players to make greater wagers, resulting in something akin to a volume discount. For the purposes of this study, both payback percentage and par represent the same characteristic of the game, albeit from very different perspectives. Individual slot machines are more often described in terms of par in discussions between casino operators, whereas game makers are more inclined to refer to payback percentages. While theoretical win is the product of the dollar-amount wagered and the par, the actual win/(loss) divided by the dollar-amount wagered produces what is referred to by gaming operators as actual hold percentage. Therefore, any reference to hold percentage must specify whether it pertains to par or actual hold percentage. For example, a player may play a game with a 5% par for one hour. Over the course of the hour, she may place $1,000 in wagers, in the process of losing $100. Although the game’s par is 5%, the player produced an actual hold percentage of 10% from the casino operator’s perspective (i.e., $100 casino win ÷ $1,000 in player wagers). Time on device (TOD) refers to the amount of play time afforded a slot player. Of course, TOD is a function of multiple factors, including the player’s bankroll, wagering behavior, and the game’s pay table design. A slot machine’s pay table design is often described in terms of its par (i.e., expected value), volatility (i.e., standard deviation), and hit frequency. The hit frequency represents the percentage of spins that produce a payout of at least one unit, regardless of the number of units wagered. Although TOD would suggest that play time is measured in terms of minutes or hours, critical differences in individual wagering behavior would quickly make a mockery of such a definition. That is, differences in the amount wagered per spin or the number of spins per hour would certainly make TOD comparisons across players very difficult. For these reasons, any study examining TOD must include a clear definition of how it is expressed.
Literature Review Dunn (2004) describes a common take on the role of par in what could be called the slot player satisfaction process. Although Dunn himself challenges many of the views he describes, the model illustrated in Figure 1 was created to summarize his description of these widely held opinions.
Figure 1. An Extant Theoretical Model of the Role of the Pay Table in the Slot Player’s Gaming Experience.
Game’s Par
Game’s Hit Frequency
Time on Device (i.e., single trip play time)
Player Perceptions of Gaming
Value
Satisfaction with Gaming Experience
Loyalty Behavior
(+/-)
(+/-)
(+/-) (+/-) (+/-)

20 UNLV Gaming Research & Review Journal ♦ Volume 15 Issue 1
While Hit Frequency is shown in Figure 1, Dunn (2004) notes that operators often think of par as the primary determinant of the play time afforded a gambler. Of course, this assumes all else is held constant, such as the player’s bankroll and wagering behavior. Dunn also notes the frequent lack of consideration for the effect of the pay table variance on TOD, hence its omission from Figure 1. In short, the operator’s take on Figure 1 would hold that changes in par lead to changes in a player’s single-visit play time. Further, players make value-based judgments about their gaming experience and the casino’s overall slot machine offering, based on the play time they are afforded from their single-trip bankroll. These perceptions serve as the foundation of their satisfaction with the gaming experience, which, in turn, influences their loyalty behavior. The primary behavioral concerns of operators relate to the slot player’s intent to return and willingness to recommend the property to others. That said, the focus of the current study challenges the front-end of Figure 1. Specifically, the ability of slot players to perceive changes in par, over the course of a single-visit and beyond. To this extent, the following paragraphs examine the literature as it relates to the specification, structure, and assumptions that underlie the popular operating theory modeled in Figure 1.
Time on Device and Par There is an agreement in the literature with respect to the notion that TOD is a critical determinant of slot player satisfaction (Lucas 2003; Dunn 2004; Klebanow 2006; Lucas & Singh, 2008; Higgins, 2010). In the case of frequent gamblers, TOD may take on exaggerated importance. However, there is disagreement regarding the role of par in the determination of a player’s TOD, especially over the course of a single gaming session. Specifically, the literature is replete with claims that par is a critical factor in the determination of a player’s TOD (Harrigan & Dixon, 2009; Higgins, 2010; Klebanow, 2006; Velotta, 2009). In fact, Harrigan and Dixon state, “The differences in payback percentages have a direct effect on playing time.” They also note, “Payback percentage is the major distinguishing characteristic between multiple approved versions of the same game.” Harrigan and Dixon offer the following example in support of their argument that payback percentage affects a player’s time on device.
“In Lobstermania [a specific reel slot machine], a player wagering $1.00 per spin would lose, on average, 3.8 cents per spin on the 96.2% game [refers to the payback % for that version of Lobstermania] and 15 cents per spin on the 85% game [a second version of Lobstermania]. Thus, the player loses approximately four times more money per spin on the 85% game than on the 96.2% game (15 ÷ 3.8 = 3.95). A player arriving with a “bankroll” of $10.00 and wagering $1.00 per spin, who gambles until the bankroll is depleted, would make, on average, 263 one-dollar wagers on the 96.2% game ($10.00 ÷ $0.038 = 263), but only 67 one-dollar wagers on the 85% game ($10.00 ÷ $0.15 = 66.7); thus a player with a specific bankroll would have approximately four times more gambling time on the 96.2% version versus the 85% version (263 ÷ 66.7 = 3.95).” [p. 86]
Harrigan & Dixon were most likely attempting to demonstrate a long-run phenomenon by way of a short-run example, describing a single gaming trip made by an individual player. Such explanations are common, yet very misleading. That is, this example suggests that the outcome distribution of a slot machine is somehow uniform. This is not the case. Slot machines do not win a player’s bankroll at anything that resembles a steady or uniform rate. In fact, their paper includes a par sheet, which contains the key to understanding the great difference between such short- and long-run outcome distributions. Specifically, the par sheet for the Double Diamond Deluxe game discussed in their paper shows that 85.7 % of all spins result in a payout of zero. By the way, most reel slots feature a similar design (e.g., see Event 76 in Appendix A

21UNLV Gaming Research & Review Journal ♦ Volume 15 Issue 1
Estimating the Ability of Gamblers to Detect Differences in the Payback Percentages of Reel Slot Machinesof the current study). If a player wagers one coin, hits the spin button, and receives no payout, the player loses one coin. If this happens on 85.7% of the spins, a great number of spins would be required before anyone could expect the game to produce an outcome representative of its long-run design (i.e., a programmed payback percentage of 92.5%). Moreover, the top awards occur extremely infrequently, requiring many trials to produce these outcomes. In short, the slot machines simply redistribute wealth from the many to the few. That is, the many losers fund the jackpots won by the few winners. In the short-run, there is nothing uniform about the individual gaming experiences of slot players. From the player perspective, most trips result in actual losses that fall well short of the game’s programmed payback percentage, with very few trips resulting in wins that greatly exceed the same payback percentage. From the player’s point of view, individual slot machines rarely produce outcomes representative of the long-term programmed house advantage, over the course of single gaming session. That is, slot machines are almost always operating greatly out of balance in the short-term.
Ability to Perceive Differences in Par Independent of whether changes in par actually influence single-visit TOD, many believe that avid gamblers are able to detect even modest changes in par (Higgins, 2010; Klebanow, 2006; Velotta, 2009). Such detection is often feared by those who are positioning their property in terms of gaming value (i.e., an EDLP strategy2). Commenting on a Las Vegas operator’s announcement of recently reduced pars, Higgins stated, “The 1 – 2% increase in slot paybacks enacted by Gaughan [the casino operator], though seemingly insignificant, are in fact enough for routine slot players to notice.” Klebanow concurs claiming, “When a slot manager makes the decision to increase the hold percentage on the slot floor, frequent players quickly recognize the change.” He goes on to advise casino managers against assuming that an increase in par from 7% to 9% would go unnoticed by the vast majority of their players. In Velotta, Michael Meczka, a gaming industry consultant, states that by dropping the slot machine hold percentage from 7% to 6%, gamblers will play longer, have a better time, and be more likely to make a return visit. This conclusion certainly suggests that the slot player would perceive such a change in par (i.e., from 7% to 6%). In Anderer (2010, p. 42), one gaming pundit explained that “loosened slots represent real value and that players gravitate toward lower-hold environments.” This statement was made in response to another’s opinion that slots suffer from “an obfuscation of pricing.” Unfortunately there is a paucity of published empirical research on the ability of players to identify differences in par. The results of one related study found the theoretical win levels of $5.00 reel slots unaffected by a 50% increase in par (Lucas & Brandmier, 2005). Lucas and Brandmier (2005) examined slot machine performance data within the context of a year-over-year quasi-experimental design. In the five-month period described as Fall/Winter 2002, the games featured a 5.0% par. For the same period in 2003, the pars were increased to 7.5%. Other than the 50% increase in par, the games remained unchanged with respect to location on the floor and game theme. Despite a remarkable increase in the par, the theoretical win per game in the 2003-period was $582, which was $53 greater than that produced in the 2002-period. Although this difference was not statistically significant, if the players did notice the change in par, they did not seem to mind. It is important to note that this result was observed in spite of overall business trends in the opposite direction. That is, in Fall/Winter 2003, overall slot win and total $5.00 reel slot win both experienced a mild decline from the same period in 2002. While the season, game theme, and floor location were held constant, questions remained regarding the ability of slot players to detect changes in par over time. 2 EDLP stands for every-day low price, which is a pricing strategy described in the retail literature.

22 UNLV Gaming Research & Review Journal ♦ Volume 15 Issue 1
Specifically, is a five-month period long enough for players to detect and respond to a change in par? Given a greater length of time (i.e., number of trips), slot players may be able to detect such changes. Also, Lucas and Brandmier (2005) were only provided with the year-over-year results of 38 reel slots. Despite these limitations, it remains counter-intuitive that the casino’s theoretical win would increase on the heels of 50% increase in “price.” The following section further examines the limited empirical research on the effects of manipulating the payback percentage.
Effects of Changes in Payback Percentage Within the problem gambling literature, Haw (2007) examined the relationship between reinforcement and slot machine selection. Reinforcement was expressed in two different ways: Win frequency and payback percentage (i.e., 1.0 – par). Seventy undergraduate students played a simulated version of a 2x Double Cherry slot machine. The game was loaded on two different personal computers and the students were told that their outcomes would be converted from game credits to extra-credit points applicable toward the calculation of their course grade. That is, they were given motivation to maximize their ending game credit value. There were two phases of the study: A practice phase and a test phase. During the practice phase, the subjects were required to initiate 40 trials on each of the two “machines.” Both simulated games were identical in terms of the programmed payback percentage. The win frequency and payback percentage was recorded for each subject, on each of the two games. After a brief questionnaire was completed following the practice phase, the subjects returned to the game room to begin the test phase. They were told that they must complete 120 trials on the game (i.e., terminal) of their choice. They were also told that they could switch games at any time. Each student was staked with 500 game credits. This experiment was conducted to determine whether the results experienced by the subjects during the practice phase would influence their choice of games in the test phase. That is, would the subjects initially choose the game that afforded them the greatest payback percentage and/or win frequency during the practice phase? Using a Chi-Squared test (with alpha set at 0.05), no statistically significant relationship was found between game choice in the test phase and win frequency in the practice phase. Using the same Chi-Squared test, no evidence of a statistically significant relationship was found between game choice in the test phase and payback percentage in the practice phase. That is, knowing which game produced the greatest payback percentage in the practice phase did not indicate (with statistical significance) which game a subject would choose to play in the test phase. The same could be said for win frequency. Haw’s (2007) result applies to the current study in that it addresses the extent to which the prior gaming experiences of slot players shape their future gaming behavior. More specifically, despite the insistence of many in the gaming industry, Haw’s subjects failed to regard the importance of payback percentage when making subsequent game choices. Perhaps creating the perception of greater payback percentages is more important than actually offering greater payback percentages. It is important to remember that the two games in Haw’s experiment featured identical programmed payback percentages. Only the actual payback percentages experienced by the subjects varied across the two games. Staying in the problem gambling literature, other studies have failed to establish a link between programmed payback percentages and gaming behavior (Weatherly & Brandt, 2004; Weatherly, Thompson, Hodny, & Meier, 2009). Weatherly and Brandt failed to find a statistically significant relationship between payback percentage and the number of trials per gaming session (i.e., one expression of TOD). A gaming session lasted a maximum of 15 minutes on each of three simulated slot machines, featuring programmed payback percentages of 75, 83, and 95. Weatherly et al. studied the gambling behavior of six women across three actual slot machines featuring varying payback percentages. They found little evidence to suggest that the programmed payback
23UNLV Gaming Research & Review Journal ♦ Volume 15 Issue 1
Estimating the Ability of Gamblers to Detect Differences in the Payback Percentages of Reel Slot Machinespercentage influenced the observed gambling behavior of their subjects, including choice of games played. Like Weatherly and Brandt, the gaming sessions in Weatherly et al. were short, lasting a maximum of 20 minutes. The brevity of these sessions certainly could have influenced the results of these two studies. Just the same, with the paucity of experimental research on the effects of payback percentages on gaming behavior, the results of these studies provide useful start positions for more in-depth examinations of this topic. It is worth noting that several problem gaming researchers have sought to understand the relationship between reinforcement levels and gambling behavior, without considering the effect of the pay table variance on the ability of the subjects to perceive differences in reinforcement levels. Given such short gaming sessions (i.e., 15 and 20 minutes), the effect of the game’s variance is likely to obscure the long-term effects of the payback percentage. In others words, it is possible if not likely that the variance in the outcome distributions of games would severely hinder a subject’s ability to perceive differences in payback percentages, especially given such a limited number of trials. If such differences were not perceived, then researchers may not expect to find changes in the gaming behavior of the subjects. This brings us to the work of commercial gaming researchers. Specifically, their efforts to understand the critical determinants of a slot player’s TOD.
Pay Table Variance and TOD This stream of research started with a simulation of ten slot machines with hit frequencies ranging from 6.7% to 30.6% (Kilby & Fox, 1998). With par held constant at 10%, their simulation was an examination of the alternative hypothesis that increases in hit frequency would be matched by increases in pulls per losing player (i.e., a TOD measure). The results failed to support this hypothesis, producing an inconsistent pattern between the ten hit frequencies and the ten corresponding TOD outcomes. Several years later, researchers began to include the pay table’s standard deviation as a predictor variable in models designed to predict the dollar-amount wagered on each slot machine (Lucas, Dunn, Roehl, & Wolcott, 2004; Lucas & Dunn, 2005). The results for the standard deviation variables were significant and negative. That is, increases in the standard deviation of the pay table produced significant decreases in the wagering levels. Dunn (2004) questioned whether operators should concern themselves with a game’s par when attempting to manage TOD, loyalty, or position the property and/or brand in terms of gaming value. He suggested that attending to the standard deviations of the games may be the best approach to managing these interrelated and critical objectives. Lucas, Singh, and Gewali (2007) employed the pay tables of six different slot machines in a simulation that demonstrated the ability of the game’s variance to affect TOD. With par held constant at 10%, they found that increases in the pay table variance were matched with decreases in TOD. Lucas and Singh (2008) extended their previous study by simulating five different games with pars that incrementally decreased and variances that incrementally increased. That is, Game 1 of 5 featured the greatest par and the least variance, while Game 5 of 5 featured the least par and the greatest variance. In the end, the results clearly suggested that it was the changes in variance that drove their TOD measure. That is, increases in variance were associated with decreases in TOD, while increases in par were associated with increases in TOD. The latter result clearly contradicts popular theory with regard to the effect of changes in par on TOD. Simply put, the effect of pay table variance overpowered the effect of par.
Research Questions In review, TOD is widely accepted a critical determinant of slot player satisfaction, especially in repeater markets (Lucas 2003; Dunn 2004; Klebanow 2006; Lucas & Singh, 2008; Higgins, 2010). However, there is disagreement in the literature regarding the key determinants of TOD. While both academics and industry professionals contend that par directly influences a slot player’s TOD (Harrigan & Dixon, 2009; Higgins, 2010;

24 UNLV Gaming Research & Review Journal ♦ Volume 15 Issue 1
Klebanow, 2006; Velotta, 2009), empirical research results make a strong case for pay table variance as the primary driver of single-visit TOD (Lucas & Singh, 2008). Further, the findings of problem gambling researchers failed to support the link between payback percentage and the number of trials per gaming session (Weatherly & Brandt, 2004). In spite of these empirical results, many discuss the effects of par as if it were the only determinant of TOD, arguing that frequent players are able to detect even slight changes in par over time (Higgins, 2010; Klebanow, 2006; Velotta, 2009). The ability to detect changes in par could directly affect the often considerable efforts of gaming companies to position their brands in the marketplace. Specifically, operators catering to frequent gamers are concerned with how existing and potential customers view their slot floor in terms of gaming value. This study seeks to extend this literature by addressing the questions that remain regarding the ability of slot players to detect changes in price (i.e., par or payback percentage). Given the single-session bankroll and time constraints of players along with the effects of the pay table variance, could a difference in the programmed payback percentage be detected from the results of two typical gaming sessions featuring identical wagering behavior? Additionally, could players assimilate the actual results of multiple trips and somehow detect a change in a game’s payback percentage over time? By answering these questions, much more will be known about the extent to which the programmed payback percentage affects a player’s TOD. One way to address such concerns is to simulate games at varying levels of programmed payback percentages and measure the observed or actual payback percentages of virtual players. If the observed results do not warrant rejection of the hypothesis of equal payback percentages, then operators should not concern themselves with the ability of players to assimilate the results of multiple trips. That is, if the observed results do not provide sufficient evidence to reject the hypothesis of equal payback percentages at the trip level, then none will be found by aggregating the results produced over a greater number of individual trips. Regarding the concern that players can detect differences in par over time, gamblers can do no more than consider the outcomes of some number of single trips. Slot players do not produce ten-million-spin trips. If they did, this research would not be necessary, as the programmed and actual payback percentages would be inconsequentially different.
MethodologyPay Tables Drawing on work conducted for game makers, an actual slot machine pay table was modified to create twelve different versions of the same line game. Specifically, four payback percentages were created at three different levels of pay table variance. The ranges of the payback percentages and variance levels were selected such that they represented games that fell within the core offering of U.S. gaming operators. Although the aim was to hold the pay table variance constant across the four payback percentages, minimal changes were unavoidable. Because variance was added with each stage of the simulations, minor differences in the payback percentages also occurred across the three levels of variance. Given the complexity of the modern pay table, holding these parameters absolutely constant would be a most difficult task. Each of the games offered 76 discrete pay outs. The pay tables of the games examined in this paper were representative of actual reel slot machines. The information in Table 1 describes the critical parameters of the 12 pay tables.

25UNLV Gaming Research & Review Journal ♦ Volume 15 Issue 1
Estimating the Ability of Gamblers to Detect Differences in the Payback Percentages of Reel Slot Machines
Appendix A includes the probability density function (PDF) for each of the 12 games. The PDF lists each possible payout and the probability of each payout’s occurrence. It is the PDF that produces the game’s outcome distribution, which is used to compute its expected value (i.e., par) and its standard deviation.
Simulation All simulations were coded in the R programming language, version 2.11.1 (R Development Core Team, 2010). A sample of the code can be found in Appendix B. The
code was the same for all the simulations, save the changes to pay table data summarized in Table 1. Several simulations were conducted using the PDFs from each of the 12 games. That is, simulations were conducted at various payback percentages, numbers of spins (i.e., starting bankroll amounts), and levels of pay table variance. Specifically, 10,000 virtual players made one-unit wagers on each of four slot games, at the following play intervals: 250 spins; 500 spins; 750 spins; 1,000 spins; and 2,000 spins. This process was repeated at three different levels of variance, resulting in 60 separate simulations (i.e., 4 payback percentages, at 5 different bankroll levels, at 3 different levels of pay table variance). The aim was to hold the range of and difference between the payback percentages as close to constant as possible, at each stage of the simulation. This design aided in the comparison of the results across the three levels of pay table variance. Again, the stages of the simulation
were defined by the three general levels of pay table variance (i.e., the standard deviations shown in Table 1). After many conversations with industry executives and a review of the literature (Hannum & Cabot, 2005; Harrigan & Dixon, 2009), it was determined that an average of 500 spins per hour was a reasonable estimate of a reel slot player’s game pace. Based on this estimate, the simulations replicated gaming durations ranging from 30 minutes (i.e., 250 spins) to 4 hours of play (i.e., 2,000 spins). It should be noted that the game speed estimate is only necessary to the extent that it reflects the duration of a player’s interaction with the game on a single visit.
1
Table 1 Pay Table Summary Metrics
Payback
House Advantage
Standard Deviation*
Stage 1: Game 1 88.01% 11.99% 6.01933 coins Game 2 91.01% 8.99% 6.01375 coins Game 3 94.02% 5.98% 6.01062 coins Game 4 97.03% 2.97% 6.01072 coins Stage 2: Game 5 88.03% 11.97% 11.28587 coins Game 6 91.01% 8.99% 11.28609 coins Game 7 94.05% 5.95% 11.27799 coins Game 8 97.04% 2.96% 11.27803 coins Stage 3: Game 9 88.00% 12.00% 15.03385 coins Game 10 91.01% 8.99% 15.02896 coins Game 11 94.04% 5.96% 15.02441 coins Game 12 97.04% 2.96% 15.02810 coins Note: * The standard deviation is the square root of the pay table variance.
Simulations were conducted at various payback percentages,
numbers of spins (i.e., starting bankroll amounts), and levels of pay table variance. Specifically,
10,000 virtual players made one-unit wagers on each of four slot games, at the following play
intervals: 250 spins; 500 spins; 750 spins; 1,000 spins; and 2,000 spins.
26 UNLV Gaming Research & Review Journal ♦ Volume 15 Issue 1
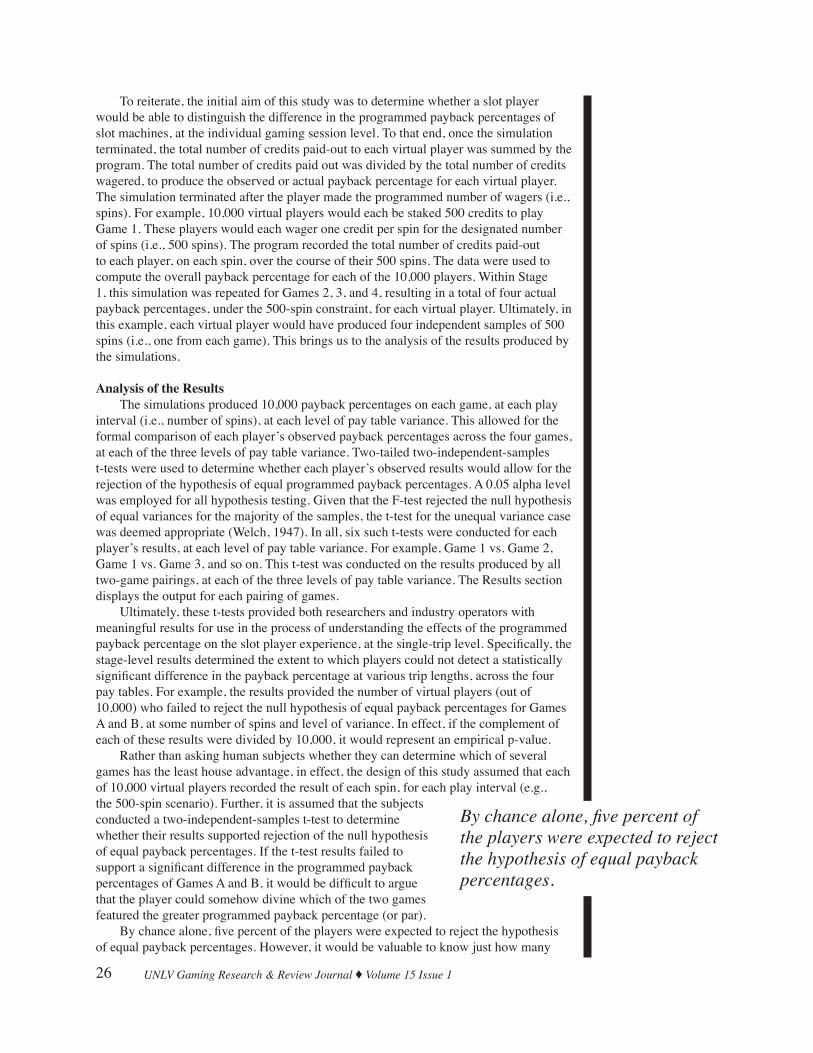
By chance alone, five percent of the players were expected to reject the hypothesis of equal payback percentages.
To reiterate, the initial aim of this study was to determine whether a slot player would be able to distinguish the difference in the programmed payback percentages of slot machines, at the individual gaming session level. To that end, once the simulation terminated, the total number of credits paid-out to each virtual player was summed by the program. The total number of credits paid out was divided by the total number of credits wagered, to produce the observed or actual payback percentage for each virtual player. The simulation terminated after the player made the programmed number of wagers (i.e., spins). For example, 10,000 virtual players would each be staked 500 credits to play Game 1. These players would each wager one credit per spin for the designated number of spins (i.e., 500 spins). The program recorded the total number of credits paid-out to each player, on each spin, over the course of their 500 spins. The data were used to compute the overall payback percentage for each of the 10,000 players. Within Stage 1, this simulation was repeated for Games 2, 3, and 4, resulting in a total of four actual payback percentages, under the 500-spin constraint, for each virtual player. Ultimately, in this example, each virtual player would have produced four independent samples of 500 spins (i.e., one from each game). This brings us to the analysis of the results produced by the simulations.
Analysis of the Results The simulations produced 10,000 payback percentages on each game, at each play interval (i.e., number of spins), at each level of pay table variance. This allowed for the formal comparison of each player’s observed payback percentages across the four games, at each of the three levels of pay table variance. Two-tailed two-independent-samples t-tests were used to determine whether each player’s observed results would allow for the rejection of the hypothesis of equal programmed payback percentages. A 0.05 alpha level was employed for all hypothesis testing. Given that the F-test rejected the null hypothesis of equal variances for the majority of the samples, the t-test for the unequal variance case was deemed appropriate (Welch, 1947). In all, six such t-tests were conducted for each player’s results, at each level of pay table variance. For example, Game 1 vs. Game 2, Game 1 vs. Game 3, and so on. This t-test was conducted on the results produced by all two-game pairings, at each of the three levels of pay table variance. The Results section displays the output for each pairing of games. Ultimately, these t-tests provided both researchers and industry operators with meaningful results for use in the process of understanding the effects of the programmed payback percentage on the slot player experience, at the single-trip level. Specifically, the stage-level results determined the extent to which players could not detect a statistically significant difference in the payback percentage at various trip lengths, across the four pay tables. For example, the results provided the number of virtual players (out of 10,000) who failed to reject the null hypothesis of equal payback percentages for Games A and B, at some number of spins and level of variance. In effect, if the complement of each of these results were divided by 10,000, it would represent an empirical p-value. Rather than asking human subjects whether they can determine which of several games has the least house advantage, in effect, the design of this study assumed that each of 10,000 virtual players recorded the result of each spin, for each play interval (e.g., the 500-spin scenario). Further, it is assumed that the subjects conducted a two-independent-samples t-test to determine whether their results supported rejection of the null hypothesis of equal payback percentages. If the t-test results failed to support a significant difference in the programmed payback percentages of Games A and B, it would be difficult to argue that the player could somehow divine which of the two games featured the greater programmed payback percentage (or par). By chance alone, five percent of the players were expected to reject the hypothesis of equal payback percentages. However, it would be valuable to know just how many

27UNLV Gaming Research & Review Journal ♦ Volume 15 Issue 1
Estimating the Ability of Gamblers to Detect Differences in the Payback Percentages of Reel Slot Machinesof the 10,000 virtual players would produce results different enough to reject the null hypothesis at each level of the simulation. If 5,000 of the 10,000 players were able to reject the hypothesis of equal payback percentages, then executives would have cause for concern regarding the ability of players to detect such differences. To the contrary, if only 500 of the 10,000 players rejected the null hypothesis, operating, tactical, and strategic decisions regarding the payback percentages of games might be made quite differently. Alternatively, the very same results of the simulations could be used to examine a different question related to the player’s multiple-trip experience. This is achieved by simply interpreting the results of each simulation as 10,000 trips made by the same player, instead of 10,000 trips made by 10,000 different players. That is, after 10,000 consecutive 500-spin trips (on each of two games), would the results of the player’s t-tests support rejection of the hypothesis of equal payback percentages. This interpretation clearly addresses the question related to the ability of frequent players to detect such differences in par over time (i.e., consecutive trips).
ResultsPayback Percentages Table 2 summarizes the results of the t-tests conducted by the virtual players. The contents of the cells in the body of the table represent the number of times a player failed to reject the null hypothesis of equal payback percentages, after making the same number of same-size wagers on each of two games with different programmed payback percentages. The results contained in Table 2 indicated that the vast majority of players were not able to detect a difference in the programmed payback percentages, in any of the two-game pairings. Given the 0.05 alpha level, five percent of the virtual players (i.e., 500) would be expected to the reject the null hypothesis on chance alone.
2
Table 2 Number of Times the Null Hypothesis of Equal Payback Percentages was Not Rejected over 10,000 Virtual Trips of Various Lengths (i.e., Spins)
Game Pairings for t-test of Equal Payback %’s Std. Dev.
# of Spins Per Trip
88% & 91%
88% & 94%
88% & 97%
91% & 94%
91% & 97%
94% & 97%
≈ 6.0 250 9,575 9,496 9,425 9,516 9,508 9,569 Coins 500 9,556 9,449 9,291 9,552 9,422 9,549
750 9,466 9,352 9,103 9,524 9,376 9,473 1,000 9,473 9,317 8,962 9,483 9,319 9,468 2,000 9,446 9,067 8,527 9,417 9,151 9,398 Game Pairings for t-test of Equal Payback %’s
Std. Dev.
# of Spins Per Trip
88% & 91%
88% & 94%
88% & 97%
91% & 94%
91% & 97%
94% & 97%
≈ 11.3 250 9,577 9,495 9,391 9,584 9,501 9,559 Coins 500 9,498 9,482 9,280 9,532 9,443 9,527
750 9,479 9,368 9,109 9,522 9,361 9,512 1,000 9,528 9,316 8,991 9,487 9,302 9,502 2,000 9,419 9,100 8,604 9,415 9,119 9,397 Game Pairings for t-test of Equal Payback %’s
Std. Dev.
# of Spins Per Trip
88% & 91%
88% & 94%
88% & 97%
91% & 94%
91% & 97%
94% & 97%
≈ 15.0 250 9,540 9,511 9,406 9,594 9,498 9,554 Coins 500 9,522 9,408 9,308 9,530 9,436 9,514
750 9,494 9,399 9,135 9,508 9,319 9,471 1,000 9,509 9,299 9,036 9,487 9,308 9,485 2,000 9,438 9,114 8,668 9,409 9,130 9,452

28 UNLV Gaming Research & Review Journal ♦ Volume 15 Issue 1
The number of virtual players who could detect a difference in the programmed payback percentages was computed by subtracting the cell value of Table 2 from 10,000 (i.e., the number of simulated trips). For example, given a standard deviation of 11.3 coins and a trip length of 500 spins, 518 (i.e., 10,000 – 9,482) of 10,000 players were able to detect a difference in the payback percentages of an 88% game and a 94% game. Some clear patterns can be found in Table 2. Greater numbers of players could detect differences in the programmed payback percentages as the trip length (i.e., number of spins) increased. Also, the detection rate increased as the true difference in programmed payback percentages increased. Both of these patterns were expected, as both were artifacts of the t-test itself. The results also featured interesting absences of patterns. For example, the pay table standard deviation appeared to have little influence on the results. That is, the number of virtual players who failed to reject the hypothesis of equal payback percentages appeared unaffected by changes in the standard deviation across the three stages of the simulations. Pay Table Variances Using the F-test of equal variances, the following chart lists the number of virtual players who failed to reject the null hypothesis of equal variances. Although not the primary aim of this study, the results captured in the simulations provided an opportunity to examine the extent to which players could detect differences in the pay table variances. The F-tests were conducted at the 0.05 alpha level on all the same two-game pairings. The actual differences in the pay table variances of the simulated games were miniscule, as the original intent was to hold variance constant. That is, the Table 1 data show that the pay table standard deviations only differ at the second decimal place, in each of the three stages of the simulations. In spite of this condition, the results in Table 3 clearly show that even minor differences in the pay table variance are far easier to detect than the intentionally obvious differences in the four programmed payback percentages.
3
Table 3
Number of Times the Null Hypothesis of Equal Pay Table Variances was Not Rejected over 10,000 Virtual Trips of Various Lengths (i.e., Spins)
Game Pairings for t-test of Equal Payback %’s Std. Dev.
# of Spins Per Trip
88% & 91%
88% & 94%
88% & 97%
91% & 94%
91% & 97%
94% & 97%
≈ 6.0 250 1,941 1,937 1,987 1,893 2,027 2,075 Coins 500 1,621 1,686 1,657 1,721 1,684 1,744
750 1,514 1,532 1,546 1,540 1,566 1,578 1,000 1,527 1,410 1,472 1,477 1,468 1,475 2,000 1,304 1,308 1,272 1,314 1,314 1,381
Game Pairings for t-test of Equal Payback %’s Std. Dev.
# of Spins Per Trip
88% & 91%
88% & 94%
88% & 97%
91% & 94%
91% & 97%
94% & 97%
≈ 11.3 250 1,981 2,015 1,920 2,029 2,060 2,016 Coins 500 1,649 1,661 1,639 1,706 1,690 1,686
750 1,453 1,536 1,542 1,620 1,570 1,654 1,000 1,532 1,441 1,495 1,489 1,475 1,504 2,000 1,309 1,233 1,376 1,387 1,328 1,354 Game Pairings for t-test of Equal Payback %’s
Std. Dev.
# of Spins Per Trip
88% & 91%
88% & 94%
88% & 97%
91% & 94%
91% & 97%
94% & 97%
≈ 15.0 250 1,928 1,942 1,968 1,952 1,982 1,980 Coins 500 1,605 1,600 1,665 1,673 1,702 1,651
750 1,548 1,514 1,561 1,525 1,551 1,531 1,000 1,446 1,417 1,436 1,451 1,521 1,473 2,000 1,288 1,314 1,330 1,343 1,342 1,363
The results shown in Table 3 clearly indicate that the overwhelming majority of virtual players were able to detect that the variances of the pay tables were not equal, in every two-game pairing. That is, the results of their F-tests supported rejection of the null hypothesis of equal variances.

29UNLV Gaming Research & Review Journal ♦ Volume 15 Issue 1
Estimating the Ability of Gamblers to Detect Differences in the Payback Percentages of Reel Slot MachinesDiscussion
Payback Percentages Based on the results of this study, it is very unlikely that a player would be able to legitimately detect a one- to two-percent change in the payback percentage. This fails to support the claims related to the ability of avid gamblers to identify such modest changes in the par (Higgins, 2010; Klebanow, 2006; Velotta, 2009). Further, the results of this study highlight the considerable limitations associated with Harrigan and Dixon’s
(2009) explanation of how par affects TOD. For example, when par was tripled, more than 91% of the players across every simulated condition failed to detect the difference. Such a result is not consistent with the uniform bankroll reduction process described in Harrigan and Dixon (2009). To the contrary, the findings herein support those who contend that par is not a critical determinant of a player’s TOD at the single-session level (Dunn, 2004; Kilby & Fox, 1998; Lucas & Singh, 2008). If par were a critical determinant of TOD, then great numbers
of virtual players would have been able to detect differences in the programmed payback percentages. In other words, as par decreased from one game to the next, the ending credit balances on the game with the lower par would have to have been significantly greater to fund an increase in TOD. The general failure of the virtual players to detect a difference in the programmed payback percentages is consistent with the quasi-experimental findings of problem gambling researchers. That is, Weatherly and Brandt (2004) failed to find a statistically significant relationship between the payback percentage and the number of trials per gaming session (i.e., a TOD measure). Haw (2007) failed to link changes in the actual payback percentage experienced by players to their future game choices, while Weatherly et al. (2009) reported similar findings related to the effect of programmed payback percentages on game choice. Given the slim likelihood of detecting a difference in the programmed payback percentage over a 15- to 20-minute gaming session, such results are no longer surprising. The findings displayed in Table 2 support this conclusion. Specifically, the results found in the rows comparing the t-test outcomes of trips consisting of 250 spins (i.e., 30 minutes) show how unlikely it would be to reject the hypothesis of equal payback percentages under any of the simulation conditions. Finally, the results of this study were consistent with those of Lucas and Brandmier (2005) in that they failed to find a statistically significant change in theoretical win levels of games that endured a 50% increase in par. While the games they examined moved from a 95% payback to a 92.5% payback, the results of the current study supported the same conclusion for the two-game pairings featuring a 50% increase in par (i.e., the 94% and 91% payback games).
Pay Table Variance The findings of this study provide additional support for attention to and careful consideration of the role of pay table volatility in the slot player experience. Specifically, the rejection rates of the equal variance hypothesis ranged from a high of 87.67% to a low of 79.25%. The rejection rate of 79.25% was computed by subtracting the greatest value from Table 3 (i.e., 2,075) from 10,000 and then dividing that difference by 10,000. To compute the opposite end of the rejection rate range, 87.67%, the same calculation was applied to the cell containing the least number of rejections in Table 3 (i.e., 1,233). The overall extent to which player’s were able to detect even slight differences in the pay table variances was remarkable, especially when compared to their inability to detect clear differences in the programmed payback percentages. These findings support those of Lucas and Singh (2008) in that their results indicated that changes in the pay table variance were far more impactful on single-session TOD than concomitant changes in par. It would stand to reason that players would be more likely to notice/detect changes in the more impactful force.
Based on the results of this study, it is very unlikely that a player would
be able to legitimately detect a one- to two-percent change in the
payback percentage.

30 UNLV Gaming Research & Review Journal ♦ Volume 15 Issue 1
Managerial Implications From Table 2, consider the results associated with the following three, two-game pairings: 88% v. 94% (6 sigma); 88% v. 94% (11 sigma); and 88% v. 94% (15 sigma). These game pairings each featured differences in the payback percentages very near six percentage points. Alternatively stated, such fluctuations represented differences in the pars (i.e., house advantages) equal to or greater than 100%. For example, at the 15 sigma level, Game 11 featured a 5.96% par (1.0 – 0.9404) and Game 9 had a 12% par (1.0 – 0.88). Therefore, Game 9’s par represented a 101% increase from Game 11’s par ((0.1200 – 0.0596) ÷ 0.0596). Given such a remarkable increase in the house advantage, one might assume from the trade literature that detection of such differences would be nearly certain. However, at 500 spins (i.e., approximately one hour of play) the number of players (out of 10,000) who were not able to detect a difference in the payback percentages of these three, two-game parings were 9,449, 9,482, and 9,408, respectively. The simulation results challenge existing positions on the sensitivity of slot players to changes in par. Further, if changes in payback percentages are so often indistinguishable at the single-session level, how critical is par to single-session TOD? That is, increases in TOD must be fueled by game credits. Even slight changes in pay table variance appear much easier to detect, suggesting that players are much more sensitive to pay table volatility. Casino operators may want to consider the merit of existing theories related to the player-level effects of par, while taking a closer look at the impact of pay table variance. The findings of this study fail to support concerns that frequent players will detect changes in par over time. Consider the following interpretation of the results. A virtual player made 10,000 trips to a casino. On each trip, this player wagered one coin on each spin for 1,000 spins. Such wagering behavior occurred on a game with an 88% programmed payback and was repeated on a game with a 94% programmed payback. After approximately two hours of play on each of the two games (i.e., 1,000 spins), this player could not reject the hypothesis of equal payback percentages on 9,316 of the 10,000 trips. Referring to Table 2, this result was achieved at the 11-coin standard deviation level. At the 6-coin and 15-coin standard deviation levels, the virtual player was not able to reject the hypothesis of equal payback percentages on 9,317 and 9,299 of the 10,000 trips, respectively. Given the slim likelihood of detecting such changes in par over time, it would appear that operators need not become overly concerned about their players ability to do so. This is important to those who are also concerned about the ramifications of changes in the payback percentage on brand and brand positioning, especially with regard to gaming value. Let’s consider the case of an operator who is facing low slot floor occupancy - a popular condition in the U.S. Further, let’s assume this operator caters to a frequently visiting clientele and is heavily promoting gaming value (i.e., TOD) in her marketing communications. This operator would certainly benefit from a slot offering that is well-matched to her operating conditions and marketing messages. Too often, operators respond to such a scenario by lowering their pars. This study shows that not many players would be able to appreciate such an act, provided the change was equal to or less than those simulated in this experiment. If the players cannot perceive the change in par, how effective is such a strategy? Alternatively, it would seem that operators should consider lowering the standard deviations of their games. Low pars have long been incorrectly associated with the idea of a loose slot floor (Dunn, 2004; Kilby & Fox, 1998). Further, many operators believe that low-par floors are perceived as generous gaming environments, aiding them in the retention of valuable gamblers. This is especially true for those catering to a frequently visiting clientele. Given these conditions and the results of this study, some operators may want
Given the slim likelihood of detecting such changes in par over time, it would appear that operators need not become overly concerned about their players ability to do so.

31UNLV Gaming Research & Review Journal ♦ Volume 15 Issue 1
Estimating the Ability of Gamblers to Detect Differences in the Payback Percentages of Reel Slot Machinesto reconsider their position on this tactic. That is, if it is difficult for players to perceive even great changes in par, it would be equally difficult for them to perceive changes in the relative “looseness” of an operator’s slot floor, following changes in pars. For those operators who wish to retain valuable gamblers by offering superior gaming value, the findings of this study suggest that lowering pars is not likely to produce the desired result. Although it is less common, some operators wish to capture player bankrolls faster rather than slower. This agenda would apply to those operating in markets where gaming demand greatly exceeds supply. It also applies to operators who wish to capture bankrolls before gamblers have an opportunity to lose their gaming capital elsewhere. This strategy may be appropriate for markets such as the Las Vegas Strip and Atlantic City where customer acquisition costs are often great and players can easily walk to a competitor. Of course, this strategy assumes that players who stay at a resort will gamble there first, before trying their luck elsewhere. At any rate, the result of the payback simulations would suggest that increasing par is not likely to achieve these objectives. Again, increasing the pay table variance would appear to be the better option here as well. In any case, a better understanding of the impact produced by changes in par can only help operators achieve their operating, branding, and positioning objectives.
Further, given their reliance on slot profits, any step toward an improved understanding of the slot player experience is absolutely critical to U.S. gaming operators. Finally, with the soaring cost of new games, scarcity of investment capital, and the current economic conditions, it is very difficult for many operators to acquire new games. When executives are able to obtain new games, it is critical that they procure games that achieve their operating objectives. That is, buying games to reposition the slot floor in terms of par could result in an
expensive failure, especially if the intent is to retain existing customers by improving the perceptions of gaming value.
Limitations & Future Research Although 12 different pay tables were examined herein, the results of this study should not be generalized beyond the parameters of the simulations and pay tables. It is possible that other pay tables and simulation parameters could produce different results. For example, greater differences in the programmed payback percentages of games could trigger material differences in detection rates. Although we have no reason to believe a different outcome would be achieved, the findings of this study should not be applied to video poker games, even those featuring pars and variances similar to the reel games examined in this work. Given that the probabilities of standard video poker hands do not vary, it would be interesting to replicate this study using video poker pay tables. However, perception of value may take on an exaggerated role when it comes to video poker players. That is, frequent players often infer “price” or value from the posted payouts. This occurs due to the fact that the probability of the outcomes is constant, assuming the use of a standard deck and optimal play. The reality of this perception could not be incorporated in a simulation, limiting the usefulness of the results. Replication of the current simulation at varying levels of reel payback percentages and variances would add valuable results to this area of research. If the payback percentages were appropriately staggered across a broad enough range, the results could be graphed to illustrate a rejection-rate curve of sorts. That is, at given levels of variance and fixed wagering constraints, how would the rejection rate vary with regard to the actual difference in the programmed payback percentages? This would provide operators with a limited guideline for use in assessing the likelihood of players detecting changes in the payback percentages. Such information would be helpful to those attempting to measure the potential benefits and consequences related to proposed changes in pars.
In any case, a better understanding of the impact produced by changes
in par can only help operators achieve their operating, branding,
and positioning objectives.

32 UNLV Gaming Research & Review Journal ♦ Volume 15 Issue 1
Although incredibly time intensive, it would be useful to conduct an experiment using actual games and human subjects. For example, it would be interesting to know whether human subjects could identify which of two games offered the greater payback percentage after playing them both under identical wagering conditions. If nothing else, the extent to which the results of the current study are supported would be a valuable addition to this research stream. Although the results indicated that it was not likely that players could identify differences in the payback percentages on the games examined herein, the fail-to-reject rate remained reasonably constant over the three levels of pay table standard deviation. That is, the fail-to-reject rate at each of the four levels of payback percentage did not consistently increase or decrease across the three levels of standard deviation. It is likely that the number of spins comprising the independent samples was insufficient for observing the effect of the pay table variance on the fail-to-reject rate. That said, other related possibilities are worth exploring. One such possibility involves examining whether the location of the variance within the pay table could influence TOD. For example, with par and variance held constant across two games, a game with a pay table that is front-loaded with variance may produce quite different TOD than a pay table containing the bulk of its variance at the top-award level. That is, the shape of the game’s outcome distribution might affect the player experience with regard to TOD and the ability to perceive differences in par. This is something worthy of further examination.
ReferencesAnderer, C. (2010). As told at the casino marketing conference. Casino Journal, 23(8),
42.Dunn, W. (2004). Standard deviation: A way to optimize the slot floor. Slot Manager,
January, 22-24.Hannum, R. C., & Cabot, A. N. (2005). Practical casino math (2nd ed.). Reno, NV:
Institute for the Study of Gambling and Commercial Gaming: Harrigan, K. A., & Dixon, M. (2009). PAR sheets, probabilities, and slot machine play:
Implications for problem and non-problem gambling. Journal of Gambling Issues, 23, 81-110.
Haw, J. (2008). The relationship between reinforcement and gaming machine choice. Journal of Gambling Studies, 24(1), 55-61.
Higgins, C. (2010). Finally! One longtime Vegas casino owner loosens slots. Retrieved on September 26, 2010 from http://www.examiner.com/las-vegas-in-national/finally-one-longtime-vegas-casino-owner-loosens-slots.
Illinois Gaming Board. (2010). 2009 Annual Report (Sources of revenue, p. 15). Retrieved on February 9, 2011 from http://www.igb.state.il.us/annualreport/2009igb.pdf.
Iowa Racing & Gaming Commission. (2010). Riverboat Revenue Report. Retrieved on February 10, 2011, from http://www.state.ia.us/irgc/FYTD10.pdf
Kale, S. H. (2006). Whatever happened to old-fashioned gambling? Native American Casino, 6(8), 38-39.
Kilby, J., & Fox, J. (1998). Casino operations management. New York: Wiley.Klebanow, A. (2006). What players really want. Indian Gaming, 16(12), 48-49.Lucas, A. F. (2003). The determinants and effects of slot servicescape satisfaction in a
Las Vegas hotel casino. Gaming Research & Review Journal, 7(1), 1-20.Lucas, A. F., & Brandmeir, K. D. (2005). Short-term effects of an increase in par on reel
slot performance. Gaming Research & Review Journal, 9(2), 1-14.Lucas, A. F., & Dunn, W. T. (2005). Estimating the effects of micro-location variables
and game characteristics on slot machine volume: A performance-potential model. Journal of Hospitality and Tourism Research, 29 (2), 170-193.
33UNLV Gaming Research & Review Journal ♦ Volume 15 Issue 1
Estimating the Ability of Gamblers to Detect Differences in the Payback Percentages of Reel Slot MachinesLucas, A. F., Dunn, W. T., Roehl, W. S., & Wolcott, G. M. (2004). Evaluating slot
machine performance: A performance-potential model. International Journal of Hospitality Management, 23(2), 103-121.
Lucas, A. F., & Singh, A. K. (2008). Decreases in a slot machine’s coefficient of variation lead to increases in customer play time. Cornell Hospitality Quarterly, 49(2), 122-133.
Lucas, A. F., Singh, A. K., & Gewali, L. (2007). Simulating the effect of pay table standard deviation on pulls per losing player at the single-visit level. Gaming Research & Review Journal, 11(1), 41-52.
MacDonald, A. (2001). The empire strikes back: Table games emerge from the ashes! Retrieved on February 9, 2010 from http://urbino.net/articles.cfm?Article_ID=24& specificArticle=The%20Empire%20Strikes%20Back%2E&searchString=empire% 20strikes&CFID=21236534&CFTOKEN=61902490.
MacDonald, A., Eadington, W. R. (2008). Everything to everybody: A case for the integrated resorts. Global Gaming Business. 7(11), 32-34, 36, 38, 40.
Nevada Gaming Control Board. (2011). Gaming Revenue Report, December 2010. Retrieved on February 10, 2011 from http://gaming.nv.gov/documents/pdf/1g_10dec.pdf.
New Jersey Casino Control Commission. (2011). Casino Win Analysis for the Year-to-Date Period Ended December 31, 2010 versus 2009. Retrieved on February 11, 2011 from http://www.state.nj.us/casinos/financia/mthrev/Press%20Release%20docs/2010/ 201012_revenue.pdf.
R Development Core Team. (2010). R: A language and environment for statistical computing. R Foundation for Statistical Computing, Vienna, Austria. ISBN 3-900051-07-0, URL, http://www.R-project.org.
Velotta, R. N. (2009). Marketers: Reduce slot hold to attract more customers. Retrieved on October 3, 2010 from http://www.lasvegassun.com/news/2009/jul/31/marketers-reduce-slot-hold-attract-more-customers/.
Weatherly, J. N. & Brandt, A. E. (2004). Participants’ sensitivity to percentage payback and credit value when playing a slot-machine simulation. Behavior and Social Issues, 13, 33-50.
Weatherly, J. N., Thompson, B. J., Hodney, M., & Meier, E. (2009). Choice behavior of nonpathological women playing concurrently available slot machines: Effect of changes in payback percentages. Journal of Applied Behavior Analysis, 42(4), 895-900.
Welch, B. L. (1947). The generalization of Student’s problem when several different population variances are involved. Biometrika, 34(1-2), 28-35.
Article submitted: 3/7/11Sent to peer review: 3/10/11Reviewer comments sent to author: 3/25/11Author’s revised comments received: 3/31/11Article accepted for publication: 4/1/11

34 UNLV Gaming Research & Review Journal ♦ Volume 15 Issue 1
Appendix AProbability Density Functions (PDFs) of the 12 Simulated Reel Slots*
Pay Tables Listed by Sigma and Payback Percentage Sigma = 6 Sigma = 11 Sigma = 15 (A=5,000 coins) A=11,000 coins) (A=15,000 coins)Event Probability 88 91 94 97 88 91 94 97 88 91 94 97
1 0.00025909 1 1 1 2 1 1 1 2 1 1 1 2 2 0.02092634 1 2 2 3 1 2 2 3 1 1 2 3 3 0.01813616 1 2 3 3 1 2 3 3 1 3 3 3 4 0.01554528 3 4 4 5 3 3 4 5 3 4 4 5 5 0.00139509 7 3 5 4 7 4 5 4 7 4 5 4 6 0.00119579 7 3 5 4 7 5 5 4 7 4 5 4 7 0.00103635 6 3 5 4 6 5 5 4 6 4 5 4 8 0.00019930 6 5 5 4 6 5 5 4 6 4 5 4 9 0.00017273 6 5 5 4 6 5 5 4 6 3 5 410 0.00001330 15 10 5 9 15 5 5 9 15 3 5 911 0.00007970 15 10 15 9 15 11 15 9 15 3 15 912 0.00934710 10 10 11 10 10 12 11 10 10 11 11 1013 0.00025695 10 10 10 10 10 10 10 10 10 11 10 1014 0.00131537 20 20 20 20 20 20 20 20 20 20 20 2015 0.00010961 20 20 20 20 20 20 20 20 20 20 20 2016 0.00042707 40 40 40 40 40 40 40 40 40 40 40 4017 0.00005340 40 40 40 40 40 40 40 40 40 40 40 4018 0.00005120 100 60 60 60 100 60 60 60 100 60 60 6019 0.00000854 100 60 60 60 100 60 60 60 100 60 60 6020 0.00014046 75 75 75 75 75 75 75 75 75 75 75 7521 0.00000380 75 75 75 75 75 75 75 75 75 75 75 7522 0.00004560 100 100 100 100 100 100 100 100 100 92 100 10023 0.00000380 100 100 100 100 100 100 100 100 100 100 100 10024 0.00001040 250 300 250 250 250 300 250 250 250 300 250 25025 0.00000095 A A A A A A A A A A A A26 0.00259088 2 2 2 3 2 2 2 3 2 2 2 327 0.02112564 2 2 2 2 2 2 2 2 2 2 2 228 0.01830889 2 2 2 2 2 2 2 2 2 2 2 229 0.01554528 2 2 2 2 2 2 2 2 2 2 2 230 0.00140838 5 5 5 5 5 5 5 5 5 5 5 531 0.00119579 4 4 4 4 4 4 4 4 4 4 4 432 0.00103635 4 4 4 4 4 4 4 4 4 4 4 433 0.00017273 4 4 4 4 4 4 4 4 4 4 4 434 0.00017273 4 4 4 4 4 4 4 4 4 4 4 435 0.00001330 4 4 4 4 4 4 4 4 4 4 4 436 0.00007970 4 4 4 4 4 4 4 4 4 4 4 437 0.00957772 9 9 9 9 9 9 9 9 9 9 9 938 0.00026336 10 10 10 10 10 10 10 10 10 10 10 1039 0.00131537 20 20 20 20 20 20 20 20 20 20 20 2040 0.00010961 40 40 40 40 40 40 40 40 40 40 40 4041 0.00045554 40 40 40 40 40 40 40 40 40 40 40 4042 0.00005690 40 40 40 40 40 40 40 40 40 40 40 4043 0.00005120 40 40 40 40 40 40 40 40 40 40 40 4044 0.00000854 40 40 40 40 40 40 40 40 40 40 40 4045 0.00011911 40 40 40 40 40 40 40 40 40 40 40 4046 0.00000332 40 40 40 40 40 40 40 40 40 40 40 4047 0.00003420 50 50 50 50 50 50 50 50 50 50 50 5048 0.00000285 50 50 50 50 50 50 50 50 50 50 50 5049 0.00001040 150 150 150 150 150 150 150 150 150 150 150 15050 0.00000095 250 250 250 250 250 250 250 250 250 250 250 25051 0.00261579 2 2 2 2 2 2 2 1 2 2 3 252 0.01848493 3 2 2 2 2 2 2 2 2 2 2 253 0.01848493 2 2 2 2 2 2 2 2 2 2 2 254 0.01569475 2 2 2 2 2 2 2 2 2 2 2 255 0.00123233 2 5 4 6 6 4 2 4 5 3 3 356 0.00104632 3 5 4 5 6 4 3 5 5 3 4 357 0.00104632 4 5 4 5 6 4 3 5 5 3 4 358 0.00017439 4 5 5 5 6 4 3 4 5 3 4 359 0.00017439 4 9 5 5 6 4 3 4 5 3 4 360 0.00001160 4 15 10 10 15 8 8 8 10 8 4 361 0.00006980 4 15 10 10 15 8 8 8 10 8 7 362 0.00978650 10 10 10 10 10 9 10 10 10 9 9 1063 0.00026858 10 10 10 10 10 10 10 10 10 10 9 964 0.00137801 20 20 20 20 20 20 20 20 20 20 20 2065 0.00011483 20 20 20 20 20 20 20 20 20 20 20 2066 0.00045554 40 40 40 40 40 40 40 40 40 40 40 4067 0.00005690 40 40 40 40 40 40 40 40 40 40 40 4068 0.00005120 60 60 60 60 60 60 60 60 60 60 60 6069 0.00000854 60 60 60 60 60 60 60 60 60 60 60 6070 0.00011911 75 75 75 75 75 75 75 75 75 75 75 75

35UNLV Gaming Research & Review Journal ♦ Volume 15 Issue 1
71 0.00000332 75 75 75 75 75 75 75 75 75 75 75 7572 0.00003420 100 100 100 100 100 100 100 100 100 100 100 10073 0.00000285 100 100 100 100 100 100 100 100 100 100 100 10074 0.00001040 250 250 250 250 250 250 250 250 250 250 250 25075 0.00000095 250 250 250 250 250 250 250 250 250 250 250 25076 0.78428144 0 0 0 0 0 0 0 0 0 0 0 0
Notes: * Pay table variances were adjusted by manipulating “A” in Event 25. The “A” payout was set to the following values: 5,000 coins (on the 6-sigma games); 11,000 coins (on the 11-sigma games); and 15,000 coins (on the 15-sigma games).
Appendix BSimulation Code
d <- as.matrix(read.csv(“G:SLOT_SIM//four slot games sd 11 feb 13 2011.csv”,header=TRUE)) # ng = number of pulls or games played by each playerng <- c(50, 100, 250, 500, 750, 1000, 1250, 1500, 1750, 2000) sigprob <- matrix(0,nrow=10, ncol=6)sigprob_var <- matrix(0,nrow=10, ncol=6) # a = no of times null of EQUAL PARS is not rejected, av = ... EQUAL VARS is not rejecteda <- matrix(NA,nrow=4, ncol=4)av <- matrix(NA,nrow=4, ncol=4) p12 <- matrix(0)p13 <- matrix(0)p14 <- matrix(0)p23 <- matrix(0)p24 <- matrix(0)p34 <- matrix(0)pv12 <- matrix(0)pv13 <- matrix(0)pv14 <- matrix(0)pv23 <- matrix(0)pv24 <- matrix(0)pv34 <- matrix(0)# prob = probability column, pay1 = pay-table for 88% game, ..., pay4 = same for 97% gameprob <- matrix(0)pay1 <- matrix(0)pay2 <- matrix(0)pay3 <- matrix(0)pay4 <- matrix(0) prob <- d[,2]pay1 <- d[,3]pay2 <- d[,4]pay3 <- d[,5]pay4 <- d[,6] x1 <- matrix(0)xx1 <- matrix(0) x2 <- matrix(0)xx2 <- matrix(0) x3 <- matrix(0)xx3 <- matrix(0) x4 <- matrix(0)xx4 <- matrix(0) # n = number of events in the slot gamesn <- 76 ev1 <- sum(prob*pay1)print(“EV of game 1 = “)
[1] “EV of game 1 = “print(ev1)[1] 0.8803326var1 <- sum(prob*pay1**2)-ev1**2sd1 <-sqrt(var1) ev2 <- sum(prob*pay2)print(“EV of game 2 = “)[1] “EV of game 2 = “print(ev2)[1] 0.9010574var2 <- sum(prob*pay2**2)-ev2**2sd2 <-sqrt(var2) ev3 <- sum(prob*pay3)print(“EV of game 3 = “)[1] “EV of game 3 = “print(ev3)[1] 0.9404875var3 <- sum(prob*pay3**2)-ev3**2sd3 <-sqrt(var3) ev4 <- sum(prob*pay4)print(“EV of game 4 = “)[1] “EV of game 4 = “print(ev4)[1] 0.9704207var4 <- sum(prob*pay4**2)-ev4**2sd4 <-sqrt(var4) evgames <- c(100*ev1,100*ev2,100*ev3,100*ev4)sdgames <- c(sd1, sd2, sd3, sd4) print(“Payback% of the 4 games are”)print(evgames)
print(“SD of the 4 games are”)print(sdgames)
# niter = number of playersniter <- 10000 for (ig in 1:10){ # g = number of games playedg <- ng[ig]# print(g) for (k in 1:niter) { x1 <- sample(n, g, prob, replace = T)for (j in 1:g){jj <- x1[j]xx1[j] <- pay1[jj]}

36 UNLV Gaming Research & Review Journal ♦ Volume 15 Issue 1
x2 <- sample(n, g, prob, replace = T)for (j in 1:g){jj <- x2[j]xx2[j] <- pay2[jj]} x3 <- sample(n, g, prob, replace = T)for (j in 1:g){jj <- x3[j]xx3[j] <- pay3[jj]} x4 <- sample(n, g, prob, replace = T)for (j in 1:g){jj <- x4[j]xx4[j] <- pay4[jj]} # Running t-test for UNEQUAL variancest12<- t.test(xx1,xx2)t13 <- t.test(xx1,xx3)t14 <- t.test(xx1,xx4)t23<- t.test(xx2,xx3)t24 <- t.test(xx2,xx4)t34 <- t.test(xx3,xx4) # pij = significance probability of t-test for testing null that Par_i = Par_j (i, j = 1, 2, 3, 4, i < j) p12[k] <- t12[3]p13[k] <- t13[3]p14[k] <- t14[3]p23[k] <- t23[3]p24[k] <- t24[3]p34[k] <- t34[3] # test equal variances v12 <- var.test(xx1, xx2)v13 <- var.test(xx1, xx3)v14 <- var.test(xx1, xx4)v23 <- var.test(xx2, xx3)v24 <- var.test(xx2, xx4)v34 <- var.test(xx3, xx4) # pvij = sig probability of F-test for testing null that Var_i = Var_j (i, j = 1, 2, 3, 4, i < j)pv12[k] <- v12[3]pv13[k] <- v13[3]pv14[k] <- v14[3]pv23[k] <- v23[3]pv24[k] <- v24[3]pv34[k] <- v34[3] }sigprob <- cbind(p12,p13,p14,p23,p24,p34) # sij = total number of times the t-test DID NOT REJECT null of Equal Parss12 <- sum(p12>.05)s13 <- sum(p13>.05)s14 <- sum(p14>.05)s23 <- sum(p23>.05)s24 <- sum(p24>.05)s34 <- sum(p34>.05) a[1,2] <- s12a[1,3] <- s13a[1,4] <- s14
a[2,3] <- s23a[2,4] <- s24 a[3,4] <- s34 a[2,1] <- a[1,2] a[3,1] <- a[1,3]a[4,1] <- a[1,4]a[3,2] <- a[2,3]a[4,2] <- a[2,4]a[4,3] <- a[3,4] # results of equal variance testssigprob_var <- cbind(pv12,pv13,pv14,pv23,pv24,pv34) # svij = total number of times the F-test DID NOT REJECT null of Equal Variancessv12 <- sum(pv12>.05)sv13 <- sum(pv13>.05)sv14 <- sum(pv14>.05)sv23 <- sum(pv23>.05)sv24 <- sum(pv24>.05)sv34 <- sum(pv34>.05) av[1,2] <- sv12av[1,3] <- sv13av[1,4] <- sv14av[2,3] <- sv23av[2,4] <- sv24av[3,4] <- sv34
av[2,1] <- av[1,2] av[3,1] <- av[1,3]av[4,1] <- av[1,4]av[3,2] <- av[2,3]av[4,2] <- av[2,4]av[4,3] <- av[3,4] print(“# of Players”)print(niter)print(“# of pulls”)print(g) print(“ 88% 91% 94% 97%”)print(a)print(av)}