EQi Handbook June 3rd - EQ Europeeqeurope.com/wp-content/uploads/EQi-Reference-List.pdf ·...
71
EQͲi 2.0 Users Handbook: Preview Version Copyright 2011 MultiͲHealth Systems Inc. All rights reserved. 285 References Allen, A., Montgomery, M., Tubman, J., Frazier, L., & Escovar, L. (2003). The effects of assessment feedback on rapportͲbuilding and selfͲenhancement processes. Journal of Mental Health Counseling, 25, 165Ͳ182. American Education Research Association, American Psychological Association and the National Council on Measurement in Education (1999). Standards for educational and psychological testing. Washington, DC: American Educational Research Association Anastasi, A. (1982). Psychological testing (5th ed.). New York, NY: Macmillan. Anastasi, A. (1988). Psychological testing (6th ed.). New York, NY: Macmillan. Bachman, J., Stein, S., Campbell, K., & Sitarenios, G. (2000). Emotional intelligence in the collection of debt. International Journal of selection and assessment, 8, 176Ͳ182. Bandura, A. (1977). Social Learning Theory. Englewood Cliffs, NJ: Prentice Hall. BarͲOn, R. (1988). The development of a concept of psychological wellͲbeing. Doctoral dissertation, Rhodes University, South Africa. The precursor of the BarͲOn model of emotionalͲsocial intelligence. BarͲOn, R. (1997). EQͲi Technical Manual. Toronto, Canada: MultiͲHealth Systems. BarͲOn, R. (1992). The development of a concept and test of emotional intelligence. Unpublished manuscript. BarͲOn, R. (2002). EQͲi Technical Manual. Toronto, Canada: MultiͲHealth Systems. BarͲOn, R. (2004). EQͲi: BarOn Emotional Quotient Inventory. Toronto, Canada: MultiͲ Health Systems. BarͲOn, R., & Handley, R. (2003). The BarOn EQ 360: Technical manual. Toronto, Canada: MultiͲHealth Systems. BarͲOn, R., Tranel, D., Denburg, N. L., & Bechara, A. (2003). Exploring the neurological substrate of emotional and social intelligence. Brain, 126, 1790Ͳ1800.
Transcript of EQi Handbook June 3rd - EQ Europeeqeurope.com/wp-content/uploads/EQi-Reference-List.pdf ·...

EQ i 2.0 User�’s Handbook: Preview Version
Copyright 2011 Multi Health Systems Inc. All rights reserved.
285
References
Allen, A., Montgomery, M., Tubman, J., Frazier, L., & Escovar, L. (2003). The effects ofassessment feedback on rapport building and self enhancement processes.Journal of Mental Health Counseling, 25, 165 182.
American Education Research Association, American Psychological Association and theNational Council on Measurement in Education (1999). Standards foreducational and psychological testing.Washington, DC: American EducationalResearch Association
Anastasi, A. (1982). Psychological testing (5th ed.). New York, NY: Macmillan.
Anastasi, A. (1988). Psychological testing (6th ed.). New York, NY: Macmillan.
Bachman, J., Stein, S., Campbell, K., & Sitarenios, G. (2000). Emotional intelligence in thecollection of debt. International Journal of selection and assessment, 8, 176 182.
Bandura, A. (1977). Social Learning Theory. Englewood Cliffs, NJ: Prentice Hall.
Bar On, R. (1988). The development of a concept of psychological well being. Doctoraldissertation, Rhodes University, South Africa. The precursor of the Bar On modelof emotional social intelligence.
Bar On, R. (1997). EQ i Technical Manual. Toronto, Canada: Multi Health Systems.
Bar On, R. (1992). The development of a concept and test of emotional intelligence.Unpublished manuscript.
Bar On, R. (2002). EQ i Technical Manual. Toronto, Canada: Multi Health Systems.
Bar On, R. (2004). EQ i: BarOn Emotional Quotient Inventory. Toronto, Canada: MultiHealth Systems.
Bar On, R., & Handley, R. (2003). The BarOn EQ 360: Technical manual. Toronto, Canada:Multi Health Systems.
Bar On, R., Tranel, D., Denburg, N. L., & Bechara, A. (2003). Exploring the neurologicalsubstrate of emotional and social intelligence. Brain, 126, 1790 1800.
EQ i 2.0 User�’s Handbook: Preview Version
Copyright 2011 Multi Health Systems Inc. All rights reserved.
286
Barrow, J. C. (1977). The variables of leadership: A review and conceptual framework,Academy of Management Review, 2, 231 251.
Bass, B. M., & Avolio, B. J. (1997). Full range leadership development: Manual for theMultifactor Leadership Questionnaire. Palo Alto, CA: Mindgarden.
Bechara, A., Damasio, A.R., Damasio, H. & Anderson, S.W. (1994). Insensitivity to futureconsequences following damage to human prefrontal cortex. Cognition, 50,7�–12.
Bem, D.J., & Allen, A. (1974). On predicting some of the people some of the time. Thesearch for cross situational consistencies in behavior. Psychological Review,81(6), 506 520.
Bentler, P. M. (1990). Comparative fit indexes in structural models. PsychologicalBulletin, 107, 238�–246.
Bentler, P. M., & Bonett, D. G. (1980). Significance tests and goodness of fit in theanalysis of covariance structures. Psychological Bulletin, 88, 588�–606.
Block, P. (2000). The Flawless Consulting Fieldbook (2nd ed). San Francisco: Pfeiffer.
Broad, M. (2005). Beyond Transfer of Training: Engaging Systems to ImprovePerformance. San Francisco: Pfeiffer.
Brown, F. W., Bryant, S.E., & Reilly, D. (2006). Does emotional intelligence as measuredby the EQI influence transformational leadership and/or desirable outcomes?Leadership & Organization Development Journal, 27(5), 330 351.
Bumphus, A.T. (2009). The emotional intelligence and resilience of school leaders: Aninvestigation into leadership behaviors.Dissertation Abstracts InternationalSection A: Humanities and Social Sciences, 3401.
Burns, J. M. (1978). Leadership. New York: Harper & Row.
Campbell, D. T., & Fiske, D. W. (1959). Convergent and discriminant validation by themultitrait multimethod matrix. Psychological Bulletin, 56, 81�–105.
Cavelzani, A., Lee, I., Locatelli, V., Monti, G., & Villamira, M. A. (2003).Emotionalintelligence and tourist services: The tour operator as a mediatorbetween tourists and residents. International Journal of Hospitality and TourismAdministration, 4(4), 1 24.
EQ i 2.0 User�’s Handbook: Preview Version
Copyright 2011 Multi Health Systems Inc. All rights reserved.
287
Cavins, B. (2006). The relationship between emotional social intelligence and leadershippractices among college student leaders. Dissertation Abstracts InternationalSection A: Humanities and Social Sciences, 66, 3518.
Change, K.T. (2007). Can we teach emotional intelligence? Dissertation AbstractsInternational Section A: Humanities and Social Sciences, 4451.
Ciarrochi, J., Forgas, J., & Mayer, J.D (2001). Emotional intelligence in everyday life: Ascientific inquiry. New York: Psychology Press.
Cohen, J. (1988). Statistical power analysis for the behavioral sciences (2nd ed.).Mahwah, NJ: Earlbaum.
Core competencies (2011). Retrieved January 19, 2011, fromhttp://www.coachfederation.org/icfcredetials/core competencies/
Costa, P.T., Jr., & McCrae, R.R. (1992). NEO PI R Professional Manual: Revised NEOPersonality Inventory (NEO PI R) and NEO Five Factor Inventory (NEO FFI). Lutz,FL: PAR.
Covey, S.R. (2004). The 7 habits of highly effective people. Philadelphia, PA: RunningPress.
Cronbach, L. J. (1951). Coefficient alpha and the internal structure of tests.Psychometrika, 16, 297�–335.
Crowne, D.P., & Marlowe, D. (1964). The approach motive: Studies in evaluativedependence. New York, NY: Wiley.
Cummings, T.G. and Worley, C.G. (2005). Organization Development and Change,8th ed., Ohio: Thomson South Western
Damasio, A.R., Tranel, D. & Damasio, H. (1991). "Somatic markers and the guidance ofbehaviour: theory and preliminary testing" (pp. 217�–229). In H.S. Levin, H.M.Eisenberg & A.L. Benton (Eds.). Frontal lobe function and dysfunction. New York:Oxford University Press.
Davidson, R. J. & Lutz, A. (2008). Buddha�’s Brain: Neuroplasticity and Meditation.IEEE Signal Processing 25(1), 171 174.
Davies, M., Stankov, L., & Roberts, R. D. (1998). Emotional intelligence: In search of anelusive construct. Journal of Personality and Social Psychology, 75(4), 989 1015

EQ i 2.0 User�’s Handbook: Preview Version
Copyright 2011 Multi Health Systems Inc. All rights reserved.
288
Downie, N. M., & Heath, R. W. (1970). Basic statistical methods (3rd ed.). New York, NY:Harper and Row.
Dries, N. & Pepermans, R. (2007). Using emotional intelligence to identify high potential:Metacompetency perspective. Leadership and Organization DevelopmentJournal, 28(8), 749 770.
Dulewicz, V., & Higgs, M. (2004). Can emotional intelligence be developed? InternationalJournal of Human Resource Management, 15(1), 95 111.
Durek, D. & Gordon, W. (2009). Zeroing in on Star Performance. In M. Hughes,H. L. Thompson, & J. B. Terrell (Eds.), Handbook for Developing Emotional andSocial Intelligence: Best Practices, Case Studies, and Strategies. (pp. 183�–203).San Francisco, CA: Pfeiffer.
Edwards, A.L. (1966). Relationships between probability of endorsement and socialdesirability scale value for a set of 2,824 personality statements. Journal ofApplied Psychology, 50, 238 239.
Elfenbein, H.A. (2006). Learning in emotion judgments: Training and the cross culturalunderstanding of facial expressions. Journal of Nonverbal Behavior, 30(1), 21 36.
Ellingson, J., Sackett, P., & Hough, L. (1999). Social desirability corrections in personalitymeasurement: issues of applicant comparison and construct validity. Journal ofApplied Psychology, 84(2), 155 166.
Endler, N. S., & Parker, J. D. A., (1990). Coping Inventory for Stressful Situations(CISS):Manual. Toronto, Canada: Multi Health Systems Inc.
Endler, N. S., & Parker, J. D. A., (1994). Assessment of multidimensional coping: Task,emotion, and avoidance strategies. Psychological Assessment, 6, 50 60.
Engstrom, M. (2005). A study of emotional intelligence as it relates to organizationaloutcomes beyond what is contributed by personality. Dissertation AbstractsInternational: Section B, 66(10).
Epstein, S. (1979). The stability of behavior: On predicting most of the people much ofthe time. Journal of Personality and Social Psychology, 37(6), 1097 1126
EQ i 2.0 User�’s Handbook: Preview Version
Copyright 2011 Multi Health Systems Inc. All rights reserved.
289
Farnsworth, R., Gilbert, E., & Armstrong, D. (2002). Exploring the relationship betweenthe Myers Briggs Type Indicator and the Bar On Emotional Quotient Inventory:Applications for professional development practices. ASAC,Winnipeg, Manitoba.
Fiedler, F. E. (1967). A theory of leadership effectiveness.New York: McGraw Hill.
Fleishman, E.A. (1953). Leadership climate and human relations training.Personnel Psychology, 6, 205 222.
Flesch, R. (1948). A new readability yardstick. Journal of Applied Psychology, 32,221 233.
Fletcher, I., Leadbetter, P., Curran, A., & O�’Sullivan, H. (2009). A pilot study assessingemotional intelligence training and communication skills with 3rd year medicalstudents. Patient Education and Counseling, 76 (3), 376 379.
Flora, C. (2009). The pursuit of happiness. Psychology Today,http://www.psychologytoday.com/node/21162
Frederiksen, N. (1965). Response set scores as predictors of performance. PersonnelPsychology, 18, 225 244.
Frye, M. C., Bennett, R., & Caldwell, S. (2006). Team emotional intelligence and teaminterpersonal process effectiveness. Mid American Journal of Business, 21(1),49 56.
Gabel, R.S., Dolan, S.L., & Cerdin, J.L. (2005). Emotional intelligence as predictor ofcultural adjustment for success in global assignments. Career DevelopmentInternational, 10(5), 375 395.
Gardner, H. (1983). Frames of Mind. New York: Basic Books.
Gasiorowska, G.M. (2007). A study of project managers�’ most dominant emotionalintelligence abilities and skills. Dissertation Abstracts International: Section B:The Sciences and Engineering, 68(06).
Gervais, M. (2008). Achieving Success in Combat Sports Through Emotional Intelligence.Paper presented at the 116th American Psychological Association AnnualConvention, Boston, Massachusetts, August 14 17.
EQ i 2.0 User�’s Handbook: Preview Version
Copyright 2011 Multi Health Systems Inc. All rights reserved.
290
Giroir, E.M.E. (2010). Motivated by money: Students with academic scholarships versusthose without and their emotional intelligence. Dissertation AbstractsInternational Section A: Humanities and Social Sciences, p. 2409.
Goleman, D., (1995). Emotional Intelligence. New York: Bantam Books.
Haier, R. J., Siegel, B. V., MacLachlan, A., Soderling, E., Lottenberg, S., & Buchsbaum, M.S. (1992). Regional glucose metabolic changes after learning a complexvisuospatial/motor task: A positron emission tomographic study. Brain Research,570, 134 143.
Haffey, K.E. (2007). The relationship between emotional intelligence and psychologicaladjustment in children with cancer.Dissertation Abstracts International: SectionB: The Sciences and Engineering, 7373.
Halpin, A.W. (1954). The leadership behavior and combat performance of airplanecommanders. Journal of Abnormal and Social Psychology, 49, 19 22.
Handley, R. (1997). AFRS rates emotional intelligence. Airforce Recruited News, April.
Hansen, R.A. (2010). A study of school district superintendents and the connection ofemotional intelligence to leadership. Dissertation Abstracts International SectionA: Humanities and Social Sciences, 3920.
Harns, P.D., & Crede, M. (2010). Emotional intelligence and transformational andtransactional leadership: A meta analysis. Leadership and Organizational Studies,17(1), 5 17.
Harris, N.V. (2009). Is emotional intelligence the key to medical sales success? Therelationship between emotional intelligence and sales performance. DissertationAbstracts International Section A: Humanities and Social Sciences, 935.
Hayashi, A. (2006). Leadership development through an outdoor leadership programfocusing on emotional intelligence. Dissertation Abstracts International SectionA: Humanities and Social Sciences, 1530.
Hughes, M., Patterson, L.B., & Terrell, J., (2005). Emotional Intelligence in Action:Training andCoaching Activities for Leaders and Managers. San Francisco: Pfeiffer.
Hughes. M., & Terrell. J. (2007). The Emotionally Intelligent Team: Understanding andDeveloping the Behaviors of Success. San Francisco: Jossey Bass.
EQ i 2.0 User�’s Handbook: Preview Version
Copyright 2011 Multi Health Systems Inc. All rights reserved.
291
Hughes, M., Thompson, H., & Terrell, J. (2009). Handbook for developing emotional andsocial intelligence. San Francisco: Pfeiffer/John Wiley & Sons.
IBM SPSS Statistics (Version 19.0.0) [Computer software]. Somers, NY: IBM.
Jackson, D. N. (1971). The dynamics of structured personality tests. PsychologicalReview, 78, 229 248.
Jackson, D.N. (1974). Personality Research Form Manual. Goshen, NY: ResearchPsychologists Press.
Jasvinder, K. (2010). A mixed method case study: Bar On EQ i framework of emotionalintelligence and the school leadership experiences of principals who completedan urban leadership program in Northern California. Dissertation AbstractsInternational Section A: Humanities and Social Sciences, p. 1570.
Jerome, K.L. (2010). An examination of the relationship between emotional intelligenceand the leadership styles of early childhood professionals. Dissertation AbstractsInternational Section A: Humanities and Social Sciences, p. 3336.
John, O. P., & Benet Martínez, V. (2000). �“Measurement, scale construction, andreliability,�” in Handbook of research methods in social and personalitypsychology, ed. H. T. Reis and C. M. Judd, 339�–369. New York, NY: CambridgeUniversity Press.
Jöreskog, K. G., & Sörbom, D. (1986). LISREL VI: Analysis of linear structural relationshipsby maximum likelihood and least squares methods. Mooresville, IN: ScientificSoftware.
Kahn Greene, E.T., Lippizzi, E.L., Conrad, A.K., Kamimori, G.H., & Kilgore, W.D.S. (2006).Sleep deprivation adversely affects interpersonal responses to frustration.Personality and Individual Differences, 41, 1433 1443.
Kaplan, H. I., & Sadock, B. J. (1991). Synopsis of psychiatry (6th ed.). Baltimore, MD:Williams & Wilkins.
Kilgore, W.D.S., & Yurgelon Todd, D.A. (2007). Neural corrlates of emotional intelligencein adolescent children. Cognitive, Affective, & Behavioral Neuroscience, 7(2),140 151.
EQ i 2.0 User�’s Handbook: Preview Version
Copyright 2011 Multi Health Systems Inc. All rights reserved.
292
Killgore WD, Kahn Greene ET, Lipizzi EL, Newman RA, Kamimori GH, Balkin TJ. Sleepdeprivation reduces perceived emotional intelligence and constructive thinkingskills. Sleep Medicine, 9(5), 517 26.
Killgore WD, Killgore DB, Day LM, Li C, Kamimori GH, Balkin TJ. The effects of 53 hours ofsleep deprivation on moral judgment. Sleep, 30(3), 345 52.
Kincaid, J. P., Fishburne, R. P., Rogers, R. L. & Chissom, B. S. (1975). Derivation of newreadability formulas (Automated Readability Index, Fog Count and FleschReading Ease Formula) for Navy enlisted personnel, Research Branch Report 8�–75, Millington, TN: Naval Technical Training, U. S. Naval Air Station, Memphis,TN.
Leary, M. M. Reilly, M.D. Brown, F. W. (2009). A study of personality preferences andemotional intelligence. Leadership & Organization Development Journal, 30(5),421 434.
Likert, R. (1961). New patterns of management. New York: McGraw Hill.
Livingstone, H.A., & Day, A.L. (2005). Comparing the construct and criterion relatedvalidity of ability based and mixed model measures of emotional intelligence.Educational and Psychological Measurement. 65, 757 779.
Logan, D., Papadogiannis, P.K., Stein, S. & Gorewhich, A. (2008). Relationship betweenintelligence and MMPI 2 profiles in pilot applicants. APA 116th AnnualConvention, Boston, Massachusetts, August 14 17.
Lu, F.J., Li, G., Hsu, E, & Williams, L. (2010). Relationship between athletes' emotionalintelligence and precompetitive anxiety. Perceptual and Motor Skills, 110(1),323 338.
Lusch, R. F., and Serpkenci, R. R. (1990). Personal differences, job tension, job outcomes,and store performance: A study of retail managers. Journal of Marketing,54(1),85 101.
Malek, M. (2000). Relationship between emotional intelligence and collaborativeconflict resolution styles. Dissertation Abstracts International: Section B: TheSciences and Engineering, 2805.
Martins, A., Ramalho, N., & Morin, E. (2010). A comprehensie meta analysis of therelationship between Emotional Intelligence and health. Personality andIndividual Differences, 49, 554 564.
EQ i 2.0 User�’s Handbook: Preview Version
Copyright 2011 Multi Health Systems Inc. All rights reserved.
293
Mayer, J. (1986). How mood influences cognition. In N.E. Sharkey (Ed.), Advances inCognitive Science, Vol. 1 (pp. 290 314). Chichester, England: Ellis Horwood.
Mayer, J.D., DiPaolo, M., & Salovey, P. (1990). Perceiving affective content inambiguous visual stimuli: A component of emotional intelligence. Journal ofPersonality Assessment, 54(3 4), 772 781.
Mayer, J.D., Mamberg, M., & Volanth, A.J. (1988). Cognitive domains of the moodsystem. Journal of Personality, 56, 453 486.
Mayer, J.D., & Salovey, P. (1988). Personality moderates the effects of affect oncognition. In J. Forgas and K. Fiedler (Eds.). Affect, cognition, and social behavior(pp. 87 99). Toronto: Hogrefe.
Mayer, J.D., & Salovey, P. (1993). The intelligence of emotional intelligence. Intelligence,17(4), 433 442.
Mayer, J.D., & Salovey, P. (1995). Emotional intelligence and the construction andregulation of mood experience. Applied and Preventive Psychology, 4(3),197 208.
Mayer, J.D., Salovey, P., Gomberg Kauffman, S., & Blainey, K. (1991). A broaderconception of mood experience. Journal of Personality and Social Psychology, 60,100 111.
Mayer. J.D., & Volanth, A.J. (1985). Cognitive involvement in the emotional responsesystem.Motivation and Emotion, 9, 261 275.
Mayer, J. D., Salovey, P., & Caruso, D. R. (2002).Mayer Salovey Caruso EmotionalIntelligence Test (MSCEIT) User�’s Manual. Toronto, Canada: Multi HealthSystems.
Milhoan, P.L. (2008). Emotional intelligence competencies of department chairs in theWest Virginia State Community College System and their faculty members' perceptionsof organizational climate. Dissertation Abstracts International Section A: Humanities andSocial Sciences, 52.
Morehouse, M.M. (2007). An exploration of emotional intelligence across career arenas.Leadership & Organization Development Journal, 28(4), 296 307.
EQ i 2.0 User�’s Handbook: Preview Version
Copyright 2011 Multi Health Systems Inc. All rights reserved.
294
Mount, M.K., & Barrick, M.R. (1998). Five reasons why the �“Big Five�” article has beenfrequently cited. Personnel Psychology, 51, 849 857.
Mousseau, M.B.M. (2008). Achieving success in golf through emotional intelligence.Paper presented at the 116th American Psychological Association AnnualConvention, Boston, Massachusetts, August 14 17.
Mulligan, R.D. (2004). Self assessment of social and emotional competencies of floorcovering salespeople and its correlation with sales performance. DissertationAbstracts International: Section B: The Sciences and Engineering, 64(9 B), 4664.
Myers, I.B., & McCaulley, M.H. (1985).Manual: A guide to the development and use ofthe Myers Briggs Type Indicator. Palo Alto, CA: Consulting Psychology Press.
Nideffer, R.M. (1976). Test of attentional and interpersonal style. Journal of Personalityand Social Psychology, 34(3), 394 404.
Noland, D.S. (2009). Emotional intelligence and new product development team leadersuccess in the lighting industry. Dissertation Abstracts International Section A:Humanities and Social Sciences, 69(7 A), 2788.
Oney, M. R. (2010). Exploring the causal relationship of emotional intelligence to clergyleadership effectiveness. Dissertation Abstracts International Section A:Humanities and Social Sciences, p. 214.
Papadogiannis, P.K., Logan, D., Mann, D.T.Y. & Escobar, R.E.M. (2009). A meta analyticapproach to examining an ability based measure of EI and leadership. Paperpresented at the 2009 Annual Meeting of the Academy of Management,Chicago, IL.
Parker, J. D. A., Creque, R. E., Barnhart, D. L., Harris, J., Majeski, S. A., Wood, L. M., Bond,B. J., & Hogan, M. J. (2004). Academic achievement in high school: Doesemotional intelligence matter? Personality and Individual Differences, 37, 13211330.
Parker, J. D. A., Hogan, M. J., Eastabrook, J. M., Oke, A., & Wood, L. M. (2006). Emotionalintelligence and student retention: Predicting the successful transition from highschool to university. Personality and Individual Differences, 41, 1329 1336.
Pearman, R. (2002). Introduction to Type and Emotional Intelligence. Palo Alto: CPP, Inc.

EQ i 2.0 User�’s Handbook: Preview Version
Copyright 2011 Multi Health Systems Inc. All rights reserved.
295
Perlini, A.H. & Halverson, T.R. (2006). Emotional intelligence in the National HockeyLeague. Canadian Journal of Behavioural Science, 38, 109 119.
Petrides, K. V., & Furnham, A. (2001). Trait emotional intelligence: Psychometricinvestigation with reference to established trait taxonomies. European Journal ofPersonality, 15, 425 448.
Petrides, K.V., Pita, R., Kokkinaki, F., 2007. The location of trait emotional intelligence inpersonality factor space. British Journal of Psychology, 98, 273�–289.
Piedmont, R., McCrae, R., Riemann, R., & Angleitner, A. (2000). On the invalidity ofvalidity scales: evidence from self reports and observer ratings in volunteersamples. Journal of Personality and Social Psychology, 78(3), 582 593.
Prochaska, J.O., DiClemente, C.C., & Norcross, J.C. (1992). In search of how peoplechange. Applications to addictive behaviors. American Psychologist, 47(9),102�–114.
Riggio, R.E., & Carney, D.R. (2003). Social Skills Inventory Manual (2nd ed.).Menlo Park,CA: Mind Garden, Inc.
Rosenthal, R. (1995). Writing meta analytic reviews. Psychological Bulletin, 118(2),183 192.
Rosenthal, R. (1991). Meta analysis: A review. Psychosomatic Medicine, 53(3), 247 271.
Sadri, E., Akbarzadeh, N., & Poushaneh, K. (2009). Impact of social emotional learningskills instruction on emotional intelligence of male high school students.Psychological Research, 11, 69 83.
Salovey, P., & Birnbaum, D. (1989). Influence of mood on health relevant cognitions.Journal of Personality and Social Psychology, 57, 539 551.
Salovey, P., Hsee, C.K., & Mayer, J. (1993). Emotional intelligence and the self regulationof affect. In D.M. Wegner and J.W. Pennebaker (Eds.), Handbook of mentalcontrol (p. 258 277). Englewood Cliffs, NJ: Prentice Hall.
Salovey, P., & Mayer, J. (1990). Emotional intelligence. Imagination, Cognition, andPersonality, 9(3), 185 211.

EQ i 2.0 User�’s Handbook: Preview Version
Copyright 2011 Multi Health Systems Inc. All rights reserved.
296
Salovey, P., Mayer, J., & Rosenhan, D.L. (1991). Mood and helping: Mood as a motivatorof helping and helping as a regulator of mood. In M.S. Clark (Ed.), Prosocialbehavior: Review of personality and social psychology (Vol. 12, p. 215 237).Newbury Park, CA: Sage.
Salovey, P., & Rodin, J. (1985). Cognitions about the self: Connecting feeling states andsocial behavior. In P. Shaver (Ed.), Self, situations, and social behavior: Reiew ofpersonality and social psychology, (Vol. 6 p. 143 166). Beverly Hills, CA: Sage.
Salovey, P., Mayer, J.D., Goldman, S.L., Turvey, C.P., & Tibor P. (1995). Emotionalattention, clarity, and repair: Exploring emotional intelligence using the TraitMeta Mood Scale. InJ.W. Pennebaker (Ed), Emotion, disclosure, & health, (p.125 154). Washington, DC, US: American Psychological Association.
Schulman, P. (1995). Explanatory style and achievement in school and work. In G.Buchanan and M. E. P. Seligman (Ed.), Explanatory style. Hillsdale, NJ: LawrenceErlbaum.
Schutte, N.S. & Malouff, J.M. (2007). Dimensions of reading motivation: Development ofan adult reading motivation scale. Reading Psychology: An InternationalQuarterly, 28, 469 489.
Schutte, N.S., Malouff, J.M., Thorsteinsson, E.B., Bhullar, N., & Rooke, S.E. (2007). Ameta analytic investigation of the relationship between emotional intelligenceand health. Personality and Individual Differences, 42(6), 921 933.
Schutte, N.S., Malouff, J.M., Hall, L.E., Haggerty, D.J., Cooper, J.T., Golden, C.J., &Dornheim, L. Development and validation of a measure of emotionalintelligence. Personality and Individual Differences, 25(2), 167 177.
Schwartz, M.S. (2008). High caliber athletes and emotional awareness: An examinationof NCAA division I college athletes. Dissertation Abstracts International: SectionB: The Sciences and Engineering, p. 6981.
Seligman, M.E.P. (2002). Authentic Happiness: Using the New Positive Psychology toRealize Your Potential for Lasting Fulfillment. New York: Free Press/Simon andSchuster.
Seligman, M. E. P., Steen, T. A., Park, N., & Peterson, C. (2005). Positive psychologyprogress: Empirical validation of interventions. American Psychologist, 60,410 421.

EQ i 2.0 User�’s Handbook: Preview Version
Copyright 2011 Multi Health Systems Inc. All rights reserved.
297
Sitarenios, G. & Stein, S. (1998). Emotional intelligence in the prediction of sales successin the finance industry. Toronto, Canada: Multi Health Systems
Smith, J.E. (2001). Emotional intelligence and behavior: An exploratory study of peopleon parole. Dissertation Abstracts International: Section B: The Sciences andEngineering, 61 (11 B), 6168.
Smith, S.R., Wiggins, C.M., & Gorske, T.T. (2007). A survey of psychological assessmentfeedback practices. Assessment, 14, 309 310.
Snuggs, K.L. (2007). Leadership that inspires dedication: The relationship between theemotional intelligence of community college presidents and faculty and staffretention. Dissertation Abstracts International Section A: Humanities and SocialSciences, p. 3258.
Statistics Canada. (2008). 2008 Census of Canada. Ottawa: Industry Canada.
Steiger, J. H., & Lind, J. M. (1980, June). Statistically based tests for the number ofcommon factors. Paper presented at the annual meeting of the PsychometricSociety, Iowa City, IA.
Stein, S. J., & Book, H. E. (2000). The EQ edge: Emotional intelligence and your success.Toronto, Canada: Multi Health Systems.
Stein & Book, (2006). The EQ edge: Emotional intelligence and your success, 2nd Ed.Toronto, Canada: Multi Health Systems.
Stogdill, R.M., & Coons, A.E. (1957). Leader behavior: Its description and measurement.Oxford, England: Ohio State University, Bureau of Business.
Tabachnick, B.G., & Fidell, L.S. (2007). Using multivariate statistics (5th ed.). Boston, MA:Pearson.
Tannenbaum, A.S. (1966). Social psychology of the work organization. Monterey, CA:Wadsworth.
Terman, L.M. (1916). The measurement of intelligence. Boston, MA: Houghton Mifflin.
Thiébau, E., Breton, A., Lambolez, E., & Richoux, V. (2005). Study of relations betweenthe Bar On Emotional Intelligence EQ i scores and self reports of job satisfaction.Psychologie du Travail et des Organisations, 11(1), 35 45.
EQ i 2.0 User�’s Handbook: Preview Version
Copyright 2011 Multi Health Systems Inc. All rights reserved.
298
Thompson, B. (2002). �“Statistical,�” �“practical,�” and �“clinical�”: How many kinds ofsignificance do counselors need to consider? Journal of Counseling andDevelopment, 80, 64�–71.
Torrington, A. (2001). Relationship between the BarOn Emotional Quotient Inventoryand the Myers Briggs Type Indicator. Toronto, Canada: Multi Health Systems.
United States Bureau of the Census. (2008). United States Census 2008. Washington, DC:Government Printing Office
van der Zee, K., & Wabeke, R. (2004). Is Trait Emotional Intelligence Simply or MoreThan Just a Trait? European Journal of Personality, 18(4), 243 263.
Van Rooy, D.L., & Viswesvaran, C. (2004). Emotional intelligence: A meta analyticinvestigation of predictive validity and nomological net. Journal of VocationalBehavior, 65, 71 95.
Waddell, J.T. (2010). Exploratory study of the relationship between servant leadershipattribution and the leader's emotional intelligence. Dissertation AbstractsInternational Section A: Humanities and Social Sciences, p. 4072.
Walker, M.E.B. (2007). Emotional intelligence and academic success in college.Dissertation Abstracts International Section A: Humanities and Social Sciences, p.2328.
Walpole, P., Isaac, C.L., & Reynders, H.J. (2008). A comparison of emotional andcognitive intelligences in people with and without temporal lobe epilepsy.Epilespsia, 49(8), 1470 1474.
Watson, G., & Glaser, E.M. (2009).Watson Glaser II Critical Thinking Appraisal: Technicalmanual and user�’s guide. San Antonio, TX: Pearson.
Wechsler, D. (1939). The measurement of adult intelligence. Baltimore: Williams &Wilkins.
Wechsler, D. (1940). Nonintellective factors in general intelligence. PsychologicalBulletin, 37, 444 445.
Wechsler, D. (1943). Nonintellective factors in general intelligence. Journal of AbnormalSocial Psychology, 38, 100 104.
EQ i 2.0 User�’s Handbook: Preview Version
Copyright 2011 Multi Health Systems Inc. All rights reserved.
299
Wechsler, D. (1958). The measurement and appraisal of adult intelligence, 4th ed.Baltimore: The Williams & Wilkins Company.
Wechsler, D. (2008).Wechsler Adult Intelligence Scale Fourth Edition (WAIS IV). SanAntonio, TX: Pearson.
Weissman, M. M. (1999). SAS SR: Social Adjustment Scale�–Self Report. Toronto, Canada:Multi Health Systems.
Yalcin, B.M., Karahan, T.F., Ozcelik, M., & Igde, F.A. (2008). The effects of an emotionalintelligence program on the quality of life and well being of patients with type 2diabetes mellitus. The Diabetes Educator, 34(6), 1013 1024.
Zachary, R.A., & Gorsuch, R.L. (1985). Continuous norming: Implications for the WAIS R.Journal of Clinical Psychology, 41, 86 94.
EQ i 2.0 User�’s Handbook: Preview Version
Copyright 2011 Multi Health Systems Inc. All rights reserved.
300
Appendix

301
Appendix A: Standardization,Reliability, and Validity
This appendix details the statistical results pertaining to the standardization, reliability,and validity of the EQ i® 2.0 and EQ 360® 2.0, as summarized in chapter 13.
Table A.1. Demographic Characteristics of EQ i 2.0 Pilot Data
The following table summarizes the demographic characteristics of the EQ i 2.0 pilot data.Ideally, pilot data should include representation from a wide range of demographic (gender, age,race, education level) groups.
Demographic N %Male 554 41.2Gender
Female 792 58.818�–24 586 43.525�–29 285 21.230�–34 208 15.535�–39 163 12.1
Age Group (Years)
40�–44 104 7.7Black 107 7.9Hispanic/Latino 124 9.2White 1,008 74.9
Race/Ethnicity
Other 107 7.9High School or Less 280 20.8Some College/University 447 33.2College/University or Higher 615 45.7
Education Level
Missing 4 0.3Total 1,346 100.0

302
Table A.2. Comparison of EQ i 2.0 Scores in U.S. and Canadian Samples
The following table provides mean and standard deviations of EQ i 2.0 scores in U.S. andCanadian samples. d values provide an effect size to describe differences between the twocountries as small, medium, or large. F and p values provide statistical significance tests for thesedifferences. A lack of meaningful (i.e., d .20) differences between U.S. and Canadianparticipants supports combining the two countries in the normative sample.
Scale U.S. Canada d F p
M 98.9 99.5Total EI
SD 15.4 15.50.04 0.74 .391
M 99.8 100.1Self Perception Composite
SD 15.3 15.40.02 0.21 .646
M 99.1 100.0Self Regard
SD 14.9 15.00.06 1.57 .210
M 100.5 100.7Self Actualization
SD 15.3 15.40.01 0.07 .789
M 99.9 99.6Emotional Self Awareness
SD 15.3 15.40.02 0.27 .606
M 98.4 99.1Self Expression Composite
SD 15.3 15.40.04 0.85 .358
M 99.2 99.2Emotional Expression
SD 15.2 15.30.00 0.00 .991
M 100.1 100.4Assertiveness
SD 14.9 15.00.02 0.16 .689
M 97.2 98.4Independence
SD 15.2 15.30.08 3.22 .073
M 99.6 100.7Interpersonal Composite
SD 15.3 15.40.07 2.10 .147
M 99.3 100.4Interpersonal Relationships
SD 15.3 15.40.08 2.68 .102
M 99.8 100.1Empathy
SD 15.2 15.30.02 0.28 .596
M 100.1 101.3Social Responsibility
SD 15.1 15.20.08 3.01 .083
M 98.5 97.3Decision Making Composite
SD 15.5 15.60.07 2.56 .109
M 97.8 97.5Problem Solving
SD 15.3 15.40.02 0.14 .710
M 99.9 99.6Reality Testing
SD 15.3 15.30.02 0.11 .739
M 99.0 96.7Impulse Control
SD 15.5 15.60.14 9.64 .002
M 98.7 100.2Stress Management Composite
SD 15.1 15.10.10 4.84 .028
M 98.1 99.7Flexibility
SD 15.1 15.20.10 4.89 .027
�…table continues on next page

303
Table A.2. Comparison of EQ i 2.0 Scores in U.S. and Canadian Samples (continued)Scale U.S. Canada d F p
M 99.0 100.2Stress Tolerance
SD 14.8 14.90.08 2.76 .097
M 99.5 100.6Optimism
SD 15.2 15.30.08 2.63 .105
M 99.6 100.8Happiness
SD 15.2 15.30.08 2.69 .101
Note. Sample size ranges (due to missing data): U.S., N = 5,902 to 5,905; Canada, N = 507 to 508.df for F tests: Total EI = 1, 6407; Composite Scales = 1, 6406; Subscales = 1, 6403. PositiveCohen's d values signify higher means in the U.S. group, negative Cohen's d values signify highermeans in the Canadian group. Guidelines for evaluating |d| are .20 = small, .50 = medium, .80 =large.
Table A.3. Age × Gender Distribution: EQ i 2.0 Normative Sample
The following table conveys the distribution of EQ i 2.0 normative sample participants,categorized by age group and gender. An ideal distribution is one that is similarly proportionedacross all groups, demonstrating equal representation of all age × gender groups.
Male Female TotalAge Group (Years)
N % N % N %18�–24 200 5.0 200 5.0 400 10.025�–29 200 5.0 200 5.0 400 10.030�–34 200 5.0 200 5.0 400 10.035�–39 200 5.0 200 5.0 400 10.040�–44 200 5.0 200 5.0 400 10.045�–49 200 5.0 200 5.0 400 10.050�–54 200 5.0 200 5.0 400 10.055�–59 200 5.0 200 5.0 400 10.060�–64 200 5.0 200 5.0 400 10.065+ 200 5.0 200 5.0 400 10.0Total 2,000 50.0 2,000 50.0 4,000 100.0
Table A.4. Race/Ethnicity Distribution: EQ i 2.0 Normative Sample
The following table summarizes the race/ethnicity distribution of the EQ i 2.0 normative samplealong with Census information. Ideally, the normative sample should show race/ethnicityproportions similar (within 3%) of Census, suggesting the normative sample is representative ofthe general population.Country Race/Ethnicity N % Census %
Black 410 11.4 12.3Hispanic/Latino 432 12.0 15.1White 2,519 70.0 66.0Other 239 6.6 6.6
U.S.
Total 3,600 100.0 100.0White 315 78.8 80.0Non White 85 21.3 20.0CanadaTotal 400 100.0 100.0

304
Table A.5. Geographic Region Distribution: EQ i 2.0 Normative Sample
The following table summarizes the geographic region distribution of the EQ i 2.0 normativesample along with Census information. Ideally, the normative sample should show regionproportions similar (within 3%) of Census, suggesting the normative sample is representative ofthe general population.
Country Region N % Census %Northeast 655 18.2 18.1Midwest 793 22.0 21.9South 1,292 35.9 36.7West 860 23.9 23.3
U.S.
Total 3,600 100.0 100.0West 54 13.5 13.0Prairies 72 18.0 17.1Central 244 61.0 62.4East 30 7.5 7.3
Canada
Total 400 100.0 100.0
Table A.6. Education Level Distribution: EQ i 2.0 Normative Sample
The following table summarizes the education level (i.e., highest level of attained education)distribution of the EQ i 2.0 normative sample along with Census information. Ideally, thenormative sample should show region proportions similar (within 3%) of Census, suggesting thenormative sample is representative of the general population.
Country Education Level N % Census %High school diploma or less 1,751 43.8 46.6Some college/university 1,119 28.0 27.2College/university graduate or higher 1,130 28.2 26.2
U.S. andCanada
Total 4,000 100.0 100.0
Table A.7. Multivariate Effects of Age and Gender: EQ i 2.0
The following table summarizes the results from the multivariate analyses of covariance(MANCOVAs) conducted on the composite scales and subscales to examine potential effects ofgender, age, or the interaction between gender and age on EQ i 2.0 scores in the normativesample. Wilks�’ lambda ranges from 0.00 to 1.00 and depicts the amount of variance notexplained by the demographic variable. F and p values convey the statistical significance of thedemographic variables. Partial 2 values provide an effect size for describing the effects as small,medium, or large. Meaningful effect sizes (i.e., partial 2 .01) suggest differences amongparticipants based on the demographic variable.
AnalysisDemographicVariable
Wilks�’Lambda
F (df) p Partial 2
Gender .935 55.56 (5, 3984) < .001 .07Age .955 9.22 (20, 13214.383) < .001 .01
CompositeScales
Gender × Age .989 2.16 (20, 13214.38) .002 .00�…table continues on next page
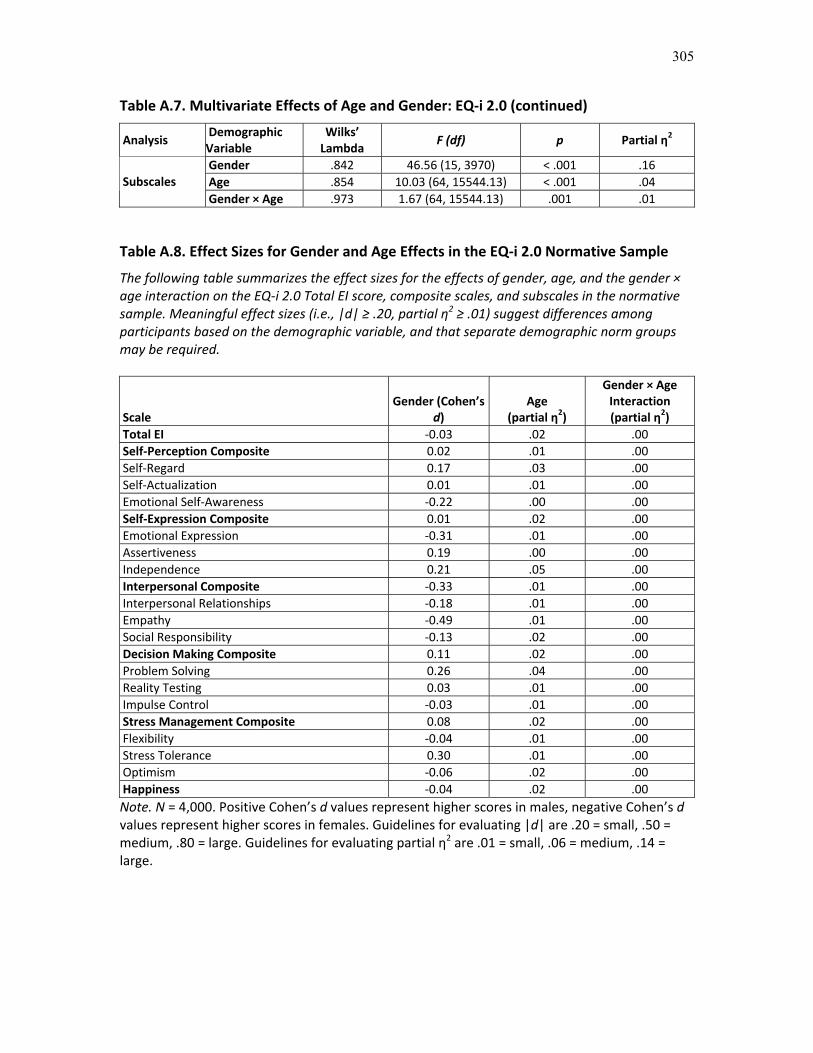
305
Table A.7. Multivariate Effects of Age and Gender: EQ i 2.0 (continued)
AnalysisDemographicVariable
Wilks�’Lambda
F (df) p Partial 2
Gender .842 46.56 (15, 3970) < .001 .16Age .854 10.03 (64, 15544.13) < .001 .04SubscalesGender × Age .973 1.67 (64, 15544.13) .001 .01
Table A.8. Effect Sizes for Gender and Age Effects in the EQ i 2.0 Normative Sample
The following table summarizes the effect sizes for the effects of gender, age, and the gender ×age interaction on the EQ i 2.0 Total EI score, composite scales, and subscales in the normativesample. Meaningful effect sizes (i.e., |d| .20, partial 2 .01) suggest differences amongparticipants based on the demographic variable, and that separate demographic norm groupsmay be required.
ScaleGender (Cohen�’s
d)Age
(partial 2)
Gender × AgeInteraction(partial 2)
Total EI 0.03 .02 .00Self Perception Composite 0.02 .01 .00Self Regard 0.17 .03 .00Self Actualization 0.01 .01 .00Emotional Self Awareness 0.22 .00 .00Self Expression Composite 0.01 .02 .00Emotional Expression 0.31 .01 .00Assertiveness 0.19 .00 .00Independence 0.21 .05 .00Interpersonal Composite 0.33 .01 .00Interpersonal Relationships 0.18 .01 .00Empathy 0.49 .01 .00Social Responsibility 0.13 .02 .00Decision Making Composite 0.11 .02 .00Problem Solving 0.26 .04 .00Reality Testing 0.03 .01 .00Impulse Control 0.03 .01 .00Stress Management Composite 0.08 .02 .00Flexibility 0.04 .01 .00Stress Tolerance 0.30 .01 .00Optimism 0.06 .02 .00Happiness 0.04 .02 .00Note. N = 4,000. Positive Cohen�’s d values represent higher scores in males, negative Cohen�’s dvalues represent higher scores in females. Guidelines for evaluating |d| are .20 = small, .50 =medium, .80 = large. Guidelines for evaluating partial 2 are .01 = small, .06 = medium, .14 =large.

306
Table A.9. Gender Differences in EQ i 2.0 ScoresThe following table provides EQ i 2.0 means and standard deviations for males and females inthe normative sample. F and p values convey the statistical significance of gender differences.Scale Male (N = 2,000) Female (N = 1,996) F (1, 3985) p
M 99.8 100.2Total EI
SD 15.2 15.20.78 .378
M 100.1 99.9Self Perception Composite
SD 15.2 15.20.28 .598
M 101.3 98.7Self Regard
SD 15.1 15.127.11 < .001
M 100.1 99.9Self Actualization
SD 15.2 15.20.14 .711
M 98.4 101.7Emotional Self Awareness
SD 15.3 15.344.28 < .001
M 100.0 100.0Self Expression Composite
SD 15.3 15.30.02 .884
M 97.6 102.4Emotional Expression
SD 15.2 15.293.63 < .001
M 101.4 98.6Assertiveness
SD 15.3 15.332.76 < .001
M 101.6 98.5Independence
SD 14.9 14.941.62 < .001
M 97.5 102.5Interpersonal Composite
SD 15.1 15.1101.97 < .001
M 98.6 101.4Interpersonal Relationships
SD 15.3 15.331.83 < .001
M 96.3 103.7Empathy
SD 14.9 14.9232.15 < .001
M 99.0 101.0Social Responsibility
SD 15.1 15.116.18 < .001
M 100.9 99.1Decision Making Composite
SD 15.1 15.112.41 < .001
M 102.0 98.1Problem Solving
SD 14.9 14.963.84 < .001
M 100.2 99.8Reality Testing
SD 15.3 15.30.62 .431
M 99.8 100.2Impulse Control
SD 15.3 15.30.85 .358
M 100.6 99.4Stress Management Composite
SD 15.2 15.26.15 .013
M 99.7 100.3Flexibility
SD 15.3 15.31.74 .188
M 102.2 97.8Stress Tolerance
SD 15.0 15.083.72 < .001
M 99.5 100.5Optimism
SD 15.2 15.23.68 .055
M 99.7 100.3Happiness
SD 15.2 15.21.66 .197
307
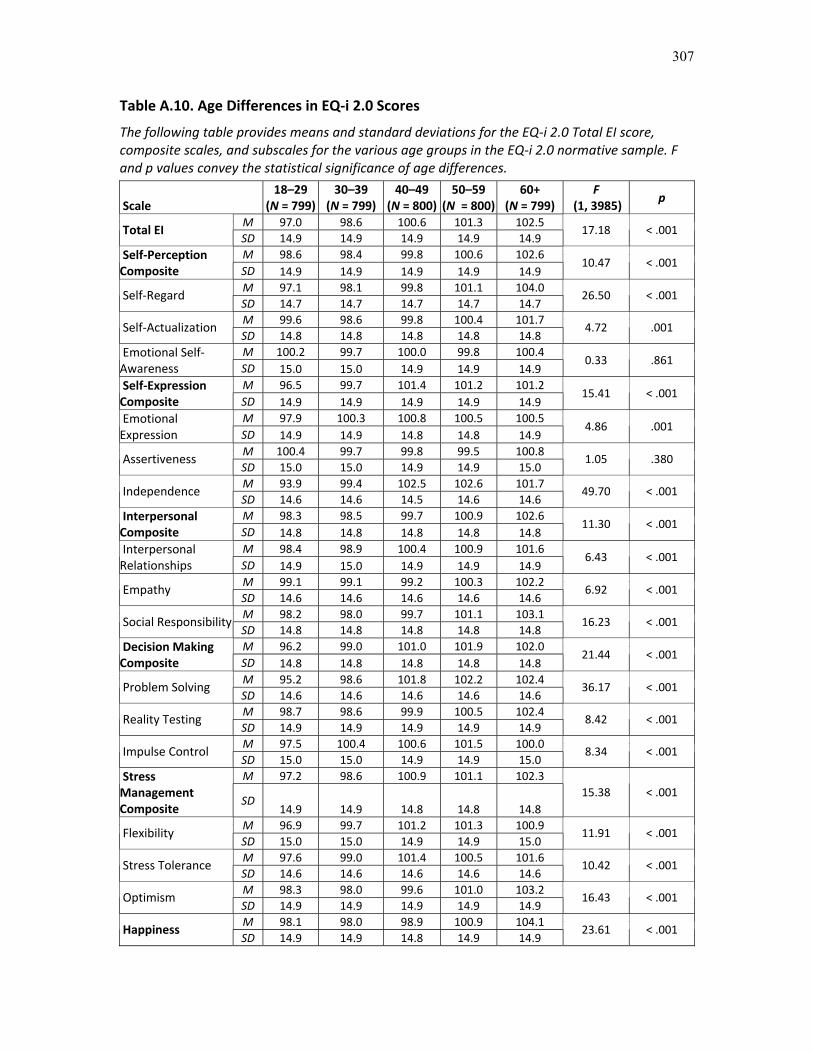
Table A.10. Age Differences in EQ i 2.0 Scores
The following table provides means and standard deviations for the EQ i 2.0 Total EI score,composite scales, and subscales for the various age groups in the EQ i 2.0 normative sample. Fand p values convey the statistical significance of age differences.
Scale18�–29
(N = 799)30�–39
(N = 799)40�–49
(N = 800)50�–59
(N = 800)60+
(N = 799)F
(1, 3985)p
M 97.0 98.6 100.6 101.3 102.5Total EI
SD 14.9 14.9 14.9 14.9 14.917.18 < .001
M 98.6 98.4 99.8 100.6 102.6Self PerceptionComposite SD 14.9 14.9 14.9 14.9 14.9
10.47 < .001
M 97.1 98.1 99.8 101.1 104.0Self Regard
SD 14.7 14.7 14.7 14.7 14.726.50 < .001
M 99.6 98.6 99.8 100.4 101.7Self Actualization
SD 14.8 14.8 14.8 14.8 14.84.72 .001
M 100.2 99.7 100.0 99.8 100.4Emotional SelfAwareness SD 15.0 15.0 14.9 14.9 14.9
0.33 .861
M 96.5 99.7 101.4 101.2 101.2Self ExpressionComposite SD 14.9 14.9 14.9 14.9 14.9
15.41 < .001
M 97.9 100.3 100.8 100.5 100.5EmotionalExpression SD 14.9 14.9 14.8 14.8 14.9
4.86 .001
M 100.4 99.7 99.8 99.5 100.8Assertiveness
SD 15.0 15.0 14.9 14.9 15.01.05 .380
M 93.9 99.4 102.5 102.6 101.7Independence
SD 14.6 14.6 14.5 14.6 14.649.70 < .001
M 98.3 98.5 99.7 100.9 102.6InterpersonalComposite SD 14.8 14.8 14.8 14.8 14.8
11.30 < .001
M 98.4 98.9 100.4 100.9 101.6InterpersonalRelationships SD 14.9 15.0 14.9 14.9 14.9
6.43 < .001
M 99.1 99.1 99.2 100.3 102.2Empathy
SD 14.6 14.6 14.6 14.6 14.66.92 < .001
M 98.2 98.0 99.7 101.1 103.1Social Responsibility
SD 14.8 14.8 14.8 14.8 14.816.23 < .001
M 96.2 99.0 101.0 101.9 102.0Decision MakingComposite SD 14.8 14.8 14.8 14.8 14.8
21.44 < .001
M 95.2 98.6 101.8 102.2 102.4Problem Solving
SD 14.6 14.6 14.6 14.6 14.636.17 < .001
M 98.7 98.6 99.9 100.5 102.4Reality Testing
SD 14.9 14.9 14.9 14.9 14.98.42 < .001
M 97.5 100.4 100.6 101.5 100.0Impulse Control
SD 15.0 15.0 14.9 14.9 15.08.34 < .001
M 97.2 98.6 100.9 101.1 102.3StressManagementComposite
SD14.9 14.9 14.8 14.8 14.8
15.38 < .001
M 96.9 99.7 101.2 101.3 100.9Flexibility
SD 15.0 15.0 14.9 14.9 15.011.91 < .001
M 97.6 99.0 101.4 100.5 101.6Stress Tolerance
SD 14.6 14.6 14.6 14.6 14.610.42 < .001
M 98.3 98.0 99.6 101.0 103.2Optimism
SD 14.9 14.9 14.9 14.9 14.916.43 < .001
M 98.1 98.0 98.9 100.9 104.1Happiness
SD 14.9 14.9 14.8 14.9 14.923.61 < .001
308
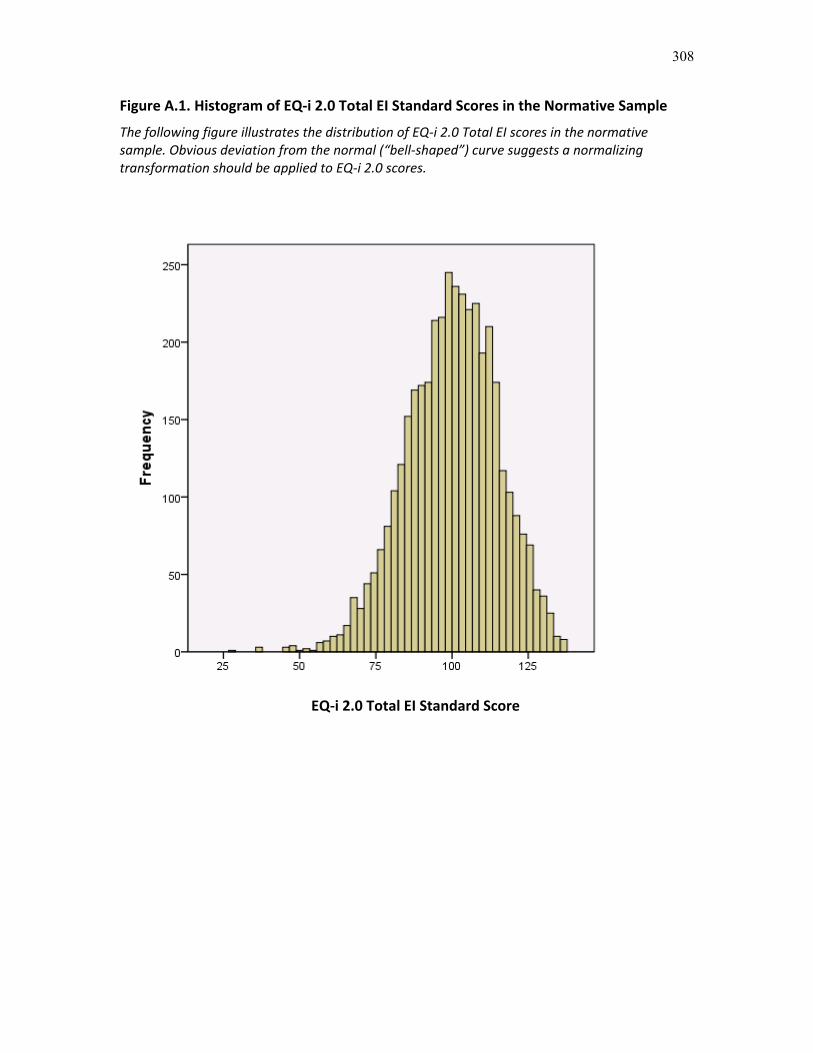
Figure A.1. Histogram of EQ i 2.0 Total EI Standard Scores in the Normative Sample
The following figure illustrates the distribution of EQ i 2.0 Total EI scores in the normativesample. Obvious deviation from the normal (�“bell shaped�”) curve suggests a normalizingtransformation should be applied to EQ i 2.0 scores.
EQ i 2.0 Total EI Standard Score

309
Table A.11. Internal Consistency: EQ i 2.0 Normative Sample
The following table summarizes the internal consistency (Cronbach�’s alpha) values for theEQ i 2.0 Total EI score, composite scales, and subscales in the EQ i 2.0 overall normative sampleand within gender by age subsamples. Alpha values range from 0.00 to 1.00 with higher valuessupporting the reliability of the EQ i 2.0.
EQ i 2.0 Normative GroupMale Female
Scale
# ofitems
General(TotalSample)
18�–29
30�–39
40�–49
50�–59
60+18�–29
30�–39
40�–49
50�–59
60+
Total EI 118 .97 .97 .97 .97 .97 .97 .97 .97 .98 .97 .98Self PerceptionComposite
24 .93 .93 .93 .93 .92 .92 .94 .93 .94 .94 .93
Self Regard 8 .91 .92 .91 .90 .89 .86 .92 .91 .92 .92 .90Self Actualization 9 .88 .88 .88 .88 .88 .87 .90 .89 .90 .88 .87Emotional SelfAwareness
7 .81 .79 .81 .81 .80 .81 .80 .80 .81 .81 .80
Self ExpressionComposite
23 .88 .88 .88 .88 .87 .86 .88 .88 .88 .88 .89
Emotional Expression 8 .84 .83 .85 .84 .84 .82 .83 .85 .82 .84 .82Assertiveness 7 .77 .76 .75 .75 .77 .77 .78 .77 .79 .78 .79Independence 8 .81 .82 .79 .80 .75 .75 .81 .82 .80 .81 .82InterpersonalComposite
23 .92 .92 .92 .92 .92 .93 .92 .91 .93 .92 .93
InterpersonalRelationships
7 .86 .87 .89 .87 .86 .87 .86 .86 .88 .86 .87
Empathy 9 .88 .86 .88 .87 .88 .88 .87 .85 .88 .86 .86Social Responsibility 6 .80 .77 .81 .78 .81 .82 .80 .80 .81 .80 .82Decision MakingComposite
24 .88 .87 .88 .89 .88 .88 .89 .86 .87 .87 .88
Problem Solving 8 .85 .83 .85 .86 .85 .85 .85 .84 .84 .82 .85Reality Testing 9 .81 .80 .80 .79 .80 .84 .79 .80 .83 .81 .81Impulse Control 8 .77 .79 .75 .79 .74 .75 .81 .75 .77 .76 .77Stress ManagementComposite
24 .92 .90 .92 .91 .91 .92 .92 .91 .92 .92 .92
Flexibility 8 .80 .78 .80 .77 .78 .80 .82 .83 .79 .80 .82Stress Tolerance 8 .87 .86 .84 .85 .86 .89 .86 .85 .86 .87 .87Optimism 8 .89 .88 .90 .88 .89 .88 .89 .89 .90 .89 .89Happiness 8 .92 .91 .91 .91 .92 .90 .90 .91 .92 .93 .92N 4,000 400 400 400 400 400 400 400 400 400 400
310
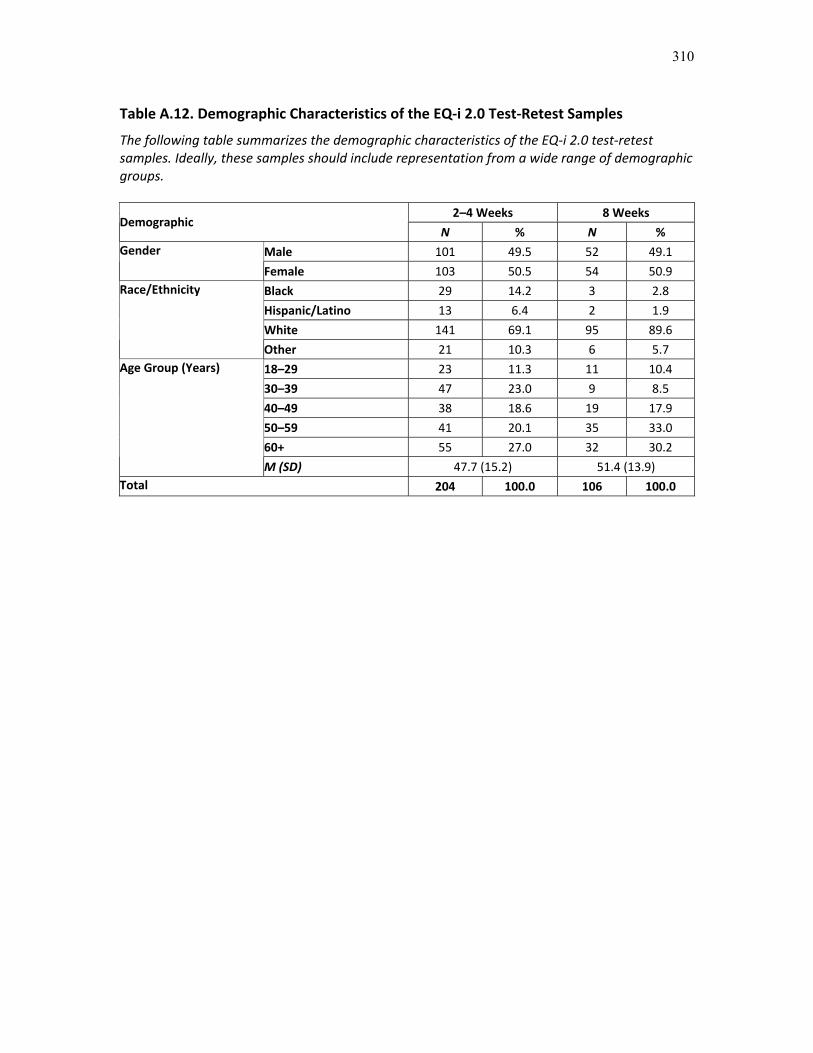
Table A.12. Demographic Characteristics of the EQ i 2.0 Test Retest Samples
The following table summarizes the demographic characteristics of the EQ i 2.0 test retestsamples. Ideally, these samples should include representation from a wide range of demographicgroups.
2�–4 Weeks 8 WeeksDemographic
N % N %
Male 101 49.5 52 49.1Gender
Female 103 50.5 54 50.9
Black 29 14.2 3 2.8
Hispanic/Latino 13 6.4 2 1.9
White 141 69.1 95 89.6
Race/Ethnicity
Other 21 10.3 6 5.7
18�–29 23 11.3 11 10.4
30�–39 47 23.0 9 8.5
40�–49 38 18.6 19 17.9
50�–59 41 20.1 35 33.0
60+ 55 27.0 32 30.2
Age Group (Years)
M (SD) 47.7 (15.2) 51.4 (13.9)Total 204 100.0 106 100.0

311
Table A.13. EQ i 2.0 Test retest Correlations and Descriptive Statistics
The following table summarizes the test retest correlations and time 1 and time 2 means andstandard deviations for the EQ i 2.0 Total EI score, composite scales, and subscales in the 2�–4week and 8 week retest samples. Correlations range from 0.00 to 1.00 with higher valuessuggesting greater test retest reliability.
2�–4 Weeks 8 Weeks
Time 1 Time 2 Time 1 Time 2
ScaleTestretest r M SD M SD
Testretest r M SD M SD
Total EI .92 98.3 16.6 98.8 17.4 .81 97.1 14.8 98.1 14.8Self PerceptionComposite
.90 98.6 15.8 98.7 17.2 .80 96.4 16.0 97.3 15.6
Self Regard .88 98.7 15.9 99.4 16.9 .84 98.1 15.3 98.3 15.8
Self Actualization .88 98.6 15.8 98.5 16.8 .74 94.4 15.6 95.8 14.8
Emotional Self Awareness .82 99.3 15.4 98.7 16.8 .72 98.7 15.3 99.5 15.0
Self Expression Composite .86 99.3 15.7 99.5 15.9 .80 98.9 14.7 98.7 14.4
Emotional Expression .81 98.1 15.9 98.9 16.2 .74 100.7 15.0 100.5 13.6
Assertiveness .80 99.9 14.8 100.1 14.7 .75 97.3 14.9 97.5 14.0
Independence .85 100.6 15.5 100.0 16.0 .81 99.0 14.0 98.4 15.1
Interpersonal Composite .91 98.1 16.4 98.1 16.1 .76 97.2 15.6 98.3 14.7InterpersonalRelationships
.88 98.9 16.1 98.9 15.5 .77 97.7 16.5 98.7 15.4
Empathy .89 98.4 16.3 98.4 16.2 .72 99.3 15.6 99.9 14.8
Social Responsibility .86 97.7 16.3 97.8 15.9 .77 95.2 15.1 96.6 14.5Decision MakingComposite
.88 98.7 15.7 99.7 17.1 .83 98.2 14.5 99.7 14.7
Problem Solving .82 98.9 15.9 100.4 16.5 .73 98.6 14.9 100.5 14.0
Reality Testing .84 98.7 15.9 98.6 16.3 .75 97.6 15.2 99.3 15.7
Impulse Control .78 99.2 15.2 100.1 16.4 .81 99.4 15.4 99.3 14.9Stress ManagementComposite
.90 98.0 17.2 98.8 17.2 .78 97.2 14.2 98.2 14.3
Flexibility .85 97.8 15.4 99.1 16.6 .70 99.5 14.7 99.8 14.6
Stress Tolerance .85 98.9 16.0 99.0 15.7 .75 96.7 13.7 97.4 13.5
Optimism .88 98.2 17.2 98.9 17.0 .80 97.0 15.2 98.5 15.7
Happiness .88 99.3 15.9 99.3 16.8 .84 97.6 17.6 98.3 16.9
Note. 2 to 4 week test retest N = 204, time interval mean = 18.4 days (SD = 3.2 days), range =14�–28 days. 8 week test retest N = 104, time interval mean = 56.8 days (SD = 1.3 days), range =54�–59 days.

312
Table A.14. Differences between Time 1 and Time 2 EQ i 2.0 Standard Scores: 2�–4Week Interval
The following table summarizes the differences between time 1 and time 2 scores for the EQ i 2.0Total EI score, composite scales, and subscales for the 2�–4 week test retest sample. The first setof results (% of Respondents) lists the percentage of respondents whose scores decreased bymore than 15 points, changed by 15 points or less, or increased by more than 15 points overtime. Test retest stability is supported if the majority of respondents show changes of 15 pointsor less over time. The mean and standard deviation of these differences across participants isalso provided, along with the 95% confidence interval (CI), which illustrates whether thedifference is statistically meaningful for the sample as a whole. That is, if the CI includes zerobetween the lower bound (LB) and upper bound (UB), the difference is not statisticallymeaningful.
% of Respondents 95% CI
Scale
Scores DecreasedMore Than 1 SD
(15 points)
Scores Changedby 1 SD or Less(15 points)
Scores IncreasedMore Than 1 SD
(15 points)MDiff SD LB UB
Total EI 1.5 97.0 1.5 0.5 6.9 0.1 0.9Self PerceptionComposite
1.5 96.5 2.0 0.1 7.4 0.6 0.8
Self Regard 1.5 94.5 4.0 0.7 8.0 0.1 1.5Self Actualization 4.0 93.0 3.0 0.7 8.8 1.5 0.2Emotional SelfAwareness
8.5 91.0 3.5 0.6 9.8 1.6 0.3
Self ExpressionComposite
2.0 95.0 3.0 0.2 8.4 0.6 1.0
Emotional Expression 4.0 90.0 6.0 0.9 10.0 0.1 1.9Assertiveness 4.0 91.5 4.5 0.0 8.1 0.8 0.8Independence 4.5 93.5 2.0 0.2 9.3 0.7 1.1InterpersonalComposite
2.5 95.5 2.0 0.0 7.1 0.7 0.7
InterpersonalRelationships
2.5 94.0 3.5 0.0 7.8 0.8 0.7
Empathy 3.5 93.5 3.0 0.0 7.6 0.8 0.7Social Responsibility 3.0 94.5 2.5 0.2 8.5 0.7 1.0Decision MakingComposite
2.5 92.5 5.0 1.0 8.2 0.2 1.8
Problem Solving 2.5 92.0 5.5 1.6 9.6 0.6 2.5Reality Testing 4.5 92.5 3.0 0.1 9.1 1.0 0.8Impulse Control 9.5 83.0 7.5 0.8 10.4 0.2 1.9Stress ManagementComposite
2.5 94.0 3.5 0.8 7.8 0.1 1.6
Flexibility 2.0 94.5 3.5 1.3 8.8 0.5 2.2Stress Tolerance 4.5 91.5 4.0 0.1 8.8 0.8 1.0Optimism 4.0 91.5 4.5 0.7 8.3 0.1 1.5Happiness 3.0 95.0 2.0 0.1 8.1 0.9 0.7Note. N = 204. M Diff = mean difference; CI = confidence interval; LB = lower bound, UB = upper bound.
313
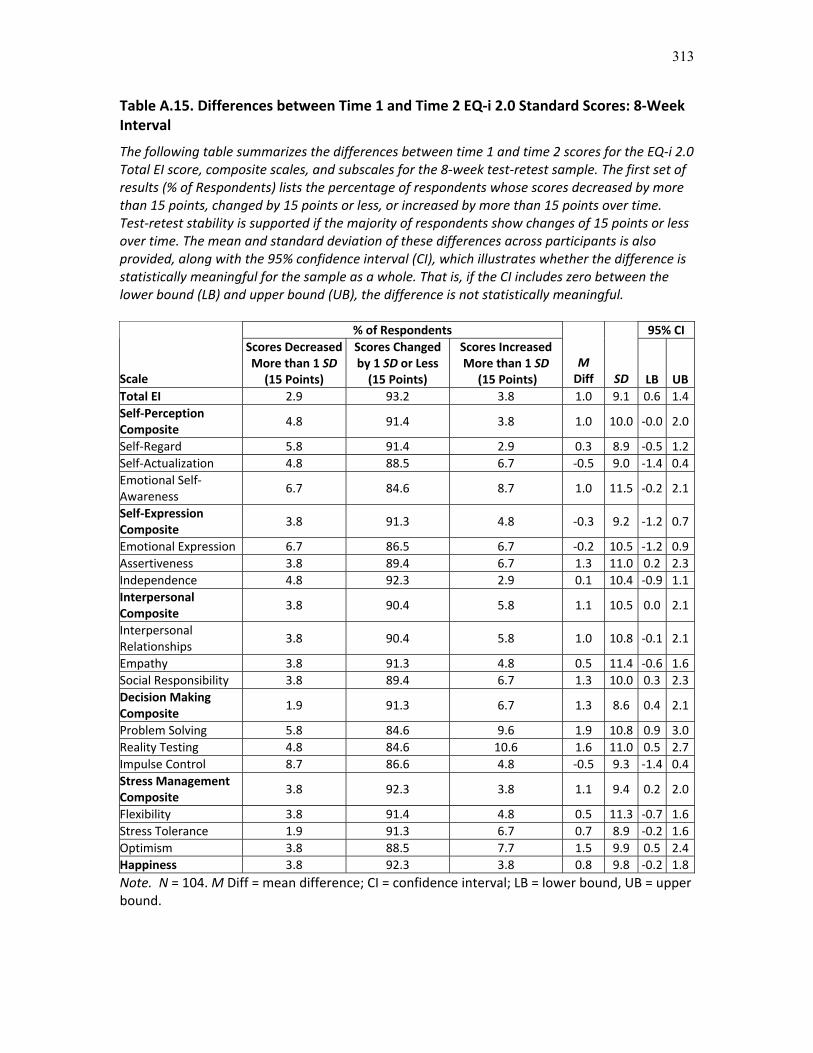
Table A.15. Differences between Time 1 and Time 2 EQ i 2.0 Standard Scores: 8 WeekInterval
The following table summarizes the differences between time 1 and time 2 scores for the EQ i 2.0Total EI score, composite scales, and subscales for the 8 week test retest sample. The first set ofresults (% of Respondents) lists the percentage of respondents whose scores decreased by morethan 15 points, changed by 15 points or less, or increased by more than 15 points over time.Test retest stability is supported if the majority of respondents show changes of 15 points or lessover time. The mean and standard deviation of these differences across participants is alsoprovided, along with the 95% confidence interval (CI), which illustrates whether the difference isstatistically meaningful for the sample as a whole. That is, if the CI includes zero between thelower bound (LB) and upper bound (UB), the difference is not statistically meaningful.
Note. N = 104.M Diff = mean difference; CI = confidence interval; LB = lower bound, UB = upperbound.
% of Respondents 95% CI
Scale
Scores DecreasedMore than 1 SD(15 Points)
Scores Changedby 1 SD or Less(15 Points)
Scores IncreasedMore than 1 SD
(15 Points)MDiff SD LB UB
Total EI 2.9 93.2 3.8 1.0 9.1 0.6 1.4Self PerceptionComposite
4.8 91.4 3.8 1.0 10.0 0.0 2.0
Self Regard 5.8 91.4 2.9 0.3 8.9 0.5 1.2Self Actualization 4.8 88.5 6.7 0.5 9.0 1.4 0.4Emotional SelfAwareness
6.7 84.6 8.7 1.0 11.5 0.2 2.1
Self ExpressionComposite
3.8 91.3 4.8 0.3 9.2 1.2 0.7
Emotional Expression 6.7 86.5 6.7 0.2 10.5 1.2 0.9Assertiveness 3.8 89.4 6.7 1.3 11.0 0.2 2.3Independence 4.8 92.3 2.9 0.1 10.4 0.9 1.1InterpersonalComposite
3.8 90.4 5.8 1.1 10.5 0.0 2.1
InterpersonalRelationships
3.8 90.4 5.8 1.0 10.8 0.1 2.1
Empathy 3.8 91.3 4.8 0.5 11.4 0.6 1.6Social Responsibility 3.8 89.4 6.7 1.3 10.0 0.3 2.3Decision MakingComposite
1.9 91.3 6.7 1.3 8.6 0.4 2.1
Problem Solving 5.8 84.6 9.6 1.9 10.8 0.9 3.0Reality Testing 4.8 84.6 10.6 1.6 11.0 0.5 2.7Impulse Control 8.7 86.6 4.8 0.5 9.3 1.4 0.4Stress ManagementComposite
3.8 92.3 3.8 1.1 9.4 0.2 2.0
Flexibility 3.8 91.4 4.8 0.5 11.3 0.7 1.6Stress Tolerance 1.9 91.3 6.7 0.7 8.9 0.2 1.6Optimism 3.8 88.5 7.7 1.5 9.9 0.5 2.4Happiness 3.8 92.3 3.8 0.8 9.8 0.2 1.8

314
Table A.16. Demographic Distributions of EQ i 2.0 Exploratory and ConfirmatoryNormative Subsamples
The following table summarizes the demographic characteristics of the subsamples of theEQ i 2.0 normative sample, created for performing exploratory factor analysis and confirmatoryfactor analysis. Ideally, the two samples should show similar demographic characteristics.
Exploratory Sample Confirmatory SampleDemographic
N % N %
Male 1,000 50.0 1,000 50.0Gender
Female 1,000 50.0 1,000 50.0
18�–29 400 20.0 400 20.0
30�–39 400 20.0 400 20.0
40�–49 400 20.0 400 20.0
50�–59 400 20.0 400 20.0
60+ 400 20.0 400 20.0
Age Group (Years)
M (SD) 44.6 (15.0) 44.7 (15.2)
Black 209 10.5 210 10.5
Hispanic/Latino 216 10.8 217 10.9
White 1,417 70.9 1,417 70.9
Race/Ethnicity
Other 158 1.0 156 1.4
High School or Less 877 43.9 874 43.7
Some College/University 558 27.9 561 28.1
Education Level
College/University or Higher 565 28.3 565 28.3
Northeast 314 15.7 341 17.1
Midwest 409 20.5 384 19.2
South 650 32.5 642 32.1U.S.
West 428 21.4 432 21.6
West 22 1.1 32 1.6
Prairies 38 1.9 34 1.7
Central 124 6.2 120 6.0
Geographic Region
Canada
East 15 0.8 15 0.8Total 2,000 100.0 2,000 100.0

315
Table A.17. Confirmatory Factor Analysis Results for EQ i 2.0
The following table provides the fit statistics generated by the confirmatory factor analyses ofthe EQ i 2.0. Values below .100 for the RMSEA and above .900 for all other fit statistics suggestthe factor structure that emerged from the exploratory factor analyses was independentlyreplicated in the confirmatory factor analysis.
CompositesFit Index
OverallModel Self Perception Self Expression Interpersonal
DecisionMaking
StressManagement
GFI .955 .963 .960 .942 .979 .943
AGFI .864 .932 .931 .900 .966 .912
NFI .966 .969 .945 .940 .970 .943
NNFI .934 .956 .929 .920 .966 .931
CFI .967 .971 .949 .943 .975 .947
RMSEA .152 .081 .078 .096 .049 .082
Note. N = 2,000. GFI = Goodness of Fit Index (Jöreskog & Sörbom, 1986), AGFI = AdjustedGoodness of Fit Index (Jöreskog & Sörbom, 1986), NFI = Normed Fit Index (Bentler & Bonett,1980), NNFI = Non Normed Fit Index (Bentler & Bonett, 1980), CFI = Comparative Fit Index(Bentler, 1990), RMSEA = Root Mean Square Error of Approximation (Steiger & Lind, 1980).
Table A.18. Correlations among EQ i 2.0 Composite Scales
The following table illustrates the correlations among the EQ i 2.0 composite scales in theEQ i 2.0 normative sample. Correlations range from 0.00 to 1.00, with higher values suggestingthe scales share a relevant common psychological characteristic (i.e., emotional intelligence),supporting the factor structure of the EQ i 2.0.
Composite Scale SPCOMP SECOMP ICOMP DMCOMP SMCOMPSPCOMP. Self Perception Composite �–SECOMP. Self Expression Composite .73 �–ICOMP. Interpersonal Composite .71 .55 �–DMCOMP. Decision Making Composite .70 .66 .50 �–SMCOMP. Stress Management Composite .78 .67 .63 .73 �–Note. N = 4,000. All correlations significant at p < .01. Guidelines for evaluating r are .10 = small,.30 = medium, .50 = large.
316
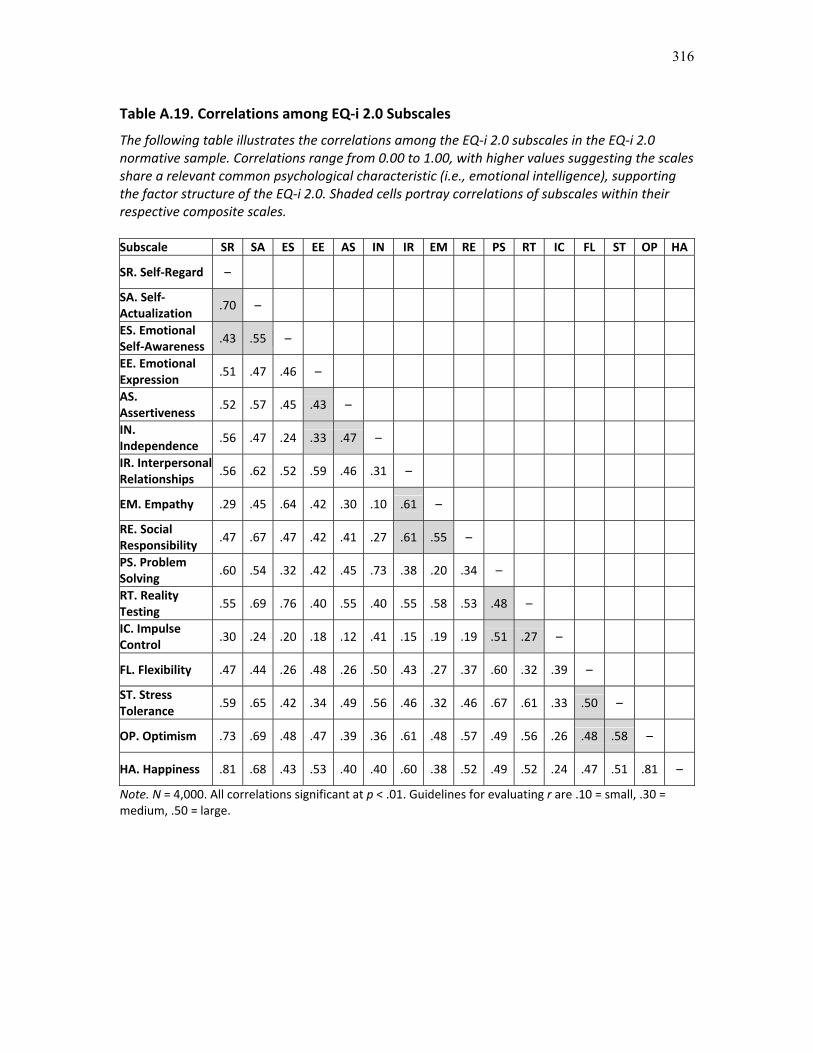
Table A.19. Correlations among EQ i 2.0 Subscales
The following table illustrates the correlations among the EQ i 2.0 subscales in the EQ i 2.0normative sample. Correlations range from 0.00 to 1.00, with higher values suggesting the scalesshare a relevant common psychological characteristic (i.e., emotional intelligence), supportingthe factor structure of the EQ i 2.0. Shaded cells portray correlations of subscales within theirrespective composite scales.
Subscale SR SA ES EE AS IN IR EM RE PS RT IC FL ST OP HA
SR. Self Regard �–
SA. SelfActualization
.70 �–
ES. EmotionalSelf Awareness
.43 .55 �–
EE. EmotionalExpression
.51 .47 .46 �–
AS.Assertiveness
.52 .57 .45 .43 �–
IN.Independence
.56 .47 .24 .33 .47 �–
IR. InterpersonalRelationships
.56 .62 .52 .59 .46 .31 �–
EM. Empathy .29 .45 .64 .42 .30 .10 .61 �–
RE. SocialResponsibility
.47 .67 .47 .42 .41 .27 .61 .55 �–
PS. ProblemSolving
.60 .54 .32 .42 .45 .73 .38 .20 .34 �–
RT. RealityTesting
.55 .69 .76 .40 .55 .40 .55 .58 .53 .48 �–
IC. ImpulseControl
.30 .24 .20 .18 .12 .41 .15 .19 .19 .51 .27 �–
FL. Flexibility .47 .44 .26 .48 .26 .50 .43 .27 .37 .60 .32 .39 �–
ST. StressTolerance
.59 .65 .42 .34 .49 .56 .46 .32 .46 .67 .61 .33 .50 �–
OP. Optimism .73 .69 .48 .47 .39 .36 .61 .48 .57 .49 .56 .26 .48 .58 �–
HA. Happiness .81 .68 .43 .53 .40 .40 .60 .38 .52 .49 .52 .24 .47 .51 .81 �–
Note. N = 4,000. All correlations significant at p < .01. Guidelines for evaluating r are .10 = small, .30 =medium, .50 = large.

317
Table A.20. Demographic Characteristics of EQ i 2.0 Validity Samples
The following table summarizes the demographic characteristics of the samples used in theEQ i 2.0 validity analyses. Ideally, these samples should include representation from a widerange of demographic groups.
EQ i 1.0 SSI NEO FFI MSCEITWatsonGlaser II
Demographic N % N % N % N % N %
Male 50 49.5 50 49.5 50 50.0 50 46.7 51 50.0Gender
Female 51 50.5 51 50.5 50 50.0 57 53.3 51 50.0
18�–29 2 2.0 3 3.0 1 1.0 6 5.6 6 5.9
30�–39 18 17.8 25 24.8 23 23.0 15 14.0 10 9.8
40�–49 29 28.7 27 26.7 36 36.0 24 22.4 20 19.6
50�–59 24 23.8 17 16.8 25 25.0 20 18.7 28 27.5
60+ 28 27.7 29 28.7 15 15.0 42 39.3 38 37.3
Age Group(Years)
M (SD) 50.6 (12.8) 49.7 (13.6) 47.5 (11.1) 52.8 (14.1) 52.8 (13.5)
Black 22 21.8 21 20.8 25 25.0 7 6.5 10 9.8
Hispanic/Latino 44 43.6 37 36.6 54 54.0 8 7.5 9 8.8
White 29 28.7 38 37.6 14 14.0 87 81.3 77 75.5
Race/Ethnicity
Other 6 5.9 5 5.0 7 7.0 5 4.7 6 5.9
High School or Less 7 6.9 15 14.9 25 25.0 27 25.2 72 70.6
Some College/University 43 42.6 42 41.6 47 47.0 30 28.0 19 18.6
EducationLevel
College/University or Higher 51 50.5 44 43.6 28 28.0 50 46.7 11 10.8
Northeast 16 15.8 14 13.9 10 10.0 22 20.6 24 23.5
Midwest 3 3.0 15 14.9 6 6.0 16 15.0 21 20.6
South 42 41.6 38 37.6 37 37.0 48 44.9 37 36.3
U.S.GeographicRegion
West 40 39.6 34 33.7 47 47.0 21 19.6 20 19.6Total 101 100.0 101 100.0 100 100.0 107 100.0 102 100.0
Note. SSI = Social Skills Inventory (Riggio & Carney, 2003); NEO FFI = NEO Five Factor Inventory(Costa & McCrae, 1992); MSCEIT = Mayer Salovey Caruso Emotional Intelligence Test (Mayer etal., 2002).

318
Table A.21. Correlations between EQ i 2.0 and EQ i.
The following table illustrates correlations between the EQ i scales and their correspondingEQ i 2.0 Total EI Score, composite scales, and subscales. Values range from 1.00 to +1.00; valuesclose to 1.00 represent an inverse relationship between scores on the two scales, values close to+1.00 represent a direct relationship, and values close to zero represent a lack of a relationship.Shaded cells indicate constructs that were relatively unchanged from the EQ i to the EQ i 2.0.Unshaded cells indicate constructs that changed substantially from the EQ i to the EQ i 2.0. Highpositive correlations support the validity of the EQ i 2.0.
Scale r
Total EI .90Self Regard .88Self Actualization .71
Self PerceptionComposite
Emotional Self Awareness* .50Emotional Expression* .84Assertiveness .65
Self ExpressionComposite
Independence .81Interpersonal Relationships .86Empathy .78
InterpersonalComposite
Social Responsibility .49Problem Solving .57Reality Testing .49
Decision MakingComposite
Impulse Control .54Flexibility .67Stress Tolerance .79
StressManagementComposite Optimism .69
Happiness .84Note. N = 101. All correlations are significant at p < .01. Guidelines for evaluating r are .10 =small, .30 = medium, .50 = large.*represents correlations with Emotional Self Awareness on the original EQ i.

319
Table A.22. Correlations between the EQ i 2.0 and the Social Skills Inventory
The following table illustrates correlations between the EQ i 2.0 Total EI score, composite scales,and subscales, and the Social Skills Inventory (SSI). Values range from 1.00 to +1.00; values closeto 1.00 represent an inverse relationship between scores on the two scales, values close to +1.00represent a direct relationship, and values close to zero represent a lack of a relationship. Formost SSI scales (see chapter 13), positive correlations support the validity of the EQ i 2.0.
SSI Scale
EQ i 2.0 ScaleTotalScore
TotalEmotional
TotalSocial
TotalControl
TotalExpressivity
TotalSensitivity
Total EI .54 .54 .47 .63 .47 .08Self PerceptionComposite
.53 .51 .47 .54 .48 .12
Self Regard .42 .44 .35 .52 .43 .06
Self Actualization .51 .46 .49 .45 .47 .19
Emotional Self Awareness .37 .36 .33 .35 .26 .21Self ExpressionComposite
.47 .47 .41 .53 .46 .03
Emotional Expression .45 .41 .43 .34 .39 .26
Assertiveness .24 .24 .21 .35 .24 .08
Independence .36 .41 .28 .52 .39 .13InterpersonalComposite
.64 .55 .63 .50 .57 .32
Interpersonal Relationships .66 .57 .63 .54 .62 .25
Empathy .52 .46 .50 .39 .38 .39
Social Responsibility .46 .35 .48 .35 .46 .17Decision MakingComposite
.22 .29 .14 .49 .13 .11
Problem Solving .29 .39 .17 .55 .23 .14
Reality Testing .39 .40 .34 .46 .28 .13
Impulse Control .13 .08 .15 .15 .19 .22
Stress ManagementComposite
.41 .46 .32 .59 .35 .03
Flexibility .37 .40 .29 .50 .33 .02
Stress Tolerance .26 .33 .18 .54 .14 .08
Optimism .37 .39 .30 .38 .38 .02
Happiness .37 .39 .31 .41 .41 .02
Note. N = 101. SSI = Social Skills Inventory (Riggio & Carney, 2003). Correlations of .19 andabove are significant at p < .05, correlations of .25 and above are significant at p < .01.Guidelines for evaluating r are .10 = small, .30 = medium, .50 = large.
...table continues on next page

320
Table A.22. Correlations between the EQ i 2.0 and the Social Skills Inventory(continued)
SSI Scale
EQ i 2.0 ScaleEmotionalExpressivity
EmotionalSensitivity
EmotionalControl
SocialExpressivity
SocialSensitivity
SocialControl
Total EI .28 .46 .28 .53 .35 .65Self PerceptionComposite
.33 .43 .19 .50 .26 .60
Self Regard .27 .29 .28 .47 .39 .51
Self Actualization .34 .44 .06 .48 .16 .57Emotional SelfAwareness
.19 .36 .12 .27 .03 .40
Self ExpressionComposite
.35 .41 .12 .45 .38 .63
Emotional Expression .33 .41 .00 .37 .01 .46
Assertiveness .14 .25 .06 .27 .38 .44
Independence .30 .27 .21 .39 .50 .55InterpersonalComposite
.34 .53 .15 .63 .03 .58
InterpersonalRelationships
.36 .52 .19 .69 .14 .60
Empathy .22 .49 .14 .42 .11 .43
Social Responsibility .28 .33 .03 .50 .07 .46Decision MakingComposite
.01 .23 .35 .20 .43 .41
Problem Solving .12 .27 .36 .26 .52 .49
Reality Testing .16 .37 .21 .32 .18 .47
Impulse Control .28 .09 .22 .10 .26 .03Stress ManagementComposite
.16 .35 .37 .42 .42 .52
Flexibility .16 .30 .31 .39 .35 .45
Stress Tolerance .01 .22 .41 .20 .37 .44
Optimism .22 .32 .20 .42 .30 .38
Happiness .27 .24 .23 .43 .28 .38
Note. N = 101. SSI = Social Skills Inventory (Riggio & Carney, 2003). Correlations of .19 andabove are significant at p < .05, correlations of .25 and above are significant at p < .01.Guidelines for evaluating r are .10 = small, .30 = medium, .50 = large.

321
Table A.23. Correlations between EQ i 2.0 and NEO Five Factor Inventory
The following table illustrates correlations between the EQ i 2.0 Total EI score, composite scales,and subscales, and the NEO Five Factor Inventory (NEO FFI). Values range from 1.00 to +1.00;values close to 1.00 represent an inverse relationship between scores on the two scales, valuesclose to +1.00 represent a direct relationship, and values close to zero represent a lack of arelationship. For most NEO FFI scales (see chapter 13), positive correlations support the validityof the EQ i 2.0.
NEO FFI Scale
EQ i 2.0 ScaleNeuroticism Extraversion
Openness toExperience
Agreeableness Conscientiousness
Total EI .71 .57 .10 .36 .61Self PerceptionComposite
.65 .61 .17 .27 .63
Self Regard .68 .57 .04 .21 .46Self Actualization .53 .54 .18 .18 .63Emotional SelfAwareness
.39 .38 .22 .32 .50
Self ExpressionComposite
.57 .45 .14 .15 .46
Emotional Expression .39 .45 .19 .29 .32Assertiveness .43 .33 .02 .09 .44Independence .55 .26 .09 .09 .35InterpersonalComposite
.49 .54 .04 .51 .51
InterpersonalRelationships
.51 .54 .12 .50 .45
Empathy .29 .38 .08 .47 .42Social Responsibility .49 .46 .16 .30 .43Decision MakingComposite
.64 .29 .03 .29 .53
Problem Solving .50 .21 .02 .14 .36Reality Testing .58 .48 .11 .27 .59Impulse Control .35 .03 .20 .25 .25Stress ManagementComposite
.71 .53 .10 .30 .48
Flexibility .56 .38 .09 .23 .41Stress Tolerance .58 .38 .07 .17 .41Optimism .61 .56 .10 .34 .38Happiness .64 .49 .05 .13 .44Note. N = 100. NEO FFI = NEO Five Factor Inventory (Costa & McCrae, 1992). Correlations of .19and above are significant at p < .05, correlations of .25 and above are significant at p < .01.Guidelines for evaluating r are .10 = small, .30 = medium, .50 = large.
322
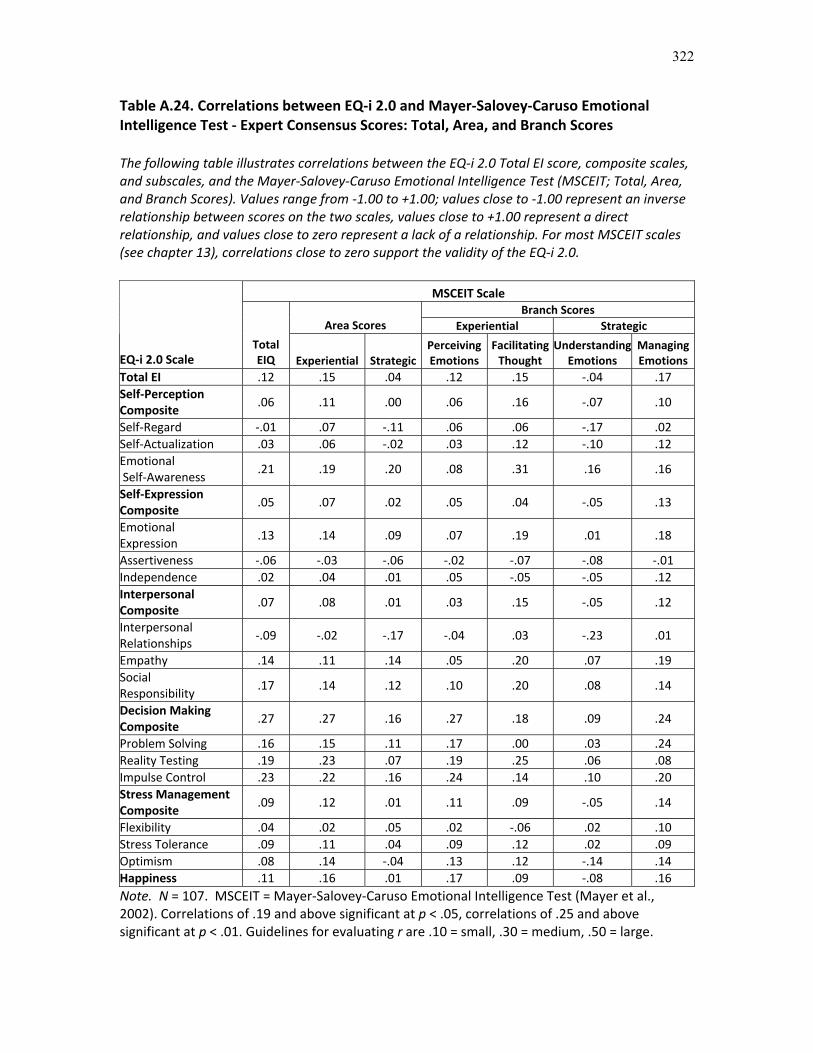
Table A.24. Correlations between EQ i 2.0 and Mayer Salovey Caruso EmotionalIntelligence Test Expert Consensus Scores: Total, Area, and Branch Scores
The following table illustrates correlations between the EQ i 2.0 Total EI score, composite scales,and subscales, and the Mayer Salovey Caruso Emotional Intelligence Test (MSCEIT; Total, Area,and Branch Scores). Values range from 1.00 to +1.00; values close to 1.00 represent an inverserelationship between scores on the two scales, values close to +1.00 represent a directrelationship, and values close to zero represent a lack of a relationship. For most MSCEIT scales(see chapter 13), correlations close to zero support the validity of the EQ i 2.0.
MSCEIT ScaleBranch Scores
Area Scores Experiential Strategic
EQ i 2.0 ScaleTotalEIQ Experiential Strategic
PerceivingEmotions
FacilitatingThought
UnderstandingEmotions
ManagingEmotions
Total EI .12 .15 .04 .12 .15 .04 .17Self PerceptionComposite
.06 .11 .00 .06 .16 .07 .10
Self Regard .01 .07 .11 .06 .06 .17 .02Self Actualization .03 .06 .02 .03 .12 .10 .12EmotionalSelf Awareness
.21 .19 .20 .08 .31 .16 .16
Self ExpressionComposite
.05 .07 .02 .05 .04 .05 .13
EmotionalExpression
.13 .14 .09 .07 .19 .01 .18
Assertiveness .06 .03 .06 .02 .07 .08 .01Independence .02 .04 .01 .05 .05 .05 .12InterpersonalComposite
.07 .08 .01 .03 .15 .05 .12
InterpersonalRelationships
.09 .02 .17 .04 .03 .23 .01
Empathy .14 .11 .14 .05 .20 .07 .19SocialResponsibility
.17 .14 .12 .10 .20 .08 .14
Decision MakingComposite
.27 .27 .16 .27 .18 .09 .24
Problem Solving .16 .15 .11 .17 .00 .03 .24Reality Testing .19 .23 .07 .19 .25 .06 .08Impulse Control .23 .22 .16 .24 .14 .10 .20Stress ManagementComposite
.09 .12 .01 .11 .09 .05 .14
Flexibility .04 .02 .05 .02 .06 .02 .10Stress Tolerance .09 .11 .04 .09 .12 .02 .09Optimism .08 .14 .04 .13 .12 .14 .14Happiness .11 .16 .01 .17 .09 .08 .16Note. N = 107. MSCEIT = Mayer Salovey Caruso Emotional Intelligence Test (Mayer et al.,2002). Correlations of .19 and above significant at p < .05, correlations of .25 and abovesignificant at p < .01. Guidelines for evaluating r are .10 = small, .30 = medium, .50 = large.
323
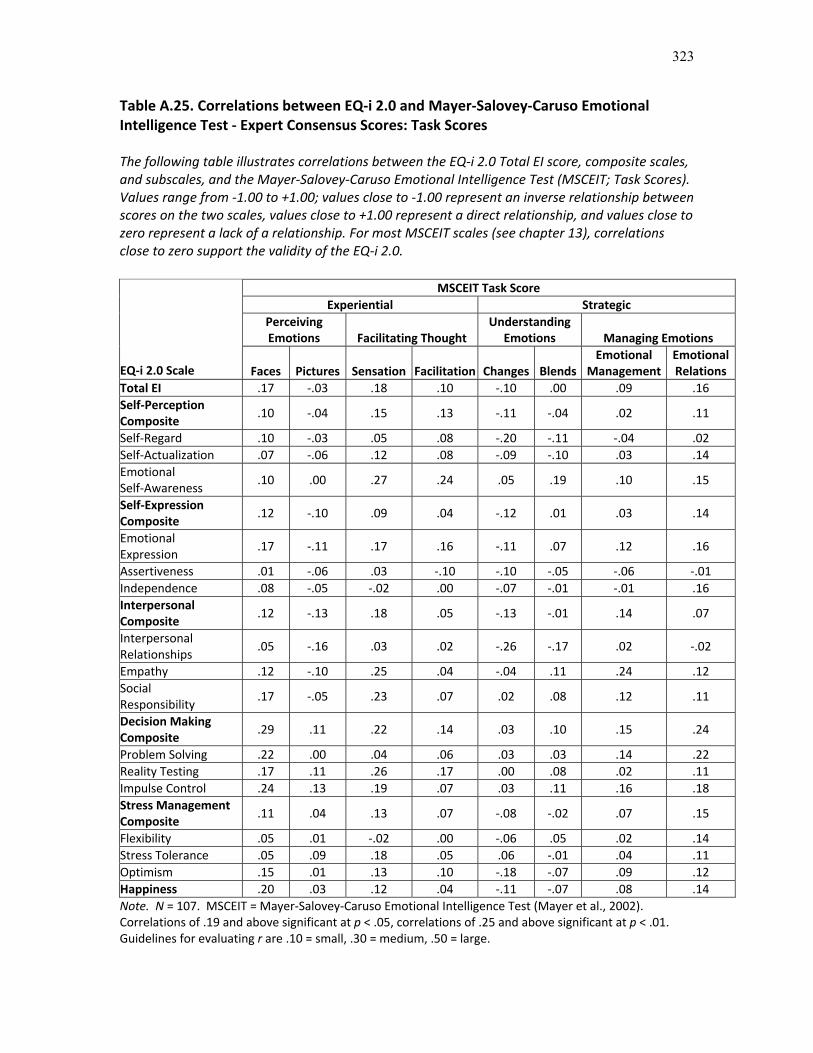
Table A.25. Correlations between EQ i 2.0 and Mayer Salovey Caruso EmotionalIntelligence Test Expert Consensus Scores: Task Scores
The following table illustrates correlations between the EQ i 2.0 Total EI score, composite scales,and subscales, and the Mayer Salovey Caruso Emotional Intelligence Test (MSCEIT; Task Scores).Values range from 1.00 to +1.00; values close to 1.00 represent an inverse relationship betweenscores on the two scales, values close to +1.00 represent a direct relationship, and values close tozero represent a lack of a relationship. For most MSCEIT scales (see chapter 13), correlationsclose to zero support the validity of the EQ i 2.0.
MSCEIT Task ScoreExperiential Strategic
PerceivingEmotions Facilitating Thought
UnderstandingEmotions Managing Emotions
EQ i 2.0 Scale Faces Pictures Sensation Facilitation Changes BlendsEmotional
ManagementEmotionalRelations
Total EI .17 .03 .18 .10 .10 .00 .09 .16Self PerceptionComposite
.10 .04 .15 .13 .11 .04 .02 .11
Self Regard .10 .03 .05 .08 .20 .11 .04 .02Self Actualization .07 .06 .12 .08 .09 .10 .03 .14EmotionalSelf Awareness
.10 .00 .27 .24 .05 .19 .10 .15
Self ExpressionComposite
.12 .10 .09 .04 .12 .01 .03 .14
EmotionalExpression
.17 .11 .17 .16 .11 .07 .12 .16
Assertiveness .01 .06 .03 .10 .10 .05 .06 .01Independence .08 .05 .02 .00 .07 .01 .01 .16InterpersonalComposite
.12 .13 .18 .05 .13 .01 .14 .07
InterpersonalRelationships
.05 .16 .03 .02 .26 .17 .02 .02
Empathy .12 .10 .25 .04 .04 .11 .24 .12SocialResponsibility
.17 .05 .23 .07 .02 .08 .12 .11
Decision MakingComposite
.29 .11 .22 .14 .03 .10 .15 .24
Problem Solving .22 .00 .04 .06 .03 .03 .14 .22Reality Testing .17 .11 .26 .17 .00 .08 .02 .11Impulse Control .24 .13 .19 .07 .03 .11 .16 .18Stress ManagementComposite
.11 .04 .13 .07 .08 .02 .07 .15
Flexibility .05 .01 .02 .00 .06 .05 .02 .14Stress Tolerance .05 .09 .18 .05 .06 .01 .04 .11Optimism .15 .01 .13 .10 .18 .07 .09 .12Happiness .20 .03 .12 .04 .11 .07 .08 .14Note. N = 107. MSCEIT = Mayer Salovey Caruso Emotional Intelligence Test (Mayer et al., 2002).Correlations of .19 and above significant at p < .05, correlations of .25 and above significant at p < .01.Guidelines for evaluating r are .10 = small, .30 = medium, .50 = large.
324
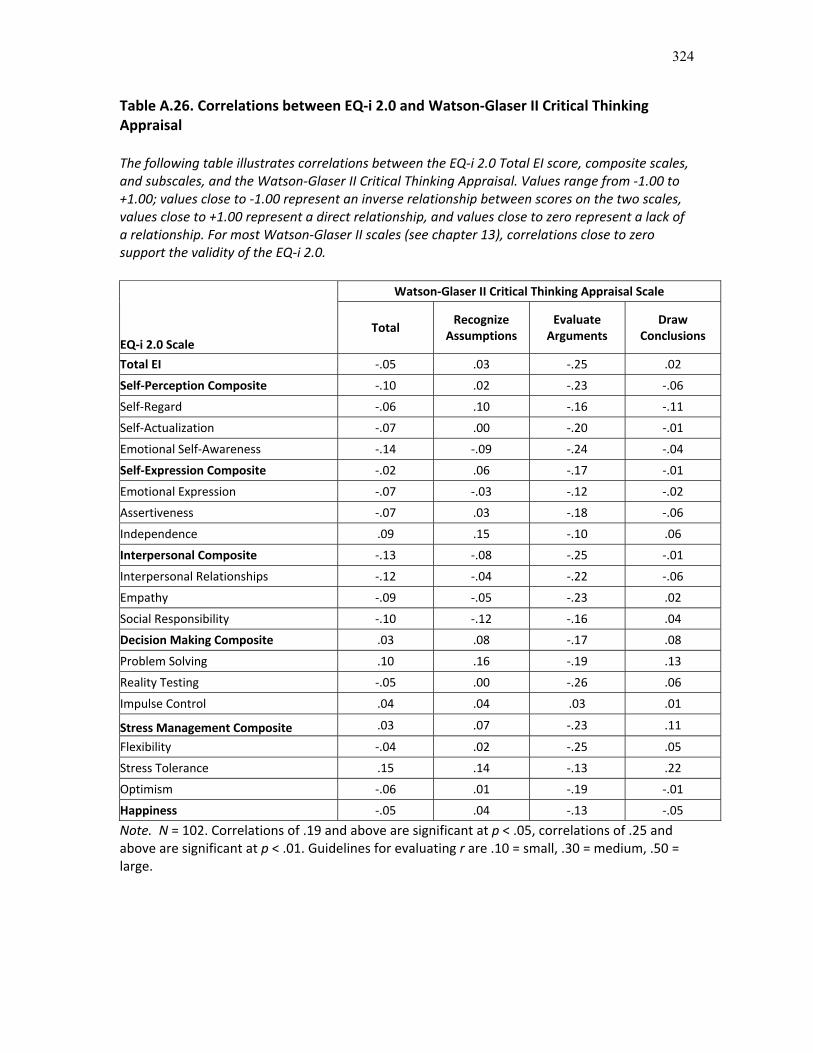
Table A.26. Correlations between EQ i 2.0 and Watson Glaser II Critical ThinkingAppraisal
The following table illustrates correlations between the EQ i 2.0 Total EI score, composite scales,and subscales, and the Watson Glaser II Critical Thinking Appraisal. Values range from 1.00 to+1.00; values close to 1.00 represent an inverse relationship between scores on the two scales,values close to +1.00 represent a direct relationship, and values close to zero represent a lack ofa relationship. For most Watson Glaser II scales (see chapter 13), correlations close to zerosupport the validity of the EQ i 2.0.
Watson Glaser II Critical Thinking Appraisal Scale
EQ i 2.0 ScaleTotal
RecognizeAssumptions
EvaluateArguments
DrawConclusions
Total EI .05 .03 .25 .02
Self Perception Composite .10 .02 .23 .06
Self Regard .06 .10 .16 .11
Self Actualization .07 .00 .20 .01
Emotional Self Awareness .14 .09 .24 .04
Self Expression Composite .02 .06 .17 .01
Emotional Expression .07 .03 .12 .02
Assertiveness .07 .03 .18 .06
Independence .09 .15 .10 .06
Interpersonal Composite .13 .08 .25 .01
Interpersonal Relationships .12 .04 .22 .06
Empathy .09 .05 .23 .02
Social Responsibility .10 .12 .16 .04
Decision Making Composite .03 .08 .17 .08
Problem Solving .10 .16 .19 .13
Reality Testing .05 .00 .26 .06
Impulse Control .04 .04 .03 .01
Stress Management Composite .03 .07 .23 .11
Flexibility .04 .02 .25 .05
Stress Tolerance .15 .14 .13 .22
Optimism .06 .01 .19 .01
Happiness .05 .04 .13 .05
Note. N = 102. Correlations of .19 and above are significant at p < .05, correlations of .25 andabove are significant at p < .01. Guidelines for evaluating r are .10 = small, .30 = medium, .50 =large.

325
Table A.27. Demographic Characteristics of Corporate Leaders Sample
The following table summarizes the demographic characteristics of the corporate leaderssample. Ideally, this sample should include leaders representing a wide range of demographicgroups.
Demographic N %
Male 143 64.7Gender
Female 78 35.3
18�–29 16 7.2
30�–39 48 21.7
40�–49 61 27.6
50�–59 66 29.9
60+ 30 13.6
Age Group (Years)
M (SD) 46.8 (11.4)
Black 11 5.0
Hispanic/Latino 8 3.6
White 175 79.2
Other 26 11.8
Race/Ethnicity
Missing 1 0.5
High School or Less 4 1.8
Some College/University 27 12.2
College/University or Higher 189 85.5
Education Level
Missing 1 0.5
CEO 64 29.0Other C level (CFO, COO, etc.) 18 8.1Senior Executive 33 14.9
Director 44 19.9
Manager 44 19.9
Other 16 7.2
Occupational Position
Missing 2 0.9
Total 221 100.0
326
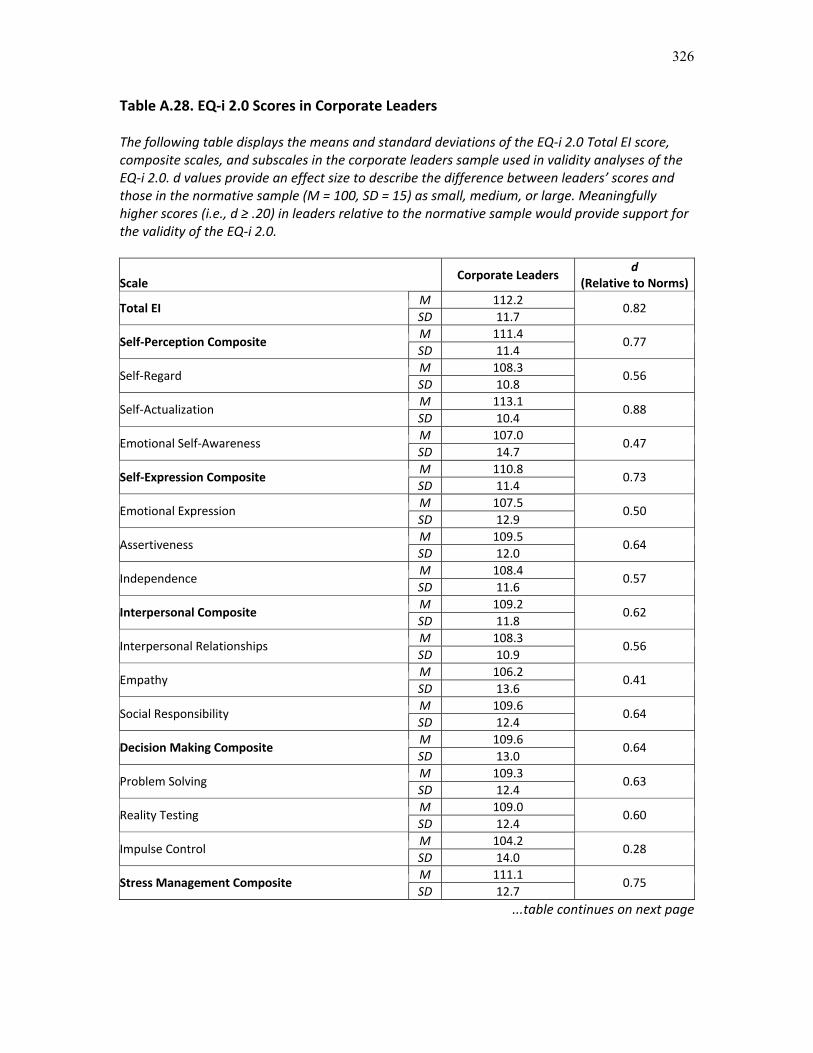
Table A.28. EQ i 2.0 Scores in Corporate Leaders
The following table displays the means and standard deviations of the EQ i 2.0 Total EI score,composite scales, and subscales in the corporate leaders sample used in validity analyses of theEQ i 2.0. d values provide an effect size to describe the difference between leaders�’ scores andthose in the normative sample (M = 100, SD = 15) as small, medium, or large. Meaningfullyhigher scores (i.e., d .20) in leaders relative to the normative sample would provide support forthe validity of the EQ i 2.0.
ScaleCorporate Leaders
d(Relative to Norms)
M 112.2Total EI
SD 11.70.82
M 111.4Self Perception Composite
SD 11.40.77
M 108.3Self Regard
SD 10.80.56
M 113.1Self Actualization
SD 10.40.88
M 107.0Emotional Self Awareness
SD 14.70.47
M 110.8Self Expression Composite
SD 11.40.73
M 107.5Emotional Expression
SD 12.90.50
M 109.5Assertiveness
SD 12.00.64
M 108.4Independence
SD 11.60.57
M 109.2Interpersonal Composite
SD 11.80.62
M 108.3Interpersonal Relationships
SD 10.90.56
M 106.2Empathy
SD 13.60.41
M 109.6Social Responsibility
SD 12.40.64
M 109.6Decision Making Composite
SD 13.00.64
M 109.3Problem Solving
SD 12.40.63
M 109.0Reality Testing
SD 12.40.60
M 104.2Impulse Control
SD 14.00.28
M 111.1Stress Management Composite
SD 12.70.75
...table continues on next page

327
Table A.28. EQ i 2.0 Scores in Corporate Leaders (continued)
ScaleCorporate Leaders
d(Relative to Norms)
M 107.4Flexibility
SD 13.40.49
M 110.5Stress Tolerance
SD 13.20.70
M 109.5Optimism
SD 11.50.64
M 106.9Happiness
SD 11.10.46
Note. Positive Cohen's d values represent higher mean scores in corporate leaders. Guidelinesfor evaluating |d| are .20 = small, .50 = medium, .80 = large.
Table A.29. Education Level Effects on EQ i 2.0 Scores in the Normative Sample
The following table displays the means and standard deviations of EQ i 2.0 Total EI scores,composite scales, and subscales in normative participants with a high school education or lessand those with a post secondary college/university degree. d values provide an effect size fordescribing differences between the two groups as small, medium, or large. Meaningfully higherscores (i.e., d .20) in post secondary graduates relative to individuals with a high schooleducation or less would provide support for the validity of the EQ i 2.0.
ScaleHigh School or
LessPost secondary
Graduated
M 98.1 103.2Total EI
SD 15.5 14.80.33
M 98.0 103.8Self Perception Composite
SD 15.5 14.80.38
M 98.4 102.4Self Regard
SD 15.4 14.70.26
M 97.5 105.7Self Actualization
SD 15.5 14.80.54
M 99.5 101.2Emotional Self Awareness
SD 15.7 15.00.11
M 99.0 100.4Self Expression Composite
SD 15.7 15.00.09
M 99.1 99.6Emotional Expression
SD 15.6 14.90.03
M 99.5 100.3Assertiveness
SD 15.7 15.00.06
M 99.3 101.2Independence
SD 15.4 14.70.12
...table continues on next page

328
Table A.29. Education Level Effects on EQ i 2.0 Scores in the Normative Sample(continued)
ScaleHigh School or
LessPost secondary
Graduated
M 98.7 102.2Interpersonal Composite
SD 15.5 14.80.23
M 99.8 99.1Interpersonal Relationships
SD 15.7 15.00.05
M 99.1 101.9Empathy
SD 15.4 14.70.19
M 97.4 105.3Social Responsibility
SD 15.5 14.80.52
M 98.3 104.2Decision Making Composite
SD 15.6 14.90.38
M 98.7 102.1Problem Solving
SD 15.4 14.70.22
M 98.4 103.7Reality Testing
SD 15.7 15.00.34
M 99.0 104.2Impulse Control
SD 15.8 15.10.33
M 97.9 103.0Stress Management Composite
SD 15.6 14.90.33
M 99.2 100.6Flexibility
SD 15.7 15.00.10
M 97.5 104.1Stress Tolerance
SD 15.4 14.70.43
M 98.4 102.6Optimism
SD 15.6 14.90.27
M 98.9 101.7Happiness
SD 15.7 15.00.18
Note. Sample sizes vary due to missing data: High school or less, N = 1,748�–1,751; Postsecondary Graduate, N = 402. Positive d values represent higher scores in post secondarygraduates, negative d values represent higher scores in high school or less group.

329
Table A.30. Demographic Characteristics of EQ i 2.0 Clinical and Matched GeneralPopulation SamplesThe following table summarizes the demographic characteristics of the depressed/dysthymic,other clinical, and matched general population groups used in validity analyses of the EQ i 2.0.Ideally, these groups should include representation from a wide range of demographic groups,and the general population group should be demographically similar to the depressed/dysthymicand other clinical groups.
Depressed/Dysthymic
Other ClinicalMatched General
PopulationDemographicN % N % N %
Male 33 42.9 27 54.0 49 49.0GenderFemale 44 57.1 23 46.0 51 51.018�–29 12 15.6 9 18.0 17 17.030�–39 14 18.2 10 20.0 18 18.040�–49 14 18.2 9 18.0 19 19.050�–59 21 27.3 7 14.0 20 20.060+ 16 20.8 15 30.0 26 26.0
Age Group(Years)
M (SD) 46.2 (15.1) 46.2 (14.7) 46.3 (14.8)Black 0 0.0 0 0.0 0 0.0Hispanic/Latino 1 1.3 3 6.0 4 4.0White 72 93.5 43 86.0 89 89.0
Race/Ethnicity
Other 4 5.2 4 8.0 7 7.0High School or Less 5 6.5 6 12.0 30 30.0Some College/University 24 31.2 19 38.0 28 28.0
EducationLevel
College/University or Higher 48 62.3 25 50.0 42 42.0Northeast 19 24.7 11 22.0 21 21.0Midwest 12 15.6 13 26.0 25 25.0South 26 33.8 13 26.0 31 31.0
U.S.GeographicRegion
West 20 26.0 13 26.0 23 23.0Total 77 100.0 50 100.0 100 100.0
Table A.31. EQ i 2.0 Clinical DifferencesThe following table provides means and standard deviations of EQ i 2.0 Total EI scores,composite scales, and subscales in the depressed/dysthymic, other clinical, and matched generalpopulation samples. F and p values provide statistical significance tests for the overall differenceamong the groups. d values provide an effect size for evaluating differences as small, medium, orlarge. Validity of the EQ i 2.0 would be supported by meaningfully higher scores (i.e., d .20) inthe general population group relative to the depressed/dysthymic and other clinical groups.
d
Scale
DD. Depressed/Dysthymic
OC. OtherClinical
GP. GeneralPopulation
F(2, 221)
p GP vsDD
GP vsOC
M 88.9 90.9 98.3Total EI
SD 16.5 16.5 16.57.89 < .001 0.57 0.45
M 87.0 92.6 98.1Self PerceptionComposite SD 16.9 16.9 16.8
9.35 < .001 0.66 0.32
M 84.6 89.6 99.4Self Regard
SD 16.0 16.0 16.019.51 < .001 0.93 0.61
�…table continues on next page

330
Table A.31. EQ i 2.0 Clinical Differences (continued)
d
Scale
DD. Depressed/Dysthymic
OC.OtherClinical
GP. MatchedGeneral
Population
F(2, 221)
p GP vsDD
GP vsOC
M 89.7 95.5 97.9Self Actualization
SD 17.2 17.2 17.14.96 .008 0.47 0.14
M 94.6 97.6 97.5Emotional SelfAwareness SD 17.1 17.1 17.0
0.73 .481 0.17 0.01
M 94.2 92.6 99.7Self ExpressionComposite SD 15.5 15.5 15.4
4.58 .011 0.36 0.46
M 97.5 96.0 99.3EmotionalExpression SD 15.5 15.5 15.4
0.82 .441 0.12 0.21
M 96.7 93.7 99.7Assertiveness
SD 16.6 16.6 16.62.24 .109 0.18 0.36
M 92.3 92.8 100.4Independence
SD 15.1 15.1 15.07.83 .001 0.54 0.51
M 93.6 97.0 97.5InterpersonalComposite SD 16.6 16.6 16.5
1.28 .281 0.23 0.03
M 89.8 92.4 97.9InterpersonalRelationships SD 16.4 16.4 16.3
5.66 .004 0.50 0.34
M 96.1 99.4 97.5Empathy
SD 17.4 17.4 17.40.54 .586 0.08 0.11
M 98.7 101.3 98.2Social Responsibility
SD 15.6 15.5 15.50.70 .497 0.03 0.20
M 89.5 88.4 99.2Decision MakingComposite SD 16.7 16.7 16.7
10.31 < .001 0.58 0.64
M 90.1 89.7 99.9Problem Solving
SD 15.8 15.7 15.711.19 < .001 0.62 0.65
M 92.4 97.0 97.8Reality Testing
SD 16.2 16.2 16.12.59 .077 0.33 0.05
M 92.9 86.7 100.2Impulse Control
SD 16.9 16.9 16.811.44 < .001 0.43 0.80
M 88.6 89.9 98.6Stress ManagementComposite SD 17.0 17.0 16.9
8.94 < .001 0.59 0.52
M 94.3 90.1 99.6Flexibility
SD 16.1 16.1 16.06.22 .002 0.33 0.59
M 90.5 90.7 98.8Stress Tolerance
SD 16.9 16.9 16.86.59 .002 0.49 0.48
M 87.5 94.0 98.4Optimism
SD 17.5 17.5 17.58.44 < .001 0.62 0.25
M 85.0 91.1 98.8Happiness
SD 17.5 17.4 17.413.75 < .001 0.79 0.44
Note. Depressed/Dysthymic N = 77, Other Clinical N = 50, General Population N = 100. PositiveCohen's d values represent higher mean scores in general population group. Guidelines forevaluating |d| are .20 = small, .50 = medium, .80 = large.

331
Table A.32. EQ i 2.0 Scores by Racial/Ethnic Group in the Normative Sample
The following table displays means and standard deviations of the EQ i 2.0 Total EI score,composite scales, and subscales in the Black, Hispanic/Latino, and White participants from theEQ i 2.0 normative sample. F values provide statistical significance tests for the overalldifferences among racial/ethnic groups. Partial 2 values provide an effect size for describing theoverall effect of race/ethnicity as small, medium, or large.
ScaleBlack
Hispanic/Latino
WhiteF
(2, 3680)Partial 2
M 105.7 104.3 98.8Total EI
SD 14.7 14.9 14.757.68 .03
M 106.0 104.6 98.5Self Perception Composite
SD 14.7 15.0 14.868.81 .04
M 105.8 104.5 98.5Self Regard
SD 14.6 14.9 14.765.81 .03
M 104.8 104.2 98.7Self Actualization
SD 14.7 14.9 14.749.28 .03
M 104.4 102.8 99.1Emotional Self Awareness
SD 14.8 15.1 14.930.48 .02
M 105.9 104.0 98.9Self Expression Composite
SD 14.8 15.0 14.855.51 .03
M 102.8 103.0 99.3Emotional Expression
SD 14.8 15.1 14.918.30 .01
M 104.7 103.3 99.0Assertiveness
SD 14.8 15.1 14.936.59 .02
M 106.5 103.1 99.0Independence
SD 14.5 14.7 14.557.08 .03
M 103.3 103.7 99.2Interpersonal Composite
SD 14.7 14.9 14.727.17 .01
M 103.8 104.0 99.2Interpersonal Relationships
SD 14.8 15.0 14.832.03 .02
M 101.4 102.2 99.6Empathy
SD 14.5 14.8 14.67.53 .00
M 103.3 103.2 99.0Social Responsibility
SD 14.7 14.9 14.726.25 .01
...table continues on next page

332
Table A.32. EQ i 2.0 Scores by Racial/Ethnic Group in the Normative Sample(continued)
ScaleBlack
Hispanic/Latino
WhiteF
(2, 3680)Partial 2
M 105.2 102.2 99.3Decision Making Composite
SD 14.6 14.9 14.732.32 .02
M 104.4 101.9 99.5Problem Solving
SD 14.5 14.7 14.523.44 .01
M 104.0 102.5 99.3Reality Testing
SD 14.8 15.1 14.924.29 .01
M 103.7 100.8 99.7Impulse Control
SD 14.9 15.2 15.013.42 .01
M 104.1 103.9 99.0Stress Management Composite
SD 14.8 15.0 14.836.11 .02
M 103.8 103.4 99.1Flexibility
SD 15.0 15.2 15.028.07 .02
M 102.9 102.6 99.4Stress Tolerance
SD 14.6 14.8 14.617.36 .01
M 103.5 103.7 99.1Optimism
SD 14.8 15.1 14.929.30 .02
M 101.6 104.4 99.2Happiness
SD 14.9 15.2 15.023.92 .01
Note. Samples sizes vary due to missing data: Black, N = 419, Hispanic/Latino, N = 433, White, N= 2,831�–2,834. All F test values significant at p < .001. Guidelines for evaluating partial 2 are .01= small; .06 = medium; .14 = large.
333
Table A.33. Comparison of Simulation and Control Samples on EQ i 2.0 PositiveImpression and Negative Impression Scale Scores
The following table provides the means and standard deviations for the control and simulation(i.e., fake good/fake bad) groups for the EQ i 2.0 Positive Impression (PI) and NegativeImpression (NI) scales. F and p values provide statistical significance tests for the differencebetween groups. d values provide an effect size for evaluating differences as small, medium, orlarge. The validity of the PI and NI scales would be supported by meaningfully higher scores (i.e.,d .20) in the simulation group relative to the control group.
Control Group SimulationResponse Style Scale
M SD M SDF (1, 194) p d
Positive Impression 0.2 0.9 0.6 0.9 9.36 .003 0.61Negative Impression 0.2 1.3 1.2 1.3 31.69 < .001 1.12Note. N = 100 for each group. Positive Cohen's d values represent higher means in simulationsamples. Guidelines for evaluating d are .20 = small, .50 = medium, .80 = large.
Table A.34. Frequencies and Descriptive Statistics of Inconsistency Index Scores in EQ i2.0 Normative and Random Samples
The following table displays the proportion of participants in the EQ i 2.0 normative sample andthe sample of computer generated random EQ i 2.0 responses at each score on the EQ i 2.0Inconsistency Index (IncX). The mean and standard deviation of the IncX for each sample is alsoprovided. d provides an effect size for evaluating the difference between the IncX scores of thetwo groups as small, medium, or large. The validity of the IncX scale would be supported bymeaningfully higher scores (i.e., d .20) in the random sample relative to the normative sample.The validity of the choice of IncX scale cutoff (i.e., 3) for identifying participants as potentiallyinvalid would also be supported if it classifies a high proportion of random respondents aspotentially invalid.
Normative Sample Random SampleInconsistency IndexScore N % N %10 0 0.0 1 0.09 or higher 0 0.0 28 0.78 or higher 1 0.0 152 3.87 or higher 3 0.1 543 13.66 or higher 5 0.1 1,293 32.35 or higher 23 0.6 2,287 57.24 or higher 60 1.5 3,172 79.33 or higher 140 3.5 3,733 93.32 or higher 455 11.4 3,939 98.51 or higher 1,449 36.2 3,994 99.90 or higher 4,000 100.0 4,000 100.0M (SD) 0.5 (0.9) 4.8 (1.6)Cohen�’s d 3.36Note. An IncX score of 3 is used to indicate a potentially inconsistent response style. PositiveCohen's d values represent higher means in the random sample. Guidelines for evaluating d are.20 = small, .50 = medium, .80 = large.

334
Table A.35. Demographic Description of EQ 360 Pilot Data (Ratees)
The following table summarizes the demographic characteristics of the person being rated (i.e.,ratees) in the EQ 360 pilot data sample. Ideally, this sample should include representation from awide range of demographic groups.
Demographic N %Male 299 39.4Female 449 59.2
Ratee Gender
Missing 11 1.418�–29 167 22.030�–39 245 32.340�–49 145 19.150�–59 134 17.7
Ratee Age Group (Years)
60+ 68 9.0Black 54 7.1Hispanic/Latino 42 5.5White 564 74.3
Ratee Race/Ethnicity
Other 99 13.0Total 759 100.0
Table A.36. Comparison of EQ 360 Scores in U.S. and Canadian Samples
The following table provides mean and standard deviations of EQ 360 scores in U.S. andCanadian samples. d values provide an effect size to describe differences between the twocountries as small, medium, or large. F and p values provide statistical significance tests for thesedifferences. A lack of meaningful differences (i.e., d .20) between U.S. and Canadianparticipants supports combining the two countries in the normative sample.
Scale U.S. Canada d F p
M 100.2 97.8Total EI
SD 15.0 15.00.16 6.60 .010
M 100.1 98.8Self Perception Composite
SD 15.0 15.00.09 1.89 .169
M 100.2 98.2Self Regard
SD 15.0 15.00.13 4.19 .041
M 100.1 98.9Self Actualization
SD 15.0 15.00.08 1.52 .217
M 100.0 99.8Emotional Self Awareness
SD 15.0 15.00.01 0.05 .822
M 100.2 97.5Self Expression Composite
SD 15.0 15.00.18 8.27 .004
M 100.3 97.0Emotional Expression
SD 14.8 14.90.22 11.71 .001
�…table continues on next page
335
Table A.36. Comparison of EQ 360 Scores in U.S. and Canadian Samples (continued) Scale U.S. Canada d F p
M 100.1 99.2Assertiveness
SD 15.0 15.00.06 0.75 .386
M 100.2 97.9Independence
SD 14.9 14.90.16 6.03 .014
M 100.1 98.5Interpersonal Composite
SD 15.0 15.00.11 3.12 .077
M 100.1 98.6Interpersonal Relationships
SD 15.0 15.00.10 2.59 .107
M 100.2 98.3Empathy
SD 14.9 15.00.12 3.69 .055
M 100.1 99.0Social Responsibility
SD 14.9 15.00.08 1.40 .237
M 100.3 97.0Decision Making Composite
SD 15.0 15.00.22 12.03 .001
M 100.3 96.9Problem Solving
SD 14.9 15.00.23 12.72 .000
M 100.1 98.6Reality Testing
SD 15.0 15.00.10 2.59 .108
M 100.3 96.7Impulse Control
SD 15.0 15.00.24 14.48 < .001
M 100.2 98.0Stress Management Composite
SD 15.0 15.00.15 5.46 .019
M 100.2 97.6Flexibility
SD 14.9 15.00.18 7.71 .006
M 100.1 98.5Stress Tolerance
SD 14.9 15.00.11 2.87 .090
M 100.1 98.4Optimism
SD 15.0 15.00.12 3.45 .063
M 100.1 99.0Happiness
SD 15.0 15.00.07 1.24 .265
Note. Positive Cohen's d values signify higher means in the U.S. group, negative Cohen�’s d valuessignify higher means in the Canadian group. Sample sizes vary due to missing data: U.S. = 2,925to 2,928, Canada = 272. df for F tests = 1, 3195 (Total EI); 1, 3194 (Composites); 1, 3192(Subscales). Guidelines for evaluating |d| are .20 = small, .50 = medium, .80 = large.

336
Table A.37. Length of Rater/Ratee Relationship: EQ 360 Normative Sample
The following table describes the raters in the EQ 360 normative sample in terms of the length oftheir relationship to the ratee. Ideally, the majority of raters should have a long (at least oneyear) relationship with ratees to ensure ratings are well informed.
Length of Relationship to Ratee N %
Less than 3 Months 0 0.0
3 Months to Under 1 Year 308 9.6
1 to 5 Years 1,285 40.2
6 to 10 Years 522 16.3
Over 10 Years 1,085 33.9
Total 3,200 100.0
Table A.38. Strength of Rater/Ratee Relationship: EQ 360 Normative Sample
The following table describes the raters in the EQ 360 normative sample in terms of the strengthof their relationship to the ratee. Ideally, the majority of raters should have a strong (at least�“Fairly Well�”) relationship with ratees to ensure ratings are well informed.
HowWell Rater Knows Ratee N %
Not Very Well 0 0.0
Fairly Well 1,346 42.1
Well 793 24.8
Very Well 1,061 33.2
Total 3,200 100.0
Table A.39. Distribution of Rater Types by Gender: EQ 360 Normative Sample
The following table describes the gender distribution of the EQ 360 normative sample withinrater types. Ideally, males and females should show similar proportions within rater types toensure equal representation.
Ratee GenderRater Type Male Female TotalDirect Report 400 400 800Manager 400 400 800Work Peer 400 400 800Family/Friend 400 400 800Total 1,600 1,600 3,200

337
Table A.40. Ratee Age Group by Gender Distribution: EQ 360 Normative Sample
The following table describes the gender distribution of the EQ 360 normative sample within agegroups. Ideally, the groups should show similar proportions, reflecting equal representation of allgender x age groups.
Ratee Gender
Male Female TotalRatee AgeGroup (Years) N % N % N %
18�–24 118 3.7 124 3.9 242 7.6
25�–29 185 5.8 190 5.9 375 11.7
30�–34 185 5.8 186 5.8 371 11.6
35�–39 191 6.0 189 5.9 380 11.9
40�–44 191 6.0 189 5.9 380 11.9
45�–49 188 5.9 178 5.6 366 11.4
50�–54 183 5.7 189 5.9 372 11.6
55�–59 181 5.7 182 5.7 363 11.3
60+ 178 5.5 173 5.4 351 10.9
Total 1,600 50.0 1,600 50.0 3,200 100.0
Table A.41. Distribution of Ratee Race/Ethnicity by Rater Type: EQ 360 NormativeSample
The following table summarizes the race/ethnicity distribution of the EQ 360 normative samplealong with Census information. Ideally, the normative sample should show race/ethnicityproportions similar (within 3%) to census, suggesting the normative sample is representative ofthe general population.
Rater TypeDirect ReportCountry
RateeRace/Ethnicity
Census % Norm %
Census for AllOther RaterTypes %
Manager %Work Peer
%Family/Friend %
Other 6.7 6.8 6.7 6.9 7.2 7.3Black 8.3 8.1 12.2 12.5 12.4 12.1Hispanic/Latino 7.0 6.1 15.0 12.3 13.3 12.0White 78.0 79.0 66.1 68.3 67.1 68.6
U.S.
Total 100.0 100.0 100.0 100.0 100.0 100.0White 80.0 78.7 80.0 81.4 87.4 82.4Non White 20.0 21.3 20.0 18.6 12.6 17.6CanadaTotal 100.0 100.0 100.0 100.0 100.0 100.0
Note. N = 3,200 (800 per rater type).
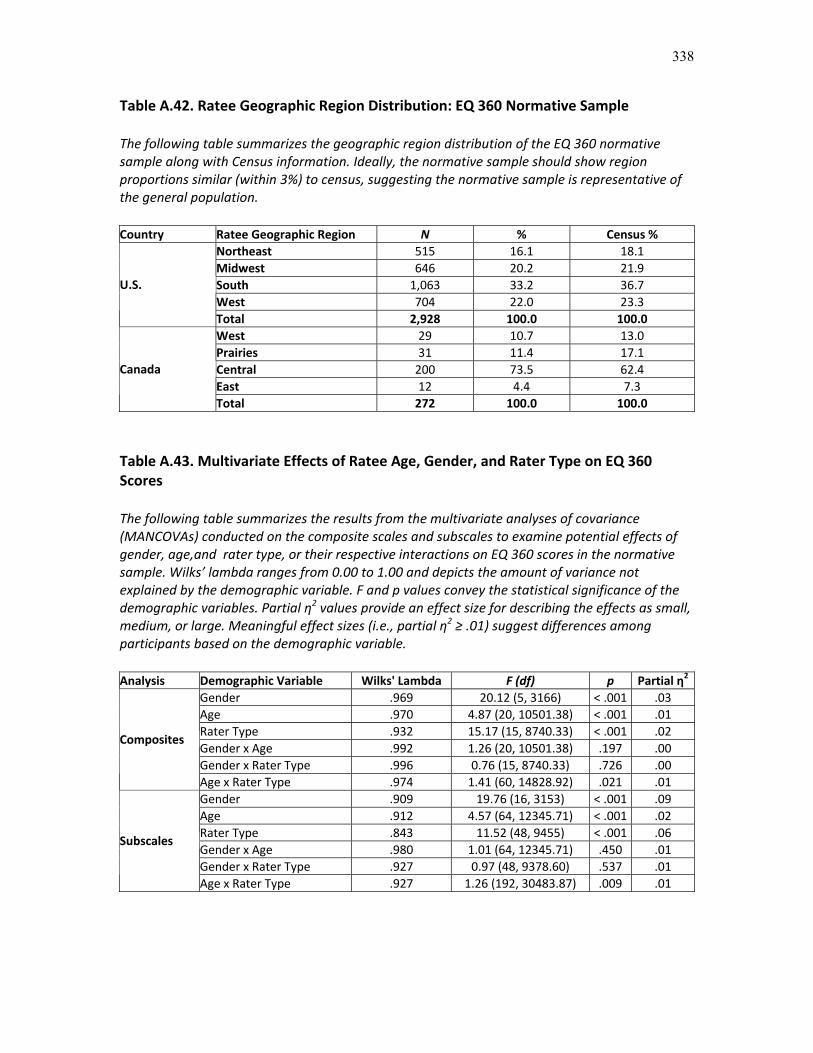
338
Table A.42. Ratee Geographic Region Distribution: EQ 360 Normative Sample
The following table summarizes the geographic region distribution of the EQ 360 normativesample along with Census information. Ideally, the normative sample should show regionproportions similar (within 3%) to census, suggesting the normative sample is representative ofthe general population.
Country Ratee Geographic Region N % Census %Northeast 515 16.1 18.1Midwest 646 20.2 21.9South 1,063 33.2 36.7West 704 22.0 23.3
U.S.
Total 2,928 100.0 100.0West 29 10.7 13.0Prairies 31 11.4 17.1Central 200 73.5 62.4East 12 4.4 7.3
Canada
Total 272 100.0 100.0
Table A.43. Multivariate Effects of Ratee Age, Gender, and Rater Type on EQ 360Scores
The following table summarizes the results from the multivariate analyses of covariance(MANCOVAs) conducted on the composite scales and subscales to examine potential effects ofgender, age,and rater type, or their respective interactions on EQ 360 scores in the normativesample. Wilks�’ lambda ranges from 0.00 to 1.00 and depicts the amount of variance notexplained by the demographic variable. F and p values convey the statistical significance of thedemographic variables. Partial 2 values provide an effect size for describing the effects as small,medium, or large. Meaningful effect sizes (i.e., partial 2 .01) suggest differences amongparticipants based on the demographic variable.
Analysis Demographic Variable Wilks' Lambda F (df) p Partial 2
Gender .969 20.12 (5, 3166) < .001 .03Age .970 4.87 (20, 10501.38) < .001 .01Rater Type .932 15.17 (15, 8740.33) < .001 .02Gender x Age .992 1.26 (20, 10501.38) .197 .00Gender x Rater Type .996 0.76 (15, 8740.33) .726 .00
Composites
Age x Rater Type .974 1.41 (60, 14828.92) .021 .01Gender .909 19.76 (16, 3153) < .001 .09Age .912 4.57 (64, 12345.71) < .001 .02Rater Type .843 11.52 (48, 9455) < .001 .06Gender x Age .980 1.01 (64, 12345.71) .450 .01Gender x Rater Type .927 0.97 (48, 9378.60) .537 .01
Subscales
Age x Rater Type .927 1.26 (192, 30483.87) .009 .01
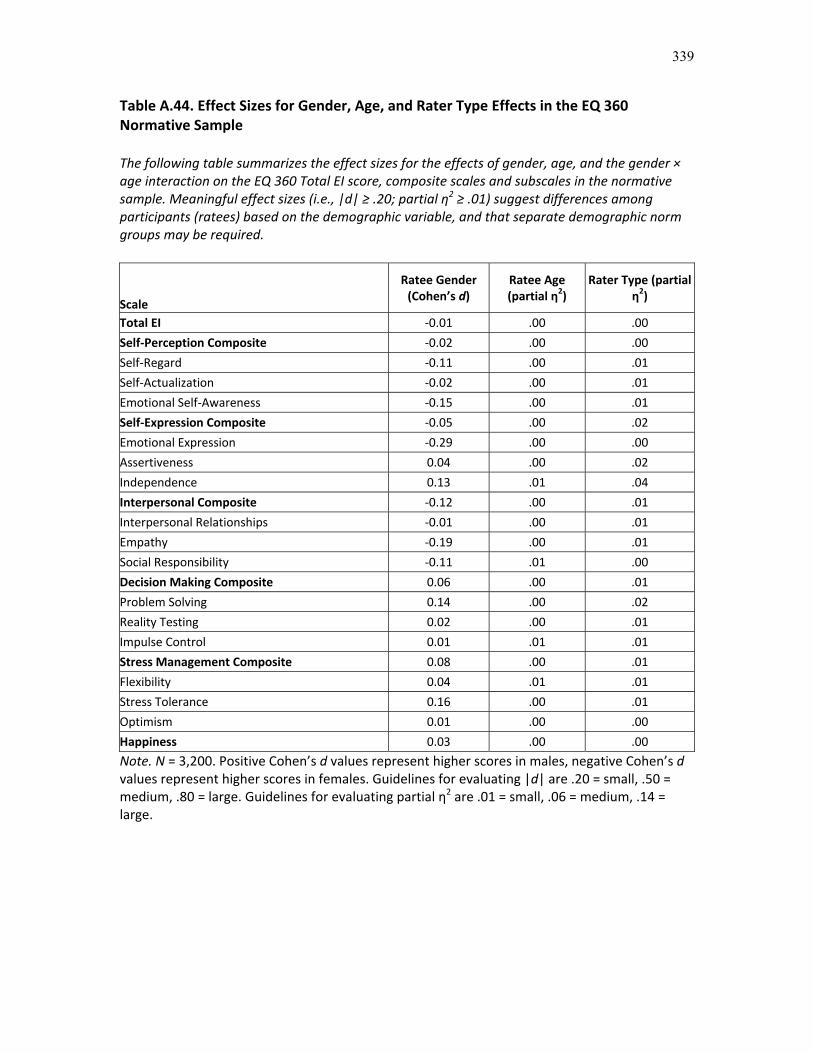
339
Table A.44. Effect Sizes for Gender, Age, and Rater Type Effects in the EQ 360Normative Sample
The following table summarizes the effect sizes for the effects of gender, age, and the gender ×age interaction on the EQ 360 Total EI score, composite scales and subscales in the normativesample. Meaningful effect sizes (i.e., |d| .20; partial 2 .01) suggest differences amongparticipants (ratees) based on the demographic variable, and that separate demographic normgroups may be required.
Scale
Ratee Gender(Cohen�’s d)
Ratee Age(partial 2)
Rater Type (partial2)
Total EI 0.01 .00 .00
Self Perception Composite 0.02 .00 .00
Self Regard 0.11 .00 .01
Self Actualization 0.02 .00 .01
Emotional Self Awareness 0.15 .00 .01
Self Expression Composite 0.05 .00 .02
Emotional Expression 0.29 .00 .00
Assertiveness 0.04 .00 .02
Independence 0.13 .01 .04
Interpersonal Composite 0.12 .00 .01
Interpersonal Relationships 0.01 .00 .01
Empathy 0.19 .00 .01
Social Responsibility 0.11 .01 .00
Decision Making Composite 0.06 .00 .01
Problem Solving 0.14 .00 .02
Reality Testing 0.02 .00 .01
Impulse Control 0.01 .01 .01
Stress Management Composite 0.08 .00 .01
Flexibility 0.04 .01 .01
Stress Tolerance 0.16 .00 .01
Optimism 0.01 .00 .00
Happiness 0.03 .00 .00
Note. N = 3,200. Positive Cohen�’s d values represent higher scores in males, negative Cohen�’s dvalues represent higher scores in females. Guidelines for evaluating |d| are .20 = small, .50 =medium, .80 = large. Guidelines for evaluating partial 2 are .01 = small, .06 = medium, .14 =large.

340
Table A.45. Ratee Gender Differences in EQ 360 Scores
The following table provides means and standard deviations for the EQ 360 Total EI score,composite scales, and subscales for males and females in the EQ 360 normative sample. F and pvalues convey the statistical significance of gender differences.
Ratee GenderScale Male Female
F p
M 99.8 99.8Total EI
SD 15.6 15.60.01 .936
M 99.8 99.9Self Perception Composite
SD 15.6 15.70.05 .818
M 101.0 99.1Self Regard
SD 15.6 15.611.98 .001
M 99.8 99.9Self Actualization
SD 15.6 15.60.02 .885
M 98.6 101.0Emotional Self Awareness
SD 15.6 15.618.65 < .001
M 99.6 100.2Self Expression Composite
SD 15.5 15.51.21 .271
M 97.7 101.9Emotional Expression
SD 15.5 15.560.03 < .001
M 100.3 99.6Assertiveness
SD 15.5 15.51.66 .198
M 100.9 98.9Independence
SD 15.2 15.214.27 < .001
M 99.0 100.7Interpersonal Composite
SD 15.6 15.610.20 .001
M 99.9 99.9Interpersonal Relationships
SD 15.6 15.60.00 .995
M 98.4 101.3Empathy
SD 15.5 15.527.97 < .001
M 99.1 100.8Social Responsibility
SD 15.6 15.68.97 .003
M 100.3 99.4Decision Making Composite
SD 15.6 15.62.90 .088
M 100.9 98.9Problem Solving
SD 15.4 15.413.82 < .001
M 100.0 99.7Reality Testing
SD 15.6 15.60.37 .541
M 100.0 99.8Impulse Control
SD 15.6 15.60.06 .811
M 100.4 99.0Stress Management Composite
SD 15.6 15.65.78 .016
M 99.9 99.3Flexibility
SD 15.5 15.51.04 .307
�…table continues on the next page

341
Table A.45. Ratee Gender Differences in EQ 360 Scores (continued)
Ratee GenderScale Male Female
F P
M 101.1 98.5Stress Tolerance
SD 15.5 15.522.99 < .001
M 100.0 99.7Optimism
SD 15.6 15.70.34 .559
M 100.2 99.6Happiness
SD 15.7 15.71.11 .291
Note. Sample sizes vary due to missing data: Males, N = 1,598�–1,600; females, N = 1,599�–1,600.df for F tests = 1, 3190 (Total EI); 1, 3189 (Composites); 1, 3187 (Subscales). Positive d valuesrepresent higher mean scores in males, negative d values represent higher mean scores infemales. Guidelines for evaluating d = .20 (small); .50 (medium); .80 (large).
Table A.46. Ratee Age Differences in EQ 360 Scores
The following table provides means and standard deviations for the EQ 360Total EI score,composite scales, and subscales for the various age groups in the EQ 360 normative sample. Fand p values convey the statistical significance of age differences.
Ratee Age
Scale18�–29Years
30�–39Years
40�–49Years
50�–59Years
60+ YearsF p
M 98.9 100.8 100.4 100.4 98.5Total EI
SD 15.2 14.9 15.0 15.0 15.02.39 .048
M 99.0 100.8 100.4 100.1 99.1Self PerceptionComposite SD 15.2 15.0 15.0 15.0 15.0
1.70 .148
M 99.0 100.3 100.1 100.1 100.6Self Regard
SD 15.1 14.9 14.9 14.9 15.00.84 .500
M 98.9 100.9 100.5 100.2 98.6Self Actualization
SD 15.1 14.9 14.9 14.9 15.02.44 .045
M 99.5 100.7 100.4 100.1 98.3Emotional Self Awareness
SD 15.1 14.9 14.9 14.9 15.01.84 .118
M 98.6 100.3 100.9 100.6 98.9Self ExpressionComposite SD 15.0 14.8 14.8 14.8 14.9
2.89 .021
M 100.4 100.3 100.5 99.7 98.2Emotional Expression
SD 15.1 14.8 14.8 14.9 14.91.72 .143
M 98.9 99.8 100.7 100.6 99.8Assertiveness
SD 15.1 14.8 14.8 14.9 14.91.59 .175
M 97.5 100.6 100.9 101.0 99.4Independence
SD 14.8 14.5 14.5 14.6 14.66.64 < .001
M 99.0 100.8 99.9 100.4 99.2Interpersonal Composite
SD 15.1 14.9 14.9 14.9 15.01.68 .153
M 100.4 100.6 99.7 99.8 98.8InterpersonalRelationships SD 15.2 14.9 14.9 15.0 15.0
1.17 .324
M 99.0 100.9 100.2 100.1 99.1Empathy
SD 15.1 14.9 14.9 14.9 14.91.66 .156
�…table continues on the next page
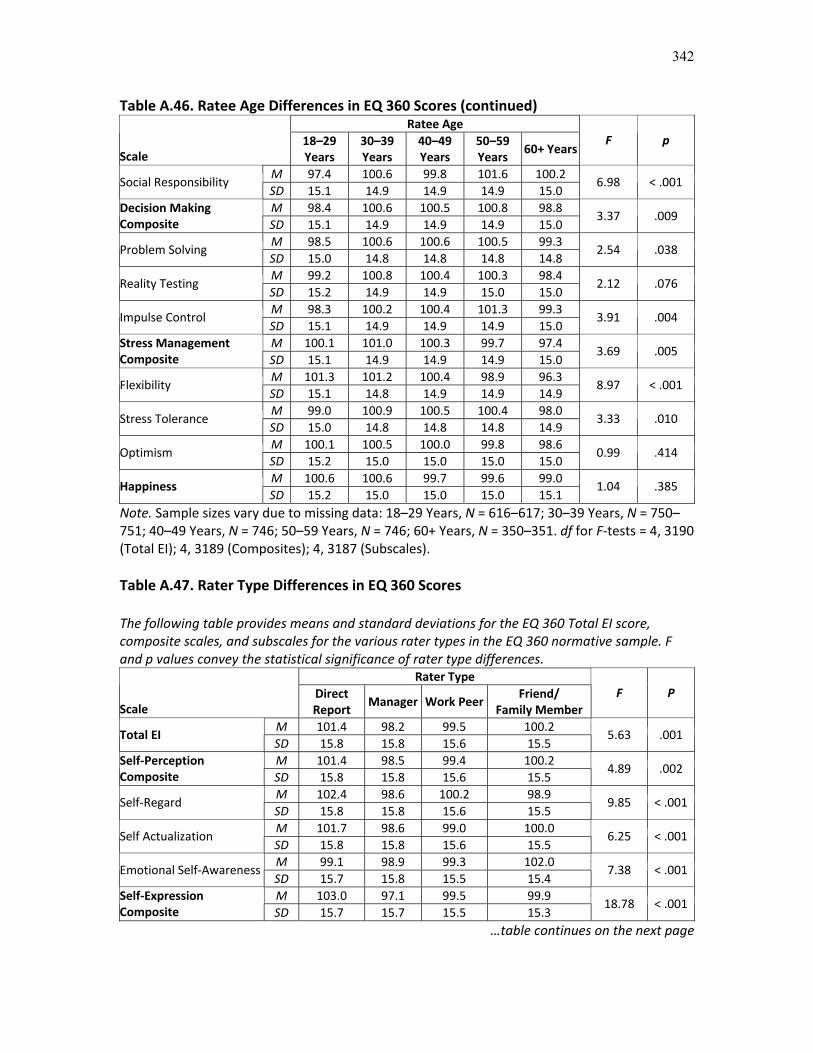
342
Table A.46. Ratee Age Differences in EQ 360 Scores (continued)Ratee Age
Scale18�–29Years
30�–39Years
40�–49Years
50�–59Years
60+ YearsF p
M 97.4 100.6 99.8 101.6 100.2Social Responsibility
SD 15.1 14.9 14.9 14.9 15.06.98 < .001
M 98.4 100.6 100.5 100.8 98.8Decision MakingComposite SD 15.1 14.9 14.9 14.9 15.0
3.37 .009
M 98.5 100.6 100.6 100.5 99.3Problem Solving
SD 15.0 14.8 14.8 14.8 14.82.54 .038
M 99.2 100.8 100.4 100.3 98.4Reality Testing
SD 15.2 14.9 14.9 15.0 15.02.12 .076
M 98.3 100.2 100.4 101.3 99.3Impulse Control
SD 15.1 14.9 14.9 14.9 15.03.91 .004
M 100.1 101.0 100.3 99.7 97.4Stress ManagementComposite SD 15.1 14.9 14.9 14.9 15.0
3.69 .005
M 101.3 101.2 100.4 98.9 96.3Flexibility
SD 15.1 14.8 14.9 14.9 14.98.97 < .001
M 99.0 100.9 100.5 100.4 98.0Stress Tolerance
SD 15.0 14.8 14.8 14.8 14.93.33 .010
M 100.1 100.5 100.0 99.8 98.6Optimism
SD 15.2 15.0 15.0 15.0 15.00.99 .414
M 100.6 100.6 99.7 99.6 99.0Happiness
SD 15.2 15.0 15.0 15.0 15.11.04 .385
Note. Sample sizes vary due to missing data: 18�–29 Years, N = 616�–617; 30�–39 Years, N = 750�–751; 40�–49 Years, N = 746; 50�–59 Years, N = 746; 60+ Years, N = 350�–351. df for F tests = 4, 3190(Total EI); 4, 3189 (Composites); 4, 3187 (Subscales).
Table A.47. Rater Type Differences in EQ 360 Scores
The following table provides means and standard deviations for the EQ 360 Total EI score,composite scales, and subscales for the various rater types in the EQ 360 normative sample. Fand p values convey the statistical significance of rater type differences.
Rater Type
ScaleDirectReport
Manager Work PeerFriend/
Family MemberF P
M 101.4 98.2 99.5 100.2Total EI
SD 15.8 15.8 15.6 15.55.63 .001
M 101.4 98.5 99.4 100.2Self PerceptionComposite SD 15.8 15.8 15.6 15.5
4.89 .002
M 102.4 98.6 100.2 98.9Self Regard
SD 15.8 15.8 15.6 15.59.85 < .001
M 101.7 98.6 99.0 100.0Self Actualization
SD 15.8 15.8 15.6 15.56.25 < .001
M 99.1 98.9 99.3 102.0Emotional Self Awareness
SD 15.7 15.8 15.5 15.47.38 < .001
M 103.0 97.1 99.5 99.9Self ExpressionComposite SD 15.7 15.7 15.5 15.3
18.78 < .001
�…table continues on the next page
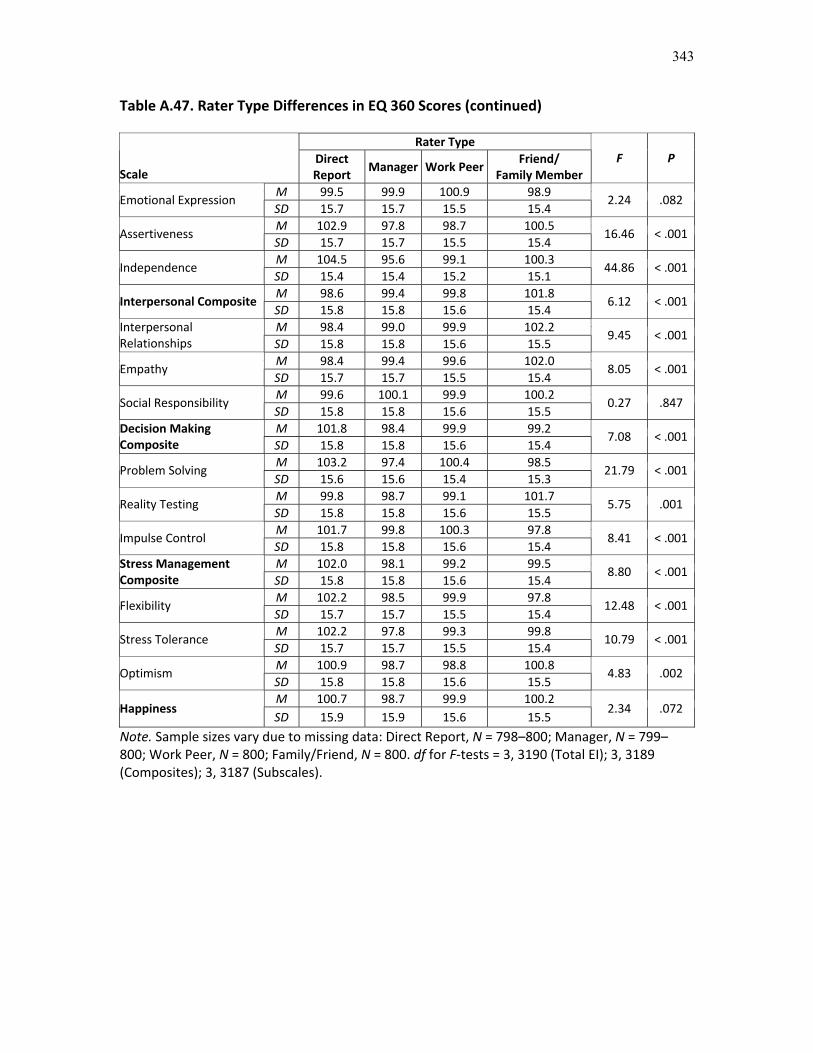
343
Table A.47. Rater Type Differences in EQ 360 Scores (continued)
Rater Type
ScaleDirectReport
Manager Work PeerFriend/
Family MemberF P
M 99.5 99.9 100.9 98.9Emotional Expression
SD 15.7 15.7 15.5 15.42.24 .082
M 102.9 97.8 98.7 100.5Assertiveness
SD 15.7 15.7 15.5 15.416.46 < .001
M 104.5 95.6 99.1 100.3Independence
SD 15.4 15.4 15.2 15.144.86 < .001
M 98.6 99.4 99.8 101.8Interpersonal Composite
SD 15.8 15.8 15.6 15.46.12 < .001
M 98.4 99.0 99.9 102.2InterpersonalRelationships SD 15.8 15.8 15.6 15.5
9.45 < .001
M 98.4 99.4 99.6 102.0Empathy
SD 15.7 15.7 15.5 15.48.05 < .001
M 99.6 100.1 99.9 100.2Social Responsibility
SD 15.8 15.8 15.6 15.50.27 .847
M 101.8 98.4 99.9 99.2Decision MakingComposite SD 15.8 15.8 15.6 15.4
7.08 < .001
M 103.2 97.4 100.4 98.5Problem Solving
SD 15.6 15.6 15.4 15.321.79 < .001
M 99.8 98.7 99.1 101.7Reality Testing
SD 15.8 15.8 15.6 15.55.75 .001
M 101.7 99.8 100.3 97.8Impulse Control
SD 15.8 15.8 15.6 15.48.41 < .001
M 102.0 98.1 99.2 99.5Stress ManagementComposite SD 15.8 15.8 15.6 15.4
8.80 < .001
M 102.2 98.5 99.9 97.8Flexibility
SD 15.7 15.7 15.5 15.412.48 < .001
M 102.2 97.8 99.3 99.8Stress Tolerance
SD 15.7 15.7 15.5 15.410.79 < .001
M 100.9 98.7 98.8 100.8Optimism
SD 15.8 15.8 15.6 15.54.83 .002
M 100.7 98.7 99.9 100.2Happiness
SD 15.9 15.9 15.6 15.52.34 .072
Note. Sample sizes vary due to missing data: Direct Report, N = 798�–800; Manager, N = 799�–800; Work Peer, N = 800; Family/Friend, N = 800. df for F tests = 3, 3190 (Total EI); 3, 3189(Composites); 3, 3187 (Subscales).
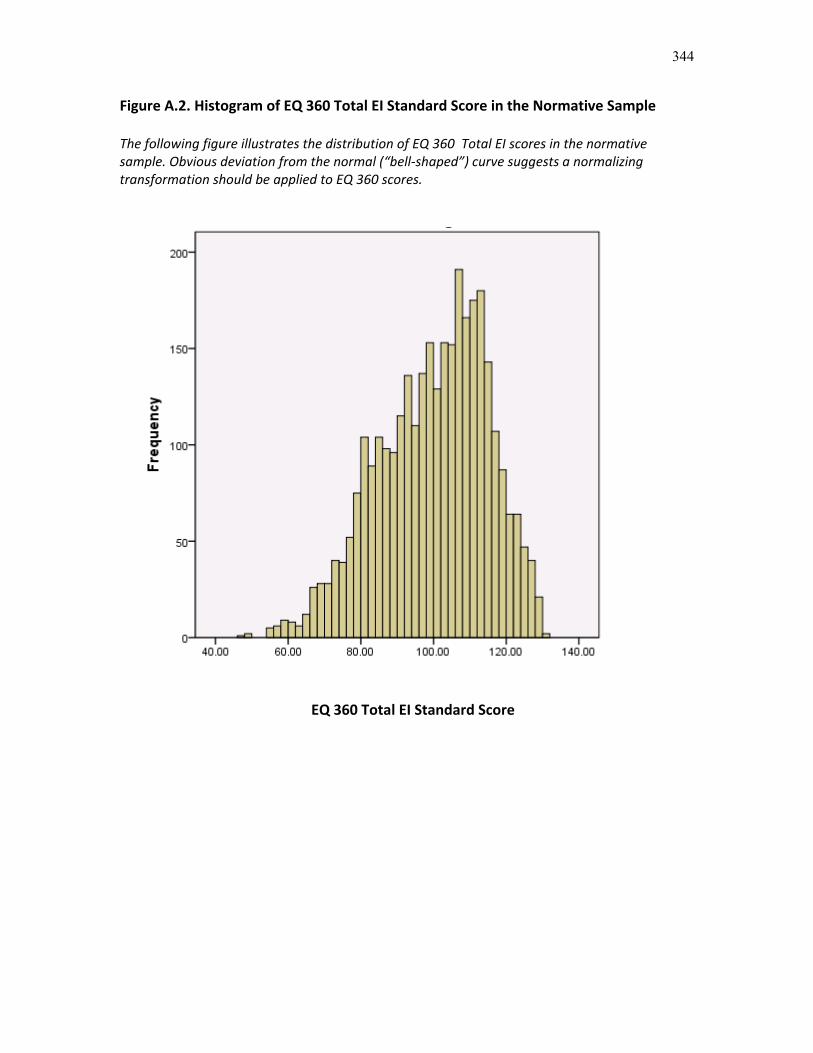
344
Figure A.2. Histogram of EQ 360 Total EI Standard Score in the Normative Sample
The following figure illustrates the distribution of EQ 360 Total EI scores in the normativesample. Obvious deviation from the normal (�“bell shaped�”) curve suggests a normalizingtransformation should be applied to EQ 360 scores.
EQ 360 Total EI Standard Score
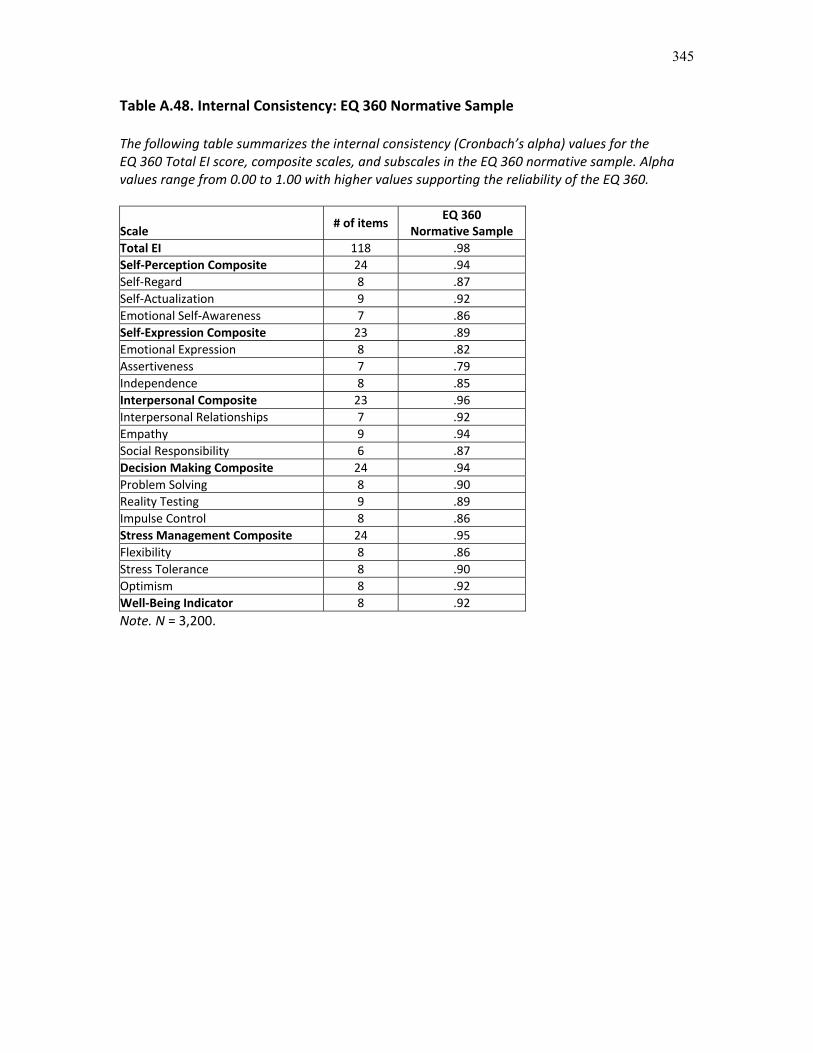
345
Table A.48. Internal Consistency: EQ 360 Normative Sample
The following table summarizes the internal consistency (Cronbach�’s alpha) values for theEQ 360 Total EI score, composite scales, and subscales in the EQ 360 normative sample. Alphavalues range from 0.00 to 1.00 with higher values supporting the reliability of the EQ 360.
Scale# of items
EQ 360Normative Sample
Total EI 118 .98Self Perception Composite 24 .94Self Regard 8 .87Self Actualization 9 .92Emotional Self Awareness 7 .86Self Expression Composite 23 .89Emotional Expression 8 .82Assertiveness 7 .79Independence 8 .85Interpersonal Composite 23 .96Interpersonal Relationships 7 .92Empathy 9 .94Social Responsibility 6 .87Decision Making Composite 24 .94Problem Solving 8 .90Reality Testing 9 .89Impulse Control 8 .86Stress Management Composite 24 .95Flexibility 8 .86Stress Tolerance 8 .90Optimism 8 .92Well Being Indicator 8 .92Note. N = 3,200.

346
Table A.49. Demographic Characteristics of EQ 360 Test Retest Sample
The following table summarizes the demographic characteristics of the EQ 360 test retestsample. Ideally, this sample should include representation from a wide range of demographicgroups.
Demographic N %
Male 100 49.3Ratee Gender
Female 103 50.7
Black 45 22.2
Hispanic/Latino 30 14.8
White 112 55.2
Ratee Race/Ethnicity
Other 16 7.9
18�–29 52 25.6
30�–39 48 23.6
40�–49 45 22.2
50�–59 43 21.2
Ratee Age Group (Years)
60+ 15 7.4
Northeast 29 14.3
Midwest 39 19.2
South 84 41.4
Ratee U.S. Geographic Region
West 50 24.6
Direct report 23 11.3
Manager 51 25.1
Work Peer 96 47.3
Rater Type
Friend/Family Member 33 16.3Total 203 100.0
Note. All demographic variables represent ratees except Rater Type. Mean and standarddeviation for age was unavailable. Region value for one participant was Canada. Time intervalmean = 19.3 days (SD = 2.4 days), range = 14�–23 days.
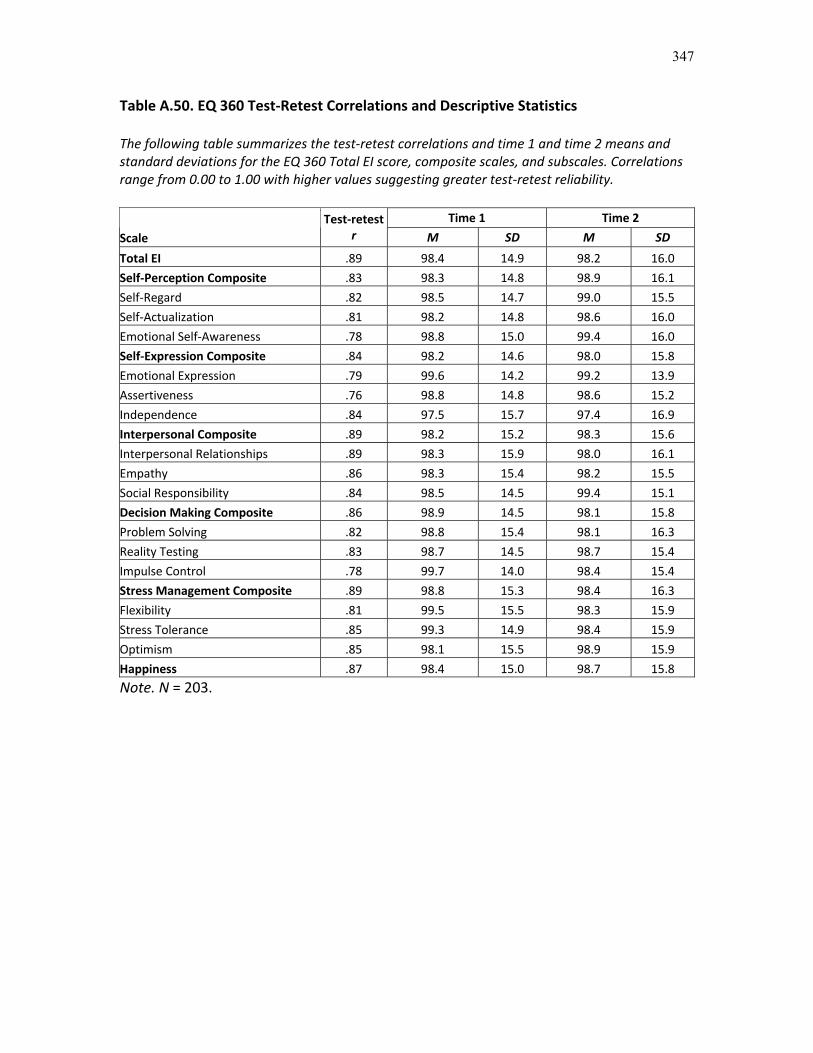
347
Table A.50. EQ 360 Test Retest Correlations and Descriptive Statistics
The following table summarizes the test retest correlations and time 1 and time 2 means andstandard deviations for the EQ 360 Total EI score, composite scales, and subscales. Correlationsrange from 0.00 to 1.00 with higher values suggesting greater test retest reliability.
Time 1 Time 2
ScaleTest retest
r M SD M SD
Total EI .89 98.4 14.9 98.2 16.0
Self Perception Composite .83 98.3 14.8 98.9 16.1
Self Regard .82 98.5 14.7 99.0 15.5
Self Actualization .81 98.2 14.8 98.6 16.0
Emotional Self Awareness .78 98.8 15.0 99.4 16.0
Self Expression Composite .84 98.2 14.6 98.0 15.8
Emotional Expression .79 99.6 14.2 99.2 13.9
Assertiveness .76 98.8 14.8 98.6 15.2
Independence .84 97.5 15.7 97.4 16.9
Interpersonal Composite .89 98.2 15.2 98.3 15.6
Interpersonal Relationships .89 98.3 15.9 98.0 16.1
Empathy .86 98.3 15.4 98.2 15.5
Social Responsibility .84 98.5 14.5 99.4 15.1
Decision Making Composite .86 98.9 14.5 98.1 15.8
Problem Solving .82 98.8 15.4 98.1 16.3
Reality Testing .83 98.7 14.5 98.7 15.4
Impulse Control .78 99.7 14.0 98.4 15.4
Stress Management Composite .89 98.8 15.3 98.4 16.3
Flexibility .81 99.5 15.5 98.3 15.9
Stress Tolerance .85 99.3 14.9 98.4 15.9
Optimism .85 98.1 15.5 98.9 15.9
Happiness .87 98.4 15.0 98.7 15.8
Note. N = 203.

348
Table A.51. Differences between Time 1 and Time 2 EQ 360 Standard Scores
The following table summarizes the differences between time 1 and time 2 scores for the EQ 360Total EI score, composite scales, and subscales. The first set of results (% of Respondents) liststhe percentage of respondents whose scores decreased by more than 15 points, changed by 15points or less, or increased by more than 15 points over time. Test retest stability is supported ifthe majority of respondents show changes of 15 points or less over time. The mean and standarddeviation of these differences across participants is also provided, along with the 95% confidenceinterval (CI), which illustrates whether the difference is statistically meaningful for the sample asa whole. That is, if the CI includes zero between the lower bound (LB) and upper bound (UB), thedifference is not statistically meaningful.
% of Respondents 95% CIScores DecreasedMore than 1 SD(15 Points)
Scores Changed by1 SD or Less(15 Points)
Scores IncreasedMore than 1 SD(15 Points)
MDiff SD LB UB
Total EI 3.4 95.1 1.5 0.2 7.4 0.9 0.6Self PerceptionComposite
3.4 92.1 4.4 0.6 9.1 0.3 1.6
Self Regard 2.5 92.2 5.4 0.5 9.2 0.5 1.6Self Actualization 2.5 94.5 3.0 0.4 9.6 0.7 1.4Emotional SelfAwareness
3.0 90.6 6.4 0.8 10.4 0.1 1.7
Self ExpressionComposite
3.9 93.6 2.5 0.3 8.6 1.1 0.6
Emotional Expression 4.4 90.2 5.4 0.4 9.2 1.3 0.6Assertiveness 7.9 85.3 6.9 0.2 10.5 1.1 0.7Independence 3.9 93.6 2.5 0.1 9.2 1.0 0.9InterpersonalComposite
3.0 95.6 1.5 0.1 7.3 0.6 0.8
InterpersonalRelationships
2.0 96.1 2.0 0.3 7.4 1.2 0.5
Empathy 3.0 94.5 2.5 0.1 8.1 0.9 0.7Social Responsibility 1.5 95.1 3.4 1.0 8.5 0.2 1.7Decision MakingComposite
4.9 94.1 1.0 0.8 8.2 1.6 0.0
Problem Solving 4.9 91.7 3.4 0.7 9.6 1.7 0.3Reality Testing 3.4 94.6 2.0 0.0 8.9 1.0 1.0Impulse Control 6.9 90.1 3.0 1.4 9.7 2.2 0.5Stress ManagementComposite
3.9 95.1 1.0 0.5 7.6 1.2 0.3
Flexibility 5.9 89.7 4.4 1.2 9.7 2.2 0.3Stress Tolerance 5.4 92.6 2.0 0.9 8.4 1.7 0.0Optimism 4.9 93.6 1.5 0.8 8.5 0.0 1.7Happiness 3.4 93.6 3.0 0.3 8.0 0.6 1.1Note. N = 203.M Diff = mean difference; CI = confidence interval; LB = lower bound, UB = upperbound.

349
Table A.52. Correlations among EQ 360 Composite Scales (Normative Sample)
The following table illustrates the correlations among the EQ 360 composite scales in the EQ 360normative sample. Correlations range from 0.00 to 1.00, with higher values suggesting the scalesshare a relevant common psychological characteristic (i.e., emotional intelligence), supportingthe factor structure of the EQ 360.
Composite Scale SPCOMP SECOMP ICOMP DMCOMP SMCOMPSPCOMP. Self Perception Composite �–SECOMP. Self Expression Composite .79 �–ICOMP. Interpersonal Composite .81 .64 �–DMCOMP. Decision Making Composite .80 .74 .74 �–SMCOMP. Stress Management Composite .85 .75 .80 .86 �–Note. N = 3,200. All correlations significant at p < .01. Guidelines for evaluating r are .10 = small,.30 = medium, .50 = large.
Table A.53. Correlations among EQ 360 Subscales (Normative Sample)
The following table illustrates the correlations among the EQ 360 subscales in the EQ 360normative sample. Correlations range from 0.00 to 1.00, with higher values suggesting the scalesshare a relevant common psychological characteristic (i.e., emotional intelligence), supportingthe factor structure of the EQ 360. Shaded cells portray correlations of subscales within theirrespective composite scales, which are expected to be higher than those in unshaded cells.
Scale SR SA ES EE AS IN IR EM RE PS RT IC FL ST OP HASR. Self Regard �–SA. Self Actualization .72 �–ES. Emotional Self Awareness .54 .67 �–EE. Emotional Expression .51 .49 .56 �–AS. Assertiveness .58 .62 .53 .41 �–IN. Independence .64 .63 .40 .37 .60 �–IR. Interpersonal Relationships .59 .71 .67 .61 .45 .43 �–EM. Empathy .49 .68 .76 .59 .40 .37 .81 �–RE. Social Responsibility .56 .76 .65 .50 .48 .43 .71 .75 �–PS. Problem Solving .68 .68 .50 .48 .54 .80 .55 .53 .53 �–RT. Reality Testing .64 .79 .82 .52 .60 .56 .74 .80 .72 .66 �–IC. Impulse Control .43 .49 .42 .31 .23 .50 .45 .54 .47 .67 .55 �–FL. Flexibility .57 .58 .51 .57 .35 .60 .61 .59 .53 .74 .61 .60 �–ST. Stress Tolerance .70 .78 .63 .46 .59 .69 .66 .64 .63 .80 .78 .60 .69 �–OP. Optimism .72 .78 .66 .54 .47 .50 .77 .74 .71 .64 .74 .50 .63 .75 �–HA. Happiness .80 .76 .62 .59 .48 .52 .77 .68 .67 .63 .71 .48 .63 .71 .87 �–Note. N = 3,200. All correlations significant at p < .01. Cutoffs for evaluating r are .10 = small, .30= medium, .50 = large. Shaded cells represent subscale groupings within composite scales.

350
Table A.54. Demographic Distribution of Self Other Agreement Sample
The following table summarizes the demographic characteristics of the EQ 360 self otheragreement sample. Ideally, this sample should include representation from a wide range ofdemographic groups.
Demographic N %
Male 52 48.1Ratee Gender
Female 56 51.9
Black 4 3.7
Hispanic/Latino 26 24.1
White 77 71.3
Ratee Race/Ethnicity
Other 1 0.9
18�–29 19 17.6
30�–39 43 39.8
40�–49 29 26.9
50�–59 14 13.0
60+ 3 2.8
Ratee Age Group (Years)
M (SD) 38.9 (10.3)
Northeast 35 32.4
Midwest 11 10.2
South 62 57.4
Ratee U.S. Geographic Region
West 0 0.0
High school or less 19 17.6
Some college 27 25.0
Ratee Education Level
College or higher 62 57.4Total 108 100.0
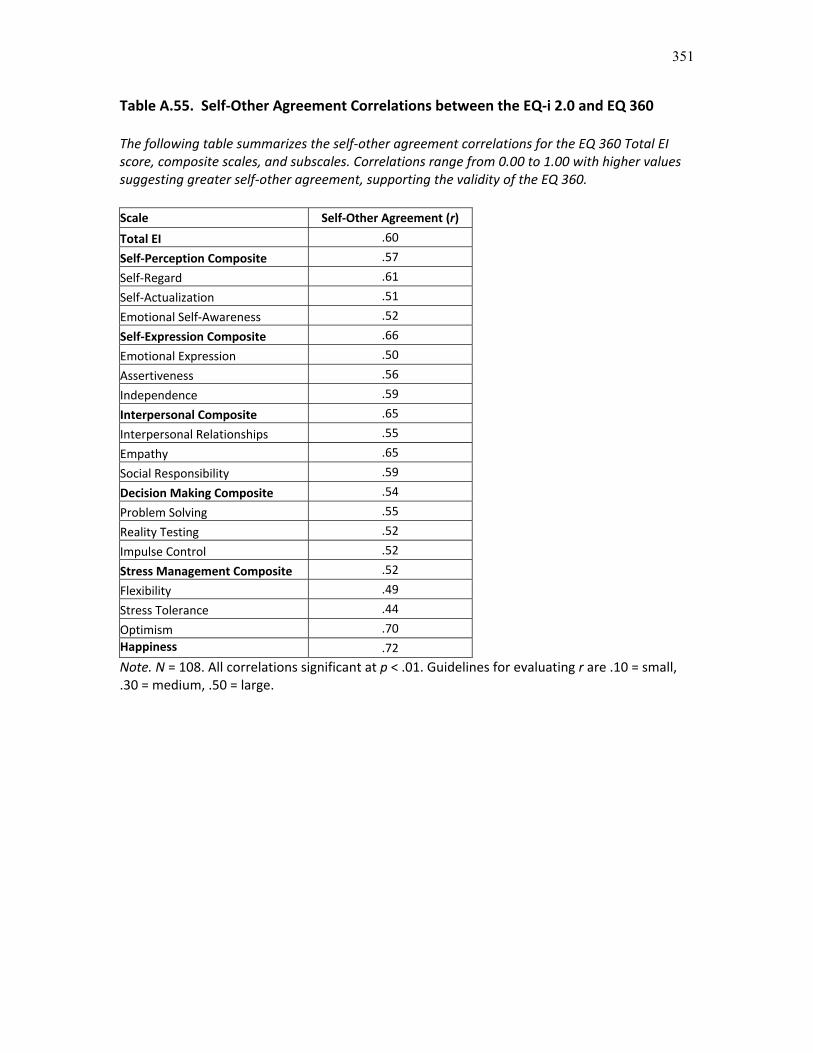
351
Table A.55. Self Other Agreement Correlations between the EQ i 2.0 and EQ 360
The following table summarizes the self other agreement correlations for the EQ 360 Total EIscore, composite scales, and subscales. Correlations range from 0.00 to 1.00 with higher valuessuggesting greater self other agreement, supporting the validity of the EQ 360.
Scale Self Other Agreement (r)
Total EI .60
Self Perception Composite .57
Self Regard .61
Self Actualization .51
Emotional Self Awareness .52
Self Expression Composite .66
Emotional Expression .50
Assertiveness .56
Independence .59
Interpersonal Composite .65
Interpersonal Relationships .55
Empathy .65
Social Responsibility .59
Decision Making Composite .54
Problem Solving .55
Reality Testing .52
Impulse Control .52
Stress Management Composite .52
Flexibility .49
Stress Tolerance .44
Optimism .70Happiness .72
Note. N = 108. All correlations significant at p < .01. Guidelines for evaluating r are .10 = small,.30 = medium, .50 = large.

352
Table A.56. Comparison of EQ i 2.0 and EQ 360 Standard Scores
The following table summarizes the differences between self (EQ i 2.0) and other (EQ 360) scoresfor the EQ i 2.0/EQ 360 Total EI score, composite scales, and subscales. This table lists thepercentage of respondents who showed EQ 360 scores that were higher than their EQ i 2.0scores by more than 10 points, scores that differed by 10 points or less, and those whose EQ i 2.0scores were higher than their EQ 360 scores by more than 10 points. Self other agreement (orself other consistency) is supported if the majority of respondents show differences of 10 pointsor less.
% of Respondents
Scale
EQ 360 ScoresHigher by> 10 Points
Scores Differ by10 Points or Less
EQ i 2.0 ScoresHigher by> 10 Points
Total EI 23.1 59.3 17.6Self Perception Composite 21.3 61.1 17.6Self Regard 16.7 61.1 22.2Self Actualization 21.3 62.0 16.7Emotional Self Awareness 32.4 50.9 16.7Self Expression Composite 19.4 63.9 16.7Emotional Expression 27.8 58.3 13.9Assertiveness 22.2 60.2 17.6Independence 27.8 53.7 18.5Interpersonal Composite 25.0 61.1 13.9Interpersonal Relationships 21.3 63.9 14.8Empathy 27.8 58.3 13.9Social Responsibility 20.4 56.5 23.1Decision Making Composite 30.6 50.0 19.4Problem Solving 27.8 53.7 18.5Reality Testing 28.7 53.7 17.6Impulse Control 25.9 50.0 24.1Stress Management Composite 26.9 57.4 15.7Flexibility 23.1 56.5 20.4Stress Tolerance 28.7 54.6 16.7Optimism 14.8 68.5 16.7Happiness 15.7 67.6 16.7
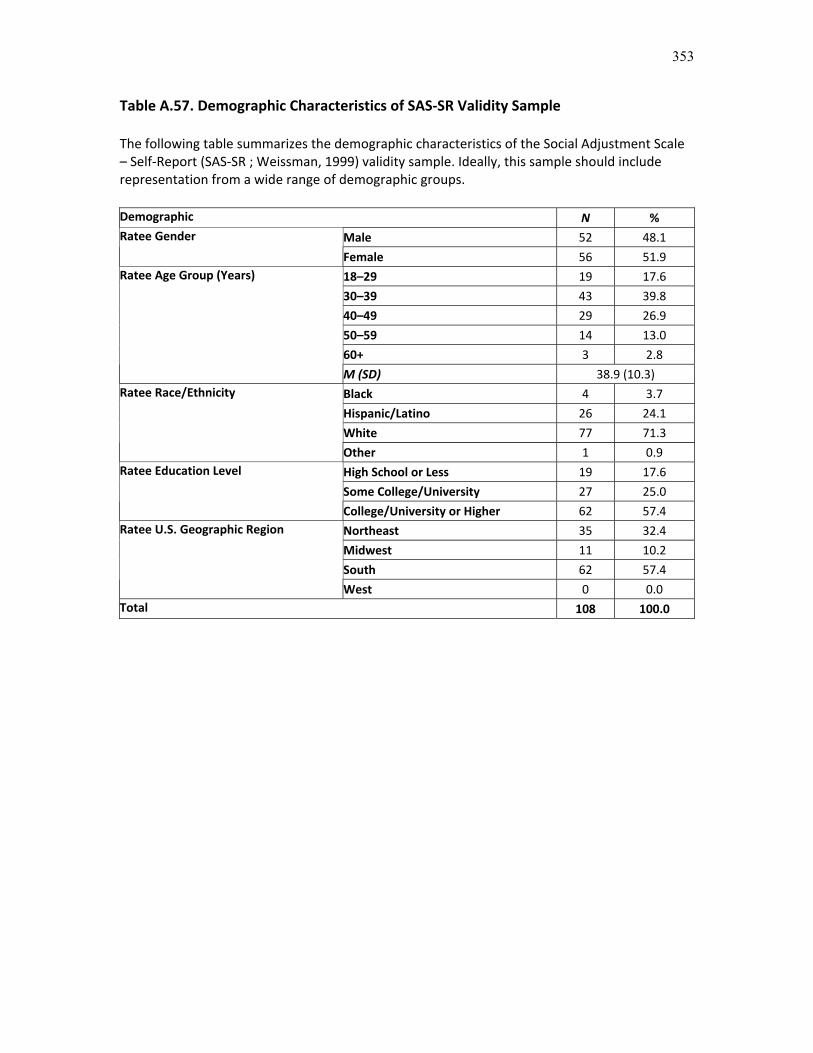
353
Table A.57. Demographic Characteristics of SAS SR Validity Sample
The following table summarizes the demographic characteristics of the Social Adjustment Scale�– Self Report (SAS SR ; Weissman, 1999) validity sample. Ideally, this sample should includerepresentation from a wide range of demographic groups.
Demographic N %
Male 52 48.1Ratee Gender
Female 56 51.9
18�–29 19 17.6
30�–39 43 39.8
40�–49 29 26.9
50�–59 14 13.0
60+ 3 2.8
Ratee Age Group (Years)
M (SD) 38.9 (10.3)
Black 4 3.7
Hispanic/Latino 26 24.1
White 77 71.3
Ratee Race/Ethnicity
Other 1 0.9
High School or Less 19 17.6
Some College/University 27 25.0
Ratee Education Level
College/University or Higher 62 57.4
Northeast 35 32.4
Midwest 11 10.2
South 62 57.4
Ratee U.S. Geographic Region
West 0 0.0Total 108 100.0

354
Table A.58. Multiple Regression Results for EQ i 2.0 and EQ 360 Predicting SocialAdjustment Scale�–Self Report Total Scores
The following table summarizes the extent to which the EQ i 2.0 and EQ 360 are independentlyrelated to Social Adjustment Scale�–Self Report (SAS�–SR) scores. Significant (p < .05) beta valuesdemonstrate independent associations with SAS�–SR scores. Significant (p < .05) f2 values suggestthe EQ 360 provides added value over the EQ i 2.0 in relation to SAS�–SR scores.
Step 1 Step 2 R2
R EQ i 2.0 EQ i 2.0 EQ 360Scale EQ i 2.0 EQ 360 P p p Step 1 Step 2
R2
change f2
Total EI .45 .42 0.45 < .01 0.31 .01 0.23 .03 .20 .24 .03 .04
Self PerceptionComposite
.45 .43 0.45 < .01 0.30 .01 0.26 .01 .20 .25 .05 .06
Self Regard .50 .46 0.50 < .01 0.35 < .01 0.25 .02 .25 .29 .04 .05
Self Actualization .38 .39 0.38 < .01 0.24 .02 0.27 .01 .14 .19 .05 .06
Emotional SelfAwareness
.25 .33 0.25 .01 0.11 .30 0.27 .01 .06 .12 .05 .06
Self ExpressionComposite
.51 .39 0.51 < .01 0.44 < .01 0.10 .35 .26 .26 .01 .01
EmotionalExpression
.41 .29 0.41 < .01 0.35 < .01 0.11 .27 .17 .18 .01 .01
Assertiveness .34 .30 0.34 < .01 0.26 .02 0.15 .17 .12 .13 .02 .02
Independence .41 .33 0.41 < .01 0.34 < .01 0.13 .23 .17 .18 .01 .01
InterpersonalComposite
.27 .38 0.27 < .01 0.04 .71 0.35 < .01 .07 .15 .07 .09
InterpersonalRelationships
.30 .37 0.30 < .01 0.14 .20 0.29 .01 .09 .15 .06 .07
Empathy .18 .36 0.18 .06 0.10 .41 0.43 < .01 .03 .14 .11 .12
Social Responsibility .24 .30 0.24 .01 0.11 .36 0.23 .04 .06 .10 .04 .04
Decision MakingComposite
.38 .35 0.38 < .01 0.26 .01 0.21 .05 .14 .17 .03 .04
Problem Solving .42 .37 0.42 < .01 0.32 < .01 0.19 .07 .18 .21 .03 .03
Reality Testing .21 .37 0.21 .03 0.02 .84 0.36 < .01 .04 .14 .09 .11
Impulse Control .26 .15 0.26 .01 0.26 .02 0.02 .89 .07 .07 .00 .00
Stress ManagementComposite
.31 .31 0.31 < .01 0.20 .06 0.21 .06 .10 .13 .03 .04
Flexibility .08 .11 0.08 .42 0.03 .76 0.09 .42 .01 .01 .01 .01
Stress Tolerance .25 .29 0.25 .01 0.15 .15 0.22 .04 .06 .10 .04 .04
Optimism .40 .35 0.40 < .01 0.29 .02 0.15 .23 .16 .17 .01 .01
Happiness .56 .43 0.56 < .01 0.51 < .01 0.07 .57 .31 .31 .00 .00
Note. N = 108. Correlations of .19 and above are significant at p < .05, correlations of .25 andabove are significant at p < .01. Guidelines for evaluating r are .10 = small, .30 = medium, .50 =large. Guidelines for evaluating f2 are .02 = small, .15 = medium, .35 = large.

355
Table A.59. Interaction Effects between Rater Race/Ethnicity and RateeRace/Ethnicity: EQ 360 Normative Sample
The following table summarizes the results from the analysis of covariance (ANCOVA) andmultivariate analyses of covariance (MANCOVAs) conducted on the composite scales andsubscales to examine potential effects of ratee race, rater race, and the interaction between thetwo on EQ 360 scores in the normative sample. Wilks�’ lambda ranges from 0.00 to 1.00 anddepicts the amount of variance not explained by the demographic variable. F and p valuesconvey the statistical significance of the demographic variables. Partial 2 values provide aneffect size for describing the effects as small, medium, or large. Meaningful effect sizes (i.e.,partial 2 .01) suggest differences among participants based on the demographic variable.
Analysis EffectWilks�’Lambda
F (df) ppartial
2
Rater Race (White vs. non White) n/a 0.10 (1, 2948) .757 .00
Ratee Race (Black vs. Hispanic/Latino vs. White) n/a 1.95 (2, 2948) .143 .00Total EI
Rater Race x Ratee Race n/a 2.41 (2, 2948) .090 .00
Rater Race (White vs. non White) .994 3.46 (5, 2944) .004 .01
Ratee Race (Black vs. Hispanic/Latino vs. White) .995 1.43 (10, 5888) .160 .00CompositeScales
Rater Race x Ratee Race .995 1.48 (10, 5888) .141 .00
Rater Race (White vs. non White) .980 3.72 (16, 2931) < .001 .02
Ratee Race (Black vs. Hispanic/Latino vs. White) .980 1.89 (32, 5862) .002 .01Subscales
Rater Race x Ratee Race .982 1.68 (32, 5862) .010 .01
Note. N = 2,956. F test values represent univariate effects for the Total EI score and multivariateeffects for the composite scales and subscales. Guidelines for evaluating partial 2 are .01 =small; .06 = medium; .14 = large. n/a = not applicable.