Envision the Future of the Moose-Wilson Corridor€¦ · Based on this analysis, ... Death Canyon...
4
Grand Teton National Park Wyoming National Park Service U.S. Department of the Interior Traffic Congestion is frustrating for visitors Insufficient pullouts and parking cause resource damage The visitor capacity system at the Laurance S. Rockefeller Preserve protects resources and the visitor experience THE DRAFT PLAN/EIS PROPOSES A VISITOR CAPACITY FOR THE CORRIDOR TO PRESERVE RESOURCES AND VALUES. The main goal of the planning effort is to preserve the resources and values of the corridor. By managing the number of people in the corridor at one time, park managers can ensure the resources are protected and that visitors have space to enjoy their drive, view wildlife, and park at key destinations. A visitor capacity system is already in use at the Laurance S. Rockefeller Preserve and is an important tool in protecting park resources and providing high quality visitor experiences. Envision the Future of the Moose-Wilson Corridor Moose-Wilson Corridor Draft Visitor Capacity Determination
Transcript of Envision the Future of the Moose-Wilson Corridor€¦ · Based on this analysis, ... Death Canyon...
Grand Teton National Park Wyoming
National Park ServiceU.S. Department of the Interior
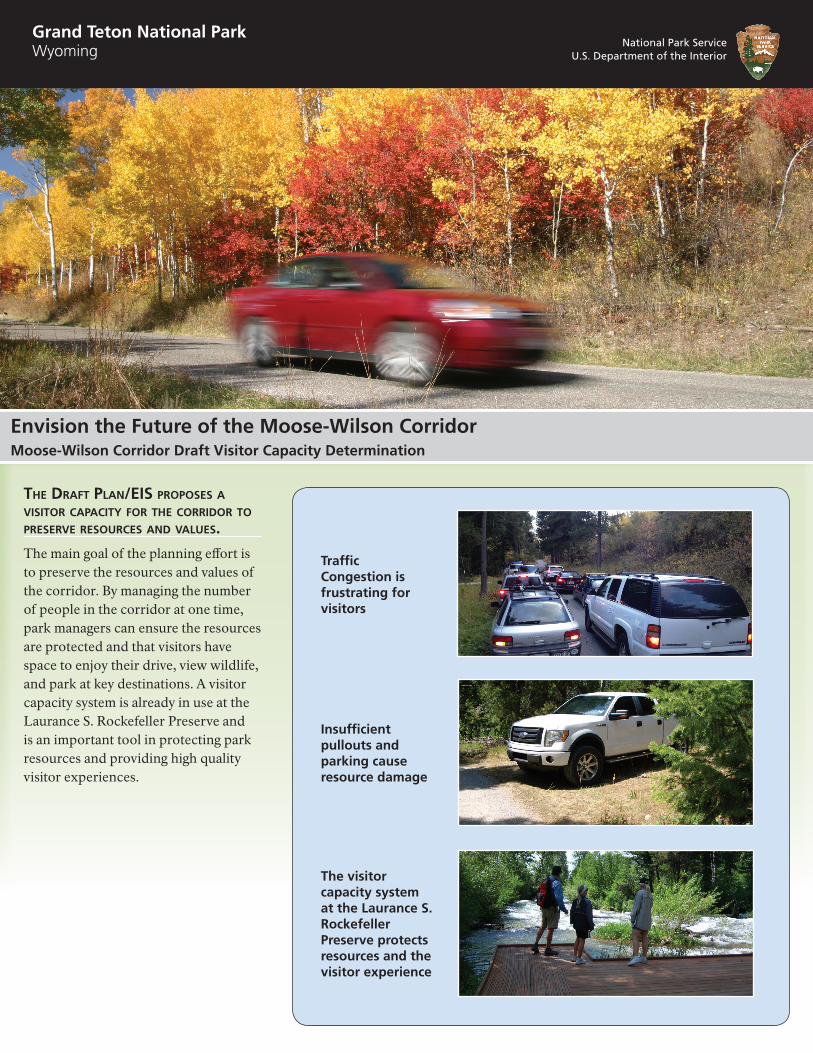
Traffic Congestion is frustrating for visitors
Insufficient pullouts and parking cause resource damage
The visitor capacity system at the Laurance S. Rockefeller Preserve protects resources and the visitor experience
The DrafT Plan/eIS ProPoSeS a vISITor caPacITy for The corrIDor To PreServe reSourceS anD valueS.
The main goal of the planning effort is to preserve the resources and values of the corridor. By managing the number of people in the corridor at one time, park managers can ensure the resources are protected and that visitors have space to enjoy their drive, view wildlife, and park at key destinations. A visitor capacity system is already in use at the Laurance S. Rockefeller Preserve and is an important tool in protecting park resources and providing high quality visitor experiences.
Envision the Future of the Moose-Wilson CorridorMoose-Wilson Corridor Draft Visitor Capacity Determination

The MooSe-WIlSon corrIDor can SuSTaIn currenT vISITor uSe levelS.
The planning team divided the corridor’s visitation into its four major areas: Death Canyon Trailhead, the Laurance S. Rockefeller Preserve, Granite Canyon Trailhead, and Moose-Wilson Road. The team then evaluated the desired resource and visitor experience conditions, current visitor use levels, and potential management strategies for each of these locations.
Based on this analysis, the current level of visitor use at these locations would continue to result in negative impacts on resource conditions and visitor experience. However, potential management strategies such as designated pullouts and improved parking areas, paving the unpaved road segment, and reducing the speed limit were identified to address these impacts and better accommodate current use. The planning team concluded that current use levels could be sustained while still achieving desired conditions if these strategies were implemented.
The capacities for all four locations were added together to inform an overall visitor capacity for the corridor of 550 people at one time. Since personal vehicles are the primary way visitors currently reach the corridor, people at one time was translated to vehicles at one time. When considering each vehicle has an average of 2.7 passengers, the visitor capacity translates to 200 vehicles at one time. The corresponding table and diagram illustrate the capacity determination.
NOTE: Parking lots would be managed for 90% of space during peak use times to allow for fluid traffic movement.
Death Canyon
220 People
80 Vehicles
LSR Preserve
120 People
44 Vehicles
Granite Canyon
50 People
17 Vehicles
Moose-Wilson
Corridor Total
550 People
200 Vehicles
Moose-Wilson Road
(includes Sawmill Ponds and other
turnouts)
160 People
59 Vehicles
Area of AnalysisPeople at One Time
People per Vehicle
Vehicles at One Time
Death Canyon 220 2.7 80
Laurance S. Rockefeller Preserve
120 2.7 44
Granite Canyon 50 2.7 17
Moose-Wilson Road 160 2.7 59
Moose-Wilson Corridor
550 2.7 200
Numbers have been approximated.

The maximum vehicles at one time that were observed in the corridor during summer days:
0
50
100
150
200
250
300
Jun-
7
Jun-
14
Jun-
21
Jun-
28
Jul-5
Jul-1
2
Jul-1
9
Jul-2
6
Aug-
2
Aug-
9
Aug-
16
Aug-
23
Max Vehicles At One Time
Capacity (Average Peak Use)
Moose-Wilson Corridor Daily Traffic Data
Summer 2013
Max
imum
# o
f Veh
icle
s at O
ne T
ime
Date
0 50 100 150 200 250
June
July
August
Average Maximum Number of Vehicles at One Time
Monthly Traffic Data Summer 2013
198
185
152
Max
imum
Num
ber o
f Veh
icle
s at O
ne T
ime
ProjecTeD queuIng WaITS WoulD be ShorT anD WoulD only occur DurIng a feW WeekS of The SuMMer.Federal Highways Administration staff also conducted analysis of potential wait times for queued vehicles (under Alternative C). The results showed that if this system was implemented under current conditions, a wait would occur on 20 to 25 days of the season. These short waits would only occur during the middle of the day, from roughly 11:00 a.m. to 4:00 p.m. The queuing lanes would be designed to accommodate all waiting vehicles within the park.
Year
Number of days in a
summer with a wait
Average wait time in minutes
on a typical busy summer day**
Average wait time in minutes on the busiest day of the
summer**
2013 20-25 5-6 9-10
2020* 35-40 7-8 10-11
2025* 50-60 8-9 11-12
*Projections based on 1.3% annual visitation increases **Average wait times based on time period when there would be a wait of any length
TraffIc voluMe DaTa confIrMS 200 vehIcleS aT one TIMe IS currenT uSe level.
Federal Highways Administration staff further analyzed the data collected by Utah State University in 2013 and 2014 to determine how many vehicles were in the corridor at one time. The results showed that average traffic volume in the corridor during the busiest times of the year was approximately 200 vehicles at one time. This confirmed that the proposed visitor capacity for the corridor would maintain visitation at current average levels seen during peak visitation.

IMPleMenTaTIon of The queuIng SySTeM May Influence vISITor behavIor.It is likely that visitor behavior will change as a result of implementation of the queuing system. While it is impossible to predict precisely how behavior may change in the future, there are a couple of probable outcomes:
1. Visitors may plan their visit either earlier or later in the day or during a less busy day to avoid the queuing system, thereby spreading visitation more evenly through the day, week, or season.
2. During peak times when the queuing system is in effect, visitors looking to make a quick commute may avoid the Moose-Wilson Road altogether and select an alternative route, thereby decreasing the number of vehicles waiting to enter the corridor and the associated wait times.
For illustration purposes only. The visitor capacity could be adjusted after implementation. The Draft Plan / EIS allows for adaptive management of the capacity. Through monitoring, if it is determined that observed conditions do not match desired conditions for the corridor, the National Park Service could adjust the capacity either up or down in order to meet the goals of the plan. For more information please see Appendix A of the Draft Plan/EIS. go.nps.gov/mwplan
0
50
100
150
200
250
6:00AM
8:00AM
10:00AM
12:00PM
2:00PM
4:00PM
6:00PM
8:00PM
10:00PM
Vehi
cles
at O
ne T
ime
Time of Day
Current UsePattern DuringPeak Times
Potential UsePattern withQueuing System
ProposedCapacity
Moose-Wilson Corridor Current and Potential
Use Patterns
For illustration purposes only.
The vISITor caPacITy coulD be aDjuSTeD afTer IMPleMenTaTIon.
The Draft Plan / EIS allows for adaptive management of the capacity. Through monitoring, if it is determined that observed conditions do not match desired conditions for the corridor, the National Park Service could adjust the capacity either up or down in order to meet the goals of the plan.
For more information please see Appendix A of the Draft Plan/EIS. go.nps.gov/mwplan