Environmental, Attitudinal, and Social Context Factors as Predictors of Immigrant Mexican Wives’...
15
Environmental, Attitudinal, Environmental, Attitudinal, and Social Context Factors and Social Context Factors as Predictors of Immigrant as Predictors of Immigrant Mexican Wives’ Personal and Mexican Wives’ Personal and Marital Well-being Marital Well-being Yuliana Rodriguez & Jinni Su University of North Carolina at Greensboro The authors acknowledge Heather Helms, Jill Walls, and Monsy Bonilla. We also thanks the families for their time and participation. Funding provided by a UNCG Regular Faculty Grant and Agricultural Research Service Award (PI, Dr.
-
Upload
kelsi-lodes -
Category
Documents
-
view
223 -
download
0
Transcript of Environmental, Attitudinal, and Social Context Factors as Predictors of Immigrant Mexican Wives’...

Environmental, Attitudinal, and Social Environmental, Attitudinal, and Social Context Factors as Predictors of Context Factors as Predictors of
Immigrant Mexican Wives’ Personal and Immigrant Mexican Wives’ Personal and Marital Well-beingMarital Well-being
Yuliana Rodriguez & Jinni Su
University of North Carolina at Greensboro
The authors acknowledge Heather Helms, Jill Walls, and Monsy Bonilla. We also thanks the families for their time and participation. Funding provided by a UNCG Regular Faculty Grant and Agricultural Research Service Award (PI, Dr. Heather Helms).

FIGURE 1. ADAPTED THREE-LEVEL MODEL FOR VIEWING MARRIAGEFIGURE 1. ADAPTED THREE-LEVEL MODEL FOR VIEWING MARRIAGE11
1From “The Social Ecology of Marriage and Other Intimate Unions” by T. L. Huston, 2000, Journal of Marriage and Family, 62, p. 300. Adapted with permission of the author by Helms, Supple, & Proulx (under review).
B: Individuals
b1: Spouses’ personal qualities
b2: Spouses’ marriage-specific beliefs and attitudes
A: Marital Behavior in the Context of Parenthood
a1: Macrobehavioral patterns
a2: Microbehavioral patterns
C: Macroenvironment
c1: Macrosocietal context c1i: Sociohistorical c1ii: Cultural background cliii: Socioeconomic
c2: Spouses’ ecological nichec2i: Social environmentc2ii: Physical environment
#1
#2
#3
#4
#5
#6

1) Explore individual and environmental factors link to psychological and marital well-being
2) Specific interest in the relation between pressure to acculturate and well-being.
Hierarchical multiple regression analyses are used to address these question.

Variables M SD Range
Age
Wives 28.13 5.463 18– 47
Husbands 30.33 5.79 18 – 48
First born (in years) 5.87 3.88 .08 – 13.64
Years in US
Wives 8.81 4.41 <1 – 22
Husbands 11.40 5.26 2 – 27
Nuclear family size 4.06 .93 3 – 7
Total household size 4.82 1.39 3 – 10

Variables M SD Range
Marital duration (years) 7 3.96 1 – 15
Education (years)
Wives 9.66 3.17 0 – 16
Husbands 9.01 3.18 1 – 18
Work hours (per week)
Wives 38.21 6.35 16 – 60
Husbands 43.15 8.01 20 – 80
Income (annual)
Wives $15,138 $6,559 $2,500 – $31,600
Husbands $24,647 $8,713 $8,000 – $69,000
Family $33,297 $12,725 $8,000 – $83,4000

• Marital Status: 69.2% married, 30.8% cohabiting• Child Gender: 58.3% male, 41.7% female• Ethnicity:
– Wives: 95.8% Mexican, 1.7% Puerto Rican, 2.5% other Latin origin
– Husbands: 93.3% Mexican, .8% Puerto Rican, 5.8% other Latin origin
• Parents’ Birth Place:– Wives: 93.3% Mexico, 4.2% US, 2.5% other Latin country– Husbands: 90.8% Mexico, 3.3% US, 5.8% other Latin country

• Employment Status:– Husbands: 98.3% employed, 1.7% non-employed– Wives: 54.2% employed, 45.8% non-employed
• Acculturation Status:– Wives: 85% Mexican oriented, 13.3%
Mexican/bicultural, 1.7 % slightly Anglo oriented– Husbands: 69.2% Mexican oriented, 29.2%
Mexican/bicultural, 1.7% slightly Anglo oriented

Construct Measure Author Scale & Reliability
Wives’ Love and Conflict Marital Love and Conflict
Love subscale: 9 itemsConflict subscale: 5 items
Braiker & Kelley, 1979
9 point scale, higher scores indicate greater levels of love and conflictLove: α = .86 wivesConflict: α = .59 wives
Wives’ Personal Well-being
Center for Epidemiological Studies Depression Scale (CES-D)12 items (shortened version)
Radloff, 1977 4 point scale, higher scores indicate higher levels of depressive symptomsα = .79 wives
Wives’ Marital Satisfaction
Domains of Satisfaction16 items
Huston, McHale, & Crouter, 1986
9 point scale, higher scores indicated greater levels of satisfactionα = .94 wives

Construct Measure Author Scale & ReliabilityMarriage Work Marriage Work
with FriendHelms, et al., 2003 16 point scale, higher
scores indicated greater levels of marriage work with friendα = .95 wives
Pressure to Acculturate Multidimensional Acculturative Stress Inventory
Pressure to acculturate subscale: 7 items
Rodriguez, Myers, Bingham Mira, Flores, & Garcia-Hernandez, 2002
5 point scale, higher scores indicate greater levels of stressα = .85 wives
Economic Hardship Employment and Financial Information
Financial Strain subscale: 4 items
Conger & Elder, 1994 5 point scale, lower scores indicate a greater level of economic hardship in the past yearα = .88 wives
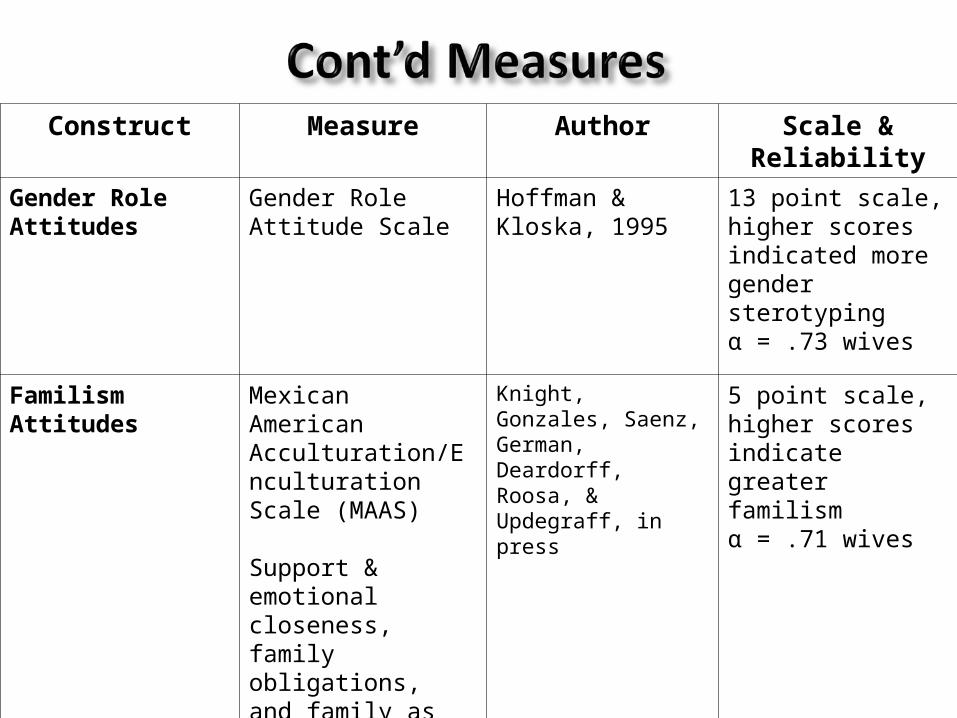
Construct Measure Author Scale & ReliabilityGender Role Attitudes Gender Role Attitude
ScaleHoffman & Kloska, 1995
13 point scale, higher scores indicated more gender sterotypingα = .73 wives
Familism Attitudes Mexican American Acculturation/Enculturation Scale (MAAS)
Support & emotional closeness, family obligations, and family as referrent subscale: 16 items
Knight, Gonzales, Saenz, German, Deardorff, Roosa, & Updegraff, in press
5 point scale, higher scores indicate greater familismα = .71 wives

Wives’ I II III IVEmployment Status .028 .014 .010 .012
Marital Status .181*.181* .091 .061 .891
Family Economic Hardship
.246**.246** .234**.234** .232**.232**
Pressure to Acculturate .226*.226* .214*.214* .203*.203*
Gender Role Attitudes .168+.168+ .174+.174+
Familism Attitudes -.065 -.050
Emotional Support -.147+-.147+
R2 .034 .154 .180 .201
Change in R2 .034 .120***.120*** .026 .021+.021+
Note: +p < .1.*p < .05. **p < .01. ***p < .001.

Wives’ I II III IV
Employment Status -.055 -.054 .019 -.022
Marital Status -.220*-.220* -.189*-.189* -.202*-.202* -.163+
Family Economic Hardship
-.046 -.053 -.049
Pressure to Acculturate
-.098 -.126 -.109
Gender Role Attitudes
-.098 -.098
Familism Attitudes .241*.241* .216*.216*
Emotional Support .244**.244**
R2 .053 .065 .118 .175
Change in R2 .053*.053* .012 .052*.052* .057*.057*
Note: +p < .1.*p < .05. **p < .01. ***p < .001.

Wives’ I II III IV
Employment Status -.117 -.113 -.088 -.091
Marital Status -.218*-.218* -.177+-.177+ -.186*-.186* -.144
Family Economic Hardship
-.090 -.096 -.090
Pressure to Acculturate
-.115 -.135 -.116
Gender Role Attitudes
-.068 -.078
Familism Attitudes .176*.176* .149
Emotional Support .263**.263**
R2 .065 .088 .116 .182
Change in R2 .065*.065* .023 .028 .066**.066**
Note: +p < .1.*p < .05. **p < .01. ***p < .001.

Wives’ I II III IV
Age .090 .072 .070 .040
Number of Kids .057 .061 .060 .059
Pressure to Acculturate -.145 -.162+-.162+ -.189*-.189*
Marriage Work with Friend
.146 .193*.193*
MPTACC*MMWORKF .190*.190*
R2 .015 .036 .057 .089
Change in R2 .015 .021 .021 .032*.032*
Note: +p < .1.*p < .05. **p < .01. ***p < .001.