Environmental assessment tools for the evaluation and
18
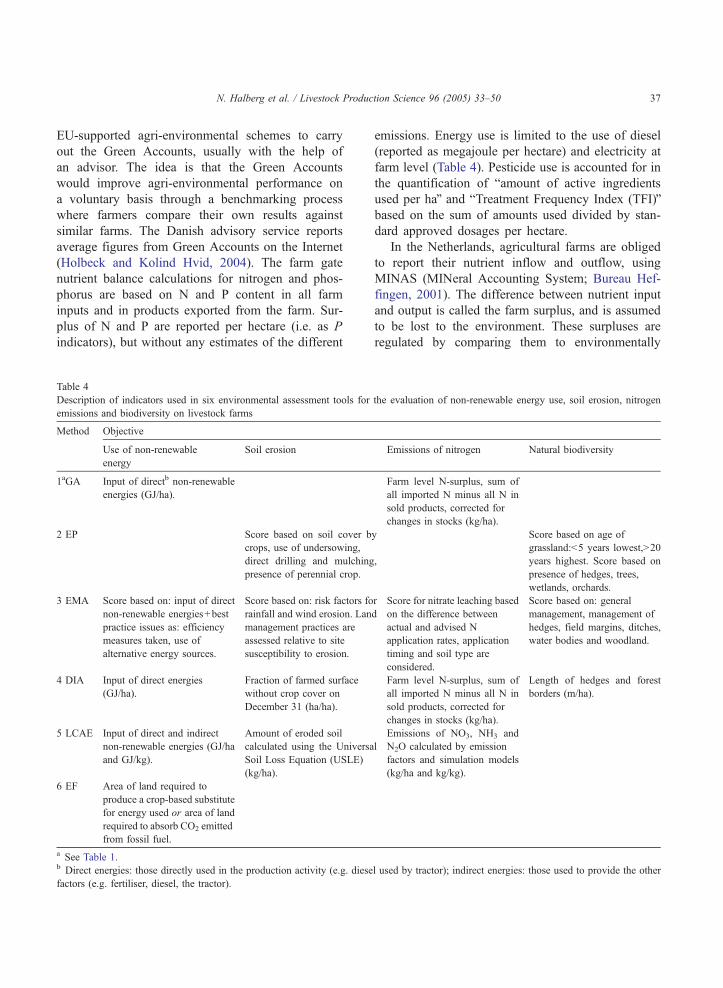
Environmental assessment tools for the evaluation and improvement of European livestock production systems Niels Halberg a, * , Hayo M.G. van der Werf b , Claudine Basset-Mens b , Randi Dalgaard a , Imke J.M. de Boer c a Danish Institute of Agricultural Sciences, Denmark b Institut National de la Recherche Agronomique, Rennes, France c Animal Production Systems Group, Wageningen University and Research Center, The Netherlands Abstract Different types of assessment tools have been developed in Europe with the purpose of determining the environmental impact of various livestock production systems at farm level. The assessment tools differ in terms of which environmental objectives are included and how indicators are constructed and interpreted. The paper compares typical tools for environmental assessment of livestock production systems, and recommends selected indicators suitable for benchmarking. The assessment tools used very different types of indicators ranging from descriptions of farm management and quantification of input to estimates of emissions of, e.g., nitrate and ammonia. The indicators should be useful in a benchmarking process where farmers may improve their practices through learning from farms with better agri-environmental performance. An example of this is given using data on P-surplus on pig farms. Some indicators used the area of the farm as the basis of the indicator—e.g. nitrogen surplus per hectare—while others were expressed per unit produced, e.g. emission of greenhouse gasses per kilogram milk. The paper demonstrates that a comparison of organic vs. conventional milk production and comparison of three pig production systems give different results, depending on the basis of the indicators (i.e. per hectare or per kilogram product). Indicators linked to environmental objectives with a local or regional geographical target should be area-based—while indicators with a global focus should be product-based. It is argued that the choice of indicators should be linked with the definition of the system boundaries, in the sense that area-based indicators should include emissions on the farm only, whereas product-based indicators should preferably include emissions from production of farm inputs, as well as the inputs on the actual farm. The paper ends with recommendations for choice of agri-environmental indicators taking into account the geographical scale, system boundary and method of interpretation. D 2005 Elsevier B.V. All rights reserved. Keywords: Environmental assessment tools; Livestock production systems; Life Cycle Assessment, LCA; Indicators; Product oriented; Green accounts; Nutrient balance; Emissions; Greenhouse gasses; Organic farming 0301-6226/$ - see front matter D 2005 Elsevier B.V. All rights reserved. doi:10.1016/j.livprodsci.2005.05.013 * Corresponding author. Tel.: +45 89 99 12 06. E-mail addresses: [email protected] (N. Halberg), [email protected] (I.J.M. de Boer). Livestock Production Science 96 (2005) 33 – 50 www.elsevier.com/locate/livprodsci
Transcript of Environmental assessment tools for the evaluation and

www.elsevier.com/locate/livprodsci
Livestock Production Scie
Environmental assessment tools for the evaluation and
improvement of European livestock production systems
Niels Halberg a,*, Hayo M.G. van der Werf b, Claudine Basset-Mens b,
Randi Dalgaard a, Imke J.M. de Boer c
aDanish Institute of Agricultural Sciences, DenmarkbInstitut National de la Recherche Agronomique, Rennes, France
cAnimal Production Systems Group, Wageningen University and Research Center, The Netherlands
Abstract
Different types of assessment tools have been developed in Europe with the purpose of determining the environmental
impact of various livestock production systems at farm level. The assessment tools differ in terms of which environmental
objectives are included and how indicators are constructed and interpreted. The paper compares typical tools for environmental
assessment of livestock production systems, and recommends selected indicators suitable for benchmarking. The assessment
tools used very different types of indicators ranging from descriptions of farm management and quantification of input to
estimates of emissions of, e.g., nitrate and ammonia. The indicators should be useful in a benchmarking process where farmers
may improve their practices through learning from farms with better agri-environmental performance. An example of this is
given using data on P-surplus on pig farms. Some indicators used the area of the farm as the basis of the indicator—e.g. nitrogen
surplus per hectare—while others were expressed per unit produced, e.g. emission of greenhouse gasses per kilogram milk. The
paper demonstrates that a comparison of organic vs. conventional milk production and comparison of three pig production
systems give different results, depending on the basis of the indicators (i.e. per hectare or per kilogram product). Indicators
linked to environmental objectives with a local or regional geographical target should be area-based—while indicators with a
global focus should be product-based. It is argued that the choice of indicators should be linked with the definition of the system
boundaries, in the sense that area-based indicators should include emissions on the farm only, whereas product-based indicators
should preferably include emissions from production of farm inputs, as well as the inputs on the actual farm. The paper ends
with recommendations for choice of agri-environmental indicators taking into account the geographical scale, system boundary
and method of interpretation.
D 2005 Elsevier B.V. All rights reserved.
Keywords: Environmental assessment tools; Livestock production systems; Life Cycle Assessment, LCA; Indicators; Product oriented; Green
accounts; Nutrient balance; Emissions; Greenhouse gasses; Organic farming
0301-6226/$ - s
doi:10.1016/j.liv
* Correspondi
E-mail addre
nce 96 (2005) 33–50
ee front matter D 2005 Elsevier B.V. All rights reserved.
prodsci.2005.05.013
ng author. Tel.: +45 89 99 12 06.
sses: [email protected] (N. Halberg), [email protected] (I.J.M. de Boer).

N. Halberg et al. / Livestock Production Science 96 (2005) 33–5034
1. Introduction
As one of the responses to the strong focus on
agri-environmental issues in Europe, different envi-
ronmental assessment tools have been developed in
order to determine the environmental impact of var-
ious livestock production systems. Some assessment
tools are targeted for use at national or EU level for
guiding policy (e.g. the set of agri-environmental
indicators under the acronym bIRENAQ; Indicator
Reporting on the integration of Environmental con-
cerns into Agricultural policy; EEA, 2004b, in press)
or for diagnosis of agricultural systems. Other envi-
ronmental assessment tools have been developed
with the aim of improving farm management by
supplying information to the farmer or advisor
(Van der Werf and Petit, 2002; Goodlass et al.,
2003). For each target group, effective environmental
assessment tools are required in order to improve
knowledge on environmental impact of current pro-
duction systems and to find solutions to reduce the
negative impacts. Assessment tools not only differ in
target group, they also vary in their focus on envi-
ronmental issues, and in the basic choice of indicator
types (Halberg et al., 2005). It is therefore problem-
atic that for several of these tools no explicit argu-
mentation is given for target group, environmental
issues and indicator types chosen.
Most indicators are process-oriented and use a
land-based scaling of the agri-environmental topics
(e.g. nutrient surplus per hectare, energy use per
hectare) and include only on-farm emissions, mean-
ing that emissions associated with the production of
inputs (e.g. concentrated feed, fertiliser) are not con-
sidered. However, there is an increasing interest in
product-oriented and life cycle based environmental
assessments (LCA), because there is a need to eval-
uate global emissions and impacts from the whole
production chain in relation to types and amounts of
products consumed. The recent EU communication
on Integrated Product Policy (IPP; Anonymous,
2003) states that
All products cause environmental degradation in some
way, whether from their manufacturing, use or dis-
posal. Integrated Product Policy (IPP) seeks to mini-
mise these by looking at all phases of a products’ life-
cycle and taking action where it is most effective.
Product-oriented assessment is often based on
LCA and expresses resource use and emissions per
unit of product, e.g. greenhouse gas emission per
kilogram pork. Several LCA studies on food have
been published (De Boer, 2003; Halberg, 2004) and
some indicator tools for agri-environmental assess-
ment are (partly) based on LCA methodology.
The overall aim of this paper is to give a critical
evaluation and guidelines for efficient use of agri-
environmental indicator types and tools. More specif-
ically the paper will:
! Give a state-of-the-art overview of different envi-
ronmental assessment tools for improved diagno-
sis, development, advice and management of
livestock farming systems.
! Discuss how to improve the agri-environmental
performance of livestock farming systems using
benchmarking based on the variation in indicator
values between comparable farms.
! Compare the land-based (input output accounting/
green accounts, etc.) and the product-oriented
(LCA) approaches and indicators.
! Give recommendations for future development and
harmonisation of agri-environmental evaluation
tools for livestock farming for use in extension,
diagnosis and research.
2. Indicator tools for environmental assessment of
livestock systems
The relation between agricultural activities and
their environmental impact is not simple and usually
it is not possible to directly measure the environmen-
tal impact caused by a farm because most of the
emissions are diffuse. Therefore, indicators are used
to give information regarding the relation between a
certain agricultural activity and its impact on resource
use and environment. The idea of using indicators is
thus based on the need to simplify complex phenom-
ena and quantify information, so that its significance
is more readily apparent. As stated by Stolze et al.
(2000):
An indicator is a value derived from parameters,
which points to the state of the environment with a
significance extending beyond that directly associated
with a parameter value.

Table 1
Agri-environmental indicators used at national and EU level in the monitoring of environmental impacts of agriculture by the European
Environment Agency1
Driving force2 Pressure State Impact Response
Fertiliser use per hectare Nitrogen and
phosphorus surplus
Nitrates in water No. wild species
in fields
Area under organic farming
Pesticide use per hectare Pesticide residues in water b% farmers under Agri-Env. SchemesQEnergy use per hectare
b% farms specialised
in livestockQNitrate and
ammonia emission
% soil organic matter b% of Natura 2000 sites in
agricultural landQ
1. EEA, 2003; 2. EEA, 2004b, in press; See text for explanation of the different phases.
N. Halberg et al. / Livestock Production Science 96 (2005) 33–50 35
An indicator, therefore, is not simply any parame-
ter one could imagine measuring, but one that should
be selected according to specific needs for information
related to certain objectives. The European Environ-
mental Agency is presently developing a list of agri-
environmental indicators, bIRENAQ (EEA, 2004b, inpress), following the principles of the Driving-Force-
Pressure-State-Impact-Response (DPSIR) concept
(Smeets et al., 1999). The DPSIR framework is used
as a structure for the selection of environmental indi-
cators based on whether an indicator describes an
agro-economic Driving force (D, e.g. the causes),
the environmental Pressure (P, e.g. emissions of pol-
lutants), the State (S, or quality) of the environment/
recipient, the Impact (I) this has on the health of
Table 2
Characteristics of indicator-based environmental assessment tools for use
Assessment tools Characteristics of the assessment tool
Start date No. Farmers
using method
Intended
1.bGA Green accounts for farms 1999 600 Farmers,
advisors
2. EP Ecopoints 1990 1500 Farmers,
governme
3. EMA Environmental
Management for Agriculture
1997 5000 Farmer a
farmers
4. DIA DIALECTE 1994 1000 Farmer a
5. LCAE LCA for Environmental
farm management
1998 13 Farmer a
researche
6. EF Ecological Footprint 1996 ? Research
a Symbols indicate the extent to which an effect is taken into account,+: eff
is not considered.b 1, Anonymous (2000); 2, Mayrhofer et al. (1996); 3, Lewis and Bardon (1
(1996).
people, animals and ecosystems or a Response (R)
to degraded environment in the form of policies and
targets. The concept builds on the idea that indicator
selection should be guided by the cause–effect rela-
tionships between the D and their related P on the one
hand, and the changes in the S and the resulting I on
the other hand. In this way the selection of proper D
and P indicators should help to foresee and predict
important negative changes in the environment in due
time. As shown in Table 1, the fertiliser and pesticide
use are D indicators while the EEA uses the nutrient
surplus and estimates of greenhouse gas emissions as
P indicators.
The EEA has also defined some S and I indicators,
such as the level of nitrate in water and the level of C
in livestock production systems
users Time/year
for data
collection
Basis of
indicators
Scale of environmental
effects considered
Local/regionala Global
farmer 2–3 h Inputs + 0
local
nt
1–2 days Farmer practices + 0
dvisors, b1 day Farmer practices + + /0
dvisors 1 day Inputs/farmer
practices
+ +
dvisors,
rs
N2 days Effects + /0 +
ers b1 day Effects 0 +
ect is considered,+ /0: effect is considered to a minor degree, 0: effect
998); 4, Solagro (2000); 5, Rossier (1999), 6, Wackernagel and Rees

Table 3
Environmental aspects included in six environmental assessment
tools for agriculture grouped as input related, emission related, and
related to the state of the system
Environmental aspect Assessment tool
Ga E E D L E
A P M I C F
A A A
E Total
Input related (Driving force)
Use of non-renewable energy Ab x x x x x 5
Use of other non-renewable
resources (P) A
x 1
Soil erosion A x x x 3
Land use A (\) x) x x 3
Water use \ (A) x) x x 3
Nitrogen fertiliser use \ x x 2
Use of manure \ x x 2
Pesticide use A x x x x 4
Emission related (Pressure)
Surplus of Nitrogen and/or
Phosphorus A
x 1
Emission of greenhouse gases A x x 2
Emission of ozone depleting gases A x 1
Emission of acidifying gases A x x 2
Emission of nutrifying substances A x x 2
Emissions concerning terrestrial
ecotoxicity A
x 1
Emissions concerning aquatic
ecotoxicity A
x 1
Emissions concerning human toxicity A x 1
Waste production A and utilisation z x) x 2
System state related (State)
Landscape quality x x 2
Natural biodiversity x x 2
Agricultural biodiversity x x 2
Water quality x 1
Soil quality x x 2
An x indicates that the objective is taken into account. The notion x)
indicates that the objective is only included if the farmer selects it.a See Table 1.b A, objective to be minimised; \, objective to be optimised; z,
objective to be maximised.
N. Halberg et al. / Livestock Production Science 96 (2005) 33–5036
in soils, and as R indicators the percentage of organic
farming and the number of farms participating in agri-
environmental schemes are considered. The full list of
indicators may be found in EEA (2004b, in press).
The IRENA indicators are to be used at a high hier-
archical level (regions and countries) and the list
cannot be used as a blueprint for selection of indica-
tors for farm level management tools or green
accounts. But this EEA framework may be used to
compare the selection of indicators at farm level and
to better understand the objectives of using specific
indicators vis-a-vis the cause–effect relations in the
DPSIR scheme.
A large variety exists—at both methodological and
operational levels—within agri-environmental indica-
tors used in farm level assessment tools for improved
farm management and advice as reviewed recently by
Van der Werf and Petit (2002) and Halberg et al.
(2005). Most indicators are embedded in a diagnosis
tool for either research or advisory purposes with
procedures for calculation and presentation of the
results for a specific farm over a period of time,
usually a year. While a large number of such tools
have been developed, only a small proportion address
livestock farming systems and the important interac-
tions between crop and livestock production (Good-
lass et al., 2003). Tables 2 and 3 give an overview of
six indicator systems selected to illustrate different
approaches suitable for the assessment of livestock
systems. Some of these farm level agri-environmental
assessment tools use indicators based on quantifica-
tion of inputs or emissions, e.g. nutrient surplus and
potential losses and energy use per hectare. Other
tools are based on recordings of the farmers’ activi-
ties, farmer practices, e.g. whether the farmer uses soil
covers or direct drilling methods. The tools also differ
in the environmental aspects they address (Table 3);
the GA and the LCA-based tool focus on Pressure
indicators, while the other tools focus on Driving
forces or changes in the State of e.g. landscape,
biodiversity or soil on the farm. Only methods that
were sufficiently different from each other, well-docu-
mented and showing proof of having been actually
used or at least tested for assessment purposes were
retained. For some of the types of assessment tools
several specific tools have been developed indepen-
dently in Europe and the one presented here is simply
chosen as an example.
2.1. Green accounts for farms (GA)
The Danish Green Accounts is a farmer tool to
calculate and report nutrient balances and the use of
energy and pesticides in the form of indicators based
on the actual input and yields on the farm. Farmers
are subsidized up to 1000 euro per year under the
N. Halberg et al. / Livestock Production Science 96 (2005) 33–50 37
EU-supported agri-environmental schemes to carry
out the Green Accounts, usually with the help of
an advisor. The idea is that the Green Accounts
would improve agri-environmental performance on
a voluntary basis through a benchmarking process
where farmers compare their own results against
similar farms. The Danish advisory service reports
average figures from Green Accounts on the Internet
(Holbeck and Kolind Hvid, 2004). The farm gate
nutrient balance calculations for nitrogen and phos-
phorus are based on N and P content in all farm
inputs and in products exported from the farm. Sur-
plus of N and P are reported per hectare (i.e. as P
indicators), but without any estimates of the different
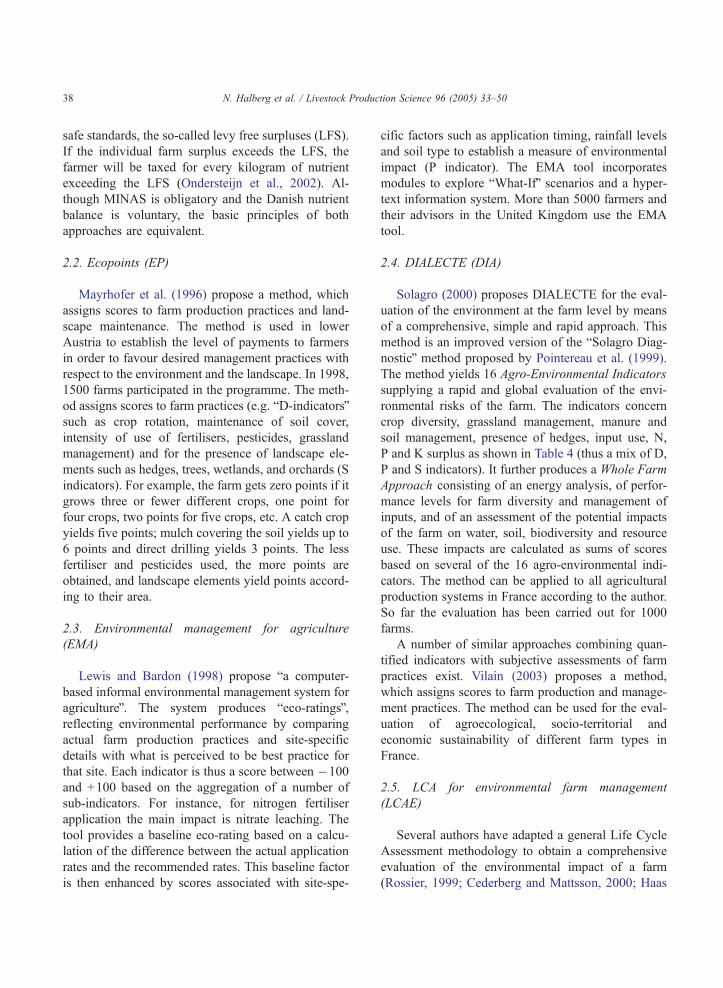
Table 4
Description of indicators used in six environmental assessment tools for
emissions and biodiversity on livestock farms
Method Objective
Use of non-renewable
energy
Soil erosion
1aGA Input of directb non-renewable
energies (GJ/ha).
2 EP Score based on soil cover b
crops, use of undersowing,
direct drilling and mulching
presence of perennial crop.
3 EMA Score based on: input of direct
non-renewable energies+best
practice issues as: efficiency
measures taken, use of
alternative energy sources.
Score based on: risk factors fo
rainfall and wind erosion. Lan
management practices are
assessed relative to site
susceptibility to erosion.
4 DIA Input of direct energies
(GJ/ha).
Fraction of farmed surface
without crop cover on
December 31 (ha/ha).
5 LCAE Input of direct and indirect
non-renewable energies (GJ/ha
and GJ/kg).
Amount of eroded soil
calculated using the Universa
Soil Loss Equation (USLE)
(kg/ha).
6 EF Area of land required to
produce a crop-based substitute
for energy used or area of land
required to absorb CO2 emitted
from fossil fuel.
a See Table 1.b Direct energies: those directly used in the production activity (e.g. diese
factors (e.g. fertiliser, diesel, the tractor).
emissions. Energy use is limited to the use of diesel
(reported as megajoule per hectare) and electricity at
farm level (Table 4). Pesticide use is accounted for in
the quantification of bamount of active ingredients
used per haQ and bTreatment Frequency Index (TFI)Qbased on the sum of amounts used divided by stan-
dard approved dosages per hectare.
In the Netherlands, agricultural farms are obliged
to report their nutrient inflow and outflow, using
MINAS (MINeral Accounting System; Bureau Hef-
fingen, 2001). The difference between nutrient input
and output is called the farm surplus, and is assumed
to be lost to the environment. These surpluses are
regulated by comparing them to environmentally
the evaluation of non-renewable energy use, soil erosion, nitrogen
Emissions of nitrogen Natural biodiversity
Farm level N-surplus, sum of
all imported N minus all N in
sold products, corrected for
changes in stocks (kg/ha).
y
,
Score based on age of
grassland:b5 years lowest,N20
years highest. Score based on
presence of hedges, trees,
wetlands, orchards.
r
d
Score for nitrate leaching based
on the difference between
actual and advised N
application rates, application
timing and soil type are
considered.
Score based on: general
management, management of
hedges, field margins, ditches,
water bodies and woodland.
Farm level N-surplus, sum of
all imported N minus all N in
sold products, corrected for
changes in stocks (kg/ha).
Length of hedges and forest
borders (m/ha).
l
Emissions of NO3, NH3 and
N2O calculated by emission
factors and simulation models
(kg/ha and kg/kg).
l used by tractor); indirect energies: those used to provide the other
N. Halberg et al. / Livestock Production Science 96 (2005) 33–5038
safe standards, the so-called levy free surpluses (LFS).
If the individual farm surplus exceeds the LFS, the
farmer will be taxed for every kilogram of nutrient
exceeding the LFS (Ondersteijn et al., 2002). Al-
though MINAS is obligatory and the Danish nutrient
balance is voluntary, the basic principles of both
approaches are equivalent.
2.2. Ecopoints (EP)
Mayrhofer et al. (1996) propose a method, which
assigns scores to farm production practices and land-
scape maintenance. The method is used in lower
Austria to establish the level of payments to farmers
in order to favour desired management practices with
respect to the environment and the landscape. In 1998,
1500 farms participated in the programme. The meth-
od assigns scores to farm practices (e.g. bD-indicatorsQsuch as crop rotation, maintenance of soil cover,
intensity of use of fertilisers, pesticides, grassland
management) and for the presence of landscape ele-
ments such as hedges, trees, wetlands, and orchards (S
indicators). For example, the farm gets zero points if it
grows three or fewer different crops, one point for
four crops, two points for five crops, etc. A catch crop
yields five points; mulch covering the soil yields up to
6 points and direct drilling yields 3 points. The less
fertiliser and pesticides used, the more points are
obtained, and landscape elements yield points accord-
ing to their area.
2.3. Environmental management for agriculture
(EMA)
Lewis and Bardon (1998) propose ba computer-
based informal environmental management system for
agricultureQ. The system produces beco-ratingsQ,reflecting environmental performance by comparing
actual farm production practices and site-specific
details with what is perceived to be best practice for
that site. Each indicator is thus a score between �100
and +100 based on the aggregation of a number of
sub-indicators. For instance, for nitrogen fertiliser
application the main impact is nitrate leaching. The
tool provides a baseline eco-rating based on a calcu-
lation of the difference between the actual application
rates and the recommended rates. This baseline factor
is then enhanced by scores associated with site-spe-
cific factors such as application timing, rainfall levels
and soil type to establish a measure of environmental
impact (P indicator). The EMA tool incorporates
modules to explore bWhat-IfQ scenarios and a hyper-
text information system. More than 5000 farmers and
their advisors in the United Kingdom use the EMA
tool.
2.4. DIALECTE (DIA)
Solagro (2000) proposes DIALECTE for the eval-
uation of the environment at the farm level by means
of a comprehensive, simple and rapid approach. This
method is an improved version of the bSolagro Diag-
nosticQ method proposed by Pointereau et al. (1999).
The method yields 16 Agro-Environmental Indicators
supplying a rapid and global evaluation of the envi-
ronmental risks of the farm. The indicators concern
crop diversity, grassland management, manure and
soil management, presence of hedges, input use, N,
P and K surplus as shown in Table 4 (thus a mix of D,
P and S indicators). It further produces a Whole Farm
Approach consisting of an energy analysis, of perfor-
mance levels for farm diversity and management of
inputs, and of an assessment of the potential impacts
of the farm on water, soil, biodiversity and resource
use. These impacts are calculated as sums of scores
based on several of the 16 agro-environmental indi-
cators. The method can be applied to all agricultural
production systems in France according to the author.
So far the evaluation has been carried out for 1000
farms.
A number of similar approaches combining quan-
tified indicators with subjective assessments of farm
practices exist. Vilain (2003) proposes a method,
which assigns scores to farm production and manage-
ment practices. The method can be used for the eval-
uation of agroecological, socio-territorial and
economic sustainability of different farm types in
France.
2.5. LCA for environmental farm management
(LCAE)
Several authors have adapted a general Life Cycle
Assessment methodology to obtain a comprehensive
evaluation of the environmental impact of a farm
(Rossier, 1999; Cederberg and Mattsson, 2000; Haas
N. Halberg et al. / Livestock Production Science 96 (2005) 33–50 39
et al., 2000; De Boer, 2003; Dalgaard et al., 2004).
The method allows the identification of the main
pollution sources through the chain (including pro-
duction of farm inputs) as far as the farm gate and the
evaluation of possible modifications of the farms or
farming methods. Rossier (1999) applied the LCA
approach to 13 crop, animal and mixed farms in
Switzerland and in Denmark the system of Green
Accounts has been supplemented with a tool for
performing LCA on the farms, which has been tested
on 20 private farms. These tools are, however, not
widely used by farmers or advisors so far. In the
Netherlands, for example, an energy yardstick has
been developed, which applies an LCA based assess-
ment of energy use. This yardstick has been tested on
livestock production systems only, and is not used
widely on commercial farms yet (Hanegraaf et al.,
1996).
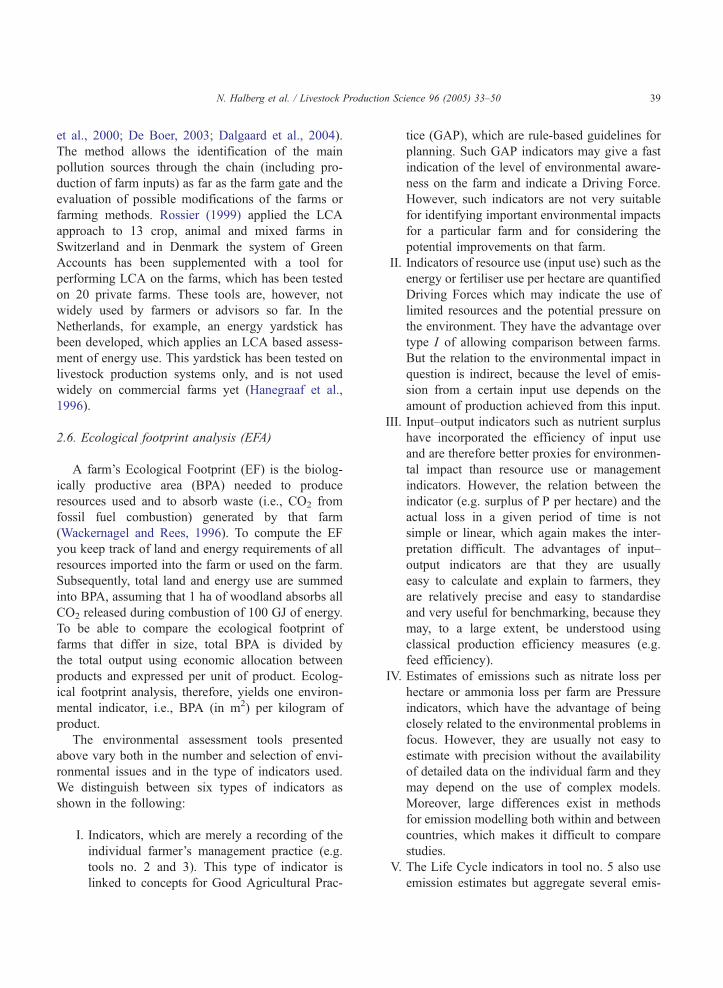
2.6. Ecological footprint analysis (EFA)
A farm’s Ecological Footprint (EF) is the biolog-
ically productive area (BPA) needed to produce
resources used and to absorb waste (i.e., CO2 from
fossil fuel combustion) generated by that farm
(Wackernagel and Rees, 1996). To compute the EF
you keep track of land and energy requirements of all
resources imported into the farm or used on the farm.
Subsequently, total land and energy use are summed
into BPA, assuming that 1 ha of woodland absorbs all
CO2 released during combustion of 100 GJ of energy.
To be able to compare the ecological footprint of
farms that differ in size, total BPA is divided by
the total output using economic allocation between
products and expressed per unit of product. Ecolog-
ical footprint analysis, therefore, yields one environ-
mental indicator, i.e., BPA (in m2) per kilogram of
product.
The environmental assessment tools presented
above vary both in the number and selection of envi-
ronmental issues and in the type of indicators used.
We distinguish between six types of indicators as
shown in the following:
I. Indicators, which are merely a recording of the
individual farmer’s management practice (e.g.
tools no. 2 and 3). This type of indicator is
linked to concepts for Good Agricultural Prac-
tice (GAP), which are rule-based guidelines for
planning. Such GAP indicators may give a fast
indication of the level of environmental aware-
ness on the farm and indicate a Driving Force.
However, such indicators are not very suitable
for identifying important environmental impacts
for a particular farm and for considering the
potential improvements on that farm.
II. Indicators of resource use (input use) such as the
energy or fertiliser use per hectare are quantified
Driving Forces which may indicate the use of
limited resources and the potential pressure on
the environment. They have the advantage over
type I of allowing comparison between farms.
But the relation to the environmental impact in
question is indirect, because the level of emis-
sion from a certain input use depends on the
amount of production achieved from this input.
III. Input–output indicators such as nutrient surplus
have incorporated the efficiency of input use
and are therefore better proxies for environmen-
tal impact than resource use or management
indicators. However, the relation between the
indicator (e.g. surplus of P per hectare) and the
actual loss in a given period of time is not
simple or linear, which again makes the inter-
pretation difficult. The advantages of input–
output indicators are that they are usually
easy to calculate and explain to farmers, they
are relatively precise and easy to standardise
and very useful for benchmarking, because they
may, to a large extent, be understood using
classical production efficiency measures (e.g.
feed efficiency).
IV. Estimates of emissions such as nitrate loss per
hectare or ammonia loss per farm are Pressure
indicators, which have the advantage of being
closely related to the environmental problems in
focus. However, they are usually not easy to
estimate with precision without the availability
of detailed data on the individual farm and they
may depend on the use of complex models.
Moreover, large differences exist in methods
for emission modelling both within and between
countries, which makes it difficult to compare
studies.
V. The Life Cycle indicators in tool no. 5 also use
emission estimates but aggregate several emis-

N. Halberg et al. / Livestock Production Science 96 (2005) 33–5040
sions into impact categories. Moreover, the
impacts are often aggregated over several pro-
cesses in the production chain and expressed per
kilogram of product. The difference between
this indicator type and the area-based input–
output and emission indicators are discussed
below.
VI. A few examples of (Environmental) State indi-
cators are used such as the percentage of small
biotopes (hedges, ponds, etc.) or the presence of
landscape elements in tools nos. 2–4. Some of
the indicator tools above do not speak of
bevaluation of environmental impactQ but use
the expression bevaluation of ecological (or en-
vironmental) sustainabilityQ. Although this ex-
pression is not always clearly defined, it
obviously envisages a situation in which envi-
ronmental impact is limited to an acceptable
level. As environmental sustainability is not a
measurable entity in itself, most assessment
tools use environmental indicators to evaluate
environmental impact of contrasting production
systems and to identify possible reasons for
variation within and between production sys-
tems (Mitchell et al., 1995; Bell and Morse,
1999; OECD, 2000).
Most of the environmental assessment tools are
meant for voluntary use, but only few attempts have
been made to verify that these tools are actually used
to improve the environmental performance (Halberg
et al., 2005). The most promising tools seem to be the
ones that are linked with production-oriented planning
tools used in collaboration with local advisors. This is
because the indicators on a given farm need to be
interpreted in relation to both the objectives behind
the indicator and the potential for improvement of the
environmental performance on the particular farm.
This process of benchmarking is discussed in the
following section.
3. Using indicators for improving livestock farming
systems: from diagnosis to development
The indicator tools described above may all be
used to characterise different farming systems in rela-
tion to the objectives chosen, which may lead to a
diagnosis of problematic issues. However, it is not
evident how this may lead to improvements in the
farming systems involved, i.e. going from diagnosis to
development. The first step in this process will often
be to identify reference values to compare the indica-
tor value achieved on a specific farm with (e.g. public
limits for emissions, estimated results when the farm
follows norms for GAP, the variation among similar
farms. . .). One method for this purpose is called
benchmarking, which is the process of learning from
farms with better agri-environmental performance in
one or more indicators according to the following
definition: bBenchmarking is the process of improving
performance by continuously identifying, understand-
ing and adapting outstanding practices and processes
found inside and outside the organisationQ (Amer.
Prod and Quality Center, 1999, cit. EEA, 2001).
Thus, benchmarking is more than just comparing
numbers from different companies (farms); it involves
the process of identifying bbest practicesQ, under-
standing differences between farms, learning from
an analysis of the reasons for this difference, setting
goals for oneself based on the results achieved by
others, and hence improving own practices. There-
fore, for indicator tools to be useful for the develop-
ment of environmentally improved farming systems,
there should be a strong and known relation between
the farming practice (i.e. the farm management) and
the level of the indicator on a specific farm. Moreover,
it should be possible to link the variation between
farms/farming systems in their indicator values to
differences in farm management or system properties.
This is indeed the case for some important input–
output based indicators, which has been shown in
studies of farm data (Halberg et al., 1995; Halberg,
1999; Haas et al., 2000; Schroder et al., 2003; De
Boer et al., 2004).
As an example of the benchmarking approach, the
variation in farm gate P-surplus per hectare among
Danish Pilot farms is shown in Fig. 1 (Nielsen, un-
published; Nielsen and Kristensen, 2005). The P-sur-
plus increased—not surprisingly—with increased
stocking density defined by livestock production per
hectare. However, there is a difference between pig
farms with identical stocking density (seen as the
vertical variation at points on the X-axis, e.g. 1 Live-
stock Unit (LU) per ha. The two pig farms marked A
and B both use manure from around 1 LU per ha of

5
1620
29
-20
-10
0
10
20
30
40
0 0,5 1,5 2,51 2
Stocking rate LSU per ha
Far
m g
ate
P S
urpl
us, K
g P
per
ha
Pig farms
Dairy farms
Farm A(Fattening)
Farm B(Fattening)
Farm C (Sows)
Farm D (Sows)
Fig. 1. Farm gate P-surplus in kilogram P per hectare by farm type and stocking density after net manure sale. Data from Danish pilot farms
(1998–2003), observations are averages over 2–5 years per farm. Nielsen, unpublished.
N. Halberg et al. / Livestock Production Science 96 (2005) 33–50 41
fattening pigs (after correction for manure export) and
should, therefore, have approximately the same farm
gate P-surplus per hectare if they follow the same
norms for feeding and fertilisation. Obviously, this is
not the case; farm B has a higher P surplus per hectare
than A (16 vs. 5 kg P per ha per year respectively).
The reason for this difference can be explored by
comparing the use of P on the two farms. Since the
farms use almost the same amount of pig manure per
hectare and purchase very little P fertiliser (results not
shown), the reason for different farm level P-surpluses
should be found in the P-efficiency in the crops and/or
in the feeding practices. When calculating the herd-
level P balances of the yearly pig production, it
becomes clear that farm B supplies more P in manure
5
1620
-20
-10
0
10
20
30
40
0 10 20 30 4
P supplied with manure,
Far
m g
ate
P S
urpl
us, K
g P
per
ha
Fig. 2. Farm gate P-surplus in kilogram P per hectare by farm type and amo
2003), observations are averages over 2–5 years per farm. Nielsen, unpub
to the crops than farm A does. As shown in Fig. 2,
Farm B supplies 20 kg P per ha compared with 30 kg
P from farm A, even though they had identical stock-
ing density (Fig. 1). Thus, there should be a potential
for farm B to reduce the farm level P surplus simply
by optimising the supply of P in feed and minerals.
The same picture emerges when comparing the piglet
production of Sow farms C and D.
To move from the stage of understanding why
some farms perform better than others as measured
by a specific indicator to the task of actually improv-
ing the agri-environmental performance on a farm
(either voluntarily or by regulation), it is necessary
to link the diagnostic assessment tools to on-farm
management strategies (Børsting et al., 2003; Schro-
29
0 50 60
kg per ha
Pig farms
Dairy farms
Farm A(Fattening)
Farm B(Fattening)
Farm C (Sows)
Farm D (Sows)
unt of P supplied with manure. Data from Danish pilot farms (1998–
lished.

N. Halberg et al. / Livestock Production Science 96 (2005) 33–5042
der et al., 2003; Halberg et al., 2005). Model-based
research has already indicated that, for example, the
surplus of N and P per hectare could be mitigated by
tactical and operational management (Van der Meer
and Van der Putten, 1995; Halberg and Jensen, 1996;
Børsting et al., 2003; Schroder et al., 2003). In addi-
tion, a demonstration project in the Netherlands, re-
ferred to as dCows and OpportunitiesT, showed that
use of nutrient accounting in combination with farm
specific management advice, i.e., a detailed fertilisa-
tion scheme, significantly reduced individual farm
surpluses (Hanegraaf and den Boer, 2003). Likewise,
the use of the Dutch farm energy use analysis tool btheEnergy YardstickQ has shown that it is possible to
include the objective of energy savings in farm plan-
ning (Hanegraaf et al., 1996).
There seems, thus, to be evidence that benchmark-
ing is a feasible process for the improvement of agri-
environmental performance when using different
types of I/O indicators. More systematic data compar-
ing different types of farming systems using such
clearly defined and possibly standardised I/O account-
ing methods are needed for this to be useful on a large
scale.
The situation is different for environmental indica-
tors obtained from LCA, such as for example global
warming or acidification potential per kilogram milk.
So far, LCA studies at farm level use case studies (few
farms) and reference values (i.e. the estimation of, e.g.
N2O and CH4 is still based on relatively crude stan-
dard emission factors), and therefore show limited
variation between farms. To gain insight into the
between-farm variation of, for example, acidification
potential per kilogram milk, variation in NH3 emis-
sion between farms is highly relevant. Prediction or
measurement of variation in emission of gasses such
as NH3, N2O or CH4, however, appears to be difficult.
Therefore, it is presently not easy to document differ-
ences in such emissions between otherwise compara-
ble farms due to management at tactical or operational
levels (i.e. things that might be changed in medium to
short-term planning). The relation between manure
handling and methane emissions is poorly understood
and does not allow a farm specific calculation (Han-
sen et al., 2002). The relations between feeding and
methane emission established in the literature are
difficult to apply in practice, because of the level of
detail needed regarding the chemical composition of
carbohydrates (Bertilsson, 2002). However, the rela-
tion between methane loss from ruminants’ digestion
and the feeding practice may in the future be oper-
ationalised in a way that allows this to be taken into
account when planning feeding management on a
particular farm (Bertilsson, 2002).
The other significant contributor to greenhouse gas
emission, nitrous oxide, cannot presently be measured
or assessed precisely in relation to individual manage-
ment practices such as manure handling techniques
and crop rotation, and there is even a large difference
between countries in the way the IPCC methodology
is applied (Petersen et al., 2002). Hence, efforts to
improve the methods for assessment of NH3, N2O and
CH4 emissions on farm scale should be continued and
should be linked to an understanding of the underly-
ing processes in order to use LCA indicators at farm
level (De Boer, 2003). It would be a very important
gain if the increased knowledge of causes for these
emissions on a process level could be operationalised
into management tools in the future. The prospects for
estimating nitrate and ammonia emissions on specific
farms are better, but even within a relatively small and
homogenous country such as Denmark there is still no
consensus on which model to use to assess nitrate
losses from specific farms.
4. Comparison of the land-based indicators and
assessment
Both for the comparison of contrasting production
systems and for the identification of options for im-
provement, the definition of the environmental indica-
tor used is highly important as discussed above. Most
indicator tools present the environmental impacts per
hectare and most systems include only the emissions
from the farm itself (Tables 2, 3; see also Goodlass et
al., 2003). Thus in this sense they are bsite-specificQ.However, some environmental impacts, e.g. green-
house gas emission, are of a global nature and there-
fore the emission per unit produced (e.g. 1 kg milk) is
as relevant from a global, environmental perspective as
the emissions per hectare. Also indirect emissions
related to the use of inputs on a farm (e.g. the envi-
ronmental impact from producing the imported feeds
and fertiliser, Van der Werf et al., 2005) should be
included when a comprehensive assessment of the
N. Halberg et al. / Livestock Production Science 96 (2005) 33–50 43
environmental consequences of a product is needed.
The impact of, e.g. nitrous oxide emissions from
soybean cultivation in tropical countries may be as
relevant to the assessment of European livestock
production as the greenhouse gas losses from the
animals themselves. Moreover, increasingly it is
recognised that environmental gains from improve-
ment in farming systems per se may be off-set by the
amounts and patterns of consumption, which is one of
the reasons for the EU IPP policy paper (Anonymous,
2003). Therefore, the definition of system boundaries
is very important for indicator selection and for inter-
pretation of results.
For these reasons, a product-oriented assessment
that includes the whole production chain and quanti-
fies the environmental impacts per kilogram product
delivered is recommended internationally (Anony-
mous, 2003; UNEP, 2004). Life Cycle Assessment
is the most developed product-oriented assessment
tool and is increasingly used to evaluate the environ-
mental efficiency of different agri-enterprises and
food production systems (Halberg, 2004). For a cor-
rect interpretation of obtained results of each indica-
tor, however, it makes a difference whether the
environmental impact assessed is expressed relative
to the amount of product produced (product-based
approach) or relative to the amount of farmland used
(area-based approach) (De Boer, 2003). This will be
illustrated below with examples from different Euro-
pean farming systems—dairy and pig production. In
Table 5 we review results of LCA case studies that
compare results of organic and conventional dairy
production systems (Cederberg, 1998; Cederberg
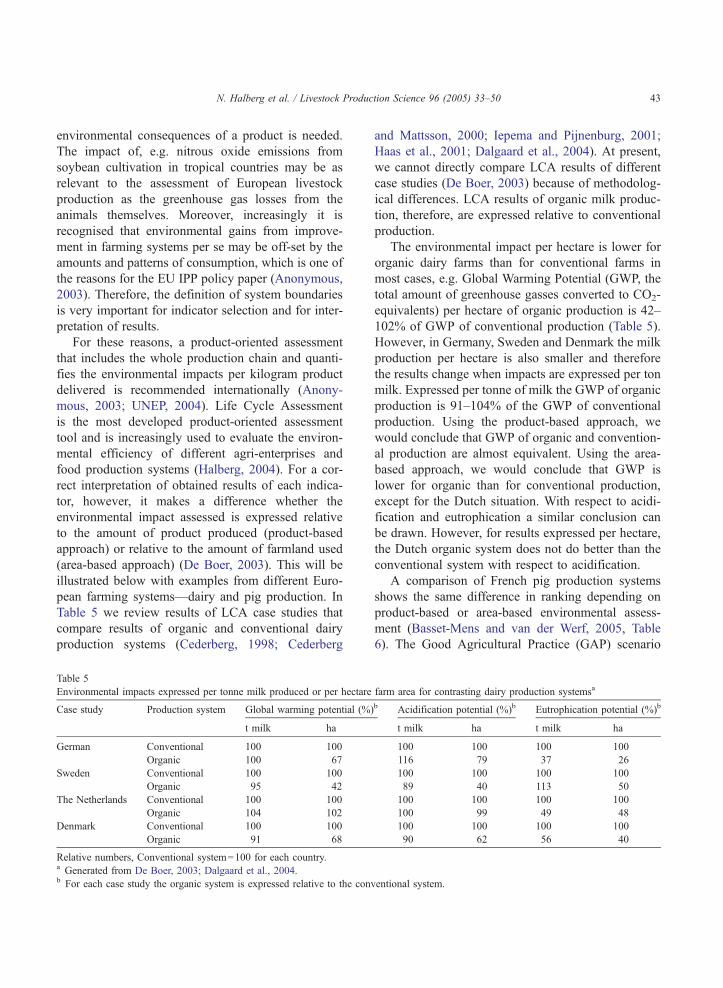
Table 5
Environmental impacts expressed per tonne milk produced or per hectare
Case study Production system Global warming potential (%)
t milk ha
German Conventional 100 100
Organic 100 67
Sweden Conventional 100 100
Organic 95 42
The Netherlands Conventional 100 100
Organic 104 102
Denmark Conventional 100 100
Organic 91 68
Relative numbers, Conventional system=100 for each country.a Generated from De Boer, 2003; Dalgaard et al., 2004.b For each case study the organic system is expressed relative to the conv
and Mattsson, 2000; Iepema and Pijnenburg, 2001;
Haas et al., 2001; Dalgaard et al., 2004). At present,
we cannot directly compare LCA results of different
case studies (De Boer, 2003) because of methodolog-
ical differences. LCA results of organic milk produc-
tion, therefore, are expressed relative to conventional
production.
The environmental impact per hectare is lower for
organic dairy farms than for conventional farms in
most cases, e.g. Global Warming Potential (GWP, the
total amount of greenhouse gasses converted to CO2-
equivalents) per hectare of organic production is 42–
102% of GWP of conventional production (Table 5).
However, in Germany, Sweden and Denmark the milk
production per hectare is also smaller and therefore
the results change when impacts are expressed per ton
milk. Expressed per tonne of milk the GWP of organic
production is 91–104% of the GWP of conventional
production. Using the product-based approach, we
would conclude that GWP of organic and convention-
al production are almost equivalent. Using the area-
based approach, we would conclude that GWP is
lower for organic than for conventional production,
except for the Dutch situation. With respect to acidi-
fication and eutrophication a similar conclusion can
be drawn. However, for results expressed per hectare,
the Dutch organic system does not do better than the
conventional system with respect to acidification.
A comparison of French pig production systems
shows the same difference in ranking depending on
product-based or area-based environmental assess-
ment (Basset-Mens and van der Werf, 2005, Table
6). The Good Agricultural Practice (GAP) scenario
farm area for contrasting dairy production systemsa
b Acidification potential (%)b Eutrophication potential (%)b
t milk ha t milk ha
100 100 100 100
116 79 37 26
100 100 100 100
89 40 113 50
100 100 100 100
100 99 49 48
100 100 100 100
90 62 56 40
entional system.

Table 6
Comparison of three pig production systems (Good Agricultural Practice (GAP), Red Label (RL) and Organic Agriculture (OA)) expressed in
impact categories per kilogram of pig produced and per hectare of land usea
Impact category Per kilogram of pig, %b Per hectare, %b
GAP RL OA GAP RL OA
Eutrophication (kg PO4-eq) 100 80 104 100 69 57
Climate change (kg CO2-eq) 100 150 173 100 130 95
Acidification (kg SO2-eq) 100 52 86 100 45 47
Terrestrial toxicity (kg 1.4-DCB-eq) 100 112 184 100 96 101
Non-renewable energy (MJ) [JHE1] 100 113 140 100 97 77
Land use (m2 per year) 100 116 182 100 100 100
Pesticide use (kg active matter) 100 105 17 100 92 10
Pig produced (kg) 100 100 100 100 86 55
Relative numbers, GAP=100.a Generated from Basset-Mens and van der Werf, 2005.b For each unit of scale the organic and RL systems are expressed relative to the GAP system.
N. Halberg et al. / Livestock Production Science 96 (2005) 33–5044
corresponds to conventional intensive production with
good agricultural practice. The Organic Agriculture
(OA) scenario corresponds to organic agriculture. The
Red Label (RL) scenario corresponds to a French
quality label (animal welfare, meat quality).
The choice between product-based and area-based
assessment and evaluations of production systems is a
political or normative one that has implications for
which environmental issues will be most important,
local or global, and which function of the production
system should be highlighted. This choice is crucial
when comparing systems with very different degrees
of productivity (yields per unit land) because the
extensive farming systems usually have lower yields
and emissions per hectare, but above average emis-
sions per kilogram product compared with more in-
tensive systems (defined in terms of input use per
hectare or livestock unit). Taking the pig production
systems GAP versus RL as an example, the analysis
of the results, both per hectare and per kilogram of
pig, suggested that RL might be an interesting alter-
native to GAP (lower eutrophication and lower acid-
ification impacts, Table 6), provided that the
emissions responsible for climate change could be
better controlled with RL. The comparison between
GAP and OA, however, strongly depended on the way
results are expressed. Impacts for OA were generally
similar to or lower than those for GAP when com-
pared per hectare of land used. But the GAP scenario
presented better or similar results on a product basis
(per kilogram of pig produced), except for pesticide
use.
An area-based—compared with a product-based—
agri-environmental indicator reflects intensity or ex-
tensiveness of production (defined here by inputs per
hectare). In general, organic systems are more exten-
sive than conventional systems (except for the Dutch
case), and show a lower environmental impact per
farm area. The low emissions from extensive systems
may have local or regional benefits. But if the lower
production is compensated for by more intensive
production in other areas (regions), then the total
emission on a global scale may be the same or even
higher. Therefore, from a global perspective the inter-
esting indicator is the emission per kilogram product.
This is in agreement with the proposition of Haas
et al. (2000) and De Boer (2003) that the choice of the
indicator should be connected with the impact cate-
gory type: an area-based indicator should be preferred
for regional impacts (such as eutrophication and acid-
ification) and product-based indicators should be used
for global impacts (e.g. climate change) (Table 6). In
the pig farming example, the OAwould then be better
for the regional impacts (except terrestrial toxicity)
and GAP would be better for global impacts. With
respect to GWP and acidification, the results in Table
5 show no clear difference between conventional and
organic milk production per kilogram milk. However,
eutrophication per tonne milk is lower in (most) or-
ganic systems. Thus, for a global environmental prob-
lem, a production system that produces 1 kg of milk
or meat with minimal environmental impact seems
most efficient. This is of increasing importance be-
cause of the increasing demand worldwide for live-

N. Halberg et al. / Livestock Production Science 96 (2005) 33–50 45
stock products (Delgado et al., 1999). For an environ-
mental problem with a local or regional character,
however, we could argue that looking at an area-
based indicator is informative as well, especially be-
cause there are regional differences in the tolerance of
emissions such as acidification. Knowing that farms
are not evenly distributed over a region/country/
world, an area-related indicator gives information
about the environmental load per farm area. Hence,
for acidification and eutrophication, i.e., environmen-
tal problems with a regional component, we should
compare contrasting production system using both a
product and an area-based indicator.
However, changing the indicator basis also often
changes systems boundaries, i.e. the definition of
which impacts and resource flows to include. Thus,
when calculating eutrophication and acidification per
hectare (area-based), the result most often only
includes the emissions on the particular farm and
not the emissions during production of imported fer-
tiliser or soybeans. These emissions are, on the con-
trary, included in the product-based assessment
because this includes all steps from cradle to consum-
er. Moreover, emissions resulting from handling of
manure exported from specialised livestock farms to
cash crop farms are usually not included in the area-
based assessment of the livestock farm (Schroder et
al., 2003), but should be included in the product-based
assessment. Therefore, each assessment has its advan-
tage but cannot stand alone. An area-based assessment
of livestock farming systems that depend on imported
feeds and export large amounts of manure would
overlook the emissions outside the farm related to
the livestock production. On the other hand, a prod-
uct-based assessment cannot presently distinguish be-
tween the different impacts a given level of emissions
has on different locations. Thus, both types of indica-
tors are needed in order to comprehensively charac-
terise environmental impacts from food production.
5. Selection of agri-environmental issues for the
indicator tools
As shown in Tables 3 and 4, most agri-environ-
mental assessment tools cover only part of the exten-
sive list of agri-environmental topics and problems,
yet the normative (value-based) objectives behind the
selection are rarely explicitly included in the systems’
documentation. Most indicators are obviously uncon-
troversial, because they represent a sympathetic ob-
jective (e.g. reducing eutrophication or pesticide
losses and maintaining biodiversity) as shown in
Table 3. But the selection of some indicators over
others is already a normative (i.e. value-based) choice
and signals that some problems are considered more
important than others. Not all indicator tools in Table
3 include, for example, pesticide use or emissions,
which by the EU and many member states are con-
sidered important causes of environmental impact
from farming (EEA, 2003). Some systems (DIA and
EF) do not cover the use or potential loss of phos-
phorus, but focus on, for example, soil erosion and
land use. Soil erosion/soil quality (which is another
important topic according to EEA, 2003), on the other
hand, is addressed only by four of the methods, partly
because of a lack of simple indicators at the farm or
field level (Halberg et al., 2005; Schjønning et al.,
2004). All systems except EP include energy use, but
it is not always clear whether this is from the perspec-
tive of a limited resource or the contribution of CO2 to
global warming.
Moreover, the issue of balancing the different
objectives, e.g., the trade-off between different indi-
cators if they cannot all be improved at the same time,
is seldom dealt with in an explicit way. Some systems
transfer the indicator values to closed scales signalling
maximum acceptable levels and comparisons between
different issues, which often are based on researchers
own perceptions or subjective views (Halberg et al.,
2005). Other systems simply report the level of an
indicator and in some cases offer reference values for
comparison.
The objectives behind indicators for water use and
fertiliser use are to promote boptimalQ use, thus not
necessarily to minimise the input. On a livestock farm
the water consumption by livestock or the irrigation
should cover the needs of animals and crops, but at
the same time avoid waste. Thus, there is a need for
interpretation of what is a reasonable level on a given
farm. For other indicators the objective is to minimise,
e.g. the surplus of nitrogen (N) or the N emission,
which seems simple, and most often the indicator is
based on the area used (NH3 emission per hectare).
However, in a situation with conflicting objectives
between production and emissions, it may be interest-
N. Halberg et al. / Livestock Production Science 96 (2005) 33–5046
ing to base the indicator on the amount of product
(e.g. NH3 emission per kilogram wheat), in order to
facilitate an explicit trade-off. The life cycle assess-
ment methodology allows for a calculation of emis-
sions per kilogram product and includes explicit
functions for scaling different environmental impacts
in the so-called bnormalisation procedureQ (Guinee et
al., 2002).
In the end, any choice of which impacts from
livestock systems are more important to address in
a given context will be political decisions, depending
on a local or regional/national context and the dis-
courses in society (Kristensen and Halberg, 1997).
Researchers need to justify explicitly their choices of
objectives and indicators in relation to societal goals
such as reflected in the environmental assessments
from the European Environmental Agency (EEA,
2003, in press). Some objectives and the related
indicators address environmental issues at the local
or regional level (e.g., land use, biodiversity and soil
erosion) while others focus on global issues (e.g.,
energy use and the release of greenhouse gasses).
This may have consequences for the assessment of
different livestock production systems and thus the
choice of interventions. It thus seems obvious that
there is a need for consensus concerning a list of
basic agri-environmental indicators to assess different
livestock farming systems in relation to clear objec-
tives. Table 7 shows recommendations for agri-envi-
ronmental indicators for use at the local, regional and
global scale for diagnostic and development pur-
poses. The table is not exclusive and mainly proposes
a structure for selecting indicators based on consid-
erations of the geographical scale and system bound-
ary they should be interpreted within. The objectives
and environmental themes correspond to objectives
behind the IRENA indicators (EEA, in press) but do
not include all (e.g. water abstraction). The indicators
presented are suitable for use on specific farms or for
specific products and processes. Therefore they differ
from the IRENA indicators, which are selected to be
useful on an aggregated level, using statistical data.
The methodology for each indicator in Table 7 has
been described elsewhere but more work is needed in
order to harmonise specific calculation and interpre-
tation procedures.
For each environmental objective there is a need
for both diagnostic indicators and assessment tools for
development (optimisation) purposes. Diagnostic
indicators need to be relatively simple to carry out
and to report, but should still give a precise assess-
ment of the relation between production practices and
the (potential) environmental impact. Indicators such
as N and P surplus per hectare, pesticide bTreatment
Frequency IndexQ or bkg active ingredients per haQand energy use in bMJ per kg productQ are well
established in a number of countries. The LCA type
indicators for GWP, eutrophication and acidification
per kilogram product are well-established, but meth-
odological differences are still too large to allow
detailed comparisons between results from different
researchers. Land use is part of LCA tools and was
interpreted to reflect three competing objectives of: I.
Biodiversity protection through sustaining and in-
creasing uncultivated areas, e.g. rainforests and
bogs. II. The need for land to secure global food
sufficiency (Runge et al., 2003). III. Bio energy pro-
duction (EEA, 2003). The objective of minimising
land use per produced unit does not always go hand
in hand with the objective of maintaining semi-natural
grasslands by grazing, which is a goal in many Euro-
pean countries (EEA, 2004a).
Some of the objectives, especially for landscape
and biodiversity, cannot be described satisfactorily
by single and general indicators because of geograph-
ical and cultural differences. The Austrian concept
bEcopointsQ operates with a list including bthe percent-age of small biotopes on the farmQ, which may have a
general validity but which does not tell much about the
actual biodiversity in, e.g. the hedges or ponds. Some
attempts to define generic landscape (aesthetical) indi-
cators exist, but the subjective and normative aspects
of landscape aesthetics should be considered carefully
as part of the process for such indicators (Højring and
Noe, 2004). No consensus exists on appropriate and
simple soil quality indicators to be used on individual
farms or fields (Schjønning et al., 2004), but some
feasible indicators of specific aspects of soil quality
can be selected such as the amount of toxic substances
applied (e.g. bkg Cu per haQ).In conclusion: For an indicator to be useful it is
necessary to establish reference values for different
types of livestock farming systems. This should be
done by analysing data from farms to demonstrate
the variation in indicator values and by testing the
possibilities of reducing environmental impacts
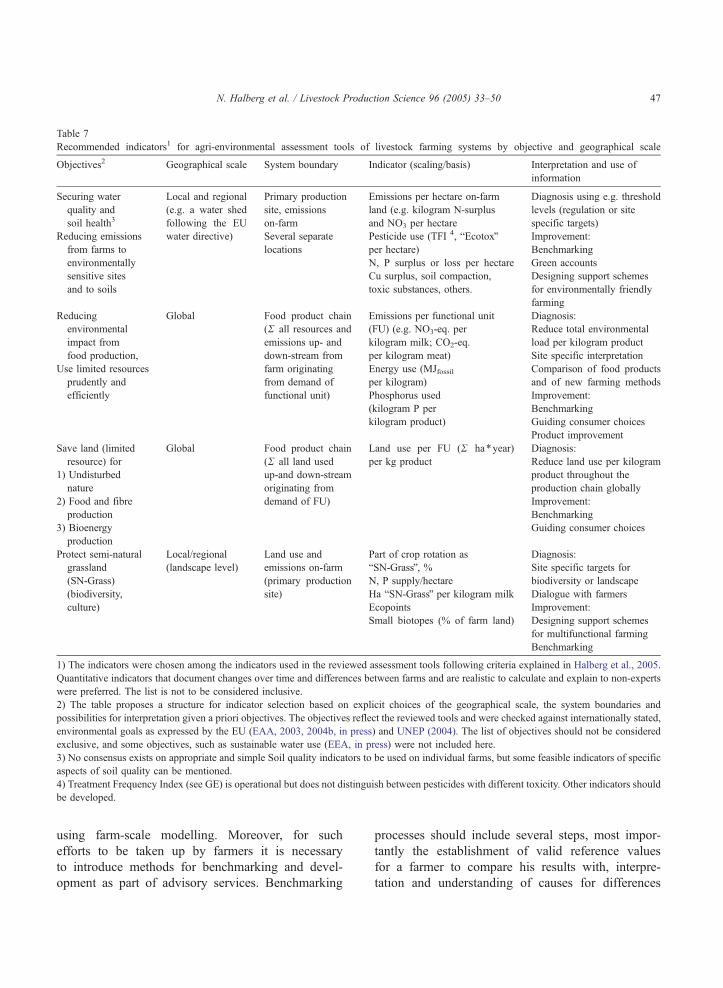
Table 7
Recommended indicators1 for agri-environmental assessment tools of livestock farming systems by objective and geographical scale
Objectives2 Geographical scale System boundary Indicator (scaling/basis) Interpretation and use of
information
Securing water
quality and
soil health3
Local and regional
(e.g. a water shed
following the EU
water directive)
Primary production
site, emissions
on-farm
Emissions per hectare on-farm
land (e.g. kilogram N-surplus
and NO3 per hectare
Diagnosis using e.g. threshold
levels (regulation or site
specific targets)
Reducing emissions
from farms to
environmentally
sensitive sites
and to soils
Several separate
locations
Pesticide use (TFI 4, bEcotoxQper hectare)
Improvement:
Benchmarking
N, P surplus or loss per hectare Green accounts
Cu surplus, soil compaction,
toxic substances, others.
Designing support schemes
for environmentally friendly
farming
Reducing
environmental
impact from
food production,
Global Food product chain
(R all resources and
emissions up- and
down-stream from
farm originating
from demand of
functional unit)
Emissions per functional unit
(FU) (e.g. NO3-eq. per
kilogram milk; CO2-eq.
per kilogram meat)
Diagnosis:
Reduce total environmental
load per kilogram product
Site specific interpretation
Use limited resources
prudently and
efficiently
Energy use (MJfossilper kilogram)
Comparison of food products
and of new farming methods
Phosphorus used
(kilogram P per
kilogram product)
Improvement:
Benchmarking
Guiding consumer choices
Product improvement
Save land (limited
resource) for
Global Food product chain
(R all land used
up-and down-stream
originating from
demand of FU)
Land use per FU (R ha*year)
per kg product
Diagnosis:
Reduce land use per kilogram
product throughout the
production chain globally
Improvement:
Benchmarking
Guiding consumer choices
1) Undisturbed
nature
2) Food and fibre
production
3) Bioenergy
production
Protect semi-natural
grassland
(SN-Grass)
(biodiversity,
culture)
Local/regional
(landscape level)
Land use and
emissions on-farm
(primary production
site)
Part of crop rotation as
bSN-GrassQ, %Diagnosis:
Site specific targets for
biodiversity or landscapeN, P supply/hectare
Ha bSN-GrassQ per kilogram milk Dialogue with farmers
Ecopoints Improvement:
Small biotopes (% of farm land) Designing support schemes
for multifunctional farming
Benchmarking
1) The indicators were chosen among the indicators used in the reviewed assessment tools following criteria explained in Halberg et al., 2005.
Quantitative indicators that document changes over time and differences between farms and are realistic to calculate and explain to non-experts
were preferred. The list is not to be considered inclusive.
2) The table proposes a structure for indicator selection based on explicit choices of the geographical scale, the system boundaries and
possibilities for interpretation given a priori objectives. The objectives reflect the reviewed tools and were checked against internationally stated,
environmental goals as expressed by the EU (EAA, 2003, 2004b, in press) and UNEP (2004). The list of objectives should not be considered
exclusive, and some objectives, such as sustainable water use (EEA, in press) were not included here.
3) No consensus exists on appropriate and simple Soil quality indicators to be used on individual farms, but some feasible indicators of specific
aspects of soil quality can be mentioned.
4) Treatment Frequency Index (see GE) is operational but does not distinguish between pesticides with different toxicity. Other indicators should
be developed.
N. Halberg et al. / Livestock Production Science 96 (2005) 33–50 47
using farm-scale modelling. Moreover, for such
efforts to be taken up by farmers it is necessary
to introduce methods for benchmarking and devel-
opment as part of advisory services. Benchmarking
processes should include several steps, most impor-
tantly the establishment of valid reference values
for a farmer to compare his results with, interpre-
tation and understanding of causes for differences
N. Halberg et al. / Livestock Production Science 96 (2005) 33–5048
between farms, explorations of possible ways to
improve the environmental performance on specific
farms through changed tactical and strategic plan-
ning, and holistic evaluation of the consequences of
such partial improvements for the overall economic,
environmental and animal welfare performance of
the farming system using indicators. For each of
these steps more readily available tools should be
developed for farmers and advisors to be linked
with traditional technical-economic planning tools.
References
Anonymous, 2000. Vejledning om grønne regnskaber for landbrugs-
bedrifter (Manual for Green Accounts for a Farms). Landbrugets
Radgivningscenter. 90 pp. Available on-line: http://www.lr.dk//
groentregnskab (feb. 2003).
Anonymous, 2003. Integrated Product Policy. Building on Environ-
mental Life-Cycle Thinking. Communication from the Commis-
sion to the Council and the European Parliament Commission of
the European Communities. Brussels, 18.6.2003, COM(2003)
302 final.
Basset-Mens, C., van der Werf, H.M.G., 2005. Scenario-based
environmental assessment of farming systems: the case of pig
production in France. Agriculture, Ecosystems and Environment
105, 127–144.
Bell, S., Morse, S., 1999. Sustainability Indicators, Measuring the
Immeasurable. Earthscan Publications Ltd, London.
Bertilsson, J., 2002. Methane emissions from enteric fermentation—
effects of diet composition. In: Petersen, S.O., Olesen, J. (Eds.),
Greenhouse Gas Inventories for Agriculture in the Nordic
Countries. Proceedings from an International Workshop, DIAS
Report, vol. 81, pp. 37–45.
Børsting, C.F., Kristensen, T., Misciatteli, L., Hvelplund, T., Weisb-
jerg, M.R., 2003. Reducing nitrogen surplus from dairy farms.
Effects of feeding and management. Livestock Production Sci-
ence 83, 165–178.
Bureau Heffingen, 2001. MINAS Tabellenbrochure 2001. Minist-
erie van Landbouw, Natuurbeheer en Visserij, Assen, The
Netherlands.
Cederberg, C., 1998. Life cycle assessment of milk production—a
comparison of conventional and organic farming, SIK-report,
no. 643, SIK, The Swedish Institute for Food and Biotechno-
logy, Goteborg.
Cederberg, C., Mattsson, B., 2000. Life cycle assessment of milk
production—a comparison of conventional and organic farming.
Journal of Cleaner Production 8, 49–60.
Dalgaard, R., Halberg, N., Kristensen, I.S., Larsen, I., 2004. An
LC inventory based on representative and coherent farm
types. In: Halberg, N. (Ed.), Life Cycle Assessment in the
Agri-food Sector. Proceedings from the 4th International
Conference, October 6–8, 2003, Bygholm, Denmark DIAS
Report, vol. 61, pp. 98–106. Available on-line (Oct. 2004):
http://www.lcafood.dk/lca_conf/DJFrapport_paper_2_poster.
pdf.
De Boer, I.J.M., 2003. Environmental impact assessment of con-
ventional and organic milk production. Livestock Production
Science 80, 69–77.
De Boer, I.J.M., Iepema, G., Thomassen, M.A., 2004. Environmen-
tal impact assessment at commercial dairy farms. In: Halberg, N.
(Ed.), Life Cycle Assessment in the Agri-food Sector. Proceed-
ings from the 4th International Conference October 6–8, 2003,
Bygholm, Denmark DIAS Report, vol. 61, pp. 214–218.
Available on-line (Oct. 2004) at: http://www.lcafood.dk/lca_
conf/DJFrapport_paper_2_poster.pdf.
Delgado, C., Rosegrant, M., Steinfeld, H., Ehui, S., Courbois, C.,
1999. Livestock to 2020: the next food revolution. Discussion
Paper, vol. 28, 70 pp. IFPRI. Available on-line (August 2004):
http://www.ifpri.org/2020/dp/dp28.pdf.
EEA, 2001. Environmental benchmarking for local authorities:
from concept to practice. Environmental Issue Report, vol. 20.
European Environmental Agency.
EEA, 2003. Europe’s environment: the third assessment. Environ-
mental assessment report, no. 10. Agriculture, 43–51;
EEA, 2003. Europe’s environment: the third assessment. En-
vironmental assessment report, no. 10. Soil Degradation,
198–212.
EEA, 2004a. High nature value Farmland. EEA report no. 1/2004,
24 pp.
EEA, 2004b. IRENA, Indicator Reporting on the Integration of En-
vironmental Concerns into Agricultural Policy (Available online
(May 2004) http://webpubs.eea.eu.int/content/irena/index.htm.
EEA, in press. Agriculture and Environment in EU-15: the IRENA
indicator report. (On-line: http://webpubs.eea.eu.int/content/
irena/Latestproducts.htm).
Goodlass, G., Halberg, H., Vershuur, G., 2003. Input output ac-
counting systems in the European community—an appraisal of
their usefulness in raising awareness of environmental problems.
European Journal of Agronomy 20, 17–24.
Guinee, J.B., Gorree, M., Heijungs, R., Huppes, G., Kleijn, R., de
Koning, A., van Oers, L., Wegener Sleeswijk, A., Suh, S., Udo
de Haes, H.A., de Bruijn, H., van Duin, R., Huijbregts, M.A.J.,
2002. Life cycle assessment. An Operational Guide to the ISO
Standards. Centre of Environmental Science, Leiden University,
Leiden, The Netherlands.
Haas, G., Wetterich, F., Geier, U., 2000. Life cycle assessment
framework in agriculture on the farm level. International Journal
of Life Cycle Assessment 5, 345–348.
Haas, G., Wetterich, F., Kopke, U., 2001. Comparing intensive,
extensified and organic grassland farming in southern Germany
by process life cycle assessment. Agriculture, Ecosystems and
Environment 83, 43–53.
Halberg, N., 1999. Indicators of resource use and environmental
impact for use in a decision aid for Danish livestock farmers.
Agriculture, Ecosystems and Environment 76, 17–30.
Halberg, N. (Ed.), 2004. Life cycle assessment in the agri-food
sector. Proceedings from the 4th International Conference Oc-
tober 6–8, 2003, Bygholm, Denmark DIAS Report, vol. 61,
288 pp. Available on-line (Oct. 2004) at: http://www.lcafood.dk/
lca_conf.
N. Halberg et al. / Livestock Production Science 96 (2005) 33–50 49
Halberg, N., Jensen, C.H., 1996. Dairy farm production strategy and
nitrogen surplus. In: Walter-Jørgensen, Aa., Pilegaard, S. (Eds.),
Integrated Environmental and Economic Analyses in Agricul-
ture, SJFI-rapport, vol. 89, pp. 103–120.
Halberg, N., Kristensen, E.S., Kristensen, I.S., 1995. Nitro-
gen turnover on organic and conventional mixed farms.
Journal of Agricultural and Environmental Ethics 8 (1),
30–51.
Halberg, N., Verschuur, G., Goodlass, G., 2005. Farm level envi-
ronmental indicators; are they useful? An overview of green
accounting systems for European farms. Agriculture, Ecosys-
tems and Environment 105, 195–212.
Hanegraaf, M.C., den Boer, D.J., 2003. Prespectives and limitations
of the Dutch minerals accounting system (MINAS). European
Journal of Agronomy 20, 25–31.
Hanegraaf, M.C., van Bergen, J.A.M., Biewinga, E.E., van Milten-
burg, J., 1996. Ervaringen met de energiemeetlat in de veehou-
derij: cijfers, methodiek, rekenregels. Centrum voor Landbouw
en Milieu, Utrecht.
Hansen, M.N., Sommer, S.G., Henriksen, K., 2002. Methane
emission from livestock manure—effects of storage conditions
and climate. In: Petersen, S.O., Olesen, J. (Eds.), Greenhouse
Gas Inventories for Agriculture in the Nordic Countries. Pro-
ceedings from an International Workshop, DIAS Report, vol.
81, pp. 37–45.
Holbeck, H.B., Kolind Hvid, S., 2004. Næringsstofoverskud pa
kvæg-, svine-og planteavlsbedrifter i demonstrationsprojekt
med grønne regnskaber 1999-2001 (Nutrient surplus on dairy,
pig and cash crop farms performing green accounts). Available
on-line (September 3rd, 2004) at http://www.lr.dk/planteavl/
diverse/groent_regnskab.htm.
Højring, K., Noe, E., 2004. Communicative approaches to involve
farmers in solving conflicts related to rural landscapes and
nature. Paper for the XI World Congress of Rutal Sociology
July, 2004, Trondheim, Norway.
Iepema, G., Pijnenburg, J. 2001. Conventional versus Organic Dairy
Farming. A Comparison of Three Experimental Farms on En-
vironmental Impact, Animal Health and Animal Welfare. MSc
Thesis Animal Production Systems Group, Wageningen Univer-
sity, Wageningen, The Netherlands.
Kristensen, E.S., Halberg, N., 1997. A systems approach for asses-
sing sustainability in livestock farms. Proceedings of the Fourth
International Symposium on Livestock Farming Systems,
EAAP Publication, vol. 89, pp. 16–29.
Lewis, K.A., Bardon, K.S., 1998. A computer-based informal en-
vironmental management system for agriculture. Environmental
Modelling and Software 13, 123–137.
Mayrhofer, P., Steiner, C., Garber, E., Gruber, E., 1996. Regional-
programm Okopunkte Niederosterreich. Informationsheft. NO
Landschaftsfonds. Wien, Austria.
Mitchell, G., May, A., McDonald, A., 1995. PICABUE: a method-
ological framework for the development of indicators of sus-
tainable development. International Journal of Sustainable
Development and World Ecology 2, 104–123.
Nielsen, A.H., unpublished. Phosphorus balances based on data
from Danish Pilot Farms. Danish Institute of Agricultural
Sciences, Department of Agroecology.
Nielsen, A.H., Kristensen, I.S., 2005. Level of nitrogen and phos-
phorus surpluses on Danish dairy and pig farms in relation to
farm characteristics. doi:10.1016/j.livprodsci.2005.05.012.
OECD, 2000. Towards sustainable development. Indicators to
Measure Progress. OECD Publications, Paris.
Ondersteijn, C.J.M, Beldman, A.C.G., Daatselaar, C.H.G., Giesen,
G.W.J., Huirne, R.B.M., 2002. The Dutch mineral accounting
systems and the European nitrate directive: implications for N
and P management and farm performance. Agriculture, Ecosys-
tems and Environment 92, 283–296.
Petersen, S.O., Adolfsson, R., Fenhann, J., Halsdottir, B., Hoem, B.,
Regina, K., Rypdal, K., Staaf, H., Olesen, J., 2002. Comparison
of national and IPCC default methodologies to estimate methane
and nitrous oxide emissions from agriculture. In: Petersen, S.O.,
Olesen, J. (Eds.), Greenhouse Gas Inventories for Agriculture in
the Nordic Countries. Proceedings from an International Work-
shop, DIAS Report, vol. 81, pp. 21–36.
Pointereau, P., Bochu, J.L., Doublet, S., Meiffren, I., Dimkic, C.,
Schumacher, W., Backhausen, J., Mayrhofer, P., 1999. Le diag-
nostic agri-environnemental pour une agriculture respectueuse
de l’environnement. Trois methodes passees a la loupe. Travaux
et Innovations. Societe Agricole et Rurale d’Edition et de Com-
munication, Paris, France.
Rossier, D., 1999. L’ecobilan, outil de gestion ecologique de
l’exploitation agricole? Revue suisse d’Agriculture 31 (4),
179–185.
Runge, C.F., Senauer, B., Pardey, P.G., Rosegrant, M.W.,
2003. Ending Hunger in our Lifetime—Food Security
and Globalization. The Johns Hopkins University Press.
288 pp.
Schjønning, P., Elmholt, S., Christensen, B.T., 2004. Soil quality
management—synthesis. In: Schjønning, P., Elmholt, S.,
Christensen, B.T. (Eds.), Managing Soil Quality: Challenges
in Modern Agriculture. CAB International, pp. 315–333.
Chapter 18.
Schroder, J., Aarts, K.F.M., Ten Berge, H.F.M., van Keulen, H.,
Neeteson, J.J., 2003. An evaluation of whole-farm nitrogen
balances and related indices for efficient nitrogen use. European
Journal of Agronomy 20, 33–44.
Smeets, E., Weterings, R., Bosch, P., Buchele, M., Gee, D., 1999.
Environmental indicators: typology and overview. EEA Techni-
cal Report 25, 1–19.
Solagro, 2000. DIALECTE, Diagnostic Liant Environnement et
Contrat Territorial d’Exploitation. User manual, first version
(February 2000), Solagro, Toulouse, France.
Stolze, M., Piorr, A., Haring, A., Dabbert, S., 2000. The environ-
mental impacts of organic farming in Europe. Organic Farming
in Europe: Economics and Policy, vol. 6. University of Hohen-
heim, Stuttgart. 126 pp.
UNEP, 2004. UNEP-SETAC life cycle initiative. Life Cycle Initi-
ative’s Newsletter, vol. 4. Available on-line (January, 2005):
http://www.uneptie.org/pc/sustain/ lcinitiative/.
Van der Meer, H.G., Van der Putten, A.H.J., 1995. Reduction of
nutrient emissions from ruminant livestock farms. Proceedings
of the British Grassland Society 50, 118–134.
Van der Werf, H.M.G., Petit, M., 2002. Evaluation of the environ-
mental impact of agriculture at the farm level: a comparison and

N. Halberg et al. / Livestock Production Science 96 (2005) 33–5050
analysis of 12 indicator-based methods. Agriculture, Ecosys-
tems and Environment 93, 131–145.
Van der Werf, H.M.G., Petit, J., Sanders, J., 2005. The envi-
ronmental impact of the production of concentrated feed:
the case of pig feed in Bretagne. Agricultural Systems 83,
153–177.
Vilain, L., 2003. La methode IDEA. Indicateurs de Durabilite des
Exploitations Agricoles. Guide d’utilisation. Educagri editions,
Dijon, France.
Wackernagel, M., Rees, W.E., 1996. Our ecological footprint. Re-
ducing the Human Impact on the EarthNew Society Publishers,
Gabriola Island, British Columbia, Canada.