ENVIRONMENT MANAGEMENT PLAN for - Welcome … Garg W/o Sh. Ashish Garg, 22, Patel Nagar, Aerodrome...
26
ENVIRONMENT MANAGEMENT PLAN for AMOCH LATERITE, OCHRE & WHITE CLAY MINE Village - Amoch Tehsil - Bahoriband, District- Katni State - Madhya Pradesh Khasra No. - 567, 568, 570, 571, 572, 573, 574/2, 575/1, 575/5, 575/6, 575/7 M. L. Area – 10.99 ha. Lessee - M/s Smi. Jyoti Garg W/o Sh. Ashish Garg , 22, Patel Nagar, Aerodrome Road P.O. & District - Indore (M.P.) Pin code – 452001 Mobile No.- 09425330820 Envirta Sustainable Solutions India Pvt. Ltd. NABET-QCI Accredited -2412,Tower 2 , Express Trade Towers 2, B- 36,Sector 132,Noida-201301
Transcript of ENVIRONMENT MANAGEMENT PLAN for - Welcome … Garg W/o Sh. Ashish Garg, 22, Patel Nagar, Aerodrome...
ENVIRONMENT MANAGEMENT PLAN
for AMOCH LATERITE, OCHRE & WHITE CLAY
MINE
Village - Amoch
Tehsil - Bahoriband, District- Katni
State - Madhya Pradesh
Khasra No. - 567, 568, 570, 571, 572, 573, 574/2, 575/1, 575/5, 575/6, 575/7
M. L. Area – 10.99 ha.
Lessee -
M/s Smi. Jyoti Garg
W/o Sh. Ashish Garg ,
22, Patel Nagar, Aerodrome Road
P.O. & District - Indore (M.P.)
Pin code – 452001
Mobile No.- 09425330820
Envirta Sustainable Solutions India Pvt. Ltd.
NABET-QCI Accredited
-2412,Tower 2 , Express Trade Towers 2, B-
36,Sector 132,Noida-201301

2
INDEX
CHAPTER
NO.
SUBJECT PAGE NO.
1. Name and address of the holder of the Quarry Lease 3
2. Details of the area 3
3. Detail of the machine to be used in mining operation 5
4. Details of measurement of quarry pit earlier excavation in the
area to be sanctioned and details of mineral concession situated
within 500 meter periphery of the area
5
5. Details of Quarry operations 6
6. Scheme of tree plantation 6
7. Detail and approximate distance of the National Park,
Sanctuary, Biodiversity Area, Interstate Boundary situated
within periphery of 10 km. from the area to be sanctioned
7
8. Proposed annual production of the mineral 7
9. Effect on ground water level due to mining operation and its
preventive measures
7
10. Details of scheme of continuous reclamation and rehabilitation
of the land degradation due to mining operation
7
11. Details of preventive and control scheme of air and water
pollution
10
12. Provision for separate stacking of surface soil excavated from
mining operation and its utility
12
13. Details of social and economic up gradation of mining effected
area due to proposed project
12
14. Details of budgetary arrangement for environment management 12
15. Environment Monitoring Programme 13
16. Any other details desired to be submitted by mineral concession
holder
18
3
Introductory Note – Amoch Laterite, Ochre & Clay Mine is situated in Village Amoch of District
–Katni of M.P. State. The ML area has been executed for 30 years period w.e.f. 14.01.2015 to
13.01.2045. About 36,289 TPA of Laterite, Ochre & Clay will be produced. Cost of the proposed
project is Rs. 0.75 Crores. The Mining Plan has been approved on 29.09.2014 by IBM.
1) Name and address of the holder of the Mining Lease holder .
NAME OF COMPANY / OWNER ADDRESS
Smt. Jyoti Garg
W/o Sh. Ashish Garg
22, Patel Nagar, Aerodrome Road
P.O. & District - Indore (M.P.)
Pin code – 452001
Mobile No.- 09425330820
2) Details of the area;
(i) Date of sanction
S. No. Particulars Details
1. Mining lease sanction by state
govt.
1st Grant - 30 years period w.e.f.
14.01.2015 to 13.01.2045
(ii) Period of Mining Lease
30 years period w.e.f. 14.01.2015 to 13.01.2045
4
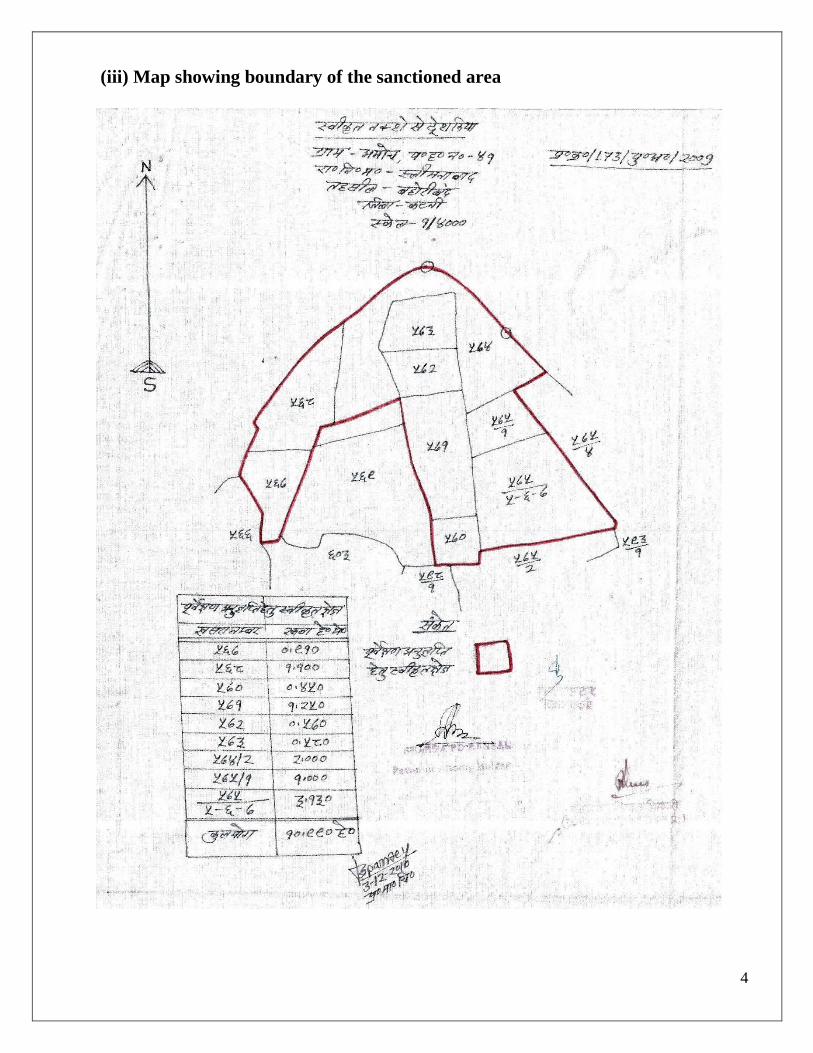
(iii) Map showing boundary of the sanctioned area
5
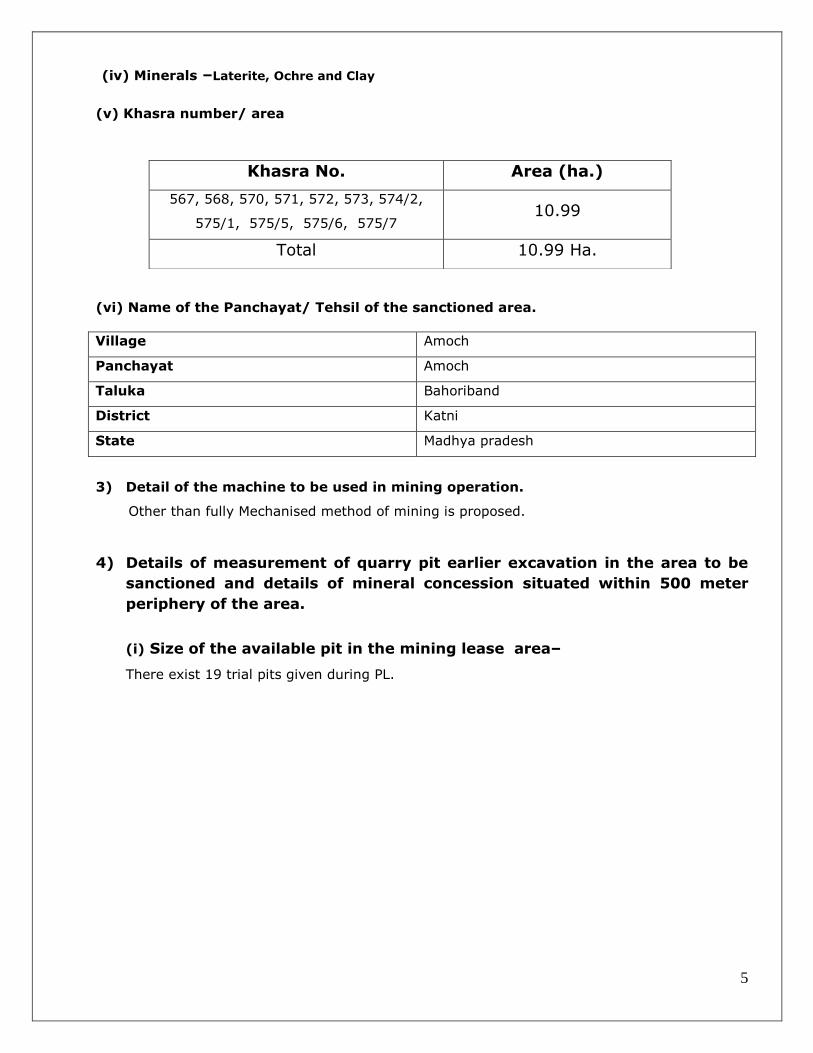
(iv) Minerals –Laterite, Ochre and Clay (v) Khasra number/ area
(vi) Name of the Panchayat/ Tehsil of the sanctioned area.
Village Amoch
Panchayat Amoch
Taluka Bahoriband
District Katni
State Madhya pradesh
3) Detail of the machine to be used in mining operation.
Other than fully Mechanised method of mining is proposed.
4) Details of measurement of quarry pit earlier excavation in the area to be
sanctioned and details of mineral concession situated within 500 meter
periphery of the area.
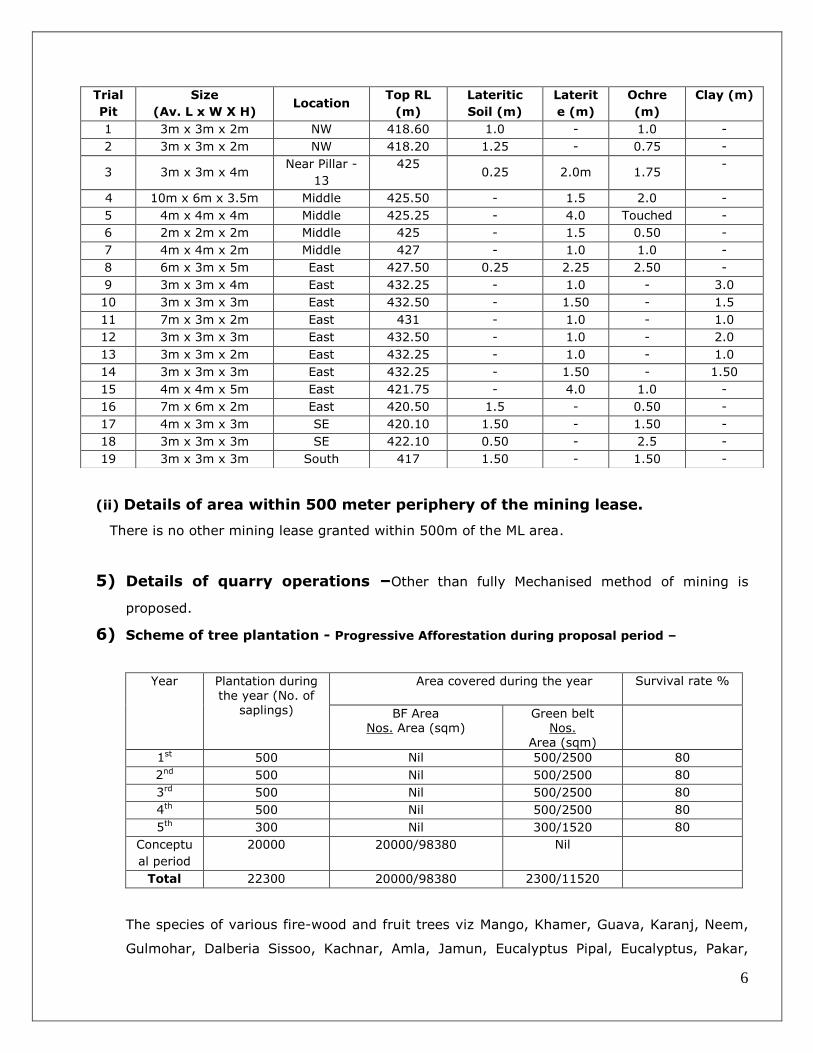
(i) Size of the available pit in the mining lease area–
There exist 19 trial pits given during PL.
Khasra No. Area (ha.)
567, 568, 570, 571, 572, 573, 574/2,
575/1, 575/5, 575/6, 575/7 10.99
Total 10.99 Ha.
6
(ii) Details of area within 500 meter periphery of the mining lease.
There is no other mining lease granted within 500m of the ML area.
5) Details of quarry operations –Other than fully Mechanised method of mining is
proposed.
6) Scheme of tree plantation - Progressive Afforestation during proposal period –
Year
Plantation during the year (No. of
saplings)
Area covered during the year Survival rate %
BF Area Nos. Area (sqm)
Green belt Nos.
Area (sqm)
1st 500 Nil 500/2500 80
2nd 500 Nil 500/2500 80
3rd 500 Nil 500/2500 80
4th 500 Nil 500/2500 80
5th 300 Nil 300/1520 80
Conceptu
al period
20000 20000/98380 Nil
Total 22300 20000/98380 2300/11520
The species of various fire-wood and fruit trees viz Mango, Khamer, Guava, Karanj, Neem,
Gulmohar, Dalberia Sissoo, Kachnar, Amla, Jamun, Eucalyptus Pipal, Eucalyptus, Pakar,
Trial
Pit
Size
(Av. L x W X H) Location
Top RL
(m)
Lateritic
Soil (m)
Laterit
e (m)
Ochre
(m)
Clay (m)
1 3m x 3m x 2m NW 418.60 1.0 - 1.0 -
2 3m x 3m x 2m NW 418.20 1.25 - 0.75 -
3 3m x 3m x 4m Near Pillar -
13
425 0.25 2.0m 1.75
-
4 10m x 6m x 3.5m Middle 425.50 - 1.5 2.0 -
5 4m x 4m x 4m Middle 425.25 - 4.0 Touched -
6 2m x 2m x 2m Middle 425 - 1.5 0.50 -
7 4m x 4m x 2m Middle 427 - 1.0 1.0 -
8 6m x 3m x 5m East 427.50 0.25 2.25 2.50 -
9 3m x 3m x 4m East 432.25 - 1.0 - 3.0
10 3m x 3m x 3m East 432.50 - 1.50 - 1.5
11 7m x 3m x 2m East 431 - 1.0 - 1.0
12 3m x 3m x 3m East 432.50 - 1.0 - 2.0
13 3m x 3m x 2m East 432.25 - 1.0 - 1.0
14 3m x 3m x 3m East 432.25 - 1.50 - 1.50
15 4m x 4m x 5m East 421.75 - 4.0 1.0 -
16 7m x 6m x 2m East 420.50 1.5 - 0.50 -
17 4m x 3m x 3m SE 420.10 1.50 - 1.50 -
18 3m x 3m x 3m SE 422.10 0.50 - 2.5 -
19 3m x 3m x 3m South 417 1.50 - 1.50 -
7
Maha neem, etc will be planted every year. Fencing will be done to protect the plants..
Monitoring and management of plantation will be continued until the vegetation becomes
self-sustaining.
7) Detail and approximate distance of the National Park, Sanctuary, Biodiversity
Area, Interstate Boundary situated within periphery of 5 km. from the area to be
sanctioned.
There is no National Park, Sanctuary, Biodiversity Area, Interstate Boundary situated within
periphery of 10.0 km. from the lease area.
8) Proposed annual production of the mineral.
Opencast Other than fully Mechanised method of mining will be adopted in the lease area.
The proposed annual production is 36,289 TPA of Laterite, Ochre and Clay.
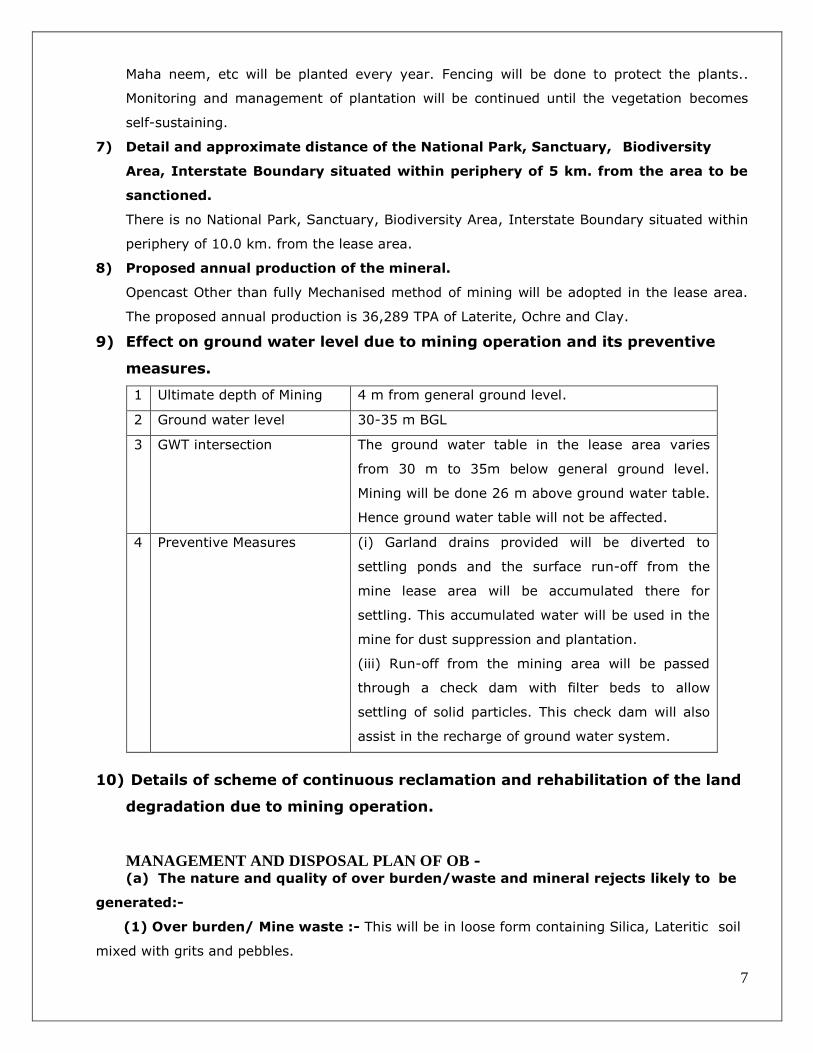
9) Effect on ground water level due to mining operation and its preventive
measures.
1 Ultimate depth of Mining 4 m from general ground level.
2 Ground water level 30-35 m BGL
3 GWT intersection The ground water table in the lease area varies
from 30 m to 35m below general ground level.
Mining will be done 26 m above ground water table.
Hence ground water table will not be affected.
4 Preventive Measures (i) Garland drains provided will be diverted to
settling ponds and the surface run-off from the
mine lease area will be accumulated there for
settling. This accumulated water will be used in the
mine for dust suppression and plantation.
(iii) Run-off from the mining area will be passed
through a check dam with filter beds to allow
settling of solid particles. This check dam will also
assist in the recharge of ground water system.
10) Details of scheme of continuous reclamation and rehabilitation of the land
degradation due to mining operation.
MANAGEMENT AND DISPOSAL PLAN OF OB -
(a) The nature and quality of over burden/waste and mineral rejects likely to be
generated:-
(1) Over burden/ Mine waste :- This will be in loose form containing Silica, Lateritic soil
mixed with grits and pebbles.
8
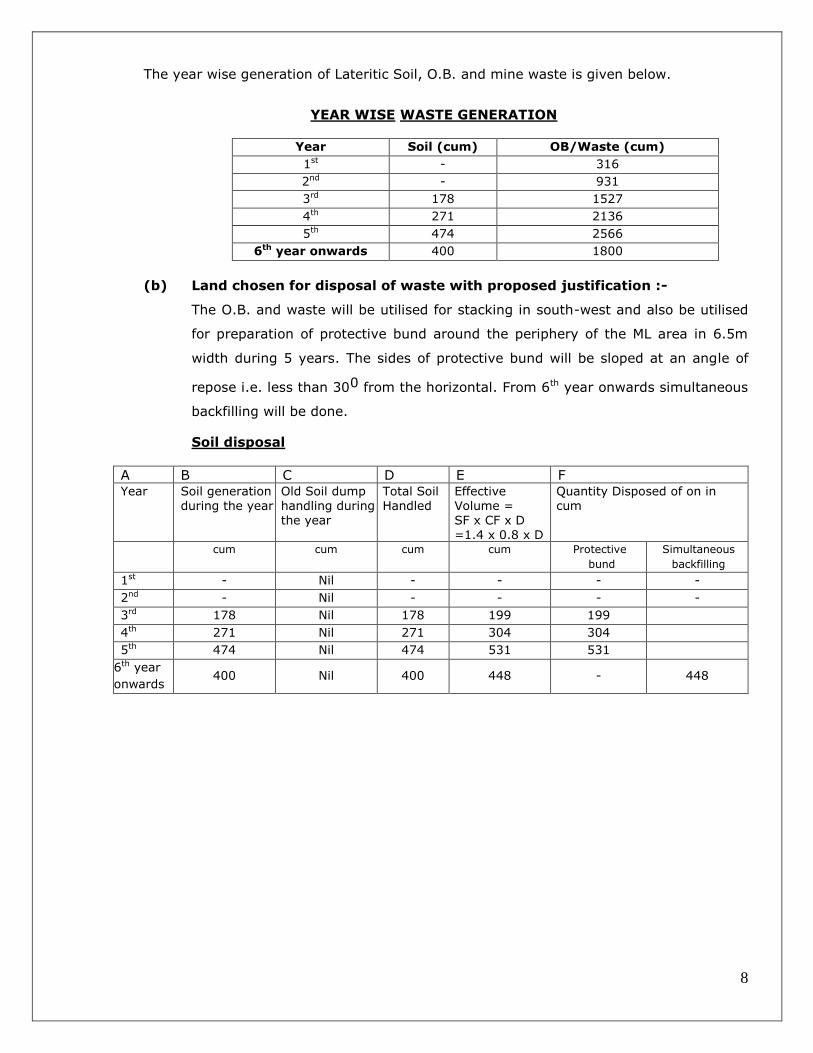
The year wise generation of Lateritic Soil, O.B. and mine waste is given below.
YEAR WISE WASTE GENERATION
Year Soil (cum) OB/Waste (cum)
1st - 316
2nd - 931
3rd 178 1527
4th 271 2136
5th 474 2566
6th year onwards 400 1800
(b) Land chosen for disposal of waste with proposed justification :-
The O.B. and waste will be utilised for stacking in south-west and also be utilised
for preparation of protective bund around the periphery of the ML area in 6.5m
width during 5 years. The sides of protective bund will be sloped at an angle of
repose i.e. less than 300 from the horizontal. From 6th year onwards simultaneous
backfilling will be done.
Soil disposal
A B C D E F Year Soil generation
during the year Old Soil dump handling during the year
Total Soil Handled
Effective Volume = SF x CF x D =1.4 x 0.8 x D
Quantity Disposed of on in cum
cum cum cum cum Protective
bund
Simultaneous
backfilling
1st - Nil - - - -
2nd - Nil - - - -
3rd 178 Nil 178 199 199
4th 271 Nil 271 304 304
5th 474 Nil 474 531 531
6th year
onwards 400 Nil 400 448 - 448
9
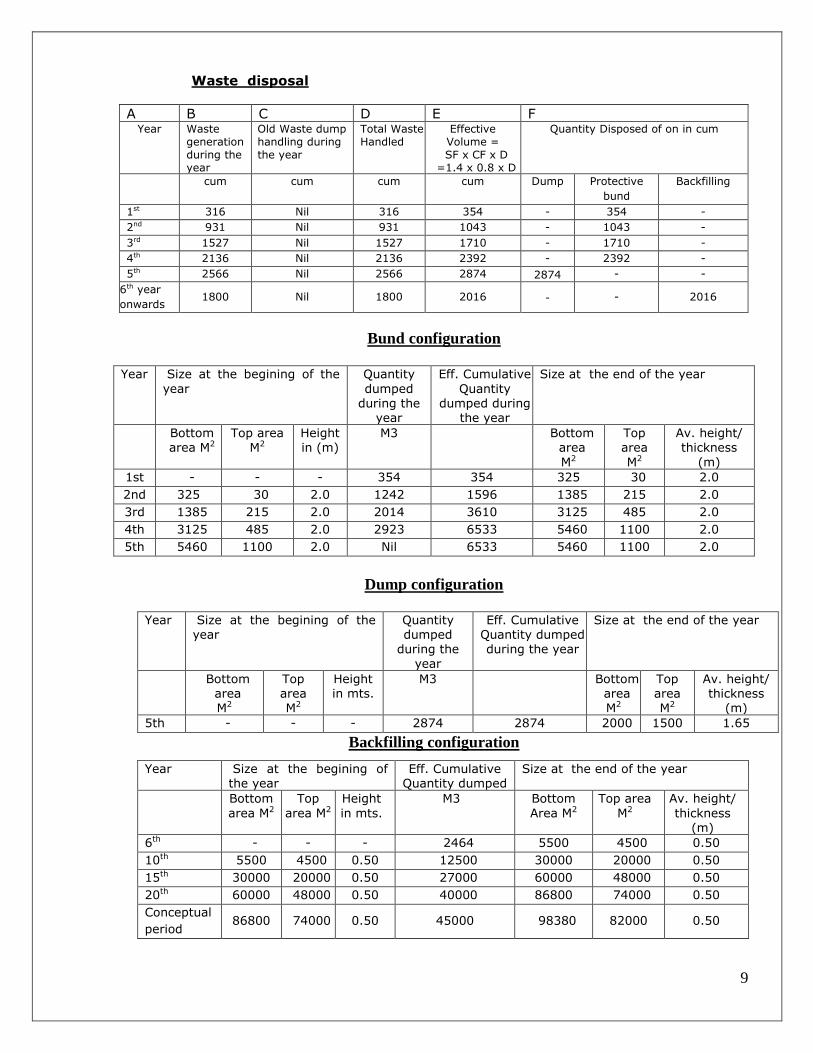
Waste disposal
A B C D E F Year Waste
generation during the year
Old Waste dump handling during the year
Total Waste Handled
Effective Volume = SF x CF x D
=1.4 x 0.8 x D
Quantity Disposed of on in cum
cum cum cum cum Dump Protective
bund
Backfilling
1st 316 Nil 316 354 - 354 -
2nd 931 Nil 931 1043 - 1043 -
3rd 1527 Nil 1527 1710 - 1710 -
4th 2136 Nil 2136 2392 - 2392 -
5th 2566 Nil 2566 2874 2874 - -
6th year
onwards 1800 Nil 1800 2016 - - 2016
Bund configuration
Year Size at the begining of the
year
Quantity
dumped during the
year
Eff. Cumulative
Quantity dumped during
the year
Size at the end of the year
Bottom area M2
Top area M2
Height in (m)
M3 Bottom area
M2
Top area
M2
Av. height/ thickness
(m)
1st - - - 354 354 325 30 2.0
2nd 325 30 2.0 1242 1596 1385 215 2.0
3rd 1385 215 2.0 2014 3610 3125 485 2.0
4th 3125 485 2.0 2923 6533 5460 1100 2.0
5th 5460 1100 2.0 Nil 6533 5460 1100 2.0
Dump configuration
Year Size at the begining of the
year Quantity dumped
during the year
Eff. Cumulative Quantity dumped during the year
Size at the end of the year
Bottom area M2
Top area M2
Height in mts.
M3 Bottom area M2
Top area M2
Av. height/ thickness
(m)
5th - - - 2874 2874 2000 1500 1.65
Backfilling configuration
Year Size at the begining of the year
Eff. Cumulative Quantity dumped
Size at the end of the year
Bottom
area M2
Top
area M2
Height
in mts.
M3 Bottom
Area M2
Top area
M2
Av. height/
thickness
(m)
6th - - - 2464 5500 4500 0.50
10th 5500 4500 0.50 12500 30000 20000 0.50
15th 30000 20000 0.50 27000 60000 48000 0.50
20th 60000 48000 0.50 40000 86800 74000 0.50
Conceptual
period 86800 74000 0.50 45000 98380 82000 0.50
10
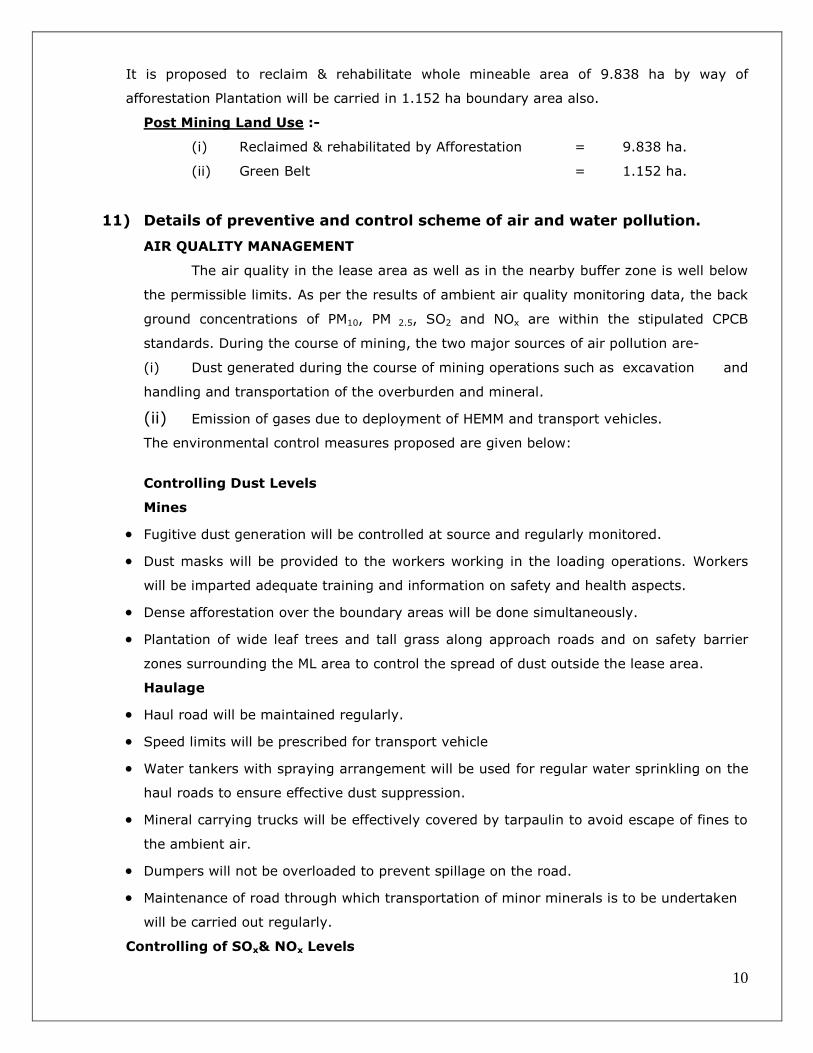
It is proposed to reclaim & rehabilitate whole mineable area of 9.838 ha by way of
afforestation Plantation will be carried in 1.152 ha boundary area also.
Post Mining Land Use :-
(i) Reclaimed & rehabilitated by Afforestation = 9.838 ha.
(ii) Green Belt = 1.152 ha.
11) Details of preventive and control scheme of air and water pollution.
AIR QUALITY MANAGEMENT
The air quality in the lease area as well as in the nearby buffer zone is well below
the permissible limits. As per the results of ambient air quality monitoring data, the back
ground concentrations of PM10, PM 2.5, SO2 and NOx are within the stipulated CPCB
standards. During the course of mining, the two major sources of air pollution are-
(i) Dust generated during the course of mining operations such as excavation and
handling and transportation of the overburden and mineral.
(ii) Emission of gases due to deployment of HEMM and transport vehicles.
The environmental control measures proposed are given below:
Controlling Dust Levels
Mines
Fugitive dust generation will be controlled at source and regularly monitored.
Dust masks will be provided to the workers working in the loading operations. Workers
will be imparted adequate training and information on safety and health aspects.
Dense afforestation over the boundary areas will be done simultaneously.
Plantation of wide leaf trees and tall grass along approach roads and on safety barrier
zones surrounding the ML area to control the spread of dust outside the lease area.
Haulage
Haul road will be maintained regularly.
Speed limits will be prescribed for transport vehicle
Water tankers with spraying arrangement will be used for regular water sprinkling on the
haul roads to ensure effective dust suppression.
Mineral carrying trucks will be effectively covered by tarpaulin to avoid escape of fines to
the ambient air.
Dumpers will not be overloaded to prevent spillage on the road.
Maintenance of road through which transportation of minor minerals is to be undertaken
will be carried out regularly.
Controlling of SOx& NOx Levels

11
The source of SOx & NOx would be due to vehicular emissions. This can be controlled by
Periodic maintenance and servicing of the HEMM & trucks/dumpers used in mining and
allied activities will be done as per manual of and/or at regular interval to reduce smoke
emissions.
Ambient air quality monitoring will be carried out as per CPCB norms except monsoon
season.
Vehicular emissions will be kept under control and regularly monitored.
Water Quality Management
The lease area is undulating land. The general slope is towards South-West. The main
drainage of the area is through seasonal water courses situated in south and south-west
side of the applied area which merges in to Bah Nalla. This ultimately merges in to Kaneri
Nadi in south flowing towards south-west. Adequate control measures will be adopted to
check not only the wash-off from erosion but also uncontrolled flow of runoff from mine.
Mining activities may cause adverse impacts due to mine drainage, Siltation due to storm
water and contaminated water from dump. In order to mitigate the likely impacts the
following management has been proposed.
Surface water
The major concern is the silt and the fine suspended particulate matter carried by the
surface run-off from the mining area during the monsoon to seasonal water course
towards south causing siltation in the buffer zone.
Following measures are proposed as part of the management plan to check the pollution
of surface water bodies due to mining and dumping.
The lease area is undulating with general slope towards south-West. In order to
avoid surface run off at lower level as well as over flow to seasonal water courses,
garland drain will be provided towards southern periphery of section 2.0m x 1m along
with settling tank of 30.0m x 6.0m x 2.0m in SW, SE and southern side . The protective
bund will also be prepared around the periphery of the ML area. Plantation will be raised
on it. The sides of protective bund will be sloped at an angle of repose i.e. less than 450
from the horizontal. Short trenches and holes will be made to further avoid run off.
Garland drains provided along the UPL boundary will be diverted to settling ponds
and the surface run-off from the lease area will be accumulated there for settling. This
accumulated water will be used in the mine for dust suppression and plantation. This will
also assist in the recharge of ground water system. The settling tank will be constructed
at the lowest level in the ML area in south.

12
The settling tank will be periodically de-silted before the onset of monsoon.
There is no top soil in the lease area. The OB/waste will be simultaneously
backfilled in the mined out area. The sides will be adequately sloped and vegetated.
12) Provision for separate stacking of surface soil excavated from mining
operation and its utility.
The lateritic soil will be used for topping of the backfilled area on which afforestation will
be done.
13) Details of social and economic up gradation of mining effected area
due to proposed project.
The Project will bring economical benefits to the state by the way of Royalty for
mineral and to the local people by way of direct and indirect employment opportunities.
The mine management will also help the nearby villages by providing aid to school,
conducting medical and social awareness camps, helping in formation of self help groups,
etc. especially keeping in view the tribal and economically backward population in the
area. Thus the project will bring about socio-economic improvement of the area and will
prove beneficial to the area.
Proposed facilities:
Provision of green belt along the mining lease boundary
Direct Employment to about 65 numbers of persons from nearby villages.
Indirect employment opportunities to about 45 persons from the nearby
villages.
Arrangements for safe and healthy working conditions
Provision of Drinking water to nearby villages through tankers in dry period.
Medical facilities and Health check-up camps for the workers
Conducting medical camps in nearby villages at regular interval.
14) Details of budgetary arrangement for environment management Budget for Environmental protection
Particulars Capital Cost
(Rs.)
Recurring Cost
(Rs.)/year
Dust suppression (Water Tanker with Sprinkler) 7,50,000 2,00,000
Garland drain and settling tank etc 2,00,000 25,000
Pollution Monitoring -- 50,000
Green belt & afforestation - 1,00,000
Tarpaulin and cover for stack of ore 50,000 25,000
Total 10,50,000 4,00,000

13
Budget under Corporate Social Responsibility
S. No. Activities Allocation of
fund per annum
A Construction of toilets for girls with water facility in village Amoch 75,000/-
B Maintenance of Approach road 1,00,000/-
C Community Health checkup 50,000
D Water supply in dry season 75,000
Total 3,00,000/-
PP will take CSR activities in the region through the gram panchayat and additional fund will
be generated as well as activity will be done on need based assessment as well as demand
by Panchayat.
(15) ENVIRONMENTAL MONITROING PROGRAM
15.1 INTRODUCTION
Success of any environmental management program depends upon the efficiency of the
organizational set up responsible for the implementation of the program. Regular monitoring of
the various environmental parameters is also necessary to evaluate the effectiveness of the
management program so that the necessary corrective measures can be taken in case there are
some drawbacks in the proposed program. Since environmental quality parameters at work zone
and surrounding areas are important for maintaining sound operating practices of the project in
line with conformity with environmental regulations, the post project monitoring work forms part
of EMP. Monitoring program will be followed till the mining operations cease; every year as per
the schedule below:
15.1.1 Air Quality Monitoring
One location in core zone and three locations in the buffer zone will be monitored for once per
season except monsoon.
15.1.2 Noise Levels Monitoring
Noise levels in the working area will be monitored once in every month till the continuation of
operations. Ambient noise levels will also be monitored once in a season in the buffer zone to
evaluate the noise levels in surrounding community.
15.1.3 Water Quality Monitoring
Water environment will be assessed periodically for both surface water and ground water.
Surface water quality will be monitored at identified ponds/water bodies during all four seasons.
Surface water flow through the major nalla downstream will be measured at least once a month
during monsoon and co-relate with the total rainfall during the season to estimate the relative

14
changes, if any. Ground water level and quality on seasonal basis will be assessed in the
open/dug wells to evaluate the impacts of ongoing operations. Water levels will also be
monitored on seasonal basis in surrounding wells.
15.1.4 Plantation
Before the onset of monsoon season, will be done progressively till the final closure of the mine.
15.1.5 Ecological Monitoring
Half yearly monitoring of afforestation program will be done for the survival rate and plant
growth within the core zone.
15.2 METHODOLOGY ADOPTED
Post project monitoring will be carried out as per conditions stipulated in environmental
clearance letter issued by MOEF, consent issued by SPCB as well as according to CPCB
guidelines. The project site is considered as core zone and the area lying within 10 km radius
from the mine site is considered as buffer zone, where some impacts may be observed on
physical and biological environment. In the buffer zone, slight impact may be observed and that
too is occasional, table below showing the details of Post Project Monitoring Programme:
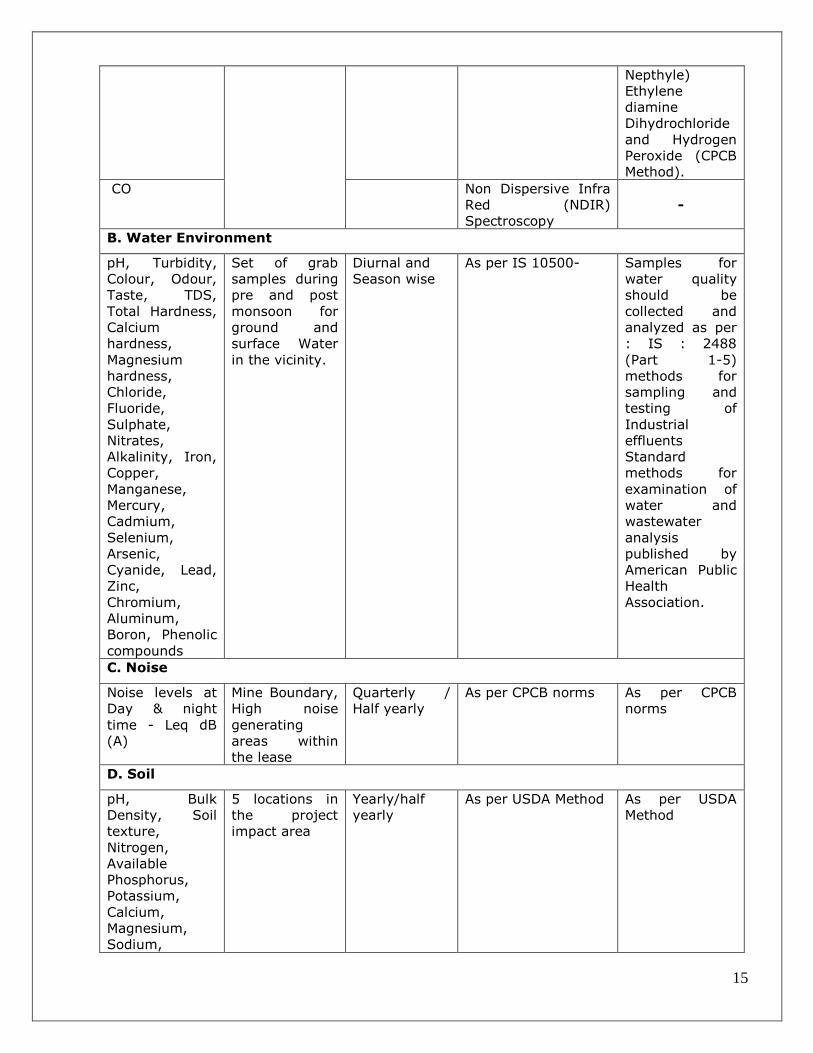
Post Project Monitoring Programme
Attributes Sampling Measurement
Method
Test
Procedure Network Frequency
A. Air Environment
Meteorological
Wind direction
Relative
humidity
Rainfall
Minimum1 site
in the project
impact area
Regularly in
one season by
Weather
Monitoring
Station
Mechanical/automatic
weather station
-
Pollutants
PM10
4 locations in
the project
impact area
(Minimum 2
locations in
upwind side, 2
sites in
downwind side
/ impact zone)
Revised
National
Ambient Air
Quality
Standards
(NAAWS) vide
MoEF circular,
dated
16.11.2009
Gravimetric method -
PM2.5 Gravimetric method -
SO2 EPA Modified West &
Geake method
Absorption in
Potassium Tetra
Chloromercurate
followed by
Colorimetric
estimation using
P-Rosaniline
hydrochloride
and
Formaldehyde
(IS: 5182 Part -
II).
NO2 Arsenite modified
Jacob & Hochheiser
Absorption in
dil. NaOH and
then estimated
colorimetrically
with
sulphanilamide
and N (I-
15
Nepthyle)
Ethylene
diamine
Dihydrochloride
and Hydrogen
Peroxide (CPCB
Method).
CO Non Dispersive Infra
Red (NDIR)
Spectroscopy
-
B. Water Environment
pH, Turbidity,
Colour, Odour,
Taste, TDS,
Total Hardness,
Calcium
hardness,
Magnesium
hardness,
Chloride,
Fluoride,
Sulphate,
Nitrates,
Alkalinity, Iron,
Copper,
Manganese,
Mercury,
Cadmium,
Selenium,
Arsenic,
Cyanide, Lead,
Zinc,
Chromium,
Aluminum,
Boron, Phenolic
compounds
Set of grab
samples during
pre and post
monsoon for
ground and
surface Water
in the vicinity.
Diurnal and
Season wise
As per IS 10500- Samples for
water quality
should be
collected and
analyzed as per
: IS : 2488
(Part 1-5)
methods for
sampling and
testing of
Industrial
effluents
Standard
methods for
examination of
water and
wastewater
analysis
published by
American Public
Health
Association.
C. Noise
Noise levels at
Day & night
time - Leq dB
(A)
Mine Boundary,
High noise
generating
areas within
the lease
Quarterly /
Half yearly
As per CPCB norms As per CPCB
norms
D. Soil
pH, Bulk
Density, Soil
texture,
Nitrogen,
Available
Phosphorus,
Potassium,
Calcium,
Magnesium,
Sodium,
5 locations in
the project
impact area
Yearly/half
yearly
As per USDA Method As per USDA
Method

16
Electrical
Conductivity,
Organic Matter,
Chloride
E. Socioeconomic
Demographic
structure
Infrastructure
resource base
Economic
resource base
Health status:
Morbidity
pattern Cultural
and Aesthetic
attributes
Education
Socioeconomic
survey is based
on
proportionate,
stratified and
random
sampling
method
Minimum for
two phases of
the project
Primary data
collection through
questionnaire
Secondary data
from census
records,
statistical hard
books, topo
sheets, health
records and
relevant official
records
available with
Govt. agencies
15.3 LOCATIONS OF MONITORING STATIONS
The location of the monitoring stations will be selected on the basis of prevailing micro –
meteorological conditions of the area like Wind direction & wind speed, Relative Humidity,
Temperature. 3 to 4 AAQM stations will be selected (including minimum 2 locations in upwind
side, more sites in downwind side / impact zone) to assess ambient air quality of the area.
Noise level monitoring will be carried out on lease boundary & in high noise generating area
within the lease. Water & soil monitoring locations will be decided on the basis of general slope
of the area & drainage pattern. Locations for the post project monitoring shall be as under:
Post Project Monitoring Locations
S. No. Description Location
1. Ambient Air Quality Mine site, Villages in downwind direction
from the mine site
2. Meteorological data Mine site
3. Noise Level Monitoring Mine Boundary, High noise generating
areas within the Mine boundary
4. Water Level & Quality Nearby Surface & Ground water sources
5. Health Check-up Workers
6. Monitoring of Agricultural crops In the nearby area (on yearly basis)
7. Socio – economic status In the nearby area (on yearly basis)
15.4 DATA ANALYSIS
Monitoring data analysis will be done as per CPCB guidelines by approved laboratory & shall be
submitted to concern authority (specified in Environment Clearance Letter issued by MoEF &
Consent issued by SPCB) on regular basis.
15.5- Organizational Setup
In order to develop and implement the environmental monitoring and management plan,
Dhausada Laterite Mine is having an Environmental Cell, headed by the environmental officer
reporting to head of the project.
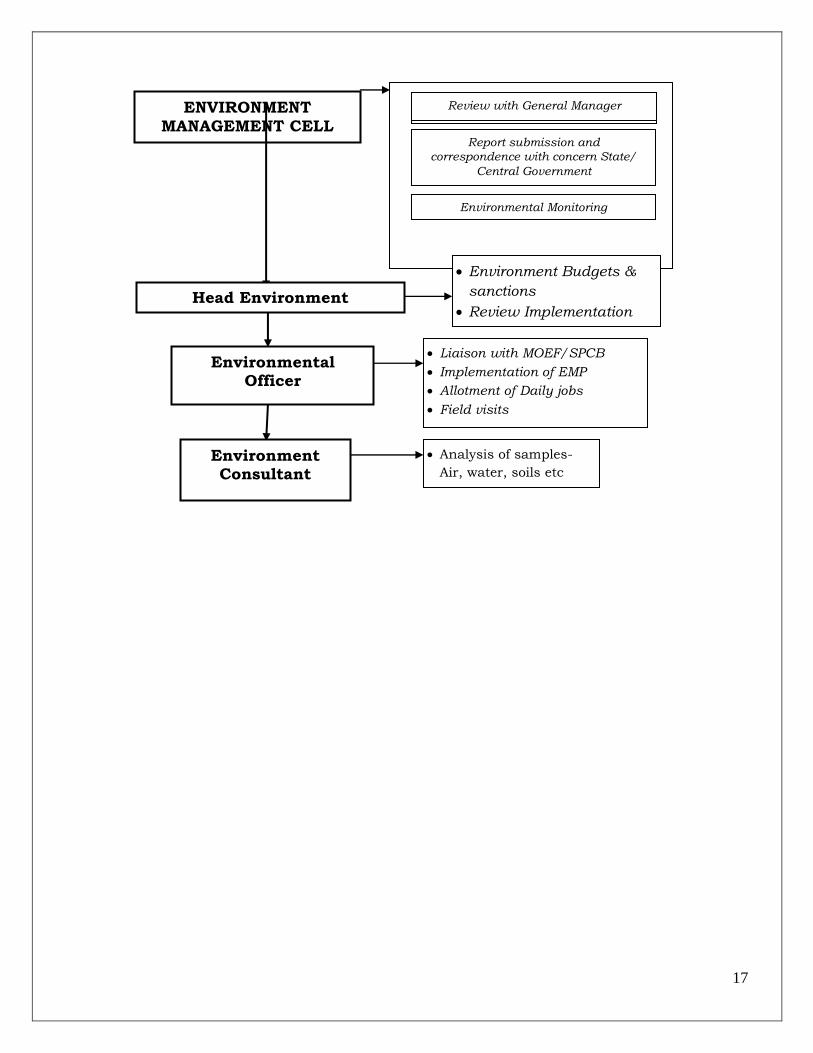
17
ENVIRONMENT
MANAGEMENT CELL
Implementation of Control/Measure Review with General Manager
Report submission and
correspondence with concern State/
Central Government
Environmental Monitoring
Environmental Officer
Head Environment
Liaison with MOEF/SPCB
Implementation of EMP
Allotment of Daily jobs
Field visits
Analysis of samples-
Air, water, soils etc
Environment Budgets &
sanctions
Review Implementation
Environment Consultant
18
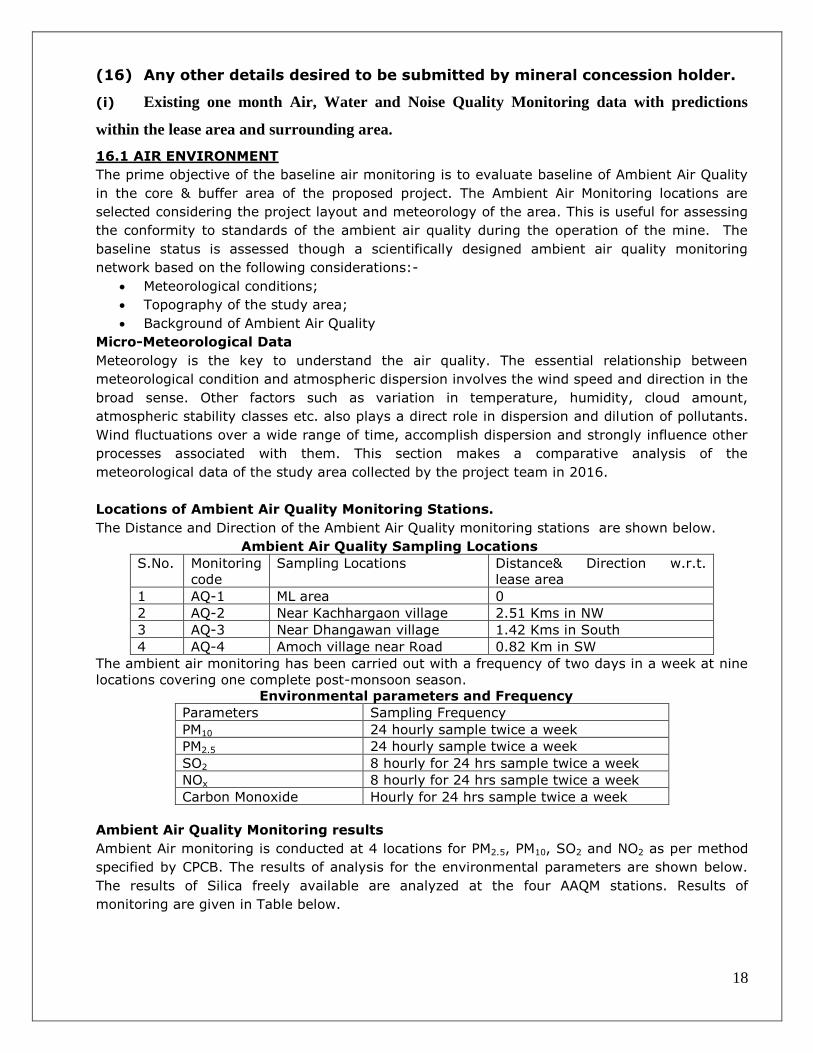
(16) Any other details desired to be submitted by mineral concession holder.
(i) Existing one month Air, Water and Noise Quality Monitoring data with predictions
within the lease area and surrounding area.
16.1 AIR ENVIRONMENT
The prime objective of the baseline air monitoring is to evaluate baseline of Ambient Air Quality
in the core & buffer area of the proposed project. The Ambient Air Monitoring locations are
selected considering the project layout and meteorology of the area. This is useful for assessing
the conformity to standards of the ambient air quality during the operation of the mine. The
baseline status is assessed though a scientifically designed ambient air quality monitoring
network based on the following considerations:-
Meteorological conditions;
Topography of the study area;
Background of Ambient Air Quality
Micro-Meteorological Data
Meteorology is the key to understand the air quality. The essential relationship between
meteorological condition and atmospheric dispersion involves the wind speed and direction in the
broad sense. Other factors such as variation in temperature, humidity, cloud amount,
atmospheric stability classes etc. also plays a direct role in dispersion and dilution of pollutants.
Wind fluctuations over a wide range of time, accomplish dispersion and strongly influence other
processes associated with them. This section makes a comparative analysis of the
meteorological data of the study area collected by the project team in 2016.
Locations of Ambient Air Quality Monitoring Stations.
The Distance and Direction of the Ambient Air Quality monitoring stations are shown below.
Ambient Air Quality Sampling Locations
S.No. Monitoring
code
Sampling Locations Distance& Direction w.r.t.
lease area
1 AQ-1 ML area 0
2 AQ-2 Near Kachhargaon village 2.51 Kms in NW
3 AQ-3 Near Dhangawan village 1.42 Kms in South
4 AQ-4 Amoch village near Road 0.82 Km in SW
The ambient air monitoring has been carried out with a frequency of two days in a week at nine
locations covering one complete post-monsoon season.
Environmental parameters and Frequency
Parameters Sampling Frequency
PM10 24 hourly sample twice a week
PM2.5 24 hourly sample twice a week
SO2 8 hourly for 24 hrs sample twice a week
NOx 8 hourly for 24 hrs sample twice a week
Carbon Monoxide Hourly for 24 hrs sample twice a week
Ambient Air Quality Monitoring results
Ambient Air monitoring is conducted at 4 locations for PM2.5, PM10, SO2 and NO2 as per method
specified by CPCB. The results of analysis for the environmental parameters are shown below.
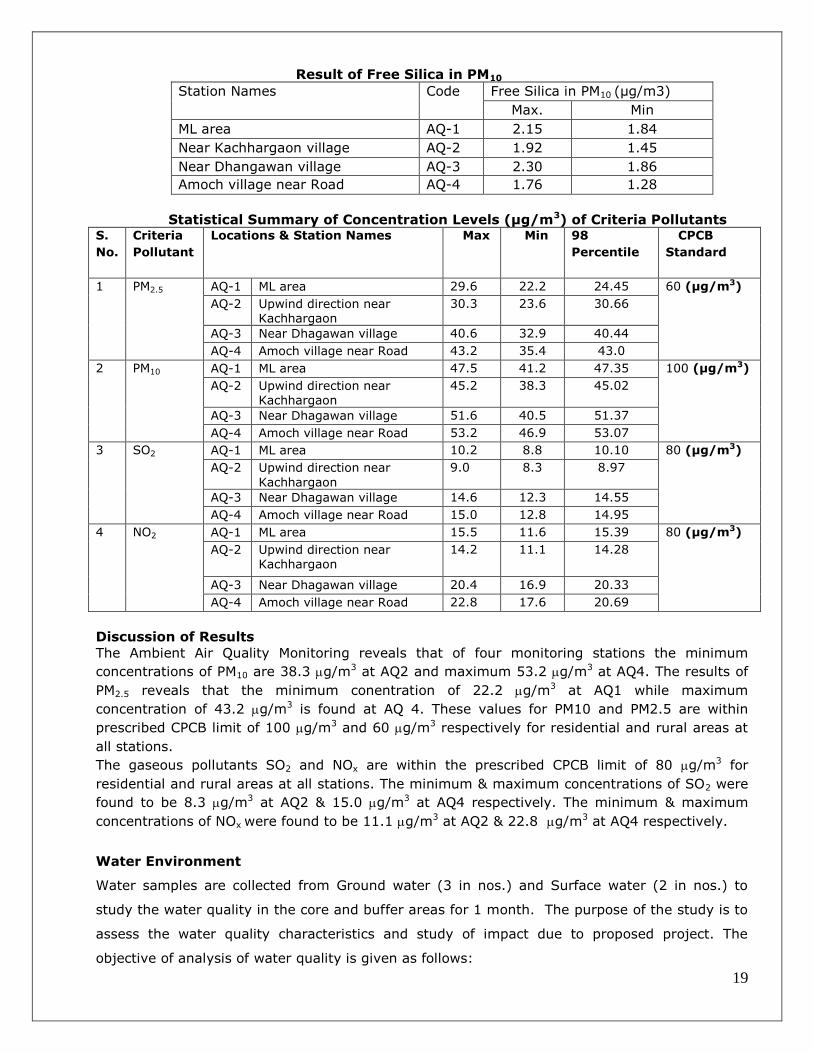
The results of Silica freely available are analyzed at the four AAQM stations. Results of
monitoring are given in Table below.
19
Result of Free Silica in PM10
Station Names Code Free Silica in PM10 (µg/m3)
Max. Min
ML area AQ-1 2.15 1.84
Near Kachhargaon village AQ-2 1.92 1.45
Near Dhangawan village AQ-3 2.30 1.86
Amoch village near Road AQ-4 1.76 1.28
Statistical Summary of Concentration Levels (µg/m3) of Criteria Pollutants S.
No.
Criteria
Pollutant
Locations & Station Names Max Min 98
Percentile
CPCB
Standard
1 PM2.5 AQ-1 ML area 29.6 22.2 24.45 60 (µg/m3)
AQ-2 Upwind direction near Kachhargaon
30.3 23.6 30.66
AQ-3 Near Dhagawan village 40.6 32.9 40.44
AQ-4 Amoch village near Road 43.2 35.4 43.0
2 PM10 AQ-1 ML area 47.5 41.2 47.35 100 (µg/m3)
AQ-2 Upwind direction near Kachhargaon
45.2 38.3 45.02
AQ-3 Near Dhagawan village 51.6 40.5 51.37
AQ-4 Amoch village near Road 53.2 46.9 53.07
3 SO2 AQ-1 ML area 10.2 8.8 10.10 80 (µg/m3)
AQ-2 Upwind direction near
Kachhargaon
9.0 8.3 8.97
AQ-3 Near Dhagawan village 14.6 12.3 14.55
AQ-4 Amoch village near Road 15.0 12.8 14.95
4 NO2 AQ-1 ML area 15.5 11.6 15.39 80 (µg/m3)
AQ-2 Upwind direction near Kachhargaon
14.2 11.1 14.28
AQ-3 Near Dhagawan village 20.4 16.9 20.33
AQ-4 Amoch village near Road 22.8 17.6 20.69
Discussion of Results
The Ambient Air Quality Monitoring reveals that of four monitoring stations the minimum
concentrations of PM10 are 38.3 g/m3 at AQ2 and maximum 53.2 g/m3 at AQ4. The results of
PM2.5 reveals that the minimum conentration of 22.2 g/m3 at AQ1 while maximum
concentration of 43.2 g/m3 is found at AQ 4. These values for PM10 and PM2.5 are within
prescribed CPCB limit of 100 g/m3 and 60 g/m3 respectively for residential and rural areas at
all stations.
The gaseous pollutants SO2 and NOx are within the prescribed CPCB limit of 80 g/m3 for
residential and rural areas at all stations. The minimum & maximum concentrations of SO2 were
found to be 8.3 g/m3 at AQ2 & 15.0 g/m3 at AQ4 respectively. The minimum & maximum
concentrations of NOx were found to be 11.1 g/m3 at AQ2 & 22.8 g/m3 at AQ4 respectively.
Water Environment
Water samples are collected from Ground water (3 in nos.) and Surface water (2 in nos.) to
study the water quality in the core and buffer areas for 1 month. The purpose of the study is to
assess the water quality characteristics and study of impact due to proposed project. The
objective of analysis of water quality is given as follows:

20
Objective of water analysis is discussed as follows:
To evaluate the impacts on people, agriculture productivity, habitation, recreational
resources and aesthetics environment.
To evaluate the physical, chemical and biological properties of water quality in the study
area.
To assess the water quality & characteristics;
To predict the likely impacts on water quality due to the mining and related activities.
Surface Water Quality
The natural treatment of the water current takes places for a considerable length from the place
of origin as the ultraviolet radiation due to sun is quite high in the upper reaches. The applied
lease area is free of industrial pollutants.
Ground Water Quality Assessment
The sources of potable water are the hand pumps, tub-wells & dug well situated near by villages
in the study area. Samples were collected from the available water resources around the applied
mine lease area. The samples were collected & tested from different sites. Total of 5 samples
were taken (3 for ground water & 2 for surface water). The Distance and direction of the
monitoring locations are given as follows:
Table : Ground Water Sampling Locations
S.No. Monitoring
code
Sampling Locations Distance & Direction
1 GW-1 Kachhargaon 2.58 NW
2 GW-2 Dinari Khamaria 6.6 Km in SW
3 GW-3 kuan 6.4 Km in NW
Analysis and Results of Water samples
S. No.
Parameter Ground Water Analysis Unit Requirement (Acceptable Limit)
Permissible Limit GW-1 GW-2 GW-3
Organoleptic & Physical parameters
1. Colour <5.0 <5.0 <5.0 Hazen Unit 5 15
2. Odour Agreeable Agreeable Agreeable - Agreeable Agreeable
3. Taste Agreeable Agreeable Agreeable - Agreeable -
4. Turbidity 3.1 2.1 2.5 NTU 1 5
5. pH value 8.1 7.8 8.0 - 6.5-8.5 -
6. TotalDissolve Solid (TDS)
284 255 340 mg/l 500 2000
General Properties -
7. Aluminum (as Al)
BDL BDL BDL mg/l 0.03 0.2
8. Total Ammonia
BDL BDL BDL mg/l - -
9. Anionic Detergents (as MBAS)
BDL BDL BDL mg/l 0.2 1.0
11. Bicarbonate 110 96 121 mg/l Not Specified Not Specified
12. Calcium(as Ca)
43.9 39.1 43.0 mg/l 75 200
13. Chloride (as Cl)
83 76.2 82 mg/l 250 1000
14. Copper (as Cu)
BDL BDL BDL mg/l 0.05 1.5
21
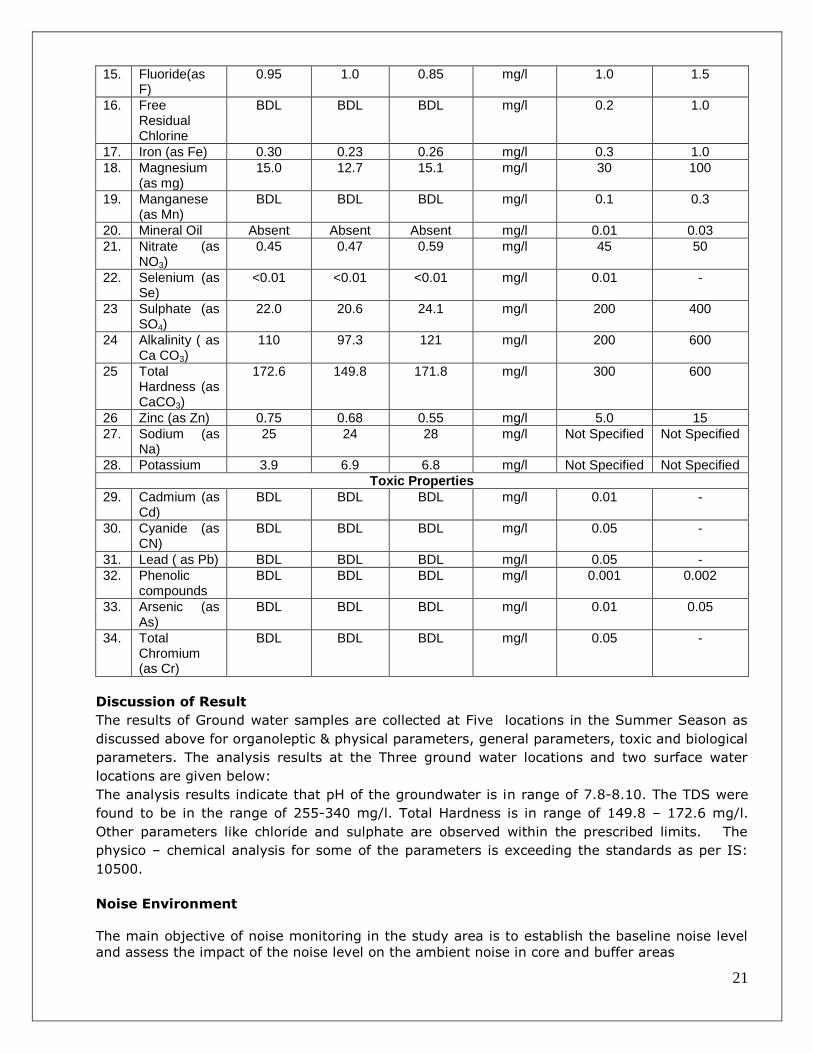
15. Fluoride(as F)
0.95 1.0 0.85 mg/l 1.0 1.5
16. Free Residual Chlorine
BDL BDL BDL mg/l 0.2 1.0
17. Iron (as Fe) 0.30 0.23 0.26 mg/l 0.3 1.0
18. Magnesium (as mg)
15.0 12.7 15.1 mg/l 30 100
19. Manganese (as Mn)
BDL BDL BDL mg/l 0.1 0.3
20. Mineral Oil Absent Absent Absent mg/l 0.01 0.03
21. Nitrate (as NO3)
0.45 0.47 0.59 mg/l 45 50
22. Selenium (as Se)
<0.01 <0.01 <0.01 mg/l 0.01 -
23 Sulphate (as SO4)
22.0 20.6 24.1 mg/l 200 400
24 Alkalinity ( as Ca CO3)
110 97.3 121 mg/l 200 600
25 Total Hardness (as CaCO3)
172.6 149.8 171.8 mg/l 300 600
26 Zinc (as Zn) 0.75 0.68 0.55 mg/l 5.0 15
27. Sodium (as Na)
25 24 28 mg/l Not Specified Not Specified
28. Potassium 3.9 6.9 6.8 mg/l Not Specified Not Specified
Toxic Properties
29. Cadmium (as Cd)
BDL BDL BDL mg/l 0.01 -
30. Cyanide (as CN)
BDL BDL BDL mg/l 0.05 -
31. Lead ( as Pb) BDL BDL BDL mg/l 0.05 -
32. Phenolic compounds
BDL BDL BDL mg/l 0.001 0.002
33. Arsenic (as As)
BDL BDL BDL mg/l 0.01 0.05
34. Total Chromium (as Cr)
BDL BDL BDL mg/l 0.05 -
Discussion of Result
The results of Ground water samples are collected at Five locations in the Summer Season as
discussed above for organoleptic & physical parameters, general parameters, toxic and biological
parameters. The analysis results at the Three ground water locations and two surface water
locations are given below:
The analysis results indicate that pH of the groundwater is in range of 7.8-8.10. The TDS were
found to be in the range of 255-340 mg/l. Total Hardness is in range of 149.8 – 172.6 mg/l.
Other parameters like chloride and sulphate are observed within the prescribed limits. The
physico – chemical analysis for some of the parameters is exceeding the standards as per IS:
10500.
Noise Environment
The main objective of noise monitoring in the study area is to establish the baseline noise level
and assess the impact of the noise level on the ambient noise in core and buffer areas
22
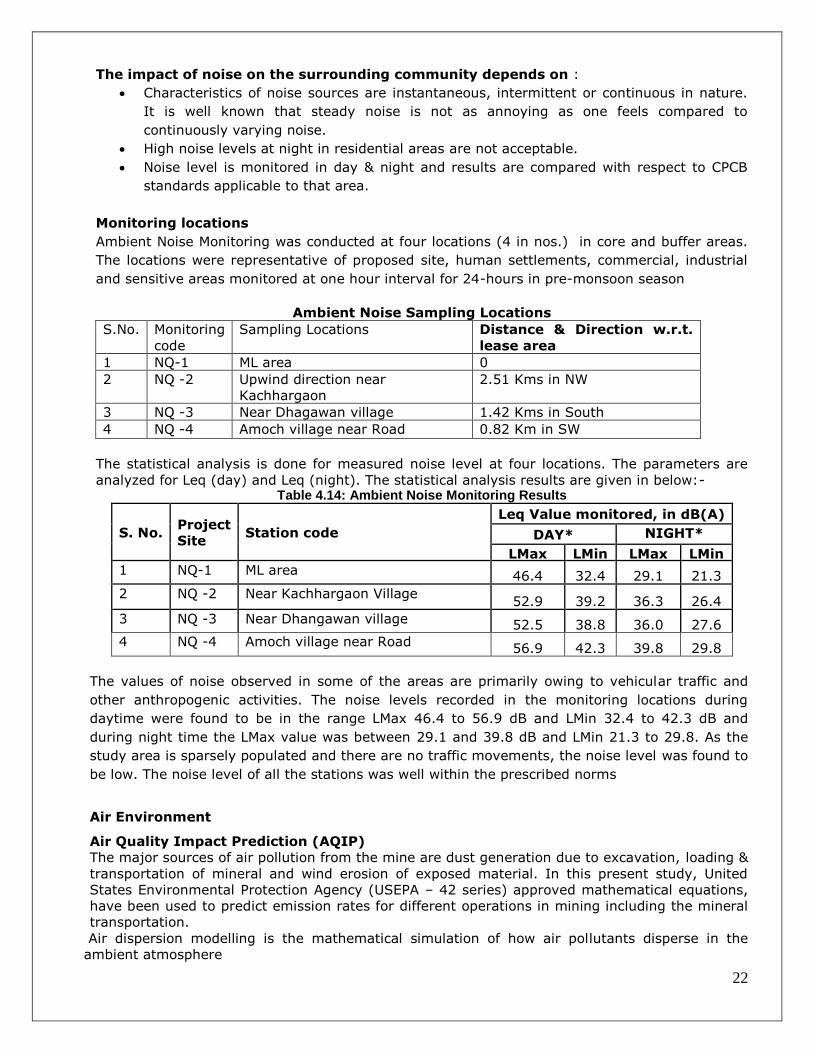
The impact of noise on the surrounding community depends on :
Characteristics of noise sources are instantaneous, intermittent or continuous in nature.
It is well known that steady noise is not as annoying as one feels compared to
continuously varying noise.
High noise levels at night in residential areas are not acceptable.
Noise level is monitored in day & night and results are compared with respect to CPCB
standards applicable to that area.
Monitoring locations
Ambient Noise Monitoring was conducted at four locations (4 in nos.) in core and buffer areas.
The locations were representative of proposed site, human settlements, commercial, industrial
and sensitive areas monitored at one hour interval for 24-hours in pre-monsoon season
Ambient Noise Sampling Locations
S.No. Monitoring
code
Sampling Locations Distance & Direction w.r.t.
lease area
1 NQ-1 ML area 0
2 NQ -2 Upwind direction near
Kachhargaon 2.51 Kms in NW
3 NQ -3 Near Dhagawan village 1.42 Kms in South
4 NQ -4 Amoch village near Road 0.82 Km in SW
The statistical analysis is done for measured noise level at four locations. The parameters are
analyzed for Leq (day) and Leq (night). The statistical analysis results are given in below:- Table 4.14: Ambient Noise Monitoring Results
S. No. Project
Site Station code
Leq Value monitored, in dB(A)
DAY* NIGHT*
LMax LMin LMax LMin
1 NQ-1 ML area 46.4 32.4 29.1 21.3
2 NQ -2 Near Kachhargaon Village 52.9 39.2 36.3 26.4
3 NQ -3 Near Dhangawan village 52.5 38.8 36.0 27.6
4 NQ -4 Amoch village near Road 56.9 42.3 39.8 29.8
The values of noise observed in some of the areas are primarily owing to vehicular traffic and
other anthropogenic activities. The noise levels recorded in the monitoring locations during
daytime were found to be in the range LMax 46.4 to 56.9 dB and LMin 32.4 to 42.3 dB and
during night time the LMax value was between 29.1 and 39.8 dB and LMin 21.3 to 29.8. As the
study area is sparsely populated and there are no traffic movements, the noise level was found to
be low. The noise level of all the stations was well within the prescribed norms
Air Environment
Air Quality Impact Prediction (AQIP)
The major sources of air pollution from the mine are dust generation due to excavation, loading &
transportation of mineral and wind erosion of exposed material. In this present study, United
States Environmental Protection Agency (USEPA – 42 series) approved mathematical equations,
have been used to predict emission rates for different operations in mining including the mineral
transportation.
Air dispersion modelling is the mathematical simulation of how air pollutants disperse in the
ambient atmosphere
23
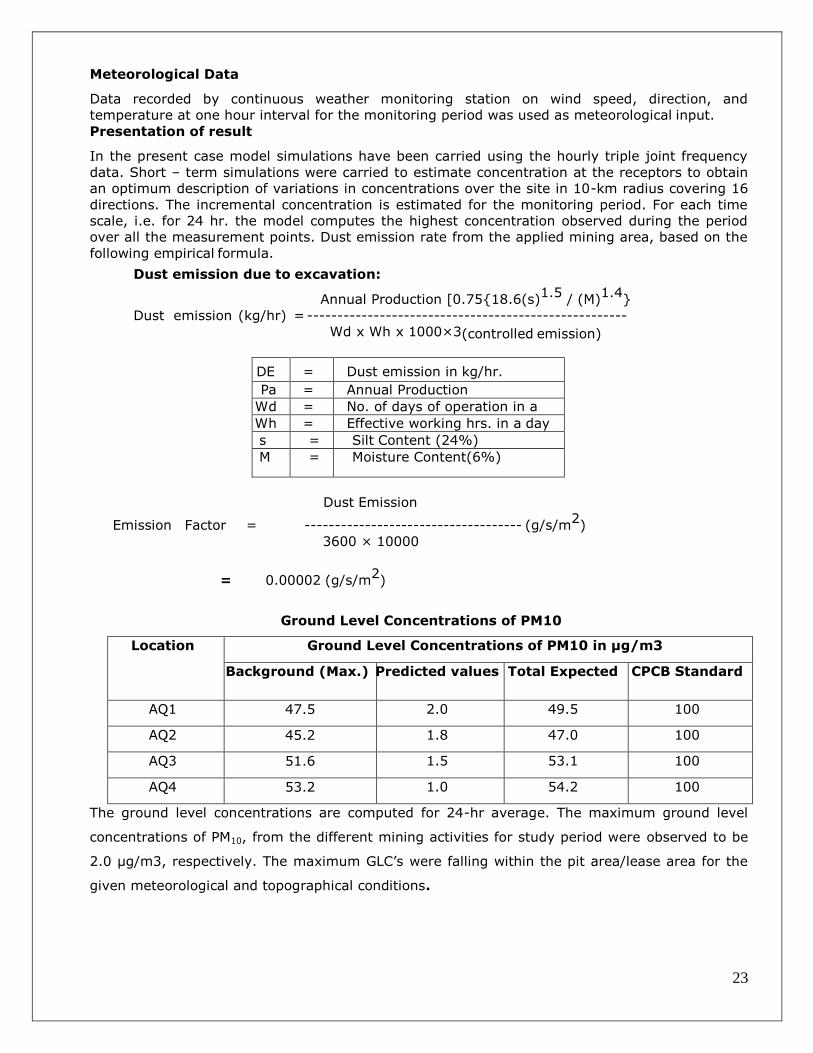
Meteorological Data
Data recorded by continuous weather monitoring station on wind speed, direction, and
temperature at one hour interval for the monitoring period was used as meteorological input.
Presentation of result
In the present case model simulations have been carried using the hourly triple joint frequency
data. Short – term simulations were carried to estimate concentration at the receptors to obtain
an optimum description of variations in concentrations over the site in 10-km radius covering 16
directions. The incremental concentration is estimated for the monitoring period. For each time
scale, i.e. for 24 hr. the model computes the highest concentration observed during the period
over all the measurement points. Dust emission rate from the applied mining area, based on the
following empirical formula.
Dust emission due to excavation:
Annual Production [0.75{18.6(s)1.5
/ (M)1.4
}
Dust emission (kg/hr) = -----------------------------------------------------
Wd x Wh x 1000×3(controlled emission)
DE = Dust emission in kg/hr.
Pa = Annual Production
Wd = No. of days of operation in a
year Wh = Effective working hrs. in a day
s = Silt Content (24%)
M = Moisture Content(6%)
Dust Emission
Emission Factor = ------------------------------------ (g/s/m2)
3600 × 10000
= 0.00002 (g/s/m2)
Ground Level Concentrations of PM10
Location Ground Level Concentrations of PM10 in µg/m3
Background (Max.) Predicted values Total Expected CPCB Standard
AQ1 47.5 2.0 49.5 100
AQ2 45.2 1.8 47.0 100
AQ3 51.6 1.5 53.1 100
AQ4 53.2 1.0 54.2 100
The ground level concentrations are computed for 24-hr average. The maximum ground level
concentrations of PM10, from the different mining activities for study period were observed to be
2.0 μg/m3, respectively. The maximum GLC’s were falling within the pit area/lease area for the
given meteorological and topographical conditions.
24
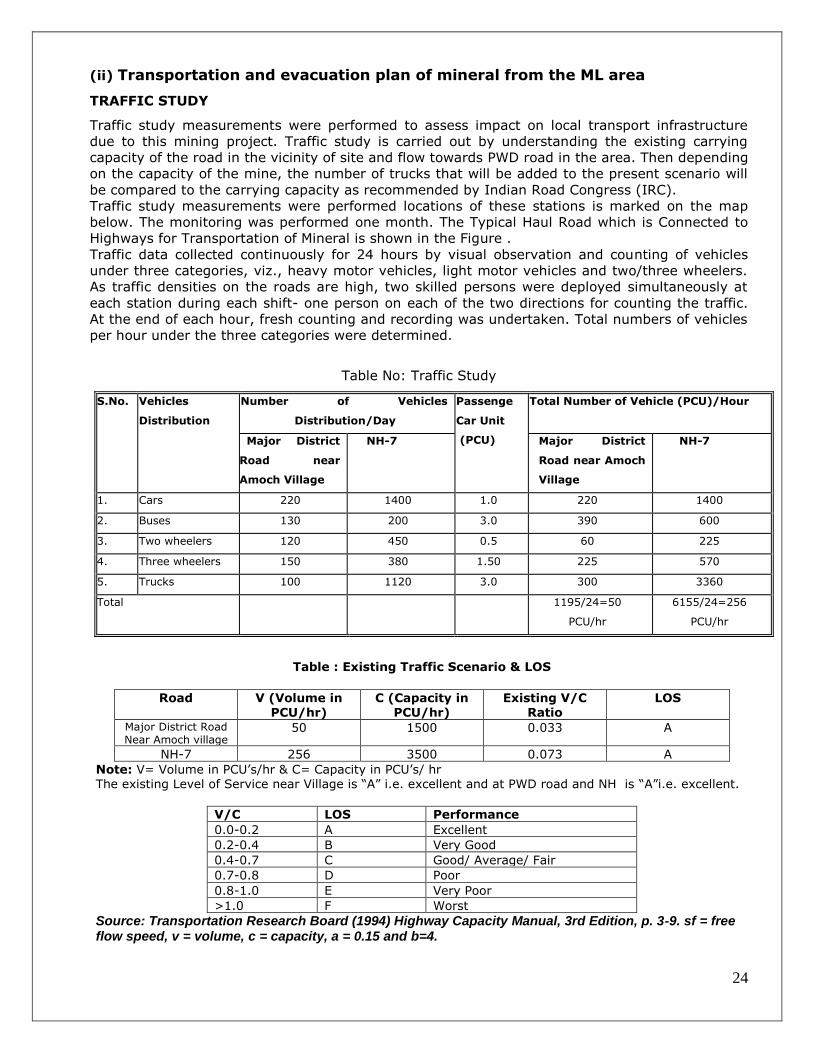
(ii) Transportation and evacuation plan of mineral from the ML area
TRAFFIC STUDY
Traffic study measurements were performed to assess impact on local transport infrastructure
due to this mining project. Traffic study is carried out by understanding the existing carrying
capacity of the road in the vicinity of site and flow towards PWD road in the area. Then depending
on the capacity of the mine, the number of trucks that will be added to the present scenario will
be compared to the carrying capacity as recommended by Indian Road Congress (IRC).
Traffic study measurements were performed locations of these stations is marked on the map
below. The monitoring was performed one month. The Typical Haul Road which is Connected to
Highways for Transportation of Mineral is shown in the Figure .
Traffic data collected continuously for 24 hours by visual observation and counting of vehicles
under three categories, viz., heavy motor vehicles, light motor vehicles and two/three wheelers.
As traffic densities on the roads are high, two skilled persons were deployed simultaneously at
each station during each shift- one person on each of the two directions for counting the traffic.
At the end of each hour, fresh counting and recording was undertaken. Total numbers of vehicles
per hour under the three categories were determined.
Table No: Traffic Study
S.No. Vehicles
Distribution
Number of Vehicles
Distribution/Day
Passenge
Car Unit
(PCU)
Total Number of Vehicle (PCU)/Hour
Major District
Road near
Amoch Village
NH-7 Major District
Road near Amoch
Village
NH-7
1. Cars 220 1400 1.0 220 1400
2. Buses 130 200 3.0 390 600
3. Two wheelers 120 450 0.5 60 225
4. Three wheelers 150 380 1.50 225 570
5. Trucks 100 1120 3.0 300 3360
Total
1195/24=50
PCU/hr
6155/24=256
PCU/hr
Table : Existing Traffic Scenario & LOS
Road V (Volume in PCU/hr)
C (Capacity in PCU/hr)
Existing V/C Ratio
LOS
Major District Road Near Amoch village
50 1500 0.033 A
NH-7 256 3500 0.073 A
Note: V= Volume in PCU’s/hr & C= Capacity in PCU’s/ hr The existing Level of Service near Village is “A” i.e. excellent and at PWD road and NH is “A”i.e. excellent.
V/C LOS Performance
0.0-0.2 A Excellent
0.2-0.4 B Very Good
0.4-0.7 C Good/ Average/ Fair
0.7-0.8 D Poor
0.8-1.0 E Very Poor
>1.0 F Worst
Source: Transportation Research Board (1994) Highway Capacity Manual, 3rd Edition, p. 3-9. sf = free flow speed, v = volume, c = capacity, a = 0.15 and b=4.
25
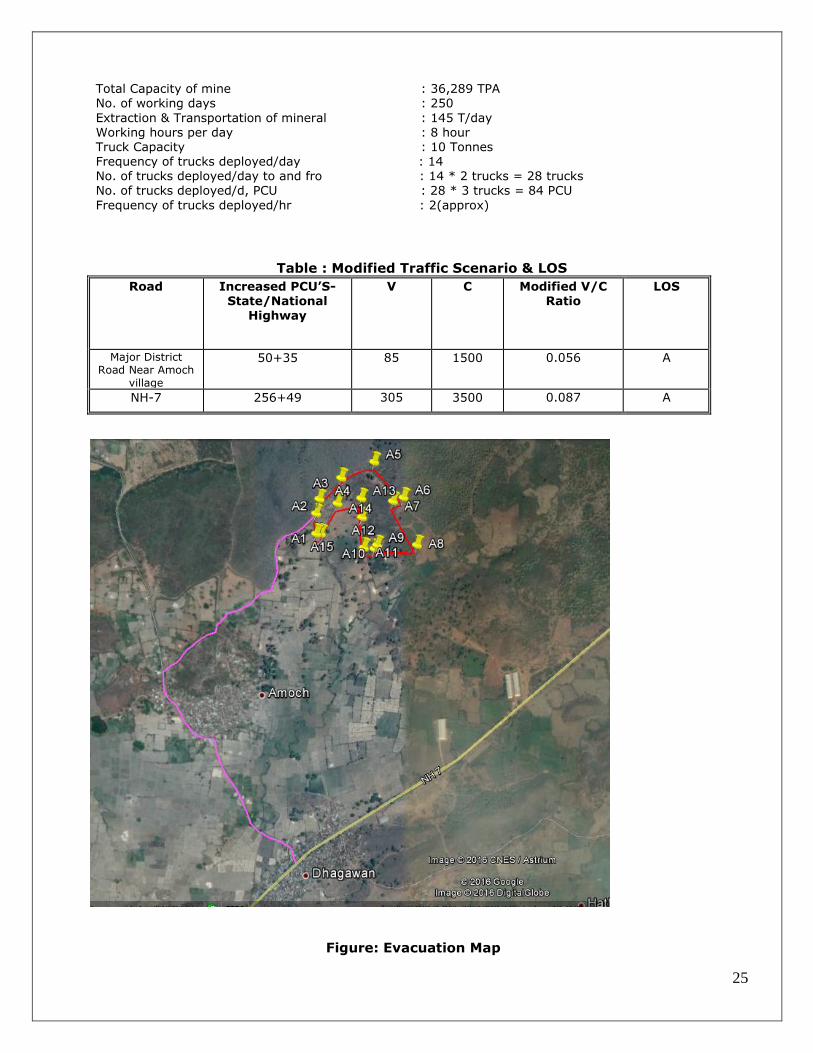
Total Capacity of mine : 36,289 TPA No. of working days : 250
Extraction & Transportation of mineral : 145 T/day Working hours per day : 8 hour Truck Capacity : 10 Tonnes Frequency of trucks deployed/day : 14 No. of trucks deployed/day to and fro : 14 * 2 trucks = 28 trucks No. of trucks deployed/d, PCU : 28 * 3 trucks = 84 PCU
Frequency of trucks deployed/hr : 2(approx)
Table : Modified Traffic Scenario & LOS
Road Increased PCU’S- State/National
Highway
V C Modified V/C Ratio
LOS
Major District Road Near Amoch
village
50+35 85 1500 0.056 A
NH-7 256+49 305 3500 0.087 A
Figure: Evacuation Map
26
(iii) Site services :-
Following Site services has been provided as per the provisions of Mines Act 1952, MMR 1961
and Mines Rules 1955.
1.Office and stores :- Office and stores will be provided as per Rules within the applied area..
2.First Aid :- Specified first Aid station will be maintained at the site office and the rest shelter
as per Mines Act-1952. The mines manager and other statutory personnel will be the qualified
person to render first aid to the injured and will be the holder of a valid first aid certificate.
3. Drinking water facility, rest shelters, toilet and urinal .will be provided.
(iv) Water requirement & Source - Total water requirement for dust suppression, plantation
and drinking is 10m3/day. Water will be sourced from bore well near site services and quarry
sump.
(v) Occupational Health and Safety :-
(a) Induction training and refresher training will be imparted as per Mines Act.
(b) All protective equipments like boots, ear plug, dust mask etc. will be provided to workers
(c) Periodic health survey for occupational health status of workers.
(d) Doctor (specialist in occupational health and safety) will be engaged to implement the
proposed OH&S management
(e) Budget of Rs. 0.50 lakhs have been earmarked for occupational health activities and
Training per annum.
(f) Besides enough care, a well equipped first aid room is available in case of any accident.
The Environment Management plan is simultaneous process concurrent with the mining
operation. Dust suppression measures and water pollution control measures will be under taken
by the lessee as practiced at present.
Sanjay K. Singh
(EIA Coordinator)
Date : 21.04.2015
Signature of Applicant
SMT. JYOTI GARG
W/O SH. ASHISH GARG
(Owner)