ENV GLOBAL FORUM OCT 2016 - Opening Session - A. Markandya
26
Natural Capital and Economic Growth: Past Evidence and Future Prospects Anil Markandya Basque Centre for Climate Change and Bath University October 2016
-
Upload
oecd-environment -
Category
Presentations & Public Speaking
-
view
64 -
download
1
Transcript of ENV GLOBAL FORUM OCT 2016 - Opening Session - A. Markandya

Natural Capital and Economic Growth: Past Evidence and Future Prospects
Anil Markandya
Basque Centre for Climate Change and Bath University
October 2016

The Questions
1. How have environmental services or natural capital contributed to growth in the past?
2. How will they contribute to growth in the future?
3. More effort so far on 2. than on 1!
4. In answering questions 1) and 2), how do we measure economic growth?
5. The aim is to understand what quantitative analysis of these links tells us and where the gaps are.
2

The Historic Picture?
• The main work on links between growth and environmental quality/natural capital is under the following categories:• The Environmental Kuznets Curve
• Weak and Strong Sustainability (can losses of natural capital be compensated by accumulation of human and physical capital?)
• Has environmental regulation, protecting natural capital and ecosystems had an effect on economic growth?
• The resource curse (countries with high endowments of natural capital often perform worse in terms of growth and development than countries with less endowments).
3

The Environmental Kuznets Curve (EKC)• Growth creates the resources that allow for a greater protection of
the environment. This is the so-called EKC, which shows a “U” shaped relationship between environmental quality and level of development. Huge literature.• Applies well to some pollutants such SO2, NOx, River water quality• Does not apply to GHG emissions and some toxic pollutants• Loss of some biodiversity or ecosystems during development are
irreplaceable.
• EKC does not inform us about the contribution of natural capital or ecosystems to the growth process.
• Cross section relation does not apply for historic experience, which is a function of factors influencing scale, composition and technique of production.
4

Weak and Strong Sustainability
• Weak sustainability argues that a loss of natural capital need not compromise growth if it is replaced by other forms of capital (physical and human).
• Strong sustainability takes the view that natural capital is not so easily substituted and its loss could compromise growth.
• Production function estimates of elasticity of substitution between different forms of capital turn out quite high, favouring a weak sustainability vision.
• But no one can argue that loss of key forms of natural capital would be detrimental to economic performance.
5

Weak and Strong Sustainability
• Natural capital is considered important -- an interim conclusion for the UK by the natural capital committee is that economic prospects could be diminished as a result of declining natural capital.
• Unfortunately there is very little historic evidence that the loss of natural capital has compromised economic growth. This is an area that needs further research.
• One pathway is the link between loss of natural capital and human health. Mortality and morbidity-related losses due to air pollution cause a loss of GDP – estimate for the UK is losses from 1990 have caused a 4% lower GDP by 2010.
6
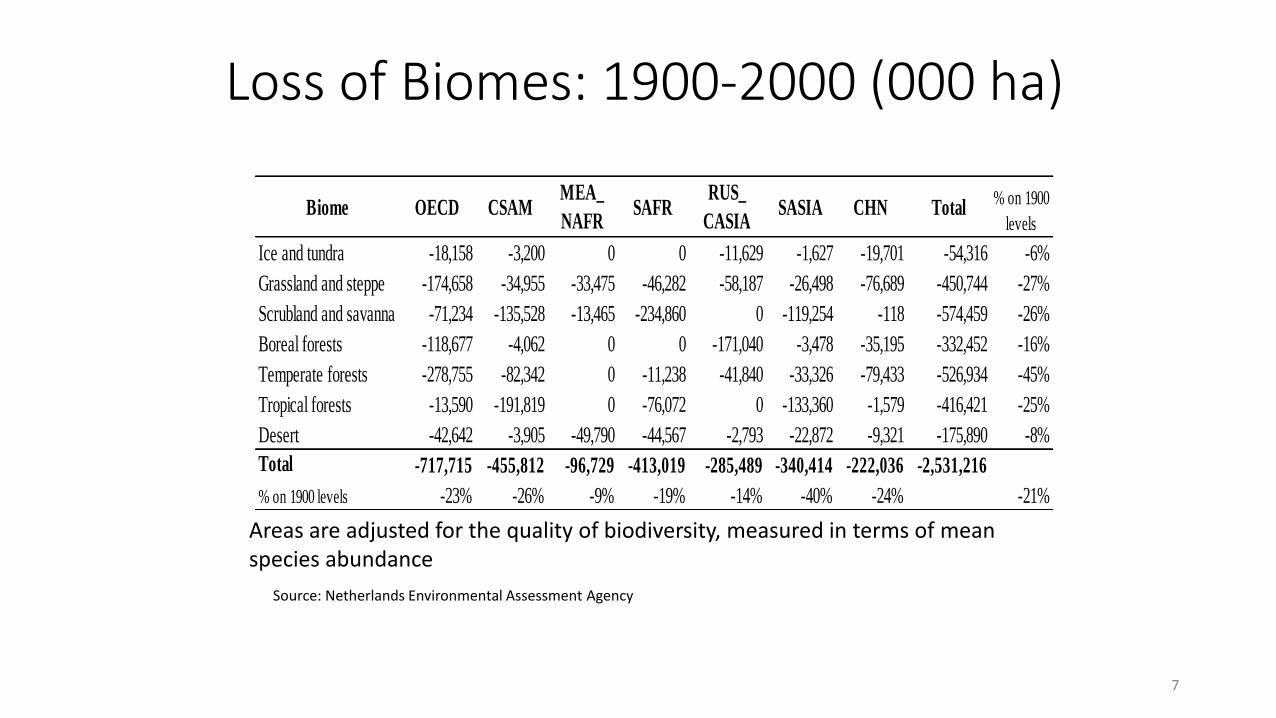
Loss of Biomes: 1900-2000 (000 ha)
7
Ice and tundra -18,158 -3,200 0 0 -11,629 -1,627 -19,701 -54,316 -6%
Grassland and steppe -174,658 -34,955 -33,475 -46,282 -58,187 -26,498 -76,689 -450,744 -27%
Scrubland and savanna -71,234 -135,528 -13,465 -234,860 0 -119,254 -118 -574,459 -26%
Boreal forests -118,677 -4,062 0 0 -171,040 -3,478 -35,195 -332,452 -16%
Temperate forests -278,755 -82,342 0 -11,238 -41,840 -33,326 -79,433 -526,934 -45%
Tropical forests -13,590 -191,819 0 -76,072 0 -133,360 -1,579 -416,421 -25%
Desert -42,642 -3,905 -49,790 -44,567 -2,793 -22,872 -9,321 -175,890 -8%
Total -717,715 -455,812 -96,729 -413,019 -285,489 -340,414 -222,036 -2,531,216
% on 1900 levels -23% -26% -9% -19% -14% -40% -24% -21%
Total% on 1900
levelsBiome OECD CSAM
MEA_
NAFRSAFR
RUS_
CASIASASIA CHN
Source: Netherlands Environmental Assessment Agency
Areas are adjusted for the quality of biodiversity, measured in terms of mean species abundance

Biome Losses and GDP Change: Links Unclear
8
OECD
CSAM
MENA
SSA
FORMER USSR
S.ASIA
CHINA
0%
500%
1000%
1500%
2000%
2500%
3000%
3500%
4000%
4500%
0 5 10 15 20 25 30 35 40 45
% C
han
ge in
GD
P
% Loss in MSA
Growth in GDP and Loss of MSA: 1900-2000

Natural Capital Is More Important for Low Income Countries But Estimates are Uncertain
9
Country
Produced
Capital
Sub-Soil
Resources
Renewable
NR Intangible Total
Produced
Capital
Sub-Soil
Resources
Renewable
NR Human Total
Brazil 10,941 1,938 5,723 80,023 98,624 13,280 2,055 25,631 42,795 83,761
Germany 77,924 305 4,739 480,314 563,283 102,564 16,353 1,873 255,576 376,366
Kenya 985 1 1,551 4,963 7,499 1,224 0 1,288 6,611 9,122
Kazakhstan n.a n.a n.a n.a n.a 17,417 56,699 782 23,587 98,485
Morocco 3,897 120 1,700 20,339 26,060 5,415 3 1,890 20,927 28,235
World Bank Estimates UN Estimates
Country
Produced
Capital
Sub-Soil
Resources
Renewable
NR Intangible Total
Produced
Capital
Sub-Soil
Resources
Renewable
NR Human Total
Brazil 11% 2% 6% 81% 100% 16% 2% 31% 51% 100%
Germany 14% 0% 1% 85% 100% 27% 4% 0% 68% 100%
Kenya 13% 0% 21% 66% 100% 13% 0% 14% 72% 100%
Kazakhstan n.a n.a n.a n.a n.a 18% 58% 1% 24% 100%
Morocco 15% 0% 7% 78% 100% 19% 0% 7% 74% 100%

Environmental Regulation and Economic Growth
• In general fears that stricter regulation to protect the environment and natural capital may reduce economic performance have been overstated. Even some evidence that they may improve performance by leading to more innovation (Porter Hypothesis).
• International competitiveness effects of environmental measures have mostly been small:• A lot of trade is between countries all affected by same measures• Except for very highly polluting industries costs of compliance are small• Relocation of industry to lower level environmental standard countries has been
relatively rare (although some evidence for this).
• Macroeconomic models based on econometric analysis find lower competitiveness effects or even negligible effects when revenues are recycled via reduction in other taxes. (OECD, 1997)
10

Environmental Legislation & Sulphur: No Impact on GDP Growth
11

The Resource Curse
• The higher the share of natural capital in total, the lower is the growth performance.
• Holds quite widely (R2 0.6) but not universally.
• Compare Botswana and Sierra Leone, both heavily dependent on diamond exports. From 1965 to 1998 Botswana had the highest per capita growth, while Sierra Leone had negative growth and was poorest country in the world in 1998.
• Debate is about the causes – some argue it is explained by quality of institutions, which are determined by history (Acemoglu et al., 2001). Others claim natural resource dependence affects macroeconomic outcomes as well as institutions (Glyfason and Zoega, 2006).
12

The Resource Curse
13

The Resource Curse• Macroeconomic pathways and policies leading to lower growth for
resource abundant countries include:• Fix factor drag (NRs are a fixed factor of production and run into diminishing returns).
• Rent seeking behaviour by producers.
• “Dutch disease” – NR exports drive up real exchange rate.
• NR abundance reduces incentives to accumulate human capital due to high non-wage income.
• NR abundance can crowd out social capital (Sachs and Warner, 1999) and lower investment in physical capital (Glyfason and Zoega, 2006).
• Countries that overcome these problems focus on ensuring transparency in public finances and building strong institutions with a role for civil society.
14
The Picture Looking Forward….
• Effects of climate change on GDP and GDP Growth.•Medium term – to mid 21st century• Longer term – to end 21st century
• Effects of loss of natural capital more widely on GDP growth.• Limits to Growth literature• Literature on loss of ESS
15

Estimates of Economic Costs
• OECD CIRCLE project and many others have looked at the economic effects of climate change.
• The economic costs of climate change to 2050-2060 are small.
• Globally they amount to about 2% of GDP, although they vary quite a lot by region, with South Asia and SS Africa having the highest losses.
• In terms of GDP per capita and reduction in growth, these figures are even smaller.
• More discussion of this in Session 3.
16

Key Messages from the Impact Analysis
• Quantified damages to 2060 are modest if the growth story is true.
• But lack of action to mitigate emissions locks in further increases in temperature beyond 2060 that are not so modest.
• And they have a large uncertainty range. At the upper end of the potential increase modern economies may not function.
• And the changes are irreversible!
25

Is Long Term Growth Possible Given Loss of Natural Capital?
• There are doubts whether we can maintain economic growth indefinitely:• It has only been our experience for the last 200 years of our civilization (prior
to that living standards were cyclical but with no growth)
• Available non-renewable resources and capacities of ecosystems place a limit to growth.
• Limits to Growth literature has argued that even 50 years or so of continued growth is not feasible.
• Projections of collapse in economic growth made in the 1970s by the Limits to Growth Modellers turned out to be incorrect.
26

Is Long Term Growth Possible Given Loss of Natural Capital?
• These models by Meadows et al. have been criticised on the grounds that they assume continued trends in the rate of use of fixed resources, whereas growth is complex and multi-dimensional and can adapt to changes in scarcity.
• An important indicator of scarcity is the price of something. In terms of natural resources, prices have not been rising for most resources (falling costs of exploitation, new discoveries etc…).
• Critics argue that prices are not good indicators of future scarcity.
• The message that growth has to be sensitive to trends in scarcity is well taken.
27

Measuring the Growth of What?
• GDP is a flawed measure of wellbeing.
• Specifically it excludes:• Costs of environmental pollution (recent OECD study shows outdoor air
pollution alone causes 6-9 million premature deaths and costs about 1% of GDP).
• Non-valued ESS for which no market transactions exist.
• Over time the trends in these costs is changing and so a GDP adjusted for these factors will differ from that of conventional GDP.• Most evidence points to increasing loss of non-valued ESS (e.g. marine and
coastal ESS estimated to have declined by 18% between 1997 and 2011).• Environmental pollution is declining in some countries (developed) but rising
in others (developing and emerging).
28

Growth of What?
• Work in this area suggests it may be better to focus on capital rather than GDP – i.e. to measure changes in the stock of all kinds of capital over time.
• This can also be tracked through changes in net savings of capital (i.e. changes in the stock of capital after depreciation and loss of natural capital). Sometimes referred to as Genuine Savings or Net Savings.
• Depending on how strongly you take the view of weak versus strong sustainability you may wish to track total capital and net savings or the components of the stock.
• Data show that changes in capital net of depreciation and losses often show a more negative trend than gross capital formation.
• This is especially true for NR dependent developing countries, but also for developed countries.
29

Net Savings by Region: Growth in MENA and SSA may not be sustainable
30
-40
-30
-20
-10
0
10
20
30
1970 1980 1990 2000
East Asia & Pacif ic
Middle East & North Africa
Sub-Saharan Africa
%GNI
Year

Net Savings in UK: 1975-2010: Tangible wealth changes go negative after 2008
31
Gross savings rates during this time were just under 17%

Concluding Thoughts
• The historic data gives little information on how natural capital has contributed to growth in the past. More work is needed on this.
• Natural capital is an important component of wealth (share is bigger in developing countries) but a higher share can lead to lower growth, especially where it is in the form of mineral wealth. It needs transparency in rent and public finance management and strong accountable institutions to avoid that.
• Strong environmental regulations do not in general compromise conventional growth and could enhance ‘correct’ measures of growth.
32

Concluding Thoughts
• Forward looking analysis that predicted collapse in economic growth due to loss of natural capital has been proved wrong.
• Natural capital and other forms of capital seem to be more substitutable than those who argue about limits to growth believe.
• But losses of ecosystems (especially water-related) in key areas could lead to severe economic losses.
• Projections of the impacts of climate change predict small overall economic losses at the global level to the middle of this century, with some developing countries having larger losses.
• But losses by the end of this century could be quite significant, depending on what climate control ambition is realised. There is a lot of uncertainty about this.
33

Concluding Thoughts
• We need to rethink our growth indicator. Conventional GDP is not a good measure of well being, nor is growth in that GDP a good measure of sustainable growth.
• Net capital formation, taking account of losses of natural capital indicate a number countries that do not have sustainable growth.
• More work is needed to measure natural capital in all forms, including that which supports complex biological and economic systems.
34