ENV GLOBAL FORUM OCT 2016 - Opening Session - Janez Potocnik
50
NATURAL RESOURCES AND ECONOMIC GROWTH OECD GLOBAL FORUM ON ENVIRONMENT OCTOBER, 24th-25th 2016 Janez Potočnik Co-Chair UNEP International Resource Panel (IRP)
-
Upload
oecd-environment -
Category
Presentations & Public Speaking
-
view
110 -
download
1
Transcript of ENV GLOBAL FORUM OCT 2016 - Opening Session - Janez Potocnik
NATURAL RESOURCES AND ECONOMIC GROWTH
OECD GLOBAL FORUM ON ENVIRONMENT
OCTOBER, 24th-25th 2016 Janez Potočnik
Co-Chair UNEP International Resource Panel (IRP)

• Growth of population by a factor 3.7
• Annual extraction of construction materials grew by a factor of 34, ores and minerals by a factor of 27, fossil fuels by a factor of 12, biomass by a factor of 3.6
• Total material extraction grew by a factor of 8
• GHG emissions grew by a factor of 13
• Globalisation
20th CENTURY THE GREAT ACCELERATION

“PLANETARY BOUNDARIES”
Source: Steffen et al. 2015

• Population growth (2050 – 9.7 billion)
• Per capita consumption growth (McKinsey estimates 3 billion consumers moving from low to middle class consumption till 2030)
• Example: China used more cement in the three years 2011-2013 than the USA used in the whole 20th Century
21th CENTURY FACTS WE CAN NOT IGNORE

• Poverty and social inequality (Oxfam Report: 62 people own the same as half of the world and the richest 1% is more wealthy than the rest of the world)
• 60% of ecosystems already degraded or used unsustainably
• Increasing evidence of the climate change threat
21th CENTURY FACTS WE CAN NOT IGNORE
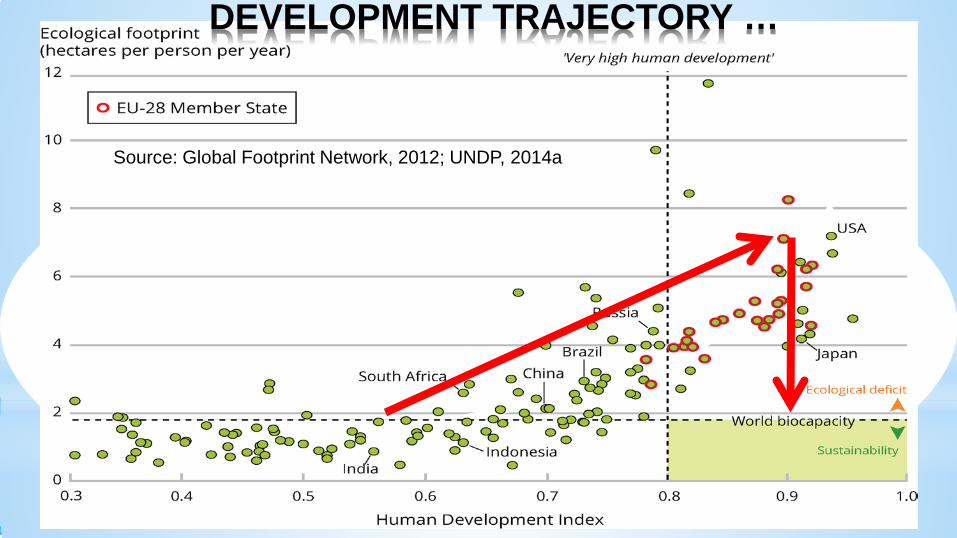
DEVELOPMENT TRAJECTORY …
Source: Global Footprint Network, 2012; UNDP, 2014a

IN THE RECENT SIX MONTH …

THE NEW UNEP IRP MATERIAL FLOW AND RESOURCE PRODUCTIVITY DATA SET
• A coherent account of material use in the global economy and for every nation, complementary to the System of National Accounts
• A large data set covering 40 years (1970–2010) and most countries of the world.
• Presents direct and consumption-based material flow indicators, covering total usage, per capita use and material use per US$.
• Information will help identify opportunities, risks and vulnerabilities related to the global supply of primary materials and show the potential for efficiency gains and reductions in material use in the global economy

SUMMARY OF THE MAIN POINTS (1970-2010)
• Global material use has accelerated
• Material extraction grew unevenly in the global economy
• Trade in materials has grown dramatically and mobilizes primary materials extraction
• Consumption has been stronger driver of material use that population growth
• The richest countries consume on average 10 times more materials as the poorest
• Since 2000 we face an overall decline in material efficiency
• The level of well-being achieved in wealthy industrial countries cannot be generalised globally based on the same system of production and consumption!

AND …
SOLUTIONS
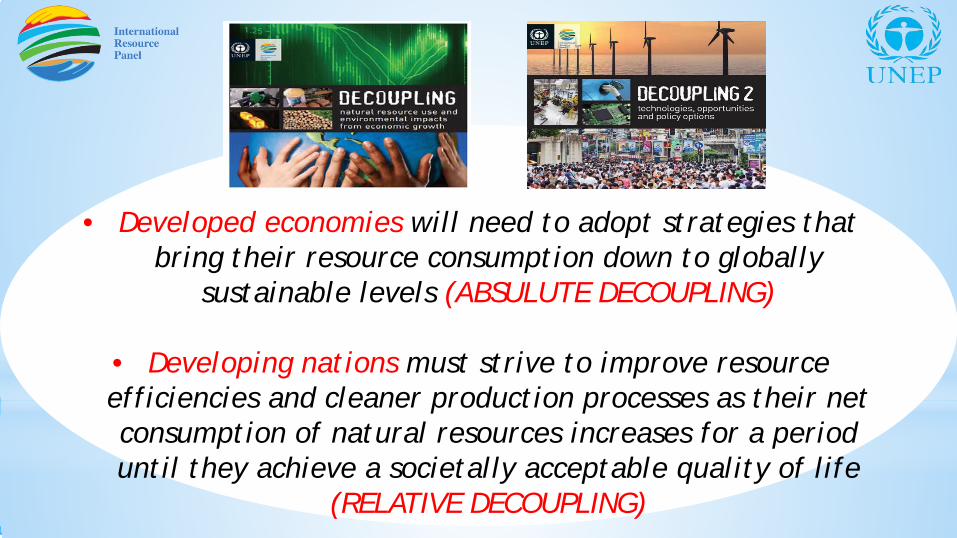
• Developed economies will need to adopt strategies that bring their resource consumption down to globally
sustainable levels (ABSULUTE DECOUPLING)
• Developing nations must strive to improve resource efficiencies and cleaner production processes as their net consumption of natural resources increases for a period until they achieve a societally acceptable quality of life
(RELATIVE DECOUPLING)

IN THE RECENT SIX MONTH …

“With concerted action, there is significant potential for increasing resource efficiency, which will have
numerous benefits for the economy and the environment”

“Improving resource efficiency is
indispensable for meeting climate
change targets cost effectively”
Total anthropogenic GHG emissions (Gt CO2eq per year) by economic sector

LAND MATERIALS GHG WATER
CARBON MANAGEMENT
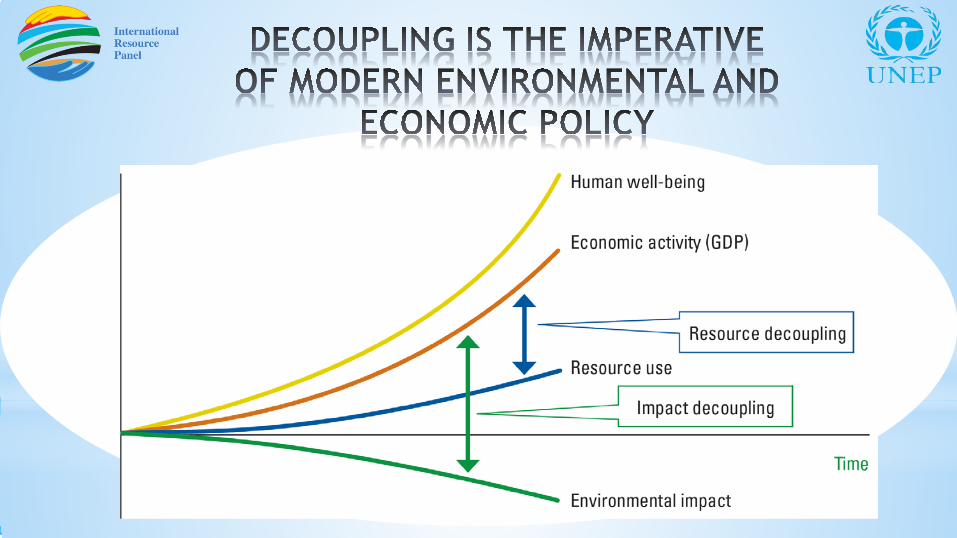
DECOUPLING
CLIMATE
RESOURCES

“Resource efficiency can contribute to economic growth and job creation”
Modelling results differ in size, but all of them show that increasing resource efficiency can lead to higher economic growth and employment, often even when environmental benefits are not accounted.

“There are substantial areas of opportunity for greater resource efficiency ”
The top 15 categories of resource efficiency potential

“Increased resource efficiency is practically attainable”
Energy consumption and saving potential by equipment type in US mining industry

EU APPROACH

1. Hunting and fishing 2. Can take both post-harvest and post-consumer waste as an
input Source: Ellen MacArthur Foundation; McKinsey Center for Business and Environment; Stiftungsfonds Für Umweltökonomie und Nachhaltigkeit (SUN); Drawing from Braungart & McDonough Cradle to Cradle (C2C)
1 PRINCIPLE
Preserve and enhance natural capital by controlling finite stocks and balancing renewable resource flows
2 PRINCIPLE
Optimise resource yields by circulating products, components and materials in use at the highest utility at all times in both technical and biological cycles
3 PRINCIPLE
Foster system effectiveness by revealing and designing out negative externalities

STRUCTURAL WASTE IN THE MOBILITY SYSTEM

The mobility system of tomorrow
Low CO2 level
Parking spots returned to land
Zero accidents
Fewer lanes needed
X X
Personalized multimodal route. Car preferred for last mile
Universal access and higher affordability
Based on individual preferences (e.g. fast vs. cheap, sharing, etc.)
Renewable energy
Shared cars is the norm: autonomous cars on demand
Wireless contents provided to the user
A FUTURE END-STATE COULD LOOK VERY DIFFERENT FROM TODAY’S MOBILITY SITUATION
The car of tomorrow
3D printed
Electric and silent propulsion
Connected
Driverless
Long battery duration
Designed for disassembly
Durable, upgradable and easily repairable
Remanu-factured locally
Illustrative vision
SOURCE: SUN, ELLEN MACARTHUR FOUNDATION AND MCKINSEY & COMPANY: TEAM ANALYSIS

CONCRETE ACTIONS • ECO-DESIGN to include reparability, durability, recyclability
• Legislation on FERTILISERS, including organic and waste-based fertilisers
• Minimum requirements for the REUSE OF WASTEWATER
• Actions on GREEN PUBLIC PROCUREMENT
• FUNDING of €650 million for ‘industry 2020 in the circular economy’
• Quality standards for SECONDARY RAW MATERIALS
• STRATEGY ON PLASTICS, including marine litter
• Interface CHEMICALS, PRODUCTS AND WASTE LEGISLATION

GROWTH WITHIN: A CIRCULAR ECONOMY VISION FOR A COMPETITIVE EUROPE
Shift to advanced materials (less resource intensive) Shift to different technologies (electric vehicles, LED) Shift to different product/service (e.g., car to public transport) Shift to renewable energy (wind, solar, etc.) and materials
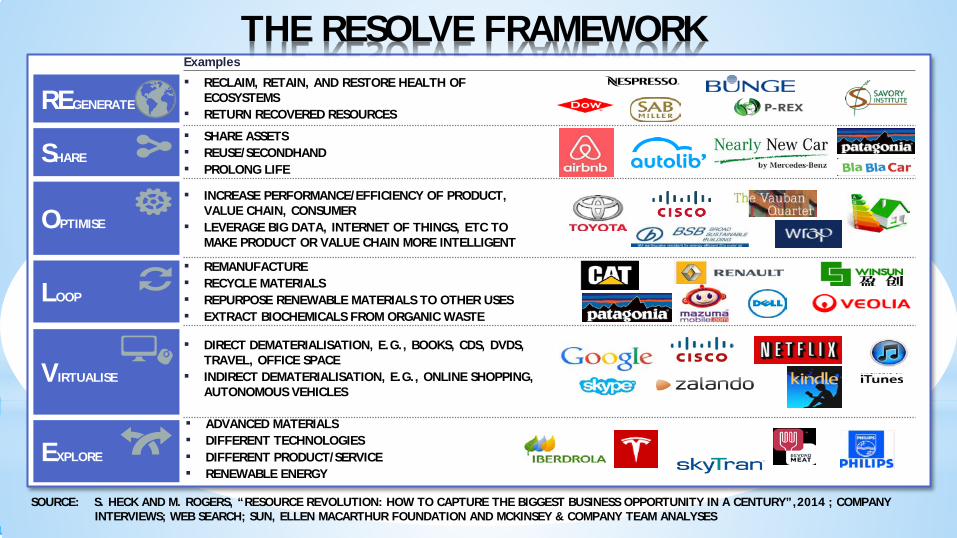
THE RESOLVE FRAMEWORK
SOURCE: S. HECK AND M. ROGERS, “RESOURCE REVOLUTION: HOW TO CAPTURE THE BIGGEST BUSINESS OPPORTUNITY IN A CENTURY”,2014 ; COMPANY INTERVIEWS; WEB SEARCH; SUN, ELLEN MACARTHUR FOUNDATION AND MCKINSEY & COMPANY TEAM ANALYSES
Examples
SHARE
▪ SHARE ASSETS ▪ REUSE/SECONDHAND ▪ PROLONG LIFE
OPTIMISE
▪ INCREASE PERFORMANCE/EFFICIENCY OF PRODUCT, VALUE CHAIN, CONSUMER
▪ LEVERAGE BIG DATA, INTERNET OF THINGS, ETC TO MAKE PRODUCT OR VALUE CHAIN MORE INTELLIGENT
LOOP
▪ REMANUFACTURE ▪ RECYCLE MATERIALS ▪ REPURPOSE RENEWABLE MATERIALS TO OTHER USES ▪ EXTRACT BIOCHEMICALS FROM ORGANIC WASTE
VIRTUALISE
▪ DIRECT DEMATERIALISATION, E.G., BOOKS, CDS, DVDS, TRAVEL, OFFICE SPACE
▪ INDIRECT DEMATERIALISATION, E.G., ONLINE SHOPPING, AUTONOMOUS VEHICLES
EXPLORE
▪ RECLAIM, RETAIN, AND RESTORE HEALTH OF ECOSYSTEMS
▪ RETURN RECOVERED RESOURCES REGENERATE
▪ ADVANCED MATERIALS ▪ DIFFERENT TECHNOLOGIES ▪ DIFFERENT PRODUCT/SERVICE ▪ RENEWABLE ENERGY

1 Note that this is not a forecast of how costs will develop. It is an assessment of how costs could develop if Europe aggressively went after this agenda, and if all improvements were captured as cost savings.
COST REDUCTION POTENTIAL INHERENT IN BROAD CIRCULAR ECONOMY LEVERS1 Total savings, % X Total annual cash-out costs per household; EU average 2012, Euro,
Improvement potential for the year 2050
SOURCE: SUN, ELLEN MACARTHUR FOUNDATION AND MCKINSEY & COMPANY TEAM ANALYSES REPORT
60-80%
~5,500
25-35%
~9,600
<2%
<2%
15%
15%
10%
2%
25-40%
~6,600
6%
<2%
<2%
<2%
35%
2%
Mobility Food Built environment
Share
Optimise
Loop
Virtualise
Exchange
REgenerate
Today’s cost
Remaining cost2
6%
40%
<5%
5%
25%
25%

2050
2030
2050
2030
Current development scenario Circular economy scenario
EU-27, indexed (2012 = 100)
Household disposable income
GDP
SOURCE: Economic modelling expertise provided by Professor Christoph Böhringer, University of Oldenburg, and Professor Thomas F. Rutherford, University of Wisconsin; Company and expert interviews; Web search; Eurostat household expenditure data; ACEA, The Automobile Industry Pocket Guide, 2015; Todd Alexander Litman, Transportation Cost and Benefit Analysis: Techniques, Estimates and Implications, Victoria Transport Policy Institute, 2009; Udo Jürgen Becker et al., The True Costs of Automobility: External Costs of Cars: Overview on existing estimates in EU-27, TU Dresden, 2012; ICCT, European Vehicle Market Statistics Pocketbook, 2013; ICE database of CO2 embedded in material; Frances Moore and Delavane Diaz, Temperature Impacts on Economic Growth Warrant Stringent Mitigation Policy, Nature Climate Change, 2015; MGI, Overcoming obesity: An initial economic analysis, 2014; FAO, Global food losses and food waste – Extent, Causes and Prevention, 2011; EEA, Towards efficient use of water resources in Europe, 2012; EU Commission, Official journal of the EU, Commission Agriculture and Rural Development, 2012 budget, 2012; FAOSTAT; Kimo van Dijk, Present and future phosphorus use in Europe: food system scenario analyses, Wageningen University, 2014; Josef Schmidhuber, The EU Diet – Evolution, Evaluation and Impacts of the CAP, FAO, 2008; Gregor Zupančič and Viktor Grilc, Anaerobic Treatment and Biogas Production from Organic Waste, 2012; Joint Research Centre (JRC) of the European Commission et al., Precision agriculture: an opportunity for EU farmers – potential support with the CAP 2014-2020, 2014; Laure Itard et al., Building Renovation and Modernisation in Europe: State of the art review, TU Delft, 2008; BPIE, Europe’s buildings under the microscope: A country-by-country review of the energy performance of buildings, 2011; Per-Erik Josephson and Lasse Saukkoriipi, Waste in construction projects: call for a new approach, Chalmers University of Technology, 2007; Mark Hogan, The Real Costs of Building Housing, SPUR, 2014; Cushman & Wakefield Research Publication, Office space across the world, 2013; Ellen MacArthur Foundation, Delivering the circular economy toolkit for policymakers, 2015.
COMPARISON OF POTENTIAL DEVELOPMENT PATHS: IMPACT ON THE ECONOMY

2050
2030
2050
2030
Current development scenario Circular economy scenario
EU-27, indexed (2012 = 100)
CO2 emissions
Primary material consumption
COMPARISON OF POTENTIAL DEVELOPMENT PATHS: IMPACT ON THE ENVIRONMENT

ACHIEVING ‘GROWTH WITHIN’ 10 CE investment opportunities to accelerate Europe’s circular economy transition

INTERNATIONAL DEVELOPMENTS

SDGs offer unique opportunity to move to an integrated, universally relevant and potentially
transformative Global Development Agenda.
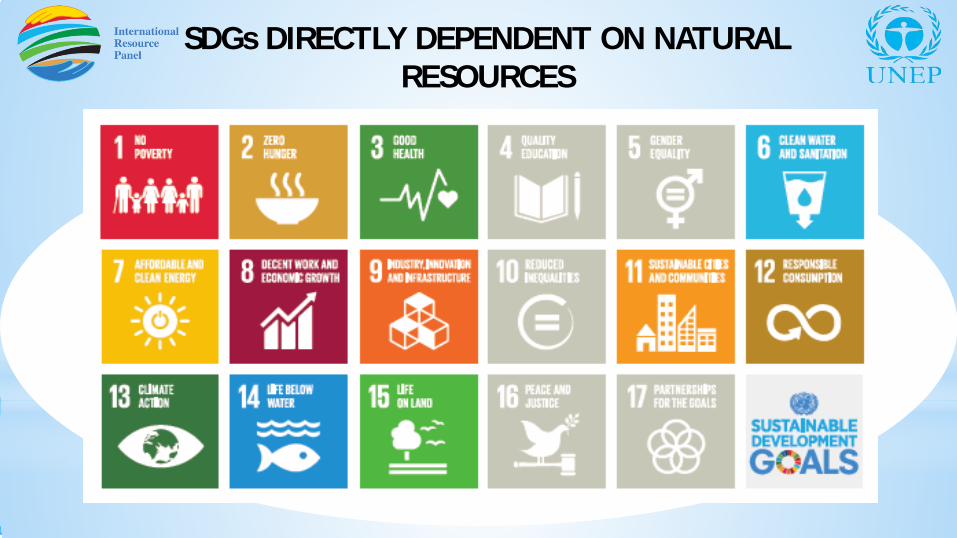
SDGs DIRECTLY DEPENDENT ON NATURAL RESOURCES
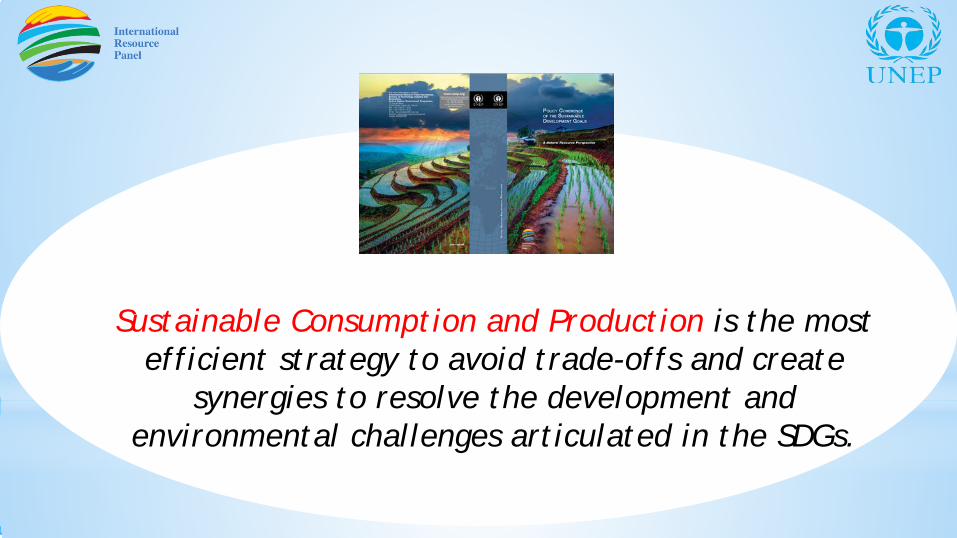
Sustainable Consumption and Production is the most efficient strategy to avoid trade-offs and create
synergies to resolve the development and environmental challenges articulated in the SDGs.

SDGs DIRECTLY DEPENDENT ON NATURAL RESOURCES

Source: Literature review; AlphaBeta analysis
SUSTAINABLE BUSINESS COMMISSION: QUANTIFYING THE SDG PRIZE
Environmental
Social
Economic
Governance
Shift to circular models could generate an opportunity of over $3 trillion by 2030
Reducing food waste could be worth over $580 billion by 2030
Gender equality could be worth up to $28 trillion by 2025
Matching Poland’s improvement in education could boost OECD GDP by 1.5% by 2030
Technological upgrading and innovation could deliver an economic prize of $25 trillion by driving productivity growth
Annual incremental infrastructure opportunity of $1.7 trillion
Potential economic prize of up to $6 trillion from addressing corruption, illicit financial flows, and reducing all forms of violence
DRAFT

GROWTH AND JOBS PARADIGM

GROWTH … IN TRANSITION
• LEADING EU POLITICAL GOAL: FROM GROWTH AND JOBS TO JOBS AND GROWTH
• GROWTH RATES IN EU BY DECADES - OECD DATA:
Sixties 5.4%
Seventies 3.8%
Eighties 3.1%
Nineties 2.3%
First decade of this century 1.4%
GROWTH … IN TRANSITION
• Growth is generally considered as a positive phenomena
• Growth expressed as GDP – Beyond GDP agenda
• “Good” growth -“Bad” growth (externalities) – how much of the “growth” in the past actually qualifies for growth?

-15
-10
-5
0
5
10
15
AGRICULTURE MINING STEEL
WITHOUTWITH
EVALUATION OF EXTERNALITIES PROFIT MARGINS WITHOUT NATURAL CAPITAL COSTS INCLUDED
AND WITH NATURAL CAPITAL COSTS INCLUDED
SOURCE: TRUECOST STUDY - 2013

GROWTH … IN TRANSITION
• Growth as a future political priority (developed and developing countries)
• 10% growth – doubling in 7 years
• Viable economy - building resilience or improving efficiency?

IS WEALTH (GDP) MAKING US HAPPIER …
• Win-Gallup Survey
(December 2014, 64000 people, 64 states)
• 70% of people satisfied with their lives
• The happiest people live in Africa (83% very happy or happy)
• The least happy people live in western Europe (11% very unhappy)
• In improvement of quality of life believes 75% Africans and 26% western Europeans

TO CONCLUDE …

SUSTAINABLE, LOW-CARBON, CIRCULAR, GREEN, RESOURCE EFFICIENT, ENERGY EFFICIENT, DECOUPLING, 3Rs, ECOLOGICAL CIVILISATION, BIOECONOMY, ECO-ECONOMY, BLUE …
• What we actually talk about

NECESSARY AND UNAVOIDABLE
NEW ECONOMIC MODEL BASED ON SCP INTEGRATING ALL THREE PILLARS OF
SUSTAINABILITY IS
WE HAVE TO FIX A BROKEN COMPASS
(PAVAN SUKHDEV)
SCIENCE

• If prices do not reflect the true value and costs of resources,
• If rewards to capital are disproportionate to other inputs,
• If managers on annual contracts are induced to make short term investment decisions overly influenced by bonuses based on short term share price,
• If …
MARKETS CANNOT ENSURE EFFICIENCY IN THE ALLOCATION AND USE OF RESOURCES …

• INNOVATION (Incentives) • PRODUCTS (Design) • CONSUMERS (Behaviour) • BUSINESS MODELS (Sharing -
Products to services)
MARKETS AND REGULATION

ALL POLICIES SHOULD BE SYSTEMATICALLY ADJUSTED
Beyond GDP, natural capital accounting, corporate sustainability reporting, tax policy, state aid, public procurement, product design, use of banking potential, R and D and innovation, investments in infrastructure, education, consumers awareness, new business models, support to SMS, …
ACTIVE DIALOGUE WITH ALL STAKEHOLDERS IS NECESSARY
Transition is only possible if we actively involve those loosing in the process of transition
POLICY APPROCH

WE CAN NOT SOLVE OUR PROBLEMS WITH THE SAME THINKING WE USED WHEN WE HAVE CREATED THEM
INSANITY – DOING THE SAME THINGS OVER AND OVER AGAIN AND EXPECTING DIFFERENT RESULTS
ABOUT OUR TIME ...
EVERYTHING HAS TO CHANGE TO REMAIN THE SAME
GIUSEPPE TOMASI DI LAMPEDUSA
ALBERT EINSTEIN
SCP
ENV
ECO SOC

THANK YOU www.unep.org/resourcepanel