Ensemble River Stage Forecasts From the Site Specific Hydrologic Predictor
27
Ensemble River Stage Forecasts From the Site Specific Hydrologic Predictor Al Cope National Weather Service Forecast Office Mount Holly, NJ Nancy Furbush and Jeffrey Tongue National Weather Service Forecast Office New York, NY Michael Erickson School of Marine and Atmosphere Sciences Stony Brook University, Stony Brook, NY
description
Ensemble River Stage Forecasts From the Site Specific Hydrologic Predictor. Al Cope National Weather Service Forecast Office Mount Holly, NJ Nancy Furbush and Jeffrey Tongue National Weather Service Forecast Office New York, NY Michael Erickson - PowerPoint PPT Presentation
Transcript of Ensemble River Stage Forecasts From the Site Specific Hydrologic Predictor

Ensemble River Stage Forecasts From the
Site Specific Hydrologic PredictorAl Cope
National Weather Service Forecast OfficeMount Holly, NJ
Nancy Furbush and Jeffrey Tongue
National Weather Service Forecast OfficeNew York, NY
Michael Erickson
School of Marine and Atmosphere SciencesStony Brook University, Stony Brook, NY

Introduction
• Part of COMET Collaborative Project with SUNY-SB, MARFC, WFO OKX, WFO PHI (2007-2009)
• Overall goal was to improve NWS short-term hydrologic forecasts and warnings, specifically using ensemble QPF as input to hydrologic models
• SUNY-SB provided QPF’s from mesoscale ensemble forecast systems
• MARFC implemented an ensemble river forecast system (MMEFS)• Initially WFO’s planned to develop an automatic procedure to use
ensemble QPF with SSHP for small basins in real time, but eventually settled on retrospective case study approach

Passaic River Basin Study Area
Whippany River at Morristown(drains 29.4 sq. miles)
Saddle River at Lodi (drains 54.6 sq. miles)
Data and Methods
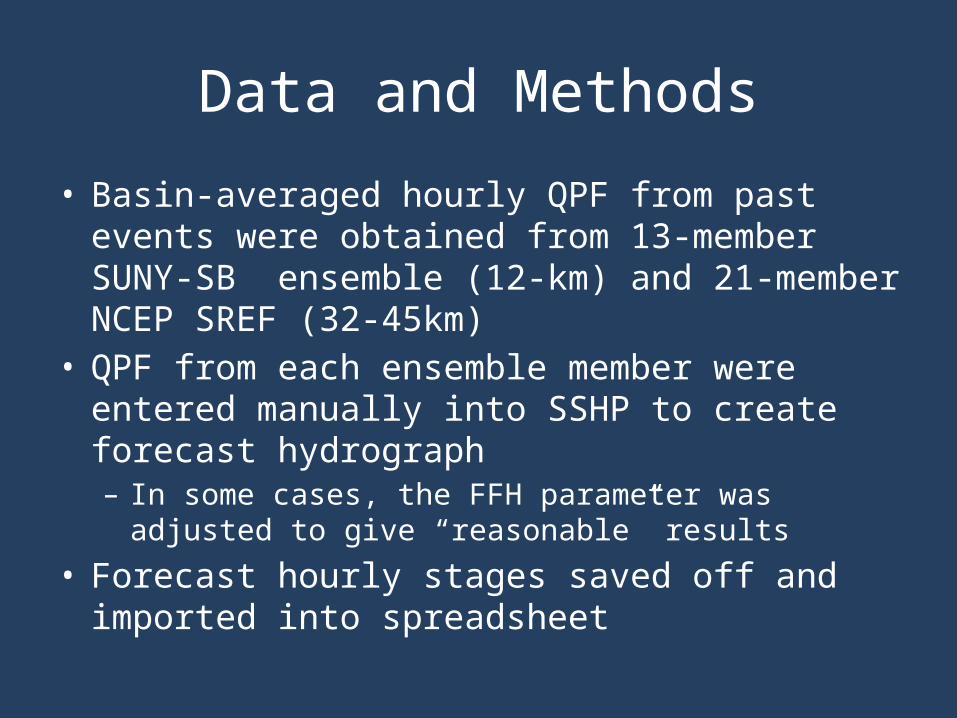
• Basin-averaged hourly QPF from past events were obtained from 13-member SUNY-SB ensemble (12-km) and 21-member NCEP SREF (32-45km)
• QPF from each ensemble member were entered manually into SSHP to create forecast hydrograph– In some cases, the FFH parameter was adjusted to give
“reasonable” results• Forecast hourly stages saved off and imported into
spreadsheet

QPF
Forecast Hydrograph
Adjusted FFH
Example of SSHP Analysis Window

A Case Study Example:
Whippany River at Morristown (WHIN4)
March 13-14, 2010

Surface Analysis, 1200 UTC, March 13, 2010
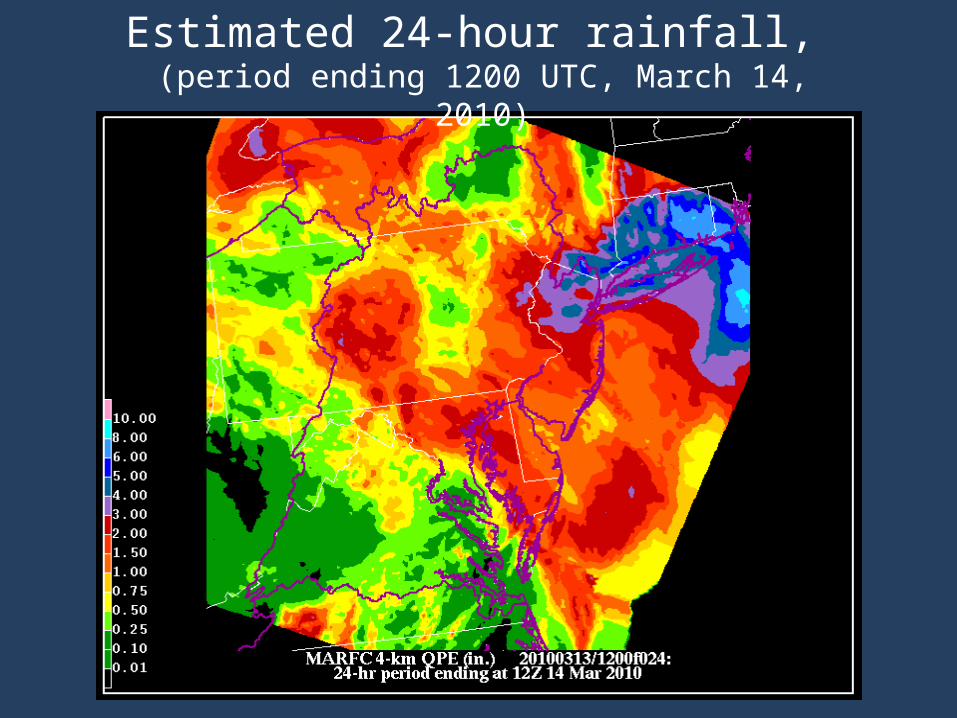
Estimated 24-hour rainfall, (period ending 1200 UTC, March 14, 2010)

0 2 4 6 8 10 12 14 16 18 20 22 0 2 4 6 8 10 12 14 16 18 20 22 00.00
0.05
0.10
0.15
0.20
0.25
0.30
0.35
0.40
0.45
0.50
SBU Ensemble QPF from 00 UTC, March 13, 2010
mm51 mm52 mm53 mm54 mm55 mm56 mm57wrf1 wrf2 wrf3 wrf4 wrf5 wrf6 Mean
Time (UTC)
Hour
ly Q
PF (i
n.)
0 1 2 3 4 5 6 7 8 9 1011121314151617181920212223 0 1 2 3 4 5 6 7 8 9 1011121314151617181920212223240.00
0.50
1.00
1.50
2.00
2.50
3.00
3.50
4.00
4.50
5.00
5.50
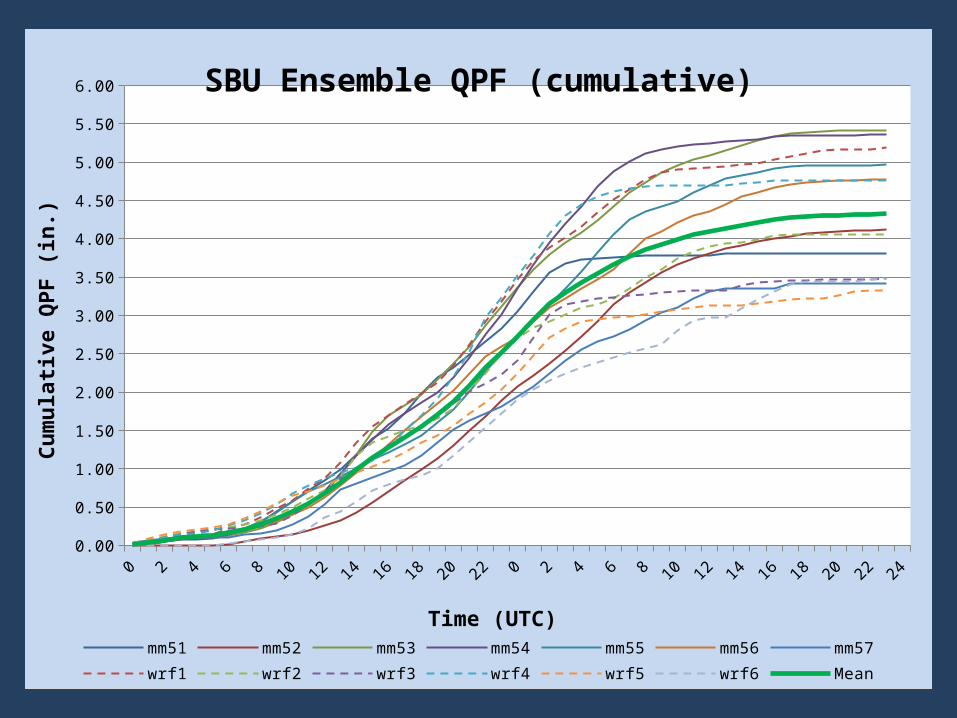
6.00 SBU Ensemble QPF (cumulative)
mm51 mm52 mm53 mm54 mm55 mm56 mm57wrf1 wrf2 wrf3 wrf4 wrf5 wrf6 Mean
Time (UTC)
Cum
ulati
ve Q
PF (i
n.)

0 1 2 3 4 5 6 7 8 9 1011121314151617181920212223 0 1 2 3 4 5 6 7 8 9 1011121314151617181920212223 02
3
4
5
6
7
8
9Ensemble Forecast for WHIN4, March 13-14, 2010
mm51 mm52 mm53 mm54 mm55 mm56 mm57wrf1 wrf2 wrf3 wrf4 wrf5 wrf6 meanQPFObsvd Flood Stg
Time (UTC)
Rive
r Sta
ge (ft
)
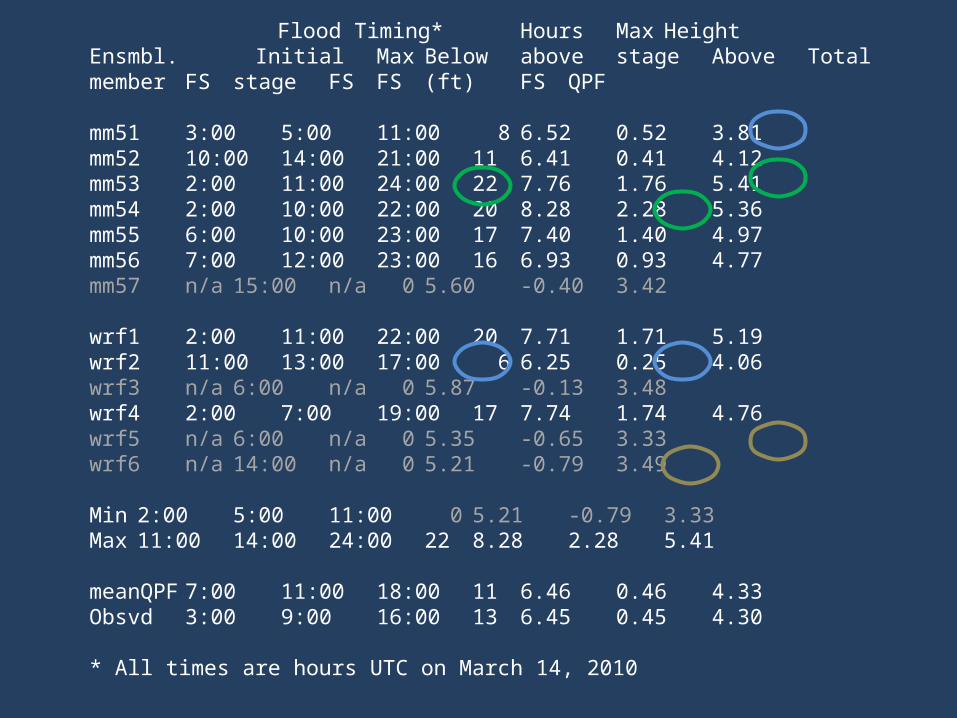
Flood Timing* Hours Max HeightEnsmbl. Initial Max Below above stage Above Totalmember FS stage FS FS (ft) FS QPF
mm51 3:00 5:00 11:00 8 6.52 0.52 3.81mm52 10:00 14:00 21:00 11 6.41 0.41 4.12mm53 2:00 11:00 24:00 22 7.76 1.76 5.41mm54 2:00 10:00 22:00 20 8.28 2.28 5.36mm55 6:00 10:00 23:00 17 7.40 1.40 4.97mm56 7:00 12:00 23:00 16 6.93 0.93 4.77mm57 n/a 15:00 n/a 0 5.60 -0.40 3.42
wrf1 2:00 11:00 22:00 20 7.71 1.71 5.19wrf2 11:00 13:00 17:00 6 6.25 0.25 4.06wrf3 n/a 6:00 n/a 0 5.87 -0.13 3.48wrf4 2:00 7:00 19:00 17 7.74 1.74 4.76wrf5 n/a 6:00 n/a 0 5.35 -0.65 3.33wrf6 n/a 14:00 n/a 0 5.21 -0.79 3.49
Min 2:00 5:00 11:00 0 5.21 -0.79 3.33Max 11:00 14:00 24:00 22 8.28 2.28 5.41
meanQPF 7:00 11:00 18:00 11 6.46 0.46 4.33Obsvd 3:00 9:00 16:00 13 6.45 0.45 4.30
* All times are hours UTC on March 14, 2010
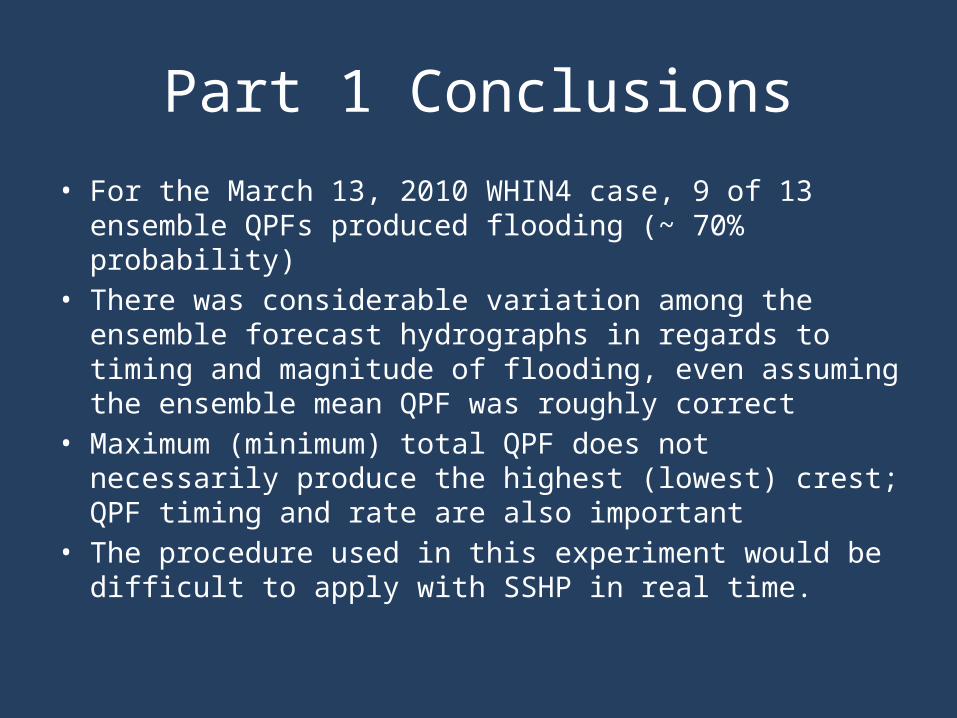
Part 1 Conclusions• For the March 13, 2010 WHIN4 case, 9 of 13 ensemble QPFs
produced flooding (~ 70% probability)• There was considerable variation among the ensemble
forecast hydrographs in regards to timing and magnitude of flooding, even assuming the ensemble mean QPF was roughly correct
• Maximum (minimum) total QPF does not necessarily produce the highest (lowest) crest; QPF timing and rate are also important
• The procedure used in this experiment would be difficult to apply with SSHP in real time.

A Case From WFO New York’s Hydrologic Service Area
Jeffrey TongueNancy Furbush
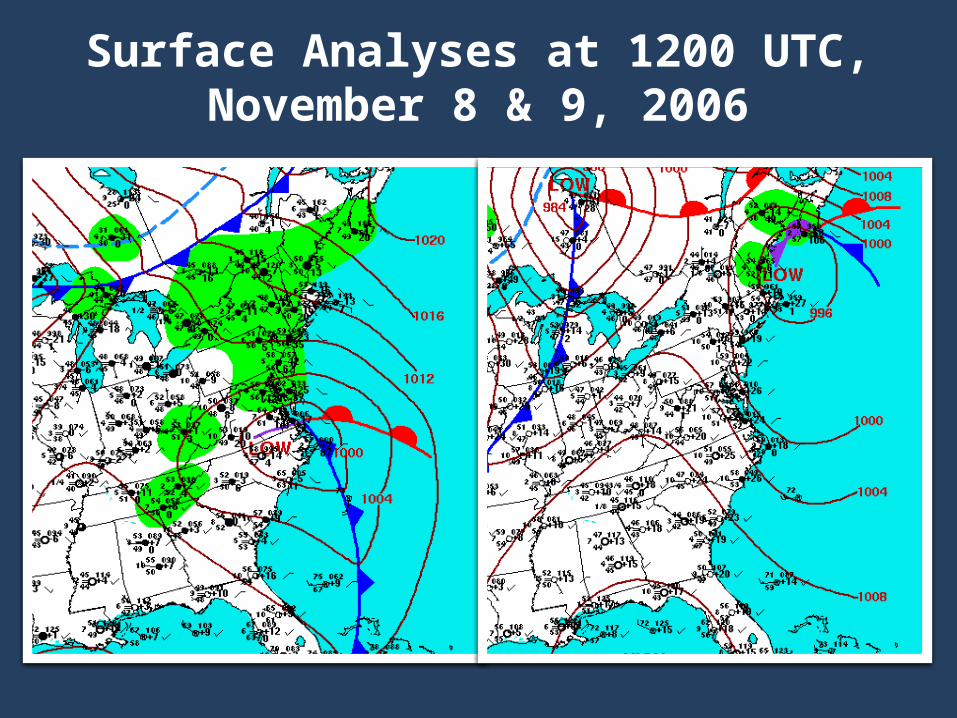
Surface Analyses at 1200 UTC, November 8 & 9, 2006

Saddle River at Lodi New Jersey

Synoptically stratiform in nature, but with embedded mesoscale features

Radar Storm Total Under Estimated
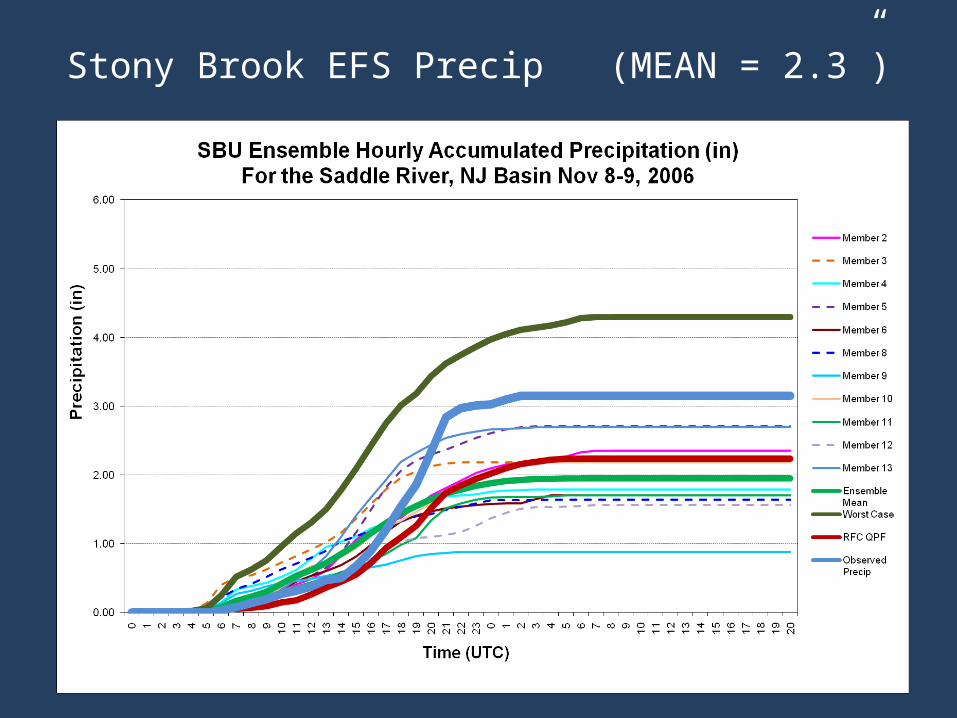
Stony Brook EFS Precip (MEAN = 2.3”)
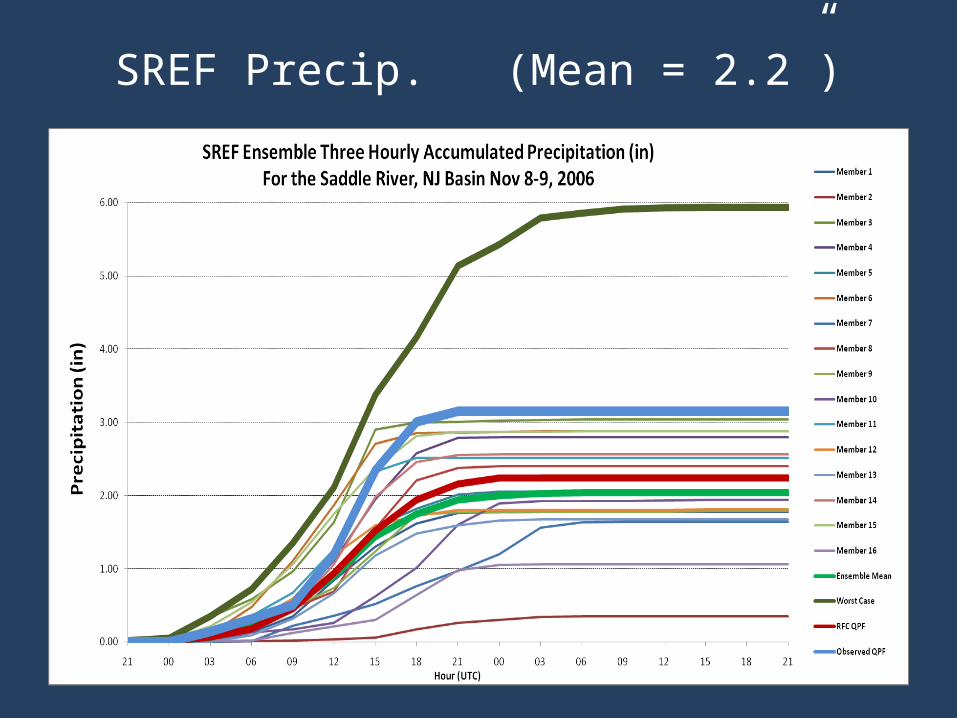
SREF Precip. (Mean = 2.2”)

Site Specific with SBU EFSMean 4’ Observed 7.8’
ONLY ONE (1) Member Touches Flood Stage

Site Specific with SREFMean 5.2’ Observed 7.8’
ONLY FOUR (4) Members Reach Flood Stage
Conclusions
• Site Specific Hydrologic Predictor – Excellent with the Magnitude– Good Temporally• Flood Stage within an hour• Crest Too early (6 hours)
• 5 out of 28 members reach flood stage! (18%)

Project Results
• Use of Site Specific Hydrologic Predictor• Use of Ensemble Forecast Systems in
Operations building a new stochastic culture in Operational Hydro-Meteorology
• New Understanding of Local Hydrology at the WFO
• Need for EFS integration into the Site Specific Hydrologic Predictor.

THE END
Thank you for your attention!
Questions ???