Engineering Failure Analysis - sia.cnir.sia.cn/bitstream/173321/15072/2/A novel method for...
11
Review A novel method for failure analysis based on three-dimensional analysis of fracture surfaces Yuguang Cao a,⇑ , Wenjun Nie a , Jiancheng Yu b , Kiyoshi Tanaka c a Department of Engineering Mechanics, China University of Petroleum, 266580 Qingdao, China b State Key Laboratory of Robotics, Shenyang Institute of Automation, Chinese Academy of Sciences, 110016 Shenyang, China c Department of Mechanical Systems Engineering, Toyama Prefectural University, 939-0398 Toyama, Japan article info Article history: Received 24 January 2014 Received in revised form 19 April 2014 Accepted 24 April 2014 Available online 2 May 2014 Keywords: Fracture surface Quantitative reverse deduction FRASTA CTOA J-integral abstract The fractured surfaces include a lot of useful information that can help investigate the rea- sons that caused metal materials to break. For example, the details on the processes that lead to failure can be determined from these surfaces, making it useful to investigate their morphology. The principle of the fracture-surface topography analysis (FRASTA) was used in this research and some progresses have been made on quantitative reverse deduction of metal fracture surfaces. In FRASTA, the fracture surfaces are scanned by laser microscope and the elevation data is recorded for analysis. The crack-tip opening angle (CTOA) was firstly determined by the cross-sectional plots. Simple bar hypothesis was then proposed. As for the hypothesis, the fracture surfaces can be assumed to be composed of independent rectangular bars. After dividing the plastic deformation left on the fracture surfaces into such single bars, the original lengths of these bars were calculated and then the global strains of these bars during the course of failure were calculated, and finally the J-integral was calculated. Then, the relationship between J-integral and crack opening displacement (COD), and the relationship between J-integral and fracture surface average profile for plain strain were deduced. Furthermore, according to the relationship between true stress and true strain for the material, the normal stress on the cross section of each single bar was determined. Summing up all the loads on all bars provided the total applied load of the specimen. Some experiments have been performed and the proposed methods have been verified to some extent. At the same time, software, namely fracture surface analyst (FSA) was developed as per the proposed methods and was used for analysis successfully. Ó 2014 Elsevier Ltd. All rights reserved. 1. Introduction When fracture accidents take place in a structural component, there are only the broken parts left for investigation. Frac- ture surfaces of broken parts include a lot of useful information. They record details and sequences of process that caused the failure. It is necessary to research fracture surfaces thoroughly. In order to investigate the reasons that caused the material to break, it is necessary to clarify the temperature, environ- ment and load imposed on the material. But these records are often unavailable. For this reason, it is useful to extract mes- sages from broken materials. To analyze fracture surfaces and deduce the reasons that caused the failure is a proposing way. http://dx.doi.org/10.1016/j.engfailanal.2014.04.032 1350-6307/Ó 2014 Elsevier Ltd. All rights reserved. ⇑ Corresponding author. Tel.: +86 546 839 7849; fax: +86 546 839 3903. E-mail address: [email protected] (Y. Cao). Engineering Failure Analysis 44 (2014) 74–84 Contents lists available at ScienceDirect Engineering Failure Analysis journal homepage: www.elsevier.com/locate/engfailanal
Transcript of Engineering Failure Analysis - sia.cnir.sia.cn/bitstream/173321/15072/2/A novel method for...

Engineering Failure Analysis 44 (2014) 74–84
Contents lists available at ScienceDirect
Engineering Failure Analysis
journal homepage: www.elsevier .com/locate /engfai lanal
Review
A novel method for failure analysis based on three-dimensionalanalysis of fracture surfaces
http://dx.doi.org/10.1016/j.engfailanal.2014.04.0321350-6307/� 2014 Elsevier Ltd. All rights reserved.
⇑ Corresponding author. Tel.: +86 546 839 7849; fax: +86 546 839 3903.E-mail address: [email protected] (Y. Cao).
Yuguang Cao a,⇑, Wenjun Nie a, Jiancheng Yu b, Kiyoshi Tanaka c
a Department of Engineering Mechanics, China University of Petroleum, 266580 Qingdao, Chinab State Key Laboratory of Robotics, Shenyang Institute of Automation, Chinese Academy of Sciences, 110016 Shenyang, Chinac Department of Mechanical Systems Engineering, Toyama Prefectural University, 939-0398 Toyama, Japan
a r t i c l e i n f o
Article history:Received 24 January 2014Received in revised form 19 April 2014Accepted 24 April 2014Available online 2 May 2014
Keywords:Fracture surfaceQuantitative reverse deductionFRASTACTOAJ-integral
a b s t r a c t
The fractured surfaces include a lot of useful information that can help investigate the rea-sons that caused metal materials to break. For example, the details on the processes thatlead to failure can be determined from these surfaces, making it useful to investigate theirmorphology. The principle of the fracture-surface topography analysis (FRASTA) was usedin this research and some progresses have been made on quantitative reverse deduction ofmetal fracture surfaces. In FRASTA, the fracture surfaces are scanned by laser microscopeand the elevation data is recorded for analysis. The crack-tip opening angle (CTOA) wasfirstly determined by the cross-sectional plots. Simple bar hypothesis was then proposed.As for the hypothesis, the fracture surfaces can be assumed to be composed of independentrectangular bars. After dividing the plastic deformation left on the fracture surfaces intosuch single bars, the original lengths of these bars were calculated and then the globalstrains of these bars during the course of failure were calculated, and finally the J-integralwas calculated. Then, the relationship between J-integral and crack opening displacement(COD), and the relationship between J-integral and fracture surface average profile for plainstrain were deduced. Furthermore, according to the relationship between true stress andtrue strain for the material, the normal stress on the cross section of each single bar wasdetermined. Summing up all the loads on all bars provided the total applied load of thespecimen. Some experiments have been performed and the proposed methods have beenverified to some extent. At the same time, software, namely fracture surface analyst (FSA)was developed as per the proposed methods and was used for analysis successfully.
� 2014 Elsevier Ltd. All rights reserved.
1. Introduction
When fracture accidents take place in a structural component, there are only the broken parts left for investigation. Frac-ture surfaces of broken parts include a lot of useful information. They record details and sequences of process that caused thefailure. It is necessary to research fracture surfaces thoroughly.
In order to investigate the reasons that caused the material to break, it is necessary to clarify the temperature, environ-ment and load imposed on the material. But these records are often unavailable. For this reason, it is useful to extract mes-sages from broken materials. To analyze fracture surfaces and deduce the reasons that caused the failure is a proposing way.
Y. Cao et al. / Engineering Failure Analysis 44 (2014) 74–84 75
Fracture surfaces of broken parts (in failure analysis) and test specimens (in materials development) are routinely exam-ined using an optical microscope and scanning electron microscope (SEM) to obtain qualitative information including crackinitiation sites, the direction of crack propagation, and associated fracture mechanisms. While it is also possible to obtainlimited quantitative information, such as fatigue-crack-growth rates based on the striation spacing by using conventionaltechniques, generally there is not sufficient information that can be used in quantitative fracture-mechanics analyses.
Fracture-surface topography analysis (FRASTA), developed by SRI International, is a procedure for reconstructing theprocess of crack extension in microscopic details by comparing the topographic features from conjugate areas of opposingfracture surfaces [1]. It overcomes the limitations of conventional techniques by quantifying and analyzing the topographiesof conjugate fracture surfaces simultaneously to reconstruct a fracture event (via computer). The concept of analyzing con-jugate fracture surfaces is based on accurately characterizing the micro-failure processes that result in final rupture. TheFRASTA considers that as the crack extends, the material immediately beneath the newly formed fracture surfaces undergoesno further inelastic deformation.
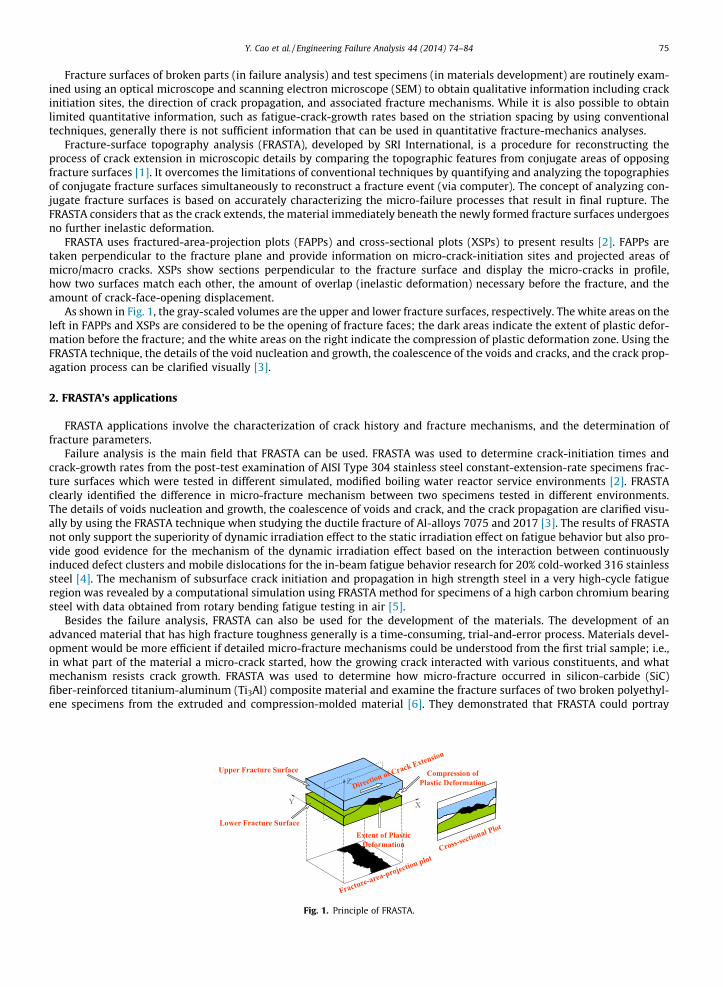
FRASTA uses fractured-area-projection plots (FAPPs) and cross-sectional plots (XSPs) to present results [2]. FAPPs aretaken perpendicular to the fracture plane and provide information on micro-crack-initiation sites and projected areas ofmicro/macro cracks. XSPs show sections perpendicular to the fracture surface and display the micro-cracks in profile,how two surfaces match each other, the amount of overlap (inelastic deformation) necessary before the fracture, and theamount of crack-face-opening displacement.
As shown in Fig. 1, the gray-scaled volumes are the upper and lower fracture surfaces, respectively. The white areas on theleft in FAPPs and XSPs are considered to be the opening of fracture faces; the dark areas indicate the extent of plastic defor-mation before the fracture; and the white areas on the right indicate the compression of plastic deformation zone. Using theFRASTA technique, the details of the void nucleation and growth, the coalescence of the voids and cracks, and the crack prop-agation process can be clarified visually [3].
2. FRASTA’s applications
FRASTA applications involve the characterization of crack history and fracture mechanisms, and the determination offracture parameters.
Failure analysis is the main field that FRASTA can be used. FRASTA was used to determine crack-initiation times andcrack-growth rates from the post-test examination of AISI Type 304 stainless steel constant-extension-rate specimens frac-ture surfaces which were tested in different simulated, modified boiling water reactor service environments [2]. FRASTAclearly identified the difference in micro-fracture mechanism between two specimens tested in different environments.The details of voids nucleation and growth, the coalescence of voids and crack, and the crack propagation are clarified visu-ally by using the FRASTA technique when studying the ductile fracture of Al-alloys 7075 and 2017 [3]. The results of FRASTAnot only support the superiority of dynamic irradiation effect to the static irradiation effect on fatigue behavior but also pro-vide good evidence for the mechanism of the dynamic irradiation effect based on the interaction between continuouslyinduced defect clusters and mobile dislocations for the in-beam fatigue behavior research for 20% cold-worked 316 stainlesssteel [4]. The mechanism of subsurface crack initiation and propagation in high strength steel in a very high-cycle fatigueregion was revealed by a computational simulation using FRASTA method for specimens of a high carbon chromium bearingsteel with data obtained from rotary bending fatigue testing in air [5].
Besides the failure analysis, FRASTA can also be used for the development of the materials. The development of anadvanced material that has high fracture toughness generally is a time-consuming, trial-and-error process. Materials devel-opment would be more efficient if detailed micro-fracture mechanisms could be understood from the first trial sample; i.e.,in what part of the material a micro-crack started, how the growing crack interacted with various constituents, and whatmechanism resists crack growth. FRASTA was used to determine how micro-fracture occurred in silicon-carbide (SiC)fiber-reinforced titanium-aluminum (Ti3Al) composite material and examine the fracture surfaces of two broken polyethyl-ene specimens from the extruded and compression-molded material [6]. They demonstrated that FRASTA could portray
Fig. 1. Principle of FRASTA.

76 Y. Cao et al. / Engineering Failure Analysis 44 (2014) 74–84
micro-fracture mechanisms in a complex material and also could delineate the hidden effects of processing on the fracturebehavior of materials. The results told that FRASTA was useful not only in material design, but also in process quality control.
Another function of FRASTA is to determine the fracture parameters. FRASTA was used to obtain the information on thefracture toughness directly from a broken part [6]. The crack-arrest toughness assessed via FRASTA from conjugate fracturesurfaces agreed very well with the values computed from dynamic measurement data. The possibility of deducing load spec-trum parameters from fatigue failure surfaces is explored by applying innovative, three-dimensional topographic character-ization and analysis techniques to failure surfaces in aluminum sheet [7]. FRASTA provided a way to quantify overloads. Aprocedure was sought for to estimate fatigue loading information from the characteristics of roughness of fracture surfaces[8]. The topography of fracture surfaces produced in compact tension specimens of a titanium alloy in load-shedding andmonotonically increasing DK tests were analyzed with a fast Fourier transform. FRASTA helped determine the relationshipbetween fracture surface roughness and fatigue load parameters.
3. Development of quantitative fracture surface analysis by FRASTA
The FRASTA technique can be widely used for failure analysis, materials development and determination of fractureparameters. However, the FRASTA application has previously focused on smaller size scales and localized behaviors [9].At the same time, only a few fracture parameters were determined by FRASTA. Thus, the ability of FRASTA to extract quan-titative information from fracture surface is greatly restricted. With the development of experimental equipment, lasermicroscope is used for fracture surface analysis. By this non-contact three-dimensional scanning system, the global fracturesurfaces of larger size scale fracture surfaces can be examined and analyzed. Combined with the development of software,the fracture surfaces and the whole fracture process can be rebuilt and many fracture parameters can be determined duringthe course.
3.1. Experiments
A compact tension (CT) specimen of alloy steel was used as an instance to illustrate the progresses made in this area. Thedisplacements at two different locations were measured using the double gauge method. That is, a clip gauge and a ringgauge were used to measure the opening displacements at the load-line and crack mouth, respectively, as shown inFig. 2. During the test, the displacements and the corresponding loads at these two locations were recorded.
After the completion of the test, the conjugate fracture surfaces were examined by laser microscope as shown in Fig. 3 andthe elevation data was recorded. The resolutions of the laser microscope along the X, Y, and Z directions are 50 lm, 50 lmand 1 lm respectively. The working ranges of the stage along the X and Y directions are both 15 cm. Fig. 4 shows therecorded fracture surface.
3.2. Process of FRASTA simulation
Fig. 5 displays the principle of matching the conjugate fracture surfaces. According to [2], the corresponding location ofthe upper and lower fracture surfaces should share common features because when crack takes place, plastic deformationwill be left on the fracture surfaces and will not undergo further deformation. That is to say that the corresponding locationon the conjugate surfaces can match each other well.
The process of using FRASTA to simulate the process of fracture is shown in Fig. 6. The upper fracture surface is firstinverted along specimen thickness direction and mirrored to correlate the lower fracture surface; after being adjusted tothe proper position, the conjugate surfaces are rotated and moved according to the recorded displacements at load-lineand crack mouth respectively.
Clip gauge
Ring gauge
P
P
Fig. 2. A clip gauge and a ring gauge were used to measure the displacements at load-line and crack mouth respectively.

Fig. 3. Laser microscope system for recording fracture surface elevation data.
X
Y
Initial crack-tip
Direction of crack extension
Fig. 4. Recorded fracture surface.
Specimen upper half
Specimen lower half
Lower surface
Upper surface
Pre-crack
Pre-crack
ua
ub
lalb
uS
lS
Fig. 5. Principle of matching the conjugate fracture surfaces of CT specimen.
Y. Cao et al. / Engineering Failure Analysis 44 (2014) 74–84 77
3.3. Calculation of some parameters
3.3.1. CTOA and othersA number of different criteria are used to predict crack growth. The crack opening angle is one of the most appealing.
There are two definitions for the crack opening angle, crack-tip opening angle (CTOA) and the crack opening angle (COA)as shown in Fig. 7 [10]. The CTOA is the local slope of the crack face near the crack tip while the COA is the ratio of the crackopening displacement at the site of the initial crack tip to the current crack extension. It has been verified that, after an initial

ua ub
la
uS
lS
ua
ub
la lb
uS
lS
ua ub
lalb
uS
lS
ua ub uS
lalb lS
uaub uS
(b) The upper fracture surface is mirrored to correlate the lower fracture surface
(c) The positions of the upper and lower surfaces are adjusted to make the pre-crack match each other precisely
(d) The upper and lower surfaces are rotated and moved according to the displacement recorded at load-line and outer edge of specimen respectively
(e) Final state when simulation finished
(a) The upper fracture surface, which is inverted along thickness direction
Fig. 6. Process of matching the conjugate fracture surfaces of CT specimen.
(a) CTOA (b) COA
Crack TipCTOA
Initial Crack Tipmr
Crack Tip
COA
Initial Crack Tip
Fig. 7. Definition of CTOA and COA.
78 Y. Cao et al. / Engineering Failure Analysis 44 (2014) 74–84
transient period, stable crack growth occurs when the CTOA reaches a constant critical value [11]. This value is referred to asthe critical CTOA. The critical CTOA fracture criterion is widely used to describe fracture behavior [12,13].
CTOA is generally defined as shown in Fig. 7 as the angle between the upper and lower crack surfaces rm behind the crack-tip. To measure CTOA during testing is often inconvenient. In FRASTA, the elevation data of the conjugate fracture surfaceswas obtained and the process of fracture was simulated as shown in Fig. 6, making it simple to calculate CTOA. By just locat-ing the current crack-tip and two points rm behind the crack-tip on the upper and lower facture surfaces respectively, thevalue of CTOA can be determined.
It is worth noting that during the period of the crack’s initial growth, i.e. when crack extension Da < rm, the initial crack-tip is assumed to be the current crack-tip. This means that, when Da < rm, CTOA = COA.
The variance of CTOA with crack extension is plotted in [14] as shown in Fig. 8. From the results it is clear that the CTOAbecomes constant with the crack extension. Fig. 9 shows the variation of CTOA through specimen thickness. It found that theCTOA does not vary with position along the thickness direction.

Y. Cao et al. / Engineering Failure Analysis 44 (2014) 74–84 79
Using this method, COA, crack opening displacement (COD) and crack-tip opening displacement (CTOD), which are incon-venient to obtain by traditional methods, can also be easily calculated.
3.3.2. J-integralThe J-integral is one of the most important parameters to assess the toughness and describe the extension of a crack body.
Generally, the elastic compliance method is used to calculate the J-integral and construct the J–R curve for CT specimens. Inour previous work [15,16], a new method, which makes use of the elevation data of the conjugate fracture surfaces and is onthe basis of FRASTA, was proposed to calculate J-integral.
According to the simple bar hypothesis proposed in our work, the fracture surfaces can be assumed to be composed ofindependent rectangular bars as shown in Fig. 10. In order to simplify the calculation, this paper supposes the plastic defor-mation is symmetrical about the fracture surface. The sizes of these bars in the directions of crack extension and specimenthickness are determined by the step lengths of the laser microscope. Thus, along the direction of crack extension, theamount of plastic deformation which is gray-scaled in Fig. 10 can be considered to be the elongation of the bar. Consideringthe simple tension test for rectangular specimens, during the course of the test, as the load increases from zero to the spec-imen’s failure, the strain varies from 0 to ef and the stress varies from 0 to rf. As introduced in [17], the strain distributionalong the bar can be written as some kind of power exponential function. Thus, for a fracture surface that is considered to becomposed of such simple bars, the strain distribution of the strain component along the z axis can be plotted as F(z) as shownin Fig. 10, where ez is the critical strain of yield and ef is the critical strain of fracture. It is clear that ez is the value at the end ofthe bar (on the boundary of the plastic field) and ef is the value at the center of the bar (on the fracture surface). Both of themare material constants [18]. By integrating, we can get the elongation and the ratio of elongation to original length of the bar.By deduction, it is found that the ratio of elongation of the bar is also a constant. That means the size of the plastic field is inproportion to that of the plastic deformation.
At the same time, based on FRASTA principle, when the conjugate fracture surfaces are driven to the initial position(stated before the test started) after being broken, the overlap refers to the plastic deformation left on the specimen. As intro-duced above, we supposed that the plastic field was composed of independent rectangular bars with the original length ofthe bar l and the elongation Dl. Because the ratio of elongation for some material can be determined by tension test and theelongation Dl can be determined by FRASTA, l, which denotes the scale of plastic field, can also be determined.
According to the relationship between true stress and logarithmic strain of the material, the energy consumed for plasticdeformation of a single bar under tension can be found by using integration,
uij ¼ v ij
Z ef
ey
Kende ð1Þ
05
101520253035404550
0 1 2 3 4 5 6 7
Δa (mm)
CT
OA
(de
gree
)
Fig. 8. CTOA versus crack extension Da by FRASTA simulation.
0
2
4
6
8
10
12
14
0 2 4 6 8 10 12 14 16 18
Position on specimen thickness (mm)
CT
OA
(de
gree
)
Fig. 9. Variation of CTOA through thickness.

Fig. 10. Principle of determining plastic field left on specimen.
80 Y. Cao et al. / Engineering Failure Analysis 44 (2014) 74–84
where vij is the volume of each bar, K is a constant and n is the work hardening exponent.On the basis of the upper suppositions and by summing up the energy consumed by each individual bar which has been
broken during the course of crack extension; we could obtain the total energy consumed for crack extension and the energyrelease rate, which is J-integral, can be represented as,
J ¼ DUBDa
¼ Un � Un�1
Bðan � an�1Þð2Þ
where Un�1 and Un are the dissipated plastic energy when crack extends to an�1 and an respectively, and B is the specimenwidth.
Finally, the paper plotted the J–R curves constructed by using the method proposed and also by the elastic compliancemethod respectively as shown in Fig. 11. Comparison results showed that these two curves match each other well.
The new method proposed provides a new way to calculate the J-integral. Since it can be obtained from the fracturesurfaces of the broken components, it is also convenient for widespread application.
3.4. Relationship between J-integral and fracture surface average profile
As introduced above, J-integral can be calculated from metal fracture surfaces. But, in practice, it is inconvenient tocalculate the J-integral and plot the J–R curve because the recorded fracture surface can be regarded to be composed of manyaccidented lines, and to simulate the process of fracture is to locate the conjugate lines on the upper and lower fracturesurfaces precisely according to the displacements recorded at load-line and crack-mouth respectively during test. Slightdeviation of location will make the results deviate from the theoretical value much. On the other hand, calculation ofJ-integral based on the simulation of crack extension using every pair of lines can only represent the state of some certainposition while not the global fracture surfaces. With these means, using the average profile to represent the whole fracturesurface was proposed in [16].
0
100
200
300
400
500
600
700
800
900
1000
0 1 2 3 4 5 6 7
FRASTA simulation
Compliance
J (K
J/m
m2 )
Crack extension (mm)
Fig. 11. Comparison of J–R curves made by compliance method and by FRASTA simulation.

Y. Cao et al. / Engineering Failure Analysis 44 (2014) 74–84 81
In [16], the relationship between J-integral and the fracture surface average profile was deduced as follows,
Jg ¼ p:c:f :1þ Pnþ 1
Kdg ð3Þ
where p.c.f. is the plastic constraint factor, P is the ratio of elongation and dg is the average deformation which is left on frac-ture surfaces.
Comparison between the results by the new method and by the compliance method showed that what introduced couldprovide a proposing way to calculate J-integral from the average profiles of fracture surfaces conveniently.
3.5. Relationship between J-integral and COD
J-integral and crack opening displacement d (COD) are important parameters for characterization of fracture in engineer-ing materials. The relationship between J-integral and COD has been investigated for a long time and is generally representedas J = mryd. In order to determine the value of m, extensive studies and experiments have been performed. But the final con-clusion is unavailable.
In fact, the value of COD can be determined during simulation of crack extension by the fracture surface average profile asintroduced in [18], that is, there is some relationship between COD and the fracture surface average profile. At the same time,because the relationship between J-integral and the fracture surface average profile was deduced in [16], both J-integral andCOD are related to the fracture surface average profile. The relationship between J-integral and COD was deduced as,
J ¼ p:c:f :K1
nþ 1d ð4Þ
A series of center-cracked tension (CCT) and double-edge notched (DEN) specimen experiments were performed, resultsin Fig. 12 shows that the proposed expression worked well.
3.6. Calculation of the applied loads on the specimen
To reveal the reasons that lead to the final failure, calculation of the applied loads during the course of failure is the mostimportant. According to the simple bar hypothesis, the fracture surfaces can be assumed to be composed of independent
Fig. 12. Comparisons of results by the compliance method and the present method.

82 Y. Cao et al. / Engineering Failure Analysis 44 (2014) 74–84
rectangular bars as shown in Fig. 10. The sizes of these bars in the directions of crack extension and specimen thickness aredetermined by the step lengths of the laser microscope. Thus, along the direction of crack extension, the amount of plasticdeformation which is gray-scaled in Fig. 10 can be considered to be the elongation of the bar.
In order to calculate the load applied to the specimen during the course of failure, we should first determine the globalstrain of each bar during the course of failure. As shown in Fig. 13, the crack has extended from the ‘‘initial crack tip’’ to the‘‘present crack tip’’; that is, material behind the present crack tip (between the ‘‘initial crack tip’’ and the ‘‘present crack tip’’in Fig. 13) has been fractured, and thus forces acting on the bars composing this part have been released. For the material infront of the ‘‘present crack tip’’, it still bears a load. By adding the loads acting on these bars together, the applied load of thespecimen can then be determined. As shown in Fig. 13, assuming the final elongation of the bar when the specimen fracturesis dij, and dividing the elongation into two parts, d0 ij and d00 ij, where d0ij represents the elongation of the bar when the crackextends to the ‘‘present crack tip’’, and d00ij represents the residual elongation of the bar with the crack extending further fromthe ‘‘present crack tip’’ until the final failure. It should be noted that the dot-dashed lines in Fig. 13 are the initial fracturesurfaces. The distance between them when the crack extends to the ‘‘present crack tip’’ represents the relative displacementof the conjugate fracture surfaces, which can be recorded by gauges.
As introduced above, dij, d0ij and d00 ij can be easily obtained by reconstructing the process of crack extension using FRASTA.Assuming that work hardening in the material obeys the Hollomon equation, the applied load on the specimen can be cal-culated as,
F ¼ p� q� K � k�X
eni ð5Þ
where p and q are the step lengths along the X and Y directions, ei is the average strain at xi and the k is the number of barswith the same x coordinate.
The method was applied to fracture surfaces obtained from double-edge notched (DEN) specimens made of two kinds ofmetallic alloy, broken under low-cycle fatigue in [19]. Fig. 14 shows the maximum applied loads versus crack extension forspecimen A and specimen B respectively. Results showed that the calculated maximum fatigue loads were almost equal towhat recorded during testing, which are 47 and 30 kN respectively.
3.7. Development of FRASTA simulation software
The new method introduced above can accurately calculate the parameters of crack such as CTOA, J-integral and appliedloads. But the process of calculation is generally very troublesome and time-consuming; at the same time, it is hard for thosewho do not have much experience in this field to do this work. In order to avoid this kind of complications and make thecalculation more accurate, Fracture Surface Analyst (FSA) was developed in [20].
The software was developed under the operating system of Microsoft Windows with the platform of Microsoft VisualBasic. The procedure of functions that the software fulfilled was detailed in [20]. Fig. 15 shows the main interface of FSA.
A series CCT and DEN specimen experiments were performed in [20]. Elevation data of fracture surfaces was firstly pro-cessed by FSA to build the three-dimensional fracture surfaces. Then the process of fracture was simulated in accordancewith what introduced above. During fracture process simulation, values of parameters such as CTOA, J-integral and appliedloads were calculated and recorded. Finally, the variation of these parameters with the crack extension was plotted. From the
Fig. 13. Two parts of the elongation of a single bar.

Fig. 14. Maximum applied loads versus crack extension for specimens fractured by low-cycle fatigue.
Fig. 15. The main interface of FSA.
Y. Cao et al. / Engineering Failure Analysis 44 (2014) 74–84 83
results of our previous work, it is found that FSA could accurately simulate the process of fracture for three types of specimen– CT, CCT and DEN and could accurately calculate the values of these parameters of crack. Thus, we consider that FSA can bewidely used for fracture surface three-dimensional analysis.
4. Conclusions and future work
From what is presented in this paper, it is clear that the FRASTA simulation, which can record the elevation data of frac-ture surfaces and simulating the process of crack extension, can be used for failure analysis, materials development and

84 Y. Cao et al. / Engineering Failure Analysis 44 (2014) 74–84
determination of some fracture parameters. FRASTA’s ability to reveal the entire sequence of evolving fracture events couldbe useful in areas including development of a life-prediction model, providing a physical correlation with acoustic-emissionsignals, and improving the efficiency of materials development. It provides a new way to analyze the global fracture surfacesand the whole process of fracture and can obtain much more quantitative information. It is possible to calculate someparameters of crack such as CTOA and J-integral. Based on the relationship between the plastic energy and the plastic defor-mation which can be determined by FRASTA, the loads that were imposed on the specimen during fracture can also be cal-culated. The method may provide a new way to help clarify the causes, such as over-load, variance of temperature, corrosionand so on that lead to fracture for metal materials without performing experiments while just from the broken parts. Thus,the ability of FRASTA to solve real-world problems will be greatly improved.
Acknowledgements
This work has been supported by the National Nature Science Foundation of China (Contract No. 11242004) and the StateKey Laboratory of Robotics (Contract No. 2013-O15).
References
[1] Kobayashi T, Shockey DA. A fractographic investigation of thermal embrittlement in cast duplex stainless steel. Metall Mater Trans A1987;18(11):1941–9.
[2] Kobayashi T, Shockey DA. FRASTA: a new way to analyze fracture surface. Adv Mater Process 1991;11:28–34.[3] Miyamoto H, Kikuchi M, Kawazoe T. A study on the ductile fracture of Al-alloys 7075 and 2017. Int J Fract 1990;42(4):389–404.[4] Murase Y, Nagakawa J, Yamamoto N. Fracture surface topography analysis of in-beam fatigue behavior for 20% cold-worked 316 stainless steel. J Nucl
Mater 2003;322(2–3):249–54.[5] Shiozawa K, Morii Y, Nishino S, Lu L. Subsurface crack initiation and propagation mechanism in high-strength steel in a very high cycle fatigue regime.
Int J Fatigue 2006;28(11):1521–32.[6] Kobayashi T, Shockey DA. Fracture analysis via FRASTA. Adv Mater Process 1991;140(6):24–32.[7] Kobayashi T, Shockey DA, Schmidt CG, Klopp RW. Assessment of fatigue load spectrum from fracture surface topography. Int J Fatigue
1997;19(93):237–44.[8] Kobayashi T, Shockey DA. The relationship between fracture surface roughness and fatigue load parameters. Int J Fatigue 2001;23:s135–42.[9] Lloyd WR. Microtopography for ductile fracture process characterization, Part 1: theory and methodology. Eng Fract Mech 2003;70(3–4):387–401.
[10] Kanninen MF, Popelar CH. Advanced fracture mechanics. New York: Oxford University; 1985.[11] Dawicke DS, Sutton MA, Newman JC, Bigelow CA. Measurement and analysis of critical CTOA for an aluminum alloy sheet. ASTM Special Tech Publ
1995;1220:358–79.[12] Volinsky AA, Moody N, Gerberich WW. Fiducial mark and CTOA estimates of thin film adhesion. Int J Fract 2003;119(120):431–9.[13] Corigliano A, Maier G, Mariani S. Analysis of ductile fracture in damaged pipelines by a geometric parameter method. Eng Struct 1999;21(10):924–36.[14] Cao YG, Tanaka K. Determination of some parameters of crack based on FRASTA simulation. Acta Metall Sin (Engl Lett) 2005;18(5):594–602.[15] Cao YG, Tanaka K. Determination of CTOA and J-integral by fracture surface topography analysis. Int J Fract 2006;139(2):253–66.[16] Cao YG, Xue SF, Tanaka K. Relationship between J-integral and fracture surface average profile. Acta Metall Sin (Engl Lett) 2007;20(1):40–8.[17] Igata N. Strength of materials. Tokyo: Baifukan; 1983.[18] Cao YG, Sun XY, Tanaka K. Study on the relationship between J-integral and COD. Acta Metall Sin (Engl Lett) 2007;20(6):417–24.[19] Cao YG, Zhang SH, Tanaka K. Calculation method for maximum low-cycle fatigue loads using FRASTA reconstruction data. Int J Fract
2013;182(2):157–66.[20] Cao YG, Tanaka K. Development of FRASTA simulation software. Acta Metall Sin (Engl Lett) 2006;19(3):165–70.