Engineering and Socioeconomic Impacts of Earthquakes
216
Engineering and Socioeconomic Impacts of Earthquakes Editors: M. Shinozuka A. Rose R. T. Eguchi An Analysis of Electricity Lifeline Disruptions in the New Madrid Area 2 Monograph Series Multidisciplinary Center for Earthquake Engineering Research A National Center of Excellence in Advanced Technology Applications
Transcript of Engineering and Socioeconomic Impacts of Earthquakes

Engineering and SocioeconomicImpacts of Earthquakes
Editors:M. Shinozuka
A. RoseR. T. Eguchi
An Analysis of Electricity Lifeline Disruptions in the New Madrid Area
2
Monograph Series
Multidisciplinary Center for Earthquake Engineering ResearchA National Center of Excellence in Advanced Technology Applications

xxiv
The Multidisciplinary Center for Earthquake Engineering Research
The Multidisciplinary Center for Earthquake Engineering Research (MCEER)is a national center of excellence in advanced technology applications that isdedicated to the reduction of earthquake losses nationwide. Headquartered atthe State University of New York at Buffalo, the Center was originally establishedby the National Science Foundation (NSF) in 1986, as the National Center forEarthquake Engineering Research (NCEER).
Comprising a consortium of researchers from numerous disciplines andinstitutions throughout the United States, the Center’s mission is to reduceearthquake losses through research and the application of advanced technolo-gies that improve engineering, pre-earthquake planning and post-earthquakerecovery strategies. Toward this end, the Center coordinates a nationwide pro-gram of multidisciplinary team research, education and outreach activities.
Funded principally by NSF, the State of New York and the Federal HighwayAdministration (FHWA), the Center derives additional support from the FederalEmergency Management Agency (FEMA), other state governments, academicinstitutions, foreign governments and private industry.

i

i i

iii
EN G I N E E R I N G A N D SO C I O E C O N O M I C
IM PA C T S O F E A R T H Q U A K E S:AN AN A LY S I S O F EL E C T R I C I T Y L I F E L I N E
DI S R U P T I O N S I N T H E NE W MA D R I D AR E A

i v

v
Edited byMasanobu Shinozuka
Adam RoseRonald T. Eguchi
EN G I N E E R I N G A N D SO C I O E C O N O M I C
IM PA C T S O F E A R T H Q U A K E S:AN AN A LY S I S O F EL E C T R I C I T Y L I F E L I N E
DI S R U P T I O N S I N T H E NE W MA D R I D AR E A

v i
Copyright © 1998 by the Research Foundation of the State University of New Yorkand the Multidisciplinary Center for Earthquake Engineering Research. All rightsreserved.
This mongraph was prepared by the Multidisciplinary Center for EarthquakeEngineering Research (MCEER) through grants from the National Science Foun-dation, the State of New York, the Federal Emergency Management Agency, andother sponsors. Neither MCEER, associates of MCEER, its sponsors, nor any per-son acting on their behalf:
a. makes any warranty, express or implied, with respect to the use of anyinformation, apparatus, method, or process disclosed in this report or thatsuch use may not infringe upon privately owned rights; or
b. assumes any liabilities of whatsoever kind with respect to the use of, orthe damage resulting from the use of, any information, apparatus, method, orprocess disclosed in this report.
Any opinions, findings, and conclusions or recommendations expressed in thispublication are those of the author(s) and do not necessarily reflect the views ofMCEER, the National Science Foundation, Federal Emergency ManagementAgency, or other sponsors.
Published by the Multidisciplinary Center for Earthquake Engineering Research
University at BuffaloRed Jacket QuadrangleBuffalo, NY 14261Phone: (716) 645-3391Fax: (716) 645-3399email: [email protected] wide web: http://mceer.eng.buffalo.edu
ISBN 0-9656682-2-3
Printed in the United States of America.
Jane Stoyle, Managing EditorHector Velasco, IllustrationJennifer Caruana, Layout and CompositionHeather Kabza, Cover DesignAnna J. Kolberg, Page Design and CompositionMichelle Zwolinski, Composition
Cover Photograph provided by EQE, Inc.
MCEER Monograph Number 2

vii
F o r e w o r d
Earthquakes are potentially devastating natural events whichthreaten lives, destroy property, and disrupt life-sustaining services andsocietal functions. In 1986, the National Science Foundation establishedthe National Center for Earthquake Engineering Research to carry outsystems integrated research to mitigate earthquake hazards in vulner-able communities and to enhance implementation efforts through tech-nology transfer, outreach, and education. Since that time, our Centerhas engaged in a wide variety of multidisciplinary studies to developsolutions to the complex array of problems associated with the develop-ment of earthquake-resistant communities.
Our series of monographs is a step toward meeting this formi-dable challenge. Over the past 12 years, we have investigated howbuildings and their nonstructural components, lifelines, and highwaystructures behave and are affected by earthquakes, how damage to thesestructures impacts society, and how these damages can be mitigatedthrough innovative means. Our researchers have joined together to sharetheir expertise in seismology, geotechnical engineering, structural engi-neering, risk and reliability, protective systems, and social and eco-nomic systems to begin to define and delineate the best methods tomitigate the losses caused by these natural events.
Each monograph describes these research efforts in detail. Eachis meant to be read by a wide variety of stakeholders, including acade-micians, engineers, government officials, insurance and financial ex-perts, and others who are involved in developing earthquake loss miti-gation measures. They supplement the Center’s technical report seriesby broadening the topics studied.
As we begin our next phase of research as the MultidisciplinaryCenter for Earthquake Engineering Research, we intend to focus our ef-forts on applying advanced technologies to quantifying building andlifeline performance through the estimation of expected losses; devel-oping cost-effective, performance-based rehabilitation technologies; andimproving response and recovery through strategic planning and crisismanagement. These subjects are expected to result in a new monographseries in the future.
I would like to take this opportunity to thank the National Sci-ence Foundation, the State of New York, the State University of New

viii
George C. Lee
Director, Multidisciplinary Center
for Earthquake Engineering Research
York at Buffalo, and our institutional and industrial affiliates for theircontinued support and involvement with the Center. I thank all the au-thors who contributed their time and talents to conducting the researchportrayed in the monograph series and for their commitment to further-ing our common goals. I would also like to thank the peer reviewers ofeach monograph for their comments and constructive advice.
It is my hope that this monograph series will serve as an impor-tant tool toward making research results more accessible to those whoare in a position to implement them, thus furthering our goal to reduceloss of life and protect property from the damage caused by earthquakes.

i x
C o n t e n t s
Foreword ....................................................................... viiPreface .......................................................................... xiiiAcknowledgments ......................................................... xixAbbreviations ................................................................ xxi
1 Introduction ..........................................................1by Adam Rose, Ronald T. Eguchi, and Masanobu Shinozuka
1.1 Background ........................................................................... 41.1.1 Brief History of Lifeline Earthquake Developments
in the United States .................................................. 51.1.2 Federal and Industry Lifeline Initiatives .................. 10
1.2 Overview ............................................................................ 10
2 Modeling the Memphis Economy .........................13by Adam Rose and Philip A. Szczesniak
2.1 History ................................................................................ 132.2 Major Sectors of the Memphis Economy .............................. 142.3 Economic Indicators ............................................................ 172.4 Economic Interdependence and Interindustry Analysis ......... 182.5 Memphis Input-Output Model ............................................. 222.6 Regional Analysis of the Role of Utility Lifelines................. 232.7 Conclusion .......................................................................... 29
3 Seismic Performance of Electric Power Systems ...33by Masanobu Shinozuka and Howard H. M. Hwang
3.1 Electric Power System ......................................................... 343.1.1 Conditions for System Failure ................................. 343.1.2 Substation Model .................................................... 353.1.3 Monte Carlo Simulation ......................................... 38
3.2 Conclusion .......................................................................... 43

x
4 Spatial Analysis Techniques for Linking PhysicalDamage to Economic Functions ...........................45by Steven P. French
4.1 Describing the Local Economy ............................................ 474.2 Spatial Analysis ................................................................... 494.3 Conclusion .......................................................................... 51
5 Earthquake Vulnerability and EmergencyPreparedness Among Businesses ..........................53by Kathleen J. Tierney and James M. Dahlhamer
5.1 Memphis/Shelby County Business Survey ............................ 575.2 Business Vulnerability ......................................................... 58
5.2.1 Building Type and Business Location ...................... 595.2.2 Lifeline Dependency .............................................. 605.2.3 Perceptions of the Earthquake Threat ...................... 64
5.3 Business Preparedness.......................................................... 655.3.1 Adoption of Preparedness Measures ........................ 655.3.2 Explaining Business Preparedness ........................... 67
5.4 Conclusion .......................................................................... 70
6 Direct Economic Impacts .....................................75by Stephanie E. Chang
6.1 Scope of Direct Economic Impacts ...................................... 756.2 Current Estimation Methodologies ....................................... 786.3 Conceptual Framework ....................................................... 806.4 Case Study: Electricity Disruption in NMSZ Earthquake ...... 81
6.4.1 Business Resiliency to Lifeline Disruption ............... 816.4.2 Location of Economic Activity ............................... 856.4.3 Lifeline Service Disruption and Restoration ............ 866.4.4 Deterministic vs. Probabilistic Analysis .................. 886.4.5 Results .................................................................... 91
6.5 Conclusion .......................................................................... 92
7 Regional Economic Impacts .................................95by Adam Rose and Juan Benavides
7.1 Estimation of Total Regional Impacts .................................. 967.1.1 Input-Output Impact Analysis ................................. 967.1.2 Analysis of Simulation Results ................................ 99
7.2 Optimal Rationing of Scarce Electricity ............................ 1027.2.1 Linear Programming ............................................. 1027.2.2 Analysis of Simulation Results .............................. 1067.2.3 Policy Implications ............................................... 111
7.3 Conclusion ........................................................................ 113

x i
8 Decision Support for Calamity Preparedness:Socioeconomic and Interregional Impacts .........125by Sam Cole
8.1 Modeling Economic Disasters ........................................... 1278.2 Construction of the Many-Region Accounts ....................... 128
8.2.1 Development of the Model ................................... 1298.2.2 Representation as a Virtual GIS-based Model ....... 131
8.3 Model Solution ................................................................ 1348.3.1 Distributed Disruptions, Transaction
Costs and Uncertainty .......................................... 1348.4 Memphis-Mississippi Valley Model ................................... 135
8.4.1 Memphis Region .................................................. 1358.4.2 Memphis Accounts ............................................... 137
8.5 Application of the Decision Support System ...................... 1418.5.1 Event Accounting Matrix ...................................... 1418.5.2 Base Scenario ....................................................... 1418.5.3 Income Distribution and Interregional Impacts ..... 1488.5.4 Reallocation of Resources..................................... 149
8.6 Integration into Policy Making .......................................... 1508.6.1 Decision Support Systems Versus Expert
Systems ................................................................ 151
9 Implications for Effective Lifeline Risk ReductionPolicy Formulation and Implementation ............155by Laurie A. Johnson and Ronald T. Eguchi
9.1 Study Implications............................................................. 1579.2. Towards Effective Lifeline Risk Reduction Policy
Formulation and Implementation....................................... 1629.2.1 Policy Formulation Model .................................... 162
9.3 Conclusion ........................................................................ 168
References ...................................................................171Index ...........................................................................183Contributors ................................................................189

xii

xiii
P r e f a c e
by Adam Rose
The potential losses from natural hazards, in terms of bothlives and property, are increasing. On the one hand, human ac-tion is now so pervasive as to intrude in a major way on theenvironment, even to the extent of causing climate change. Thismay manifest itself not only in terms of warming, but also climatevariability that increases the prevalence of strong winds andfloods. In contrast, our potential to affect the frequency of earth-quakes is rather limited. Here the main concern is the other sideof the ledger—the continued population and economic build-up,which makes us increasingly more vulnerable even if the fre-quency of ground shaking does not increase.
Our ability to cope with these issues thus requires an In-tegrated Assessment, ranging from geology and engineering toeconomics and policy. In-depth studies of this kind are, how-ever, lacking in the earthquake field, and, for the most part, withrespect to other natural hazards. Our study is the first that hasattempted such an assessment of urban lifeline systems in rela-tion to earthquakes.
This monograph is a first-of-its-kind effort to remedy thesituation by developing and applying a multidisciplinary meth-odology that traces the impacts of a catastrophic earthquakethrough a curtailment of utility lifeline services to its host regionaleconomy and beyond. The New Madrid Seismic Zone is an ap-propriate case study because it is the site of the largest earth-quakes to hit North America in recorded history. It has been thefocal point of extensive research, especially by scientists, engi-neers, and social scientists affiliated with the National Center forEarthquake Engineering Research over the first ten years of itsexistence. The study represents the culmination of many of theseefforts, which have often involved not only researchers but alsopublic officials, utility managers, company executives, and thepublic at large.

xiv
Our objective is to improve the understanding of the de-tailed aspects and overall complexity of the problem. This mono-graph examines and connects the role of an electric utility andits host economy, the vulnerability of the lifeline network to acatastrophic earthquake, the business response to physical dam-age and production losses, the estimation of direct economiclosses, the estimation of indirect losses in the immediate region,and the manner in which these losses cause further ripple effectsto a broader metropolitan area and the rest of the U.S., as well asthe policy implications of all these interactions. The presentationof this monograph appears multidisciplinary rather than interdis-ciplinary—it is more like a relay race where each member haspicked up the baton from his or her predecessor. However, eachhand-off heightens our interdisciplinary understanding of the prob-lem, and the effort as a whole is an integrated assessment.
The ultimate aim of our study is to heighten awareness ofearthquake vulnerability and the interconnected nature of hu-man actions. Our methods should help analysts sharpen theirvulnerability and loss estimates. It should also help private andpublic decision-makers make wiser choices about putting them-selves at risk and about coping measures ranging from pre-disas-ter mitigation to post-disaster recovery. Obviously, the analysisis readily generalizable to both other types of lifelines and othernatural hazards.
In addition to its practical usefulness, we also take prideas researchers in our ability to advance the state-of-the-art inseveral areas, both in terms of theory and empirical work. Ex-amples include:• An advanced vulnerability analysis of a major municipal elec-
tric utility system.• The results of a major survey of perceived business disrup-
tions.• A GIS overlay of a major socioeconomic database and an
electric utility grid, capturing engineering features of elec-tric utility lifelines and their linkages to the economy.
• Neglected features of input-output impact analysis relatingto the estimation of indirect effects, general input supplybottlenecks, resilience of production technology to electric-ity curtailment, and spatial differentials in electricity utiliza-tion.

xv
• Formal optimization of scarce lifeline services across sectorsand sub-regions.
• A methodology to telescope economic impacts from the neigh-borhood to the national level.
• A new set of policy recommendations only ascertainable froman integrated assessment.
The number of integrated assessment models of naturalhazards is on the rise. A major initiative was recently sponsoredby the National Institute of Building Sciences on behalf of theFederal Emergency Management Agency to develop an Earth-quake Loss Estimation Methodology, referred to as HAZUS, andrelated efforts are currently underway to supplement this effortwith wind damage and flood damages modules. HAZUS is acomputerized system primarily for use by government agenciesat all levels to evaluate hazard mitigation, response, and recov-ery. System components range from ground-shaking throughphysical damage to the built environment to a translation intodirect dollar damage and then direct and indirect business dis-ruption losses. Although HAZUS represents a major advance,for it to be operational it had to sacrifice modeling sophisticationof the type presented in this monograph. Also, more specifically,it is very limited in its treatment of lifelines, including only directphysical damage to lifeline structural components. It omits di-rect impacts on lifeline customers and ensuing economy-wideripple effects, as well as omitting considerations of optimal real-location of scarce lifeline resources so as to minimize produc-tion and employment losses. We hope that our monograph willprove useful in remedying these omissions in the HAZUS soft-ware and other practical approaches to emergency managementin the future. At the same time, we intend that our work willprovide engineering and socioeconomic insights that will helpstreamline loss estimation methods for complex systems in gen-eral.
This study will prove useful to several categories of read-ers. While the probabilities of large earthquakes are highly un-certain, the potentially overwhelming economic impacts (bothregionally and nationally) cannot be ignored. This study shouldprove provocative to even experienced public utility managers.It provides compelling evidence for considering a long-term riskmanagement strategy to reduce earthquake vulnerability. Fur-ther, it demonstrates the significance of economic impacts in-

xvi
duced by lifeline damage and the importance of considering themin designing socially responsible risk management strategies.
Insurance companies might also be interested in our meth-odologies to quantify indirect losses. There may be a marketdemand for insurance riders that cover business interruption lossesresulting from both direct damage to a facility or building, andfrom external factors, such as loss of electric power service orunavailability of other inputs. This coverage is not generally of-fered because of the lack of actuarial experience to assess risk.The methods developed in this study could be used to calculatethe potential magnitude of these losses, and then used in estab-lishing a credible insurance structure. As a result, insurance com-panies might be better able to offer business interruption cover-age on a broader basis.
Business executives could gain insight to earthquake pre-paredness from their counterparts in Memphis in terms of an as-sessment of vulnerability and identification of coping measures.They might also gain a greater appreciation of theinterconnectedness of the economy in which they operate andits ramifications. For example, paying a premium for non-inter-ruptible electricity service may not insure continued operation ifa supplier of another critical input opts not to pay the premiumand is not able to produce and hence deliver its product.
We also hope that the analysis will be useful to our fellowresearchers in the earthquake field, as well as other hazards.We make no pretense that we have exhausted research ad-vances needed to adequately address these issues, and henceencourage others to build on our work.
The research in this monograph has endeavored to im-prove our perspectives on time and space in relation to hazards.It has imparted spatial dimensions to economic models, wherethese are usually lacking. This is a key link between the physicalworld and the human settlement system. On a temporal side, theresearch emphasis on production losses helps heighten aware-ness that an earthquake event is not confined to the period ofground shaking and structural damage, but to the longer periodduring which the socioeconomic system is unable to prevail atpre-earthquake levels. This is key in making the transition fromstructural to nonstructural (societal) aspects of earthquakes.
Finally, an overall theme of this monograph is that natu-ral hazards accentuate scarcity, thus making resources even more

xvii
valuable than before. Our limited resources must be balancedwisely between pre-disaster mitigation and post-disaster recov-ery. Just as emergency medical, fire, and other safety servicesmust be well managed in the aftermath of a disaster, so too shouldlifeline services. This calls for major reallocations of resources,which may be controversial from a political standpoint. How-ever, our analysis indicates that savings from prioritizing elec-tricity service among those with the lowest intensities of elec-tricity use directly and indirectly (after safeguarding for health,safety, and essential industry) can reduce losses of goods andservices several-fold. As the author of one of the chapters notes,not taking advantage of such opportunities results in an outcomeas devastating as if the earthquake had actually toppled the build-ings in which the lost production would have originated.

xviii

xix
The papers in this monograph resulted from multi-year,multidisciplinary research sponsored by the National Center for Earth-quake Engineering Research. The researchers gratefully acknowledgethe assistance of many individuals who contributed to the project. Inparticular, we would like to thank Dr. Woody Savage, Pacific Gas andElectric Company; Mr. Tom Durham, Central United States EarthquakeConsortium; Dr. Anshel Schiff, Stanford University; Dr. Satoshi Tanaka,Kyoto University; and Mr. Tommy Whitlow and Mr. Bill Sipe, MemphisLight, Gas and Water (MLGW) Division, City of Memphis, for their help-ful suggestions. We are also indebted to MLGW and the Shelby CountyPlanning Department for access to their data.
We owe a great debt to the staff of the National Center for Earth-quake Engineering Research, especially its Director, Dr. George Lee,and its Publication Manager, Jane Stoyle, who did such a fine job duringthe various stages of this monograph’s production. We benefitted greatlyfrom the helpful suggestions of several anonymous reviewers contactedby NCEER to assess the suitability of our manuscript for publication. Thefinancial support of NCEER’s sponsors, the National Science Foundationand the State of New York, is also gratefully acknowledged. Several ofthe authors also benefitted from supplemental finding from related NSFgrants and other sources.
Many of the authors benefitted from clerical support at their institu-tions/organizations. However, the word processing and coordinationefforts of Jan Moyer of The Pennsylvania State University deserve spe-cial mention.
Perhaps our greatest debt is to our departed friend and colleague,Barclay Jones, who was a stalwart among NCEER researchers for manyyears. Barclay, perhaps more than anyone, worked to bridge the gapbetween engineers and social scientists. Without his pioneering efforts,this interdisciplinary monograph would not have been possible.
Acknowledgments

xx

xxi
A b b r e v i a t i o n s
ASCE American Society for Civil EngineersATC Applied Technology Council
BEPC (Memphis) Business Emergency Preparedness CouncilBSSC Building Seismic Safety Council
CB Circuit BreakerCTPP Census Transportation Planning PackageCUREe California Universities for Research in Earthquake
EngineeringCUSEC Central U.S. Earthquake Consortium
DRC Disaster Research CenterDSS Decision Support System
EAM Event Accounting MatrixEERI Earthquake Engineering Research InstituteEPRI Electric Power Research InstituteEPSA Electric Power Service AreaESRI Environmental Systems Research Institute
F.I.R.E. Finance, Insurance and Real EstateFEMA Federal Emergency Management Agency
GAMS General Algebraic Modeling SystemGIS Geographic Information SystemGRP Gross Regional Product
HH Household
IMPLAN Impact Analysis for Planning SystemI-O Input-OutputIRS Internal Revenue Service
LP Linear Programming

xxii
M MagnitudeMCEER Multidisciplinary Center for Earthquake Engineering
ResearchMLGW Memphis Light, Gas and Water DivisionMP Mathematical ProgrammingMSA Metropolitan Statistical AreaMW Megawatts
NCEER National Center for Earthquake Engineering ResearchNCGIA National Center for Geographic Information and
AnalysisNEHRP National Earthquake Hazards Reduction ProgramNIBS National Institute of Building SciencesNIST National Institute of Standards and TechnologyNMSZ New Madrid Seismic ZoneNRC National Research CouncilNSF National Science FoundationNYSSTF New York State Science and Technology Foundation
PGA Peak Ground AccelerationPOLA Port of Los Angeles
RMS Risk Management Software
SAM Social Accounting MatrixSBA Small Business AssociationSEMS Standardized Emergency Management SystemSIC Standard Industrial Classification
TAZ Traffic Analysis ZoneTCLEE Technical Council on Lifeline Earthquake EngineeringTCU Transportation, Communications and UtilitiesTVA Tennessee Valley AuthorityTVPPA Tennessee Valley Public Power Association

1
2
11111
by Adam Rose, Ronald T. Eguchi
and Masanobu Shinozuka
The largest earthquakes ever to hit North America were cen-tered in the New Madrid Seismic Zone near Memphis, Tennessee,in 1811-12. Reports of these events were phenomenal. Riverswere rerouted, trees were said to have popped right out of theground, and the ground shaking itself was felt as far away as Bos-ton (Pinick, 1981; Fuller, 1990). Yet, total dollar damages associatedwith the earthquakes were probably less than $1 million. Thereason is that the area was relatively uninhabited, the city of Mem-phis, for example, not being founded until several years later.
How would the situation differ today? An earthquake of asimilar or even lesser magnitude is projected to be able to causedamage in the billions of dollars. The difference is that the Mem-phis area is now highly populated and is the center of asophisticated and highly-interdependent regional economy. More-over, it is also a major crossroads for the national economy.
Earthquake events are what natural hazards expert Robert Kates(1971) refers to as a “joint interaction phenomenon”—a combi-nation of a physical stimulus and the human settlement system.Both are necessary for disaster to take place. The 1811-12 earth-quakes are much like the old philosophical conundrum: if a treefalls in the forest and there is no one around, is there a noise?Similarly, in an area with a small population and little economicactivity, an earthquake is not very meaningful.
This is much the rationale for the interdisciplinary nature ofthis monograph. A study of earthquake impacts requires knowl-edge of geological origins, but also of the engineering realities ofstructures and their vulnerabilities, the workings of the economy,the sociology of individuals and organizations, and the politicsand planning of mitigation, recovery, and reconstruction.
I n t r o d u c t i o n
2 C H A P T E R 1
This monograph presents an integrated study of the implica-tions of an electricity lifeline disruption caused by a majorearthquake in the New Madrid Seismic Zone. Scientists do notplace a strong likelihood of a reoccurrence of an earthquake themagnitude of the 8.5M event of the previous century in the Mem-phis area in the near future. Therefore, a 7.5M event was used asthe basis for this study. Note that high levels of damage to lifelinesand other features of the human use system can take place at evenlesser magnitudes as witnessed by the recent Kobe and Northridgeearthquakes. The methodology in this monograph, therefore, hasmore general applicability in terms of earthquake magnitude. Inaddition, it can provide insights into earthquake impacts in otherlocations, as well as those stemming from other hazards.
Electricity is one of several utilities termed “lifelines” becauseof its crucial role in maintaining social and economic systems andbecause of its linear characteristics, which make it especially vul-nerable to disruption from natural disasters. Economic losses stemfrom direct damage to various parts of an electricity network, in-cluding generating stations, distribution stations, transmission lines,and distribution lines. They also result from lost production andsales in those businesses without power, as well as those busi-nesses whose suppliers or customers have had their electricityservice disrupted. These impacts can extend far beyond the sitesof any physical damage, and, given the Memphis area’s increasingrole as a major manufacturing and distribution center, may be feltthroughout the U.S. economy. Electricity lifelines are also inte-gral to the orderly functioning of society in powering traffic signals,street lights, and safety alarms. These direct disruptions, com-bined with the loss of jobs in critical goods and services, have thepotential to cause civil strife as well.
Society has developed a number of coping strategies for life-line failures. These include mitigation measures, such as structuralreinforcement of electricity network facilities and earthquake re-sistant equipment. A number of recovery mechanisms also exist,including electricity network exchanges, back-up generation, andconservation. As this study provides information on how an elec-tricity network may be impacted by an earthquake and how thisdamage spreads throughout the economy, it should prove usefulin identifying an improved mix of coping strategies, including non-

3I N T R O D U C T I O N
structural measures, such as market-oriented and administeredreallocation of electricity supplies.
This monograph is the culmination of the efforts of severalresearchers whose work has been sponsored by the National Cen-ter for Earthquake Engineering Research. The team includesgeologists, engineers, planners, sociologists, economists, and ge-ographers. The project was undertaken as a case study, with acommon location, earthquake magnitude, and other parametersused by all the researchers. The study is truly interdisciplinary, asopposed to multidisciplinary. That is, the results from each facetof the research served as a critical input to one or more otherfacets, and the researchers directly advised or served as collabora-tors to those in other disciplines. Chapters of the monograph followa natural progression beginning with the illustration of why elec-tricity is a “lifeline” of the Memphis economy, followed by a spatialcharacterization of the electricity transmission systems and thenby an assessment of its vulnerability to earthquakes. A GeographicInformation System (GIS) is used to manage and represent net-work data. The GIS is key to linking the engineering and economicaspects of the study by effectively subregionalizing the Memphiseconomy according to electric power service areas. A chapter onindividual business response further identifies the importance ofelectric power in Memphis and the way business copes with itspossible disruption. This is followed by an assessment of the likelydirect economic impacts of a major New Madrid earthquake, tak-ing into account distinctions in sectoral electricity use and resiliencyin the face of disruption. The next chapter evaluates the total re-gional economic impacts, including multiplier effects, on ShelbyCounty, and is followed by a chapter that extends the impact analy-sis to the Memphis Metro area, and the U.S. as a whole. Policyimplications of these impacts are then explored, such as ways toreduce network vulnerability, to increase business resiliency, andto improve recovery. The study demonstrates that it truly doesrequire an integrated team effort to adequately address the majorissues associated with electricity lifeline disruptions in the con-text of natural hazards.
In addition to the unique interdisciplinary contributions of thisstudy, it offers advances in the state-of-the-art in several of its indi-vidual disciplines. These include the refinement of the systemsapproach to vulnerability analysis, the mapping of census datainto geographical units delineated by lifeline service areas, the

4 C H A P T E R 1
integration of lifeline resiliency measures into the formal estima-tion of direct losses, the establishment of a methodology forestimating indirect losses that eliminates double-counting, the re-formulation of the lifeline loss problem into an optimizationframework, and the systematic study of how the lifelines disrup-tions affect emergency response organizations.
B a c k g r o u n d
1.11.11.11.11.1
The failure and disruption of electric power systems duringearthquakes can be devastating and costly. Although the costs torepair these systems have been relatively small compared to otherdamaged structures, such as buildings and transportation struc-tures, the indirect impacts resulting from their failure can be farmore catastrophic. For example, the inability to supply power towater distribution systems during fires has led to conflagration oflarge urban areas, e.g., the Oakland Fires. In addition, many busi-nesses can fail if power is not restored in a timely manner.
Only recently have secondary effects resulting from lifelinedisruption been considered seriously. Part of the reason for thisslow development has been the lack of empirical data with whichto validate analytical or theoretical predictions of secondary orindirect loss. Another reason for this lack of development hasbeen that indirect loss assessment requires a multidisciplinary ef-fort. Engineers and social scientists must work together to developmodels to assess economic and social impacts. Until recently,engineers have not completely understood the measures or di-mensions used by social scientists to quantify socioeconomicimpact. By the same token, social scientists have not completelycommunicated to the engineers the importance of quantifying ef-fects, other than direct damage, to lifelines.
As the previous discussion explains, the current effort is oneof the first attempts at bringing engineers and social scientists to-gether to focus on this important problem. Because research taskshave been defined within a larger project scope, it has been pos-sible to link various analytic capabilities to resolve these complexissues. Although much progress has been made in this study, morework is needed to deliver a methodology and tools that can be

5I N T R O D U C T I O N
used by utility company owners and operators in their everydayoperations. In addition, only some of the potential applications ofindirect loss estimation are explored in the last section of this re-port, which deals with policy implications.
In order to provide some perspective on where this study fitsin the overall evolution of lifeline engineering, a discussion of thehistory of lifeline earthquake engineering in the U.S. is provided.This is followed by a discussion of important federal initiatives toimprove the seismic performance of lifelines.
1.1.1 Brief History of Lifeline Earthquake
Developments in the United States
“As does a human body, a city has lifelines. In the body,they provide for the supply and the flow of energy, informationand water by means of the alimentary, vascular and neurologi-cal systems. In the city they provide for the supply and theflow of people, goods, information, energy and water by meansof the transportation, communication, energy and water sys-tems.
The failure to function of one of the lifelines, or its severeimpairment, brings on injury or death to the human body anddamage or disaster to the city. Knowledge of the risk of suchfailures is a stimulus for preventive measures. The acceptablelevel of risk is established by the individual for his body and bythe citizenry for the city.”
— C. Martin Duke (1972)
Although the importance of lifelines to community welfarehas long been understood, it was not until the 1971 San Fernandoearthquake that we fully understood the extent of their vulner-abilities, particularly during natural disasters. As stated by ProfessorC. Martin Duke, the founder of lifeline earthquake engineering inthe U.S., “the function of lifeline earthquake engineering is to pro-vide reliable lifeline systems and components which will performtheir functions in and after earthquakes and will protect propertyand human activity against lifeline and earthquake hazards.” Af-ter the San Fernando event, it was recognized that this functionhad not fully been performed.

6 C H A P T E R 1
As a result of this earthquake, lifeline engineering profession-als in the U.S. set a general goal to raise the state of the artinternationally to the equivalent of that which prevailed for earth-quake resistive buildings at that time. This goal will have beenachieved “when a comprehensive set of standards of lifeline per-formance in earthquakes [will] have been established and havebeen proved out in future earthquakes.” The time frame for thisgeneral goal was set at 30 years from the San Fernando earth-quake.
It is now roughly 26 years after the San Fernando earthquake,and standards still are not in place for most lifelines. Although acomprehensive plan has been developed for adopting lifeline stan-dards, it has had little momentum behind it, and as a result, manyof our lifeline systems remain vulnerable to earthquake damage.In order to improve this situation, demonstration studies must beperformed to illustrate the full scope of effects and impacts thatmay result from the failure and disruption of these systems, andthe benefits that accrue from the implementation of cost-effectivemitigation activities. This monograph addresses some of theseissues and also helps to put into perspective the importance ofconsidering the indirect and other broader impacts associated withthe disruption of lifeline service. It is hoped that this informationwill be used to help achieve the goals set forth immediately afterthe San Fernando earthquake by those pioneers in lifeline earth-quake engineering.
The following chronology summarizes some of the more im-portant milestones in lifeline earthquake engineering and relatedtopics in the U.S. (see also Eguchi, 1997). The major impetus toexamine seismic design procedures for lifeline facilities really be-gan with the 1971 San Fernando earthquake. Even though therehad been prior earthquakes in the U.S., which had highlighted theimportance of lifeline systems after major disasters (e.g., the 1906San Francisco earthquake), the San Fernando event was the firstearthquake to promulgate changes in design and construction.
Year Milestone
1971 San Fernando Earthquake (M6.4)
Significant damage to all lifeline systems. Start oflong-term research program to study the effects of earth-quakes on all lifeline systems (mostly National Science

7I N T R O D U C T I O N
Foundation funding). Many changes tolifeline seismic design and construction initiatedby this event.
1974 The Technical Council on Lifeline EarthquakeEngineering (TCLEE)
Formed to address general issues regarding thestate-of-the-art and practice of lifeline earthquakeengineering in the U.S. TCLEE has sponsored fourmajor conferences on lifeline earthquake engineering;endowed the C. Martin Duke Lifeline Earth-quake Engineering Award; and has published nu-merous monographs, design guideline documents, andspecial reports on lifeline earthquake engineering.
1985 Building Seismic Safety Council (BSSC) LifelineWorkshop
Led to an action plan for abating seismic hazards. Theworkshop had recommendations in four ar-eas: public policy, legal and financial strategies;information transfer and dissemination; emergency plan-ning; and scientific and engineering knowl-edge.
1986 National Center for Earthquake EngineeringResearch(NCEER)
Formed to address socioeconomic issues relatedto the seismic performance of lifeline systemsthrough a multi-year grant to the State Universityof New York at Buffalo. This Center has broughttogether researchers from many different technical dis-ciplines to focus on multi-dimensional issues(e.g., socioeconomic impacts caused bythedisruption of lifeline service).
1989 Loma Prieta Earthquake (M7.1)
Reaffirmed need to assess and improve seismicdesign and construction procedures for all lifeline fa-cilities. Particular attention was given to the perfor-mance of highway bridge structures.

8 C H A P T E R 1
1990 Port of Los Angeles (POLA) Seismic Workshop
Developed a set of guidelines to be used by theport to address seismic design issues in the design andconstruction of new landfill areas within theport. This workshop reflected the culmination ofmany months of preparation and meetings among sci-entists, engineers and policymakers.
1990 Public Law 101-614 (Reauthorization of theNational Earthquake Hazards Reduction Program)
Required the Director of the Federal EmergencyManagement Agency, in consultation with theNational Institute of Standards and Technology, to sub-mit to Congress a plan for developing andadopting seismic design and construction standards forall lifelines.
1990 Iben Browning Prediction for a New MadridEarthquake
Prediction triggered many midwestern utilities toquickly anchor critical electric power equipmentin the anticipation of a large New Madrid earth-quake.
1991 Lifeline Standards Workshop
Workshop obtained comments and suggestions for re-vising draft plans prepared in response to Public Law101-614, examining lifeline issues, and iden-tified priorities for various standard developmentand research activities.
1991 Workshop sponsored by the National ScienceFoundation and the National CommunicationsSystem
One of first workshops to focus on the effects ofearthquakes on communication lifeline systems.This workshop was followed by a second meeting in1992 to discuss different approaches to com-munication lifeline modeling.

9I N T R O D U C T I O N
1994 Northridge Earthquake (M6.7)
Performance of lifelines significantly improvedcompared to prior earthquakes in this region (e.g., 1971San Fernando earthquake). However, concern con-tinued over the performance of highway bridgesstructures.
1995 Standardized Emergency Management Systems(SEMS)
Required all municipal agencies in California, in-cluding lifeline operators, to develop standardized emer-gency response plans. This requirement was, in largepart, motivated by the poor performanceof water supply systems during the 1991 Oakland Hillsfires in California.
1995 G7 Bilateral Meeting between Japan and the U.S.
Resulted in the commitment from both countriesto work together to better prepare for natural di-sasters. This meeting has led to many U.S.-Japanresearch initiatives, including several that dealexclusively with lifeline performance. The 1994Northridge and 1995 Kobe earthquakes were thekey motivating factors in this development.
1995 NIST/FEMA Lifeline Standards Development Plan
Plan encourages the voluntary adoption of seismic de-sign and construction standards for all publicand private lifelines.
1997 Deregulation of the Natural Gas and ElectricPower Industries
Deregulation may have multiple impacts on cur-rent and future earthquake hazard mitigation pro-gram. Increased competition leads to more utility ser-vice providers in the market, thereby loweringprices and increasing system redundancies. How-ever, competitive pressures may limit the amountof money that a utility will spend to reduce future sys-tem vulnerabilities or to improve overall sys-tem reliability.

10 C H A P T E R 1
1.1.2 Federal and Industry L ifel ine
Init iat ives
The federal government has historically played a major role infacilitating research and seismic evaluation programs for lifelines.With the reauthorization of the National Earthquake Hazards Re-duction Program, Congress mandated that the Federal EmergencyManagement Agency (FEMA), in consultation with the NationalInstitute of Standards and Technology (NIST), develop a plan forassembling and adopting national seismic design standards for alllifelines, public and private. This resulted in the formulation ofthe FEMA Report, Plan for Developing and Adopting Seismic De-sign Guidelines and Standards for Lifelines. A major feature of thisplan is the recommendation that public and private partnershipsbe developed in order to effect implementation. As key elementsof the plan, several pilot projects will be conducted to demon-strate the cost-effectiveness of various mitigation strategies. Overall,this plan will be consistent with FEMA’s new initiative for an im-proved hazard mitigation strategy.
O v e r v i e w
1.21.21.21.21.2
Chapter 2 introduces the Memphis economy in terms of itshistory and current structure. It also portrays the role of electricitylifelines in sustaining economic activity in all sectors. The impor-tance of economic interdependence is made clear and serves asthe basis for choosing the modeling approach of InterindustryAnalysis.” The core of this approach is an “Input-Output Table,” amatrix of all purchases and sales among economic sectors in Mem-phis in a given year. The chapter concludes with an illustration ofelectricity lifeline “multipliers” derived from this table, which pro-vide insight into indirect impacts of electricity disruption.
Chapter 3 provides an introduction to the Memphis electricitysystem as operated by the Memphis Light, Gas and Water Divi-sion (MLGW) of the City. A Geographic Information System isused to provide a two-dimensional depiction of this network, whichis divided into 36 electric power service areas (EPSAs) for further

11I N T R O D U C T I O N
analysis. The reliability of the Memphis electricity lifeline net-work during the occurrence of earthquakes is analyzed using MonteCarlo methods. This chapter presents the results of simulations ofdisruptions based on data on seismicity and data on engineeringcharacteristics of electricity substations. The results summarizethe vulnerability of the system to earthquakes ranging in magni-tude of M6.5 to M7.5.
Chapter 4 provides more details of the Geographic Informa-tion System (GIS) used in the various aspects of the study. GISimparts a spatial dimension to the Memphis economy by differen-tiating sectoral electricity demand in each EPSA so, in effect, theEPSAs become subregional economies. This is done by mappingU.S. Census Bureau data relating to employment by place of workonto EPSA configurations. This work would have taken weeks byconventional methods, as opposed to the expeditious approach ofoverlaying Census boundaries and EPSA boundaries.
Chapter 5 summarizes the results of a survey of individualbusiness response to earthquake hazards. It indicates how vulner-able businesses in the Memphis area might be if a major earthquakewere to take place. The evaluation is performed and measured interms of building type and lifeline dependency. It also identifiesthe “resiliency” in the economy, which arises from various copingstrategies. These include mitigation measures, such as reinforcingbuildings and having backup power in place, as well as variousresponse strategies, such as relocating business activities.
Chapter 6 discusses the various aspects of estimating the di-rect economic impacts of a major earthquake. The analysiscombines reliability data, economic data, lifeline network, andresiliency data in each EPSA to translate earthquake-induced elec-tricity lifeline disruptions into sectoral economic losses. Theanalysis translates simulation results of Chapter 3 for a scenarioM7.5 earthquake into sectoral production losses in each of theEPSAs based on their employment opposition generated by theGIS results in Chapter 4. The measures of business resiliency fromChapter 5 are incorporated as well. The analysis in Chapter 6 alsoshows that direct production losses are not a constant factor ofphysical damages but depend on the timing of restoration.
Chapter 7 details the estimation of total regional impacts.Direct economic losses estimated in Chapter 6 are fed into anInput-Output table to show how lifeline disruptions ripple through

12 C H A P T E R 1
the rest of the Shelby County economy. Thus, in addition to themore obvious direct effects, there are successive rounds of up-stream indirect impacts on suppliers of a given business anddownstream impacts on its customers. Also, the chapter providesa lead-in to policy formation. Rather than cutting back electricityusage on a proportional, or across-the-board manner, a linear pro-gramming analysis is used to indicate how economic losses canbe significantly reduced by reallocating electricity across sectorsand by rearranging the time pattern of recovery among substa-tions.
Chapter 8 shows how the direct and indirect impacts estimatedin Chapters 6 and 7 spread beyond Shelby County to outer rings ofthe Memphis metropolitan area and beyond to the United Statesas a whole. Moreover, a methodology is presented, based on theconcept of a Social Accounting Matrix, to perform impact analy-ses at the census tract level. The chapter provides a broadframework for policy-making with regard to electricity lifeline andother crucial goods and services in a regional economy hit by anearthquake, including a generalization of the optimization modelpresented in Chapter 7.
Chapter 9 summarizes the major points of previous chaptersthat have policy relevance. It crystallizes several important policyimplications of the analysis that can save lives, income, and jobs.The chapter also presents a policy formulation model to delineatethe essence of earthquake risk problems, devise risk managementsolutions, identify the most effective participants to reduce earth-quake risk, develop appropriate mechanisms for action, andacquire the necessary financial base and knowledge base to con-tinue priority research and to translate it into effective policies.

13
2
22222
The city of Memphis is located in the southwest corner of thestate of Tennessee on the banks of the Mississippi River. Directlyto the south of the city is the state of Mississippi and across theMississippi River to the west is the state of Arkansas. The city isspread out over 295.5 square miles of a relatively flat landscapeand is classified within the five county Memphis Metropolitan Sta-tistical Area (MSA) (3,013 square miles), which is comprised ofthree counties in Tennessee (Shelby County, Fayette County, andTipton); one county in Mississippi (De Soto), and one county inArkansas (Crittenden). The average annual temperature in the cityis 62° Fahrenheit and because it is located in the middle of the“Sun Belt,” Memphis averages more sunny days each year thanMiami.
In 1995, the population of Memphis was 865,000. Between1990 and 1995, the overall population grew by 27,100 or 3.2%.In 1990, the Census Bureau ranked Memphis as the 43rd mostpopulous city in the U.S. Also in 1990, the racial make-up of thecity was 55.1% white, 43.6% black, 0.9% Hispanic, and 0.4%other (U.S. Bureau of the Census, 1997).
Memphis was founded in 1819 by three prominentNashvillians: General Andrew Jackson, General James Winches-ter, and Judge John Overton, upon land that became part of theUnited States in 1797. Over the next forty years the city grew bya steady influx of Africans, Germans, French, and Irish. Althoughits late origin averted all but damage to its natural setting from theNew Madrid earthquakes of 1811-12, it suffered a human tragedyin 1838 when the native tribe of Chickasaw Indians was forced
H i s t o r y
2.12.12.12.12.1
by Adam Rose and Philip A. Szczesniak
Model i ng the
Memph i s Economy

14 C H A P T E R 2
out of the city and onto the “Trail of Tears” to other parts of theUnited States.
By the 1860s, Memphis was the sixth-largest city in the Southand became known as the “Capital of the Mid-South.” This statusmade Memphis a focal point for Union strategies during the CivilWar. However, Memphis was not well prepared for war, and thusin 1862 the city was easily overrun by the Union army. Becausethere was not much fighting in Memphis, the city did not endurethe devastation that many other cities throughout the South suf-fered during the war.
Between 1860 and 1900, Memphis was primarily involvedwith helping to rebuild the South. During this period, Memphisbegan to grow as a distribution center. However, there were twosetbacks to the overall growth of the city. In 1872 and 1878,yellow fever epidemics devastated the city, killing more than 5,000people and sending nearly half of the city’s population of 50,000to seek safety elsewhere.
By the turn of the century, Memphis started showing signs thatit had overcome its problems of the previous decades. Amongsome of the accomplishments of which the residents could boastwere: 1) the first bridge erected over the Mississippi River south ofSt. Louis; 2) 100 miles of trolley car tracks throughout the city; 3)a web of electric lines to practically every home and business(provided by the Memphis Power and Light Company); and 4) apopulation of over 100,000 residents, making it the third-largestcity in the South.
Between 1910 and 1950, Memphis continued to graduallygrow by the guidance of E. H. Crump. He served as mayor of thecity from 1910 to 1915 and remained actively involved in eco-nomic development throughout his lifetime. The Crumpadministration is largely credited with putting Memphis on firmfinancial footing (Memphis Area Chamber of Commerce, 1994).
In the second half of the twentieth century, Memphis has con-tinued to build upon its solid heritage. For example, the city
2.22.22.22.22.2
Major Sec tors o fthe Memph i s Economy

15MODELING THE MEMPHIS ECONOMY
currently has one of the Nation’s largest medical facilities; hasbecome the Nation’s leading distribution centers; and, due in greatpart to the success of Elvis Presley and the “blues” musicians onBeale Street, has become one of the Nation’s premier entertain-ment centers.
Agriculture and related industries are a cornerstone of theMemphis economy. Although tobacco is the leading cash crop inthe State of Tennessee, cotton is “king” in and around Memphis.Since Memphis is at the regional trading center for cotton farmersfrom Tennessee, Arkansas, Mississippi, Missouri, Kentucky, and Ala-bama, it is the largest spot cotton market in the world. The cottonbrokerage houses alone bring in over $3 billion in gross revenuesannually to the city. In addition, Memphis is a major trading cen-ter for soybeans and hardwoods. Well-known food productcompanies, such as Kellogg, Beatrice/Hunt-Wesson, Kraft, andArcher Daniels Midland, are all large local employers.
With respect to the construction sector, recently there havebeen a number of large projects in the city. Two noteworthy onesinclude the $62 million 20,500-seat Pyramid sports and enter-tainment arena and the $56 million David Taylor Naval ResearchCenter. Other projects include a new high rise national head-quarters for AutoZone and a new IRS service center comprised offive buildings that cover more than one million square feet.
In the manufacturing sector, there are over 1,000 plants foundin the city. The sector was recently bolstered by an investment byCoors of $110 million for the retrofit of the former Stroh BrewingCompany plant. A sampling of other recent relocations or expan-sions of existing businesses include Birmingham Steel Corporation,Toshiba America Information Systems, Sharp, Mazda, WESCO di-vision of Westinghouse, International Paper, and Fisher-Price.
Memphis has made great strides towards becoming a nationalleader in transportation and distribution. For example, Walt Disney,Williams Sonoma, and Nike have all located major warehousingand distribution operations in Memphis. Serving these and otherinterests is the Memphis International Airport, which recently be-came the number one cargo airport in the world due in great partto being the Federal Express hub.
Memphis is also at the crossroads of several utility lifelines.These include oil pipelines, gas pipelines, and electricity trans-mission lines that serve not only the city, but are key to nationalnetworks. Electricity is supplied by the Memphis Light, Gas, and

16 C H A P T E R 2
Water Division of the Tennessee Valley Authority under a distribu-tor contract.
Health care services also significantly contribute to the over-all economy. Among the larger hospitals in Memphis are BaptistMemorial Hospital and St. Jude Children’s Research Hospital.Baptist Memorial Hospital is the nation’s largest private hospitalwith a staff of about 6,000. St. Jude Children’s Research Hospitaland the University of Tennessee-Memphis Medical School bringin more than $62 million annually in federal research funds.
Each year, many tourists come to see the many attractions inand around the city of Memphis. For example, in sports, the Lib-erty Bowl at the Fairgrounds has 63,000 seats. In addition, thecity has been the setting for the filming of several motion pictures,most recently, “The Firm” and “The Client,” both based on best-selling novels by John Grisham. Furthermore, some of the moreprominent entertainers have included B. B. King, Jerry Lee Lewis,and Elvis Presley, whose Graceland Estate alone draws nearly700,000 people each year.
The military is also a major employer in the region. The Mem-phis Naval Air Station at Millington employs about 12,000 people.Like many military bases across the country, the Memphis NavalAir Station has been threatened with closure. Recently, the basetraining command contingent has been replaced by staff from theBureau of Naval Personnel (Memphis Area Chamber of Commerce,1994).
Overall, the largest sectoral grouping in Memphis in 1994 wasservices, which accounted for 25.9% of earnings and 28.9% ofemployment; trade, 19.5% and 24.4%; government, 16.1% and15.4%; transportation, 13.4% and 10.0%; and manufacturing,12.7% and 9.1%. While earnings have increased for every sectorin the economy over the period 1990 to 1994, employment hasnot. The government sector has accounted for the greatest loss ofjobs with a decrease of 3,880. Mining has experienced the great-est percentage loss with a decrease of 21.1%. Sectors that haveshown the most growth are transportation, 15.1%; services, 12.0%;agriculture, 10.8%; and retail trade, 4.4% (U.S. Bureau of Eco-nomic Analysis, 1996).
17MODELING THE MEMPHIS ECONOMY
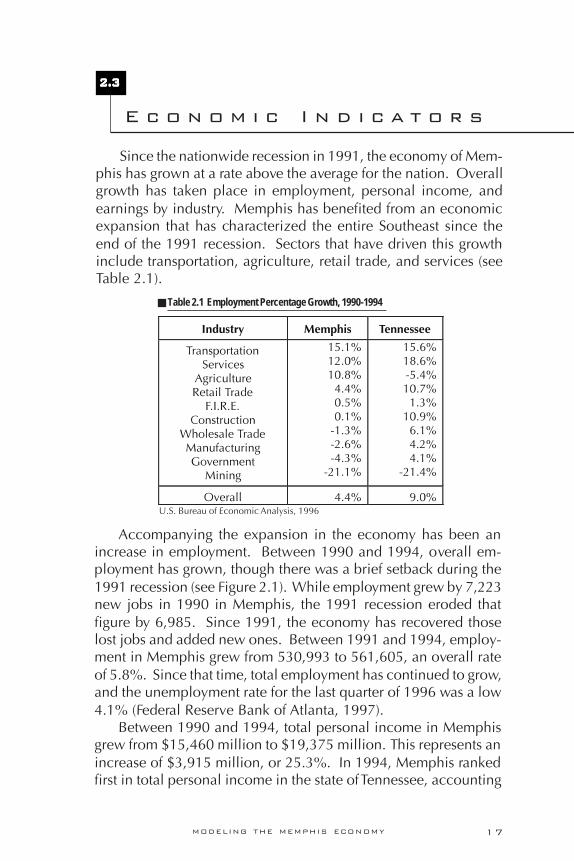
Since the nationwide recession in 1991, the economy of Mem-phis has grown at a rate above the average for the nation. Overallgrowth has taken place in employment, personal income, andearnings by industry. Memphis has benefited from an economicexpansion that has characterized the entire Southeast since theend of the 1991 recession. Sectors that have driven this growthinclude transportation, agriculture, retail trade, and services (seeTable 2.1).
Accompanying the expansion in the economy has been anincrease in employment. Between 1990 and 1994, overall em-ployment has grown, though there was a brief setback during the1991 recession (see Figure 2.1). While employment grew by 7,223new jobs in 1990 in Memphis, the 1991 recession eroded thatfigure by 6,985. Since 1991, the economy has recovered thoselost jobs and added new ones. Between 1991 and 1994, employ-ment in Memphis grew from 530,993 to 561,605, an overall rateof 5.8%. Since that time, total employment has continued to grow,and the unemployment rate for the last quarter of 1996 was a low4.1% (Federal Reserve Bank of Atlanta, 1997).
Between 1990 and 1994, total personal income in Memphisgrew from $15,460 million to $19,375 million. This represents anincrease of $3,915 million, or 25.3%. In 1994, Memphis rankedfirst in total personal income in the state of Tennessee, accounting
E c o n o m i c I n d i c a t o r s
2.32.32.32.32.3
U.S. Bureau of Economic Analysis, 1996
Table 2.1 Employment Percentage Growth, 1990-1994

18 C H A P T E R 2
for 19.2% of the total of $100,656 million. Tennessee ranked20th in the nation and accounted for 1.8% of the national total of$5,592,000 million.
Between 1990 and 1994, per capita personal income for Mem-phis grew from $18,674 to $22,592. This represents an increaseof $3,918, or 21%. Although Memphis’ total personal incomeranked first in the state in 1994, its per capita personal incomeranked only third. In 1994, this value was about $3,000 higherthan the average of $19,450 for the entire state and about $900higher than the national average of $21,696. Figure 2.2 showshow per capita personal income has steadily grown for both Mem-phis and the state of Tennessee (U.S. Bureau of Economic Analysis,1996).
When measuring the impact that a particular sector has on aregion’s economy, it is important to look beyond its direct role andto also examine the extent to which it stimulates other sectors.No economic enterprise stands alone, but rather is dependent onother businesses as suppliers or customers. These, in turn, depend
Economic Interdependenceand Interindustry Analysis
2.42.42.42.42.4
U.S. Bureau of Economic Analysis, 1996
Figure 2.2 Per Capita Personal Income
U.S. Bureau of Economic Analysis, 1996
Figure 2.1 Overall Employment Growth

19MODELING THE MEMPHIS ECONOMY
on suppliers and customers of their own. The sum total of thesebusiness relations are a multiple of a given sector’s direct activity,hence the term “multiplier effect.” Another term, which capturesthese relationships, but from another perspective, is “ripple ef-fect,” which conjures up the successive waves of broader activityfollowing an initial stimulus.
An Input-Output (I-O) table is a valuable tool that providesinsights into economic interdependence. The table is composedof a set of accounts representing purchases (or inputs) and sales(or output) between all of the sectors of the economy. Officialversions of these tables at the national level, prepared by the U.S.Department of Commerce, are based on an extensive collectionof data from nearly all U.S. business establishments.
These accounts can serve as the foundation for more formalmodels, the most basic of which assume a linear relationship be-tween inputs and the outputs they are used to produce. Thesestructural models enable us to trace linkages between sectors andto estimate the economy-wide impacts of changes in activity inany one sector, such as electricity.
Input-Output analysis was pioneered in the 1930s by Profes-sor Wassily Leontief. Since that time, Leontief and hundreds ofother researchers have extended I-O theory, constructed tables forcountries and regions around the world, and used these tables toperform a broad range of economic impact analyses. I-O analysisis considered such an important achievement that Leontief wasawarded the Nobel Prize in Economics in 1973 (see Leontief, 1986;Miller and Blair, 1985; and Rose and Miernyk, 1989 for furtherinsight into Input-Output analysis).
In addition to the official U.S. I-O table, based on U.S. De-partment of Commerce censuses of business establishments, tableshave been constructed for many regions of the U.S., based onadjustments of national data and/or a regional sample of firmswithin a region. The former set of regional Input-Output tables,those based on adjusted national coefficients, has been called non-survey I-O tables, and the latter, based on expensive sampling offirms within a region, has been called survey-based I-O tables.There are five widely-used, non-survey based regional I-O tablesin the United States (Brucker et al., 1987). Among them is theImpact Analysis for Planning System, or IMPLAN (1993), devel-oped by the U.S. Forest Service in conjunction with several othergovernment agencies including the Federal Emergency Manage-

20 C H A P T E R 2
ment Agency. IMPLAN consists of national and regional eco-nomic data bases and methodologies to construct small area I-Otables and to apply them in impact studies. In this monograph,the IMPLAN I-O tables generated for the Shelby County economy,the nine-county metropolitan area, and the remainder of the U.S.were used to examine the local and wide-ranging impacts of aNew Madrid earthquake.
The IMPLAN system is currently benchmarked to 1992. Giventhe enormous amount of data collection and reconciliation thatgoes into constructing an I-O model, there is typically a consider-able lag between the year in which data are gathered and the dateof availability of the table. The authors are satisfied that one of thebest available models was utilized, and that any errors in estimat-ing industry impacts are likely to be small.1 Although the economyhas grown, the structural relationships (ratios of input to outputs)upon which I-O models are based, have been found to be rela-tively stable over short time periods (3-8 years) (see Conway, 1980;Afrasiabi and Casler, 1991).
An input-output model typically determines the supply re-sponse to a given change in demand. It can also be adapted to an“allocation,” or supply side, version to analyze the impacts onproduction of a supply shortage (see, e.g., Davis and Salkin, 1984;Oosterhaven, 1988; Rose and Allison, 1989). However, in bothcases, the I-O approach represents a mechanistic response of fixedinput requirements or marketing patterns. An alternative is to uti-lize a model that allows for a reallocation of resources in pursuitof a societable objective, such as maximizing gross regional prod-uct (GRP). In the context of lifeline disruptions associated withearthquakes, this problem could be reformulated as the realloca-tion of scarce electricity so as to minimize loss of GRP oremployment.
A modeling framework that can perform such analyses is lin-ear programming (LP) or mathematical (MP) in general. LP involvesthe maximization of an additive objective function subject to a setof linear constraints (see, e.g., Baumol, 1980; Rose and Benavides,1997). In fact, an I-O model can be transformed into an LP formatby specifying an objective function subject to the technologicalconstraints of economic sector production structures and con-straints relating to the availabilities of primary factors of production(labor, capital, and natural resources). This can be extended toinclude additional constraints for produced goods and services,

21MODELING THE MEMPHIS ECONOMY
including electricity. Such an analysis will be performed in Chap-ter 7.2
Interindustry models were chosen for this analysis because oftheir ability to reflect the structure of a regional economy in greatdetail, to trace economic interdependence by calculating indirecteffects of lifeline disruptions, and to identify an optimal emer-gency response. The use of these models to estimate the regionalimpact of natural hazards dates back to the work of Cochrane(1974). Several standard input-output impact analyses of earth-quakes have been performed over the past two decades (see, e.g.,Wilson, 1982). More recently, several advances have been madein this approach in relation to earthquake damage in general andlifelines in particular. Kawashima and Kanoh (1990), Cole (thisvolume), and Gordon and Richardson (1995) have constructedmultiregional I-O models to perform analyses of general earth-quake impacts. Cole (1995) has also performed such an analysisat the neighborhood (census tract) level. Cochrane (1997) hasrecently developed an expert system using IMPLAN input-outputdata and a set of supply-demand balancing algorithms intendedto yield ballpark impact estimates. Aspects of import adjustmentsin I-O models applied to estimating earthquake impacts were firstsuggested by Boisvert (1992).
Cochrane’s (1974) original work was a linear programmingformulation for the economy as a whole, as was a model outlinedby Rose (1981) to minimize losses from a utility lifeline disruptionby reallocating resources across sectors. Both models were simpleformulations of maximizing Gross Regional Product subject to onlythe most rudimentary constraints—constant production technol-ogy and limits on primary factors of production. The conceptualmodels presented by Rose and Benavides (1997) include adjust-ments in I-O coefficients (including imports), consideration ofexcess production capacity, minimum final demand requirementsfor necessities, reallocation of resources over time, and the incor-poration of risk (the latter in a “chance-constrained” programmingformulation). A recent paper by Cole (1995) utilizes a program-ming extension of a social accounting matrix to examine theimplications of alternative welfare criteria, including giving greaterweight to certain socioeconomic or interest groups (see Chapter8).
Of the above research, only Boisvert (1992), Cole (1995), andRose and Benavides (1997) have explicitly examined the impacts

22 C H A P T E R 2
of lifeline disruptions. This monograph advances the state-of-the-art in several ways. First, for the first time, engineering features ofelectric utility lifelines and their linkage to the economy are incor-porated into interindustry studies. Second, neglected features ofI-O impact analysis relating to the estimation of indirect effects,general input supply bottlenecks, the resiliency of production tech-nology to electricity curtailments, and spatial (subregional)differentials in electricity use/availability are clarified. Finally, aformal optimization model is offered that incorporates the abovefeatures to examine potential policies to alter the restoration pat-tern of electricity utility network components across subregions,in addition to the more conventional reallocation of electricityacross sectors.3
Memphis Input-Output Model
2.52.52.52.52.5
The core of the economic model is a 21-sector input-outputtransactions table for Shelby County, Tennessee (the heart of theMemphis metropolitan area), which is presented in Table 2.2. Thetable was derived from the IMPLAN system (1993).
The I-O table contains a set of double-entry accounts. Eachrow represents the sales of the sector listed at the left to all othersectors, whose identities are given by the corresponding sectornumbers along the top margin (column headings). Each columnrepresents the purchases by a given sector from all other sectors inthe region, as well as purchases of imports and primary factors(capital and labor listed in the value-added row), and final de-mand (comprised of consumption, investment, governmentexpenditures, and exports). For example, the table indicates thatin 1991 the electric utilities sector (sector 10) sold $1.6 millionand $16.6 million, respectively, to intermediate sectors agricul-ture (Sector 1) and retail trade (Sector 14), as well as $78.7 millionto residential customers (personal consumption). Total gross out-put (sales) of electricity in Shelby County in 1991 was $216.9million.
The I-O table used herein is an intraregional requirementsversion, i.e., the entries in rows and columns 1-21 represent onlythose goods produced in the region that are also consumed there.

23MODELING THE MEMPHIS ECONOMY
This excludes exports (which are part of final demand) and im-ports (presented in a lower row of the table). For the purpose ofexposition, an exception was made for electricity, which is gener-ated entirely outside the region by TVA.4 To illustrate the key roleof electricity, it is separated from the aggregated set of imports andincluded within the transactions table (intraregional commodityflows), but it is not actually part of the total regional intermediateinput subtotal.
The I-O table provides insight into the general structure ofShelby County. It reflects the fact that Memphis is both a majorcommercial center and a major manufacturing center. Total grossoutput in 1991 was $66.9 billion, with the major contributors being:transportation, $4.2 billion; other nondurable manufacturing, $4.1billion; and finance, insurance, and real estate (F.I.R.E.), $3.9 bil-lion. The county is rather self-sufficient, with imports of $7.8 billion.In addition, a large amount of production flows out of the economy,with exports totaling $15.1 billion.
Regional Analysis of theRole of Ut il ity L ifel ines
2.62.62.62.62.6
The structure of an Input-Output table enables the “multiplier”impacts to be determined on the economy from a change in finaldemand in any particular sector. In Table 2.3, these multipliereffects are shown as the sum of direct, indirect, and induced ef-fects on each sector of the Shelby County economy.5 An exampleof the use of these multipliers would be to analyze the impact of adecrease in final demand for durable manufacturing goods by $100million, which would result in a total gross output loss throughoutthe county economy of $182 million.
Returning to the Input-Output table, it is possible to specifi-cally evaluate how utility lifelines (electric utilities, natural gasdistribution services, and water and sanitary services) contributedirectly to total gross output but also to the total multiplier effect.Table 2.4 contains the direct utility input coefficients, i.e., theamount of direct inputs needed per dollar of output. Table 2.5contains the total (direct, indirect, and induced) inputs from pub-lic utilities for each sector.6 For example, Table 2.4 shows that the

24 C H A P T E R 2
* *1.
1 *3.
31.
71.
22.
10.
1 *0.
32.
51.
20.
31.
7 *2.
3 *0.
00.
02.
9
0.8
20.8
19.1
12.7
53.4
0.1 *
2.0 *
5.8
2.7
1.3
4.1
6.4
1.4
0.1
0.1
3.6
5.8
12.2 7.9
39.8 0.6
0.0
0.0
6.1
3.5
98.6
42.4
1,99
5.7
2,14
0.1
0.0
0.0 *
0.0
0.0
0.0 * *
0.0 * *
0.0
0.0
0.0 *
0.0 *
0.0
0.0
0.0 *
0.0
0.0
7.1
3.7
10.8
Agr
icul
ture
Min
ing
Con
stru
ctio
nFo
od P
rodu
cts
Non
dura
ble
Man
ufac
turi
ngD
urab
le M
anuf
actu
ring
Petr
oleu
m R
efin
ing
Tran
spor
tatio
nC
omm
unic
atio
nEl
ectr
ic U
tiliti
es**
Gas
Dis
trib
utio
nW
ater
and
San
itary
Ser
v.W
hole
sale
Tra
deRe
tail
Trad
eF.
I.R.E
.Pe
rson
al S
ervi
ces
Bus
ines
s &
Pro
f. Se
rvic
esEn
tert
ainm
ent
Serv
ices
Hea
lth S
ervi
ces
Educ
atio
n Se
rvic
esG
over
nmen
t
Erro
rs a
nd o
mis
sion
s
Tota
l R
eg.
Inte
rmed
. In
puts
Tota
l Im
port
sTo
tal
Valu
e A
dded
Tota
l G
ross
Out
lays
19.2 *
3.3
0.3
6.7
1.9
3.5
3.2
0.7
1.6
0.1
0.4
5.2
0.9
15.8 0.4
8.7
0.2
0.1 *
5.3
1.4
75.7
75.0
50.5
202.
6
1*
1.5
0.4 *
0.4
0.3
0.2
0.2
0.1
0.5 *
0.1
0.2
0.1
1.2
0.2
0.8 *
0.0 *
1.2
0.2
6.7
6.6
26.2
39.72
8.7
0.6
4.8 *
11.1
90.4
39.5
90.3
12.6 4.7
0.2
1.2
108.
883
.440
.3 5.9
272.
60.
80.
00.
017
.9
33.3
789.
182
5.3
808.
32,
456.
0
312
.8 *6.
526
6.6
163.
98.
43.
956
.733
.610
.0 1.3
1.3
72.6 4.1
17.6 9.4
61.5 1.4
0.0 *
33.3 6.6
755.
088
0.4
490.
02,
132.
0
40.
90.
47.
24.
229
1.3
13.6
16.6
60.4
17.9
20.8 1.4
10.2
57.2 9.7
26.4 5.7
128.
90.
90.
00.
869
.1
13.8
722.
71,
708.
71,
635.
74,
080.
9
50.
31.
617
.2 1.3
88.9
139.
96.
339
.420
.732
.2 0.8
1.6
80.3
10.7
24.7 5.1
85.1 1.0
0.0
1.6
40.3
12.1
566.
795
1.0
1,00
8.9
2,53
8.7
6*
0.1
0.2 *
2.8
1.5
3.3
2.0
0.4
0.3 *
0.1
1.3
0.1
0.3
0.1
1.1 *
0.0 *
0.9
0.3
14.1
320.
686
.942
2.0
70.
6 *51
.8 3.1
34.2 8.8
173.
837
0.1
71.4 9.1
0.1
1.3
47.0
88.3
105.
54.
218
6.6
2.0
0.0
0.1
34.3
37.8
1,18
3.1
1,19
7.3
1,77
5.2
4,19
3.4
8* *
6.0 *
1.0
1.6
0.1
1.9
7.0
0.2 *
0.3
0.8
2.1
13.4 0.3
13.2
20.9 0.0
0.1
2.2
1.0
70.7
38.4
345.
845
5.8
90.
00.
00.
00.
00.
00.
00.
00.
00.
00.
00.
00.
00.
00.
00.
00.
00.
00.
00.
00.
00.
0
0.0
0.0
0.0
0.0
0.0
1011
1213
1.0 *
12.8
39.4
35.0 2.8
4.0
17.0
28.6
16.6 0.3
0.6
19.2
23.3
93.5 5.1
142.
64.
40.
00.
456
.2 9.3
486.
434
6.0
2,06
9.5
2,91
1.3
14Se
ctor
Tabl
e 2.
2 In
put-O
utpu
t Tab
le fo
r She
lby
Coun
ty, T
N, 1
991
($M
M 1
991)

25MODELING THE MEMPHIS ECONOMY
Tota
lG
ross
Out
put
*Les
s th
an 0
.05
mill
ion.
**El
ectr
ic u
tility
sal
es a
re p
rese
nted
in
the
intr
areg
iona
l tr
ansa
ctio
ns t
able
for
pur
pose
s of
exp
ositi
on,
but
are
actu
ally
im
port
s (fr
om T
VA).
Ther
efor
e, t
hey
are
not
coun
ted
in T
otal
Reg
iona
l In
term
edia
teIn
puts
.
IM
PLA
N, 1
993
Agr
icul
ture
Min
ing
Con
stru
ctio
nFo
od P
rodu
cts
Non
dura
ble
Man
ufac
turi
ngD
urab
le M
anuf
actu
ring
Petr
oleu
m R
efin
ing
Tran
spor
tatio
nC
omm
unic
atio
nEl
ectr
ic U
tiliti
es**
Gas
Dis
trib
utio
nW
ater
and
San
itary
Ser
v.W
hole
sale
Tra
deRe
tail
Trad
eF.
I.R.E
.Pe
rson
al S
ervi
ces
Bus
ines
s &
Pro
f. Se
rvic
esEn
tert
ainm
ent
Serv
ices
Hea
lth S
ervi
ces
Educ
atio
n Se
rvic
esG
over
nmen
t
Erro
rs a
nd o
mis
sion
s
Tota
l R
eg.
Inte
rmed
. In
puts
Tota
l Im
port
sTo
tal
Valu
e A
dded
Tota
l G
ross
Out
lays
11.5 *
103.
2 *11
.2 0.9
1.0
21.7
19.7 1.6 *
0.8
1.9
18.8
276.
04.
113
4.3
1.0
0.0
0.1
26.2
12.5
632.
723
8.0
3,05
7.4
3,94
0.6
0.5 *
3.1
0.1
6.1
0.8
0.8
1.8
5.0
3.1
0.1
0.3
2.9
1.6
19.4 3.5
22.0 0.2
0.0
0.0
11.6 1.0
79.8
59.8
501.
064
1.6
1.0 *
20.7 1.1
21.5
51.1 6.7
23.9
29.6 5.2
0.3
0.5
22.8
32.3
90.8
22.2
293.
82.
00.
00.
136
.4
20.7
657.
949
6.6
1,78
9.5
2,96
4.7
1.3 *
1.4
1.1
5.1
0.7
0.2
1.3
4.1
0.8 * *
0.5
1.5
8.4
0.9
17.4
14.4 0.0
0.0
4.3
1.3
62.8
36.0
100.
720
0.7
0.7 *
14.1 2.0
39.5
23.5 2.6
4.3
8.9
3.4
0.2
0.2
6.3
3.5
59.1 2.0
59.5 0.4
18.2 *
20.3 3.1
265.
215
0.7
1,02
9.0
1,44
8.1
1.2 *
9.5
1.6
5.0
0.7
0.5
1.6
4.9
0.8
0.1 *
1.8
1.2
16.6 0.3
14.1 0.6
0.0 *
4.4
0.9
64.1
55.1
102.
022
2.0
1.5
0.1
125.
71.
18.
13.
96.
117
.8 1.9
13.2 3.8
0.1
9.7
1.9
10.9 0.7
18.5 0.1
0.0
0.7
55.9 2.8
268.
632
3.2
2,63
4.5
3,22
9.1
61.3 4.2
391.
132
1.9
740.
735
5.3
271.
871
9.8
273.
612
5.4
8.9
21.6
443.
428
9.5
833.
977
.91,
503.
050
.918
.3 4.8
428.
8
162.
4
6,82
0.6
7,77
7.3
19,5
23.2
34,2
83.5
14.0 *
0.0
173.
826
1.5
138.
298
.041
3.4
141.
478
.7 1.6
20.5
256.
21,
677.
52,
073.
625
4.0
625.
613
4.5
965.
520
5.4
497.
6
0.0
7,95
2.3
4,27
1.4
0.0
12,2
23.7
127.
235
.52,
064.
91,
636.
23,
078.
72,
045.
252
.23,
060.
240
.912
.9 0.3
11.2
1,44
0.5
944.
31,
033.
130
9.7
836.
015
.346
4.3
11.8
2,30
2.7
0.0
19,5
10.1
895.
20.
020
,405
.3
141.
235
.52,
064.
91,
810.
03,
340.
22,
183.
415
0.2
3,47
3.6
182.
391
.6 1.8
31.7
1,69
6.8
2,62
1.8
3,10
6.8
563.
71,
461.
614
9.8
1,42
9.8
217.
22,
800.
2
0.0
27,4
62.5
5,16
6.6
0.0
32,6
29.1
202.
639
.72,
456.
02,
132.
04,
080.
92,
538.
742
2.0
4,19
3.4
455.
821
6.9
10.8
53.4
2.14
0.1
2,91
1.3
3,94
0.6
641.
62,
964.
720
0.7
1,44
8.1
222.
03,
229.
1
162.
0
34,2
83.1
12,9
43.9
19,5
23.2
66.9
12.2
1516
1718
1920
21
Tota
lIn
ter.
Sale
s
Pers
onal
Con
sum
p-ti
on
Oth
erFi
nal
Dem
and
Tota
lFi
nal
Dem
and
Sect
or

26 C H A P T E R 2
direct inputs from the electricity sector per dollar of output of du-rable manufacturing is $0.0127. Table 2.5 adds indirect andinduced linkages to the direct inputs. Once again, looking at thedurable manufacturing sector, the total of various rounds of inputsfrom electric utilities is $0.0166 per dollar of output. Part of thedifference of $0.0039 for this sector is accounted for by the elec-tricity used by the direct and indirect suppliers to the manufacturingsector, such as transportation and services, while the rest is attrib-utable to electricity purchased by households from income earnedfrom manufacturing and its direct and indirect suppliers.
Sector DirectEffects
IndirectEffects
InducedEffects
Total(Multiplier)a
AgricultureMining
ConstructionFood Products
Other NondurableManufacturing
DurableManufacturing
PetroleumRefining
TransportationCommunicationElectric Utilities
Gas Dist. ServicesWater and
Sanitary ServicesWholesale Trade
Retail TradeF.I.R.E.
Personal ServicesBusiness, Repair,and Professional
ServicesEntertainment and
Rec. ServicesHealth Services
Education ServicesGovernment
1.00001.00001.00001.00001.0000
1.0000
1.0000
1.00001.00001.00001.00001.0000
1.00001.00001.00001.00001.0000
1.0000
1.00001.00001.0000
0.67020.47110.65240.62950.3954
0.5248
0.0847
0.64710.42370.00000.08450.7147
0.47010.53930.36010.50170.5909
0.6776
0.65310.75540.6178
0.22920.31590.31770.20220.2168
0.2970
0.0547
0.36750.27700.00000.10050.2824
0.51440.40610.19670.43060.3903
0.3390
0.52910.48510.6319
1.89941.78701.97011.83171.6122
1.8218
1.1394
2.01451.70071.00001.18501.9970
1.98451.94531.55691.93221.9813
2.0166
2.18222.24062.2496
a. The multiplier is the sum of direct, indirect, and induced effects divided by the direct effects.IMPLAN, 1993
Table 2.3 Output Multipliers in Shelby County

27MODELING THE MEMPHIS ECONOMY
Sector ElectricUtilities
Gas DistributionServices
Water andSanitaryServices
AgricultureMining
ConstructionFood Products
Other NondurableManufacturing
DurableManufacturing
PetroleumRefining
TransportationCommunicationElectric Utilities
Gas Dist. ServicesWater and
Sanitary ServicesWholesale Trade
Retail TradeF.I.R.E.
Personal ServicesBusiness, Repair,and Professional
ServicesEntertainment and
Rec. ServicesHealth Services
Education ServicesGovernmentHousehold
0.00790.01260.00190.00470.0051
0.0127
0.0007
0.00220.00040.00000.00370.0007
0.00070.00570.00040.00480.0017
0.0041
0.00230.00340.00410.0064
0.00040.00010.00010.00060.0003
0.0003
0.0001
0.00000.00000.00000.00000.0048
0.00000.00010.00000.00020.0001
0.0001
0.00010.00030.00120.0001
0.00190.00170.00050.00060.0025
0.0006
0.0002
0.00030.00060.00000.00000.0477
0.00000.00020.00020.00040.0002
0.0002
0.00010.00020.00000.0017
IMPLAN, 1993
Table 2.4 Direct Utility Coefficients

28 C H A P T E R 2
Sector ElectricUtilities
Gas DistributionServices
Water andSanitaryServices
AgricultureMining
ConstructionFood Products
Other NondurableManufacturing
DurableManufacturing
PetroleumRefining
TransportationCommunicationElectric Utilities
Gas Dist. ServicesWater and
Sanitary ServicesWholesale Trade
Retail TradeF.I.R.E.
Personal ServicesBusiness, Repair,and Professional
ServicesEntertainment and
Rec. ServicesHealth Services
Education ServicesGovernmentHousehold
0.01160.01630.00600.00810.0077
0.0166
0.0013
0.00610.00330.00000.00460.0048
0.00530.00980.00250.00890.0059
0.0082
0.00770.00850.00990.0108
0.00060.00020.00020.00080.0005
0.0005
0.0001
0.00020.00010.00000.00000.0052
0.00020.00030.00010.00030.0003
0.0003
0.00030.00050.00140.0003
0.00280.00260.00130.00150.0033
0.0015
0.0003
0.00120.00120.00000.00020.0510
0.00110.00110.00070.00140.0011
0.0011
0.00140.00130.00140.0025
IMPLAN, 1993
Table 2.5 Total Utility Coefficients

29MODELING THE MEMPHIS ECONOMY
2.72.72.72.72.7
C o n c l u s i o n
When the New Madrid earthquakes took place in 1811-12,Memphis and its surroundings were relatively unpopulated, andthe event caused little actual damage over and above the destruc-tion of some aspects of the natural setting. The New Madrid SeismicZone is now heavily populated, with the city of Memphis near itscenter. The city is an example of the advances of modern society,which makes its damage potential very high. Moreover, moderneconomies are characterized by high degrees of specialization,efficient location patterns, tightly wound production processes,and sophisticated human tastes. This means that the Memphiseconomy is, as is any major city in the industrialized world, highlyinterdependent and streamlined. A shock to a fundamental as-pect of the system, such as an electricity lifeline, potentially affectsevery sector directly when it has its power source interrupted, butalso indirectly when its suppliers and customers must curtail someor all of their activity as well. The streamlining of modern econo-mies is an efficient strategy that is especially well represented innetworks, but the lack of redundancy also heightens vulnerability,as the cutting of one link can bring down the entire system (notonly the electricity network but the entire economy).
This chapter has introduced the major features of the Mem-phis economy and presented an approach referred to asinterindustry analysis, which is especially adept at modeling eco-nomic interdependence and its repercussions. Input-output modelshave been widely used in natural hazard studies and are espe-cially accessible not only to economists but planners and engineers.In the chapters to follow, some of the major contributions of thismonograph are the utilization of an I-O model as a data organiz-ing framework for economic and engineering considerations ofearthquakes, the refinement of the tool to overcome some of itsinappropriate applications in the past, and its extension into amathematical programming format to examine the damage re-duction possibilities of the reallocation of scarce lifeline resources.

30 C H A P T E R 2
N o t e s
1. A major alternative is RIMS II (U.S. Bureau of Economic Analysis,1997).
2. In technical terms, both I-O and LP are part of a field of economicscalled “activity analysis,” which is the examination of production interms of linear combinations of inputs and outputs. I-O is a simpleactivity analysis in which there is no choice of production alternatives(each good is produced by only a single production technique), whileLP is an optimizing solution algorithm to an activity analysis problemwhere a choice of technique exists or when an objective function isspecified. In relation to terminology, I-O is obviously an example of“interindustry” analysis, and so is LP when it is applied to the economyas a whole (as opposed to a single business enterprise).
3. This discussion of methodologies has focused on region-wide impacts,with an emphasis on the indirect. A major contribution has recentlybeen made by West and Lenze (1994) detailing how to estimate directregional economic losses from natural hazards by piecing togetherprimary and secondary data; however, their study omits considerationspeculiar to lifeline losses.
4. It is also the case that a small proportion of electricity (less than 5%) isgenerated by small independent power producers (usually involvingcogeneration). These are vulnerable to earthquakes, and in some partsof the U.S. have had good earthquake safety records. They are notseparately identified in this analysis, but the model framework is suf-ficiently general to do so if warranted for purposes of accuracy.
5. The IMPLAN multipliers we used are known as Type II multipliers. Ingeneral, a multiplier is a ratio of total impacts divided by direct im-pacts. Versions of multipliers differ according to the calculation oftotal impacts. Type I multipliers only include indirect impacts (inter-industry demands) and are rarely used because they omit a majorcomponent of economic interdependence. Type II multipliers includeindirect effects and induced effects (those stemming from income pay-ments and their expenditure).
6. The total energy coefficients are derived by premultiplying the set ofdirect energy use coefficients by the Leontief Inverse (I-A)-1, where theA matrix is the set of direct requirements of each input in the produc-

31MODELING THE MEMPHIS ECONOMY
tion of the corresponding output (i.e., each Table 2.3 entry in rows 1-21, as well as the household income portion of the value added rowdivided by its column sum).
The views expressed in this paper are solely the authors’ and do not nec-essarily reflect the views of the Bureau of Economic Analysis or the U.S.Department of Commerce.

32 C H A P T E R 2

33
2
33333
Seismic Performance of
Electric Power Systems
The most significant recent development in earthquake engi-neering is the recognition that traditional approaches cannot meetthe growing public demand for better seismic disaster mitigationstrategies to minimize human and property losses resulting fromearthquakes. Traditional earthquake engineering, throughout thiscentury, concentrated on the development of improved structuralmaterials, and on more sophisticated methods of seismic analy-sis, design and construction. Obviously, further development inthis direction is desirable and important, particularly in view ofthe significant physical damage sustained by buildings, bridgesand other structures from the January 17, 1995 Hyogo-ken Nanbu(Kobe) earthquake. There are, however, a number of socioeco-nomic considerations that are equally, if not more important inthe context of seismic disaster mitigation. These socioeconomicconsiderations are an integral part of the seismic hazard mitiga-tion effort. Dealing primarily with public infrastructure systems,particularly with electric systems, the economic loss consists ofdirect and indirect losses. The direct loss includes the cost ofrepair and restoration, the loss of business revenue on the part ofthe owner of the system, and the economic loss suffered by theindustries in the region from the direct interruption of the serviceby the system. The indirect loss results, in part, from the eco-nomic loss suffered by various industrial sectors not directly affectedby the service interruption of the system, but whose suppliers orcustomers were disrupted. Indirect loss must also include theimpact of human casualty in some form, though this is a matter ofcontroversy at this time.
In this chapter, seismically induced degradation of system func-tion is evaluated for Memphis Light, Gas and Water (MLGW)Division’s electric power system. This evaluation provides the foun-
by Masanobu Shinozuka
and Howard H. M. Hwang

34 C H A P T E R 3
dation for the ensuing estimation of the economic loss suffered bythe regional industries in the Memphis area from the seismicallyinduced service interruption of the electric power transmissionsystem. In this respect, it is mentioned that the interruption of thepower supply will in turn induce malfunction of the MLGW’s waterdelivery system (Shinozuka et al., 1994) aggravating further theextent of post-earthquake human suffering and economic losses.The analytical model of the electric system used is not an exactmodel of the Memphis system due to the unavailability of com-plete information, although the model is expected to represent itsapproximate physical characteristics. In this regard, caution mustbe exercised if the numerical results are to be used for derivingspecific technical and operational recommendations for the Mem-phis system.
E l e c t r i c P o w e r S y s t e m
3.13.13.13.13.1
Figure 3.1 MLGW’s Electric Power Transmission Network
3 .1 .1 Cond i t i ons for System Fa i lure
MLGW’s electric power transmission network is depicted inFigure 3.1. It transmits electric power provided by the TennesseeValley Authority (TVA) through gate stations to 45 substations in

35SEISMIC PERFORMANCE OF ELECTRIC POWER SYSTEMS
the network consisting of 500 kv, 16l kv, 115 kv and 23 kv trans-mission lines and gate, 23 kv and 12 kv substations. The 500 kvline and gate stations are operated by TVA, and other transmissionlines and substations by MLGW. Each substation is associatedwith a service area, and usually one service area is served by onlyone substation with two exceptions.
In analyzing the functional reliability of each substation, thefollowing modes of failure are usually taken into consideration:(1) loss of connectivity, (2) failure of substation’s critical compo-nents, and (3) power imbalance. Each of these failure modes isaddressed in the following subsections from the viewpoint of theensuing reliability analysis of the MLGW’s electric power trans-mission system.
With respect to the loss of connectivity, it is noted that most ofthe transmission lines of the MLGW system are aerially supportedby transmission towers. While by no means does this imply thatthe transmission lines are completely free from seismic vulner-ability, it is assumed in this study that they are, primarily for thepurpose of analytical simplicity. Further study on this issue, par-ticularly on the seismic vulnerability of transmission towers, needsto be carried out.
3 . 1 . 2 S u b s t a t i o n M o d e l
An electric substation consists of several electric nodes sub-jected to various values of voltage and connected to each otherthrough transformers to reduce the voltage and/or distribute powerto the service areas. Each electric node consists of many types ofelectric equipment such as buses, circuit breakers, and discon-nect switches. The schematic diagram of an actual MLGWsubstation is depicted in Figure 3.2. Among the equipment, buses,circuit breakers and disconnect switches are seismically the mostvulnerable, as observed during the 1971 San Fernando, 1989 LomaPrieta and 1994 Northridge earthquakes (Benuska, 1990; Hall,1994; Goltz, 1994). Figure 3.3 shows the damaged equipment ofMoss Landing 500 kv switchyard at the Loma Prieta earthquake(Benuska, 1990). As shown in the figure, most of the live-tankcircuit breakers and disconnect switches were damaged. The physi-cal damage thus sustained by the system produced correspondingsystem malfunction that required concentrated repair and restora-

36 C H A P T E R 3
tion effort to make them operational again. However, in spite ofthe damage, the system performed reasonably well during theseearthquakes. Two factors played a significant role in this respect.First, the high voltage power transmission network is designed to-
Figure 3.3 Damaged Equipment of Moss Landing 500kv Switchyard at the 1989 Loma PrietaEarthquake
Benuska, 1990 Reprinted by Permission of EERI
Figure 3.2 Schematic Diagram of MLGW Substation 21

37SEISMIC PERFORMANCE OF ELECTRIC POWER SYSTEMS
Damaged Status of Switches Line Status
Bus 1 CB11
LineA
CB12
LineB
CB13
Bus LineA
LineB
0000101111
0110011001
0101010101
0011010010
0000100000
0110110111
0011110010
0: Operational 1: Not Operational
Table 3.1 Status Table of Position 1
Note that disconnect switches are normally closed.
Figure 3.4 Typical Node Configuration Model
pologically with a sufficientdegree of redundancy intransmission circuits. Sec-ond, substations are alsodesigned with a sufficientdegree of internal redun-dancy. Actual equipmentconfiguration in a node is socomplicated that it defies arigorous modeling. There-fore, a simplified butessentially accurate con-figuration as shown inFigure 3.4 is employed. InFigure 3.4, if only one cir-cuit breaker CB 11 isdamaged due to an earth-quake, the node is stillfunctional because all thelines remain connected toeach other. However, if CB11 and CB 13 are damagedsimultaneously, Line A and
Line B are disconnected from the node, thus the function of thenode is impaired. Table 3.1 partially shows the line status result-ing from a combination (among a possible 32) of the switch statusat Position I in order to judge whether or not the correspondingmode of line connectivity still functions. In this study, it is as-sumed that buses and circuit breakers can be broken due toearthquake ground motion.

38 C H A P T E R 3
Utilizing the results of the previous studies by Shinozuka etal., (1989) and Ang et al., (1992), the fragility curve Fc(a) for acircuit breaker is chosen to be a log-normal distribution functionwith the median and coefficient of variation equal to 0.45g and0.38, respectively. This curve is also assumed to be applicable tobus fragility for the purpose of analytical simplicity.
3 .1 .3 Monte Carlo S imul at i on
The damaged state is simulated based on Peak Ground Accel-eration (PGA) values which are computed at 424 sites in ShelbyCounty, under a scenario earthquake of moment magnitude M =7.5 with the epicenter located at Marked Tree in Arkansas, one ofthe epicenters of the New Madrid Seismic Zones (see Figure 3.5).These PGA values are spatially interpolated so that they can beoverlaid with the network.
Figure 3.5 New Madrid Seismic Zone

39SEISMIC PERFORMANCE OF ELECTRIC POWER SYSTEMS
Utilizing the Geographical Information System (GIS) capabil-ity existing at the University of Southern California (ESRI, 1988;Burrough, 1986; and Sato et al., 1991), the map of the electrictransmission network is overlaid with the map of PGA identifyingthe PGA value associated with each substation. The fragility curvefor the equipment (buses and circuit breakers) can then be used tosimulate the state of equipment damage involving the equipmentin all the nodes at all the substations of the transmission system.For each damage state, the connectivity and flow analyses areperformed with the aid of a computer code IPFLOW developedand distributed by Electric Power Research Institute (EPRI, 1992) .
Loss of connectivity occurs when the node of interest survivesthe corresponding PGA, but is isolated from all the generatingnodes because of the malfunction of at least one of the nodes oneach and every possible path between this node and any of thegenerating nodes. Hence, the loss of connectivity with respect toa particular node can be confirmed on each damage state by actu-ally verifying the loss of connectivity with respect to all the pathsthat would otherwise establish the desired connectivity. The lossof connectivity is primarily due to the possible equipment failurenot only at the node of interest but also all other nodes in thenetwork.
As to the abnormal power flow, it is noted that the electricpower transmission system is highly sensitive to the power bal-ance and ordinarily some criteria are used to judge whether or notthe node continues to function immediately after internal and ex-ternal disturbances. Two kinds of criteria are employed at eachnode for the abnormal power flow: power imbalance and abnor-mal voltage. When some nodes in the network are damaged dueto an earthquake, the total generating power becomes greater orless than the total demanding power. For a normal condition, thepower balance between generating the demanding power is in acertain tolerance range. Actually, the total generating power mustbe between 1.0 and 1.05 times the total demanding power fornormal operation even accounting for power transmission loss.
If this condition is not satisfied, the operator of the electricsystem must either reduce or increase the generating power tokeep the balance of power. However, in some cases, supply can-not catch up with demand because the generating system is unableto respond so quickly. In this case, it is assumed that the generat-ing power of each power plant cannot be quickly increased or

40 C H A P T E R 3
reduced by more than 20% of the current generating power. Whenthe power balance cannot be maintained even after increasing orreducing the generating power, the system will be down. Thiskind of outage is defined as a power imbalance. This situation,however, never materialized in this analysis.
As for the abnormal voltage, voltage magnitude at each nodecan be obtained by power flow analysis. Then, if the ratio of thevoltage of the damaged system to the intact system is out of atolerable range (plus/minus 20% of the voltage for the intact sys-tem), it is assumed that the node is subjected to an abnormal voltageand fails.
Each node which makes up a substation has a different func-tion. Some function as a power receiving node that receives thehigh voltage power from the high voltage transmission line andtransfer the power to the lower voltage nodes through transform-ers. On the other hand, some function as a power distributionnode that distribute the power to the service area. In this study, ifthe distribution node fails or is isolated from the network, or re-ceives an abnormal power flow, the service area is assumed to beblacked out. Appropriate modification can be made to estimatethe probability of malfunction of the service area served by morethan one node.
For the Monte Carlo simulation, random numbers uniformlydistributed between 0 and 1 are generated for every circuit breakerand bus in all nodes. The equipment is considered to be broken,when the random number is less than the value of failure prob-ability (fragility) for each piece of equipment under the given PGAvalue.
Each substation is examined with respect to its possible mal-function under these three modes of failure for each simulateddamage state. In the present study, a sample of size 100 (N = 100)is considered for the Monte Carlo analysis. The probability PEm ofmalfunction of a particular substation m is then estimated as N
m/
N = Nm/100 where Nm is the number of simulated damage statesin which the substation m malfunctions in at least one of the threemodes. On the basis of the flow analysis performed on the net-work in 100 simulated damage states, the ratio of the averageelectric power output (real-power in MW) of the damaged net-work to that associated with the intact network is computed andplotted in Figures 3.6 through 3.8 under the scenario earthquakeepicentered at Marked Tree with M = 6.5, 7.0 and 7.5, respec-

41SEISMIC PERFORMANCE OF ELECTRIC POWER SYSTEMS
Figure 3.7 Ratio of the Average Power Output under the Damaged Condition to theIntact Condition for Service Areas (M = 7.0)
Figure 3.6 Ratio of the Average Power Output under the Damaged Condition to theIntact Condition for Service Areas (M = 6.5)
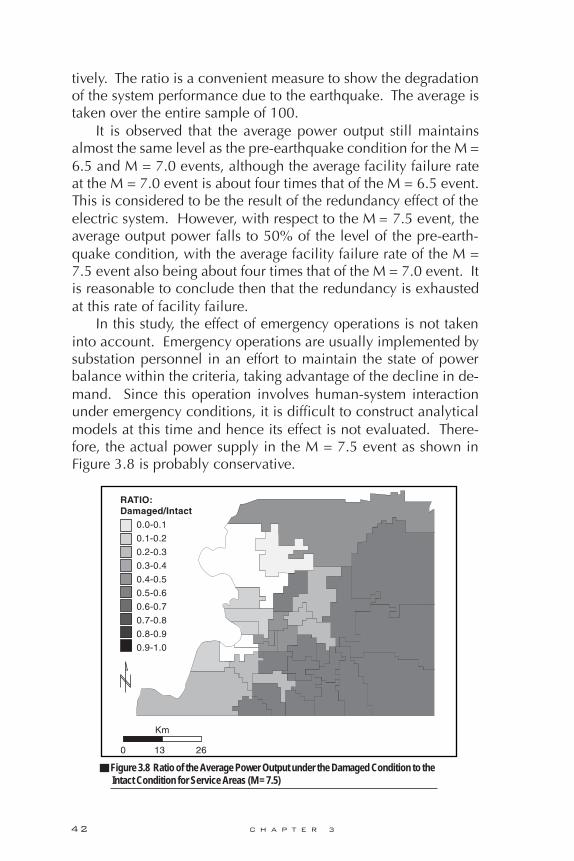
42 C H A P T E R 3
tively. The ratio is a convenient measure to show the degradationof the system performance due to the earthquake. The average istaken over the entire sample of 100.
It is observed that the average power output still maintainsalmost the same level as the pre-earthquake condition for the M =6.5 and M = 7.0 events, although the average facility failure rateat the M = 7.0 event is about four times that of the M = 6.5 event.This is considered to be the result of the redundancy effect of theelectric system. However, with respect to the M = 7.5 event, theaverage output power falls to 50% of the level of the pre-earth-quake condition, with the average facility failure rate of the M =7.5 event also being about four times that of the M = 7.0 event. Itis reasonable to conclude then that the redundancy is exhaustedat this rate of facility failure.
In this study, the effect of emergency operations is not takeninto account. Emergency operations are usually implemented bysubstation personnel in an effort to maintain the state of powerbalance within the criteria, taking advantage of the decline in de-mand. Since this operation involves human-system interactionunder emergency conditions, it is difficult to construct analyticalmodels at this time and hence its effect is not evaluated. There-fore, the actual power supply in the M = 7.5 event as shown inFigure 3.8 is probably conservative.
Figure 3.8 Ratio of the Average Power Output under the Damaged Condition to the Intact Condition for Service Areas (M = 7.5)

43SEISMIC PERFORMANCE OF ELECTRIC POWER SYSTEMS
C o n c l u s i o n
3.23.23.23.23.2
This chapter simulated the MLGW’s electric power transmis-sion system and demonstrated an analytical method by which theprobability of electric power interruption for each service areacan be computed. Special features of the analysis are: (1) essen-tial use of GIS integrated with systems analysis performed on thepower system; (2) the redundancy that exists in each node withina substation; and (3) the use of industry standard computer codeIPFLOW for evaluation of power imbalance. These features repre-sent significant advances in the seismic performance analysismethodology to estimate direct economic loss suffered by regionalindustries from the seismically induced interruption of electricity.Such direct loss estimates can also be obtained in a similar fash-ion for the interruption of other lifelines.

44 C H A P T E R 3

45
2
44444
Until recently, earthquake infrastructure damage models pro-duced results that characterized the earthquake impact in purelyphysical terms. For examples of these types of models, see Daviset al. (1982a and 1982b); Applied Technology Council (1985);O’Rourke and Russell (1991); and Shinozuka et al. (1992). RiskManagement Software and California Universities for Research inEarthquake Engineering provide an excellent review of damagemodeling techniques in NIBS, 1994. The most simplistic of thesemodels typically characterized damage in terms of breaks per ki-lometer in the distribution network. More sophisticated modelswere developed to estimate the length of time required for serviceto be restored. While this type of information was an importantstep forward in modeling the impact of an earthquake on infra-structure systems, it was still not sufficient to understand economicimpacts because there was not a clear linkage between the physi-cal system and the economic sectors affected by service interruptionof these systems.
In 1989, the National Research Council suggested that earth-quake damage modeling needed to go beyond physical damageto capture the social and economic impacts of earthquakes. Forthe past decade, social scientists have been developing modelsthat estimate the impact of an earthquake or other natural hazardon the social and economic functions of a city or a region. Asdiscussed in Chapter 2, most of these models have been based onregional input-output models that define the linkages betweeneconomic sectors (see, for example, Applied Technology Council,1991; and Rose et al., 1997.) In this project, the physical damageto the electric system serves as the input to the economic model-ing. Combining the two historically independent modeling effortspromises to provide a more comprehensive and more accuratepicture of the true impacts of an earthquake on a regional economy.
Spatial Analysis
Techniques for Linking
Physical Damage to
Economic Functions
by Steven P. French

46 C H A P T E R 4
This type of economic modeling can help decision makers under-stand the full effects of an earthquake on their city or region. Itcan also help emergency response planners and utility operatorsallocate response resources in the most effective manner and setpriorities for hazard mitigation programs.
This chapter describes how the spatial analysis capabilities ofGeographic Information Systems (GIS) are important in modelingthe economic impact of electric power system damage. Similarapproaches are possible for the whole array of lifeline systems,including water, sewer, telecommunications and transportation.A Geographic Information System provides a number of featuresthat are important to the damage modeling process. Since infra-structure systems consist of complex networks containing manycomponents with varying degrees of fragility, the Geographic In-formation System’s ability to store and manipulate large amountsof spatial as well as attribute information is helpful. The GIS usesa relational database to store characteristics of system compo-nents that are important in determining their response to groundshaking and other earthquake-induced effects. Unlike individualbuildings, infrastructure systems are networks that are spread overwide areas that include a variety of geotechnical conditions. Thesedifferences in site conditions mean that different parts of the net-work are likely to experience differential ground shaking effects.It is critical to be able to associate the appropriate parts of thenetwork with the corresponding geology and level of ground mo-tion. The GIS provides the spatial analysis tools needed to combinesite specific geotechnical information with system characteristicsbased on location. Most of these capabilities are well known andwill not be reiterated here.
What is unique is the way in which the GIS was used to estab-lish the linkage between economic sectors and physical damageto the electric power system. There are several ways in which theoverlay or proximity functions of a GIS can be used to link eco-nomic activities or service populations to specific parts of theinfrastructure system based on location. At the most elementarylevel, firms and employees can be associated with service areasfor which changes in service can be estimated. A more refinedlevel of analysis uses proximity analysis to associate service popu-lations or economic activities with individual system components,such as substations or distribution lines. (For an example of thistype of analysis applied to a water system, see French and Jia,

47SPATIAL ANALYSIS TECHNIQUES
1997.) An even more precise approach would use address match-ing techniques to tie specific economic activities to individualsystems components.
In this particular research, the first approach was selected asthe most appropriate given the level of damage information avail-able concerning the electric power system. This research utilizesthe spatial aggregation techniques of the GIS to bridge the physi-cal damage models and the economic loss models. It does so bylinking small area employment information with electric powerservice areas. Figure 4.1 shows the conceptual approach used tolink physical damage to economic impact.
Most economic loss models characterize the size and impor-tance of economic sectors using measures of economic output.When aggregate output measures are not available, employmentis often used as a surrogate for the firm’s output or production. Aspart of the NCEER research effort, Rose and his colleagues havedeveloped an input-output model to estimate the interindustryimpacts of damage to the electric power system operated by theMemphis Light, Gas and Water division of the City of Memphis(Rose et al., 1997). The IMPLAN input-output model containsemployment in various economic sectors for Shelby County as abasis for determining the interindustry linkages in the localeconomy. Since the electric power lifeline model produces loca-tion specific damage information, it was necessary to find a dataset that describes the sub-county location of employment in vari-ous economic sectors.
Figure 4.1 Conceptual Framework for Linking Lifeline Damage to Economic Impact
D e s c r i b i n g t h eL o c a l E c o n o m y
4.14.14.14.14.1

48 C H A P T E R 4
The Census Transportation Planning Package (CTPP) providesthe best available inventory of employees by their work location.This data set was developed to support transportation planningthrough a joint effort of the Bureau of the Census and the U.S.Department of Transportation to support metropolitan transporta-tion planning (U.S. Bureau of the Census, 1991). The CTPP datawas used for Shelby County to tabulate the number of employeesin each of 18 economic sectors that are compatible with theIMPLAN model. These economic sectors and their correspondingStandard Industrial Classification (SIC) codes are shown in Table4.1.
This data set does not provide the geographic location of indi-vidual firms for privacy reasons. The location of the CTPPemployment data is provided by aggregating the data to small geo-graphic areas called Traffic Analysis Zones (TAZ’s). Shelby Countyis divided into 618 traffic analysis zones that cover its entire area.The number of employees for each economic sector for each zoneis reported in tabular form. Figure 4.2 shows the Shelby CountyTAZ’s and the total number of employees that work in each. Simi-lar data are available for employment within each economic sector.
Group # Economic Sector Two-digit SIC
123456789101112131415161718
Agriculture, Forestry, and FishingMining
ConstructionNondurable Manufacturing
Durable ManufacturingTransportation
Communication/UtilitiesWholesale Trade
Retail TradeF.I.R.E.
Business and Repair ServicesPersonal Services
Entertainment ServicesHealth Services
Educational ServicesOther Professional Services
Public AdministrationArmed Forces
01, 02, 08, 0910, 12-14
15-1720-23, 26, 2724, 25, 28-39
40-4748, 4950, 5152-5960-67
73, 75, 7670, 7278, 79
8082
81, 83, 84, 86-8891-97
Table 4.1 Economic Sectors

49SPATIAL ANALYSIS TECHNIQUES
4.24.24.24.24.2
Spat ial Analys is
To make the link between the electric power damage modelsand the economic models, a relationship between the TAZ’s andthe electric power service areas was developed based on loca-tion. Several steps were required to establish this relationship: (1)36 electric power service areas were digitized from a map pro-vided by the Memphis Light, Gas and Water; (2) electric powerservice area boundaries were overlayed on the TAZ’s; and (3) em-ployment data was aggregated from the TAZ’s to the larger electricpower service areas. This employment by economic sector for eachelectric power service area was then used to estimate the directand indirect economic impacts of power disruption caused by anearthquake.
As can be seen in Figure 4.3, each electric power service areacontains between 8 and 15 TAZ’s. The electric power zone bound-aries are not completely congruent with the underlying TAZ
Figure 4.2 Spatial Distribution of Total Employment in Shelby County by Traffic Analysis Zone

50 C H A P T E R 4
Figure 4.3 Electric Power Service Areas and Traffic Analysis Zones: Memphis/Shelby County, Tennessee
Figure 4.4 Total Employment by Electric Power Service Area: Memphis/ShelbyCounty, Tennessee

51SPATIAL ANALYSIS TECHNIQUES
boundaries. For those TAZ’s that are split between electric powerservice areas, their employment was apportioned between the twobased on the area of the TAZ in each. This apportioning methodassumes a uniform distribution of employment within each TAZ.Without more detailed data on firm location and more specificinformation of the distribution of damage over the electric distri-bution system, this is the best assumption that can be made andprovides the best method of allocating employment to each ser-vice area. Using this method, employment in 18 economic sectorswas estimated for electric power service area. Figure 4.4 showsthe total employment for each electric power service zone. Simi-lar data is available for each of the 18 economic sectors. Theemployment data provide the basis for estimating the economicimpacts of an earthquake using the IMPLAN I-O model.
4.34.34.34.34.3
C o n c l u s i o n
The spatial analysis techniques available in a GIS provide amechanism for linking the formerly separate physical and eco-nomic modeling efforts using a technique known as a spatial relate.Output or employment information is generally not available forelectric power service areas, thus the economic impact of the in-terruption of electric power could not be readily estimated.Input-output models such as IMPLAN are aspatial, so they cannotaccount for the spatial distribution of damage to network systems,such as the Memphis electric power system. The overlay capabili-ties of the GIS provide a way to create employment data for eachelectric power service area. Once the data are in hand, it is arelatively straightforward matter to estimate the direct and indi-rect economic impacts of damage to the electric system usingstandard input-output techniques.
This approach is applicable to a wide range of social and eco-nomic impact applications. While some of the employment datamust be estimated due to the incongruence of the TAZ’s and theelectric power service areas, the error likely to result from thisproblem is certainly acceptable given the uncertainties that existthroughout the earthquake damage modeling process.

52 C H A P T E R 4

53
2
55555Earthquake Vulnerability
and Emergency
Preparedness Among
Businesses
To be effective, earthquake loss reduction policies must bebased on an understanding of the range of impacts earthquakesproduce. These impacts include not only deaths, injuries, anddirect physical damage to the built environment, but also indirectimpacts, including losses resulting from economic disruption. Sev-eral other chapters in this monograph have focused on howearthquake-induced electrical power service interruptions are likelyto affect overall economic activity and different economic sectorsin the Greater Memphis area. This chapter looks more specifi-cally at the vulnerability of businesses in Memphis and ShelbyCounty to physical damage and lifeline service interruption. Italso explores the extent to which business owners are concernedabout the earthquake problem and taking steps to avoid damageand disruption.
Despite their obvious economic and social importance, untilrecently there has been little systematic research focusing specifi-cally on business vulnerability to disasters. However, severalstudies have documented the serious damage U.S. disasters havedone to commercial districts. The downtown business district ofXenia, Ohio, for example, was devastated by a tornado in 1974.Coalinga, California virtually lost its downtown shopping area inthe 1983 earthquake; in 1989, the Loma Prieta earthquake seri-ously damaged the downtown business districts of Santa Cruz andWatsonville. In 1992, Hurricane Andrew devastated businessesand business districts in southern Dade County, Florida.
The potential for negative economic impacts is clear in suchcases. When business district damage is extensive, communitiesare forced to deal with a range of recovery-related problems, in-cluding potential declines in property and sales tax revenues,threats to long-term business district viability, the potential loss of
by Kathleen J. Tierney and
James M. Dahlhamer

54 C H A P T E R 5
important businesses, concerns that customers will go elsewherefor goods and services, and the need to undertake complex recon-struction and redevelopment projects. Disaster-related businessclosures can put people out of work and make it difficult for com-munity residents to obtain the goods and services they need.
Experiencing a disaster can also have consequences for indi-vidual businesses. Disasters typically cause business interruption,either through direct damage to business properties or throughthe disruption of lifeline services. Being forced to shut down foreven a short period of time can result in significant losses for somebusinesses. Businesses that are destroyed or damaged in a disas-ter must bear the costs associated with reconstruction; those thatare forced to relocate may not be as successful in their new loca-tions. The kinds of government grants that are made available tohomeowners suffering disaster losses, such as the Federal Emer-gency Management Agency’s Individual and Family Grant Program,are not available to businesses. The principal governmentally-spon-sored recovery program for businesses, operated by the SmallBusiness Administration, is a loan program, which means thatbusinesses cannot use that form of aid without taking on addi-tional debt.
The small but growing literature on disasters and businessessuggests that disasters may have differential effects on differenttypes of businesses; while some may be relatively unaffected oreven better off after experiencing a disaster, others may decline.Durkin’s work (1984) on businesses that were affected by the 1983Coalinga earthquake, for example, suggests that businesses thatare only marginally profitable, that lease rather than own theirbusiness space, that are heavily dependent on foot traffic, and thatlose expensive inventories may fare worse than other businessesin the aftermath of a disaster.
Kroll et al. (1991), in their study of the impact of the LomaPrieta earthquake on small businesses in Oakland and Santa Cruz,found that businesses in the trade and service sector were mostvulnerable to disruption in that event, and that smaller firms suf-fered proportionately greater losses than larger ones. In contrast,some businesses, such as those involved in construction, reportedbeing better off following the earthquake.
Alesch et al. (1993) argue that small businesses suffer dispro-portionately following disasters, for several reasons. They typicallyhave lower financial reserves to draw upon, and they tend to op-

55BUSINESS VULNERABILITY AND PREPAREDNESS
erate in single locations, so that serious damage can put themcompletely out of business. Small businesses tend to be less con-cerned about risk management than larger businesses; they areless likely to be insured, and they have less money to invest inmitigation and preparedness.
Gordon et al. (1995), who studied the business impacts of theNorthridge earthquake, found that 80% of the businesses in theirsample experienced some degree of earthquake-related businessinterruption. They estimated that the aggregate business interrup-tion losses incurred in that event were just under $6 billion,accounting for approximately 23% of the total dollar losses result-ing from the earthquake, which they estimated at around $26.1billion.
Other studies suggest business outcomes following disastersmay be related to the access they have to certain recovery-relatedresources. Dahlhamer (1992), in an analysis of the loan decision-making process for 309 businesses in four Southern Californiacommunities that were affected by the Whittier Narrows earth-quake, found that proprietor characteristics, businesscharacteristics, and community location were associated with theability to obtain Small Business Association (SBA) assistance, aswell as with the loan terms offered. Dahlhamer’s data indicatethat the SBA uses standards similar to those of commercial lendersin making decisions about whether to grant loans and what inter-est rates to charge, and that certain types of businesses may be ata disadvantage in attempting to obtain SBA funds.
Several years ago, the Disaster Research Center (DRC) begancarrying out research in order to shed light on business vulner-ability to disasters, how disaster-related damage and disruptionaffect business operations, and business mitigation and prepared-ness practices. Following the devastating floods that struck theMidwest in 1993, DRC studied the ways in which flooding andflood-induced lifeline service interruptions affected the operationsof businesses in Des Moines and Polk County, which were hard-hit by the flooding. That study found that approximately 40% ofthe businesses surveyed were forced to close down for at leastsome time during the flooding. Rates of business closure werehighest for large manufacturing and construction firms and largecompanies offering business and professional services. Only about20% of the businesses that closed did so because of actual physi-cal flooding of the property. More frequently, they couldn’t do

56 C H A P T E R 5
business because of loss of water, electricity, sewer and waste waterservices, and because customers and employees lost access to thebusiness. Compared with flood damage, the loss of critical life-line services was a much more important cause of business closure,affecting a significantly larger number of businesses.
The floods appear to have had slight but discernable impacts,both positive and negative, on businesses in Des Moines. Ap-proximately one year after the floods, 70% of the businesses hadrecovered to pre-disaster levels, 18% were better off, and 12%were worse off than just prior to the flooding. (For more detaileddiscussions of the Des Moines survey, see Tierney, Nigg, andDahlhamer, 1996 and Tierney, 1997b).
A similar DRC study on businesses in Los Angeles and SantaMonica, California after the 1994 Northridge earthquake foundthat physical damage and lifeline service loss were widespread inthe impact area. Just over half (56%) of businesses in the twostudy communities were directly damaged by the earthquake, 61%lost electricity, and 54% lost phone service for some period oftime, although lifeline service interruption following the earth-quake was less extensive and lengthy than lifeline disruption inthe Midwest floods. Of the businesses surveyed, 56% closed forsome period of time as a result of the earthquake. In general,small businesses were more likely to close than larger ones. Themost common reasons why businesses closed were the need toclean up damage, loss of electricity, the inability of employees tocome to work, loss of phone service, and damage at owners’ homesthat took precedence over damage at the business.
At the time the survey was conducted, approximately 18months after the earthquake, about half of the businesses surveyedrated their well-being as comparable to what it had been beforethe earthquake. One-fourth of the businesses reported being bet-ter off, while for a comparable number, business had declined.Larger firms were more likely to have recovered, while businesseslocated in high-shaking-intensity areas and businesses that expe-rienced operational problems following the earthquake (e.g.,difficulty delivering or obtaining supplies, loss of customers) weremore likely to report being worse off. (For a more detailed discus-sion of these findings, see Tierney, 1997a; Tierney and Dahlhamer,1997; and Dahlhamer and Tierney, 1997; Dahlhamer and Tierney,forthcoming).

57BUSINESS VULNERABILITY AND PREPAREDNESS
In 1993, as part of NCEER’s coordinated Memphis/ShelbyCounty seismic risk assessment project, DRC conducted a studyon earthquake hazard awareness, perceived vulnerability to earth-quake-induced lifeline service interruption, and disasterpreparedness among proprietors of a representative sample ofbusinesses in Memphis and Shelby County, Tennessee. In the firststage of the sampling design, the 27,197 businesses in ShelbyCounty were aggregated by Standard Industrial Codes (SIC) intofive business sectors: wholesale and retail sales; manufacturing,construction, and contracting; business and professional services;finance, insurance, and real estate (F.I.R.E.); and other businesses(agriculture, forestry, and fishing; mining; transportation, commu-nication, and public utilities). In the second stage of the design,small (those with less than twenty employees) and large (thosewith twenty employees or more) businesses were randomly se-lected within each of the five sectors.
The survey instrument developed for the study was an 11-pagemail questionnaire containing items on business characteristics;owners’ perceptions of the short- and longer-term risk of earth-quakes in the Memphis area; ratings on the extent to whichbusinesses rely on various lifeline services, along with assessmentsof the length of time businesses could operate without those ser-vices; and questions on the extent to which businesses hadundertaken mitigation and preparedness measures to contain andmanage disaster-related damage and disruption.
A total of 1,840 businesses were randomly selected to partici-pate in the study. Following a modified version of Dillman’s (1978)“total design method,” an initial mailing was sent to those busi-nesses in early June, 1993. Survey participants who did not respondwithin three weeks were sent a reminder postcard, which wasfollowed one month later by a second mailing of the question-naire to non-respondents. Follow-up phone calls, timed to coincidewith the second mailing, were made to businesses that had notyet replied to the survey. A total of 737 questionnaires were re-
M e m p h i s / S h e l b yC o u n t y B u s i n e s s S u r v e y
5.15.15.15.15.1

58 C H A P T E R 5
ceived, for a 40% response rate, which was adequate for under-taking the necessary statistical analyses.
Table 5.1 contains generalinformation on the businessesin the Memphis/Shelby Countysample. At the time of the sur-vey, the median age of thebusinesses was 14 years.Slightly over two-thirds were in-dividual firms, and 63% leased,rather than owned, the businessproperty. The study methodol-ogy was designed to target largeas well as small firms, and themean number of employees forbusinesses in the sample was60. However, the median busi-
ness size was six employees, indicating that the small businessesin the sample were generally very small.
This chapter discusses survey findings on business vulnerabil-ity to earthquake-induced disruption and on business mitigationand preparedness activity. To begin addressing questions of differ-ential business vulnerability, sectoral and size differences areemphasized in the discussion.
The survey attempted to assess business vulnerability to earth-quake-related damage and disruption in several ways. First, todetermine levels of exposure to physical damage, information onthe types of buildings in which businesses of different types arelocated was obtained. Second, business dependency on majorlifeline services and the ways in which lifeline service loss wouldaffect business operations was assessed. Third, estimates frombusiness owners on how long they could afford to be shut downwithout incurring financial losses were obtained. Finally, busi-ness owners were asked to provide their subjective ratings of thelikelihood of future earthquakes and their probable consequences.
B u s i n e s s Vu l n e r a b i l i t y
5.25.25.25.25.2
Median Length ofTime in Business
14 Years
Individual FirmFranchise/Chain
69%31%
Own SpaceLease Space
37%63%
Number of EmployeesMean
Median606
Table 5.1 Business Characteristics

59BUSINESS VULNERABILITY AND PREPAREDNESS
5 . 2 . 1 B u i l d i n g T y p e a n d B u s i n e s s
L o c at i o n
The relationship between the degree of structural damage abuilding sustains and post-earthquake business functionality is notlinear. Obviously, if a building collapses completely or even par-tially in an earthquake, the businesses it houses are also likely toincur very severe damage and loss of functionality. However, thereverse is not the case: even if buildings survive an earthquakewith minor or no structural damage, businesses in those structurescan still suffer severe losses due to nonstructural damage, damageto contents and inventory, lifeline service interruption, or othercauses. As the Des Moines case discussed above indicates, life-line loss alone is sufficient to render businesses inoperable, evenwithout physical damage. Thus it is difficult to make inferencesabout business impacts on the basis of data on building types.Nevertheless, other things being equal, businesses that are locatedin hazardous types of buildings, such as unreinforced masonrybuildings, generally face higher risks because of the danger ofbuilding collapse and serious structural damage. This assumptionseems particularly valid for Memphis, since the community hasadopted no provisions for retrofitting these types of structures.
Other analyses in this monograph have focused mainly onhow power system damage and subsequent service interruptionwill affect economic activity in the Greater Memphis region. How-ever, since respondents in this study were asked to provideinformation on the type of building housing their businesses, someconclusions can be drawn about their vulnerability to structuraldamage. Several building types, including wood frame, brick,concrete, and steel were listed in the survey questionnaire. Onthe assumption that masonry buildings are most at risk for col-lapse and severe damage, structures were classified into twocategories, “brick” and “other.”
As shown in Table 5.2, 24% of the businesses in the samplereported being located in brick buildings. Small service firms (33%)were the most likely to be housed in brick structures, followed bysmall businesses in the F.I.R.E.(31%) and manufacturing and con-struction sectors (30%). While 21% of the small wholesale andretail trade businesses were housed in brick buildings, only 5% ofthe large businesses in this sector were located in those types ofstructures.

60 C H A P T E R 5
Type and Size of Business Brick Other
Wholesale and Retail TradeSmall (N=141) 20.6 79.4Large (N=38) 5.3 94.7
Manufacturing and ConstructionSmall (N=67) 29.9 70.1Large (N=30) 16.7 83.3
Business and Professional ServicesSmall (N=153) 33.3 66.7Large (N=55) 21.8 78.2
Finance, Insurance, and Real EstateSmall (N=75) 30.7 69.3Large (N=22) 13.6 86.4
OtherSmall (N=69) 26.1 73.9Large (N=34) 8.8 91.2
All Businesses (N=696) 24.3 75.7
Table 5.2 Percent of Businesses in Brick Versus“Other” Buildings by Type and Size of Business(in %)
T-test results indicatedthat small businesses aresignificantly more likely tobe housed in masonrystructures than their largercounterparts. No signifi-cant relationships werefound between economicsector and the buildingtypes in which businesseswere located. Small busi-nesses, regardless of type,are disproportionately lo-cated in buildings that havea higher probability of col-lapsing or sustaining severestructural damage in anearthquake.
These findings are consistent with other research indicatingthat a substantial proportion of the nonresidential building stockin Memphis is highly vulnerable to earthquake damage. Jones andMalik (1996), using tax assessors’ records, estimate that about12,000 of the approximately 21,800 commercial and industrialbuildings in Memphis and Shelby County are masonry, and thatthose structures account for about 45% of the total commercialand industrial building area. This study, which focuses on busi-nesses, rather than buildings, makes it possible to locate specifictypes of businesses and economic activities in particular types ofstructures. Although this monograph concentrates on lifeline dam-age and its economic impacts, physical damage to structureshousing businesses will clearly be a very important source of di-rect and indirect economic loss in future New Madrid events.
5 . 2 . 2 L i f e l i n e D e p e n d e n c y
Survey respondents were asked to rate the importance of fivelifeline services — electricity, water, natural gas, sewers and waste-water treatment, and telephone services — to their ability to dobusiness. A four-point scale, ranging from “Very important” to“Not important at all” was used.

61BUSINESS VULNERABILITY AND PREPAREDNESS
Utility VeryImp.
Imp. NotVeryImp.
NotImp.at All
Electricity 82.1 14.3 3.3 0.3
Water 27.1 33.4 31.3 8.2
Natural Gasa 18.4 28.7 39.5 13.4
Wastewater Treatment 22.6 31.6 32.6 13.3
Telephone 77.8 17.5 3.2 1.5
a. Asked only of businesses using natural gas.
Table 5.3 Importance of Utilities to BusinessOperations (in %)
Table 5.3 summarizesthose importance assess-ments. A large majority ofbusiness respondentsrated electrical and tele-phone services as veryimportant to their opera-tions (82% and 78%,respectively), and only avery small number ratedthese lifelines as unimpor-tant. Water, wastewatertreatment, and natural gaswere also seen as important by Memphis businesses, but by amuch less substantial margin.
Next, size and sectoral variations in the need for electricityand telephones (the two most critical lifeline services) were re-viewed (see Table 5.4). Large businesses in the F.I.R.E. sectorassigned the highest importance ratings to electricity; in fact, there
Type and Sizeof Business
VeryImp.
Imp. NotVeryImp.
NotImp.
atAll
Wholesale and Retail TradeSmall (N=148) 79.7 15.5 4.7 0.0Large (N=41) 87.8 12.2 0.0 0.0
Manufacturing and ConstructionSmall (N=71) 73.2 19.7 4.2 2.8Large (N=29) 86.2 13.8 0.0 0.0
Business and Professional ServicesSmall (N=152) 88.8 8.6 2.6 0.0Large (N=56) 83.9 16.1 0.0 0.0
Finance, Insurance,and Real EstateSmall (N=79) 82.3 13.9 3.8 0.0Large (N=24) 100.0 0.0 0.0 0.0
OtherSmall (N=70) 67.1 25.7 7.1 0.0Large (N=30) 76.7 16.7 6.7 0.0
All Businesses (N=722) 82.1 14.3 3.3 0.3
Table 5.4 Importance of Electricity by Type and Size ofBusiness (in %)

62 C H A P T E R 5
were no businesses in this group that did not consider electricityvery important. In general, large businesses were more likely thansmall ones to consider electricity very important for their opera-tions; small service-oriented businesses, 89% of which consideredelectricity very important, are an exception to this pattern.
Just over three-quarters of the sample judged telephone ser-vice to be very important to their business activities. This lifelinewas rated as highest in importance by large businesses in the “other”category; small businesses in that category and in the F.I.R.E. sec-tor also tended to see phones as crucial for their ability to dobusiness (Table 5.5).
A related question in the survey asked how long firms couldstay in operation if they lost any of the five lifeline services. Again,electricity was considered by respondents to be most critical fortheir ability to do business, with 59% reporting that loss of electri-cal power would cause them to shut down immediately. Telephoneservices were also seen as crucial for staying in business; the me-dian length of time business owners said they could operate withoutphones was four hours. Owners believed they could stay openlonger (about two days) without water or wastewater services and
Type and Sizeof Business
VeryImp.
Imp. NotVeryImp.
NotImp.
atAll
Wholesale and Retail TradeSmall (N=148) 77.0 16.2 4.1 2.7Large (N=41) 75.6 14.6 7.3 2.4
Manufacturing and ConstructionSmall (N=70) 75.7 20.0 1.4 2.9Large (N=29) 75.9 20.7 0.0 3.4
Business and Professional ServicesSmall (N=152) 78.3 16.4 4.6 0.7Large (N=56) 71.4 23.2 3.6 1.8
Finance, Insurance, and Real EstateSmall (N=79) 83.5 16.5 0.0 0.0Large (N=21) 75.0 20.8 4.2 0.0
OtherSmall (N=70) 80.0 18.6 1.4 0.0Large (N=30) 90.0 10.0 0.0 0.0
All Businesses (N=721) 77.8 17.5 3.2 1.5
Table 5.5 Importance of Telephones by Type and Size of Business(in %)

63BUSINESS VULNERABILITY AND PREPAREDNESS
reported being leastdependent on naturalgas (see Table 5.6).
In other analysesusing data on lifelineimportance, Nigg(1995a, 1995b) foundthat size and sectorwere unrelated to re-liance on electricalpower; businessesuniversally considerthis service critical.There was some variation in the assessed criticality of phone ser-vice, with small businesses in the wholesale and retail trade sectorindicating they could stay open longer than other businesses ifphone service were lost. Small businesses considered themselvessignificantly less dependent on water service than their larger coun-terparts, and service-oriented businesses reported greater relianceon sewer and wastewater treatment services.
These data provide a basis for ranking lifeline services in termsof their importance for continued business activity. Owners viewelectrical power and telephone service as crucial by both criteriadiscussed above—assessed importance for operations and the po-tential impact of service loss. Most cannot envision remainingopen for any appreciable period without those services. An earth-quake causing extensive damage to electrical and telephonetransmission or distribution systems serving the Memphis areawould thus have an immediate and substantial negative impacton economic activity.
Additionally, businesses generally cannot tolerate loss of wa-ter or wastewater treatment service for longer than about two dayswithout being forced to close. Since restoration times for theselifelines could be lengthy following a major earthquake in theNew Madrid area, their loss could also have major negative eco-nomic effects.
Data from this section of the survey were used by other NCEERinvestigators to quantify potential regional economic impacts of aNew Madrid earthquake event. In Chapter 6, Stephanie Changused the data to calculate measures of business lifeline depen-dency and resiliency for Memphis/Shelby County businesses. Those
Table 5.6 Median Number of Hours Businesses CouldOperate with Lifeline Loss
Electricity
Water
Natural Gas
Wastewater Treatment
Telephones
LifelineService
Median Numberof Hours
0
48
120
48
4

64 C H A P T E R 5
Year(s) VeryLikely
Likely NotVeryLikely
NotLikelyat All
30 25.7 44.4 26.3 3.6
10 9.5 42.7 41.3 6.4
1 1.7 18.6 54.3 25.5
Table 5.7 Perceived Earthquake Probabilities (in %)
data were then combined with French’s GIS-based data on em-ployment patterns within the county’s electric power service areas(see Chapter 4), data on the spatial distribution of electric lifelineservice disruption, and projections on probable restoration timesderived from research on recent events, to estimate the direct eco-nomic impacts of electric power disruption and restoration.
5.2 .3 Percept ions of the Earthquake
Threat
To assess the ex-tent to whichearthquakes were per-ceived as a problemwithin the businesscommunity, respon-dents were asked torate the probability ofa damaging earth-quake striking theM e m p h i s / S h e l byCounty area within the
next year, the next ten years, and the next thirty years, using afour-point scale. As Table 5.7 indicates, owners generally did notbelieve a damaging earthquake was likely within the coming year;although about one-fifth of the sample viewed such an event aslikely or very likely, the majority rated such an event as not verylikely or not likely at all. However, perceptions of the risk beganto shift as longer time-frames were considered. The sample wasabout evenly split between respondents who thought a damagingearthquake was likely or very likely in the next ten years and thosewho didn’t think an earthquake was probable. The proportion ofthose considering an earthquake likely or very likely rose further,to about 70%, for the thirty-year time window. Based on thesedata, it appears that business proprietors were moderately con-cerned about the earthquake hazard in the Memphis area. Whilethey didn’t consider the threat of a damaging earthquake imma-nent—i.e., something that could occur within the next year—theydid assess the probability in the next one to three decades as rela-

65BUSINESS VULNERABILITY AND PREPAREDNESS
tively high. Subsequent analyses indicated that these risk percep-tions were not related either to business size or business type.
5.35.35.35.35.3
B u s i n e s s P r e pa r e d n e s s
5 . 3 . 1 A d o p t i o n o f P r e p a r e d n e s s
M e a s u r e s
One of the main objectives of the survey was to assess theextent to which businesses were engaging in activities designed toreduce losses and enhance emergency response capability in theevent of an earthquake. Respondents were asked to fill out a miti-gation and preparedness checklist containing both generalemergency preparedness and earthquake-specific items; includedin the list were activities such as having the building structurallyassessed, providing emergency training for employees, bracingshelves and other equipment, stockpiling first aid kits and emer-gency supplies, having backup power, and having a businessrecovery plan.
Table 5.8 summarizes owners’ reports on the extent to whichthey had implemented these measures at their businesses. Themore frequently-adopted measures were those geared toward gen-eral preparedness, rather than those that are earthquake-specific.For example, over half the businesses in the sample had obtainedfirst aid kits or extra medical supplies (60%) and had learned firstaid (51%). A moderate proportion of the businesses surveyed hadstored extra office supplies (30%) and fuel or batteries (22%) foruse in the event of an earthquake. A comparable percentage hadpurchased business interruption insurance (30%). Activities un-dertaken by only a small fraction of the businesses in the sampleinclude holding earthquake training programs for employees (11%),having the business property assessed for structural safety (11%),conducting earthquake drills or exercises (9%), and making ar-rangements to move the business to an alternative location in theevent of a damaging earthquake (9%).
Interestingly, a sizeable percentage of the sample had purchasedearthquake insurance (41%) and attended meetings or receivedwritten information on earthquake preparedness (40%). These

66 C H A P T E R 5
relatively high levels of information-gathering and insurance cov-erage can probably be explained in part by increases in earthquakeawareness in the Central U.S. resulting from the 1990 Iben Brown-ing earthquake prediction. During the late summer and fall ofthat year, the entire New Madrid region was bombarded with earth-quake-related information; numerous organizations, including theCentral U.S. Earthquake Consortium (CUSEC), the Red Cross, andthe Federal Emergency Management Agency, conducted prepared-ness campaigns in Memphis and other Central U.S. communities.A DRC survey conducted in Memphis and Shelby County in the
Preparedness Activity Have Done
Obtained a First Aid Kit 60
Learned First Aid 51
Purchased Earthquake Insurance 41
Attended Meetings orReceived Written Information
40
Stored Office Supplies 34
Talked with Employees AboutWhat to Do in Earthquake
30
Purchased Business Interruption Insurance 30
Stored Fuel or Batteries 22
Developed a Business Emergency Plan 22
Braced Shelves and Equipment 17
Obtained an Emergency Generator 15
Stored Food or Water 14
Developed a Business Recovery Plan 13
Held Earthquake TrainingPrograms for Employees
11
Had Engineer Assess StructuralSafety of Building
11
Made Arrangements to RelocateBusiness in Case of an Earthquake
9
Conducted Earthquake Drillsor Exercises with Employees
9
Table 5.8 Business Preparedness Activities (in %)

67BUSINESS VULNERABILITY AND PREPAREDNESS
fall of 1990, just prior to the December 3 “prediction” date, re-vealed that community residents had been extensively involved inseeking and sharing information about earthquakes (Tierney, 1994).This concern evidently carried over into their business-relatedactivities.
While the number of businesses that engaged in some of thepreparedness measures asked about was relatively large, overallthe business community in Memphis/Shelby County was not well-prepared for earthquakes at the time of the survey. Only two of theseventeen activities on the checklist — obtaining a first aid kit andlearning first aid — had been carried out by more than half of thefirms in the sample; the mean number of preparedness activitiesundertaken by businesses was four, and the median was three.Fifteen percent of the sample had not engaged in even one of thepreparedness activities listed, and an additional 10% had engagedin only one. These data suggest that while business owners in theMemphis/Shelby County area know about the hazard and see adamaging earthquake as likely in the next 10-30 years, they areactually doing little to prepare for a future damaging earthquake.
To put things into perspective, these findings on business pre-paredness don’t differ appreciably from what has been observedin other communities. In Southern California, where earthquakeexperience is much more extensive, most businesses had donelittle to prepare for earthquakes prior to the Northridge earthquake,and even after that event improvements in preparedness were quitesmall. Like their counterparts in Memphis, Southern Californiabusinesses also tended to favor the more generalized and less ex-pensive types of preparedness activities, like stocking first aidequipment, as opposed to undertaking earthquake-specific andmore costly loss reduction measures (Dahlhamer and Reshaur,1996; Tierney and Dahlhamer, 1997).
5.3.2 Explaining Business Preparedness
To identify factors associated with business willingness to pre-pare for earthquakes and other disasters, several models weretested; the one discussed here expands a model developed andanalyzed earlier by Dahlhamer and D’Souza (1997). Included inthe model are: (1) business characteristics, specifically the age ofthe business, whether the business is an individual firm or a fran-

68 C H A P T E R 5
chise or part of a chain, whether the business property is ownedor leased, business size (i.e., the number of full-time employees),the financial condition of the business, as assessed by the busi-ness owner, and business sector; (2) owners’ perceptions of thelikelihood of a future damaging earthquake; (3) an index of own-ers’ assessments of the importance of four lifeline services(electricity, telephones, water, and sewer and wastewater) for busi-ness operations1; and (4) previous disaster experience. Thedependent variable in the analysis, business preparedness, con-sisted of an index of the 17 preparedness items listed in Table 5.8.
Regression analysis was used to test the model. As shown inTable 5.9, the overall model was significant (F=11.4901). Theadjusted R2 is .1931, indicating that the model explains approxi-mately 19% of the variance in preparedness.
Four of the model variables were significantly related to busi-ness disaster preparedness. Size was by far the strongest predictorof preparedness levels; larger businesses were significantly morelikely to engage in preparedness activities than their smaller coun-terparts. This is consistent with previous research on businessdisaster preparedness (Drabek, 1991, 1994a, 1994b; Quarantelliet al., 1979). Size may be indicative of business financial well-being2, or may make it more likely that a firm will have resourcesto support preparedness activity. Conversely, smaller firms maysimply lack the resources or staff to devote to preparedness activi-ties. Mileti et. al., (1993), for example, note that large firms aremore likely to have staff who are specifically assigned disasterpreparedness tasks.
Owners of business properties were significantly more likelythan lessees to undertake loss reduction measures. This finding isconsistent with research on households, which indicates thathomeowners are better prepared than renters (Turner, Nigg, andPaz, 1986). Compared to those who lease, building owners maysee themselves as having more to lose in the event of a disaster.Owners may also have access to more financial resources thanrenters for undertaking preparedness activities. Finally, they maybe able to undertake to a wider range of preparedness activities;for example, they can have an engineer structurally assess thebuilding housing the business, while renters would be highly un-likely to do so.
Business type is also significantly related to preparedness. Busi-nesses in the F.I.R.E. sector were significantly more likely to engage

69BUSINESS VULNERABILITY AND PREPAREDNESS
in preparedness activities than other businesses. Although this sur-vey can’t directly shed light on why is the case, it is possible thatoutreach efforts have targeted this sector more than others. Forexample, the Central United States Earthquake Consortium(CUSEC) has paid considerable attention to potential earthquakeimpacts on the F.I.R.E. sector. Some other investigators have alsofound sectoral differences in preparedness levels (see, for example,Drabek, 1991, 1995; Mileti et al., 1993).
Finally, risk perception, or owners’ estimates of the likelihoodof a future damaging earthquake, was also significantly related topreparedness. Those who saw the likelihood of a future damagingearthquake as high were significantly more likely to engage inpreparedness activities than those who were less concerned aboutthe earthquake problem.
The variables in the model that were unrelated to businesspreparedness included the age of the business, owners’ ratings ofthe importance of utilities for business operations, the company’s
a. p<.01 b. p<.001
Business CharacteristicsAge of Business
Individual Firm or FranchiseOwn or Lease
Number of Full-Time EmployeesFinancial Condition
Wholesale/RetailManufacturing/Construction
Business/Professional ServicesFinance/Insurance/Real Estate
Risk PerceptionLikelihood of an Earthquake
Utility ImportanceUtility Importance
Disaster ExperiencePrevious Disaster Experience
R2
Adjusted R2
F-Value
IndependentVariables
StandardErrors
Unstandard-ized
Coefficients
StandardizedCoefficients
.0768
.3202
.3059
.1106
.1826
.4274
.5167
.4533
.5377
.3421
.0762
.4465
.0901- .37161.0763
.5400
.1898- .4129- .2121
.33091.6370
1.5364
.1472
.7721
.0504- .0486
.1486b
.2265b
.0433- .0537- .0206
.0432 .1508a
.1803b
.0816
.0701
.2115
.1931 11.4901b
Table 5.9 Regression Coefficients and Standard Errors for Business PreparednessModel

70 C H A P T E R 5
status as an individual firm or a franchise, owners’ assessments ofthe financial condition of the business, and previous disaster ex-perience. The finding regarding disaster experience is surprising,since other studies (e.g., Drabek 1994a, 1994b; Mileti, et al., 1993)have found that businesses that have gone through one or moredisasters are more likely to prepare.
C o n c l u s i o n
5.45.45.45.45.4
Memphis businesses are clearly vulnerable to earthquake-in-duced disruption; this vulnerability stems in part from the types ofbuildings in which they are housed and from their dependence onlifeline services that are susceptible to earthquake damage. Nearlyone-fourth of the businesses surveyed are located in masonry build-ings; this pattern alone suggests high levels of exposure to potentialearthquake damage. Business operations are critically dependenton electrical power; more than half the businesses in the surveyindicated that they would be forced to shut down immediately ifthey were to lose electricity. Telephone service is also viewed asextremely important by Memphis firms; the loss of this servicewould also be felt immediately by business operators. Althoughservices such as water and wastewater treatment are consideredsomewhat less important, the loss of those services would have adetrimental impact within a relatively short period of time—ap-proximately 48 hours. A major New Madrid earthquake has thepotential for causing extensive lifeline service disruption in theMemphis area. The survey data indicate that such disruption wouldalmost immediately result in significant business interruption losses.
Business owners in the Memphis area are aware of the earth-quake problem, and while they do not see the threat of a damagingearthquake as immanent, they do consider the potential for suchan event over the next three decades to be significant. This moder-ately high level of concern is attributable in part to the heightenedpublic curiosity and large-scale public awareness and educationcampaigns that resulted from the 1990 Iben Browning New Madridprediction scare. The data also show that awareness of the earth-quake problem is important for explaining actions taken withrespect to the hazard. Belief in the probability of a future damag-

71BUSINESS VULNERABILITY AND PREPAREDNESS
ing earthquake is high among those who are willing to engage inpreparedness activities. However, consistent with the disaster lit-erature, hazard awareness alone wasn’t sufficient to explainpreparedness.
Despite moderately high risk perceptions, Memphis businessesgenerally have not been enthusiastic about adopting hazard miti-gation and preparedness measures. While some businesses showa slight inclination to prepare by taking one or two minimal steps,such as keeping first aid supplies on hand or having employeeslearn first aid, they are highly unlikely to engage in more compre-hensive preparedness efforts.
The survey data also point to factors that are associated bothwith earthquake vulnerability and with levels of preparednessamong Memphis businesses. Business size is one such factor.Small businesses are more likely than their larger counterparts tobe located in masonry buildings, the kinds of structures that areparticularly vulnerable to major earthquake damage. At the sametime, small businesses are less likely than large ones to undertakepreparedness activities. Survey findings regarding the importanceof size are consistent with other research, as well as with DRC’srecent study on the Northridge earthquake (Tierney, 1997a), whichsuggest that small businesses were especially vulnerable to disas-ter-related losses and disruption in that event. Sector also turnedout to be important for preparedness in Memphis; firms in theF.I.R.E. sector were most likely to have taken steps to prepare forearthquakes and other disasters. Owners of business propertieswere more likely to adopt preparedness measures than renters,indicating that building ownership creates additional incentivesfor loss reduction.
Finally, the Memphis data suggest that the commonly-usedapproach to encouraging earthquake and general disaster prepared-ness among businesses, which emphasizes public awareness andeducation but stops short of using stronger incentives, is achiev-ing little. Lack of awareness is not the main barrier to hazardreduction. The Memphis survey respondents knew about theregion’s earthquake problem, but for most business owners thatawareness did not translate into action. To encourage broaderadoption of loss reduction measures, such measures must be madeattractive to and affordable for the business community. Busi-nesses must also understand that their economic survival may wellhinge on the extent to which they are able to cope with disasters

72 C H A P T E R 5
and their impacts. Recognizing this need, the Central U. S. Earth-quake Consortium, the Tennessee Valley Authority, and other groupshave been actively supporting the work of the Memphis BusinessEmergency Preparedness Council (BEPC), a private-sector organi-zation whose objective is to address the physical and economicvulnerability of Memphis area businesses to earthquakes and otherdisasters (CUSEC, 1997). Organizations like BEPC have an im-portant role to play, since the evidence from Memphis and othercommunities shows that currently businesses are far from sold onthe need for reducing disaster losses.

73BUSINESS VULNERABILITY AND PREPAREDNESS
N o t e s
1. Assessments of the importance of natural gas were not included in theindex since only one-third of the businesses in the sample reportedusing this lifeline service.
2. Financial soundness alone is not sufficient to stimulate preparedness,however; in the current model, business financial condition was foundto be unrelated to preparedness levels.

74 C H A P T E R 5

75
2
66666
This chapter focuses on the estimation of the direct economicimpacts that result when earthquake-related lifeline service dis-ruption impedes normal economic activity. First, an overview ofconcepts, current methodologies, and issues is provided. A newmethodology, developed as part of the NCEER coordinated studyof the seismic vulnerability of lifelines in the Memphis area, isthen presented. The crux of this methodology involves a synthesisof engineering assessment of lifeline network reliability (Chapter3) with socioeconomic analysis of lifeline usage (Chapter 5) andurban development patterns (Chapters 2, 4, 7 and 8). Estimationof direct impacts associated with electricity disruption is presentedas a case study. The conclusion discusses the significance of themethodological developments, potential applications, and areasfor further research.
by Stephanie E. Chang
The definition of direct versus indirect economic impacts pre-sents a common source of confusion, as the terms haveunfortunately been used in different ways by different researchers.Furthermore, the definitions also depend to some degree on thecontext of the problem, in particular, whether the context is theimpact of lifeline disruption, buildings damage, or total losses dueto an earthquake. For present purposes, the basic concept usedby Boisvert (1992) and Cochrane (in NRC, 1992) is applied.
Direct losses include losses of plant and equipment whichstem directly from the physical damage plus any associated
D i r e c t E c o n o m i c
I m p a c t s
Scope o f D i r ec t Econom i cI m pa c t s
6.16.16.16.16.1

76 C H A P T E R 6
loss of employment. The indirect losses in GRP result from themultiplier or ripple effect throughout the economy due to sup-ply bottlenecks and reduced demand as a result of the directlosses. (Boisvert, p.223)
This concept is also utilized in the standardized loss methodologycurrently being developed for the National Institute of BuildingSciences (NIBS) (RMS, 1997). The definition suggests that directlosses are those which occur as an immediate consequence ofphysical damage at the site of production. The implication is thatdirect economic losses are suffered by the users of this damagedplant or equipment, while indirect losses are suffered by others asa result of reduced economic transactions.
In the case of lifelines, the application of this concept requiressome clarification because lifelines provide essential services tomany sectors of the economy and generally consist of networksthat service many sites of production. Consider an example wherean earthquake causes damage to several electric power substa-tions. This causes a blackout to several parts of a city and forcesthe temporary suspension of various business activities. Techni-cally, the user of the damaged facilities (i.e., the substations) is theelectric utility company itself, which clearly suffers some directeconomic losses. Ambiguity arises, however, because the users ofthe electricity service (i.e., the customers) in the blackout areascan also be said to have suffered direct economic losses as a resultof the electricity disruption at the site of production. Their busi-ness interruption losses do not result from “multiplier” or “ripple”effects. This is illustrated by continuing the example, wherebybusiness interruption in the blackout areas reduces production ofa certain good. Businesses in the unaffected areas which requirethis good in their production process are forced to reduce theiractivities as a result of this supply bottleneck (assuming they areunable to import a substitute within a short period of time). Theselatter businesses thus suffer indirect losses resulting from directlosses incurred in the blackout areas.
In the present context of earthquake-induced lifeline damage,direct economic losses are therefore considered to include pro-duction losses in various economic sectors attributable to electricityoutage at their production site. It should be noted that this defini-tion differs from that used in some other studies, including mostnotably the Applied Technology Council (1991) report ATC-25,

77DIRECT ECONOMIC IMPACTS
Seismic Vulnerability and Impact of Disruption on Lifelines in theConterminous United States. In ATC-25, “direct” losses are con-fined to repair costs. Business interruption losses imposed onlifeline users are defined as “indirect” economic losses. Lossesdue to reverberations of “indirect” losses throughout the economyare considered “secondary” losses. ATC-25’s “direct” and “indi-rect” losses are both considered to be “direct” losses under thedefinition used in this study, while ATC-25’s “secondary” lossesare defined as “indirect” impacts here.
A further point of clarification is required with regard to im-pacts on sectors other than private businesses. While it is true thathouseholds and governments will also suffer property damage andattendant losses in a natural disaster, these losses are not evalu-ated in the current approach to direct loss estimation. This approachis based on the need to avoid double-counting losses, as empha-sized by Cochrane:
... the level of economic activity can be measured bycounting expenditures, or incomes, but not both. Income ...must be equivalent to value of the products produced. This isbecause the price of a product reflects all the costs incurred inits creation, which in this case is the sum of wages, interest,and profits. This simple result provides an important loss-ac-counting guide: damage assessments should focus on incomeslost or spending lost, but not both. Either should yield the sameresult. (NRC, p.101)
Since losses to household income can also be counted as reduc-tions in wages paid from business production, they should not becounted in addition to business interruption losses. Similarly, lossesto government revenue include reduced corporate and personalincome taxes and should not be counted in addition to businessinterruption losses.
Finally, a clarification is required regarding the distinctionbetween direct damage and direct economic losses. Direct dam-age includes repair costs or, alternatively, the replacement valueof damaged plant and equipment. These are losses to a region’scapital stock or assets. Direct economic losses derive from lostproduction (or equivalently, lost income) resulting from this physi-cal damage. These constitute reductions in the region’s flow ofincome or Gross Regional Product (GRP). This chapter focuses on
78 C H A P T E R 6
the estimation of direct economic losses, rather than direct dam-age.
The economic impact of earthquakes and other natural disas-ters has been gaining attention in recent years, and manymethodological improvements have been made with respect toestimating the direct and indirect regional economic losses be-yond the costs of repairing physical damage. However, only afew studies have specifically addressed lifeline disruption impact.Furthermore, most of these studies have focused on estimatingindirect, rather than direct, economic impacts. For example, studiessuch as Boisvert, 1992; Gordon and Richardson, 1992; Rose andBenavides, 1993 and the NIBS project (RMS, 1997) do not actu-ally provide a methodology for estimating direct economic lossesassociated with lifeline disruption. Such a methodology thereforeremains an important missing link in the complete loss estimationprocedure.
ATC-25 constitutes perhaps the principal reference for esti-mating direct economic impacts of lifeline disruption in earthquakedisasters. The ATC-25 methodology assumes a simple proportionalrelationship between the extent of lifeline service disruption andthe extent of ensuing production losses. Specifically, for a par-ticular lifeline i and industry j, ATC-25 provides an “importancefactor” Iij . This importance factor is based on expert judgmentand derives from data in another reference report by the AppliedTechnology Council (1985), ATC-13: Earthquake Damage Evalua-tion Data for California. These importance factors indicate thepercent of production that would be lost if lifeline service werecompletely disrupted. For example, an importance factor of 0.75would indicate that in the event of complete utility service disrup-tion, 75% of normal production would be lost due to reducedproductive capacity. ATC-25 further assumes that the first 5% ofutility service interruption can be absorbed without loss, presum-ably due to excess capacity, substitution possibilities, or other formsof resiliency. Going from 5 to 100% lifeline service disruption,
C u r r e n t E s t i m a t i o nM e t h o d o l o g i e s
6.26.26.26.26.2

79DIRECT ECONOMIC IMPACTS
losses decrease proportionally from 0% to the maximum indicatedby the importance factor.
The importance factors reflect the extent to which differentindustries are dependent upon different lifelines. It is not neces-sarily the case that 100% disruption of a particular lifeline leadsto 100% loss of economic output because a particular industrymay depend upon the lifeline only to a limited degree. Thus theaverage value of the importance factor for electricity across allsectors is 0.86, while the average for natural gas is 0.32. Thisindicates that industries are generally much more dependent uponelectricity than upon natural gas. For the electricity lifeline alone,the importance factor ranges from 0.30 for the transportation andwarehousing industry to 1.00 for industries such as petroleum re-fining. The economic impact of earthquake-induced lifeline servicedisruption in an urban area may therefore vary significantly de-pending upon the particular industry and lifeline underconsideration.
In addition to ATC-25, other studies have also provided meth-odologies for estimating direct economic losses from lifelinedisruption. For example, Eguchi et al., 1992 focused on evaluat-ing energy systems, specifically natural gas, electricity, andpetroleum. Using data from the Department of Energy, the studyestimated energy usage factors indicating dependency on differ-ent energy sources for various states in the Midwestern U.S. For ascenario earthquake in the New Madrid Seismic Zone, restorationtime factors are calculated based on ATC-13. Economic lossesfrom energy service disruption for each industry in a state are cal-culated by combining the lifeline restoration factors with the energyuse factors. Industry losses are combined by weighting them withtheir share of the regional economy (in terms of value added), andresults are summed across states in the affected area to obtain thetotal direct economic loss (which are referred to in that study as“indirect” losses). Thus unlike ATC-25, Eguchi et al., 1992 doesnot rely upon importance factors determined by expert judgment.In addition, the spatial dimension of lifeline disruption and resto-ration is explicitly recognized insofar as geographic subareas (i.e.,states) comprising the impacted region are analyzed separately.However, the estimation procedure is an approximate one intendedto produce order-of-magnitude rather than accurate results.

80 C H A P T E R 6
This chapter presents a general methodology for evaluatingthe direct economic losses caused by seismically-induced disrup-tion of lifeline service in an urban area. The ATC-25 methodologyand issues identified in Eguchi et al., 1992 provide a basis for theconceptual framework. However, several improvements or re-finements are developed. In particular, emphasis is placed onutilization of empirical data for the specific study area and evalu-ation of loss distribution within a geographic information system(GIS) context. An earlier version of this methodology was pre-sented in Chang et al., 1995.
The basic premise of the improvements and refinements is thatdirect economic losses will depend very much upon specific lo-cal engineering and socioeconomic conditions. First, as shown inChapter 3 on system performance, the disruption to lifeline ser-vice caused by an earthquake is likely to be uneven across theimpacted area. Furthermore, as seen in Chapter 4 on GIS repre-sentation, the distribution of pre-earthquake economic activity isalso uneven across the impacted area. The pattern of concentra-tion will also differ from industry to industry. Thus the physicalextent of lifeline service disruption region-wide will vary acrossindustries. Furthermore, the economic impact of this service dis-ruption will be determined by how dependent a particular industryis on that lifeline. To take into account all of these factors, themethodology consists of four steps: (1) development of a lifelineusage or dependency model on an industry basis, (2) estimationof the spatial distribution of economic activity throughout the ur-ban area, (3) estimation of lifeline service restoration, and (4)assessment of direct losses through evaluation of the spatial coin-cidence of economic activity with lifeline service disruption overtime.
C o n c e p t u a l F r a m e w o r k
6.36.36.36.36.3

81DIRECT ECONOMIC IMPACTS
The direct economic impact methodology is developed herein the context of the Memphis/Shelby County case study. How-ever, the methodology is general and applicable to other lifelinesand other seismically vulnerable regions of the country.
6 . 4 . 1 B u s i n e s s R e s i l i e n c y t o
L i f e l i n e D i s r u p t i o n
A simple lifeline usage model is developed based on the ATC-25 methodology. However, three improvements are made: first,rather than applying expert-based “importance” factors that aremeant to reflect conditions in California, these factors are empiri-cally calibrated with data from the study region. This data derivesfrom the NCEER study of business vulnerability in Shelby Countyconducted by researchers at the Disaster Research Center (DRC)at the University of Delaware (see Chapter 5). In addition, thetime element is explicitly recognized to take into account the re-covery timepath after the disaster. By incorporating the timeelement, alternative recovery strategies can be addressed in termsof their potential for reducing total economic loss. Finally, thespatial dimension of lifeline service disruption and economic im-pact is considered through use of GIS information. This not onlyaddresses an important source of differential impact between in-dustries but also allows for more sophisticated analysis of theeconomic implications of alternative recovery strategies.
Based on ATC-25, a simple usage-based loss model is pro-posed as follows:
lr
dijts ijt
its=
−⋅ −
( )
.( . )
1
0 950 05 if dit
s > 005. (6.1)
= 0 if dits ≤ 005.
C a s e S t u d y : E l e c t r i c i t yD i s r u p t i o n i n N M S ZE a r t h q u a k e
6.46.46.46.46.4

82 C H A P T E R 6
where l lijts
ijts( )0 1≤ ≤ is the direct economic loss from lifeline i dis-
ruption for industry j in service area s in time period t after thedisaster, r rijt ijt( )0 1≤ ≤ is a “resiliency” factor, and d dit
sits( )0 1≤ ≤ is
the percent of lifeline service disruption. Economic loss is ex-pressed relative to normal economic production levels. As inATC-25, it is assumed that the first 5% of lifeline service disrup-tion can be absorbed without economic loss. Alternatively, withoutthis 5% assumption, the loss model can be written as:
l r dijts
ijt its= − ⋅( )1 (6.2)
As in ATC-25, it is assumed that economic loss increases inproportion to extent of lifeline service disruption up to some maxi-mum. In ATC-25, the “importance” factor I indicated the maximumpercent of production loss that would be associated with com-plete lifeline disruption. Here, a “resiliency” factor r is defined asthe percent of remaining production in the event of complete life-line outage, or equivalently, one minus I. This resiliency factor isspecific to lifeline i and industry j and reflects lifeline usage char-acteristics and dependency.
Resiliency factors are calibrated from results of the DRC sur-vey of businesses in Shelby County. Specifically, businesses wereasked, “How long could your business operate without electric-ity?” and similarly for other lifelines. The responses were classifiedaccording to major industry. For each industry, a cumulative dis-tribution of temporary business closures was inferred accordingto the duration of lifeline disruption by week. It was assumed thatoutput is uniform across establishments in an industry, so that theclosure of x percent of businesses at any time represents a pro-duction loss of x percent in that industry. The percent of businessclosures at a given point in time can then be assumed to represent1− rijt , the percent loss of output in that industry due to completelifeline disruption.
Table 6.1 compares these survey-based resiliency factors withthe expert-based estimates provided in ATC-25 for electricity. Thesefactors represent an average over the first month after the disasterand are presented for nine major industries comprising the privatesector of the economy. Factors from the two sources are generallyconsistent. In some industries (notably agriculture, mining, con-struction and TCU) the differences are quite great; however, as

83DIRECT ECONOMIC IMPACTS
Table 6.1 Resiliency Factors for Electricity by Industry
a. Transportation, Communications, and Utilitiesb. Finance, Insurance, and Real Estate
Industry ATC-25 Survey-based
AgricultureMining
ConstructionManufacturing
T.C.U. a
Wholesale TradeRetail Trade
F.I.R.E. b
Services
0.500.100.600.020.450.100.100.100.16
0.150.330.170.040.150.060.080.070.07
these do not representmajor sectors of theMemphis economy, thedifferences are not asource of great concern.Similar comparisons forwater and natural gaslifelines can be found inChang et al., 1995. Ingeneral, the factors differquite significantly in the case of these other lifelines. As withelectric power, where significant differences occur, in general theexpert-based estimates overestimate resiliency — and hence un-derestimate impact — as compared with the empirical data.
The similarities and differences may be partly explained byvariations in lifeline usage across regions of the country. In par-ticular, natural gas usage and dependency is probably greater inthe Midwest than in California. Electricity dependency, on theother hand, is generally very high in any region of the country. Inaddition, the types of businesses comprising a particular industrymay vary interregionally. There is also the possibility that expertjudgment on lifeline dependency does not coincide very closelywith the opinions of business operators. It should be kept in mindthat while business operators may have a better sense of lifelinedependency in Shelby County, their opinions probably do not re-flect actual earthquake experience.
According to the survey-based factors in Table 6.1, the manu-facturing industry is the most dependent upon electricity in thesense of having the least resiliency to electricity outage. Whole-sale and retail trade, FIRE and the services industries are also highlydependent upon electricity. Mining would appear to be the leastdependent industry; however, as the resiliency factor was estimatedfrom a very small sample (three businesses), this calibration maynot be very reliable.
It should be noted that the resiliency factors are consideredindependently for each lifeline and do not account for other earth-quake impacts such as damage to buildings and other structures.It would be incorrect to sum losses from Equation 6.1 for electric-ity, water, and natural gas without accounting for some redundancyin their impacts. However, in the current study, only electricity isevaluated.

84 C H A P T E R 6
In contrast to ATC-25, the current methodology models changesin the resiliency factor over time. That is, as lifeline service dis-ruption is sustained over a period of weeks, some of the initialresiliency “cushion” would be gradually worn away. Stored en-ergy reserves, as an example, may be depleted. On the otherhand, it is also possible that in the course of the recovery process,resiliency may increase due, for example, to businesses setting upnew temporary electric generators. In general, however, the resil-iency factor is expected to decrease over time. This is schematicallyillustrated in Figure 6.1. The y-intercept of the solid line, r0, indi-cates the resiliency factor immediately after the disaster; one weeklater, resiliency decreases to r1.
To summarize, the resiliency factor rijt serves to modify theimpact of lifeline service disruption. If it is assumed that the first5% of disruption cannot be absorbed without loss, then a resil-iency factor of 0 indicates that industry j has no flexibility in dealingwith lifeline (e.g., electricity) loss; for example, 70% disruption inelectricity would lead to 70% loss in production. A resiliencyfactor of 0.1 would mean that 70% disruption of electricity wouldlead to 63% loss in production. Over the course of the repair andrestoration period, in a particular service area s, both the disrup-tion factor d and the resiliency factor r are expected to decrease.These produce opposite effects, so that the net impact on the lossfactor l in Equations 6.1 and 6.2 may be either an increase ordecrease at any point in time.
Figure 6.1 Impact of Electricity Disruption on Production

85DIRECT ECONOMIC IMPACTS
6 . 4 . 2 L o c a t i o n o f E c o n o m i c
A c t i v i t y
For a given lifeline such as electricity, the loss model repre-sented by Equation 6.1 (or alternatively 6.2) indicates the directeconomic impact for a particular industry j in a particular servicearea s. Total direct economic impact depends upon the locationaldistribution of economic activity among all service areas in theimpacted region. At time t, the total direct economic impact forindustry j can be evaluated as a weighted sum over all serviceareas:
L l wjt ijts
js
s= ∑ (6.3)
where wX
Xjs j
s
j=
L Ljt jt( )0 1≤ ≤ is the percent loss of production in industry j, lijts is
the loss factor defined in equation 6.1 (or 6.2), X represents out-put, and the area weights wj
s are indicated by the share of industryj production accounted for by area s. Total direct economic lossfor the impacted region in dollar terms ( )∆Xt is then:
∆X L Xt jt j
j= ⋅∑ (6.4)
where Xj is the normal production level for industry j.In the current application, this estimation of total direct eco-
nomic impact requires information on the distribution ofpre-earthquake economic activity among Shelby County’s elec-tric power service areas (EPSAs) for each industry. Analysisdescribed in Chapter 4 (GIS Analysis) produced results in terms ofpre-earthquake employment in different industries by EPSA. Forconvenience, it can be assumed that there is uniform labor pro-ductivity within each industry so that each employee accounts forthe same amount of output. With this assumption, the GIS data-base on employment can also be interpreted as a representationof output distributed across EPSAs in the county for each industryand can be utilized directly for inferring the weights in Equation6.3.

86 C H A P T E R 6
Note that Equation 6.4 assumes that there is no inter-area prod-uct substitution following the earthquake. In an actual disaster, tosome extent, producers in less heavily impacted EPSAs could “makeup for” losses in more heavily impacted areas, for instance bymaking use of excess capacity or working overtime. The extent towhich this is possible will depend upon a number of factors, in-cluding length of power disruption, concentration of businesses inthe industry, specialization of businesses in each area, extent ofbuilding and other lifeline damage, and condition of the local trans-portation network. For example, retail trade stores for clothing arespread throughout the impacted area and losses in one EPSA couldbe made up for by additional sales in another. On the other hand,specialized manufacturing businesses making a particular machinetool have little potential for inter-area product substitution. Whilesuch substitutions are very difficult to take into account, their po-tential suggests that the loss results from the following analysiscan be considered an upper bound estimate.
6 . 4 . 3 L i f e l i n e S e r v i c e D i s r u p t i o n
a n d R e s t o r a t i o n
The model also requires information on the disruption of elec-tric power in various service areas over time. For the scenarioearthquake considered in this study, information on initial servicedisruption is available from the reliability analysis in Chapter 3.However, lifeline performance is only evaluated for the immedi-ate post-earthquake situation. Further assessment will be neededto estimate recovery timepaths across the affected area.
The restoration of electric power is modeled on the basis ofthree main assumptions deriving from experience in past earth-quakes. First, restoration proceeds from areas of least to areas ofheaviest damage. This assumption is based on observations fromdisasters such as the Northridge and Great Hanshin (Kobe) earth-quakes (LADWP, 1994; Chang and Taylor, 1995). Second,restoration proceeds nonlinearly, with most customers havingpower restored quickly and proportionally fewer customers beingrestored as time elapses. The restoration curve can be approxi-mated with the following functional form:
R e bct= − −1 (6.5)

87DIRECT ECONOMIC IMPACTS
where R is the percentage of customers with power restored, e isthe base of the natural logarithm, t is a time index, and b and c areconstants. Based on data from the 1994 Northridge earthquake(LADPW, 1994), b is estimated to be 2.75, where t is measured indays. In this base case, c is taken to be 1. Third, it is assumed thatthe restoration curve in Equation 6.5 can be scaled to other disas-ters through the parameter c. This scaling is based on the estimatedtime to complete restoration of the system. In the Northridge earth-quake, restoration was essentially completed in four days; in themuch more devastating Memphis scenario, a rough approxima-tion of fifteen weeks was used based on results from ATC-25. Inother words, it is assumed that post-earthquake restoration of elec-tricity service proceeds according to a general pattern or restorationcurve that can be described by Equation 6.5. While the shape ofthe restoration curve is assumed to be consistent across earth-quake events, the actual restoration timeframe may vary.
Restoration times in the various electric power service areas(EPSAs) can then be inferred. The restoration of service across thecounty can be modeled as a step function approximating Equa-tion 6.5, where each step represents restoration of service to anindividual EPSA. This is illustrated in Figure 6.2. The order in
which EPSAs arerepresented in thisstep function isdetermined by thedegree of initialdamage, since it isassumed that ser-vice is restoredsequentially fromareas of least togreatest damage.The “height” ofeach step repre-sents the share of
customers that can be found in the associated EPSA. The share ofcustomers can be approximated by the proportion of jobs the areacontains. The “width” of each step is determined by the shape ofthe overall restoration curve. In Figure 6.2, for hypothetical ser-vice areas 1 to 4 ordered from least to heaviest damage, shares of
Figure 6.2 Schematic Diagram of Restoration Curve

88 C H A P T E R 6
the total number of customers with electricity disrupted are re-spectively C1 through C4. Based on the restoration curve for thecounty, the restoration times for each service area are respectivelyt1 through t4.
In the Memphis study, results from the reliability analysis inChapter 3 were used to group the EPSAs into “impact zones” ac-cording to the degree of initial damage, as indicated by the reportedaverage ratio of available electric power. These groups, rangingfrom 1 (least damage) to 6 (greatest damage), are shown in Table6.2.
It should be noted that to be consistent with the reliabilityanalysis, electricity disruption is assumed to derive from failure ofequipment at transmission substations. Compared to other com-ponents of electric power systems such as power lines anddistribution substations, these are the most time-consuming to re-pair after an earthquake and are therefore typically a controllingfactor in the restoration of the entire system. For this reason, thefunctionality of transmission substations can be used to representthe availability of electric power in a given area.
6.4.4 Determ in ist ic vs . Probab i l ist i c
Analys i s
The methodology described up to this point is a deterministicone. In other words, it pertains to the evaluation of a scenario oflifeline service disruption. However, the methodology can bereadily extended to accommodate a probabilistic approach. Thiscan be achieved through developing a direct linkage with the re-liability analysis described in Chapter 3. In particular, the reliabilityresults include estimates of average post-earthquake availabilityof electricity by electric power service area. These estimates are
Table 6.2 Characteristics of Impact Zones

89DIRECT ECONOMIC IMPACTS
based upon Monte Carlo simulation analysis, in which the par-ticular earthquake event is repeatedly simulated to produce a seriesof lifeline disruption realizations. Each of these simulations evalu-ates the probability of malfunction of nodes within a particulartransmission substation serving that EPSA and the ensuing reduc-tion in electric power levels. Each Monte Carlo realization can beinterpreted as a “scenario” whose impact can be evaluated ac-cording to the direct economic loss methodology outlined above.In other words, each of the Monte Carlo simulations can be car-ried through to the point of evaluating the economic impact oflifeline disruption. The series of simulations can then be com-bined to yield a probabilistic estimate of economic loss.
In the application developed here, a hybrid rather than fullyprobabilistic approach was used for ease of exposition. To reducethe number of calculations required, the average disruption overthe 100 Monte Carlo simulation cases was applied directly to es-timate the associated average direct economic loss in the initialperiod. This is mathematically equivalent to estimating direct eco-nomic losses for each of the Monte Carlo simulation realizationsand taking the average over these losses. The equivalence derivesfrom the linear relationships assumed in the model and can beverified with a simple numerical example.
However, this equivalence holds only in the initial time pe-riod after the disaster, before any restoration has been completed.The restoration model described above suggests that the restora-tion timepath for a particular EPSA would differ between thesimulation cases because of variations in both the absolute amountof electric service disruption and the relative severity of this dis-ruption as compared with other EPSAs. In this sense, the restorationtimepath estimated for the “average” case does not represent res-toration in any one of the actual simulations.
However, utilization of the average electricity availability fig-ures rather than each of the underlying simulation resultsindividually can be justified on several grounds. First, the primarypurpose of this study was to develop and demonstrate a method-ology for estimating direct losses. In addition, the direct economicloss results should be compatible with the methodology for esti-mating the associated indirect economic losses. Estimating indirectlosses for each of the 100 Monte Carlo simulations would haveinvolved an excessive amount of effort and resources, as can beappreciated from reviewing the following chapter. Furthermore,

90 C H A P T E R 6
the loss-minimizing optimization methodology developed as partof the indirect loss estimation project is best applied within a de-terministic or case-study context rather than in probabilistic terms.
The preceding discussion suggests that the results of this studyshould be interpreted rather carefully. Because the analysis is notfully probabilistic, the resulting estimates of direct economic im-pacts should not be interpreted as expected values of direct lossesin a literal sense. On the other hand, because the results do notcorrespond to any one lifeline disruption scenario or even to anaverage over several scenarios (taking into account the restorationtimepath effect), they are not strictly deterministic outcomes, ei-ther. This difficulty can be resolved by keeping in mind that thepurpose of this exercise is to demonstrate a methodology. In thiscontext, the resulting estimates of direct loss can be considered asdeterministic outcomes of a particular scenario. The same wouldapply to results from the indirect loss estimation.
The meaning of the direct economic loss estimates clearlydepends upon the interpretation of the systems reliability resultsand the assumptions made above. For example, in the presentcase study, the reliability results indicate a probabilistic average ofthe percent of electric service disruption in a given service area.In other cases, reliability analysis may indicate the probability ofeither having or not having service. That is, there may be no inter-mediate damage states corresponding to partial lifeline serviceavailability. In this case, the loss factor would be
l P d r P dijts
ts
i jt ts
i= ⋅ + −( ) ( ( ))1 (6.6)
where P dts
i( ) is the probability of lifeline i disruption in area s attime t and r is the resiliency factor defined earlier. If the recoverytimepath were assumed to be the same across all areas, for ex-ample,
P d P dtTt
si
si( ) ( ) ( )= ⋅ −0 1 (6.7)
where P dsi0 ( ) is the initial probability of disruption and T is the
amount of time to full recovery, then the associated direct eco-

91DIRECT ECONOMIC IMPACTS
nomic loss estimates would represent expected values of economicloss in a probabilistic sense.
6 . 4 . 5 R e s u l t s
Results for the Memphis case study are presented here for themethodology described in Equations 6.1 and 6.3. As an illustra-tion, the pre- and post-earthquake production patterns for themanufacturing industry are shown in Figure 6.3. Production ineach EPSA is shown relative to the pre-earthquake County total.The comparison clearly demonstrates the effect of lifeline disrup-tion patterns throughout the county. Recall that electricitydisruption was most severe in the northwestern quadrant of thecounty.
Figure 6.3 Pre- and Post-Earthquake Production, Manufacturing Industry

92 C H A P T E R 6
Table 6.3 shows the estimated post-earthquake production lev-els at selected weeks after the earthquake. Post-earthquakeproduction is shown as a percent of normal output. Recall thatfull restoration of electricity service was assumed to require fif-teen weeks, based on results in ATC-25. To facilitate comparisonacross different sectors of the economy, results are presented forthe standard nine-industry classification that corresponds to one-digit Standard Industrial Classification (SIC) codes.
Initial direct impact is quite severe across all industries in theeconomy. Initial losses (week 0) range from a low of 20% in themining industry to 51% in the manufacturing industry. Most in-dustries, however, initially suffer a 40-50% loss in production dueto electricity disruption. However, with the assumed restorationpattern shown in Table 6.2, recovery proceeds more rapidly forsome industries than for others. The mining industry, for example,recovers only 9% of production in the first two weeks after thedisaster while the services industry recovers 41%. Overall, con-sidering both the degree and duration of impact, the manufacturingand services industries suffer the greatest losses.
Results of the direct loss estimation procedure described abovecan be applied to assess the indirect losses as described in thefollowing chapter. Note, however, that the actual direct loss esti-mates used in that chapter differ slightly from those presented inTable 6.3. This is because the latter use loss factors from Equation6.1 while the former use factors from Equation 6.2.
This chapter has presented a methodology for assessing directeconomic losses caused by lifeline disruption in earthquake di-sasters. This methodology synthesizes results from engineering
6.56.56.56.56.5
C o n c l u s i o n
Week Agr. Min. Con. Mfg. T.C.U. Whs. Ret. F.I.R.E. Svc. Total
012514
6277969999
806989100100
6173939999
4966899898
617295100100
537096100100
537396100100
516987100100
506691100100
5369929999
Table 6.3 Post-Earthquake Production by Industry and Week After Disaster (in %)

93DIRECT ECONOMIC IMPACTS
systems reliability analysis and socioeconomic investigation thatwere presented in previous chapters. The results consist of esti-mates of reduced post-earthquake levels of economic productionin major industries over the course of the immediate impact andrecovery periods. These results can be applied directly in the indi-rect loss estimation methodology described in the followingchapter.
As illustrated in the case study application to Memphis, thismethodology provides several significant advances over existingloss assessment techniques. First, it extends direct loss estimationto consider both the temporal and spatial dimensions of the lossand recovery process. For example, in addition to evaluating theimmediate total impact on an affected region, the methodologyconsiders how this impact is distributed across different areas withinthe region. Thus it is able to take advantage of systems engineer-ing analysis that indicates how lifeline service disruption variesacross the impacted region. In addition, it considers how the eco-nomic impact is reduced over the course of the recovery process,specifically in relation to a likely pattern of service restoration.Furthermore, economic impact is evaluated according to both theextent of lifeline service disruption and its duration. Differencesbetween industries or sectors are considered in terms of their life-line usage patterns and their resiliency to lifeline disruption.
Consideration of temporal, spatial, and sectoral dimensions ofimpact is important for several reasons. First, it improves the ac-curacy of the methodology and the reliability of the results. Thisalso has benefits for estimating the associated indirect losses. Sec-ond, it provides a means for taking into account various dimensionsof local economic conditions. In the Memphis case study, forexample, local information was used to calibrate business resil-iency to lifeline disruption, as well as the distribution of economicactivity at risk throughout Shelby County. Third, these dimensionsserve to establish the link between systems engineering analysisand macroeconomic analysis. Finally, by incorporating these di-mensions, the loss estimation methodology can evaluate anextended set of policy tools for application to loss reduction. Theseinclude both post-disaster recovery strategies and pre-disaster plan-ning, such as the prioritization of lifeline network restoration andmitigation.
In addition, the methodology developed here provides a basisfor evaluating economic impact within a probabilistic rather than
94 C H A P T E R 6
a deterministic framework. Existing methodologies evaluate eco-nomic impact in deterministic terms. The discussion in this chapterestablishes a preliminary method for utilizing engineering reli-ability results to analyze the associated economic losses inprobabilistic terms. (For reasons presented earlier, however, ahybrid rather than fully probabilistic approach was actually imple-mented in the Memphis case study.) A probability-based approachcan potentially be important for quantifying the uncertainty asso-ciated with estimates of economic loss.
In view of the preceding discussion, several important areasfor further research can be identified. The direct economic lossmethodology should be improved with more refined models andfurther empirical calibration. In particular, the accuracy of theproportional impact assumption in the loss factor model (Equa-tions 6.1 and 6.2) should be examined. The models should alsobe tested against actual earthquake experiences such as Northridgeand Kobe. In addition, the development of a probabilistic frame-work for estimating economic losses should be explored further.Particular attention should be paid to quantifying the uncertaintyassociated with the loss estimates. Sensitivity analysis could alsobe very useful for identifying both a range of probable losses andthe most influential factors determining impact. Further applica-tions of the methodology can be developed for other types oflifelines, other regions, and other natural disaster events. Anotherparticularly important area for further research consists of the in-teraction between impacts from different types of lifeline disruption(e.g, evaluating losses when both electricity and water are un-available), as well as between impacts from lifeline disruption andstructural damage. GIS technology may be very useful in facilitat-ing analysis of these interactions. Finally, attention should bepaid to developing the methodology as a loss reduction tool forinforming pre-disaster mitigation and post-disaster recovery deci-sions.
95
2
77777
R e g i o n a l E c o n o m i c
I m p a c t s
The purpose of this chapter is to present and apply a method-ology for evaluating the economic impact of a catastrophicearthquake on the Memphis economy, with special reference toindirect losses stemming from a disruption of electricity services.Electricity is one of several utilities termed “lifelines” because oftheir crucial role in maintaining social and economic systems andbecause of their network characteristics, which make them espe-cially vulnerable to disruption from natural disasters. Althoughlosses from earthquakes are often measured in terms of propertydamage resulting from the actual ground shaking, the emphasis inthis chapter is on the subsequent loss of production of goods andservices by businesses directly cut off from electricity service andby businesses indirectly affected because their suppliers or cus-tomers are without power.
This chapter builds on the work of several researchers whoseresults have been presented in previous chapters. This includesthe input-output table representation of the Memphis economypresented in Chapter 2, the electricity lifeline vulnerability analy-sis of Chapter 3, the GIS mapping of sectoral employment intoElectric Power Service Areas in Chapter 4, the analysis of businessresiliency in Chapter 5, and the estimates of direct lifeline disrup-tion losses in Chapter 6. Subsequent chapters will build on thisanalysis, to help further demonstrate the capabilities and poten-tial of a multidisciplinary effort to understand key aspects ofearthquake events and to improve society’s ability to cope withthem.
In Section 7.1, a methodology is presented to estimate totalregional economic losses when electricity lifeline services are cutback proportionately across all users as a result of a 7.5 M earth-quake in the New Madrid Seismic Zone. A methodology toestimate the optimal reallocation of scarce electricity resources is
by Adam Rose and Juan Benavides

96 C H A P T E R 7
presented in Section 7.2. A base case simulation indicates thepotential production loss over a 15-week recovery period couldamount to as much as 7% of Gross Regional Product. Realloca-tion of scarce electricity across sectors could reduce the impactsby almost 70%. Additionally, an improved restoration pattern ofelectricity transmission substations across subareas could reducelosses by more than 80%.
The analytical framework used to perform this analysis is in-terindustry economics, which includes input-output analysis, socialaccounting matrices, and linear programming (see also Chapter2). These methods are able to show how the loss of production inone sector transmits itself to other sectors through a series of mul-tiplier effects. The state-of-the-art of these tools is advanced byshowing how information on business preparedness and resiliencycan be incorporated into a basic input-output framework. A fur-ther advance is to show how a linear programming extension ofinput-output analysis can be used to evaluate alternative policiesfor rationing scarce lifeline resources. Although the attention ofthe study is confined to the Memphis area, these methodologicalcontributions are readily generalizable to other contexts.1
7 . 1 . 1 I n p u t - o u t p u t I m p a c t
A n a l y s i s
Indirect impacts can be estimated from the direct effects pre-sented in the previous chapter by using input-output impactanalysis. Assuming no resiliency adjustments for the moment,electricity lifeline disruptions due to earthquakes can be trans-lated into potential output reductions in each sector as follows:
∆X d Xj es
js
jjs
= ∑∑ w (7.1)
where
j(j = 1,...,21): economic sectors s(s = 1,...,36): electricity service areas
E s t i m a t i o n o f T o t a lR e g i o n a l I m p a c t s
7.17.17.17.17.1

97REGIONAL ECONOMIC IMPACTS
X j : gross output of sector j for the entire regiond e
s : loss factor for electricity disruption by servicearea s, 0 1≤ ≤det
s
w js : fraction of sector j output produced in region s,
w js
s=∑ 1
X js: gross output of sector j in area s before the
earthquake
However, for inclusion into an input-output model, the grossoutput changes must be converted into final demand changes be-cause the latter are the conduits through which external shocksare transmitted. A decrease in electricity availability, de , trans-lates into a change in final demand sector, ∆Yj , as follows:
∆ ∆Y I A X I A d w Xj i i es= − = −( ) ( ) (i=1,... ,21);(s=1,... ,36) (7.2)
where the symbols represent entire vectors (all sectors) and whereAi is a row vector of A, the matrix of technical coefficients, aij ,representing the value of direct input i needed to produce onedollar of output j.2
Then, the standard I-O impact formula was utilized to deter-mine total output impacts: ∆ ∆X I A Y= − −( ) 1 . Had the originalvector of ∆X sj ' been used in place of the ∆Y sj ' on the right-handside of the standard I-O impact equation, an electricity demandlevel reduction larger than the disruption level caused by the earth-quake would have been obtained (the percentage difference beingequivalent to the weighted average of the sectoral multipliers).This would mean that the available electricity would beunderutilized in the region, a nonsensical outcome for earthquakedisruptions of more than a few days, where firms have time tomodify their supplier and customer linkages so as to utilize allavailable resources. Thus, there may be no indirect effects of theutility lifeline disruption over and above the initial estimate ofelectricity curtailments in each sector and the corresponding grossoutput reductions. What may appear to be indirect effects areessentially part of the simultaneous direct impacts of electricitydisruptions in all industries. “Indirect” effects are artificially cre-ated, for computational purposes, because measured impacts are

98 C H A P T E R 7
scaled back into final demand effects (which are not equivalent todirect impacts) first and then run through the I-O model. This isdone so that the basic I-O approach can be established to buildupon for the more complex cases described below.
True indirect effects arise when electricity disruptions in somesectors are much higher than in other sectors and cause supplyinput bottlenecks other than for electricity. This can happen whena sector is heavily concentrated in one subregion that is especiallyhard-hit by an earthquake. The computation of this effect takesnote that underlying the I-O model is the concept of the fixed-coefficient production function, i.e., output is dependent on themost limited input.3 First, the initial vector of gross output lossesdue to the earthquake is examined to identify the sector with thelargest potential output reduction, which in effect becomes theconstraining input to other sectors. Then, all of the other X sj ' areadjusted to the constraining sector’s output reduction level. Ofcourse, the constraining sector would be verified to ensure that itwas really crucial to production. For example, if the entertain-ment or personal services sectors had the largest potential outputreductions due to an electricity disruption, the analysis would pro-ceed to the sector with the next highest ∆X j . Effectively, the djfor the constraining sector is used in Equation 7.3 for all sectors(except those non-crucial ones passed over).4
Resiliency bears on the computations in two ways. First, itaffects the initial estimates of output reduction in each sector. Letrej represent the resiliency of sector j to electricity disruption, where0 1≤ ≤rej . Then 1− rej represents an “importance factor” that in-dicates the dependence of sector j on electricity. For example, animportance factor of 0.9 means that every 10% decrease in elec-tricity available leads to a 9% decrease in a given sector’s output.Second, it means less electricity is needed per unit of output (be-cause of conservation potential, back-up power sources, etc.) andthus requires a decrease in the electricity input coefficient, whichis denoted by aej . Thus, a modified matrix, A* is substituted forA by multiplying the electricity input coefficient in each sector,aej , by its corresponding 1− rej factor.5
These two effects are combined to modify Equation 7.2 as fol-lows:
∆Y I A r d w Xj i ej ejs= − −( )( )* 1 (i = 1...21); (s = 1...36) (7.2a)

99REGIONAL ECONOMIC IMPACTS
Thus far, the time dimensions of the analysis have not beenexplicit. As noted in the previous section, resiliency will change(usually decrease) over time. In addition, there will be a differen-tial time path of restoration across electricity service areas. Theaforementioned impact equations are, of course, still applicable,but they have to be run for several distinct time periods associatedwith parameter changes.
7 . 1 . 2 A n a l y s i s o f S i m u l a t i o n
R e s u l t s
The basic I-O impact model from Chapter 2 was applied tothe direct disruption estimates of Chapter 4, and simulations withand without input bottleneck effects were performed. Note thatthe analysis has not been able to include all of the factors affect-ing regional economic losses. First, there is likely to be significantdamage to buildings, so that even with immediate restoration ofelectricity services, the economy would not likely revert to baselineproduction levels. Second, other lifeline services are also likelyto be disrupted, and one needs to guard against double-counting.6
The most extensive damage should be attributed to a “bottleneck”utility lifeline (in a manner analogous to the analysis of bottleneckeconomic sectors). Resiliency was probably understated by omit-ting its prospects with regard to the bottlenecked sector and byignoring the possibility of importing more crucial goods and ser-vices. In addition, many sectors can make up lost production byworking overtime shifts after electricity is restored. Finally, a short-ened disruption period due to temporary repair measures was notconsidered. On the other hand, losses have been underestimatedby not having data on transmission line and distribution line dis-ruptions. In addition, damage to electric power can cause othertypes of losses such as gas line explosions and fires, as well ashampering fire fighting and other emergency responses. Overall,many of these factors offset each other, but it can be surmised thatthe loss estimates herein are definitely in the high-end range. Notealso that the methodology can readily incorporate most of theseomitted factors when data become available or can do so withsome minor adjustments, as in the case of imports (see e.g.,Boisvert, 1992 and Cochrane, 1997). Natural disaster impactsinvolve extreme complexities, which cannot be fully understood

100 C H A P T E R 7
or modeled empirically at this time. Still, insight into an impor-tant piece of the puzzle can be provided.
Preliminary data used in these simulations are presented inthe first four columns of each of Table 7.1 and Tables Appendix7.A1-A4. Note that the final demand and output data are mea-sured on a weekly basis. The changes in gross output(“X1—Reduction”) column entries differ from table to table (pe-riod to period) because of restoration and resiliency changes overtime.
For example, during the first week (Week 0), there was a maxi-mum disruption for Shelby County (no EPSA had service restored).As shown in Table 7.1, the bottleneck sector is petroleum refining,which is highly concentrated in an EPSA that suffers the most se-vere disruption in the county. It is also a sector with a minimumof resiliency with respect to electricity inputs. For the simulation“Without Bottleneck” effects, gross output losses are the same asthe (Direct) X1—Reduction (as discussed in the previous section)and amount to a total of 49.55% ($329 million) of baseline pro-duction in Shelby County. Bottleneck effects raise this disruptionto 78.71%. Thus, the true indirect effect during Week 0 is 29.16%of gross output. Note also that the final demand numbers in thisand other tables are not just the mechanism to initiate the I-Osimulations, but also represent a measure of changes in gross re-gional product (GRP).
Simulation results for additional distinct time periods are pre-sented in Tables 7.A1-A4 and contain some interesting insights.In comparison to Week 0, the Week 1 impacts “Without Bottle-necks” are less than the Week 0 impacts, but the simulations “WithBottlenecks” are greater, because of the potential for the bottle-neck effect to worsen as resiliency deteriorates over time. Ofcourse, the results signal the wisdom of choosing a new restora-tion time path, one that favors the EPSA in which the bottleneckoccurs. This will be discussed at greater length in Section 7.2.
Non-bottleneck output reductions are reduced even furtherfor the Weeks 2-3 results (see Table 7.A3), though the bottleneckresults are the same as in Table 7.A1. Negative changes in finaldemand appear in Table 7.A2 stemming from enhanced produc-tion levels in various sectors that are not fully synchronized withintermediate output requirements, thus leaving more of the prod-uct available for final use.
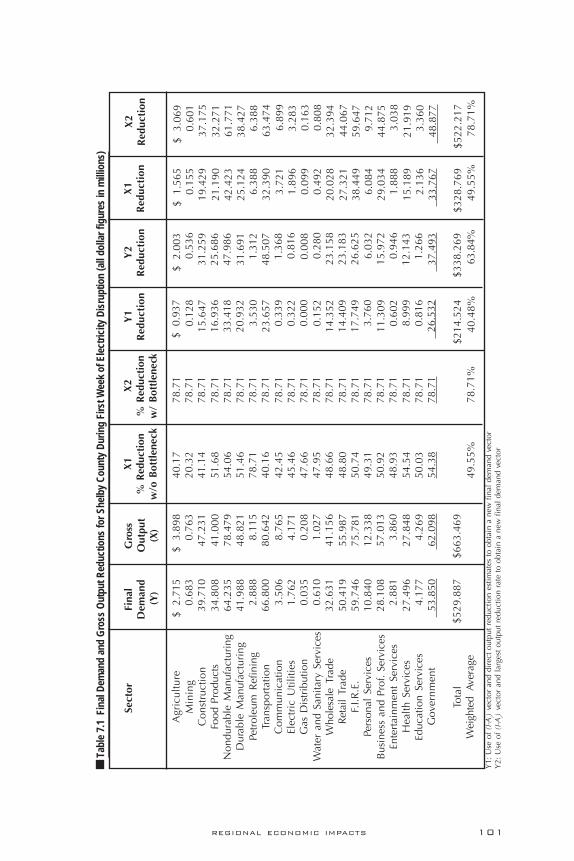
101REGIONAL ECONOMIC IMPACTS
$ 3
.898
0.76
347
.231
41.0
0078
.479
48.8
218.
115
80.6
428.
765
4.17
1 0
.208
1.02
741
.156
55.9
8775
.781
12.
338
57.0
133.
860
27.
848
4.2
69 6
2.09
8
$663
.469
$ 2
.715
0.6
8339
.710
34.
808
64.2
35 4
1.98
82.
888
66.
800
3.50
61.
762
0.03
50.
610
32.
631
50.4
19 5
9.74
6 1
0.84
028
.108
2.88
127
.496
4.1
77 5
3.85
0
$52
9.88
7
Fina
lD
eman
d (
Y)
40.1
720
.32
41.
14 5
1.68
54.0
651
.46
78.
7140
.16
42.4
545
.46
47.
6647
.95
48.
66 4
8.80
50.
74 4
9.31
50.
92 4
8.93
54.
54 5
0.03
54.3
8
X1
% R
educ
tion
w/o
Bot
tlen
eck
Gro
ssO
utpu
t(X
)
78.7
1 7
8.71
78.
71 7
8.71
78.7
178
.71
78.
71 7
8.71
78.
71 7
8.71
78.
71 7
8.71
78.
71 7
8.71
78.
71 7
8.71
78.
71 7
8.71
78.
71 7
8.71
78.
71X2
% R
educ
tion
w/
Bot
tlen
eck
$ 0
.937
0.1
2815
.647
16.9
36 3
3.41
8 2
0.93
2 3
.530
23.
657
0.3
39 0
.322
0.0
00 0
.152
14.
352
14.4
0917
.749
3.7
6011
.309
0.6
028.
999
0.8
16
26.
532
$214
.524
Y1
Red
ucti
on
$ 3
.069
0.60
1 3
7.17
532
.271
61.
771
38.4
276.
388
63.
474
6.8
993.
283
0.1
63 0
.808
32.3
94 4
4.06
759
.647
9.71
244
.875
3.0
3821
.919
3.36
0
48.8
77
$522
.217
X2
Red
ucti
on
$ 2
.003
0.5
3631
.259
25.6
8647
.986
31.6
911.
312
48.5
071.
368
0.8
160.
008
0.2
80 2
3.15
8 2
3.18
3 2
6.62
5 6
.032
15.
972
0.9
4612
.143
1.26
6
37.
493
$338
.269
Y2
Red
ucti
on
$ 1
.565
0.1
55 1
9.42
9 2
1.19
0 4
2.42
3 2
5.12
4 6
.388
32.3
903.
721
1.8
96 0
.099
0.4
92 2
0.02
827
.321
38.4
49 6
.084
29.0
341.
888
15.1
89 2
.136
33.
767
$328
.769
X1
Red
ucti
on
Agr
icul
ture
Min
ing
Con
stru
ctio
nFo
od P
rodu
cts
Non
dura
ble
Man
ufac
turi
ngD
urab
le M
anuf
actu
ring
Petr
oleu
m R
efin
ing
Tran
spor
tatio
nC
omm
unic
atio
nEl
ectr
ic U
tiliti
esG
as D
istr
ibut
ion
Wat
er a
nd S
anita
ry S
ervi
ces
Who
lesa
le T
rade
Reta
il Tr
ade
F.I.R
.E.
Pers
onal
Ser
vice
sB
usin
ess
and
Prof
. Se
rvic
esEn
tert
ainm
ent
Serv
ices
Hea
lth S
ervi
ces
Educ
atio
n Se
rvic
esG
over
nmen
t
Tota
lW
eigh
ted
Aver
age
Y1:
Use
of (
I-Ai)
vect
or a
nd d
irec
t out
put r
educ
tion
estim
ates
to o
btai
n a
new
fina
l dem
and
vect
orY
2: U
se o
f (I-A
i) ve
ctor
and
larg
est o
utpu
t red
uctio
n ra
te to
obt
ain
a ne
w fi
nal d
eman
d ve
ctor
49.5
5%78
.71%
40.4
8%49
.55%
63.8
4%
Sect
or
78.7
1%
Tabl
e 7.
1 F
inal
Dem
and
and
Gro
ss O
utpu
t Red
uctio
ns fo
r She
lby
Coun
ty D
urin
g Fi
rst W
eek
of E
lect
ricity
Dis
rupt
ion
(all
dolla
r fig
ures
in m
illio
ns)

102 C H A P T E R 7
The bottleneck tightens slightly in Week 4. However, in Weeks5-15, when power has been totally restored in all but one EPSA,the bottleneck sector changes to nondurable manufacturing. Thebottleneck effects are still five times larger than the non-bottle-neck results, but they amount to only a 3.70% reduction in grossoutput.
The results for the entire 15-week disruption period are pre-sented in Table 7.2. Note that for this presentation, the final demandand gross output figures are on an annual basis because that is thestandard time span for measuring economic changes. The resultsfor the “W/O Bottleneck” case are an overall reduction final de-mand and gross output of 1.90% and 2.28%, respectively. Thehardest hit sector in absolute terms is finance, insurance, and realestate (F.I.R.E.), with an output (sales) reduction of nearly $100million (over and above property damage stemming from the earth-quake). For the bottleneck simulations, the reductions in finaldemand and gross output are 6.97% and 8.95%, respectively. Thismeans that indirect effects overall are 6.31% of gross output, or$2.2 billion. Overall, the bottleneck effects are almost four timesthe direct (and standard total) electricity disruption effects them-selves.
Note that the choice of a 15-week restoration period is some-what arbitrary (see Chapter 6), and that the impacts would have tobe adjusted for other patterns. However, the methodology is suf-ficiently general to do this. Moreover, the interested reader coulduse the results presented in Tables 7.A1 to A4 to come up withrough estimates for alternative time periods. Finally, a major dif-ference between stock and flow losses should be emphasized.Unlike building damages, output losses are directly dependent onthe length of the restoration period.
7 . 2 . 1 L i n e a r P r o g r a m m i n g
In the previous section, the economic impact of across-the-board cutbacks (proportional rationing) of electricity to each sector
O p t i m a l R a t i o n i n g o fS c a r c e E l e c t r i c i t y
7.27.27.27.27.2

103REGIONAL ECONOMIC IMPACTS
Tabl
e 7.
2 A
nnua
l Fin
al D
eman
d an
d G
ross
Out
put i
n Sh
elby
Cou
nty
Follo
win
g El
ectri
city
Life
line
Disr
uptio
ns O
ver A
ll Ti
me
Perio
ds (i
n m
illion
s of
dol
lars
)
Agr
icul
ture
Min
ing
Con
stru
ctio
n F
ood
Prod
ucts
Non
dura
ble
Man
ufac
turi
ngD
urab
le M
anuf
actu
ring
Pet
role
um R
efin
ing
Tran
spor
tatio
n C
omm
unic
atio
n E
lect
ric
Util
ities
Gas
Dis
trib
utio
n W
ater
and
San
itary
Ser
vice
s W
hole
sale
Tra
de R
etai
l Tra
deF.
I.R.E
. P
erso
nal
Serv
ices
Bus
ines
s an
d Pr
of.
Serv
ices
Ente
rtai
nmen
t Se
rvic
es H
ealth
Ser
vice
s E
duca
tion
Serv
ices
Gov
ernm
ent
Tot
al (1
5 w
eeks
)W
eigh
ted
Avg.
Red
uctio
n
Sect
or
Bas
elin
e
Fina
lD
eman
dG
ross
Out
put
$ 1
41
36
20
65 1
810
334
0
2183
1
50
3474
1
82
92
2
32
16
97
2622
31
07
564
14
62
150
14
30
217
28
00
$275
54
$ 2
03
4
0
2456
21
32
4081
25
39
422
41
93
456
2
17
1
1
53
21
40 2
911
394
1 6
42 2
965
20
1
1448
22
2
3229
$345
00
w/
Bot
tlen
eck
w/o
Bot
tlen
eck
$ 1
85
3
6
2245
19
4937
3023
20 3
8638
33 417
198 10 49
1956
2661
3602 58
627
10 183
134
203
295
2
$315
358.
59%
Gro
ssO
utpu
t
$ 1
30
3
2
1887
16
64
3068
20
03
143
31
98
175
87
2
30
156
5
2490
29
56
529
13
71
144
13
61
210
2
587
$256
346.
97%
Fina
lD
eman
d
$ 1
99
3
924
10
2097
39
46
2480
3
89
4128
4
47
213
11
52
21
00
2859
38
45
629
28
99
197
14
09
218
31
47
$337
142.
28%
Gro
ssO
utpu
t
$ 1
39
3
5
2027
178
3 3
228
21
34
123
3428 18
0 9
1 2 3216
7125
99 3
059
557
1437 14
914
05 216
273
5
$270
311.
90%
Fina
lD
eman
d

104 C H A P T E R 7
in a given electric power service area (EPSA) was simulated. Thealternative of differential rationing of available electricity is nowconsidered to minimize total economic losses from an earthquake.Two simulations will be performed: 1) reallocation of electricityacross sectors and subregions with the previous restoration pat-tern and 2) reallocation with an optimized restoration pattern.
This problem can be formulated as one of maximizing grossregional product given constrained electricity availability, con-strained supplies of primary factors of production, and fixedtechnology. The equations are:
max Yjj
∑ (7.3)
subject to
Y I A Xi ij i= −( ) (i,j=1...21) (7.4a)
a X Y Xej js
es
es
j+ ≤∑ (s=1...36) (7.4b)
X Xjs
js
=∑ (j=1...21) (7.4c)
Y Yes
es
≤ (s=1...36) (7.4d)
X Xjs
js
≤ (s=1...36) (7.4e)
(j=1...21)
Y Cc c≥ α (c=4,7-9,19-21) (7.4f)
Y Ces
es
≥ β (s=1...36) (7.4g)
X Xjs
es, ≥ 0 (7.4h)
where
i,j(j=1...21): economic sectorss(s=1...36): electricity service areasc : necessitiese : index of the electricity sectorYe
s : final demand of electricity in area s afterthe earthquake

105REGIONAL ECONOMIC IMPACTS
Yes : final demand of electricity in area s before
the earthquakeXe
s : total electricity available in area s after anearthquake
C Cc es
, : personal consumption levels for necessi-ties for the region and electricity by areabefore the earthquake
α β, : desired minimum levels of personal con-sumption for necessities and electricity by areaafter the earthquake
and other variables are as previously defined.The objective function maximizes the sum of the final demands
over all sectors (equal to Gross Regional Product).7 Equation 7.4areflects the input-output technology matrix. Equation 7.4b speci-fies limitations on electricity availability in each serving area, s.Equation 7.4c sums sectoral gross outputs across all serving areasso the problem can be solved in an economy-wide context. Equa-tion 7.4d imposes limits on electricity availability to final demand.Equation 7.4e limits the gross output of each sector in each serv-ing area to not exceed its pre-earthquake level. Given that thereare 36 serving areas and 21 sectors, Equation set 7.4e is com-posed of 756 individual equations!8 Equations 7.4f and 7.4gguarantee minimum levels of necessities (including electricity) forhouseholds. Equation 7.4h is simply the non-negativity condi-tions of an LP problem. The LP model minimizes losses byallocating scarce electricity in such a way as to favor those sectorsthat yield the highest contribution to GRP per unit of direct plusindirect use of electricity.
Several critical assumptions underlie the implementation ofthe model. In the absence of further information, it can only beassumed that productive capacity in each sector was fully utilizedin Shelby County. That means that it is not possible for any sectorto produce output flows during the recovery period larger thanthose before the event. Note that given the absence of data at thistime, no capacity reductions have been inserted which would stemfrom damaged factories, for example. The model, however, issufficiently general to allow for excess capacity or capacity re-ductions when data are available.
Employment data serve as the proxy for output in all sectorsexcept electricity. MLGW does not have spatial billing informa-

106 C H A P T E R 7
tion, and peak load information by service area had to be used.As noted above, the fraction of the peak load by area before theearthquake was used as a proxy of the correspondent fraction ofutilization of electricity.
Household consumption of electricity by area is assumed tobe bounded from above by the pre-earthquake final demand level.With the information at hand, the vector of final demand of elec-tricity by area is unknown and cannot be consistently estimatedas the difference between total utilization by area—computed usingpeak load information—and total intermediate consumption—computed combining technical coefficients of electricity use fromthe A matrix and output by area. Data come from three differentsources, and the combination of simplifying assumptions lead toinconsistencies such as negative figures for final demand in heavilyindustrialized areas. Thus, the preliminary matrix of electricityflows by sector and area (including final demand as a sector) addto the totals given by the I-O information, but do not match totalutilization of electricity by area. This rectangular matrix of elec-tricity flows by area and sector is balanced by use of the RAS(biproportional matrix balancing) method (Bacharach, 1970).9
To impart greater realism into the model, lower bounds wereadded for personal consumption in sectors that are crucial duringemergency management—necessities, as in Rose and Benavides(1997). These sectors are food, petroleum refining, transporta-tion, communication, natural gas, water, health, education, andgovernment. Given the area-specificity of personal consumptionof electricity (i.e., residential use of electricity cannot be trans-ported across subregions), the corresponding lower bounds forthis commodity are area-specific.
7 . 2 . 2 A n a l y s i s o f S i m u l a t i o n
R e s u l t s
Gross Regional Product in Shelby County was $27.6 billion in1991, or $529.9 million per week. For the first week after anearthquake of M = 7.5 intensity, the weighted average availabilityfactor for electricity across service areas is predicted to be reducedto 49.6% for the county as a whole, with an equivalent reductionin total gross output; inclusion of bottleneck effects increases lossesto 78.7% (recall Table 7.1). In contrast, the linear programming

107REGIONAL ECONOMIC IMPACTS
model of electricity reallocation generates a total gross output re-duction of $89.5 million during Week 0, a 13.5% reduction frombaseline, and a final demand (Gross Regional Product) reductionof $66.2 million, a 12.5% reduction (see columns 3 and 4 of Table7.3). Unlike the basically proportional decrease in electricity useacross sectors in the I-O impact analysis of the preceding section,the benefit of the differential allocation is reflected in the fact thata reduction of $1 in electricity translates into only a $0.25 (12.5%÷ 49.6% x $1) reduction in Gross Regional Product.
Table 7.3 summarizes the recovery path of total gross outputand Gross Regional Product that follows from the restoration pat-tern described in the previous chapters across EPSAs over the courseof fifteen weeks. In general, the recovery path is monotonicallyincreasing for most sectors. However, some major sectoral reallo-cations do occur. For example, comparing column 4 of Table 7.4with column 7 of Table 7.2, it can be seen that electricity is shiftedaway from agriculture, food products, and durable manufacturingin favor of other sectors during Week 0. Note also that theunfavored sectors change over time as nondurable manufacturingand retail trade take on that role in Week 1.
In terms of personal consumption, the solution guarantees thathouseholds in each service area will receive at least 20% of thepre-earthquake level of electricity consumption at the instant ofthe earthquake. Services classified as necessities during an emer-gency are ensured 70% of the pre-earthquake level of personalconsumption during Week 0 as well. These service levels im-prove as electricity availability increases.10
Total economic impacts of an electric utility lifeline disrup-tion following a catastrophic earthquake in Shelby County underconditions of electricity reallocation are presented in Table 7.4,along with baseline levels and the results of other simulations.Overall, on a 52-week basis, final demand (GRP) and gross outputare reduced by 0.59% and 0.62%, respectively (see columns 5and 6), in contrast to corresponding losses of 1.90% and 2.28%under the (“Without Bottleneck”) proportional reduction case (seecolumns 3 and 4). Moreover, even with the sectoral reallocation,output levels are higher for each sector than under that case withthree minor exceptions. Overall, the improvement is 69% in finaldemand and 73% in gross output compared with the simulationof a proportional reduction of electricity across sectors.

108 C H A P T E R 7
Agr
icul
ture
Min
ing
Con
stru
ctio
n F
ood
Prod
ucts
Non
dura
ble
Man
ufac
turi
ngD
urab
le M
anuf
actu
ring
Pet
role
um R
efin
ing
Tra
nspo
rtat
ion
Com
mun
icat
ion
Ele
ctri
c U
tiliti
es G
as D
istr
ibut
ion
Wat
er a
nd S
anita
ry S
ervi
ces
Who
lesa
le T
rade
Ret
ail T
rade
F.I.
R.E
.Pe
rson
al S
ervi
ces
Bus
ines
s an
d Pr
of.
Serv
ices
Ent
erta
inm
ent
Serv
ices
Hea
lth S
ervi
ces
Edu
catio
n Se
rvic
es G
over
nmen
t
Tot
al W
eigh
ted
Aver
age
Sect
or
Bas
elin
e Le
vels
Fina
lD
eman
d
$ 2
.715
0.6
83 3
9.71
034
.808
64.2
3541
.988
2.88
866
.800
3.50
61.
762
0.03
50.
610
32.6
3150
.419
59.7
4610
.840
28.1
082.
881
27.4
964.
177
53.8
50
$529
.887
Gro
ssO
utpu
t
$ 3
.896
0.76
3 4
7.23
1 4
1.00
0 7
8.47
948
.821
8.1
15 8
0.64
2 8
.765
4.17
1 0
.208
1.0
27 4
1.15
6 5
5.98
7 7
5.78
1 1
2.33
8 5
7.01
3 3
.860
27.8
48 4
.269
62.
098
$663
.469
Wee
k 0
Red
ucti
on
Fina
lD
eman
d
$ 2
.715
0.0
00 0
.001
20.
808
0.0
0041
.988
0.0
000.
000
0.00
10.
702
-0.
001
-0.
001
0.00
10.
000
0.00
10.
000
-0.
001
0.00
00.
000
0.00
0 -
0.00
1
$66
.215
Gro
ssO
utpu
t
$ 3
.170
0.0
33 0
.576
23.
828
3.8
4844
.679
0.30
9 1
.647
0.8
64 1
.649
0.0
37 0
.070
2.4
41 0
.357
1.19
6 0
.249
3.04
1 0
.084
0.00
10.
028
1.3
48
$89.
454
Wee
k 1
Red
ucti
on
Fina
lD
eman
d
$ 0
.558
0.1
66 0
.001
12.4
646.
590
19.9
640.
000
0.00
00.
001
0.62
0-0
.001
-0.
001
0.0
0113
.753
0.0
01 0
.000
-0.0
01 0
.000
0.0
000.
000
-0.
001
$54.
116
Gro
ssO
utpu
t
$ 0
.726
0.1
91 0
.394
14.
490
9.3
68 2
1.32
3 0
.205
1.0
97 0
.656
1.2
34 0
.026
0.0
61 1
.469
14.
080
1.1
32 0
.181
2.6
16 0
.077
0.0
000.
017
1.10
8
$70.
451
Wee
k 5-
14 R
educ
tion
Fina
lD
eman
d
$ 0
.000
0.00
00.
001
0.00
01.
064
0.10
6 0
.000
0.0
00 0
.001
0.0
48 -
0.00
1 -
0.00
1 0
.001
0.0
00 0
.001
0.0
00 -
0.00
1 0
.000
0.0
00 0
.000
-0.0
01
$1.
218
Gro
ssO
utpu
t
$ -
0.00
4 0
.005
-0.0
03 0
.000
1.1
55 0
.119
-0.
006
0.01
3 0
.009
0.1
55 0
.005
0.0
11 0
.017
-0.
004
0.00
4 0
.007
0.05
0-0
.004
0.00
0 -
0.00
1 0
.039
$1.5
6512
.50%
13.4
8%10
.21%
10.6
2%0.
23%
0.24
%
Tabl
e 7.
3 F
inal
Dem
and
and
Gro
ss O
utpu
t for
She
lby
Coun
ty A
fter O
ptim
al E
lect
ricity
Rea
lloca
tion
Acro
ss S
ecto
rs: S
elec
ted
Wee
ks (i
n m
illio
ns o
f dol
lars
)

109REGIONAL ECONOMIC IMPACTS
Tabl
e 7.
4 A
nnua
l Fin
al D
eman
d an
d G
ross
Out
put i
n Sh
elby
Cou
nty
Follo
win
g El
ectri
city
Life
line
Disr
uptio
ns U
nder
Alte
rnat
ive
Resp
onse
s (in
milli
ons
of d
olla
rs)
Agr
icul
ture
Min
ing
Con
stru
ctio
nFo
od P
rodu
cts
Non
dura
ble
Man
ufac
turi
ng D
urab
le M
anuf
actu
ring
Pet
role
um R
efin
ing
Tra
nspo
rtat
ion
Com
mun
icat
ion
Ele
ctri
c U
tiliti
esG
as D
istr
ibut
ion
Wat
er a
nd S
anita
ry S
ervi
ces
Who
lesa
le T
rade
Reta
il Tr
ade
F.I.R
.E.
Per
sona
l Se
rvic
esB
usin
ess
and
Prof
. Se
rvic
es E
nter
tain
men
t Se
rvic
es H
ealth
Ser
vice
sEd
ucat
ion
Serv
ices
Gov
ernm
ent
Tot
alW
eigh
ted
Avg
. R
educ
tion
Sect
orFi
nal
Dem
and
$ 1
99
4
0 2
455
20
98
4075
247
3
422
419
1 4
55 212
11
53
2137
2911
3939
641
2893 20
114
48 2
22
322
7
$343
010.
58%
Gro
ssO
utpu
t
Prop
orti
onal
Red
uctio
n (I
-O)
Fina
lD
eman
dG
ross
Out
put
Opt
imal
Rea
lloca
tion
and
Res
tora
tion
(LP
)
Fina
lD
eman
dG
ross
Out
put
Opt
imal
Rea
lloca
tion
(LP)
$ 1
41
3
6 2
065
18
10 3
340
218
3
150
34
74
182
92
2
3
2 1
697
26
22 3
107
5
64 1
462
15
0 1
430
2
17
280
0
$275
54
$ 2
03
40
245
6
2132
40
81
2539
42
241
93 4
56 2
17 11 53
2140
2911
3941 64
229
65 201
1448 22
2 3
229
$345
00
$ 1
39
3
5
2027
178
3 3
228
213
4
123
34
28
180
91
2
32
167
1 2
599
305
9
557
14
37
149
14
05
216
2
735
$270
311.
90%
$ 1
99 39
241
0 2
097
394
624
80 389
412
844
721
3 11
5221
0028
5938
45 629
2899
197
1409
218
314
7
$33
714
2.28
%
$ 1
38
3
5 2
065
177
7 3
311
210
2
150
3474 18
2 89 2 3
216
9726
0831
07 5
6414
62 150
143
021
7
280
0
$273
91 0
.59%
$ 1
99
3
924
55
2094
4042
24
52 4
2141
90 4
53 211
11
53
2135
289
739
38 641
295
720
114
48 222
322
6
$342
860.
62%
$ 1
38 35
206
517
8033
40 2
121
150
3474
182
90 2 32
1697
262
231
07 5
6414
62 150
143
0 2
17 2
800
$274
57 0
.35%
Gro
ssO
utpu
tFi
nal
Dem
and
Bas
elin
e Le
vels

110 C H A P T E R 7
The restoration of electricity service in each EPSA has thus farfollowed a reasonable rule—those substations with the lowest prob-ability or extent of damage are restored first. This implicitlymaximizes the amount of electricity restored per unit of repairdollar. However, some EPSAs potentially contribute more to GRPper unit of electricity than others, and this is a superior basis foridentifying restoration priorities.
The optimal restoration pattern was simulated by using theshadow prices that stem from the dual of the LP solution referredto above. These shadow prices have the usual economic interpre-tation that Gross Regional Product would grow by the amount ofthe shadow price if one additional unit of electricity were avail-able in the corresponding area and were utilized by the sectorwith the highest contribution to GRP (directly and indirectly) perunit of electricity.
Shadow prices for each week of the original LP simulation arepresented in Table 7.A5. (These shadow prices represent the valueof electricity when it is efficiently allocated.) In Week 1, restora-tion in EPSAs are substituted with the highest shadow prices in theoriginal LP, but not exceeding the total megawatts of restored power(or repair dollars) of the original simulation.11 This involves shift-ing efforts from EPSAs 1, 43, 64, and 72 to EPSAs 2, 4, and 13.This has the effect of yielding a restoration of GRP to 99.97% ofbaseline by Weeks 2/3 (in contrast to 98.05% in the original LPsimulation and 91.96% in the I-O simulations of Section 7.1).
The timepaths for the three different types of responses arepresented in Figure 7.1 and clearly depict the superiority of real-locating electricity both across sectors and across areas. The verynature of the strict concavity (i.e., it increases at a decreasing rate)
Figure 7.1 Economic Recovery in Shelby County Under Alternative Responses

111REGIONAL ECONOMIC IMPACTS
of the optimal recovery/restoration timepath is another indicatorof its capability to optimize resource use over time. The shadowprices of the new LP simulation are in general lower than theshadow prices corresponding to the original LP solution. This isthe dual expression of the result that society is better off in termsof GRP (the primal objective function). Note also that in the origi-nal LP, shadow prices increase in several areas between Weeks 0and 1, which indicates that restoration is not optimal in the dy-namic sense.12
The results on a sector-by-sector basis of the optimal restora-tion LP are also presented in the last two columns of Table 7.3.Note that some significant sector reallocations do take place inthat the gross output of business and professional services is lowerin the spatial/sectoral reallocation simulations than in the puresectoral reallocation case.13 Overall, final demand and gross out-put losses can be reduced to 0.35% and 0.58% of annual baselinelevels. The GRP improvement is only 0.24%, or $66 million andonly a modest improvement over the first LP case.. However, it isnot difficult to imagine cases where this gap is likely to be muchhigher. Not taking advantage of these and the previously discussedreallocation opportunities results in losses as devastating as if theearthquake actually toppled the buildings in which the lost pro-duction would have originated.
7 . 2 . 3 P o l i c y I m p l i c a t i o n s
Currently, in the electric utility industry, earthquake recoveryplans are at a rudimentary stage with respect to economic criteria.Network managers’ experience is limited to less sophisticatedprioritization schemes for cases of brownouts or blackouts that donot require maintenance or restoration but orderly switching ma-neuvers. Given the short duration of the usual restoration efforts,typical contingency plans or algorithms are prioritized accordingto ease of restoration or size of subarea outage (equivalent to thedirect impact on output), regardless of location. This would beclearly suboptimal as illustrated by the simulations.
The challenge for utilities such as MLGW is to implement apolicy instrument to help attain a socially optimal outcome, whichhas been defined as minimizing Gross Regional Product losses.Implementation requires a mechanism to allocate scarce electric-

112 C H A P T E R 7
ity supplies combining optimal pricing information (as given bythe shadow prices) with a feasible form of load management.
Priority electricity service can be provided by a number ofmeans. In the basic interruptible service contract, or market, al-ternative, each customer subscribes to a particular level of capacitybefore the earthquake. The customer pays an interruptibility pre-mium, or capacity charge, for this amount and a usage fee foreach unit actually consumed. If usage exceeds subscribed capac-ity, a circuit breaker, for example, could activate, curtailingadditional consumption. Because customers differ according totheir willingness to pay for electricity, those with a stronger de-mand would ideally buy larger fuse sizes. The utility has two rolesin this scheme: to set usage and fuse prices so as to optimize re-source allocation, and to guarantee enough capacity to meet thetotal required by customers’ selections of fuse size. Load man-agement is achieved by a decentralized system in which consumersration themselves.14
In contrast to the above examples of price rationing, an alter-native approach that gains significance as the size and duration ofthe disruption increases, is direct quantity rationing. This is some-times overlooked as an option because of the technological featuresof electricity lifelines, i.e., unlike water, where the flow can bereduced, electric power is either on or off. Power system shut-offto individual customers is not always feasible, but there are othermechanisms. A good example stems from a recent response tothe extreme winter in the eastern United States. In late January1994, in Pennsylvania, utilities instituted rolling blackouts. In ad-dition, the governor issued a decree (at the request of the utilities)closing state government offices and requiring nonessential in-dustry to close down until the emergency was over.15
Overall rationing need not be heavy-handed; instead, it canbe based on market incentives, such as pricing. However, policy-makers still need to overcome the problem that occurs whencustomers make choices according to their own private costs andignore social costs of disruptions, thus leading to market failure(see, e.g., Rose and Benavides, 1997). The use of shadow pricesderived from a social cost optimizing methodology in place ofinterruptibility assessments made by individual firms under con-ditions of myopia (i.e., inability to calculate the general equilibriumramifications of its actions) would be a first step. It may take asystem of taxes/subsidies to induce firms to use them, however. It

113REGIONAL ECONOMIC IMPACTS
is also worthwhile to consider a combination of policy instruments,as, for example, the use of rationing for highest priority custom-ers, such as hospitals and government emergency servicedepartments, and pricing methods for the remainder of theeconomy.
C o n c l u s i o n
7.37.37.37.37.3
A methodology for estimating the regional economic lossesfrom earthquake damaged electric utility lifelines has been devel-oped and applied. It is shown that ordinary input-output impactanalysis would overestimate losses for simple cases and underes-timate them when production bottlenecks occur elsewhere in theeconomy. It was also shown how losses could be reduced morethan threefold by reallocating scarce electricity according to theresults of a specially designed linear programming model and howlosses could be reduced fourfold by optimizing the sequence ofrecovery of electricity substations according to the time trend ofthe LP model shadow prices. Given the probabilistic nature of thevunerability estimates of previous chapters and various additionaluncertainties introduced in this one, the results are only intendedas illustrative.
The models and results should be especially useful to econo-mists, planners, and engineers in making decisions on mitigationmeasures and implementing recovery policies. Although the analy-sis was applied to an earthquake in Memphis, Tennessee, it can bereadily generalized to other regions and to other types of naturalhazards.

114 C H A P T E R 7
Gro
ssO
utpu
t(X
)
X1
% R
educ
tion
w/o
Bot
tlen
eck
X2
% R
educ
tion
w/
Bot
tlen
eck
Y1
Red
ucti
onY
2 R
educ
tion
X1
Red
ucti
onX
2R
educ
tion
$ 3
.90
0.7
647
.23
41.
00 7
8.48
48.
82 8
.12
80.6
4 8
.77
4.1
7 0
.21
1.0
341
.16
55.
99 7
5.78
12.3
457
.01
3.86
27.
854.
27
62.
10
$663
.49
0.23
9 0
.315
0.2
780.
347
0.3
71 0
.308
0.8
250.
273
0.29
50.
495
0.52
20.
467
0.31
30.
282
0.31
70.
291
0.32
9 0
.287
0.43
10.
323
0.4
22
0.82
5 0
.825
0.8
250.
825
0.8
25 0
.825
0.8
25 0
.825
0.8
250.
825
0.82
50.
825
0.82
50.
825
0.82
50.
825
0.8
250.
825
0.82
50.
825
0.82
5
$ 0
.52
0.21
10.
51 1
1.39
23.0
412
.28
4.74
16.
11 0
.35
1.02
0.0
4 0
.25
9.10
7.04
10.1
62.
037.
030.
257.
760.
4821
.31
$145
.61
$ 2
.10
0.56
32.
76 2
6.92
50.3
033
.21
1.38
50.8
51.
440.
860.
010.
2924
.28
24.
3027
.90
6.33
16.7
30.
9912
.73
1.33
39.
30
$354
.563
$ 0
.93
0.2
4 1
3.13
14.
23 2
9.12
15.0
4 6
.70
22.
01 2
.59
2.0
6 0
.11
0.4
812
.88
15.7
9 2
4.02
3.5
9 1
8.76
1.1
112
.00
1.3
8 2
6.21
$222
.38
$ 3
.22
0.6
3 3
8.96
33.
83 6
4.75
40.
28 6
.70
66.
53 7
.24
3.4
4 0
.17
0.8
5 3
3.96
46.1
962
.52
10.1
847
.03
3.1
822
.98
3.5
251
.23
$547
.38
Y1:
Use
of (
I-Ai)
vect
or a
nd d
irec
t out
put r
educ
tion
estim
ates
to o
btai
n a
new
fina
l dem
and
vect
orY
2: U
se o
f (I-A
i) ve
ctor
and
larg
est o
utpu
t red
uctio
n ra
te to
obt
ain
a ne
w fi
nal d
eman
d ve
ctor
33.5
2%82
.50%
27.4
8%66
.91%
33.
52%
Sect
orFi
nal
Dem
and
(Y)
$ 2
.72
0.6
839
.71
34.
8164
.23
41.
99 2
.89
66.8
03.
51 1
.76
0.0
3 0
.61
32.
6350
.42
59.7
5 1
0.84
28.
11 2
.88
27.
50 4
.18
53
.85
$529
.90
Agr
icul
ture
Min
ing
Con
stru
ctio
n F
ood
Prod
ucts
Non
dura
ble
Man
ufac
turi
ng D
urab
le M
anuf
actu
ring
Petr
oleu
m R
efin
ing
Tra
nspo
rtat
ion
Com
mun
icat
ion
Elec
tric
Util
ities
Gas
Dis
trib
utio
nW
ater
and
San
itary
Ser
vice
sW
hole
sale
Tra
de R
etai
l Tra
deF.
I.R.E
.Pe
rson
al S
ervi
ces
Bus
ines
s an
d Pr
of.
Serv
ices
Ente
rtai
nmen
t Se
rvic
esH
ealth
Ser
vice
sEd
ucat
ion
Serv
ices
Gov
ernm
ent
Tot
alW
eigh
ted
Aver
age
82.5
0%
Tabl
e 7.
A1 T
otal
Impa
ct S
imul
atio
n fo
r She
lby
Coun
ty:
Wee
k 1,
Zon
e 1
Reco
vere
d (a
ll do
llar f
igur
es in
mill
ions
)

115REGIONAL ECONOMIC IMPACTS
$ 2
.10
0.56
32.
7626
.92
50.3
033
.21
1.38
50.8
51.
44 0
.75
0.0
1 0
.29
24.
2824
.30
27.9
06.
3316
.73
0.99
12.7
31.
33 3
9.30
$354
.46
Sect
orFi
nal
Dem
and
(Y)
Gro
ssO
utpu
t(X
)
X1
% R
educ
tion
w/o
Bot
tlen
eck
X2
% R
educ
tion
w/
Bot
tlen
eck
Y1
Red
ucti
onY
2 R
educ
tion
X1
Red
ucti
onX
2R
educ
tion
Agr
icul
ture
Min
ing
Con
stru
ctio
n F
ood
Prod
ucts
Non
dura
ble
Man
ufac
turi
ng D
urab
le M
anuf
actu
ring
Petr
oleu
m R
efin
ing
Tra
nspo
rtat
ion
Com
mun
icat
ion
Elec
tric
Util
ities
Gas
Dis
trib
utio
nW
ater
and
San
itary
Ser
vice
sW
hole
sale
Tra
de R
etai
l Tra
deF.
I.R.E
.Pe
rson
al S
ervi
ces
Bus
ines
s an
d Pr
of.
Serv
ices
Ente
rtai
nmen
t Se
rvic
esH
ealth
Ser
vice
sEd
ucat
ion
Serv
ices
Gov
ernm
ent
Tot
alW
eigh
ted
Aver
age
$ 2
.72
0.6
839
.71
34.
8164
.23
41.
99 2
.89
66.8
03.
51 1
.76
0.0
3 0
.61
32.
6350
.42
59.7
5 1
0.84
28.
11 2
.88
27.
50 4
.18
53
.85
$529
.90
$ 3
.90
0.7
647
.23
41.
00 7
8.48
48.
82 8
.12
80.6
4 8
.77
4.1
7 0
.21
1.0
341
.16
55.
99 7
5.78
12.3
457
.01
3.86
27.
854.
27
62.
10
$663
.49
0.82
5 0
.825
0.8
250.
825
0.8
25 0
.825
0.8
25 0
.825
0.8
250.
825
0.82
50.
825
0.82
50.
825
0.82
50.
825
0.8
250.
825
0.82
50.
825
0.82
5
$ 3
.22
0.6
3 3
8.96
33.
83 6
4.75
40.
28 6
.70
66.
53 7
.24
3.4
4 0
.17
0.8
5 3
3.96
46.1
962
.52
10.1
847
.03
3.1
822
.98
3.5
251
.23
$547
.39
Y1:
Use
of (
I-Ai)
vect
or a
nd d
irec
t out
put r
educ
tion
estim
ates
to o
btai
n a
new
fina
l dem
and
vect
orY
2: U
se o
f (I-A
i) ve
ctor
and
larg
est o
utpu
t red
uctio
n ra
te to
obt
ain
a ne
w fi
nal d
eman
d ve
ctor
0.04
3 0
.107
0.0
680.
000
0.14
50.
076
0.8
25 0
.040
0.0
92 0
.000
0.0
000.
000
0.04
5 0
.044
0.1
32 0
.055
0.0
990.
035
0.14
30.
047
0.1
18
$ 0
.08
0.07
2.4
5 -
0.25
9.8
2 2
.98
6.2
5 1
.94
0.3
1 -
0.27
-0.
02 -
0.06
0.9
80.
276.
280.
29 2
.62
-0.
08 2
.89
-0.
03 6
.07
$42.
59
$ 0
.17
0.0
8 3
.21
0.0
011
.38
3.71
6.70
3.2
3 0
.81
0.00
0.00
0.00
1.85
2.46
10.0
00.
685.
640.
143.
980.
207.
33
$61.
579.
28%
82.5
0%8.
04%
66.8
9%9.
28%
82.5
0%
Tabl
e 7.
A2 T
otal
Impa
ct fo
r She
lby
Coun
ty: W
eek
2-3,
Zon
e 2-
4 Re
cove
red
(all
dolla
r fig
ures
in m
illio
ns)

116 C H A P T E R 7
Sect
orFi
nal
Dem
and
(Y)
Gro
ssO
utpu
t(X
)
X1
% R
educ
tion
w/o
Bot
tlen
eck
X2
% R
educ
tion
w/
Bot
tlen
eck
Y1
Red
ucti
onY
2 R
educ
tion
X1
Red
ucti
onX
2R
educ
tion
Agr
icul
ture
Min
ing
Con
stru
ctio
n F
ood
Prod
ucts
Non
dura
ble
Man
ufac
turi
ng D
urab
le M
anuf
actu
ring
Petr
oleu
m R
efin
ing
Tra
nspo
rtat
ion
Com
mun
icat
ion
Elec
tric
Util
ities
Gas
Dis
trib
utio
nW
ater
and
San
itary
Ser
vice
sW
hole
sale
Tra
de R
etai
l Tra
deF.
I.R.E
.Pe
rson
al S
ervi
ces
Bus
ines
s an
d Pr
of.
Serv
ices
Ente
rtai
nmen
t Se
rvic
esH
ealth
Ser
vice
sEd
ucat
ion
Serv
ices
Gov
ernm
ent
Tot
alW
eigh
ted
Aver
age
$ 2
.72
0.6
839
.71
34.
8164
.23
41.
99 2
.89
66.8
03.
51 1
.76
0.0
3 0
.61
32.
6350
.42
59.7
5 1
0.84
28.
11 2
.88
27.
50 4
.18
53
.85
$529
.90
$ 3
.90
0.7
647
.23
41.
00 7
8.48
48.
82 8
.12
80.6
4 8
.77
4.1
7 0
.21
1.0
341
.16
55.
99 7
5.78
12.3
457
.01
3.86
27.
854.
27
62.
10
$663
.49
Y1:
Use
of (
I-Ai)
vect
or a
nd d
irec
t out
put r
educ
tion
estim
ates
to o
btai
n a
new
fina
l dem
and
vect
orY
2: U
se o
f (I-A
i) ve
ctor
and
larg
est o
utpu
t red
uctio
n ra
te to
obt
ain
a ne
w fi
nal d
eman
d ve
ctor
0.04
3 0
.161
0.0
680.
000
0.1
470.
077
0.8
37 0
.042
0.0
960.
000
0.0
00 0
.000
0.0
46 0
.044
0.1
39 0
.055
0.0
99 0
.035
0.1
440.
047
0.1
19
0.83
7 0
.837
0.8
37 0
.837
0.8
37 0
.837
0.83
7 0
.837
0.8
37 0
.837
0.83
7 0
.837
0.8
37 0
.837
0.8
37 0
.837
0.8
370.
837
0.83
70.
837
0.8
37
$ 0
.08
0.11
2.4
3-0
.25
9.95
3.03
6.34
2.0
7 0
.33
-0.
28-0
.02
-0.
06 1
.01
0.24
6.7
3 0
.29
2.58
-0.
08 2
.90
-0.0
36.
11
$43.
48
$ 2
.13
0.5
733
.24
27.3
2 5
1.03
33.7
01.
4051
.58
1.46
0.73
0.0
1 0
.30
24.6
3 2
4.65
28.
316.
4216
.98
1.0
012
.91
1.35
39.
87
$359
.59
$ 0
.17
0.12
3.2
1 0
.00
11.
54 3
.76
6.8
03.
39 0
.84
0.00
0.0
00.
001.
892.
4610
.53
0.68
5.64
0.1
4 4
.01
0.2
0 7
.39
$62.
77
$ 3
.26
0.64
39.5
334
.32
65.6
940
.86
6.80
67.5
0 7
.34
3.49
0.1
8 0
.86
34.
4546
.86
63.4
310
.33
47.7
2 3
.23
23.3
13.
5751
.98
$555
.35
9.46
%83
.70%
8.21
%67
.86%
9.46
%83
.70%
Tabl
e 7.
A3
I-O A
naly
sis
for S
helb
y Co
unty
: Wee
k 4,
Zon
e 2-
4 Re
cove
red,
with
Diff
eren
t Res
ilien
ce a
t Wee
k 4
(all
dolla
r fig
ures
in m
illio
ns)
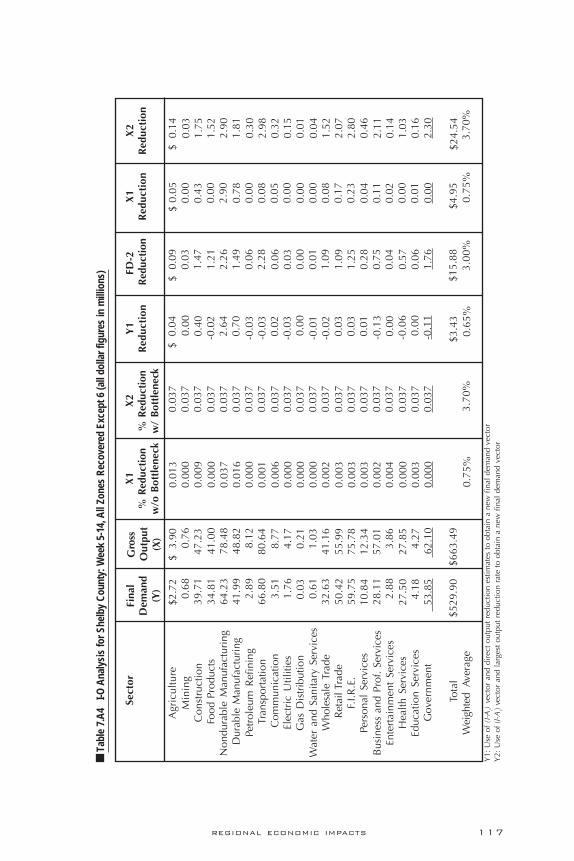
117REGIONAL ECONOMIC IMPACTS
Tabl
e 7.
A4
I-O A
naly
sis
for S
helb
y Co
unty
: Wee
k 5-
14, A
ll Zo
nes
Reco
vere
d Ex
cept
6 (a
ll do
llar f
igur
es in
mill
ions
)
Sect
orFi
nal
Dem
and
(Y)
Gro
ssO
utpu
t(X
)
X1
% R
educ
tion
w/o
Bot
tlen
eck
X2
% R
educ
tion
w/
Bot
tlen
eck
Y1
Red
ucti
onFD
-2 R
educ
tion
X1
Red
ucti
onX
2R
educ
tion
Agr
icul
ture
Min
ing
Con
stru
ctio
n F
ood
Prod
ucts
Non
dura
ble
Man
ufac
turi
ng D
urab
le M
anuf
actu
ring
Petr
oleu
m R
efin
ing
Tra
nspo
rtat
ion
Com
mun
icat
ion
Elec
tric
Util
ities
Gas
Dis
trib
utio
nW
ater
and
San
itary
Ser
vice
sW
hole
sale
Tra
de R
etai
l Tra
deF.
I.R.E
.Pe
rson
al S
ervi
ces
Bus
ines
s an
d Pr
of.
Serv
ices
Ente
rtai
nmen
t Se
rvic
esH
ealth
Ser
vice
sEd
ucat
ion
Serv
ices
Gov
ernm
ent
Tot
alW
eigh
ted
Aver
age
Y1:
Use
of (
I-Ai)
vect
or a
nd d
irec
t out
put r
educ
tion
estim
ates
to o
btai
n a
new
fina
l dem
and
vect
orY
2: U
se o
f (I-A
i) ve
ctor
and
larg
est o
utpu
t red
uctio
n ra
te to
obt
ain
a ne
w fi
nal d
eman
d ve
ctor
$2.7
2 0
.68
39.
71 3
4.81
64.
23 4
1.99
2.8
9 6
6.80
3.5
1 1
.76
0.03
0.6
1 3
2.63
50.
42 5
9.75
10.8
4 2
8.11
2.8
827
.50
4.18
53.
85
$529
.90
$ 3
.90
0.7
647
.23
41.
00 7
8.48
48.
82 8
.12
80.6
48.
774.
170.
211.
0341
.16
55.9
975
.78
12.3
457
.01
3.86
27.8
54.
27 6
2.10
$663
.49
0.01
3 0
.000
0.00
90.
000
0.0
370.
016
0.00
00.
001
0.00
60.
000
0.00
00.
000
0.00
20.
003
0.00
30.
003
0.00
20.
004
0.00
00.
003
0.0
00
0.03
70.
037
0.03
70.
037
0.03
70.
037
0.03
70.
037
0.03
70.
037
0.03
70.
037
0.03
70.
037
0.03
70.
037
0.03
70.
037
0.03
70.
037
0.03
7
$ 0
.04
0.
000.
40
-0.0
22.
640.
70 -
0.03
-0
.03
0.02
-0.
03
0.00
-0.
01 -
0.02
0.03
0.03
0.01
-0.1
3
0.0
0-0
.06
0.
00-0
.11
$3.4
3
$ 0
.09
0.03
1.47
1.21
2.26
1.49
0.06
2.28
0.06
0.03
0.00
0.01
1.09
1.09
1.25
0.28
0.75
0.04
0.57
0.06
1.76
$15.
88
$ 0.
050.
000.
430.
002.
900.
780.
000.
080.
050.
000.
000.
000.
080.
170.
230.
040.
110.
020.
000.
010.
00
$4.9
5
$ 0
.14
0.03
1.75
1.52
2.90
1.81
0.30
2.98
0.32
0.15
0.01
0.04
1.52
2.07
2.80
0.46
2.11
0.14
1.03
0.16
2.30
$24.
540.
75%
3.70
%0.
65%
3.00
%0.
75%
3.70
%

118 C H A P T E R 7
017
2.07
018
0.78
0 0 0 017
1.98
163.
070 0 0 0 0 0 0 0
Are
aW
eek
0
1 2 3 4 5 6 7 11 13 14 15 21 23 25 26 27 28 38
170.
3317
0.33
170.
3317
0.33
170.
3317
0.33
170.
3317
0.33
170.
3317
0.33
170.
3317
0.33
170.
3317
0.33
170.
3317
0.33
170.
3317
0.33
170.
3317
0.33
170.
3317
0.33
170.
3317
0.33
170.
3317
0.33
170.
3317
0.33
170.
3317
0.33
170.
3317
0.33
170.
3317
0.33
170.
3317
0.33
Ori
gina
lN
ewN
ewO
rigi
nalW
eek
1
017
8.4
178.
417
8.4
178.
417
8.4
178.
461
.57
178.
417
8.4
178.
417
8.4 0 0
61.3
5 0 0 0
65.4
4 016
3.81
016
3.81
163.
8116
3.81
63.2
3 016
3.81
163.
8116
3.81
0 063
.05 0 0 0
Wee
k 4
Ori
gina
lN
ew
017
2.07 0
180.
78 0 0 0 017
1.98
163.
07 0 0 0 0 0 0 0 0
10.
040 0 0 0 0 0 0 1 0 0 0 0 0 0 0 0
Wee
k 2-
3W
eek
5-14 N
ewN
ewO
rigi
nal
Ori
gina
l
10.
040 0 0 0 0 0 0 1 0 0 0 0 0 0 0 0
0 0 0 0 0 0 0 012
8.59 0 0 0 0 0 0 0 0 0
0 0 0 0 0 0 0 0 0 0 0 0 0 0 0 0 0 0
Tabl
e 7.
A5
Shad
ow P
rices
for E
lect
ricity
by
Serv
ice
Area

119REGIONAL ECONOMIC IMPACTS
0 0 0 0 0 0 0 0 0 0 0 0 016
7.17
0 0 0 0
Are
aW
eek
0
41 42 43 44 45 46 47 48 49 55 61 64 66 67 68 71 72 74
170.
3317
0.33
170.
3317
0.33
170.
3317
0.33
170.
3317
0.33
170.
3317
0.33
170.
3317
0.33
170.
3317
0.33
170.
3317
0.33
170.
3317
0.33
170.
3317
0.33
170.
3317
0.33
170.
3317
0.33
170.
3317
0.33
170.
3317
0.33
170.
3317
0.33
170.
3317
0.33
170.
3317
0.33
170.
3317
0.33
Ori
gina
lN
ewN
ewO
rigi
nalW
eek
1
1 0 0 016
4.53
100.
95 0 117
8.4 0
178.
4 0 017
8.4 0 0 0 0
0 0 0 0 0 0 0 0 0 0 0 0 016
7.17
0 0 0 0
Wee
k 4
Ori
gina
lN
ew
63.0
5 063
.05 0
163.
8197
.15 0
63.0
516
3.81 0
163.
8163
.05 0
163.
81 0 063
.05 0
0 0 1 0 0 0 0 0 0 0 0 1 0 1 0 0 1 0
Wee
k 2-
3W
eek
5-14 N
ewN
ewO
rigi
nal
Ori
gina
l
0 0 1 0 0 0 0 0 0 0 0 1 0 1 0 0 1 0
0 0 0 0 0 0 0 0 0 0 0 0 0 0 0 0 0 0
0 0 1 0 0 0 0 0 0 0 0 0 0 0 0 0 0 0

120 C H A P T E R 7
1. The approach taken herein is that of interindustry analysis (see thebrief review in Chapter 2). Other approaches to estimating eco-nomic impacts of disasters are found in the literature. Regionaleconometric models, for example, have been successfully applied tovarious aspects of actual and simulated disaster impacts by Chang(1983), Ellson et al. (1984), and Guimaraes et al. (1993). However,this approach does not lend itself readily to tracing the linkage be-tween lifelines and the regional macroeconomy. The analysispresented here differs from most of the econometric studies and someof the interindustry studies in that it simulates the impacts of a hypo-thetical event, as opposed to estimating the impacts of an actualdisaster or of the reconstruction spending in its aftermath. The meth-odology is sufficiently general, however, to undertake both an exante and ex post impact analysis, as well as optimal planning. In theex post context, actual data on lifeline outages can be used insteadof engineering simulation data (see Rose and Lim, 1997).
2. The computations are performed with an I-O table closed with re-spect to (i.e., including) households. Those familiar with I-O analysismay find Equation 7.2 a bit unusual at first glance. The typical con-version of any individual sector’s gross output into final demand isdone by dividing the former by the element bjj , a diagonal term ofthe closed Leontief Inverse (see, e.g., Miller and Blair, 1985). How-ever, when more than one element is adjusted, there are interactioneffects in the ensuing computations. Therefore, the row vector( )I Ai− is used.
3. Note, there is strong disagreement about the realism of the fixedcoefficient production function in general, but strong agreement ofits relevance in the very short-run, such as the timespan of electricityoutages stemming from earthquakes.
4. Note that the alternative is to use a supply-side input-output analysis(see, e.g., Davis and Salkin, 1984, for an application to water short-ages). However, given the dispute over the conceptual soundnessand accuracy of this approach (see, e.g., Oosterhaven, 1988; Roseand Allison, 1989), we have chosen to follow the less complicatedprocedure above.
N o t e s

121REGIONAL ECONOMIC IMPACTS
5. In the short term, backup power, conservation, and similar responsesrequire only an adjustment in the αej . For the case of substitution ofother fuels for electricity, there would be a need to adjust other tech-nical coefficients as well.
6. The methodology does take into account some, although not all,interactions between lifelines. For example, electricity is needed topump water, and the model is able to provide a rough estimate of theensuing direct losses to water lifeline capability and subsequent in-direct effects for normal use. However, there are some extraordinarycircumstances the model cannot account for, e.g., lack of power forpumping water may force the evacuation of upper floors of tall build-ings, which cannot be protected from fire, thereby causing still furtherbusiness disruptions.
7. For examples of other welfare criteria that might be used as the basisfor allocating scarce lifeline resources, see Cole (1995). Note alsothat the constraints in the model also guarantee necessary amountsof basic necessities such as food and health services.
8. The specification of these equations is expedited by the formattingconventions of the General Algebraic Modeling System (GAMS) Soft-ware (Brooke et al., 1988) which was used for the simulations.
9. Each RAS iteration consists of first multiplying each row by the ratioof the desired and the current row totals, and then multiplying eachcolumn by the ratio of the desired and the current column totals.After each iteration, a decision was made to go ahead or to stop bychecking the precision in the row totals. Under mild conditions (suchas non-negativity of the initial table figures), the method convergedquite rapidly to the desired precision. In essence, the RAS methodenabled us to estimate the pre-earthquake vector of final demand ofelectricity by area, y s
e, and the matrix of technical coefficients of
electricity by sector j and area s, aejo . These coefficients are found
after dividing the balanced matrix of electricity input flows by outputin each sector and area. The deviations between elements of thematrix of aej
o and the counterpart aje elements were minor.
10. These results can be contrasted with the implications of the 2-sector,2-factor Rybczynski Theorem (see e.g., Silberberg, 1990). Theoremestablishes that if the endowment of some resource (electricity) in-creases, the industry that uses that resource most intensively willincrease its output while the other industry will decrease its output.In the case study, increments in electricity availability were accom-
122 C H A P T E R 7
panied by output additions in sectors that use electricity more inten-sively. However, output reductions were found only temporarily inGovernment. This is a typical interindustry effect: output from otherindustries (in turn inputs to other industries) increase as electricityavailability improves. In the majority of the cases, increments inelectricity were sufficient to generate an increase in output for allsectors. The exception reflects trade-offs in EPSAs where Govern-ment must compete with sectors using electricity most intensively, inthe presence of uneven input increments.
11. For simplicity, a fixed total time to fully restore electricity in the re-gion, a linear repair intensity, and equivalent restoration efforts byMW were assumed. This is equivalent to repairing a constant amountof MWs per week. Those MW are denominated in “repair dollars.”With that in mind, the policy is: at each period, devote your efforts torestore those electricity power areas that yield the highest shadowprice of electricity, such that the repaired MWs at each period do notadd up to more than the repair intensity.
12. The shadow prices can take on three distinct sets of values: λ ≥1,indicating that the availability of one more dollar of electricity isbeing used for intermediate goods production; λ = 1, implying thearea is fully using its productive capacity and on additional unit ofelectricity goes directly to final demand; and λ = 0 , indicating thatthe area is being provided with the pre-earthquake electricity ser-vices and thus this input is not locally scarce.
13. The small incremental improvement of the second LP simulation maybe surprising at first glance. This is partly due to the spatial configu-ration of the MLGW electricity network. But more generally, it isdue to the fact that the sectoral reallocations for the first LP simula-tions implicitly capitalize on most of the spatial reallocationpossibilities of the problem at hand. It was expected that the substa-tion restoration simulations would be more prominent in regions withless sectoral adjustment flexibilities, i.e., regions with less uniformlydistributed sectors spatially or those with few sectors.
14. This scheme, however, must be supplemented by a contingent rulethat will be put into operation when a supply shock reduces capacitybeyond the rated fuse sizes of all customers. A simple and realisticmodification to this scheme would be to introduce a load controlstrategy in which a customer continues to self-ration by purchasing afuse, but the fuses can be activated by the electric utility when acapacity shortage occurs. In practice, however, customers wish to

123REGIONAL ECONOMIC IMPACTS
“insure” some base level of power supply during the emergency.This would require a more complex design (Wilson, 1989), wherethe customer pays a premium depending on priority class. In gen-eral, the optimal allocation of electricity is more complicated thanfor water, probably the resource for which there has been the mostadvances in theory and practice in emergency situations (i.e., drought),as opposed to local distribution disruptions associated with earth-quakes (see, e.g., Howitt et al., 1992; Zarnikau, 1994). Also, theallocation of water to meet broad social objectives is part of standardpractice, in part, due to its common property resource characteris-tics. Both market and centrally administered rationing are found.Generally speaking, electricity lifeline and disaster managers canlearn from these experiences.
15. The small incremental improvement of the second LP simulation maybe surprising at first glance. This is partly due to the spatial configu-ration of the MLGW electricity network. But more generally, it isdue to the fact that the sectoral reallocations of the first LP simula-tions implicitly capitalize on most of the spatial reallocationpossibilities of the problem at hand. It was expected that the substa-tion restoration simulations would be more prominent in regions withless sectoral adjustment flexibilities, i.e., regions with less uniformlydistributed sectors spatially or those with fewer sectors.

124 C H A P T E R 7

125
2
88888Decision Support for
Calamity Preparedness:
Socioeconomic and
Interregional Impacts
Natural disasters have their most severe impacts on isolatedlocalities and small and impoverished communities. In the UnitedStates, natural disasters are a national problem, experienced atthe local level (Berke and Beatley, 1992). For example, a majordisaster like the “500-year” Midwest floods of 1993 had minimalimpact at the national or even at the state level, yet many smallcommunities may never be able to recover (Schnorbus et al., 1994).As a fraction of annual income or even normal business cycleswings, even Hurricane Andrew had modest impact on DadeCounty, Florida—yet South Dade County and Homestead weredevastated. This specificity of the impacts demands that appropri-ate models of relatively small districts be available.
Disasters often impact most severely on poor and marginalpopulations (Ebert, 1982). In many cases, this can be traced topoverty and inappropriate development, such as inferior infrastruc-ture or housing, or limited insurance and other defensive resources(Cuny, 1983). For similar reasons, disasters tend to impact smallbusinesses more severely than large enterprises. Ideally, a modelshould describe the situation of these groups and activities explic-itly, as well as their links with the wider economy and community.
Even when they are not impacted directly, people and busi-nesses may be affected through damage to lifelines such as watersupply or roads, or through indirect effects such as the loss oflivelihood or markets. Even in aggregate, the indirect effects on acommunity are often far larger than the direct effects (Eguchi etal., 1993). Therefore, models need to be economy-wide, so as toaccount for all sectors of an economy and all segments of a popu-lation (see, e.g., NRC, 1992).
In general, the smaller a community, the greater will be theimportance of its linkages to neighboring districts, and the more
by Sam Cole

126 C H A P T E R 8
vulnerable it will be to damage to lifelines, such as power andwater supplies, or transport and other communications. Moreover,the smaller a community the greater will be the spill-over effectsto other communities, the more likely it is that neighbors also willbe impacted directly by the disaster, or that feedback effects throughtheir economies will be important (Brookshire and McKee, 1992).Thus, models must have an explicit account of a locality’s links toits neighbors and the world beyond, and in many cases modelsmust be multi-regional.
Disasters affect populations for an extended period of time.Most disasters and recovery activities operate on a variety of timescales that are characteristic of the physical, social, economic,and technological systems involved. As far as possible, it is neces-sary to represent these within a model, through the manner inwhich the impacts are calculated. Ultimately, the analysis of di-sasters presents an almost intractable network problem. Even so,one vital aspect of recovery programs or pro-active measures is torecognize that the vulnerability of the locality to disasters can bereduced through the application of various systems principles tothe physical, economic, and social aspects of disaster prepared-ness (Shinozuka et al., 1995).
Recovery needs to be situated within the overall developmentprocess (Jones, 1981; Aysan et al., 1989). While the immediatepriority must be to attend to the life-threatening consequences ofthe disaster (such as medical and shelter needs), it is also neces-sary to plan for an economic recovery which provides anopportunity to improve the quality of development if the hardshipfrom future disasters is to be reduced (see, e.g., Kreimer andMunasinghe, 1990). In the past, victims and places often havebeen disadvantaged even further by deficient recovery programs.For this reason, disasters are best viewed as part of the develop-ment process, providing opportunities, as well as tragedy. A modelbased on this perspective must bring together relevant social andeconomic categories, so that both the damage caused by the di-saster, and the proposed recovery strategy, can be assessed in thecontext of the long-term goals and institutional structures of thecommunity.
Since natural disasters typically take place with rather littlespecific warning, planning tools should be adaptable to the situa-tion of any community and type of damage, and should become

127DECISION SUPPORT FOR CALAMITY PREPAREDNESS
available as soon as possible after the disaster, so that they can beused to evaluate alternative proposals for recovery, before irre-versible commitments are made. Even after a disaster has occurred,there remains considerable uncertainty as to the extent of damageor the most appropriate recovery strategy, the model should beupdatable and flexible, so as to respond to evolving communityneeds.
Thus, the need to provide analysis quickly, to provide modelsfor small localities, describing specific sectors or lifelines, andparticular types of household or community suggests a rather highlevel of empirical detail and technical sophistication. This con-flicts with several practicalities, such as the availability of data,the understanding of complex systems, and the needs of the plan-ning process. The last cannot be ignored since, when the separationbetween the modeling and policy making becomes too great, themodeling loses much of its potential use (United Nations, 1994).While many expert and other decision support systems have beendeveloped in an attempt to bridge this gap (see, e.g., Harris andBatty, 1993), they have yet to confront the empirical and institu-tional chaos and complexity of much disaster planning. Eventhough the above is an incomplete list of the challenges for ad-dressing the consequences of major natural disasters, it presents aformidable task for economic modeling.
M o d e l i n g E c o n o m i cD i s a s t e r s
8.18.18.18.18.1
The Social Accounting Matrix (SAM) used in this chapter is anextension of input-output analysis (see, e.g., Pyatt and Roe, 1977)to include more detailed institutional accounts such as householdgroups and external trading partners. SAMs are widely recom-mended as the core empirical device for national, regional andlocal planning (United Nations, 1994). Input-output models havebeen applied at the national or regional level for disaster assess-ment, with some recent efforts at the county level and smallterritories and islands (see Chapter 2, as well as Cole, 1993; 1995).

128 C H A P T E R 8
Social accounting models have the particular advantage that,given the requisite data, both the supply and the demand sides ofthe economy can be described as a network that can be mappedonto its physical and social counterparts. Because the nodes inthe input-output tables represent localized production and con-sumption activities and the links show the flow of goods andservices, such tables are especially appropriate for representingproduction, exchange, and consumption activities. This is neces-sary to describe and evaluate the consequences of specific typesof damage in a useful fashion. The potential contribution of themethods adopted in this chapter is that it extends the possibilitiesfor constructing detailed input-output type models for small lo-calities, and for introducing fairly complex disaster andreconstruction scenarios, taking account of changes in the inter-nal structure of the economy and its external links.
Most economic transactions depend directly on physical life-line systems, for example, purchases of power and water bybusinesses and households, the trucking of goods between indus-trial areas and to markets, the flow of information within andwithout the region via telecommunication links. The impacts ofearthquakes on lifeline systems involves not only earthquake re-sistant constructions of individual components but also systemrecovery with the aid of network redundancy, back-up facilities,and restoration work, that are to be followed by reconstructionand improvement for any future earthquake (Shinozuka et al.,1995). Because the nodes in the input-output tables represent lo-calized production and consumption activities and the links showflow of goods and services, such tables are especially appropriatefor representing production, exchange, and consumption activi-ties.
C o n s t r u c t i o n o f t h eM a n y - R e g i o n A c c o u n t s
8.28.28.28.28.2
In order to address the complexity of the consequences ofnatural disasters, it is necessary to question some of the assump-tions behind conventional input-output models, and to reformulatethe construction and solution of these models. This is especially

129DECISION SUPPORT FOR CALAMITY PREPAREDNESS
so when there is a complex of events arising from the partial fail-ure of several activities, resulting in a more general failure of theeconomic network as a whole.
The earlier considerations place a very demanding set of re-quirements for model construction, especially when it is recognizedthat data at a small spatial scale are often restricted (for confiden-tiality and other reasons), and information on the direct effects ofdisasters are usually incomplete and collected in an ad-hoc fash-ion. On the other hand, the damage caused by a major naturaldisaster can affect the structure of an economy in dramatic ways(through the loss of entire industries or lifeline systems) so thateven a model which captures the key features and linkages withinan area’s economy, before and after a disaster, and allows the broadoutlines of a reconstruction strategy to be developed, can be use-ful. To this extent, the requirements on precision for the modelmay be somewhat less than for conventional economic impactcalculations. Thus, the initial goal has been to make possible therapid construction of a first-cut social accounts-based impact modelfor any locality within the United States, using readily availabledata, while providing for the subsequent improvement and exten-sion of the model, to sub-county localities.
8 . 2 . 1 D e v e l o p m e n t o f t h e M o d e l
Paradoxically, to develop the requisite analytic procedures foreven a single county, it was necessary to first construct a detailedcounty-level many-region model of the entire United States. Whilethis may appear a somewhat convoluted procedure, it providesthe parameters necessary to estimate models for smaller, sub-countylocalities, and transactions between counties across the entireUnited States, providing indirect estimates of information that areotherwise not readily available. For the present exercise, a newnational social accounting matrix has been assembled by com-bining two tables for the years 1982 (Hanson and Robinson, 1991;Reinert and Roland-Holst, 1992). This resulting matrix includesnine production sectors and seven factor and final demand cat-egories with households divided by source of income: wagesincome, transfer payments, and rent.1 The organization of the datain the United States and the addition of bilateral flows for thelocal-level social accounts are shown in Table 8.1. The table shows

130 C H A P T E R 8
123456789012341234567890123412345678901234123456789012341234567890123412345678901234123456789012341234567890123412345678901234123456789012341234567890123412345678901234123456789012341234567890123412345678901234123456789012341234567890123412345678901234123456789012341234567890123412345678901234
123456789012341234567890123412345678901234123456789012341234567890123412345678901234123456789012341234567890123412345678901234123456789012341234567890123412345678901234123456789012341234567890123412345678901234123456789012341234567890123412345678901234
1234567890123456789011234567890123456789011234567890123456789011234567890123456789011234567890123456789011234567890123456789011234567890123456789011234567890123456789011234567890123456789011234567890123456789011234567890123456789011234567890123456789011234567890123456789011234567890123456789011234567890123456789011234567890123456789011234567890123456789011234567890123456789011234567890123456789011234567890123456789011234567890123456789011234567890123456789011234567890123456789011234567890123456789011234567890123456789011234567890123456789011234567890123456789011234567890123456789011234567890123456789
123456789012345678912345678901234567891234567890123456789123456789012345678912345678901234567891234567890123456789123456789012345678912345678901234567891234567890123456789123456789012345678912345678901234567891234567890123456789123456789012345678912345678901234567891234567890123456789123456789012345678912345678901234567891234567890123456789123456789012345678912345678901234567891234567890123456789123456789012345678912345678901234567891234567890123456789123456789012345678912345678901234567891234567890123456789
Loca
lity
1
Prod
ucti
on
Fact
ors
Hou
seho
lds
Inst
itut
ions
Loca
lity
2
Prod
ucti
on
Fact
ors
Hou
seho
lds
Inst
itut
ions
Nei
ghbo
rs
Oth
er
Agr
icul
ture
, Fo
rest
ry,
Fish
ing
Min
ing
Con
stru
ctio
nN
ondu
rabl
e M
anuf
actu
ring
Dur
able
Man
ufac
turi
ngTr
ansp
orta
tion,
Com
mun
icat
ion,
Util
ities
Trad
eF.
I.R.E
.Se
rvic
esLa
bor
Prop
erty
Tran
sfer
HH
Wag
e H
HR
ent H
HG
over
nmen
tC
apita
l
Agr
icul
ture
, Fo
rest
ry,
Fish
ing
Min
ing
Con
stru
ctio
nN
ondu
rabl
e M
anuf
actu
ring
Dur
able
Man
ufac
turi
ngTr
ansp
orta
tion,
Com
mun
icat
ion,
Util
ities
Trad
eF.
I.R.E
.Se
rvic
esLa
bor
Prop
erty
Tran
sfer
HH
Wag
e H
HR
ent H
HG
over
nmen
tC
apita
l
Cou
ntie
sG
roup
s of
Cou
ntie
sSt
ates
Gro
ups
of S
tate
s
Res
t of U
.S.
Res
t of W
orld
Dom
estic
Prod
uctio
n by
Com
mod
ityTr
ansa
ctio
n
Loca
lity
1Lo
calit
y 2
Nei
ghbo
rsO
ther
Fact
ors
Hou
seho
lds
Inst
itutio
nsD
omes
ticPr
oduc
tion
byC
omm
odity
Tran
sact
ion
Fact
ors
Hou
seho
lds
Inst
itutio
nsN
eigh
bori
ngC
ount
ies
Nei
ghbo
ring
Stat
es a
ndR
egio
ns
Res
tof U.S
.
Res
t of
Wor
ld
Acc
ount
s
Impo
rts
from
Ove
rsea
s to
Loc
ality
1Im
port
s fr
om O
vers
eas
to L
ocal
ity 2
Expo
rts
to O
ther
Reg
ions
Expo
rts
to O
ther
Reg
ions
Tota
l D
omes
ticTr
ansa
ctio
ns a
nd B
ilate
ral
Reg
iona
l Tra
de
Ove
rsea
s Im
port
s an
d Pa
ymen
ts
Inte
rmed
iate
Impo
rts
toLo
calit
y 2
Com
mut
ing
Non
-loc
alPu
rcha
ses
Inte
rmed
iate
Impo
rts
toLo
calit
y 1
Oth
erC
omm
utin
gN
on-l
ocal
Purc
hase
s e.
g.m
ail
orde
rsh
oppi
ng a
ndva
catio
ns
Inte
rmed
iate
Impo
rts
toD
omes
ticPr
oduc
tion
(Not
e: E
xpor
tsfr
om L
ocal
ity 2
toLo
calit
y 1
=Im
port
s fr
omLo
calit
y 2
toLo
calit
y 1)
Fina
l Dem
and
Impo
rts
toLo
calit
y 1
from
Loc
ality
2
Com
mut
er a
nd O
ther
Tra
nsfe
rse.
g. w
orki
ng in
1 a
nd li
ving
in 2
Expo
rts
from
Loca
lity
1 to
Loca
lity
2 =
Impo
rts
from
Loc
ality
1 to
Loca
lity
2)
Com
mut
er a
nd O
ther
Tra
nsfe
rs e
.g.
wor
king
in 2
and
livi
ng in
1
Fina
l D
eman
dIm
port
s to
Reg
ion
Dom
estic
Int
er-
Sect
oral
Tra
nsac
tions
in L
ocal
ity 1
e.g.
pur
chas
es o
fag
ricu
ltura
l goo
ds b
yfo
od p
roce
ssor
s
Dom
estic
Fac
tors
and
Inst
itutio
ns in
Loc
ality
1e.
g. w
ages
to w
orke
rsan
d en
trep
rene
urs
Loca
l Hou
seho
ldPu
rcha
ses
e.g.
loca
l sho
ppin
g
Tran
sfer
s an
d O
ther
Paym
ents
e.g.
wel
fare
and
taxe
s
Dom
estic
Inte
r-Sec
tora
lTr
ansa
ctio
ns
Dom
estic
Fac
tors
and
Inst
itutio
ns
Loca
l Pur
chas
es
Tran
sfer
s an
dO
ther
Pay
men
ts
Ove
r-se
asEx
-po
rts
and
Pay-
men
ts
Tabl
e 8.
1 L
ocal
Are
a So
cial
Acc
ount
ing
Mat
rix w
ith R
egio
nal T
rans
actio
ns

131DECISION SUPPORT FOR CALAMITY PREPAREDNESS
the expenditures (in columns) and receipts (in rows) for each groupof economic actors, industry, services, factors, households, gov-ernment, and rest-of-the-world. The multi-county tables includebilateral flows of these same items with neighboring counties (orlocalities), and with blocs of counties, states, and regions.
The basic techniques used to construct the county-level modelare as follows. First, total supply and demand for each commodityand factor of production are estimated for every county and byscaling the accounts in the United States table using data from theU.S. Department of Commerce (1995). Second, the resulting sup-ply-demand imbalances of each county are used to estimate theparameters of a spatial allocation model for each activity (Sen andSmith, 1995), and to provide bilateral interregional trade matri-ces. Third, these flows are combined with the scaled regionalmatrices to give the many-region social accounts. Finally, the ac-counts are aggregated so as to highlight the locality of immediateinterest within an overall matrix of manageable size.
8 . 2 . 2 R e p r e s e n tat i o n a s a V i r t u a l
G I S - b a s e d M o d e l
The main principles of the approach have been piloted in ear-lier phases of the project (Cole et al., 1993; 1996b). Whereas thesepilot studies required considerable “hands-on” treatment usingsome specially collected data, the present approach is largely au-tomatic or mechanical using national data sets available in digitizedform (e.g., on CD-ROM) with data handling and presentation ma-nipulated through Geographic Information System (GIS)techniques, and using generalizable algorithms to scale and solvethe models (Miller and Blair, 1985). This procedure is elaboratedin Cole et al., (1993) and Cole (1992, 1996a).
Creating such a system in a GIS-like environment presents amajor challenge. In principle, every locality described in the modelis connected to every other through structure, time, and space—changing any variable in one region affects every variable in allother regions. Even though specific secular locality-to-localityimpacts across large distances may be small (say, the impact of anearthquake in Memphis, Tennessee on Buffalo, New York), thecombined effects onto entire regions or the nation of a local eventare not. Representing these interregional impacts is also a chal-

132 C H A P T E R 8
lenge since most GIS deal well only with variations in structure,and do not deal well with time varying and place-to-place flows.Moreover, since many data are missing or must be estimated, thereremains a question of how the empirical model, and the metadatathat describe it, should be organized. Last, for real-world applica-tions, the system should be manipulated via a relativelystraightforward Decision Support System (DSS) interface (see Cole,1996a).
A model of the transactions between the 3,000 counties of theUnited States, each with up to 20 activities per region could re-quire a matrix with 36x108 (a table covering several football fields!).
Figure 8.1 Flow Diagram for Mississippi Valley Model Programs

133DECISION SUPPORT FOR CALAMITY PREPAREDNESS
To deal with this vast amount of data, the system is organized as a“virtual model” whereby the many-region accounts are condensedto a set of basic data associated with each locality and a set ofestimated parameters which allow selected local accounts to bere-constructed and solved as required. Thus, the system is designedto focus in on the segment of the matrix that describes the disasterarea, in much the same way that a GIS system allows us to zooma particular locality. A key task has been to devise appropriateestimation, and aggregation rules for this process, and a practicalGIS interface.
The empirical implementation of model construction and ap-plication is carried out through a series of computer programs(see Cole, 1996a). The procedure falls into several steps, each com-prising a group of macros (ie., computer program) for datapreparation, model estimation, model assembly, and model solu-tion.2 This is summarized by the flow diagram in Figure 8.1. Withthis approach, the blocs of counties and states may be superim-posed on the radial transportation networks which are ubiquitousin U.S. cities, or modified to correspond to other systems, so thatthe regional clusters correspond to nodes on the lifeline network.The selection of the target county, and neighbors, is automatedvia a GIS interface such as that shown in Figure 8.2.
Figure 8.2 Interface for Selection of Target Locality and Aggregation of Neighbors

134 C H A P T E R 8
The social accounts provide a county-by-county pre-disasterpicture of the network of domestic transactions and flows to andfrom neighboring regions. In a multi-region system, economic trans-actions spill over into neighboring regions and also feed back intothe original economy. In the event of a disaster, some of the nodesand links in this many-region economic network are damaged,while others may take up the slack during the recovery. Becauseof this, the round-by-round process of spillover and feedback isdisrupted and diminished. The method of solution used attemptsto capture this process in a generalizable way.
8 . 3 . 1 D i s t r i b u t e d D i s r u p t i o n s ,
Tr a n s a c t i o n C o s t s a n d U n c e r ta i n t y
The solution assumes that, even under normal circumstances,some proportion of transactions will be delayed unacceptably.Indeed, most economic actors attempt to reduce losses by main-taining buffer stocks, or concentrating their business in nearbymarkets. During a “disaster” — almost by definition — the pro-portion of failed transactions is increased beyond the capability ofthe normal system to cushion their livelihood. Thus, their eco-nomic losses increase dramatically.
The technique for solving the model rests on a time-depen-dent approach for conceptualizing input-output tables (Cole, 1988).The first important notion here is that the network of activities inany economy sets up a ‘round-by-round’ process that distributesincome throughout the economy (see e.g. Miller and Blair, 1985).Thus, a change anywhere in the economy is magnified and trans-mitted throughout the community (and in some measure,throughout the world). This is the basis of the multiplier effect, thatunderlies all input-output type calculations, and provides an es-pecially useful way of conceptualizing the propagation of eventsthrough structure, time, and space. The second underlying idea isthat all economic processes involve a characteristic transactionlag — reflecting the time taken to design, finance, transport or
M o d e l S o l u t i o n
8.38.38.38.38.3

135DECISION SUPPORT FOR CALAMITY PREPAREDNESS
produce goods, or simply to adjust to new circumstances (see tenRaa, 1986; Cole, 1988).3
Typically, input output models are used to simulate events thatare relatively simple compared to the circumstances of a majordisaster. Nonetheless, many changes may be simulated by “map-ping” details of a disaster and the proposed recovery strategy ontothe social accounts in an appropriate manner. Damage is intro-duced into the model via an Event Accounting Matrix (EAM) thatrecords the intensity of the impacts on each activity and transac-tion and the response (or recovery rate) of each activity ortransaction (see Cole et al., 1993).4
M e m p h i s - M i s s i s s i p p iV a l l e y M o d e l
8.48.48.48.48.4
8 . 4 . 1 M e m p h i s R e g i o n
The Mississippi Valley, centered on Memphis, Tennessee, pro-vides the example in this chapter. The Memphis metropolitan regionlies at the intersection of three States — Tennessee, Mississippi,and Arkansas. Given the great distance to the nearest cities ofcomparable size, Memphis might be considered the metropolitancenter for as many as one hundred counties. The largest county,Shelby, contains about 80% of the region’s business and popula-tion within counties which are proximate to Memphis. Memphisitself accounts for about 20% of the Shelby economy. The nextlargest nearby counties are De Soto in Mississippi and Mississippiin Arkansas, each with about 4% of the region’s economy (U.S.Department of Commerce, 1994).
Table 8.2 compares the size, economic structure and incomedistribution across the counties of the region. It shows that serviceand lifeline sectors are concentrated in Shelby (19 and 53% of thecounty’s total income). Shelby is a transportation center for theregion. Other counties display a concentration of manufacturingactivities (73% in Lauderdale, and 60% in Tipton, Tennessee), oragricultural activities (26% in Tunica, Mississippi). These varia-tions, which are the result of many factors, indicate a good deal oftrade between the counties. Similarly, in the counties adjacent to

136 C H A P T E R 8
Tabl
e 8.
2 R
elat
ive
Size
and
Com
posi
tion
of M
emph
is R
egio
n Co
untie
s
Shar
e of
Reg
iona
l Ec
onom
yPr
oduc
tion
Val
ue A
dded
Hou
seho
ld I
ncom
e
Com
posi
tion
of
Econ
omy
Farm
ing
Man
ufac
turi
ngLi
felin
esSe
rvic
es
Com
pos.
of
Hou
seho
ld I
ncom
eTr
ansf
er H
HW
age
HH
Ren
t H
H
Item
sSh
elby
TNTi
pton
TNC
ritt
ende
nA
RD
e So
toM
SFa
yett
eA
RM
issi
ssip
piA
RM
arsh
all
MS
Laud
erda
leTN
Tate MS
Tuni
caM
S
85%
82%
79% 2% 27%
19%
53%
16%
64%
20%
1.2%
1.8%
2.6% 0% 60
% 4% 36%
20%
68%
12%
2.0%
2.7%
3.2% 4% 36%
15%
45%
18%
70%
12%
3.5%
4.1%
5.4% 0% 66
% 6% 29%
12%
76%
12%
1.0%
1.1%
1.6% 4% 65
% 3% 28%
22%
65%
13%
4.1%
4.5%
3.5% 7% 66% 4% 23%
21%
65%
15%
0.8%
1.0%
1.6% 3% 60% 6% 31%
24%
64%
12%
1.5%
1.5%
1.4% 4% 73% 4% 19%
27%
58%
16%
0.8%
1.0%
1.3% 3% 56
% 7% 34%
21%
64%
15%
0.3%
0.4%
0.5%
26%
26% 5% 44%
27%
43%
31%
Not
e: F
arm
ing
(Agr
icul
ture
, For
estr
y an
d Fi
shin
g), M
anuf
actu
ring
(Min
ing,
Dur
able
, Non
dura
ble)
, Life
lines
(Tra
nspo
rtat
ion,
Util
ities
and
Com
mun
icat
ion)
, Ser
vice
s(C
omm
erce
, F.I.
R.E
., Se
rvic
es)

137DECISION SUPPORT FOR CALAMITY PREPAREDNESS
Shelby, the share of production in the region as a whole is typi-cally about half their share of household income, indicating a highlevel of commuting into Memphis. The composition of householdincome also varies across counties, for example, the share of wageincome in Tunica is relatively low (reflecting its depressed ruraleconomy), while Shelby is an employment and entrepreneurialcenter. Such data provide the empirical basis for the virtual model.
8 . 4 . 2 M e m p h i s A c c o u n t s
The method described earlier is used to estimate a 50 countyand cluster model focused on the Memphis region economy. Thisgives the transactions between the various production and house-holds within the city of Memphis, and Shelby, and Crittendencounties, and between these localities and surrounding countiesand states to be used in the impact calculations. Thirty individualcounties in Arkansas, Mississippi and Tennessee, that are in thevicinity of Memphis are treated individually. The blocs of countiesand states are superimposed on the transportation networks whichin Memphis are roughly East-West and North-South. The final tableis then focused on particular counties, or groups of counties, inthis case those in the vicinity of Memphis.
The result is shown in Table 8.3, the county table for Shelbyremains in full detail (i.e. with the same domestic transactionsdisplayed as for the consolidated United States accounts shownearlier). The accounts for the immediate neighbor counties —Tipton, Fayette, and Lauderdale also in Tennessee; Crittenden andMississippi in Arkansas; and De Soto, Marshall, Tate, and Tunicain Mississippi — are each consolidated to show only their aggre-gate domestic accounts and their imports from and exports toShelby for each commodity and factor. Regional imports and ex-ports are aggregated so that exports from production sectors areindividual commodities, and imports to production sectors and tofinal demand are bundles of commodities.
The table shows the estimated flows of income through com-muting and lifeline-related activities between the counties in thevicinity of Memphis. The data along the diagonal show transac-tions within the counties. For example, local wage and lifelinetransactions within Shelby are $11,007 million and $3,354 mil-lion, respectively. The estimates for commuting show that all

138 C H A P T E R 8
0.1
0.0
1.9
3.5
4.5
11.3 5.2
19.6
109.
3
Agr
icul
ture
, Fo
rest
ry,
Fish
ing
Min
ing
Con
stru
ctio
nN
ondu
rabl
e M
anuf
actu
ring
Dur
able
Man
ufac
turi
ngTr
ans.
, C
omm
unic
atio
n, U
tiliti
esTr
ade
F.I.R
.E.
Serv
ices
Res
t of S
helb
y TN
Tipt
on T
NC
ritte
nden
AR
De
Soto
MS
Faye
tte T
NM
issi
ssip
pi A
rkan
sas
Mar
shal
l MS/
Tate
MS
Laud
erda
le T
N/T
unic
a M
SH
ayw
ood
TN/C
ross
, AR
AR
KA
, B
ENT,
BO
ON
, et
c.U
SA,
MS,
OK
TEN
N,
AN
DE,
BLO
U,
etc.
USA
, AL,
GA
USA
, LA
TN, C
AR
T, C
OC
K, e
tc.;
USA
AL,
etc
.U
SA,
HI,
TXU
SA,
CT,
DE,
etc
.R
owTo
tal
0.1
0.0
0.0
0.6
0.7
2.1
2.8
9.7
23.9
0.0
6.1
0.0
0.0
0.0
34.2 7.0
0.1
0.0
0.1
0.2
3.0
1.1
1.0
0.8
5.0
74.8
12.2 0.0
0.0
0.0
5.1
0.0
340 0 1 0 1 6 8 8 1 6 1 7 2
168
36 12 254
1 2 3 4 5 6 7 8 9 10 11 12 13 14 15 16 17 18 19 20 21 22 23 24 25 26 27 28 29 30 31 32 33 34 35
0.5
0.0
0.0
0.1
0.0
0.2
0.2
0.7
0.7
4.0
12.5 0.0
0.0
0.0
1.0
0.0 7 0 0 0 0 0 1 1 1 0 1 0 1 0 3 1 5 2
45
0.0
0.0
0.0
0.0
0.0
0.0
0.0
0.0
0.0
0.5
1.5
0.0
0.0
0.0
0.4
0.0 0 0 0 0 0 0 0 0 0 0 0 0 0 0 0 0 0 0 3
0.0
0.0
0.0
0.3
3.0
0.8
2.7
0.8
9.5
92.1
15.0 0.0
0.0
0.0
3.7
0.0 461 1 1 0 1 6 9 9 1 7 1 7 2
189
40 13 301
0.2
0.0
0.0
0.4
0.1
0.4
0.3
0.2
1.7
13.8 9.2
0.0
0.0
0.0
2.6
0.0
12 0 0 0 0 0 2 2 2 0 2 0 3 1 6 4 13 4 83
Dom
estic
Pro
duct
ion
by C
omm
odity
Tra
nsac
tions
Fac
tors
Hou
seho
lds
Inst
itutio
ns
0.0
0.0
13.9 0.0
6.0
0.1
0.4
0.4
0.0
0.0
0.0
0.0
0.0
0.0
112.
50.
0
912 1 3 1 2
17 22 242
174
208
51 27 107
26 558
Dom
estic
Fac
tors
and
Inst
itutio
nsTr
ansf
ers
and
Oth
er P
aym
ents
Inte
rmed
iate
Impo
rts to
Dom
estic
Pro
duct
ion
Fina
l Dem
and
Impo
rts to
Reg
ion
0.0
0.3
1.9
0.8
0.9
9.1
1.0
3.1
13.7
223.
220
8.5
0.0
0.0
0.0
37.7 0.0
801 1 1 0 1
11 11 121
142
138
31 26 62 23 799
0.0
0.0
0.2
0.2
0.2
2.4
0.6
5.0
24.6
181.
765
.9 0.0
0.0
0.0
60.9 0.0
530 0 0 0 0 3 4 5 0 4 1 4 2 9 5
225
461
238.
053
5.5
0.0
0.0
0.0
125.
90.
0
95 1 1 1 0 1 6 8 9 1 7 1 9 4 19 11 41 1011
79
302 2 3 3 1 3
27 35 373
325
38 13 81 44 192
4929
05
1455
.938
5.3
0.0
0.0
0.0
36.7 0.0
0.0
0.0
0.0
325.
10.
034
2.2
0.0
1261 16 15 16 7 8 41 62 57 3 13 4 14 7 17 15 37 0
2261
0.0
0.0
0.0
0.0
0.0
0.0
0.0
0.0
0.0
0.0
0.0
0.0
0.0
0.0
0.0
0.0
0.0
0.0
0.0
0.0
0.0
0.0
6.0
51.2
306.
2
108 1 1 2 1 1
17 19 212
243
229
65 31 156 0
845
0.0
0.0
0.0
0.3
0.3
1.1
1.4
4.9
12.0 0.0
2.1
0.0
0.0
0.0
0.0
0.7
380 0 0 0 0 3 4 4 0 4 1 4 1 9 5
225
124
77 1 1 1 0 1 6 8 9 1 7 1 9 3 18 10 44 1029
40.0
6.1
0.0
0.0
0.0
34.2 7.0
0.0
0.0
0.0
0.1
0.1
0.3
0.4
1.2
3.0
0.0
1.5
0.0
0.0
0.0
17.5 2.9 9 0 0 0 0 0 1 1 1 0 1 0 1 0 2 1 5 1 52
0.4
0.0
6.9
0.4
2.6
2.8
0.7
2.4
201.
3
0.0
88.7
496.
40.
00.
00.
00.
0
307 2 3 3 1 2
16 23 252
173
198
42 25 93 2814
22
Labo
r P
rope
rty
Tra
nsfe
r H
HW
age
HH
Ren
t HH
Gov
ernm
ent
Cap
ital
135
98
12$m
illio
n1
Acc
ount
s2
63
47
1011
1415
16
Wag
eH
HD
urab
leM
anuf
actu
r-in
g
Serv
ices
F.I.R
.E.
Tran
sfer
HH
1994
Ag.
, Fo
r.,Fi
shin
gM
emph
isM
inin
gTr
ans.
,C
omm
.,U
tiliti
es
Con
stru
c-tio
nN
ondu
rabl
eM
anuf
actu
r-in
g
Trad
eLa
bor
Prop
erty
Ren
tH
HG
over
n-m
ent
Cap
ital
0.1
0.0
3.4
0.3
0.2
3.8
0.7
4.4
42.9
Tabl
e 8.
3 L
ocal
Are
a So
cial
Acc
ount
ing
Mat
rix w
ith R
egio
nal T
rans
actio
ns

139DECISION SUPPORT FOR CALAMITY PREPAREDNESS
6184
16
530
29 37 60 27 6432
0719
8623
72 187
3874 35
833
4715
8650
1105
182
2714
772
8106
2169
72
1654 10
114
020
784 19
136
6447
871
5165 39
261
89 639
7199
2092
1105
265
3925
513
4749
1237
84
1038 60 80 13
056 11
514
8948
3029
4266 32
436
24 540
3678
2788
1350
015
661
1914
288
8622
6072
635 3 5
814
47 59 664
447
47 19 107
62 234
35 910
21
4 0 0 4 25 43 33 43 53 0 0 0 0 0 0 0
1753 32 51 98 28 12
882
5244
8765
43 704
1726
919
4222
938
6732
1623
5038
857
3002
1345
835
3 014
618 28 16 30 21
0 0 6 4 0 0
869 46 65
104 42
102
2787
4340
3172
356
8659
590
5470
7422
1511
991
6271
3217
924
640
6456
49
1 0 4 2 5 9 512
9 0 2 1 0 0
274 15 20 28 12 35
778
770
998
216
960
3098
611
8045
438
0617
1310
430
2101
5482
4
3 021
926 42 27 61 10
5 0 0 25 6 0 0
1669 10
913
318
489 20
849
6648
6610
1688 58
046
02 816
5123
2445
1363
690
0130
545
6942
1879
26
0 0 1 0 2 2 2 4 17 0 0 4 0 0 0
149 13 12 12 6
506
127
189
208 16
127 27
141 57
348
196
786
126
3079
0 0 1 1 2 3 3 0 21 0 0 4 0 0 0
160 7
15 504 6
10 128
169
154
13 121
20 133
49 276
158
645
113
2718
0 0 1 0 1 2 2 5 18 0 0 4 0 0 0
137 6
266 15 4 9 77
113
113 9 80 14 90 34
195
111
475 67
1849
0 0 1 0 1 2 2 417
0 0 3 0 0 0
124
133 6 7 5 9
55 77 876
57 10 63 25 146
83 333
4813
03
6 1 23 9 29 63 31 39 30 0 0 012
5 0 0
1493 78 11
517
067 18
646
6551
1760
1710
4272
9616
5610
262
3159
2268
810
624
8005
087
3210
30
875 47 63
103 43
100
2966
4063
3137
305
4006
0452
594
0427
2811
981
6724
2481
218
617
4872
443 015
617 27 17 32 22 0 0 6 4 0 0
0 0 2 1 2 4 3 6 9 0 0 2 1 0 0
155 9 13 17 7 20
416
436
649
7696
497
200
634
218
1571
763
5737
755
1982
2
3 0 1
8 7 24
38
26
63
131 0 0 27 6 0 0
3 017
722 29 17 34 19 0 0 0 6 5 0 0
1003 57 69
113 51
127
1021
035
7849
6737
754
5576
953
9346
3629
676
1042
040
2867
343
850
1181
204
2 013
516 27 18 41 69 0 0 14 4 0 0
1060 57 74 11
450 13
152
0935
2443
92 458
5531 98
160
1035
6944
9934
116
960
3622
017
9607
4763
4613 0
167
21 40 20 36 19
0 0 0 6 5 0 0
1 0 8 312 16 10 21 13 0 0 0 3 2 0 0
Agr
icul
ture
, Fo
rest
ry,
Fish
ing
Min
ing
Con
stru
ctio
nN
ondu
rabl
e M
anuf
actu
ring
Dur
able
Man
ufac
turi
ngTr
ans.
, C
omm
unic
atio
n, U
tiliti
esTr
ade
F.I.R
.E.
Serv
ices
Labo
r P
rope
rty
Tra
nsfe
r H
HW
age
HH
Ren
t HH
Gov
ernm
ent
Cap
ital
Res
t of S
helb
y TN
Tipt
on T
NC
ritte
nden
AR
De
Soto
MS
Faye
tte T
NM
issi
ssip
pi A
rkan
sas
Mar
shal
l MS/
Tate
MS
Laud
erda
le T
N/T
unic
a M
SH
ayw
ood
TN/C
ross
, AR
AR
KA
, B
ENT,
BO
ON
, et
c.U
SA,
MS,
OK
TEN
N,
AN
DE,
BLO
U,
etc.
USA
, AL,
GA
USA
, LA
TN, C
AR
T, C
OC
K, e
tc.;
USA
AL,
etc
.U
SA, H
I, TX
USA
, CT,
DE,
etc
.R
owTo
tal
Com
mod
ity E
xpor
ts fr
om L
ocal
ity to
Oth
er R
egio
ns
Com
mut
ing
and
Oth
er Tr
ansf
ers
Net
Tot
al D
omes
tic T
rans
actio
ns a
nd B
ilate
ral T
rade
of O
ther
Reg
ions
0 0 0 0 1 1 1 2 8 0 0 1 0 0 0
16 3 97 4912
120
014
643
715
78 0 059
426
0 0
2447
814
714
918
379 14
111
7115
3916
09 130
1268 21
013
92 560
3206
1865
7276
1849
5052
0
2226
2930
171
8A
ccou
nts
2320
2427
2831
32 3
319
3435
25
Faye
tteTN
Hay
woo
dTN
Res
t of
Shel
byTN
Mem
phis
MS
AR
DeS
oto
MS
Tipt
onTN
AR
KA
,B
ENT,
etc.
Laud
er-
dale
TN
Mar
shal
lM
S/ T
ate
MS
USA
, MS
OK
TN,
AN
DE,
BLO
U,
etc.
USA
,A
L,G
A
USA
,LA
TN,
CA
RT,
CO
CK
,et
c.
USA
,C
T, D
E,et
c.
USA
,H
I,TX
Row
Cri
tten-
den
AR
8400
996

140 C H A P T E R 8
Tabl
e 8.
3 L
ocal
Are
a So
cial
Acc
ount
ing
Mat
rix w
ith R
egio
nal T
rans
actio
ns (c
ontin
ued)
33Ja
ckso
n, A
rkan
sas
34A
lcor
n, M
issi
ssip
pi35
Lake
, Ten
ness
ee36
Mon
roe,
Ark
ansa
s37
Pont
otoc
, Mis
siss
ippi
38O
bion
, Ten
ness
ee39
Law
renc
e, A
rkan
sas
40H
ende
rson
, Ten
ness
ee41
Pren
tiss,
Mis
siss
ippi
42Ta
llaha
tchi
e, M
issi
ssip
pi43
Mis
s Ita
w, L
ee, T
ish
44A
rka
Ran
d45
Tenn
Wea
k46
Mis
s B
oli,
Hum
p, Is
sa, L
efl,
Shar
, Sun
f, W
ash,
Yaz
o47
Ark
a A
rka,
Ark
a, C
lev,
Con
w, D
all,
Faul
, Gra
n, H
ot, J
eff,
Lin
48M
iss
Atta
, Cal
h, C
arr,
Chi
c, C
hoc,
Cla
y, G
ren,
Hol
m, K
emp,
Lea
49A
rka
Bax
t, C
leb,
Ful
t, In
de, I
zar,
Mar
i, Po
pe, S
ear,
Shar
, Sto
n50
Tenn
Ben
t, C
arr,
Che
a, D
eca,
Dic
k, G
ile, H
ard,
Hen
r, H
ick,
Hou
51A
rka
Ash
l, B
rad,
Chi
c, D
esh,
Dre
w52
Ark
a U
nio
53Te
nn T
enn,
Bed
f, B
led,
Can
n, C
lay,
Cof
f, C
umb,
Dav
i, D
eka,
Fra
54M
iss
Ada
m, C
lai,
Cop
i, Fr
an, H
ind,
Jeff,
Lin
c, W
arr,
55A
rka
Ben
t, B
oon,
Car
r, C
raw
, Fr
an, J
ohn,
Mad
i, N
ewt,
Was
h56
USA
Mis
s, O
kla
57U
SA K
ent
58Te
nn A
nde,
Blo
u, B
rad,
Cam
p, C
lai,
Fent
, Gra
i, Je
ff, K
nox,
Lou
d, M
59U
SA A
lab,
Geo
r60
USA
Lou
i61
Tenn
Car
t, C
ock,
Gre
e, H
amb,
Han
c, H
awk,
John
, Sul
l, U
nic,
Was
62U
SA H
awa,
Tex
a63
USA
Con
n, D
ela,
Flo
r, Il
li, In
di, M
ass,
Mar
y, M
ain,
Mic
h, N
ort,
New
64U
SA A
las,
Ariz
, Cal
i, C
olo,
Iow
a, Id
ah, K
ans,
Min
n, M
ont,
Nor
t, N
e
1M
emph
is2
Res
t She
lby,
Tenn
esse
e3
Tipt
on, T
enne
ssee
4C
ritte
nden
, Ark
ansa
s5
DeS
oto,
Mis
siss
ippi
6Fa
yette
, Ten
ness
ee7
Mis
siss
ippi
, Ark
ansa
s8
Mar
shal
l, M
issi
ssip
pi9
Laud
erda
le, T
enne
ssee
10Ta
te, M
issi
ssip
pi11
Hay
woo
d, Te
nnes
see
12Tu
nica
, Mis
siss
ippi
13St
. Fra
ncis
, Ark
ansa
s14
Poin
sett,
Ark
ansa
s15
Cro
ss, A
rkan
sas
16B
ento
n, M
issi
ssip
pi17
Har
dem
an, T
enne
ssee
18C
rock
ett,
Tenn
esse
e19
Lee,
Ark
ansa
s20
Dye
r, Te
nnes
see
21La
faye
tte, M
issi
ssip
pi22
Mad
ison
, Ten
ness
ee23
Tipp
ah, M
issi
ssip
pi24
Gre
ene,
Ark
ansa
s25
Uni
on, M
issi
ssip
pi26
Woo
druf
f, A
rkan
sas
27M
cNai
ry, T
enne
ssee
28C
hest
er, T
enne
ssee
29Q
uitm
an, M
issi
ssip
pi30
Gib
son,
Tenn
esse
e31
Coa
hom
a, M
issi
ssip
pi32
Phill
ips,
Ark
ansa
s
1 2 3 4 5 6 7 8 910 11 12 13 14 15 16
Agr
icul
ture
, Fo
rest
ry,
Fish
ing
Min
ing
Con
stru
ctio
nN
ondu
rabl
e M
anuf
actu
ring
Dur
able
Man
ufac
turi
ngTr
ansp
orta
tion,
Com
mun
icat
ion,
Util
ities
Trad
eF.
I.R.E
.Se
rvic
esLa
bor
Prop
erty
Tran
sfer
HH
Wag
e H
HR
ent H
HG
over
nmen
tC
apita
l
18%
12%
15%
17%
23%
19%
15%
15%
16%
14%
10%
11%
14%
10%
13%
17%
0.7
0.7
0.7
0.7
0.7
0.7
0.7
0.8
1.1
1.2
0.7
0.7
1.2
0.7
0.7
0.7
0.7
0.8
0.8
0.8
0.7
0.7
0.7
0.8
0.7
0.6
0.8
0.7
0.6
0.8
0.8
0.7
2.0
2.0
2.0
2.0
2.0
2.0
2.0
2.0
2.0
2.0
2.0
2.0
2.0
2.0
2.0
2.0
Dom
esti
c A
ccou
nts
Para
met
ers
Acc
ount
Fit
Dis
tanc
eSc
ale
Loca
lN
eigh
bori
ng C
ount
ies
and
Blo
cs

141DECISION SUPPORT FOR CALAMITY PREPAREDNESS
counties provide a net flow of labor to Shelby. For example, com-muters from Crittenden earn $83 million in Shelby county, whileonly $29 million comes from commuting from Shelby toCrittenden. In general, the smaller counties, and those closest toMemphis have the highest level of commuting. For example, al-most as many residents of Tunica commute to Shelby, as live andwork in Tunica. For lifeline activities (predominantly transport, butincluding communication, and utilities combined), the flow is re-versed and Shelby is a net exporter. In general, the smaller theregion, the greater will be the mismatches between demand andsupply of commodities and factors.
A p p l i c at i o n o f t h eD e c i s i o n S u p p o r t S y s t e m
8.58.58.58.58.5
8 . 5 . 1 E v e n t A c c o u n t i n g M a t r i x
The damage sustained during the disaster, and also the subse-quent recovery measures are introduced into the model via anEvent Accounting Matrix (EAM), which maps the estimates of thedirect economic onto the pre-disaster social accounts. Hypotheti-cal events have been used to construct lifeline vulnerabilityfunctions and estimates of likely direct and indirect damage to theregional economy (e.g. NEHRP, 1992). In particular, most of theelectricity supplied to these counties comes from the TennesseeValley Authority (TVA) via a number of gate stations via transmis-sion lines. The series of fragility models for the Memphis region toassess the vulnerability of the electricity lifeline systems as a resultof substation failure, power imbalance, or loss of connectivity pre-sented in Chapter 3 are embodied in the estimates of direct damagepresented in Chapter 6 and utilized to estimate indirect impacts inShelby County alone in Chapter 7.
8 . 5 . 2 B a s e S c e n a r i o
These damage estimates are allocated to the sectors describedin the multi-county model to provide the “base scenario” given inthe Event Accounting Matrix (EAM) shown in Table 8.4. This pro-

142 C H A P T E R 8
Tabl
e 8.
4 S
cena
rio -
Out
put D
isru
ptio
n Ev
ent A
ccou
ntin
g M
atrix
Tim
ing
of E
vent
Bas
eShel
by, T
N
Opt
imal
Even
t St
art
Even
t St
op
Sect
orA
gric
ultu
re,
Fore
stry
, Fi
shin
gM
inin
gC
onst
ruct
ion
Non
dura
ble
Man
ufac
turi
ngD
urab
le M
anuf
actu
ring
Tran
spor
tatio
n,C
omm
unic
atio
n,U
tiliti
esTr
ade
F.I.R
.E.
Serv
ices
Labo
rPr
oper
tyTr
ansf
er H
HW
age
HH
Ren
t H
HG
over
nmen
tC
apita
l
1994
.1
1
994.
0
19
95.0
1994
.019
95.0
1994
.119
94.0
1995
.019
94.0
1995
.019
95.5
199
5.0
1995
.519
95.0
1995
.519
95.5
1995
.019
95.5
1995
.019
95.5
1.6
0.4
23.8
59.4
26.9
43.6
49.8
35.9
44.1
32.3
1.1
0.3
15.9
39.6
18.0
29.1
33.2
23.9
29.4
21.5
1.6
0.5
1.2
71.4 2.1
53.8
58.3 1.5
1.8
0.9
1.1
0.3
0.8
47.6 1.4
35.9
38.8 1.0
1.2
0.6

143DECISION SUPPORT FOR CALAMITY PREPAREDNESS
Tim
ing
of E
vent
Bas
e
Cri
tten
den,
AR
Opt
imal
Even
t St
art
Even
t St
op
Sect
orA
gric
ultu
re,
Fore
stry
, Fi
shin
gM
inin
gC
onst
ruct
ion
Non
dura
ble
Man
ufac
turi
ngD
urab
le M
anuf
actu
ring
Tran
spor
tatio
n,C
omm
unic
atio
n,U
tiliti
esTr
ade
F.I.R
.E.
Serv
ices
Labo
rPr
oper
tyTr
ansf
er H
HW
age
HH
Ren
t H
HG
over
nmen
tC
apita
l
1994
.1
1
994.
0
19
95.0
1994
.019
95.0
1994
.119
94.0
1995
.019
94.0
1995
.019
95.5
199
5.0
1995
.519
95.0
1995
.519
95.5
1995
.019
95.5
1995
.019
95.5
0.1
0.9
0.4
1.4
0.9
1.0
1.2
0.6
0.8
0.6
0.1
0.6
0.2
0.9
0.6
0.7
0.8
0.4
0.5
0.4
0.1
0.0
0.4
1.1
1.0
1.1
1.0
0.5
1.0
0.5
0.1
0.0
0.2
0.7
0.6
0.7
0.6
0.3
0.6
0.4
Res
t of
the
U.S
.
Res
t of
the
Wor
ld
Am
ount
11
11

144 C H A P T E R 8
vides information on the intensity of the impacts to each activityand the time taken to recover.
In the base scenario, it is assumed that damage to the variousproduction activities in neighboring counties Tipton and Fayette(in Tennessee), Crittenden and Mississippi (in Arkansas), De Sotoand Marshall (in Mississippi), is proportionately the same as inShelby County. The scenario provides an assessment of the “statusquo” response of the Memphis area economy to a disruption ofelectricity supply. The total economic impact on each activity isdetermined as the short-term (direct) curtailment of its activities,plus the subsequent indirect loss arising from downstream effectsas the initial disturbance begins to affect the entire regionaleconomy.
The results are shown in the graphs of Figure 8.3. The first setof graphs show the direct effects spread over roughly the sametime-frame as in Chapters 6 and 7, with the shut-down beginningin late-1994 and extending into 1995. The graphs on the follow-ing page show the total impacts when indirect effects, and spilloverinto adjacent counties and regions are taken into account. WithinShelby County, the indirect effects on production and householdsare comparable in size to the direct impacts. Moreover, becauseof transaction lags, the indirect effects continue to be felt wellafter the initial (direct) production losses have been restored.
Figure 8.3 Direct and Indirect Consequences of a Power Cutback (Base Scenario)

145DECISION SUPPORT FOR CALAMITY PREPAREDNESS
Figure 8.3 Direct and Indirect Consequences of a Power Cutback (Base Scenario)(continued)

146 C H A P T E R 8
Agr
icul
ture
, Fo
rest
ry,
Fish
ing
Min
ing
Con
stru
ctio
n N
ondu
rabl
e M
anuf
actu
ring
Dur
able
Man
ufac
turi
ng T
rans
port
atio
n, C
omm
unic
atio
n, U
tiliti
es T
rade
F.I.R
.E.
Ser
vice
sLa
bor
Prop
erty
Tran
sfer
HH
Wag
e H
H R
ent H
HG
over
nmen
tC
apita
l
Shel
by, T
N
Opt
imal
Non
-opt
imal To
tal
Loss
Shar
eA
nnua
lD
irec
tLo
ssSh
are
Ann
ual
Ann
ual
Gro
wth
Ann
ual
Out
put
Dir
ect
Loss
Shar
eA
nnua
lSh
are
Ann
ual
Tota
lLo
ss
Rat
ioO
ptim
al/
Non
-O
ptim
al
Rat
ioO
ptim
al/
Gro
wth
Sect
or
773 29
3546
3724
3935
785
7
6372
5709
1212
514
729
693
1 2
758
111
8034
0886
0838
39
7% -4% 1% 4%
1%
5%
2% 2
% 2
% 2
% 4
% 6
% 3
% 4
% 4
% 2
%
2.7
0.7
39.7
99.
044
.9 7
2.7
83
.159
.873
.5
53.9
0.4%
2.3
% 1
.1%
2.7
% 1
.1%
0.9
%
1.3%
1.0%
0.6
%
0.6%
6 1 66 1
54 79
117
124 97
197
217
128 41
134 37
148 42
0.8%
4.8
% 1
.9%
4.1%
2.0
% 1
.5%
1.9
% 1
.7%
1.6%
1.5
% 1
.8%
1.5%
1.2
% 1
.1%
1.7%
1.1%1
1 2
.7 0.8
2.0
119
.1 3.4
89.7
97
.1 2
.4 2.9
1.5
0.3
% 2
.7%
0.1
% 3
.2%
0.1%
1.1
%
1.5
% 0
.0%
0.0
%
0.
0%
6 1 17
159 19
121
120 25 69
127 78
17 79 23 62 25
0.7%
4.9
% 0
.5%
4.3%
0.5
%1.
5%
1.9
%0.
4%0.
6% 0
.9%
1.1
% 0
.6%
0.7%
0.7%
0.7
% 0
.7%
93%
102% 26
% 1
04%
24%
103
%
97%
25%
35%
59%
61%
42%
59%
61%
42%
61%
10%
-12
2% 52%
106%
44% 31
%
110% 21
%25
%38
%26
%11
%25
%16
%20
%29
%
Tabl
e 8.
5 B
ase
Scen
ario
and
Opt
imal
Impa
cts
by L
ocal
ity a
nd A
ctiv
ity

147DECISION SUPPORT FOR CALAMITY PREPAREDNESS
Cri
tten
den,
AR
Opt
imal
Non
-opt
imal To
tal
Loss
Shar
eA
nnua
lD
irec
tLo
ssSh
are
Ann
ual
Ann
ual
Gro
wth
Ann
ual
Out
put
Dir
ect
Loss
Shar
eA
nnua
lSh
are
Ann
ual
Tota
lLo
ss
Rat
ioO
ptim
al/
Non
-O
ptim
al
Rat
ioO
ptim
al/
Gro
wth
Sect
or
Agr
icul
ture
, Fo
rest
ry,
Fish
ing
Min
ing
Con
stru
ctio
n N
ondu
rabl
e M
anuf
actu
ring
Dur
able
Man
ufac
turi
ng T
rans
port
atio
n, C
omm
unic
atio
n, U
tiliti
es T
rade
F.I.R
.E.
Ser
vice
sLa
bor
Prop
erty
Tran
sfer
HH
Wag
e H
H R
ent H
HG
over
nmen
tC
apita
l
11
65 62 53
86
130
181
156 91
214
322 47
922
0 2
56 1
61 147
110
8%
-5%
3%
2% 1% 6%
3% 5% 6% 3% 3%
6%
4%
6%
3% 3%
0.2
1.5
0.6
2.3
1.5
1.7
2.0
1.0
1.3
0
.9
0.4
%2.
3%1.
1% 2
.7%
1.1%
0.9%
1.3
% 1
.0%
0.6
%
0.6%
0.6
1.6
1.1
2.9
2.2
2.5
2.9
1.3
3.2
5.0
2.9
1.5
3.1
1.4
3.5
1.0
0.9
% 2
.6%
2.1%
3.4
% 1
.7%
1.4%
1.9%
1.5%
1.5%
1.5
%0.
6%0.
7%1.
2%0.
9%2.
4%0.
9%
0.2
0.0
0.6
1.8
1.6
1.8
1.6
0.9
1.6
0.9
0.3%
0.0
% 1
.1%
2.1%
1.2%
1.0%
1.0%
0.9%
0.8%
0.6%
0.5
0.1
1.0 2.3
2.0 2.4
2.3
1.1
3.0 4.3
2.4
1.3
2.5
1.1
3.0
0.8
0.7%
0.2
% 1
.8%
2.7
%1.
5% 1
.3%
1.5
% 1
.2%
1.4%
1.3%
0.5
% 0
.6%
1.0%
0.7
% 2
.0%
0.7
%
84% 8
%86
%79
%92
% 9
7%
78% 83%
96%
87%
84%
82%
79%
78%
85%
79%
10%
-5% 65%
141%
105%
21%
46%
24%
23%
48%
18% 9
% 2
6%11
%65
%25
%

148 C H A P T E R 8
8 . 5 . 3 I n c o m e D i s t r i b u t i o n a n d
I n t e r r e g i o n a l I m p a c t s
Table 8.5 shows the total impacts for all activities — busi-nesses, factors, institutions, households and government — in theShelby and Crittenden counties accumulated to the year 2005. Itis seen that, even though the two economies experience propor-tionately the same initial shocks, the total impact, after all multipliereffects are accounted for, differ markedly. With the mining sector,for example, the initial shock in both counties is 2.3% of annualoutput, but rises to 4.8% in Shelby, but only 2.6% in the smallerCrittenden economy. The loss of household income to householdsin Crittenden is also somewhat less than in Shelby, partly becauseof the differences in size and structure of the two economies, andbecause of the pattern of commuting between them. The tablealso shows that the loss in wage income to workers is somewhatless than the loss in net profits to businesses. This pattern is notfully reflected in the shares of income loss by wage and rent tohouseholds because a considerable portion of rent and transferincome comes from well outside the Shelby area (via investments,retirement funds, and state and federal government), and this cush-ions the local impact.
The consolidated impacts for each county and regional blocare shown in Table 8.6. It is seen that in absolute terms there isconsiderable spill over into neighboring counties, and even to dis-tant regions of the United States. While this is not a “disaster” (it isindeed relatively insignificant) for these distant regions, it still im-plies a considerable loss to the nation as a whole (as large as theloss to Shelby County itself). Arguably, this spill over effect shouldbe taken into consideration in any cost-benefit of disaster pre-paredness measures. This is not least because the spillover from alarge county such as Shelby onto its smaller immediate neighborscan also be comparable to the impacts of events within the smallcounty.
This base scenario illustrates some implications of the Mem-phis model for income distribution, and inter-county phenomena.In practice, these impacts would be considered in the context ofother events, for example, the failure of water supply and trans-portation lifelines also caused by the earthquake, as well as theappropriate policy responses (such as federal aid to victims).

149DECISION SUPPORT FOR CALAMITY PREPAREDNESS
8 . 5 . 4 R e a l l o c a t i o n o f R e s o u r c e s
Depending on the precise details of the local lifeline system,there will always be some discretion exercised as to which partsof the power network will be repaired first, or how the availablecapacity will be allocated. The model may be used to illustratehow different priorities with respect to the allocation of supplymight reduce the cost of a disaster to the community as a whole,and how this will affect specific communities and industries (seeCole, 1995). With this Memphis example, there is the possibility,for example, of re-directing the remaining electricity supply, orreinstating supply in such a way as to reduce the overall economiclosses to the wider community as in Chapter 7. Such optimalreallocation of supplies is also possible with the multi-region so-cial accounts (see Cole, 1995).
Table 8.5 compares the results of an optimal allocation withthe base (non-optimal) allocation described above for Shelby andCrittenden counties. For the alternative scenario, the total short-fall in (the value of) electricity supplied to Shelby and Crittendencounties over the period of the cutbacks is reallocated so as tominimize total accumulated loss in value added (Gross Regional
Note: Total output is income of all activities
Table 8.6 Direct and Total Impacts by Locality and Region (all dollar figures inmillions)

150 C H A P T E R 8
I n t e g r a t i o n i n t o P o l i c yM a k i n g
8.68.68.68.68.6
Product) to the region. To achieve this, the reallocation reducescutbacks to sectors which have a high total (direct plus indirect)income loss for a given total power loss. In this example, all ac-tivities are constrained not to expand production above theirpre-disaster level. Without going into detail, it is clear that thereare some considerable reductions in the overall impact comparedto the base scenario. There are also substantial shifts in the directand indirect losses for the various production activities and insti-tutions, which may be traced to their varying composition of inputs(especially electricity). For a given activity, these shifts are some-times in different directions between the two counties. For example,the direct loss to nondurable manufacturing increases from $99 to$119 million in Shelby, but reduces from $2.3 to $1.8 million inCrittenden. Thus, the reallocation has quite different implicationsfor industries in the two counties. It also has different consequencesfor households so that the losses to households in Shelby are re-duced to about 50% from base scenario, while losses in Crittendenare reduced only by 20%.
These calculations illustrate a number of important points aboutpolicy-oriented models. Not least is that, while significant overallsavings are possible, economic factors are likely to be impactedunevenly. Even a fairly innocuous goal such as reducing losses tocommunity-wide value added is not in the interests of all indi-vidual industries or communities. From a policy perspective, thelast conclusion emphasizes that strategies chosen to deal with anyuntoward and disastrous incident is inevitably a matter of negotia-tion between the affected parties. In the example used in thischapter, an overarching question is, if the community loses a givenamount of electricity supply how might the cutbacks be distrib-uted in order to minimize the ensuing impacts to selected interestsin a mutually acceptable manner? The aim is to provide a “cost-benefit” analysis that can deal with the tradeoffs between economicand non-economic welfare, and the competing needs of variousinterest groups and communities (see e.g., Layard, 1980).

151DECISION SUPPORT FOR CALAMITY PREPAREDNESS
Certainly, it is important to consider a range of alternative re-covery strategies, responses, and scenarios, so that critical tradeoffsand choices for different interest groups can be identified, and sofacilitate negotiated compromises. Ideally, interests should beweighted to establish some broadly acceptable allocation, recog-nizing that there are several difficulties in balancing economicand non-economic utilities across competing interest groups. It isargued in Cole (1995) that most contingency evaluation should betreated as a multi-criteria assessment rather than a cost-benefitanalysis (van der Veen et al., 1994). It should be said that whileeconomists have devised these methods to assess the impon-derables associated with more sustained environmental hazards,these methods may be less useful for the situation of sudden disas-ters. Sudden disasters present some major problems because oftheir uniqueness, the difficulty in assembling data, the complexityof the institutions, the modus operandi of actors involved in nego-tiation, and so on. For this reason, it is necessary to consider howmodels such as those described in this chapter might be employedto best effect.
8 . 6 . 1 D e c i s i o n S u p p o r t S y s t e m s
v e r s u s E x p e r t S y s t e m s
The way in which the social accounting model and the eventmatrix might be used to aid decisions depends on the precise ap-plication. To explore this, it is useful to distinguish between twotypes of application in “well defined” and “poorly defined” or“chaotic” situations.
The first application approximates the circumstances of Mem-phis as a research laboratory for disaster preparedness. The secondcorresponds to the type of situation for which the modeling sys-tem developed here ultimately is designed to contribute. Thesedistinctions dictate the type of modeling system that might be use-fully employed, emphasize the balance between quantitative andqualitative representation, and the degree to which problems arewell, or ill-defined, and thus the extent to which they can be mod-eled in a mechanical fashion (see, e.g., Harris and Batty, 1993;Choi and Kim, 1992). It should be said that the promise of expertsystems based on concepts of artificial intelligence has provedhard to realize and, even for well defined situations, the literature

152 C H A P T E R 8
increasingly speaks of decision support systems rather than expertsystems (Guariso and Werthner, 1991). While the approach of thisproject falls into the generally accepted definition of aiming tohelp a community do for itself what otherwise experts might beasked to do (see, e.g., Borri, et al., 1994), this nevertheless leavesopen many issues of system interface design and mode of applica-tion.
The two types of application — well-defined and chaotic —also map closely onto the distinction made in other investigativesciences such as anthropology between the emic and the etic per-spectives (i.e. the local views of a community versus the outsideanalysis of the development agencies or researchers). As Dyer(1995) and others have argued the “culture of response” is derivedfrom the intersection of these perspectives, and this is critical fordetermining the overall outcomes of the recovery process. Theinternal process is dictated by the immediate felt needs and sharedcultural values of the impacted community, while the external re-sponse comes from any outside agencies (such as the FederalEmergency Management Agency) that are mandated to mitigatethe effects of a disaster.5
In chaotic situations, there is much evidence that very sophis-ticated models are quite unacceptable in some policy makingsituations (United Nations, 1994). This second type of situationtherefore appears to demand a reduced decision support system— one that is quite open to public scrutiny and modification. Thus,even though the manner in which the model is derived may befairly sophisticated, it must have the ring of truth about it for thelocal community. To be effective, it must be possible for local groupsto be highly involved, and to see that their interests are accountedfor properly. Such lessons are clear from the work of authors suchas Cuny (1983), Pantelic (1989), and Dynes and Tierney (1994).The challenge remains to bring the more elaborate but (hopefully)better-specified models such as those described here out of theresearch mode and transform them into effective aids for disasterpreparedness and recovery, and fulfill the hope long expressed byJones (1981, 1989), Aysan et al., (1989), and others, that naturaldisasters, however painful, can be used to stimulate positive de-velopments in the community.

153DECISION SUPPORT FOR CALAMITY PREPAREDNESS
N o t e s
1. This provides the basis for later transforming into social categories ofhouseholds who are most at risk from disasters. For example, in thepilot studies mentioned earlier, households have been sub-divided,by minority status, gender, and age (Cole, 1994), and by residenceand kinship networks (Cole, 1993; Cole, 1996b).
2. The procedures are developed in Visual Basic for Excel (see Cole,1997).
3. In Cole (1988) it is shown that a general approximation to solution ofthe calculation of time-lagged economic impacts is given by themodified Leontief inverse. For the linear case (i.e. a diagonal trans-action matrix), this reduces to the Shinozuka et al. (1995) fragilityequation used in Rose et al. (1997, and Chapter 7 of this mono-graph), and Bates’ (1994) method for analysis of travel time reliability.The manner in which the equation might be adapted to the situationwhen an economy collapses progressively as a consequence of avery large disturbance, and the properties of the solution when clus-ters of counties are aggregated together, are discussed in Cole (1997).
4. A similar method has been proposed by Boisvert (1992).
5. The manner in which these interact is still a matter of debate. Oliver-Smith (1995), for example, notes that neither rational choice theory,nor the resource mobilization approach, both of which underlie theresearch model developed here, can account for the social and emo-tional conditions following a disaster.

154 C H A P T E R 8

155
2
99999
Reducing the potential loss of property and lives, or the risk,of future damaging events, is the primary motivation for most earth-quake hazards research. Resulting risk reduction policies andactions are also the principal measures of effectiveness for researchprograms, products and practices (Nigg, 1988). Unfortunately, assuccinct as the objectives for effective earthquake risk reductionmay seem, the process leading from scientific innovation to riskreduction policy formulation and implementation is extraordinar-ily complex.
Petak (1993) defines risk management as “concerned with theactions necessary to mitigate or control the risk” and that theseactions “derive from a decision process that results in the policiesthat establish a level of acceptable risk for the community or orga-nization.” Clarke (1989) defines the process of determining thelevel of acceptable risk as having five key steps: “defining theproblem, assessing the consequences, ordering the alternatives,constructing acceptable risk assessments, and accepting the risk”(including implementing measures to achieve the acceptable level).Therefore, acceptable risk is as much a political issue as it is ascientific issue.
To many in the research field, earthquake knowledge genera-tion is described with terms like “scientific breakthrough” and“product development” — those milestones leading to advancesin the state-of-knowledge. These efforts often focus on advancingaspects of risk analysis (e.g. hazard characterization, vulnerabilityanalyses, and risk assessment). But, comprehensive risk manage-ment must include more than risk analysis and knowledgegeneration in order to affect change, or, in this case, influence riskreduction policymaking (Petak, 1993). It must also include knowl-edge development to apply effective risk reduction practices (e.g.
Implications for Effective
Lifeline Risk Reduction
Policy Formulation
and Implementation
by Laurie A. Johnson and
Ronald T. Eguchi

156 C H A P T E R 9
technology transfer, education, and training) as well as empower-ment to formulate, adopt, implement and sustain practices andpolicies that make our communities safer from earthquakes(Cassaro et al., 1995; CUSEC, 1993).
In the area of lifeline earthquake risk reduction, recent discus-sions within the Technical Council on Lifeline EarthquakeEngineering (TCLEE) of the American Society of Civil Engineers(ASCE) have suggested that the gap between the lifelines technicaland policymaking communities is significantly greater than manyother areas of the earthquake community (Taylor, 1996). There-fore, investigators in this study have been handed an even greaterchallenge, and likewise a greater opportunity, to envision the bridgethat leads from innovation to policy implementation.
This chapter attempts to help build this bridge by focusing onthe policy implications of the engineering and socioeconomicanalyses of earthquake-induced electric power disruption in Mem-phis, particularly as they relate to earthquake risk reduction forlifelines systems. In the first part of this chapter, some of the sig-nificant additions to the existing knowledge base for lifeline riskreduction, resulting from this study, are examined. They are:
• Substantial advances in accessing the indirect losses on af-fected service users for consideration in future performancedesign criteria for electric power systems.
• Advances in assessing optimum strategies for service restora-tion following a major disaster.
• Advances in defining the resiliency factors to estimate eco-nomic losses over time.
In the second half of the chapter, beyond the knowledge ad-vances resulting from this study, the problem definition, potentialsolutions, participants, opportunities for choice, and institutionalcapacities that may lead to better lifeline risk reduction policiesand actions in the central U.S. and beyond are considered.
157POLICY FORMULATION AND IMPLEMENTATION
1. Substantial advances in assessing the indirect losses onaffected service users for consideration in future performancedesign criteria for electric power systems.
The performance of electric power systems is generally mea-sured by the repair costs resulting from actual disasters. In thesemeasurements, the indirect losses, associated with factors such asutility outages, outage time, or the effects on dependent businessesare largely ignored. This is primarily due to the lack of statisticaldata or actuarial experience to quantify these impacts. The meth-ods outlined in this report provide a way of simulating theseimpacts. Whether or not these measurements or methods can bereasonably implemented by the electric utility industry and pub-lic officials responsible for disaster management is not yet certain.
In order to understand the significance of indirect losses inmeasuring the performance of electric power systems, severalcomparisons are made in Table 9.1. This table reproduces theresults of the direct and indirect loss calculations made in Chapter7. In addition, information on the estimated repair costs to theMemphis Light, Gas, and Water (MLGW) electric power system inthe same New Madrid earthquake scenario have been added us-ing data from a related NCEER report (Chang et. al., 1996).
The total repair cost shown in Table 9.1 was derived from dataproduced by Chang et al. (1996). This report also uses a M 7.5earthquake near Marked Tree, Arkansas to simulate the effects onthe MLGW electric power system. In addition to electric power,this study also investigated the impact on water and natural gasdistribution systems. The results of the Chang report indicate thatrepair costs to major substations in a large New Madrid earth-quake could be as high as $400 million. Most of this damagewould occur in major gate stations ($366.5 million or roughly91% of the total repair cost). Additional damage would occur tolower voltage (23 kv and 12 kv) substations — approximately $35million.1
The direct and indirect economic losses as computed in Table9.1 were taken from Table 7.2. Direct losses were interpreted as
9.19.19.19.19.1
S t u d y I m p l i c a t i o n s

158 C H A P T E R 9
those associated with gross output losses that consider no bottle-neck effect. In other words, each economic sector is assumed tobe impacted only by a disruption of electric power service andnot additionally by supply input bottlenecks from other sectors.Indirect losses are then calculated by subtracting these “non-bottle-neck” losses from those gross output losses that do account forbottleneck effects. These indirect losses model the so called “mul-tiplier” or “ripple” effects.
As Chapter 6 (Direct Economic Impacts) points out, calculat-ing indirect losses can be difficult, partly caused by the manyassumptions required to execute the methodology. Resiliency orimportance factors are needed, for example, in order to quantifythe dependencies businesses have on electric power service. AsChapter 5 (Socioeconomic Analysis of Lifeline Usage) notes, thesedependencies can vary widely depending on the type and size ofthe business. Future studies should focus on the sensitivity ofindirect losses on changes in input parameters and assumptions.
A comparison of the various losses in Table 9.1 shows thatindirect losses are approximately five times larger than expectedrepair costs and about 2.5 times larger than direct losses. Moreimportantly, the combined total of direct and indirect losses areabout seven times larger than expected repair costs. This ratio issignificant since, in most earthquakes, the only economic loss data
aEstimated repair costs taken from Chang et al., 1996.
Table 9.1 Repair Costs and Associated Direct and Indirect EconomicLosses Due to the Failure and Disruption of Electric Power Servicein a Large New Madrid Earthquake

159POLICY FORMULATION AND IMPLEMENTATION
generally reported by electric power utility companies are the to-tal repair costs. Therefore, the full economic impact of electricpower failure and disruption is, in general, grossly understated. Infact, accounting for regional losses (i.e., beyond Shelby County)would add to the totals given in Table 9.1 (see discussion of met-ropolitan losses in Chapter 8), thus increasing the total impact ofthe earthquake well beyond repair costs.
Chapter 8 essentially expands spatially and temporally muchof the analysis in Chapter 7. The decision support system com-prises several components:
• Social Accounting Matrices for the Memphis metropolitan areacounties as well as the U.S. as a whole. This allows for theanalysis of impacts upon various segments of society, espe-cially different income classes and racial/ethnic groups.
• A GIS overlay system so that the county-level data can bereconfigured to any geographic area.
• A set of impact algorithms that can determine the indirect im-pacts from an earthquake both spatially and temporally, i.e.,for any county grouping and to include lags and impacts (othermodels to date typically assume all impacts take place withina fixed time period, most typically a year). Also, this lag struc-ture can be applied to the pace of recovery.
• An optimization routine that allows for the specification ofalternative objective functions for minimizing losses throughthe reallocation of scarce resources (e.g., it allows for differ-ential weighting of various stakeholders). This framework ismore general than that of Chapter 7 in terms of the number ofobjectives, but not as detailed in terms of factoring in lifelinesystem considerations.
The terminology in Chapter 8 of a “decision support system” ap-proach is for sophisticated users and allows for the maximumflexibility and range of outputs. It is intended as an aid to deci-sion-making and not a substitute. It emphasizes the use ofprofessional judgement in specifying model objectives, data andpolicies. This is in contrast with an “expert system,” which is usu-ally quite rigid and intended to provide the answer.

160 C H A P T E R 9
2. Advances in assessing optimum strategies for service res-toration and allocation following a major disaster.
Chapter 7 provides some insights into how the proceduresdeveloped in this study could be used to optimally ration scarceelectricity after a disaster, and to determine more effective restora-tion patterns or strategies. The results show that indirect lossescan be reduced three-fold if scarce electricity is reallocated ac-cording to a specially designed linear programming model, andfour-fold if an optimizing algorithm is employed for determiningthe best sequence for bringing back on-line damaged substations.As stated earlier in this section, whether these algorithms can beeffectively incorporated within the framework of an existing elec-tric power utility’s program is another issue. The fact that thesealgorithms have a significant effect in reducing potential losses todependent businesses, however, should provide enough impetusfor policymakers to at least explore the merit of using these meth-ods in post-disaster applications.
At the end of Chapter 7, several methods for implementingthese algorithms were introduced. One method of rationing pro-poses that electric power utilities could establish a contingentcontract with customers, whereby the availability of service aftera major earthquake would be tied to a premium and usage fee.By negotiating before the event, customers would agree to the feethey would pay for priority service after an earthquake. In imple-menting such a policy and program, utilities could maximize theircapacity to provide service to the larger area or region. Otherforms of rationing could include “rolling blackouts,” that allowcustomers to share residual power in the service region, and otherpricing structures that charge higher fees for greater usages.
It is unclear how such rationing strategies might work to dis-tribute power after a major earthquake. These rationing methodspresume that the power distribution system will remain intact tocarry electricity to customers, which contradicts the system vul-nerabilities underscored by recent earthquakes. Transmission anddistribution substations have historically been the weak link inpower distribution. Therefore, any optimization algorithm for al-locating residual power needs to consider additional scenarioswith certain key components missing.

161POLICY FORMULATION AND IMPLEMENTATION
3. Advances in defining the resiliency factors to estimate eco-nomic losses over time.
Chapter 5 summarizes the results of an extensive survey ofMemphis businesses and it substantially advances our understand-ing of business dependencies on utility services. The resultingdata provides important information which can be used to cali-brate resiliency2 factors that are largely based on expert opinion(ATC-25, 1991). As currently defined, these factors lack: 1) theability to model specific lifeline dependencies within a region, 2)the ability to recognize the recovery time path after a disaster, and3) the spatial dimension of lifeline service disruption and eco-nomic impact.
In this study, indirect loss analyses have been expanded bydeveloping resiliency factors which account for the three attributesidentified above. These new factors allow a more explicit defini-tion of lifeline dependency by quantifying the length of time abusiness can operate without utility service. This information canbe important to businesses in general by defining the minimumrequirements for continued operations. If this data are known,and if some assessment of utility outage can be provided, thenbusinesses can develop individual emergency response plans thatoffer alternatives for dealing with utility company service disrup-tions. Chapter 6 discusses the potential benefits of this type ofplanning.
With the application of these new resiliency factors in Mem-phis, efforts to enhance this kind of information in other parts ofthe country may be more likely. This study illustrates the signifi-cance of incorporating local data about business dependenciesinto loss estimates. It is particularly important for agriculture,mining, construction and transportation, communications and util-ity industries. Therefore, any effort to improve the reliability of thisdata would be meaningful.

162 C H A P T E R 9
Based on interviews with representatives of six major utilities,Taylor (1996) notes two significant barriers to lifeline risk reduc-tion policy implementation as: 1) the importance of private utilities,and the comparative lack of reasons for federal interest in the seis-mic performance of these utilities; and, 2) the multi-jurisdictionalnature of lifeline networks, involving local, regional, state, andfederal jurisdictions. In contrast, seismic building codes, retrofitprograms, and land use plans are typically adopted by only onejurisdiction. But in spite of the many constraints challenging life-line risk reduction policymaking, successful policies and practiceshave been implemented.
The second half of this chapter synthesizes significant aspectsof public policy research in with anecdotal insights gained fromcurrent lifelines industry practices as an opportunity for formulat-ing and implementing more effective lifelines risk reduction policiesand practices in the central U.S. and beyond.
9 . 2 . 1 P o l i c y F o r m u l a t i o n M o d e l
An organization decisionmaking model, referred to as the “gar-bage can model of organizational choice” has been adopted byseveral hazards researchers to describe the public policy formula-tion process. As Petak (1993) notes, the garbage can name derivesfrom the recognition that “decisionmakers are frequently con-fronted with numerous simple and complex problems, multiplesolution alternatives and choice opportunities.” Therefore, underthis model, four essential ingredients that must exist in order fordecisions or policies to be made are problems, solutions, partici-pants, and an opportunity. Mittler (1989) suggests that a fifthingredient — institutional capacity — must also exist in order forpolicy to reach the issue agenda and be adopted. The followingsections consider how these five ingredients mixed with knowl-edge advances resulting from this study can lead to more effectivelifelines risk reduction policies and practices.
9.29.29.29.29.2
Towards Effective Lifeline RiskReduction Policy Formulationand Implementation
163POLICY FORMULATION AND IMPLEMENTATION
1. Achieving an appropriate risk reduction policy requires aclear and precise explanation of the problems being considered.
Earthquake risk estimation provides helpful information fordeveloping a greater understanding of the expected losses, andtherefore establishes a frame of reference in which policymakerscan weigh specific risks (Petak, 1993). This study enhances theunderstanding of two important problems: 1) improving the un-derstanding of the seismic risk in the central U.S., and 2) illustratingpotential deficiencies in current seismic performance design cri-teria for electric power systems.
While the probability of a large central U.S. earthquake con-tinues to be a subject for scientific controversy and debate, thepotentially overwhelming economic impacts (both regionally andnationally) can not be ignored. To an experienced utility operatoror engineer, the information in this study is probably at best, pro-vocative food for thought. Utility companies should not beexpected to make a decision to review their acceptable risk poli-cies or to implement a risk reduction action based on thisinformation alone. However, this study provides compelling evi-dence for considering a long-term risk management strategy toreduce the earthquake vulnerability of Memphis’ electric powersystem, and appropriate next steps might be to consider the con-sequences of additional earthquake scenarios.
The relative loss data in Table 9.1 may also be useful for utili-ties, in defining earthquake risk reduction policy, by establishingmore appropriate and acceptable performance criteria for electricpower systems. A number of recent technical documents (includ-ing the FEMA/NIST Plan for Developing and Adopting SeismicDesign Guidelines and Standards for Lifelines) underscore the im-portance of examining lifeline performance from a broader rangeof impacts, beyond repair costs.
On a relative scale, repair costs (as indicated by Table 9.1)account for a small percentage of the economic impacts associ-ated with the failure and disruption of electric power systems. Ifan assessment of acceptable performance is based solely on thesecosts, then earthquake risk reduction measures may overly em-phasize seismic design criteria for critical equipment and couldignore opportunities to improve operational procedures that mayalso account for large reductions in potential losses to affectedusers. A more detailed analysis of the indirect effects could pro-

164 C H A P T E R 9
vide an added impetus to electric power utilities and regulatingagencies to explore other measures for reducing expected down-times and/or improving restoration efforts.
2. Viable solutions are needed to translate policies on ac-ceptable levels of earthquake risk into meaningful riskmanagement strategies with specific actions, milestones, andbudgets.
Generally speaking, mitigation involves programs or activitiesthat will: 1) reduce the probability and/or intensity of an event, 2)reduce the vulnerability of structures, contents and process sys-tems to the forces caused by an event, and/or 3) reduce the exposureof people and property to an event (Petak, 1993). The loss estima-tion methodologies utilized in this study, relied on local informationon businesses and the economy to calibrate business resiliency tolifeline disruption and to identify the pattern of economic activityat risk throughout Shelby County. A number of viable solutionsfor loss reduction policy formulation, including post-disaster re-covery strategies and pre-disaster planning, have also beenproposed.
This study provides a number of operational strategies whichmight reduce potential losses to customers. These strategies arebased on innovative techniques to optimally allocate limited post-earthquake service capacities or improve restoration times to moreeconomically important businesses. The self rationing alternativesuggests that customers pay a non-interruptibility premium, toensure a certain level of capacity before the earthquake, and, ifpossible, in its aftermath. This allows the utility to optimize re-source allocations by setting usage prices and also to guaranteeenough capacity to manage the systems’ load. The direct quantityrationing alternative proposes using rolling blackouts for non-es-sential industries or similar means to directly control the temporaland spatial distribution of power restoration.
A more effective restoration scheme, based on economic fac-tors, provides many opportunities for reducing both the short- andlong-term losses caused by earthquake-damaged electric powersystems. Studies have shown that long-term recovery can be en-hanced if the right set of decisions are made in the early stages ofan earthquake disaster. Many businesses can operate for shortperiods of time without electric power service, however, extended

165POLICY FORMULATION AND IMPLEMENTATION
outages can lead to business failures and closures. Using thesemodels, utilities have an opportunity to join with other agenciesin establishing restoration priorities, and therefore provide a morecoordinated, multi-agency recovery effort. For small communi-ties, this is a straightforward task, particularly where one businessis responsible for the region’s primary economy. For larger urbanareas, however, this may be more difficult and would require amore sophisticated approach.
In addition to electric power utilities and affected businessowners, insurance companies might also be interested in the re-sulting methods to quantify indirect losses. There may be a marketdemand for insurance riders that cover business interruption losses,resulting from direct damage to the facility or building, or externalfactors, such as loss of electric power service. This coverage is notgenerally offered because of the lacking actuarial experience toassess risk and appropriate premiums. The methods developed inthis study could be used to calculate the potential magnitude ofthese losses and then used in establishing a credible insurancestructure. As a result, insurance companies might be better ableto offer business interruption coverage on a broader and less re-strictive basis.
3. Identifying and mobilizing internal “champions” for earth-quake risk reduction is essential for policy formulation andimplementation.
Broadly speaking, effective earthquake risk reduction requiresthe participation of scientists, engineers, and policy makers (Nigg,1988; Petak, 1993). More specifically, in lifeline earthquake riskreduction, a highly diverse and specialized group of lifelines andsystems research engineers, engineering seismologists, utility own-ers and operators, facilities engineers and managers, emergencymanagers, regulators, insurers, and government officials, are es-sential.
Furthermore, recent studies have illustrated the value of view-ing research utilization not as a linear process in which knowledgeproducers simply inform users (Michaels, 1992; Cassaro et al.,1995; Taylor, 1996), but rather, as a more iterative and interactiveprocess, involving “information networks” with diverse groups ofparticipants having similar concerns.
166 C H A P T E R 9
With regard to this study, some particularly relevant targetnetworks are TCLEE and the Earthquake Engineering Research In-stitute (EERI) for lifeline engineering design and constructionprofessionals, electric power industry associations for utility own-ers and operators, and insurance associations for risk managers ofkey insurance companies. The following section identifies someof the current federal, multi-state and regional initiatives whichoffer key opportunities for influencing existing risk reduction policynetworks in the central U.S.
Finally, with regard to advocacy concerns, the Memphis busi-ness survey data described in Chapter 5 suggest that “the currentapproach to encouraging earthquake and general disaster prepared-ness among businesses, which emphasizes public awareness andeducation, is achieving little.” The chapter also suggests that inorder to achieve more widespread adoption of loss reductionmeasures, new policy implementation strategies must make suchmeasures attractive to and affordable for the business community.
4. Good people, with good solutions to clearly defined prob-lems, may be able to formulate effective risk reduction policies.Policy adoption, however, can not occur without an opportunityfor political choice or action.
According to Taylor (1996), landmark seismic evaluation pro-grams have been instrumental in placing earthquake issues on theutility companies agendas. Furthermore, a key influencing fea-ture of the lifeline success stories is the place lifeline earthquakerisk issues typically hold as “standing issues” (not always pressingbut always present) on the political agendas of utility companiesand other policymakers. In a sense, they are part of the constantattention paid to lifelines by policymakers. In contrast, many otherseismic issues have difficulty getting on the agenda at all, or ofgaining the attention of policymakers. Based on these insights,the window of opportunity for lifeline seismic risk reduction maybe more widely and consistently opened, than it might be in otherparts of the earthquake community. Some potential opportunitiesrelevant to this study include:
• Individual companies. In 1994 and 1995, the Central U.S.Earthquake Consortium, with support from the Department ofEnergy, developed and conducted a technical, hands-on two

167POLICY FORMULATION AND IMPLEMENTATION
year program for senior electric utility managers in the sevenCUSEC states. As participants in the program, each utility car-ried out a vulnerability assessment of their respective facilitiesand systems, developed a utility policy on acceptable levelsof risk, and developed a mitigation plan and implementationstrategy for their utility (Palmer and Shaifer, 1995).
• Industry sector initiative. The Tennessee Valley Public PowerAssociation (TVPPA) represents electric utility distributors inthe Tennessee Valley Authority regions. TVPPA has developeda Model Emergency Response Plan for Utilities and has con-ducted relevant training sessions and workshops in emergencyplanning, training, and information exchange for electric utili-ties in the regions. Participants at the 1995 Annual Meeting ofthe Central U.S. Earthquake Consortium (CUSEC, 1995) rec-ommended that the Department of Energy, CUSEC and TVPPAcollaborate to develop and implement a comprehensive emer-gency preparedness program with practical, cost-effective stepsfor federal, state, local, and utility officials to take to addresspredictable post-disaster problems and expedite service resto-ration. Restoration optimization strategies resulting from thisstudy could be particularly useful to this effort.
• Multi-state, multi-industry initiatives. Two multi-industry ini-tiatives are noteworthy. The first is located in the central U.S.and the second in California.
a. The Central U.S. Earthquake Consortium is currently inthe midst of a three-year program to develop a multi-state, multi-industry strategy for managing and coordi-nating the large-scale energy emergency response anddisaster recovery operations in the aftermath of a cata-strophic earthquake in the New Madrid Seismic Zone.A key element of the strategy is the creation of an emer-gency industry regional support team with designatedofficials specifically tasked to improve coordination ofgovernmental and energy industry response and recov-ery operations, as well as to improve support to decisionmaking for priority service restoration and system recon-struction (CUSEC, 1995).
b. The Inter-utility Seismic Working Group is an ad hoccommittee initially formed of earthquake specialists forthe major gas and electric power utilities in California,

168 C H A P T E R 9
and now including utility representatives from the PacificNorthwest and elsewhere. Group members have collabo-rated to develop a common policy statement for earthquakevulnerability reduction with the ultimate goal of reachingand maintaining an acceptable level of earthquake risk (Sav-age, 1995). Each utility is responsible for preparing andimplementing a long-term seismic safety plan which com-plies with the policy statement and is based on currentknowledge, technical capabilities and industry practices.
5. For the model to be complete, institutions must also havethe necessary resources to formulate, adopt and effectively imple-ment risk reduction policies.
The institutions capable of formulating, adopting, implement-ing and sustaining the risk reduction practices and policiessuggested in this study, must have the necessary knowledge devel-opment (e.g. technology transfer, education, and training) as wellas empowerment. The investigators involved in this study havetaken some important first steps in enhancing knowledge devel-opment by involving MLGW staff in the process, andcommunicating study results in professional journals and at pro-fessional meetings and other regional conferences. It is importantto recognize, however, that institutional empowerment may notbe possible without additional resources, including financial sup-port for workshops and hands-on training. Professionalassociations, such as TCLEE, ASCE, and EERI, as well as federaland regional agencies, such as the Federal Emergency Manage-ment Agency, National Institute of Building Standards, and CUSEC,can play an important role in providing these empowerment re-sources.
9.39.39.39.39.3
C o n c l u s i o n
Clearly, the results of this study do not provide a final solutionfor reducing the economic consequences of a potential NewMadrid earthquake. For the first time, however, there is now amore complete listing of the critical models and methodologies

169POLICY FORMULATION AND IMPLEMENTATION
needed for taking a more comprehensive view of the potentialeconomic losses resulting from an earthquake-induced, regionalelectric power disruption. Likewise, there is also a better under-standing of how these results might lead to more effective lifelinerisk reduction policies and practices.

170 C H A P T E R 9
1. As a means of comparison, repair costs to Los Angeles area electricpower systems (i.e., the Los Angeles Department of Water and Powerand the Southern California Edison Company) during the recent 1994Northridge earthquake totaled about $180 million. A large portionof this repair cost was derived from damage to nine high-voltage(230kv and 500 kv) substations.
2. Resiliency is defined here as the amount of production capabilityleft after complete disruption of lifeline service. In general, theseresiliency factors are specific to particular lifelines and industries.These factors, when compared to the length of time a particular life-line service is disrupted, can be used to estimate potential businessinterruption losses.
N o t e s

171
R e f e r e n c e s
Afrasiabi, A. and Casler, S., (1991), “Product-Mix and Technological Change Within theLeontief Inverse,” Journal of Regional Science, Vol. 31, pp. 147-160.
Alesch, D., Taylor, C., Ghanty, A. S., and Nagy, R. A., (1993), “Earthquake RiskReduction and Small Business,” Socioeconomic Impacts, Monograph 5, 1993National Earthquake Conference, Memphis, TN, pp. 133-160.
Ang, A.H-S., Pires, J., Schinzinger, R., Vallaverde, R., and Yoshida, E., (1992), SeismicReliability of Electric Power Transmission Systems - Application to the 1989Loma Prieta Earthquake, Technical Report to the NSF and NCEER, Dept. ofCivil Engineering, Univ. of California, Irvine, January.
Applied Technology Council, (1991), ATC-25: Seismic Vulnerability and Impact ofDisruption on Lifelines in the Conterminous United States, Federal EmergencyManagement Agency, Applied Technology Council, CA.
Applied Technology Council, (1985), ATC-13: Earthquake Damage Evaluation Data forCalifornia, Federal Emergency Management Agency, Applied TechnologyCouncil, CA.
Aysan Y., Coburn, A., and Spence, R., (1989), “Turning Short-term Recovery into Long-Term Protection,” paper presented at Reconstruction After Earthquakes: AnInternational Agenda to Achieve Safer Settlements in the 1990’s, NationalCenter for Earthquake Engineering Research, Buffalo, New York.
Bacharach, M., (1970), Biproportional Matrices and Input-Output Change, CambridgeUniversity Press, Cambridge, U.K.
Bates, J., (1994), “The Effect of Travel Time Reliability on Travel Behavior,” mimeo, 41stNorth American Regional Science Association, Niagara Falls, Canada.
Baumol, W. J., (1980), Economic Theory and Operations Analysis (Fourth Edition),Prentice-Hall, Englewood Cliffs, NJ.
Benuska, L. (Editor), (1990), “Loma Prieta Earthquake Reconnaissance Report,”Earthquake Spectra, Supplement to Vol. 6, Earthquake Engineering ResearchInstitute (EERI), May.
Berke, P. and Beatley, T., (1992), Planning for Earthquakes: Risk, Politics and Policy,Johns Hopkins University Press, Baltimore.
Boisvert, R. N., (1992), “Indirect Losses from a Catastrophic Earthquake and the Local,Regional, and National Interest,” Indirect Economic Consequences of aCatastrophic Earthquake, National Earthquake Hazard Reduction Program,Federal Emergency Management Agency, July, pp. 207-266.

172
Borri, D., Conte, E., Pace, F., and Selicato, F., (1994), “Norm: an expert system fordevelopment control in underdeveloped operational contexts,” Environmentand Planning B, Vol. 21, pp. 35-52.
Brooke, A., Kendrick, D., and Meeraus, A., (1988), GAMS: A User’s Guide, ScientificPress, San Francisco, California.
Brookshire, D. and McKee, M., (1992), “Other Indirect Costs and Losses from Earth-quakes: Issues and Estimation,” Indirect Consequences of a CatastrophicEarthquake, National Earthquake Hazard Reduction Program, FederalEmergency Management Agency, July.
Brucker, S. M., Hastings, S. E., and Lathan, W. R., (1987), “Regional Input-OutputAnalysis: A Comparison of Five ‘Ready Made’ Model Systems,” Review ofRegional Studies, Vol. 17, pp. 1-16.
Burrough, P. A., (1986), Principles of Geographic Information Systems for LandResources Assessment, Oxford University Press, New York, NY.
Cassaro, M. A., et al., (1995), A National Strategy for Natural Disaster Reduction: ACall for Coordination of Disaster Reduction Activities, Earthquake Spectra,Earthquake Engineering Research Institute, Volume II, No. 3, August.
Central U.S. Earthquake Consortium, (1997), “Role of Business Alliances in a Commu-nity-Based Mitigation Program,” CUSEC Journal, Vol. 4, No. 1, pp. 9-10.
Central U.S. Earthquake Consortium, (1995), A Call for Action, Findings and Recom-mendations of the Annual Meeting of the Central U.S. Earthquake Consor-tium, November 13-15, St. Louis, Missouri.
Central U.S. Earthquake Consortium, (1993), Preparedness, Awareness, and PublicEducation, Monograph 3, 1993 National Earthquake Conference, May 3-5,Memphis, Tennessee.
Chang, S., (1983), “Disasters and Fiscal Policy,” Urban Affairs Quarterly, Vol. 18, pp.511-523.
Chang, S. E. and Taylor, W. J., (1995), “Economic Impact of Lifeline Disruption: CurrentModels and Preliminary Observations from the Hanshin Earthquake,”Proceedings of the U.S.-Japan Workshop on Earthquake Disaster Preventionfor Lifeline Systems, Osaka, Japan.
Chang, S. E., Seligson, H. A., and Eguchi, R. T., (1996), Estimation of the EconomicImpact of Multiple Lifeline Disruption; Memphis Light, Gas and Water CaseStudy, Technical Report NCEER-96-0011, National Center for EarthquakeEngineering Research, Buffalo, NY.
Chang, S. E., Seligson, H. A., and Eguchi, R. T., (1995), “Estimation of Economic LossesCaused by Disruption of Lifeline Service,” Proceedings of the Fourth U.S.Conference on Lifeline Earthquake Engineering, San Francisco, CA, ASCE, pp.48-55.
Choi, K. and Kim, J., (1992), “An Integrated Transportation Planning Model with GISand Expert Systems,” mimeo, Department of Urban and Regional Planning,University of Illinois, Urbana-Champaign.

173
Clarke, L., (1989), Acceptable Risk? Making Decisions in a Toxic Environment,University of California Press, Berkeley, California.
Cochrane, H., (1997), “Indirect Economic Losses,” Development of StandardizedEarthquake Loss Estimation Methodology Vol. II, Risk Management Solutions,Inc., Menlo Park, CA.
Cochrane, H., (1974), “Predicting the Economic Impact of Earthquakes,” SocialScience Perspectives on the Coming San Francisco Earthquake, (H. C.Cochrane et al., Editors), Natural Hazards Research Paper No. 25, NHRAIC,University of Colorado, Boulder, Colorado.
Cole, S., (1997), “Of Maps and Macros: A Spreadsheet Approach to GIS,” Environmentand Planning B, (forthcoming).
Cole, S., (1996a), “A GIS-Based Many-Region Disaster Preparedness Model for theUnited States,” Proceedings of the Third International Workshop on Integrat-ing Environmental Modeling and GIS, (M. Goodchild et al., Editors), Santa Fe,New Mexico.
Cole, S., (1996b), “Economy and Ecology in a Small Caribbean Island,” Historical andAnalytical Approaches to Ecological Economics, (J. van den Berg and J. vander Straaten, Editors), International Society for Ecological Economics,(forthcoming).
Cole, S., (1995), “Lifelines and Livelihood: A Social Accounting Matrix Approach toCalamity Preparedness,” Journal of Contingencies and Crisis Management,Vol. 3, pp. 1-11.
Cole, S., (1994), “A Community Accounting Matrix for Buffalo’s Eastside Neighbor-hood,” Economic Development Quarterly, Vol. 8, No. 2, May, pp. 107-126.
Cole, S., (1993), “Cultural Accounting for Small Economies,” Regional Studies, Vol. 27,No. 2, pp. 121-136.
Cole, S., (1992), “A Lagrangian Derivation of a General Multi-proportional ScalingAlgorithm,” Regional Science and Urban Economics, Vol. 22, pp. 291.
Cole, S., (1988), The Delayed Impacts of Plant Closures in a Reformulated LeontiefModel, Proceedings of the Regional Science Association, Vol. 65, pp. 135-149.
Cole, S., Pantoja, E., and Razak, V., (1993), A Social Accounting Matrix Approach toDisaster Preparedness and Recovery Planning, Technical Report NCEER 92-0002, National Center for Earthquake Engineering Research, Buffalo, NY.
Conway, R. S., (1980), “Changes in Regional Input-Output Coefficients and RegionalForecasting,” Regional Science and Urban Economics, Vol. 10, pp. 153-171.
Cuny, F., (1983), Disasters and Development, Oxford University Press, Oxford.
Dahlhamer, J. M., (1992), “Small Business and the Whittier Narrows Earthquake: LoanRequest Outcomes in the U.S. Small Business Administration Disaster LoanProgram for Businesses,” Master’s thesis, Disaster Research Center, Depart-ment of Sociology, University of Delaware, Newark, DE.

174
Dahlhamer, J. M. and D’Souza, M. J., (1997), “Determinants of Business DisasterPreparedness in Two U. S. Metropolitan Areas,” International Journal of MassEmergencies and Disasters, Vol. 15, No. 2, pp. 265-281.
Dahlhamer, J. M. and Reshaur, L., (1996), Businesses and the 1994 NorthridgeEarthquake: An Analysis of Pre- and Post-Disaster Preparedness, Preliminarypaper no. 240, University of Delaware, Disaster Research Center, Newark,DE.
Dahlhamer, J. M. and Tierney, K. J., (1998), “Rebounding from Disruptive Events:Business Recovery Following the Northridge Earthquake,” SociologicalSpectrum, (forthcoming).
Dahlhamer, J. M. and Tierney, K. J., (1997), “Winners and Losers: Predicting BusinessRecovery Outcomes Following the Northridge Earthquake,” Paper presentedat the Annual Meeting of the American Sociological Association, Toronto,Canada, August 9-13.
Davis, H. C. and Salkin, E. L., (1984), “Alternative Approaches to the Estimation ofEconomic Impacts Resulting from Supply Constraints,” Annals of RegionalScience, Vol. 18, pp. 25-34.
Davis, J. F., Bennett, J. H., Borcherdt, G. A., Kahle, J. E., Rice, S. J., and Silva, M. A.,(1982a), Earthquake Planning Scenario for a Magnitude 8.3 Earthquake onthe San Andreas Fault in Southern California, CDMG Special Publication 60,California Division of Mines and Geology, Sacramento, California.
Davis, J. F., Bennett, J. H., Borcherdt, G. A., Kahle, J. E., Rice, S. J., and Silva, M. A.,(1982b), Earthquake Planning Scenario for a Magnitude 8.3 Earthquake onthe San Andreas Fault in Southern California, CDMG Special Publication 61,California Division of Mines and Geology, Sacramento, California.
Dillman, D., (1978), Mail and Telephone Surveys: The Total Design Method, Wiley,New York.
Drabek, T., (1995), “Disaster Responses Within the Tourist Industry,” InternationalJournal of Mass Emergencies and Disasters, Vol. 13, No. 1, pp. 7-23.
Drabek, T., (1994a), “New Study Shows that Growing Tourist Industry is InadequatelyPrepared for Emergencies,” Hazard Technology, Vol. 14, No. 1, pp. 17-21.
Drabek, T., (1994b), Disaster Evacuation and the Tourist Industry, Program on Environ-ment and Behavior, Monograph No. 57, Institute of Behavioral Science,University of Colorado.
Drabek, T., (1991), “Anticipating Organizational Evacuations: Disaster Planning byManagers of Tourist-Oriented Private Firms,” International Journal of MassEmergencies and Disasters, Vol. 9, No. 2, pp. 219-245.
Duke, C. M. and Moran, D. F., (1972), “Earthquakes and City Lifelines,” San FernandoEarthquake of February 9, 1971 and Public Policy.
Durkin, M. E., (1984), “The Economic Recovery of Small Businesses After Earthquakes:The Coalinga Experience,” paper presented at the International Conferenceon Natural Hazards Mitigation Research and Practice, New Delhi, October6-8.

175
Dyer, C., (1995), “An Analysis of the Variability of Institutional and Cultural Reaction tothe Impact of Hurricane Andrew,” mimeo, American AnthropologicalAssociation, Washington, November.
Dynes, R. and Tierney, K., (1994), Disasters, Collective Behavior, and Social Organiza-tion, University of Delaware Press, Newark.
Ebert, C., (1982), “Consequences of Disasters for Developing Nations,” Impact ofScience on Society, Vol. 32, No. 1, pp. 93-100.
Eguchi, R. T., (1997), “Mitigation Risks to Lifeline Systems Through Natural HazardReduction and Design,” Economic Consequences of Earthquakes: Preparingfor the Unexpected, (Barclay G. Jones, Editor), National Center for Earth-quake Engineering Research, Buffalo, New York, January.
Eguchi, R. T., Seligson, H. A., and Wiggins, J. H., (1993), Estimation of SecondaryLosses Associated with Lifeline Disruption, Fourtieth North AmericanMeeting, Houston, Texas.
Eguchi, R. T., Seligson, H. A., and Wiggins, J. H., (1992), “Indirect Losses Caused byLifeline Damage or Disruption,” Proceedings of the Fifth U.S.-Japan Work-shop on Earthquake Prevention for Lifeline Systems, Tsukuba Science City,Japan.
Electric Power Research Institute (EPRI), (1992), Interactive Power Flow Version UsersManual, Electric Power Research Institute.
Ellson, R., Milliman, J., and Roberts, R., (1984), “Measuring the Regional Effects ofEarthquakes and Earthquake Predictions,” Journal of Regional Science, Vol.24, pp. 561-579.
Environmental Systems Research Institute (ESRI), (1988), ARC/INFO Users Manual,Environmental Systems Research Institute, Redlands, CA.
Federal Emergency Management Agency, (1995), A Plan for Developing and AdoptingSeismic Design Guidelines and Standards for Lifelines, FEMA 271, MitigationDirectorate, Washington, D.C., September.
Federal Reserve Bank of Atlanta, (1997), Regional Update, Vol. 10, No. 1, p. 15.
French, S. P. and Jia, X., (1997), “Estimating Societal Impacts of Infrastructure Damagewith GIS,” URISA Journal, Vol. 9, No. 1, Spring.
Fuller, M. L., (1990), The New Madrid Earthquake: A Scientific Factual Field Account(Second Edition), Center for Earthquake Studies, Missouri State University,Cape Girardeau, MO.
Goltz, J. D. (Editor), (1994), The Northridge California Earthquake of January 17, 1994:General Reconnaissance Report, Technical Report NCEER-94-0005, NationalCenter for Earthquake Engineering Research, Buffalo, NY, March.
Gordon, P. and Richardson, H. W., (1995), The Business Interruption Effects of theNorthridge Earthquake, Lusk Center Research Institute, Technical ReportLCRI-95-01, University of Southern California, Los Angeles, CA, April.

176
Gordon, P. and Richardson, H. W., (1992), Business Interruption Effects of a MajorEarthquake in the Newport/Inglewood Fault Zone (NIFZ), School of Urbanand Regional Planning, University of Southern California, Los Angeles, CA.
Guariso, G. and Werther, H., (1991), Environmental Decision Support Systems, EllisHorwood Computers and Application Series, New York.
Guimaraes, P., Hefner, F. L., and Woodward, D. P., (1993), “Wealth and Income Effectsof Natural Disasters: An Econometric Analysis of Hurricane Hugo,” Reviewof Regional Studies, Vol. 23, pp. 97-114.
Hall, J. F. (Editor), (1994), Northridge Earthquake January 17, 1994, PreliminaryReconnaissance Report, Earthquake Engineering Research Institute (EERI),March.
Hanson, K. and Robinson, S., (1991), “Data, Linkages, and Models: U.S. NationalIncome and Product Accounts in the Framework of a Social AccountingMatrix,” Economic Systems Research, Vol. 3, No. 3, pp. 215-232.
Harris, B. and Batty, M., (1993), “Locational Models, Geographic Information andPlanning Support Systems,” Journal of Planning Research and Education, Vol.12, pp. 102-115.
Howitt, R., Moore, N., and Smith, R. T., (1992), A Retrospective on California’s 1991Emergency Drought Water Bank, Department of Water Resources, Sacra-mento, CA.
IMPLAN, Minnesota IMPLAN Group, (1993), Impact Analysis for Planning System,Stillwater, MN.
Jones, B. G., (1989), “The Need for a Dynamic Approach to Planning for Reconstructionafter Earthquakes,” paper presented at Reconstruction After Earthquakes: AnInternational Agenda to Achieve Safer Settlements in the 1990’s, NationalCenter for Earthquake Engineering Research, Buffalo, NY.
Jones, B. G., (1981), “Planning for Reconstruction of Earthquake-stricken Communities,”PRC-US Joint Workshop, Beijing, China.
Jones, B. G. and Malik, A. M., (1996), “The Building Stock in Memphis: RelatingStructural Type and Use,” Proceedings of the Eleventh World Conference onEarthquake Engineering, Elsevier Science, Ltd., Oxford.
Kates, R. W., (1971), “Natural Hazards in Human Ecological Perspective: Hypothesesand Models,” Economic Geography, Vol. 47, pp. 438-51.
Kawashima, K. and Kanoh, T., (1990), “Evaluation of Indirect Economic Effects Causedby the 1983 Nohonkai-chubu, Japan, Earthquake,” Earthquake Spectra, Vol.6, pp. 739-56.
Kreimer, A. and Munasinghe, M. (Editors), (1990), Managing Natural Disasters and theEnvironment, World Bank, Washington, D.C.
Kroll, C. A., Landis, J. D., Shen, Q., and Stryker, S., (1991), Economic Impacts of theLoma Prieta Earthquake: A Focus on Small Business, Working Paper No. 91-187, University of California Transportation Center and the Center for RealEstate and Economics, University of California, Berkeley, CA.

177
Layard, R., (1980), Cost Benefit Analysis, Penguin Modern Economic Readings, London.
Leontief, Wassily, (1986), Input-Output Economics (Second Edition), Wiley, New York.
Los Angeles Department of Water and Power (LADWP), (1994), January 17, 1994Northridge Earthquake Major Emergency Report, Los Angeles, CA.
Memphis Area Chamber of Commerce, (1994), Memphis 1994 Guide, ToweryPublishing Inc., Memphis, TN.
Michaels, S., (1992), “New Perspectives on Diffusion of Earthquake Knowledge,”Earthquake Spectra, Earthquake Engineering Research Institute, Vol. 8, No.1, February.
Mileti, D., Darlington, J., Fitzpatrick, C., and O’Brien, P., (1993), CommunicatingEarthquake Risk: Societal Response to Revised Probabilities in the Bay Area,Hazards Assessment Laboratory and Department of Sociology, Colorado StateUniversity, Fort Collins, CO.
Miller, R. E. and Blair, P. D., (1985), Input-Output Analysis: Foundations and Extensions,Prentice-Hall, Englewood Cliffs, NJ.
Mittler, E., (1989), Natural Hazard Policy Setting: Identifying Supporters and Oppo-nents of Nonstructural Hazard Mitigation, Program on Environment andBehavior Monograph No. 48, Institute of Behavioral Science, University ofColorado, Boulder, CO.
National Earthquake Hazards Reduction Program (NEHRP), (1992), Indirect Conse-quences of a Catastrophic Earthquake, FEMA, Washington, D.C.
National Institute of Building Sciences (NIBS), (1994), Development of a StandardizedEarthquake Loss Estimation Methodology, Vols. I and II, Risk ManagementSolutions, Inc., and California Universities for Research in EarthquakeEngineering.
National Research Council (NRC), (1992), The Economic Consequences of a Cata-strophic Earthquake, Proceedings of a Forum, National Academy Press,Washington, D.C.
Nigg, J. M., (1995a), “Business Disruption Due to Earthquake-Induced LifelineInterruption,” Proceedings for Sino-US Symposium on Post-EarthquakeRehabilitation and Reconstruction, Kunming, China, May 24-27, pp. 46-58.
Nigg, J. M., (1995b), “Anticipated Business Disruption Effects Due to Earthquake-Induced Lifeline Interruptions,” Keynote presentation at Telling it Straight—AConference on Communicating Disaster Information, Emergency PlanningCollege and the University of Hertfordshire, York, Great Britain, October 11-13.
Nigg, J. M., (1988), Frameworks for Understanding Knowledge Dissemination andUtilization: Applications for the National Earthquake Hazards ReductionProgram, USGS Open-File Report 88-13-A (W. Hays, Editor), U.S. GeologicalSurvey, Department of the Interior, U.S. Government Printing Office.
Oliver-Smith, A., (1995), Emotion and Social Organization in the Crisis of Disaster,American Anthropological Association, Washington, November.

178
Oosterhaven, J., (1988), “On the Plausibility of the Supply-Driven Input-Output Model,”Journal of Regional Science, Vol. 28, pp. 203-217.
O’Rourke, M. and Russell, D., (1991), “Seismic Vulnerability of Memphis Water SystemComponents,” Proceedings of the Third United States Conference on LifelineEarthquake Engineering, ASCE, (M. A. Cassaro, Editor), August 22, LosAngeles, CA, pp. 520-9.
Palmer, D. and Shaifer, L., (1995), “Energy Emergency Preparedness,” Annual Meetingof the Central U.S. Earthquake Consortium, November 13-15, St. Louis,Missouri.
Pantelic, J., (1989), “Post Earthquake Housing Reconstruction in Mexico City: Makingof a New Paradigm,” Proceedings of the Ninth World Conference onEarthquake Engineering, Tokyo-Kyoto, Japan, Vol. VII, pages VII-655-660.
Petak, W., (1993), “A Survey of Disaster Mitigation Research in the United States,”U.S.-Former Soviet Union Seminar on Social Science Research on Mitigationfor and Recovery from Disaster and Large Scale Hazards, Moscow, Russia,April 21-24.
Pinick, J. L. Jr., (1981), The New Madrid Earthquakes, U. of Missouri Press, Columbia,MO.
Pyatt, G. and Roe, A., (1977), Social Accounting Matrices for Development Planningwith Special Reference to Sri Lanka, Cambridge University Press, London,and World Bank, Washington, D.C.
Quarantelli, E., Lawrence, C., Tierney, K., and Johnson, T., (1979), Initial Findings froma Study of Socio-Behavioral Preparations and Planning for Acute ChemicalHazard Disasters, Disaster Research Center, Department of Sociology, TheOhio State University.
Reinhert, K. and Roland-Holst, D., (1992), “A Detailed Social Accounting Matrix for theUnited States,” Economic Systems Research, Vol. 4, No. 2, pp. 173-187.
Risk Management Solutions, Inc. (RMS), (1997), Development of a Standardized LossEstimation Methodology, Menlo Park, California.
Rose, A., (1981), “Utility Lifelines and Economic Activity in the Context of Earth-quakes,” Social and Economic Impact of Earthquakes on Utility Lifelines, (J.Isenberg, Editor), American Society of Civil Engineers, NY.
Rose, A. and Allison, T., (1989), “On the Plausibility of the Supply-Driven Input-OutputModel: Empirical Evidence on Joint Stability,” Journal of Regional Science,Vol. 29, pp. 451-58.
Rose, A. and Benavides, J., (1997), Interindustry Models for Analyzing the EconomicsImpacts of Earthquakes and Recovery Policies: Illustrative Examples,Advances in Social Science Analysis of Earthquakes, (B. Jones, Editor),National Center for Earthquake Engineering Research, Buffalo, NY, (forth-coming).

179
Rose, A. and Benavides, J., (1993), “Interindustry Models for Analyzing the EconomicImpacts of Earthquakes and Recovery Policies,” presented at 40th NorthAmerican Meetings of the Regional Science Association International,Houston, Texas.
Rose, A., Benavides, J., Chang, S., Szczesniak, P., and Lim, D., (1997), “The RegionalEconomic Impact of an Earthquake: Direct and Indirect Effects of ElectricityLifeline Disruptions,” Journal of Regional Science, Vol. 37, pp. 437-58.
Rose, A. and Lim, D., (1997), The Economic Impact of Electricity Lifeline DisruptionsStemming from the Northridge Earthquake, Final Report to the NationalScience Foundation, Department of Energy, Environmental and MineralEconomics, The Pennsylvania State University, University Park, Pennsylvania.
Rose, A. and Miernyk, W., (1989), “Input-Output Analysis: The First Fifty Years,”Economic Systems Research, Vol. 1, pp. 229-271.
Sato, R., Murata, M., and Shinozuka, M., (1991), “Seismic Risk Analysis of WaterDelivery System Based on GIS,” Proceedings of the Fourth InternationalConference on Seismic Zonation, Stanford, CA, August 25-29.
Savage, W., (1995), “Policy on Acceptable Levels of Earthquake Risk for California Gasand Electric Utilities,” Proceeding of the Fourth U.S. Conference on LifelineEarthquake Engineering, August 10-12, San Francisco, California.
Schnorbus, R., Mahadhara, R., and Ballew, P., (1994), “The Great Flood of 1993 andthe Midwest Economy,” Midwest Economic Reports, 1993, Fourth Quarter,pp. 1-13.
Sen, A. and Smith, T., (1995), Gravity Models of Spatial Interaction Behavior, Springer-Verlag, New York.
Shinozuka, M., et al., (1995), “Interaction of Lifeline Systems under EarthquakeConditions,” unpublished manuscript, Princeton University, Princeton, NJ.
Shinozuka, M., Hwang, H., and Murata, M., (1992), “Impact on Water Supply of aSeismically Damaged Water Delivery System,” Lifeline Earthquake Engineer-ing in the Central and Eastern U.S., (D.B. Ballantyne, Editor), Monograph No.5, Technical Council on Lifeline Earthquake Engineering, ASCE, New York.
Shinozuka, M., Mizutani, M., Takeda, M., and Kai, Y., (1989), “A Seismic PRA Proce-dure in Japan and Its Application to a Building Performance Safety Estima-tion, Part 3: Estimation of Build and Equipment Performance Safety,”Proceedings of ICOSSAR ’89, pp. 637-644.
Shinozuka, M., Shumuta, Y., Tanaka, S., and Koiwa, H., (1994), “Interaction of LifelineSystems under Earthquake Conditions,” (keynote paper), Proceedings of theSecond China-Japan-U.S. Trilateral Symposium on Lifeline EarthquakeEngineering, April 19-23, Xi’an, China, pp. 43-52.
Silberberg, E., (1990), The Structure of Economics: A Mathematical Analysis (SecondEdition), McGraw-Hill, Inc., New York.
Taylor, C., (1996), Written communication on overcoming barriers in lifeline seismicrisk reduction, research in progress under NSF award #CMS-9502771.

180
ten Raa, T., (1986), “Dynamic Input-Output Analysis with Distributed Activities,”Review of Economics and Statistics, Vol. 68, pp. 300-310.
Tierney, K. J., (1997a), “Business Impacts of the Northridge Earthquake,” Journal ofContingencies and Crisis Management, Vol. 5., No. 2 (June), pp. 87-97.
Tierney, K. J., (1997b), “Impacts of Recent Disasters on Businesses: The 1993 MidwestFloods and the 1994 Northridge Earthquake,” Economic Consequences ofEarthquakes: Preparing for the Unexpected, (Barclay G. Jones, Editor),National Center for Earthquake Engineering Research, Buffalo, NY, pp. 189-222.
Tierney, K. J., (1994), “Making Sense of Collective Preoccupations: Lessons fromResearch on the Iben Browning Earthquake Prediction,” Self, CollectiveBehavior, And Society: Essays Honoring the Contributions of Ralph H. Turner,(G. Platt and C. Gordon, Editors), JAI Press, Greenwich, CT, pp. 75-95.
Tierney, K. J. and Dahlhamer, J. M., (1997), “Business Disruption, Preparedness, andRecovery: Lessons From the Northridge Earthquake,” Proceedings of theNorthridge Earthquake Research Conference, California Universities forResearch in Earthquake Engineering, Richmond, CA.
Tierney, K. J., Nigg, J. M., and Dahlhamer, J. M., (1996), “The Impact of the 1993Midwest Floods: Business Vulnerability and Disruption in Des Moines,” Citiesand Disaster: North American Studies in Emergency Management, (R. T.Sylves and W. L. Waugh, Jr., Editors), Charles C. Thomas, Springfield, MA, pp.214-233.
Turner, R., Nigg, J., and Paz, D., (1986), Waiting for Disaster: Earthquake Watch inCalifornia, University of California Press, Berkeley, CA.
United Nations, (1994), Planning for Sustainable Development: Guidelines for Develop-ing Countries, Department for Development Support and Management,DDDSMS/DEPSD, New York.
U.S. Bureau of the Census, (1997), State Population Estimates and Components ofChange 1990-94, Population Distribution Branch, Washington D.C.
U.S. Bureau of the Census, (1991), 1990 Census Transportation Planning Package onCD-ROM, Technical Documentation, U.S. Department of Commerce,Washington, D.C.
U.S. Bureau of Economic Analysis, (1997), Regional Multipliers: A User Handbook forthe Regional Input-Output Modeling Systems (RIMS II).
U.S. Bureau of Economic Analysis, (1996), Regional Economic Information System(REIS), Washington D.C.
U.S. Department of Commerce, (1994), Regional Economic Information System (REIS),Washington, D.C.
U.S. Department of Commerce, (1995), BEA Economic Areas and ComponentEconomic Area Nodes, Washington D.C.
181
van der Veen, A., Green, C., Pflugner, W., and Wierstra, E., (1994), “Appraisal Methodsas Tools in Evaluating Responses to Long Term Climatic Changes: Cost BenefitAnalysis and Multi-Criteria Analysis,” Journal of Coastal Engineering.
West, C. T. and Lenze, D. G., (1994), “Modeling the Regional Impact of NaturalDisaster and Recovery: A General Framework and an Application toHurricane Andrew,” International Regional Science Review, Vol. 17, pp. 121-150.
West, C. and Lenze, D., (1993), Modeling Natural Disaster and Recovery: An ImpactAssessment of Regional Data and Impact Methodology in the Context ofHurricane Andrew, Bureau of Business and Economic Research, University ofFlorida, Gainesville.
Wilson, R., (1989), “Efficient and Competitive Rationing,” Econometrica, Vol. 57, pp. 1-40.
Wilson, R., (1982), Earthquake Vulnerability Analysis for Economic Impact Assessment,Information Resources Management Office, Federal Emergency ManagementAgency, Washington, D.C.
Zarnikau, J., (1994), “Spot Market Pricing of Water and Efficient Means of RationingWater during Scarcity,” Resource and Energy Economics, Vol. 16, pp. 189-210.

182

183
I n d e x
AAllocation of resources, 149American Society of Civil Engineers
(ASCE), 156, 168Applied Technology Council, see
ATCATC-13, 78ATC-25, 76-79, 81-82, 161Arkansas, 13, 15, 135Artificial intelligence, 151-152
BBottleneck, 99-101Browning, Iben, 8, 66, 70Building Seismic Safety Council
(BSSC) Workshop, 7Businesses
Closure, 55Dependency on lifelines, 161Interruption, 53-56, 76-77, 82Preparedness, 65-70Surveys, 57-65
CCensus Transportation Planning
Package, 48Central United States Earthquake
Consortium (CUSEC), 66,166-168
Coalinga earthquake, 53-54Commuting, 137-141Complex systems, 128-129Consolidated impacts, 148-149Coping strategies
Back up generators, 2Business relocation, 11Conservation, 2
Coping strategies, continuedElectricity network exchanges, 2Reallocation of electricity, 3
Cost-benefits analysis, 148-150Crittendon County, Arkansas, 13,135-
150Crump administration, 14Culture of response, 152CUSEC, see Central United States
Earthquake Consortium
DDade County, Florida, 53, 125Decision support systems, 151-152,
159Deregulation of natural gas/electric
power industries, 9DeSoto County, Mississippi, 13, 135-
150Differential impact, 80Differential rationing, 104Direct economic impact, see also
Direct lossesComparison between direct and
indirect impacts, 157-158Effect on regional economy, 144-
145, 150Modeling of, 85-86Scope of, 75-77
Direct losses, see also Directeconomic impact
Definition of, 33, 75Development of methodology, 88-
90Results, 91-92
Disaster relief, 152Disaster Research Center, 55-58Duke, C. Martin, 5,7

184
EEarthquakes
and business recovery, 58-65and electric service disruption,
81-92as a joint-interaction phenomena,
1Developing an interdisciplinary
methodology, 2-3Direct economic impacts of, 75-80Kobe earthquake, 9, 33, 86, 94Loma Prieta earthquake, 7, 35,
53-54Loss estimation methodologies, 78-
80New Madrid earthquake, 1-2, 13Northridge earthquake, 9, 35,
86-87, 94Politics and planning for, 3Recovery plans, 111-113Research, 2-3San Fernando earthquake, 5-6, 9,
35Earthquake Engineering Research
Institute (EERI), 166, 168Economic disaster models
Decision support systems vs.expert systems, 151-152
Event accounting matrix, 141-147GIS-based model, 131-133Memphis-Mississippi Valley model,
135-141Counties included, 136
Model development, 129-131Social accounting matrix, 127-128,
138-140Economic impacts, see also Direct
economic impacts and Indirecteconomic impacts, 2, 135
Estimating regional impacts, 96-102
Interregional impacts, 148-149Economic indicators, 17-18Economic networks, 127-128Economy
Manufacturing sector of Memphis,Tennessee, 15
Traffic analysis zones, 48-51
EERI, see Earthquake EngineeringResearch Institute
Effects on recovery over time, 106-109
Electric power industries deregula-tion, 9
Electric power service areas (EPSA)Determining economic impacts to,
85-86Relationship to traffic analysis
zones, 49Restoration of services, 86-88;
107-111Within a GIS, 10
Electricity consumption, 106-109Electricity disruption
Business supply, 95Effects, 95, 100-103Loss of production, 95
Electricity lifelines, see also LifelinesAbnormal power flow, 39Abnormal voltage, 39-40Connectivity, loss of, 39Failures
Coping strategies, 2Economic losses, 2Mitigation measures, 2Recovery mechanisms, 2Systems failures, 33-43
Loss models, 81-92Seismic performance of, 33-43
Electricity networks, 2,11Distribution lines, 2Engineering assessment, 38-42Generating stations, 2Modes of failure, 35Redundancy, 37Substations, 35-38Transmission lines, 2Vulnerability, 35
Electricity pricing, 112Electricity restoration, 107-111Electricity supply, 144Employment, 15-18, 48, 51EPSA, see Electric power service
areasEvent accounting matrix, 141-144Expert systems, 151-152, 159
185
FFailed transactions model, 134Fayette County, Arkansas, 13, 136-
140, 144Federal Emergency Management
Agency (FEMA), 8-10, 19, 152,163, 168
Fragility analysis, 35-38
GG7 Bilateral (U.S.-Japan) Meeting, 9Garbage can model of organizational
choice, 162Geographic Information System (GIS)
Creating a virtual model, 131-133Developing a decision support
system, 159Developing a direct economic
impact methodology, 80-81Developing fragility curves, 38Facilitating analysis of interaction
between lifeline disruption andstructural damage, 94
in locating economic activity, 85Modeling economic impact, 46-51Uses in this study, 10-11
Great Hanshin earthquake, see KobeGross regional product (GRP), 77,
96, 104-111, 149-150Ground shaking, 38, 46
HHurricane Andrew, 53, 125
IImpact algorithms, 159Impact Analysis for Planning System
(IMPLAN), 19-20, 30, 47, 51Impact zones, 88Importance factor, see also Resil-
iency, 78-79, 98Inappropriate development, 125Income distribution, 148Income flow, 137-140
Indirect economic impacts, see alsoIndirect losses
Comparison between direct andindirect impacts, 157-158
Effects on regional economy, 144-147, 150
Estimating, 96-97Scope of, 75-77
Indirect losses, see also Indirecteconomic impacts, 125
Definition of, 33in developing emergency response
plans, 161Industry dependence on electricity,
83Infrastructure, see LifelinesInput-Output (I-O) analysis
Allocation (supply-side) version, 20Definition of, 19Impact analysis, 96-102I-O impact formula, 97I-O models, 97-98, 134-135I-O multipliers, 23, 26I-O table, 10, 19, 22-25, 120,
128, 134Inverse, 120Role of electricity in, 23-28
Direct utility input coefficient,23
Total utility input coefficients,28
Supply-side, 120Technical coefficients, 97
Insurance coverage, 165Interdisciplinary research, 1,3Interindustry analysis, 18-22, 29Interindustry economics, see also I-O
analysis, 21,96, 120Interregional impacts, 131-133,148-
149Inter-utility Seismic Working Group,
167-168
KKates, Robert, 1Knowledge transfer, 155-156Kobe earthquake, 9, 33, 86, 94
186
LLauderdale County, Tennessee, 135-
140Lifeline earthquake engineering
Federal initiatives, 10Function of, 5History in U.S., 5-9Standards for, 5
Lifeline Standards Development Plan,9
Lifeline Standards Workshop, 8Lifelines
Dependency, 76Disruption patterns, 91-92Importance assessments of, 60-65Interaction, 99, 121Loss estimation methodologies, 78-
79in Memphis, 15-16Regional analyses of, 23-28Risk reduction policy, 162-168
Advances, 157Barriers to implementation, 162Central U.S. EarthquakeConsortium (CUSEC), 166-167
Developing methods, 163Inter-utility Seismic WorkingGroup, 167-168
Operational strategies, 164Tennessee Valley Public PowerAssociation, 167
Service disruption, 80Usage, 81-83
Linear programming, 102-106, 160Analysis of, 20, 30Application of, 105-106Shadow prices, 110-111, 122
Loma Prieta earthquake, 7, 35, 53-54Long term recovery, 164Loss estimation, 4-5, see also Direct
losses and Indirect lossesMethodologies for, 78-79
Loss reduction, 53
MMany-regions models, 128-130, 134Marked Tree, Arkansas, 38, 40, 157Marshall County, Mississippi, 136-
140, 144
Mathematical programming,see also Linear programming, 20
Memphis, Tennessee, 1, 135-137Agriculture, 15Businesses
GIS maps of, 48-50Lifeline dependency, 60-64Preparedness, 53, 65-70Seismic risk perception, 64-65
Business vulnerabilityBuilding stock, 59-60Dependency on lifelines, 58,60-64
Earthquake insurance, 65-66Level of exposure, 58Perception of risk, 58, 64-65Structural damage, 59-60
Construction, 15Distribution, 15Economy, 14-18, 29, 83, see also
Impact Analysis for PlanningSystem, Input-Output analysis,Interindustry analysisCensus transportation plan-
ning package, 48Growth, 17-18
Electric power system disruption,34
Employment, 17Government, 16Health care, 16History, 13-14Impact of an earthquake, 148-149Manufacturing, 15, 91Metropolitan statistical area
(MSA), 13Military, 16Population, 13Response of economy to electrical
disruption, 144Services, 16Tourism, 16Trade, 16Transportation, 15-16Utility lifelines, 15
Memphis Light, Gas and Water(MLGW)
Institutional empowerment, 168Monte Carlo simulation, 38-42,
89-91

187
Memphis Light, Gas and Water(MLGW), continued
Policy development issues, 111-113
Repair cost to electric powersystem, 157-158
Seismic performance of, 33-43Memphis Light, Gas and Water
(MLGW), continuedSpatial analysis of, 49-51Substation models, 35-37
Node configuration models, 37System failure conditions, 34-35
Methodology to estimate totalregional economic losses, 95
Midwest floods, 55-56, 59, 125Mississippi, 13, 15, 135Mississippi County, Arkansas, 135-
140, 144Monte Carlo methods, 11, 38-42, 88-
91Multiplier effects, 19, 23, 76, 96,
134, 158
NNational Center for Earthquake
Engineering Research (NCEER), 7National Communications System
(NCS) Workshop, 8National Earthquake Hazard Reduc-
tion Program (NEHRP), 10Reauthorization, 8
National Institute of BuildingSciences (NIBS), 76
National Institute of Standards andTechnology (NIST), 8-10, 163, 168
National Research Council (NRC), 45National Science Foundation (NSF), 8Natural gas deregulation, 9New Madrid seismic zone (NMSZ),
29, 79, 95Browning prediction, 8, 66, 70Earthquakes of 1811-12, 1-2, 13Repair cost to substations, 157Simulation of earthquakes, 38,
95-96Vulnerability to earthquakes, 29
Northridge earthquake, 9, 35, 86-87,94
OOakland Hills fire, 9Optimal resource reallocation, 95-
96, 110-111Optimization model, 12, 159
PPartnerships, public-private, 10Peak ground acceleration (PGA), 38Policy adoption, 166
Industry initiatives, 166-167Multi-industry initiatives, 167Multi-state initiatives, 167
Policy formulation, 12, 150-152,162-168
Policy implications, 156Port of Los Angeles workshop, 8Public Law 101-614, 8Public policy, see Policy formulation
RRationing of electricity, 112, 160
Differential, 104Direct quantity, 112Price, 112Rolling blackouts, 112
Reallocation strategies, 149-150Effects, 149Priorities, 149
RecoveryDevelopment of procedures for,
126-127Mechanisms for , 2Policy, 111-112
Regional (Economic) analysis, 21Impacts, 10-12
Regional imports and exports, 137Regression analysis, 68Repair costs, 158Resiliency, 98-99
Factors, 81-84, 161Response strategies, 11-12Restoration
Patterns, 96Period, 102of power, 86-87, 89Strategies, see Rationing, 160
Risk management, 155

188
SSan Fernando earthquake, 5-6, 9, 35San Francisco earthquake, 1906, 6Scenarios, 144, 148-150Seismic Vulnerability and Impact of
Disruption of Lifelines in theConterminous U.S. (ATC-25), 76-79
Shadow prices, 110-112, 122Shelby County, Tennessee
Business survey of, 57-65Businesses
Earthquake preparedness, 65-70
Gross regional product, 106-111
Input-Output analyses, 23, 96-113
Resiliency factors, 83Economic sectors, 135-142Electricity lifelines
Rationing, 102-106Service disruption, 86-88
Linkages in the local economy, 47Loss reduction strategies, 164Memphis metropolitan statistical
area, 13Monte Carlo simulation, 38-42Scenarios, 144-150
Small Business Association, 55Small localities, 125-126, 131Social accounting matrix (SAM)
County-level model, 131Definition, 127-128Developing a decision support
system, 159Development of, 129-133U.S. model, 129
Socioeconomic analysis of lifelineusage, 53-56
Spill-over effects, 144, 148Standard Emergency Management
System, 9Subregionalizing, 3Supply-side, 98, 120System performance, 38-42
TTate County, Mississippi, 136-140Technical Council on Lifeline
Earthquake Engineering (TCLEE),7, 156, 166, 168
Tennessee, see also Memphis, ShelbyCounty, 13, 15, 135
Tennessee Valley Authority (TVA),16, 23, 34, 141
Tennessee Valley Public PowerAssociation (TVPPA), 167
Time to restore electricity, 110, 122Tipton County, Tennessee, 13, 135-
140, 144Traffic analysis zones, 48-51Transaction lag, 134, 144Tunica County, Mississippi, 135-140
UUnited Nations recommendations,
127U.S. Department of Commerce, 19U.S.-Japan Bilateral Meeting, see G7
Bilateral MeetingUsage-based loss model, 81, 85Utilities, see LifelinesUtility deregulation, 9
VVirtual model, 133Vulnerable populations, 125-127
WWell defined vs. chaotic events,
151-152
XXenia, Ohio tornado, 53

189
C o n t r i b u t o r s
Dr. Juan Benavides, ProfessorDepartment of Industrial EngineeringUniversidad de los AndesBogota, [email protected]
Dr. Stephanie E. Chang, ResearchAssistant Professor
Department of GeographyBox 353550University of WashingtonSeattle, [email protected]
Dr. H. Sam Cole, ProfessorDepartment of Planning201 D Hayes HallUniversity at BuffaloBuffalo, New [email protected]
Mr. James M. Dahlhamer, Field DirectorDisaster Research CenterUniversity of DelawareNewark, [email protected]
Mr. Ronald T. Eguchi, Vice PresidentEQE International, Inc.Center for Advanced Planning and
Research4590 MacArthur Blvd., Suite 400Newport Beach, [email protected]
Dr. Steven P. French, DirectorCity Planning ProgramGeorgia Institute of TechnologyCollege of ArchitectureAtlanta, [email protected]
Dr. Howard H.M. Hwang, ProfessorCenter for Earthquake Research and
InformationUniversity of Memphis3890 Central AvenueMemphis, [email protected]
Ms. Laurie A. Johnson, Principal UrbanPlanner
EQE International, Inc.Center for Advanced Planning and
Research4590 McArthur Blvd., Suite 400Newport Beach, [email protected]
Dr. Adam Rose, Professor and HeadDepartment of Energy, Environmental
and Mineral EconomicsCollege of Earth and Mineral SciencesThe Pennsylvania State UniversityUniversity Park, [email protected]
Dr. Masanobu Shinozuka, ProfessorFred Champion Chair in Civil
EngineeringDepartment of Civil EngineeringUniversity of Southern California3620 Vermont Ave. KAP 254Los Angeles, [email protected]
Mr. Philip A. Szczesniak, RegionalEconomist
Bureau of Economic Analysis DivisionU.S. Department of CommerceWashington, [email protected]
Dr. Kathleen J. Tierney, Co-DirectorDisaster Research CenterUniversity of DelawareNewark, [email protected]

190

191
Monographs and
Special Publications
Economic Consequences of Earthquakes: Preparing forthe Unexpected, edited by Barclay G. Jones
Passive Energy Dissipation Systems for Structural Designand Retrofit, by M. C. Constantinou, T. T. Soong, and G. F.Dargush
Engineering and Socioeconomic Impacts of Earthquakes:An Analysis of Electricity Lifeline Disruptions in the NewMadrid Area, edited by M. Shinozuka, A. Rose, and R. T.Eguchi