Energy Trends and Opportunities in Residential Construction Innes Hood The Sheltair Group May 25.
27
Energy Trends and Opportunities in Residential Construction Innes Hood The Sheltair Group May 25
-
Upload
eustace-alexander -
Category
Documents
-
view
220 -
download
2
Transcript of Energy Trends and Opportunities in Residential Construction Innes Hood The Sheltair Group May 25.

Energy Trends and Opportunities in
Residential Construction
Innes HoodThe Sheltair Group
May 25

Outline
1. Where are we now?
2. Where are we going?
3. Where do we want to go?
4. How do we get there?

In a Nutshell
• Technical innovation has improved energy efficiency of new construction.
BUT
• There is huge potential to increase profits and save energy.
• Why isn’t the construction industry doing more?

Why Should We Care?
1. Commodity
2. Strategic resource
3. Basic human need
4. Ecological resource

Where are we now?

Energy Consumption by End Use
Energy Consumption by end Use
0.020.040.060.080.0
100.0120.0140.0160.0180.0
En
eg
y C
on
su
mp
tio
n [
PJ
]
Space Cooling
Lighting
Appliances
Water Heating
Space Heating

Heating Fuel and Source
Apartment Heating Systems
0
100
200
300
400
500
600Heat Pump
Electric Baseboard
Natural Gas – HighEfficiency
Natural Gas – MediumEfficiency
Natural Gas – NormalEfficiency
Heating Oil – NormalEfficiency

Summary
• The industry is dominated by minimizing capital cost – Little attention paid to lifecycle
costing
• The industry is dominated by a large number of small operators– We are still a cottage industry– Innovation is difficult

Where are we going?

Energy Prices
What the Policy Makers Say
$-
$2.00
$4.00
$6.00
$8.00
$10.00
$12.00
$14.00
$16.00
2003
2005
2007
2009
2011
2013
2015
2017
2019
2021
2023
2025
Nat
ura
l Gas
Pri
ce F
ore
cast
[$/
GJ]
Low
Medium
High

And then there is reality…

Housing Construction Trends
• New homes are getting more energy efficient
BUT• They are also getting larger, and we
are filling them with more gadgets
01020304050607080
1840 1860 1880 1900 1920 1940 1960 1980 2000 2020
Year of Construction
EGH
Ratin
g
y = -0.0676x + 140.2
R2 = 0.187
0
5
10
15
20
25
30
1880 1900 1920 1940 1960 1980 2000 2020
Vintage
Air
Ch
ang
es
@ 5
0Pa

What about Apartments?
• Ref Enersys Analytics

Building Energy PerformanceBuilding Energy Performance
0.00
0.50
1.00
1.50
2.00
2.50
BE
PI [
GJ
/Sq
m]
Residential Sector
Commercial Sector

Summary
• Energy prices are likely to continue to increase.
• Improvements in energy performance are limited.

Where do we want to get to?
Human Wood/Hay Coal Oil Methane Renewables

BC Provincial Targets
SECTOR TARGET
New single family and row houses
EnerGuide 80 by 2010, ( 32% savings in energy use)
New multi-unit residential and commercial buildings
25% better than the MNECB by 2010, reducing average energy consumption by 37%

Savings Potential
11,000
13,000
15,000
17,000
19,000
21,000
2000/01 2005/06 2010/11 2015/16
Base Year Reference Case
Economic Potential
Achievable "Most Likely"
Achievable "Upper"

Summary
• Significant technical and economic potential exists.
• Limited successes and performance improvements

How do we get there?
Introduction
Source: Nadel, Steven and Linda Latham. 1998. “The Role of Market Transformation Strategies in Achieving a More Sustainable Energy Future.” Washington, DC: American Council for an Energy-Efficient Economy.
Market Share
Time
Market Maturity
Commercialization / Penetration
Market Expansion / Common Practice
RD&D, Education e.g. VSMs
Incentives, Bulk Procurement, Education
e.g. CFL.
Utility Rebates, Labeling, Education, Financing e.g. Furnaces
Codes & Standards e.g. insulation

Opportunities
• Given the choice, consumers will invest in efficient equipment – why aren't we doing more?
• Furnace Example
Mid Efficient
High Efficient
New 80% 20%
Retrofit 40% 60%

Opportunities (Detached)• HE Furnace example:
– Incremental cost $600– Incremental Mortgage payment @ 6%=$47/yr– Annual operating cost savings (Gas @$12/GJ)
=$113/yr
• Other Significant Opportunities– Advanced Framing with increased wall insulation– Full Height basement insulation– Integrated space and water heating– Window Upgrades– HRV– Dare I mention the Built America Program?

Opportunities (MURBs)
• Wood Frame Example– 23% energy savings translated into
36,000 investment with 6.4 yr payback
– Getting consumers to pay is challenging – but not impossible

The Land Use Connection
• Densification (integration) is having more impact on energy use than conservation
05000
1000015000200002500030000350004000045000
Single Family Row Low Rise High Rise
Annu
al E
nerg
y Us
e [K
Wh/
yr]
Other
DHW
Space Ht
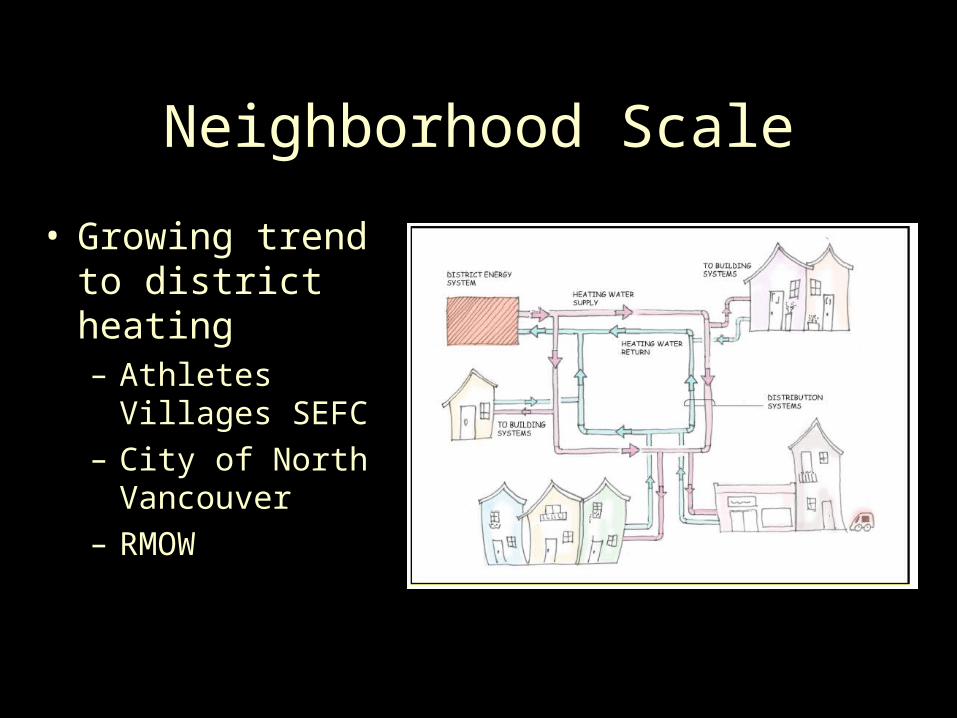
Neighborhood Scale
• Growing trend to district heating– Athletes Villages
SEFC– City of North
Vancouver– RMOW

Summary
• Significant energy and cost savings exist
• Progress is limited
• Need to work more effectively as an industry to achieve these results