Energy Optimization - hetadatain.com PRESENTATION.pdf · Heta Datain is managed by a team who are...
28
Energy Optimization A New Approach
Transcript of Energy Optimization - hetadatain.com PRESENTATION.pdf · Heta Datain is managed by a team who are...

Energy OptimizationA New Approach

➢ Heta Datain provide Energy Optimization Solutions for High Energy Consumers.
➢ Heta Datain is managed by a team who are specialists in Data logging, Data simulation,Energy analysis, and SCADA / PLC process tweaking. We also have hardware software skill set in IOT's, Dataloggers, Big Data analysis, and software computing skills of MIS reporting.
➢ I am a Senior Consultant in IT in Power Distribution ( including Smart Grid) with RECPower Distribution Company Limited, an ISO 9001:2008, ISO 14001:2004 & OHSAS18001:2007 Certified Company, a wholly owned subsidiary of REC Ltd., a 'Navratna’CPSE under Ministry of Power, Government of India. I have over 40 years experiencein Teaching and Industries, and am a Certified Energy Auditor.
➢ Heta Datain and its associates are in this field in for the last 20 years,and we haveimplemented “Electronic National Agriculture Market” network pan for AgricultureProduce, Mumbai Octroi, etc. which shows our strength in handling Big Data in RealTime.

HETA DATAIN uses this historicalSCADA data to analyse the workingof the complete plant and simulatesthe whole working model of the planton a computer simulation software.This helps in locating the efficienciesof each equipment under variousoperating conditions.
Earlier the SCADA system wasessentially used for running theplant by the operator. Backup datawas only retrieve in case of anyfailure in the plant, for analysis ofthe time line.

➢ Energy, Process (including HVAC), Production and other relevant environmentalData is extracted and logged at regular intervals (1 second to 120 seconds)from the system.
➢ Data retrieval in non-invasive and does not intrude in the running system.
➢ Data is uploaded to a Cloud, where all calculations are done to compute theEnergy Flow and Energy loss in various locations and processes.
➢ This Energy Flow, Losses, and Value are shown on a web based dashboard toall authorized users, who track the daily variations in Energy usage.
➢ Based on process pre-defined limits, alarms and notifications are given torelevant users as alerts.
➢ Business Intelligence (BI) reports can be extracted from the system forManagement use.
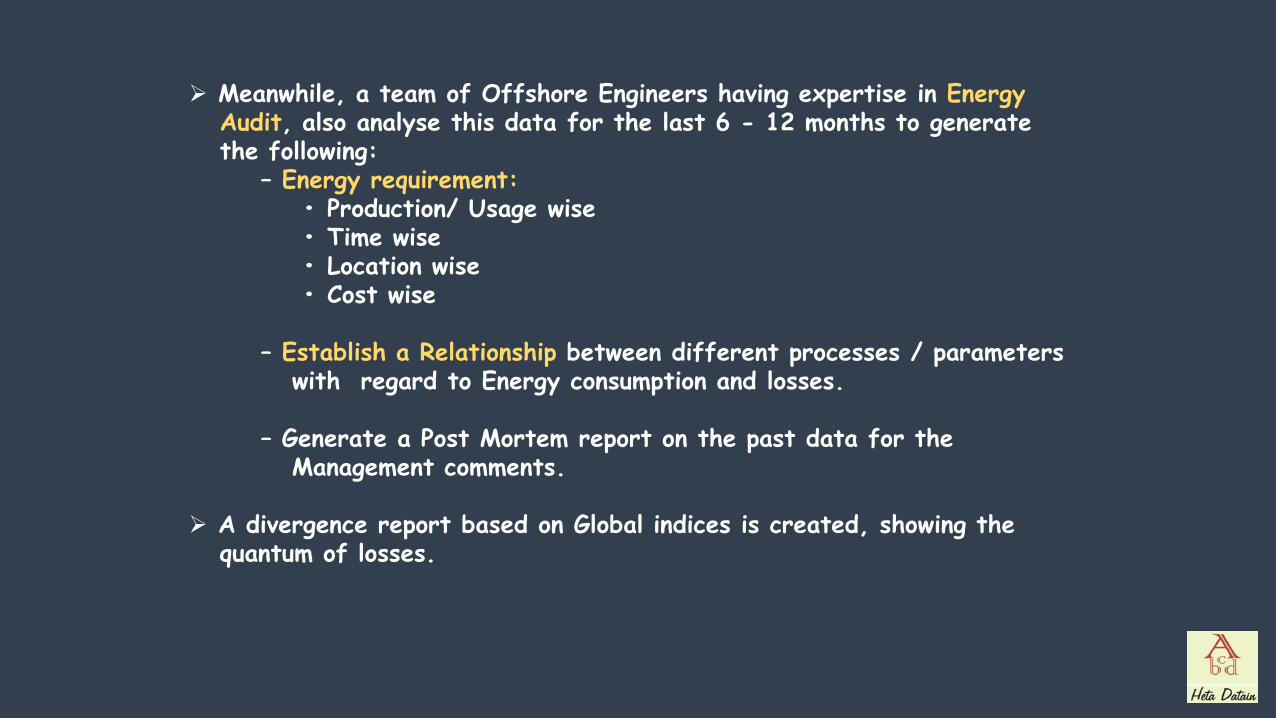
➢ Meanwhile, a team of Offshore Engineers having expertise in EnergyAudit, also analyse this data for the last 6 - 12 months to generatethe following:
– Energy requirement:• Production/ Usage wise• Time wise• Location wise• Cost wise
– Establish a Relationship between different processes / parameterswith regard to Energy consumption and losses.
– Generate a Post Mortem report on the past data for theManagement comments.
➢ A divergence report based on Global indices is created, showing thequantum of losses.

➢ A team of Offshore Engineers having expertise in ComputerSimulation also use this 6-12 month old data to create a ComputerSimulated Model of the complete process / plant.
➢ They use high end Electrical / Mechanical / Chemical Simulationsoftware for modelling. (Typically ETAP, MATLAB, ANYSYS,HYSYS, MITAB etc).
➢ Based on the simulation, the following reports are generated:
– Equipment condition, and deviation from the design.– Process deviation from the design.– “What if” analysis, if any equipment if to be shut or replaced.– Notional savings if the equipment / process was as per design.
➢ Dashboard generated earlier also shows the notional savings for userinformation.

Plant Dashboard

District Cooling System Dashboard

Trend of User Supply Temperature with User Supply Pressure and User Supply Flow.

➢ 40000 TR District Cooling Plant with 31 Energy Transfer Stations.
• In District Cooling Plant, earlierKWHr (energy) requirement forcooling was high but now to meetsome cooling requirement KWHr isreduced.
• Changed in Temperature received toUser in Aug 17 is more as comparedto Aug 16, this indicates more RTreceived to User.

• After applying Energy Optimization Technique Production Efficiency (Plant KW/RT) is improved to 0.90 KW/RT from 1.40 KW/RT.
Daily Power varies between 130000 to 220000 KWHr.

Production cost (Dirhams) per RTH (cooling) was 0.96 Dirhams in Aug 16, now it is decreased to 0.48 in Aug 17 percentage YOY is 57%.
Daily RTH varies between 130000 to 210000 RTH.

➢ Energy Optimization based on Past Data Trends give moremeaningful insights.
➢ Data analysis by Energy Auditors give a second opinion onthe Energy losses and savings.
➢ Simulating the Process / Equipment gives a non invasive insightto its mechanical condition, process set-points and deviationfrom Best Efficiency Point.
➢ Dashboard available to all the Users give a Energy SavingCentric Thought Process in the organization.

Energy Optimization System
International Hospitals UAE
2018
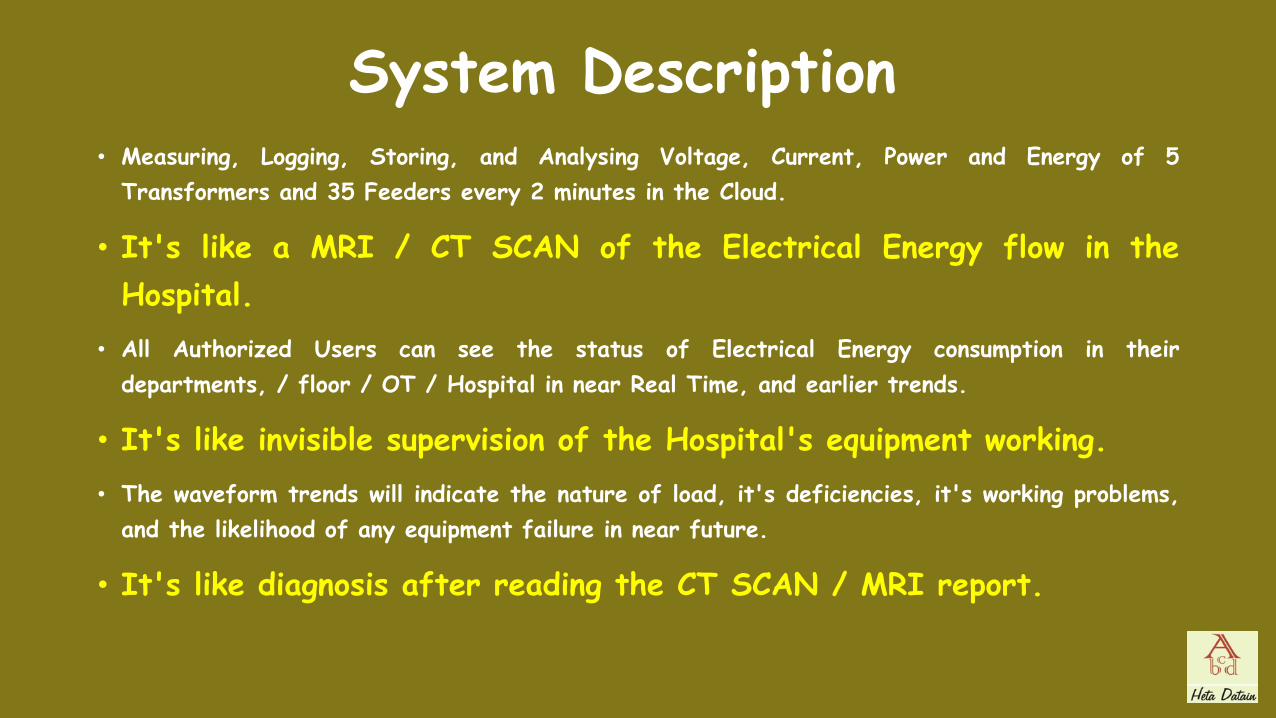
System Description• Measuring, Logging, Storing, and Analysing Voltage, Current, Power and Energy of 5
Transformers and 35 Feeders every 2 minutes in the Cloud.
• It's like a MRI / CT SCAN of the Electrical Energy flow in the
Hospital.
• All Authorized Users can see the status of Electrical Energy consumption in their
departments, / floor / OT / Hospital in near Real Time, and earlier trends.
• It's like invisible supervision of the Hospital's equipment working.
• The waveform trends will indicate the nature of load, it's deficiencies, it's working problems,
and the likelihood of any equipment failure in near future.
• It's like diagnosis after reading the CT SCAN / MRI report.

User User
Cloud
Client Client Client
Transformer
Incomer Supply
Server
Transformer Transformer
Non Invasive Transducer
Non Invasive Transducer
Non Invasive Transducer
How our system Works ?

System SetupTR1 TR5TR4TR3TR2
BASEMENT
EIGHT
SEVENTH
SIXTH
FIFTH
FOURTH
CLIENT-2
THIRD
SECOND
FIRST
GROUND
CLIENT-1
NINE
TERRACE
CLIENT-3
TWELVE
ELEVEN
TEN
SMDB-B
100/63A
SMDB-MG
250/79A
SMDB-BE
400/215A
SMDB-G
160/67A
SMDB-UPS-1-1
400/180A
SMDB-1
250/132A
SMDB-2-1
630/296A
SMDB 2-2
500/321A
SMDB 2-E
160/39A
SMDB-3
400/159A
SMDB-4
250/148A
SMDB-4-E
400/261A
SMDB-5
250/111A
SMDB-UPS-1-2
300/159A
SMDB-6
160/63A
SMDB-7
400/234A
SMDB-SF
160/30A
SMDB-UPS-2
250/147A
SMDB-SFE
400/208A
SMDB-8
200/119A
SMDB-9
250/110A
SMDB-10
250/109A
SMDB-10-E
400/192A
SMDB-11
250/114A
SMDB-12
160/57A
MCC-1
2500/1105A
MCC-2
2500/1250A
SMDB-TF-1
400/259A
SMDB-TF-2
400/257A
SMDB-TFE-1
400/253A
SMDB-TFE-2
100/39A
CAT VI FOR
RS485
CAT VI FOR
CLIENTS
SWITCH

Scans and Reports

Hospital Dashboard

500
550
600
650
700
750
800
850
900
950
00
:00
00
:20
00
:40
01:
00
01:
20
01:
40
02
:00
02
:20
02
:40
03
:00
03
:20
03
:40
04
:00
04
:20
04
:40
05
:00
05
:20
05
:40
06
:00
06
:20
06
:40
07
:00
07
:20
07
:40
08
:00
08
:20
08
:40
09
:00
09
:20
09
:40
10
:00
10
:20
10
:40
11:
00
11:
20
11:
40
12
:00
12
:20
12
:40
13
:00
13
:20
13
:40
14
:00
14
:20
14
:40
15
:00
15
:20
15
:40
16
:00
16
:20
16
:40
17
:00
17
:20
17
:40
18
:00
18
:20
18
:40
19
:00
19
:20
19
:40
20
:00
20
:20
20
:40
21:
00
21:
20
21:
40
22
:00
22
:20
22
:40
23
:00
23
:20
23
:40
Power trend (KW)

0
1000
2000
3000
4000
5000
6000
7000
8000
TF kWh 7th floor
kWh
2nd Floor
kWh
BF kWh GF kWh 10th floor
kWh
5th Floor
kWh
4th Floor
kWh
3rd Floor
kWh
1st floor
kWh
8th floor
kWh
9th Floor
kWh
12th floor 11th floor 6th Floor
kWh
AVERAGE kWh FLOORWISE
Floor Wise Average Energy Consumptions.
100
600
1100
1600
2100
MEP OT IP OPD (non critical) Radiology (non critical) OP (critical) 12F Service(Non
critical)
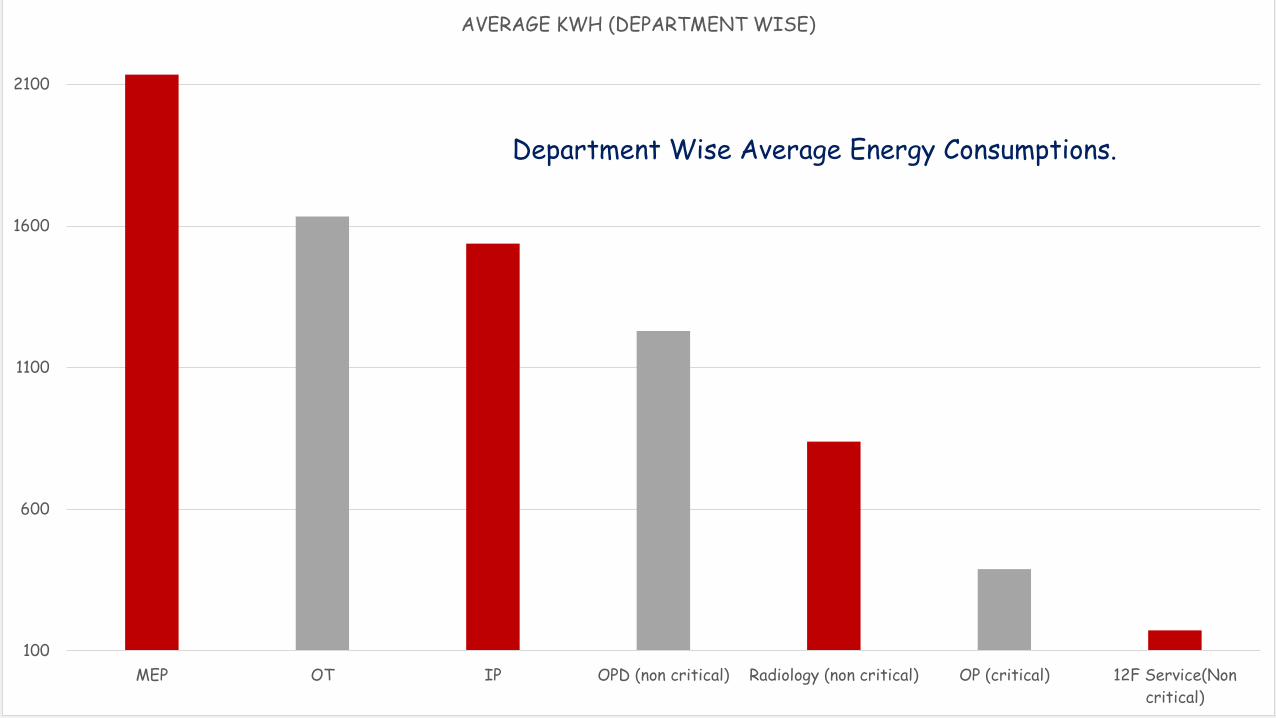
AVERAGE KWH (DEPARTMENT WISE)
Department Wise Average Energy Consumptions.

0
500
1000
1500
2000
2500
3000
3500
4000
4500
5000
Feeder wise Average Daily Energy

0
5
10
15
20
25
0
500
1000
1500
2000
2500
3000
3500
4000
4500
5000
Variation in Daily Energy Consumption
AVG kWH STDEV %

15500
16000
16500
17000
17500
18000
18500
19000
19500
6000
8000
10000
12000
14000
16000
18000
Total Energy Usage = Cooling Energy + Others
Total kWh Cooling Kwh NON-Cooling kWh
1700
1800
1900
2000
2100
2200
2300
2400
2500
2600
0 TO 6 6 TO 12 12 TO 18 18 TO 24
COOLING ENERGY - 6 HOURLY
Cooling system consuming more Energy than
others.
Cooling system consuming more energy during
working hours.
1450
1550
1650
1750
1850
1950
2050
20
18-0
2-1
9
20
18-0
2-2
0
20
18-0
2-2
1
20
18-0
2-2
2
20
18-0
2-2
3
20
18-0
2-2
4
20
18-0
2-2
5
20
18-0
2-2
6
20
18-0
2-2
7
20
18-0
2-2
8
20
18-0
3-0
1
20
18-0
3-0
2
20
18-0
3-0
3
20
18-0
3-0
4
20
18-0
3-0
5
20
18-0
3-0
6
20
18-0
3-0
7
20
18-0
3-0
8
20
18-0
3-0
9
20
18-0
3-1
0
20
18-0
3-1
1
20
18-0
3-1
2
20
18-0
3-1
3
20
18-0
3-1
4
20
18-0
3-1
5
20
18-0
3-1
6
20
18-0
3-1
7
20
18-0
3-1
8
20
18-0
3-1
9
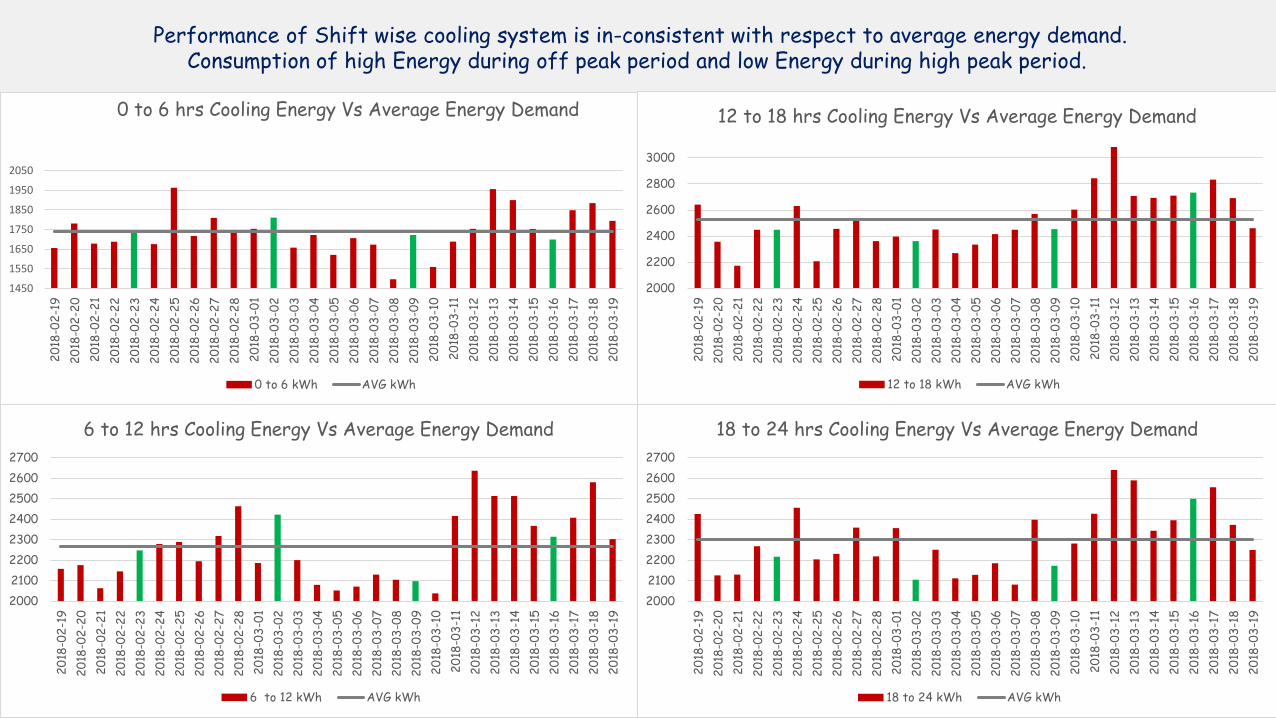
0 to 6 hrs Cooling Energy Vs Average Energy Demand
0 to 6 kWh AVG kWh
2000
2100
2200
2300
2400
2500
2600
2700
20
18-0
2-1
9
20
18-0
2-2
0
20
18-0
2-2
1
20
18-0
2-2
2
20
18-0
2-2
3
20
18-0
2-2
4
20
18-0
2-2
5
20
18-0
2-2
6
20
18-0
2-2
7
20
18-0
2-2
8
20
18-0
3-0
1
20
18-0
3-0
2
20
18-0
3-0
3
20
18-0
3-0
4
20
18-0
3-0
5
20
18-0
3-0
6
20
18-0
3-0
7
20
18-0
3-0
8
20
18-0
3-0
9
20
18-0
3-1
0
20
18-0
3-1
1
20
18-0
3-1
2
20
18-0
3-1
3
20
18-0
3-1
4
20
18-0
3-1
5
20
18-0
3-1
6
20
18-0
3-1
7
20
18-0
3-1
8
20
18-0
3-1
9
6 to 12 hrs Cooling Energy Vs Average Energy Demand
6 to 12 kWh AVG kWh
2000
2200
2400
2600
2800
3000
20
18-0
2-1
9
20
18-0
2-2
0
20
18-0
2-2
1
20
18-0
2-2
2
20
18-0
2-2
3
20
18-0
2-2
4
20
18-0
2-2
5
20
18-0
2-2
6
20
18-0
2-2
7
20
18-0
2-2
8
20
18-0
3-0
1
20
18-0
3-0
2
20
18-0
3-0
3
20
18-0
3-0
4
20
18-0
3-0
5
20
18-0
3-0
6
20
18-0
3-0
7
20
18-0
3-0
8
20
18-0
3-0
9
20
18-0
3-1
0
20
18-0
3-1
1
20
18-0
3-1
2
20
18-0
3-1
3
20
18-0
3-1
4
20
18-0
3-1
5
20
18-0
3-1
6
20
18-0
3-1
7
20
18-0
3-1
8
20
18-0
3-1
9
12 to 18 hrs Cooling Energy Vs Average Energy Demand
12 to 18 kWh AVG kWh
2000
2100
2200
2300
2400
2500
2600
2700
20
18-0
2-1
9
20
18-0
2-2
0
20
18-0
2-2
1
20
18-0
2-2
2
20
18-0
2-2
3
20
18-0
2-2
4
20
18-0
2-2
5
20
18-0
2-2
6
20
18-0
2-2
7
20
18-0
2-2
8
20
18-0
3-0
1
20
18-0
3-0
2
20
18-0
3-0
3
20
18-0
3-0
4
20
18-0
3-0
5
20
18-0
3-0
6
20
18-0
3-0
7
20
18-0
3-0
8
20
18-0
3-0
9
20
18-0
3-1
0
20
18-0
3-1
1
20
18-0
3-1
2
20
18-0
3-1
3
20
18-0
3-1
4
20
18-0
3-1
5
20
18-0
3-1
6
20
18-0
3-1
7
20
18-0
3-1
8
20
18-0
3-1
9
18 to 24 hrs Cooling Energy Vs Average Energy Demand
18 to 24 kWh AVG kWh
Performance of Shift wise cooling system is in-consistent with respect to average energy demand. Consumption of high Energy during off peak period and low Energy during high peak period.

300
320
340
360
380
400
420
440
460
12AM to 6 AM 6 AM to 12PM 12PM to 18PM 18 PM to 24PM
ENERGY IN OT - 6 HOURLY
150
160
170
180
190
200
210
220
230
240
12AM to 6 AM 6 AM to 12PM 12PM to 18PM 18 PM to 24PM
ENERGY IN CRITICAL OT
150
160
170
180
190
200
210
220
230
240
12 AM to 6 AM 6 AM to 12PM 12 PM to 6 PM 6 PM to 12 AM
ENERGY IN NON CRITICAL OT

Contact
341, Laxminagar Nagpur, Maharashtra, India-440022.
91-712-2243682 / 9422111044
Skype : [email protected]