

Energy Management in Demand Side Programs at the ... · Energy Management in Demand Side Programs...
163
TRIO Roundtable: Energy Management in Demand Side Programs at the California Utilities August 19, 2013 PG&E Pacific Energy Center
Transcript of Energy Management in Demand Side Programs at the ... · Energy Management in Demand Side Programs...
TRIO Roundtable: Energy Management in Demand Side Programs at the California Utilities August 19, 2013 PG&E Pacific Energy Center
2
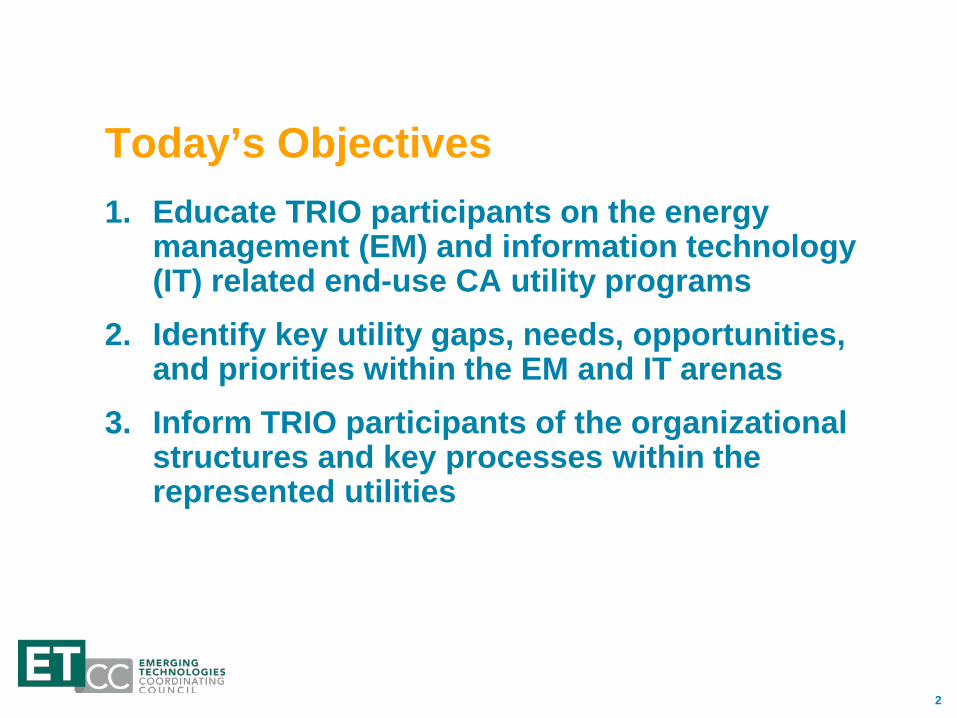
Today’s Objectives 1. Educate TRIO participants on the energy
management (EM) and information technology (IT) related end-use CA utility programs
2. Identify key utility gaps, needs, opportunities, and priorities within the EM and IT arenas
3. Inform TRIO participants of the organizational structures and key processes within the represented utilities
3
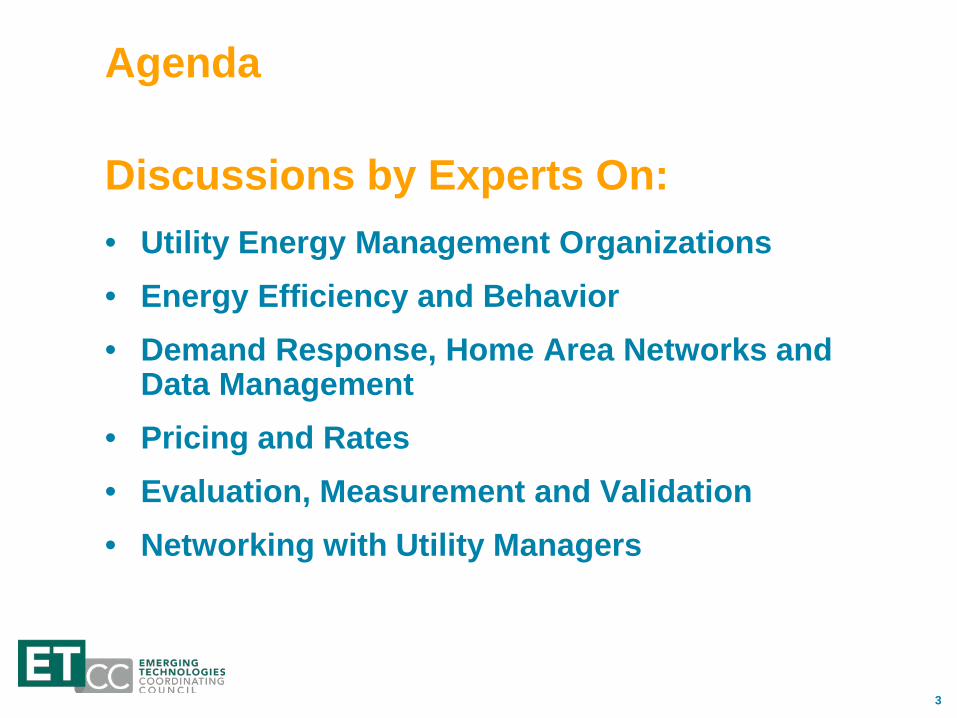
Agenda Discussions by Experts On: • Utility Energy Management Organizations • Energy Efficiency and Behavior • Demand Response, Home Area Networks and
Data Management • Pricing and Rates • Evaluation, Measurement and Validation • Networking with Utility Managers
Welcome and Big Picture Speaker: Aaron Panzer: Principal, Emerging Technologies | PG&E
5
Safety Message
In Case of Emergency
6
1. PG&E Background 2. Energy Efficiency’s Role 3. Emerging Technologies' Mission 4. Engage with ET
Discussion
7
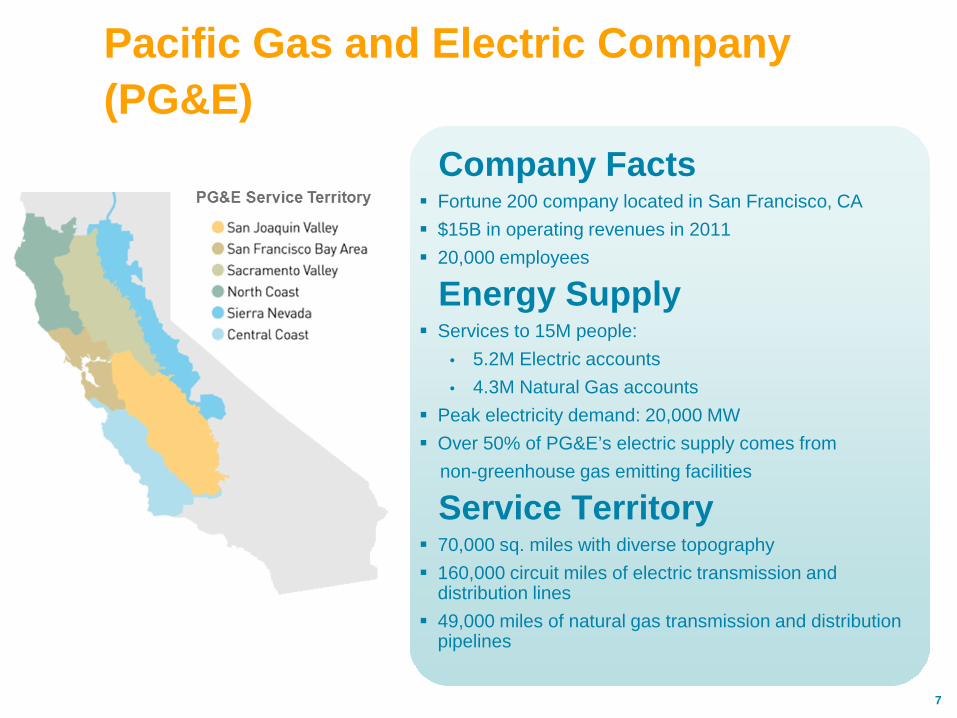
Company Facts Fortune 200 company located in San Francisco, CA $15B in operating revenues in 2011 20,000 employees
Energy Supply Services to 15M people:
• 5.2M Electric accounts • 4.3M Natural Gas accounts
Peak electricity demand: 20,000 MW Over 50% of PG&E’s electric supply comes from non-greenhouse gas emitting facilities
Service Territory 70,000 sq. miles with diverse topography 160,000 circuit miles of electric transmission and
distribution lines 49,000 miles of natural gas transmission and distribution
pipelines
Pacific Gas and Electric Company (PG&E)
8
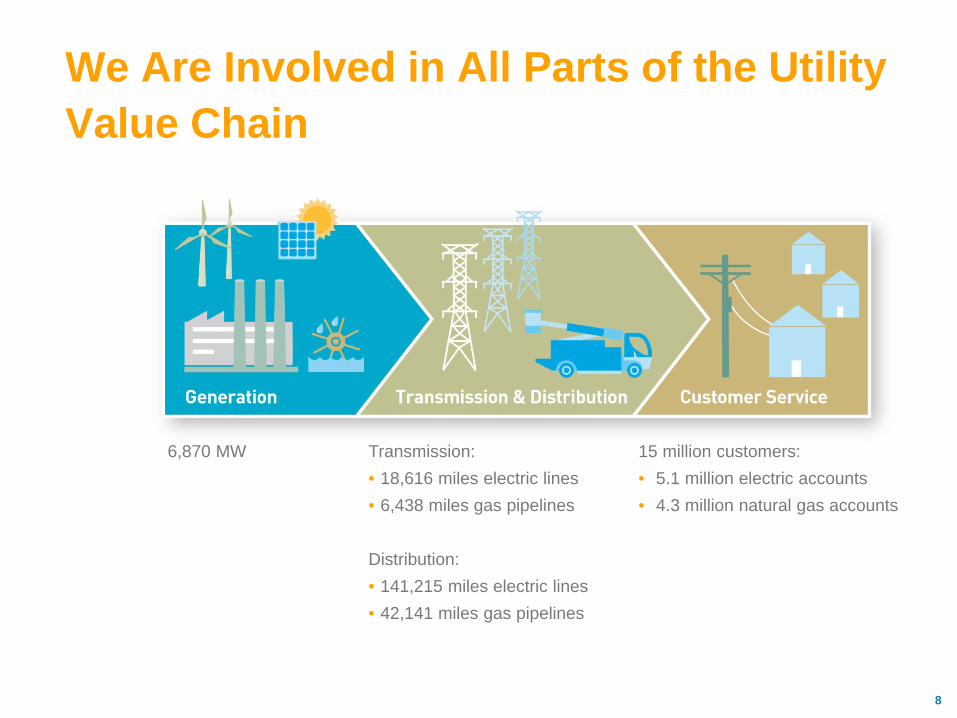
We Are Involved in All Parts of the Utility Value Chain
6,870 MW Transmission: • 18,616 miles electric lines • 6,438 miles gas pipelines Distribution: • 141,215 miles electric lines • 42,141 miles gas pipelines
15 million customers: • 5.1 million electric accounts • 4.3 million natural gas accounts
9
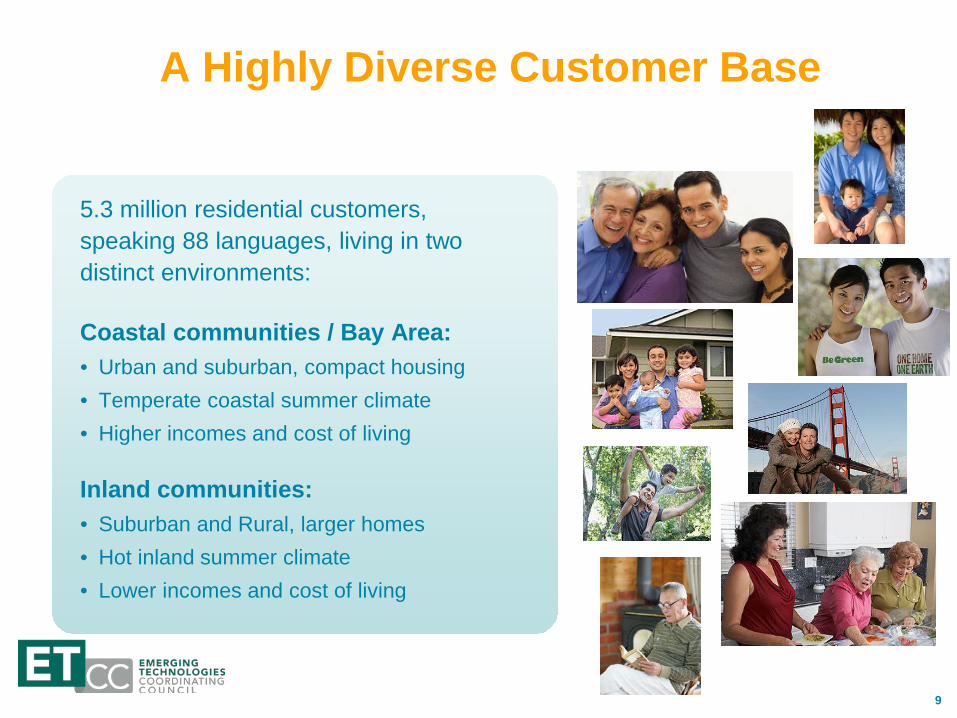
A Highly Diverse Customer Base
5.3 million residential customers, speaking 88 languages, living in two distinct environments:
Coastal communities / Bay Area: • Urban and suburban, compact housing • Temperate coastal summer climate • Higher incomes and cost of living
Inland communities: • Suburban and Rural, larger homes • Hot inland summer climate • Lower incomes and cost of living
10
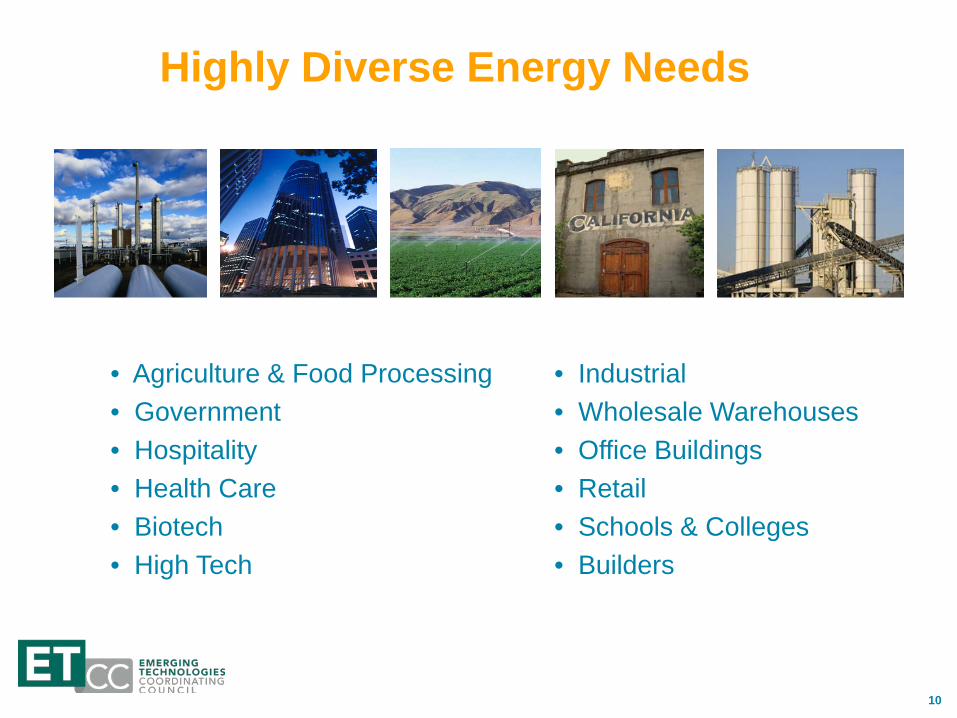
Highly Diverse Energy Needs
• Agriculture & Food Processing • Government • Hospitality • Health Care • Biotech • High Tech
• Industrial • Wholesale Warehouses • Office Buildings • Retail • Schools & Colleges • Builders
11
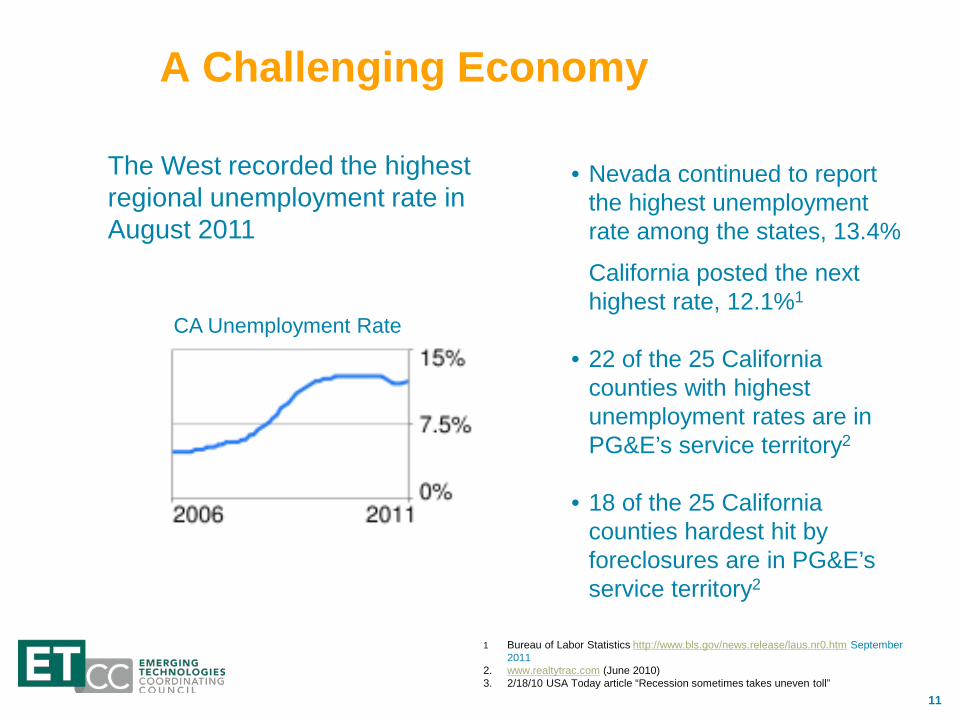
A Challenging Economy
• Nevada continued to report the highest unemployment rate among the states, 13.4%
California posted the next highest rate, 12.1%1
• 22 of the 25 California counties with highest unemployment rates are in PG&E’s service territory2
• 18 of the 25 California counties hardest hit by foreclosures are in PG&E’s service territory2
1 Bureau of Labor Statistics http://www.bls.gov/news.release/laus.nr0.htm September 2011
2. www.realtytrac.com (June 2010) 3. 2/18/10 USA Today article “Recession sometimes takes uneven toll”
The West recorded the highest regional unemployment rate in August 2011
CA Unemployment Rate
12
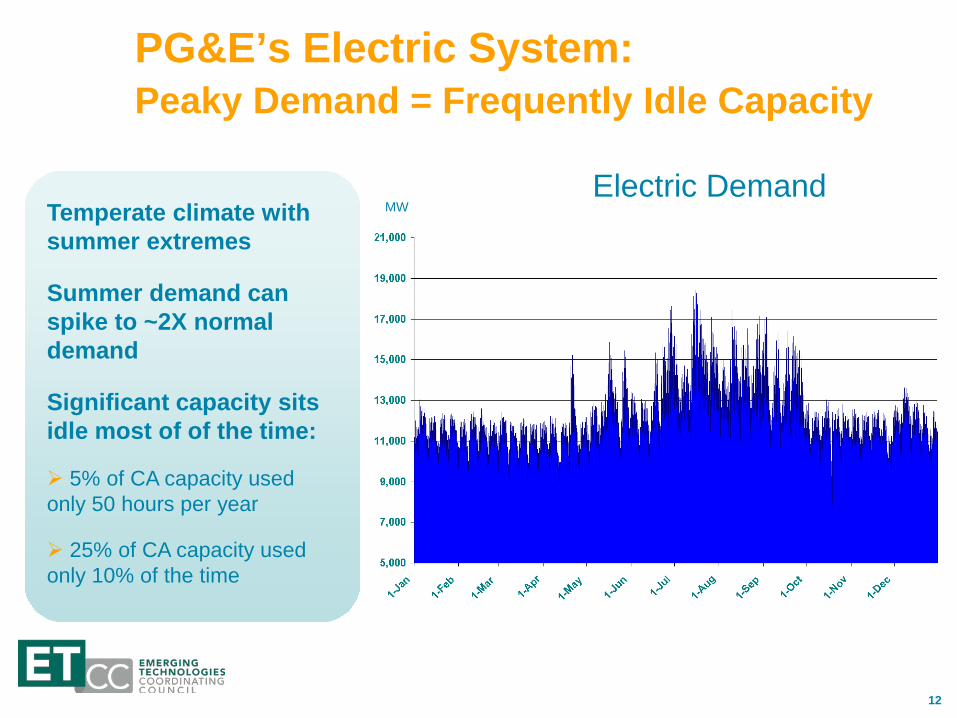
PG&E’s Electric System: Peaky Demand = Frequently Idle Capacity
Temperate climate with summer extremes
Summer demand can spike to ~2X normal demand
Significant capacity sits idle most of of the time:
5% of CA capacity used only 50 hours per year
25% of CA capacity used only 10% of the time
Electric Demand MW
13
35+ years of energy efficiency programs facilitated by “decoupling”
Renewable Portfolio Standard: 20% by 2010
33% by 2020
Preferred loading order: 1. Demand reductions: energy efficiency, demand response
2. New renewable and distributed generation
3. Clean gas-fired power plants
Forward Thinking Energy Policies
14
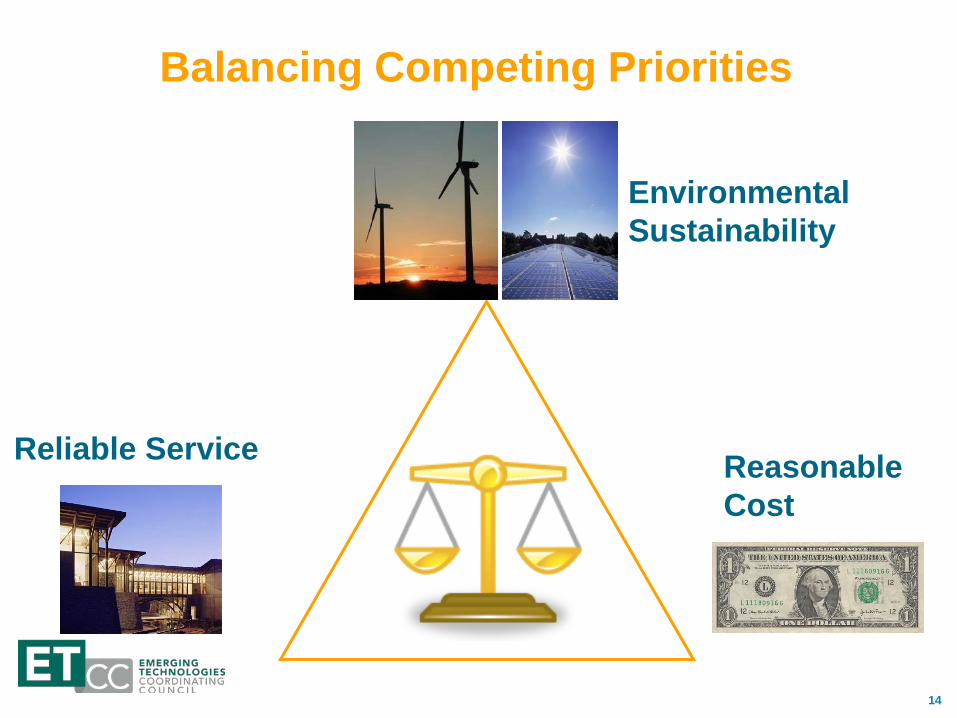
Balancing Competing Priorities
Reliable Service Reasonable Cost
Environmental Sustainability
15
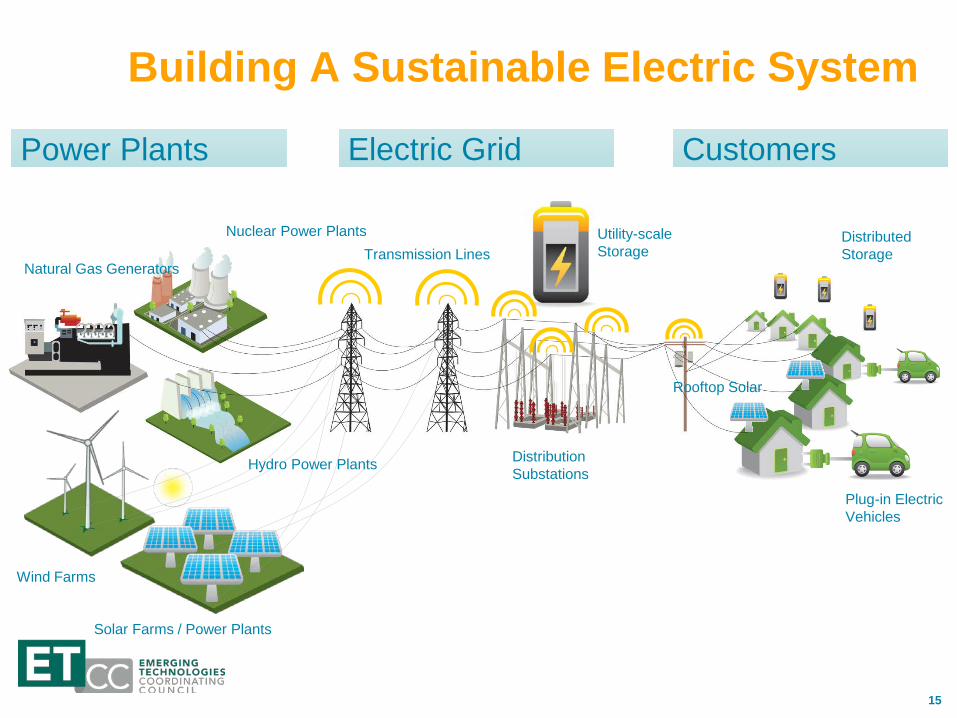
Power Plants
Smart Grid functionality restores the balance
Hydro Power Plants
Nuclear Power Plants
Natural Gas Generators Transmission Lines
Distribution Substations
Plug-in Electric Vehicles
Rooftop Solar
Solar Farms / Power Plants
Wind Farms
Electric Grid Customers
Utility-scale Storage
Distributed Storage
Building A Sustainable Electric System
16
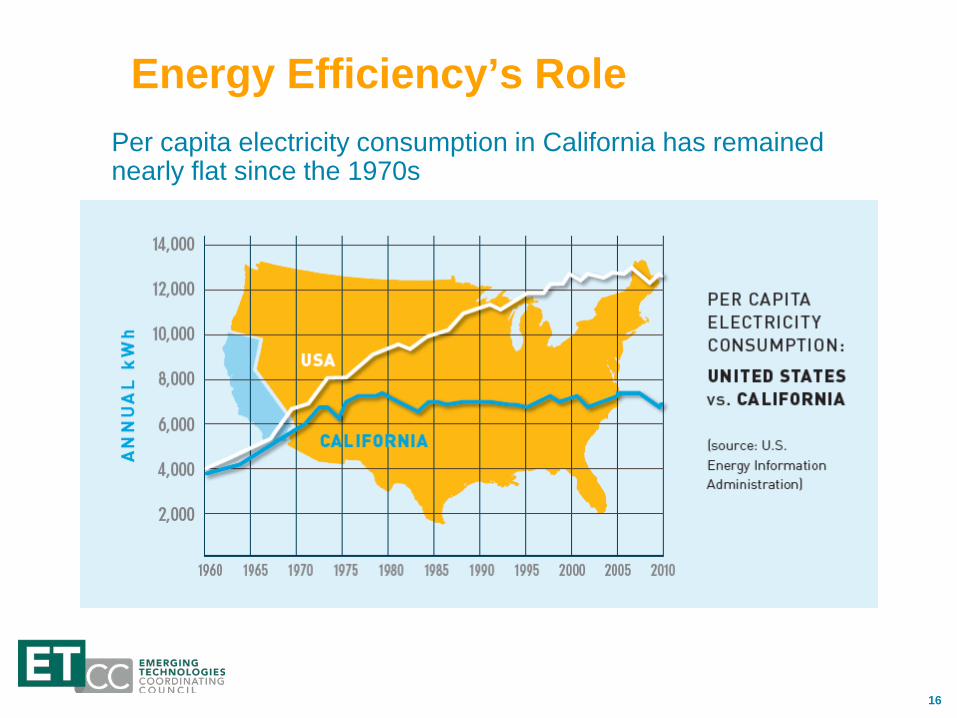
Energy Efficiency’s Role Per capita electricity consumption in California has remained nearly flat since the 1970s
17
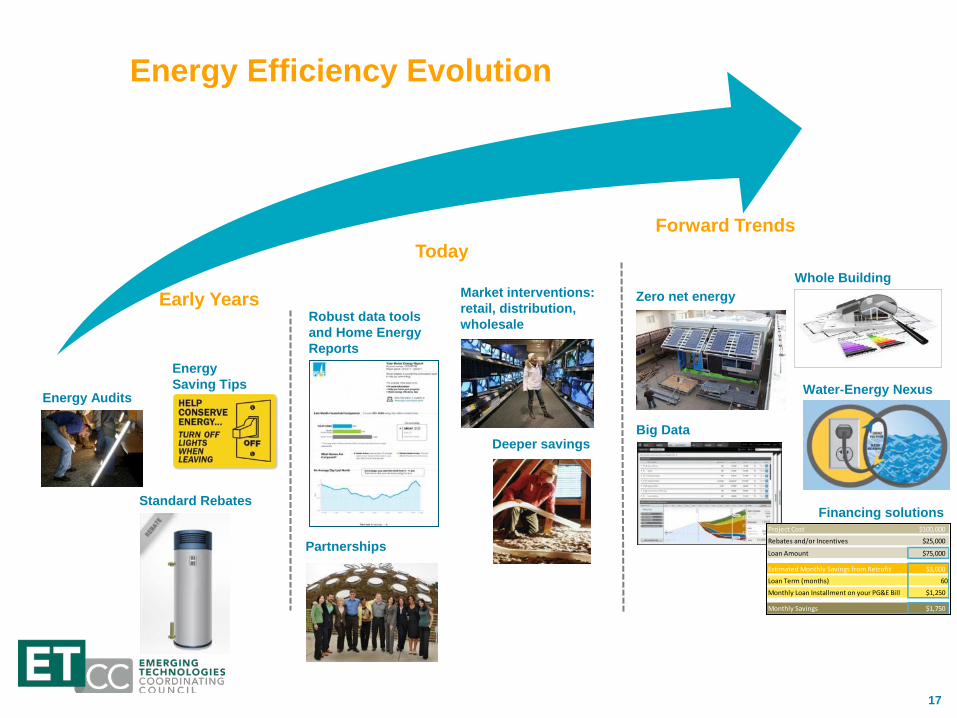
Early Years
Today Forward Trends
Energy Efficiency Evolution
Robust data tools and Home Energy Reports
Energy Saving Tips
Energy Audits
Standard Rebates
Market interventions: retail, distribution, wholesale
Deeper savings
Whole Building Zero net energy
Financing solutions
Partnerships
Water-Energy Nexus
Big Data
Project Cost $100,000
Rebates and/or Incentives $25,000
Loan Amount $75,000
Estimated Monthly Savings from Retrofit $3,000
Loan Term (months) 60
Monthly Loan Installment on your PG&E Bill $1,250
Monthly Savings $1,750
19
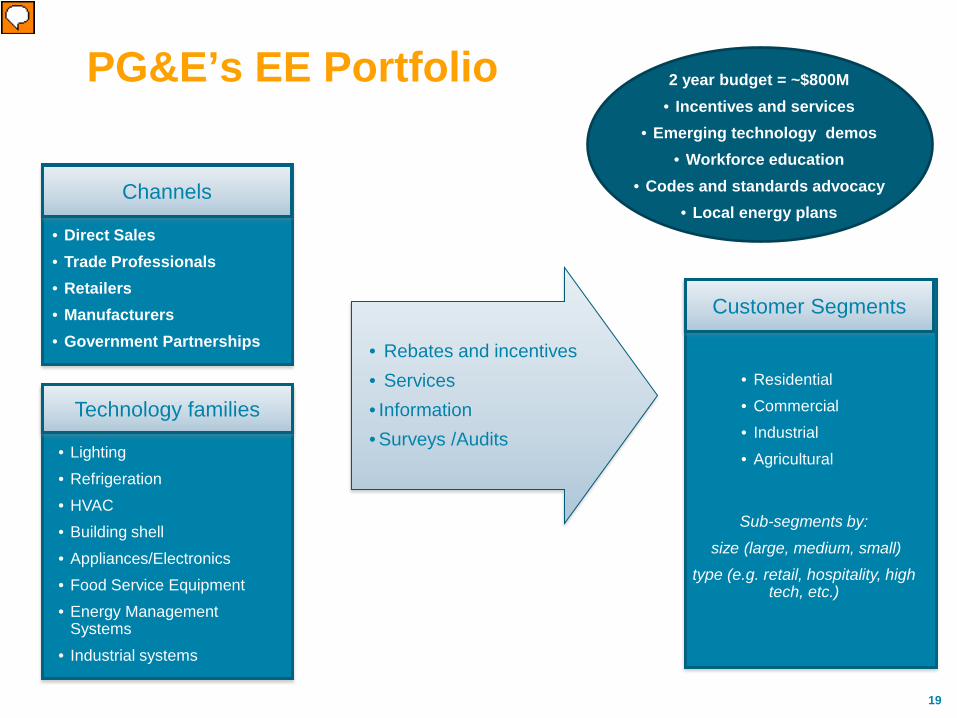
PG&E’s EE Portfolio
• Rebates and incentives • Services • Information • Surveys /Audits
• Lighting
• Refrigeration • HVAC • Building shell
• Appliances/Electronics • Food Service Equipment • Energy Management
Systems
• Industrial systems
Technology families
• Residential • Commercial • Industrial
• Agricultural
Customer Segments
Channels
• Direct Sales • Trade Professionals • Retailers • Manufacturers • Government Partnerships
Sub-segments by:
size (large, medium, small)
type (e.g. retail, hospitality, high tech, etc.)
2 year budget = ~$800M • Incentives and services
• Emerging technology demos • Workforce education
• Codes and standards advocacy • Local energy plans
Presenter
Presentation Notes
Our Customer Energy Efficiency program covers the full range of EE opportunities in our service territory. This program includes over 100 programs a 3-year budget of $1.3 Billion We have dedicated programs for each customer segment and even work upstream to influence the manufacturers and distributors when appropriate We also have multiple delivery channels with Core IOU programs (some PGE-only, some statewide), outsourced Third Party Programs, and Local Government Partnerships We have a diverse set of programs Incentive or Rebate programs: appliances, lighting, new construction, retrofits, audits, electronics, buildings, energy management systems, boilers / steam systems, food service, motors, refrigeration, pumps and fans, HVAC, industrial systems / processes Dedicated Low Income program which offers deeply incented EE for our neediest residents On-Bill financing program to enable more EE Codes and Standards advocacy and compliance training Emerging Technology assessments / demos / incubation Workforce education
20
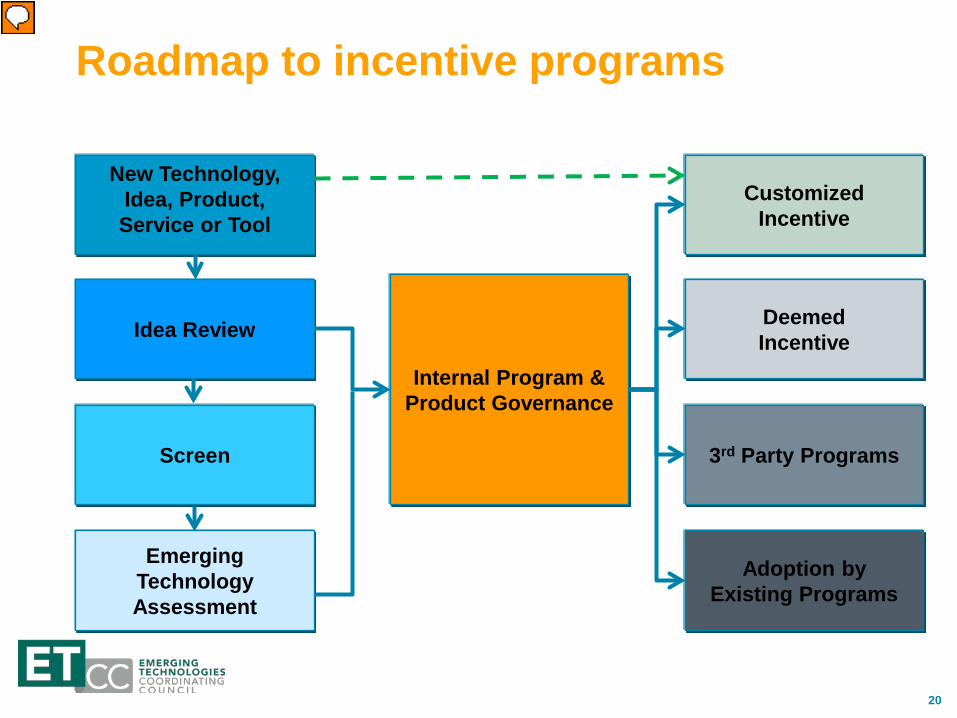
Roadmap to incentive programs
New Technology, Idea, Product, Service or Tool
Idea Review
Screen
Emerging Technology Assessment
Internal Program & Product Governance
Customized Incentive
Deemed Incentive
3rd Party Programs
Adoption by Existing Programs
Presenter
Presentation Notes
On the left are the “big picture” steps. On the right are the outcomes, i.e. programs where you can receive incentives for your product. Not everyone needs to go into the full Emerging Technology Assessment Process. You have some choice over which path you choose. Each path has its advantages and disadvantages. We are now going to drill down into the process at increasing levels of detail. But where do you start? Are you even ready to start?
22
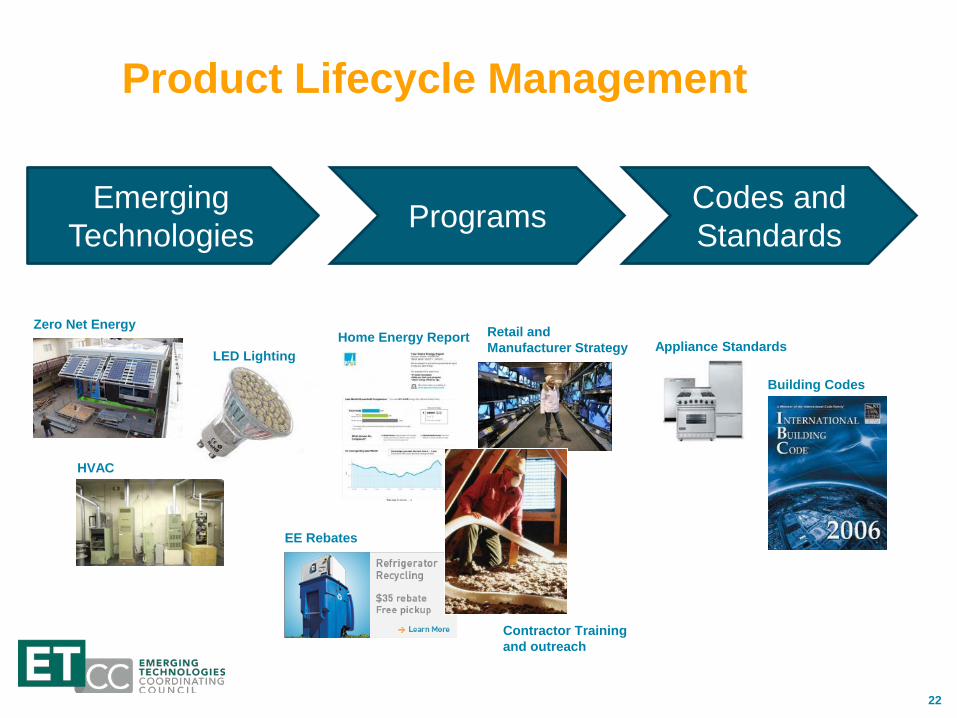
Product Lifecycle Management
Home Energy Report
Emerging Technologies Programs Codes and
Standards
LED Lighting
Zero Net Energy
HVAC
Retail and Manufacturer Strategy
Contractor Training and outreach
Appliance Standards
Building Codes
EE Rebates
23
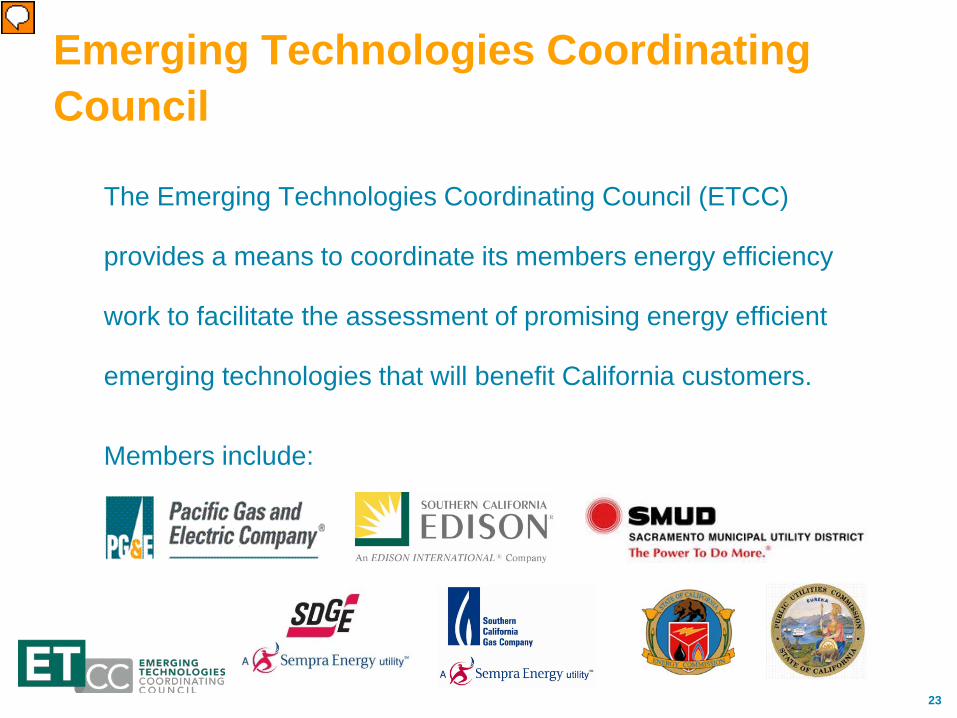
Emerging Technologies Coordinating Council
The Emerging Technologies Coordinating Council (ETCC)
provides a means to coordinate its members energy efficiency
work to facilitate the assessment of promising energy efficient
emerging technologies that will benefit California customers.
Members include:
Presenter
Presentation Notes
California's investor-owned utilities (IOUs), the Sacramento Utility District(SMUD), the California Energy Commission (CEC) and the California Public Utilities Commission (CPUC) have combined forces to promote new cost-effective, energy saving technologies-the basis for products and services that strengthen the region's economy while meeting today's and tomorrow's environmental challenges. This work responds to the mandate outlined in the California Energy Action Plan. Created in 2003.
24
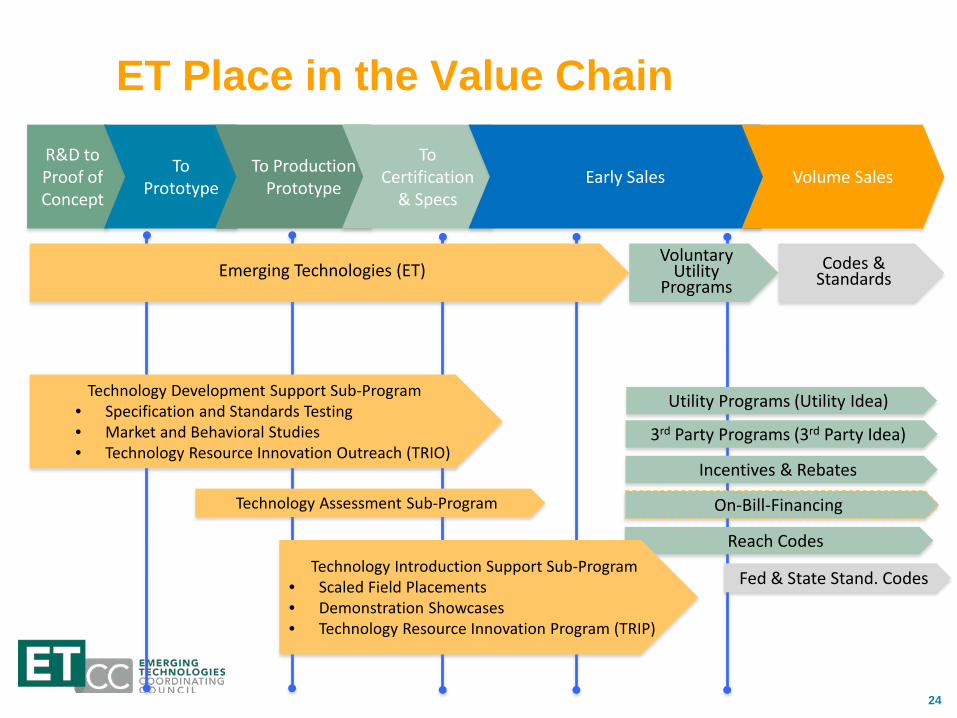
ET Place in the Value Chain R&D to Proof of Concept
To Prototype
To Production Prototype
To Certification
& Specs Early Sales Volume Sales
Technology Development Support Sub-Program • Specification and Standards Testing • Market and Behavioral Studies • Technology Resource Innovation Outreach (TRIO)
Technology Assessment Sub-Program
Emerging Technologies (ET) Voluntary
Utility Programs
Codes & Standards
Reach Codes
Utility Programs (Utility Idea)
3rd Party Programs (3rd Party Idea)
Incentives & Rebates
On-Bill-Financing
Fed & State Stand. Codes Technology Introduction Support Sub-Program
• Scaled Field Placements • Demonstration Showcases • Technology Resource Innovation Program (TRIP)
25
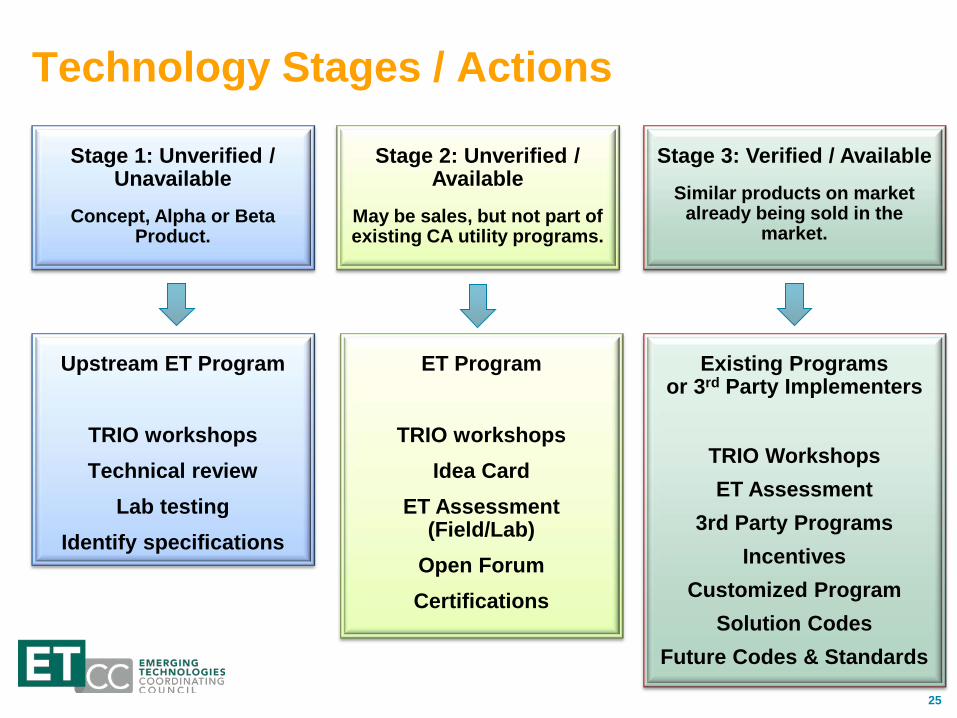
Technology Stages / Actions
Upstream ET Program
TRIO workshops Technical review
Lab testing Identify specifications
Stage 1: Unverified / Unavailable
Concept, Alpha or Beta Product.
Stage 2: Unverified / Available
May be sales, but not part of existing CA utility programs.
Stage 3: Verified / Available Similar products on market
already being sold in the market.
ET Program
TRIO workshops Idea Card
ET Assessment (Field/Lab)
Open Forum Certifications
Existing Programs or 3rd Party Implementers
TRIO Workshops ET Assessment
3rd Party Programs Incentives
Customized Program Solution Codes
Future Codes & Standards
26
Screening Criteria • It Saves Energy!
• Has a DSM Program Portfolio Fit
• Meets EE and DR Programs Requirements
• Commercially Available
• Market Barriers Addressed
• Current Market Readiness
• Need for IOU Involvement
• EM&V (achievable/defendable)
• Aligns with the California Long Term Strategic Plan
27
Emerging Technology Focus Areas
Advanced lighting (LEDs) and controls Whole buildings approach for “deep savings” •Building = system of systems (lighting, HVAC, building shell)
Integration: energy efficiency + demand response + distributed generation
Behavior-based approaches •Energy information (e.g. in-home displays)
Automation •Smart meters
•Customer automation of energy management
28
Engage with ET Technology Resource Innovation Outreach (TRIO)
• Education opportunity to learn about CA utility DSM programs
• Arena to meet and network with key CA utility stakeholders
ETCC Open Forums • Present technologies/solutions to ETCC members and other key
CA utility stakeholders
ETCC Website • Access final reports for previous Emerging Technologies projects
• Submit ideas to ETCC members
Presenter
Presentation Notes
This will be discussed in more depth later on in the program. Introduce the idea that TRIO is a mechanism for the CA Utilities to engage with entrepreneurs and developers prior to their products being commercially ready. This allows the utilities to disseminate info about our savings goals and ratepayer needs regarding energy efficiency.
30
Online Resources
http://www.etcc-ca.com/
31
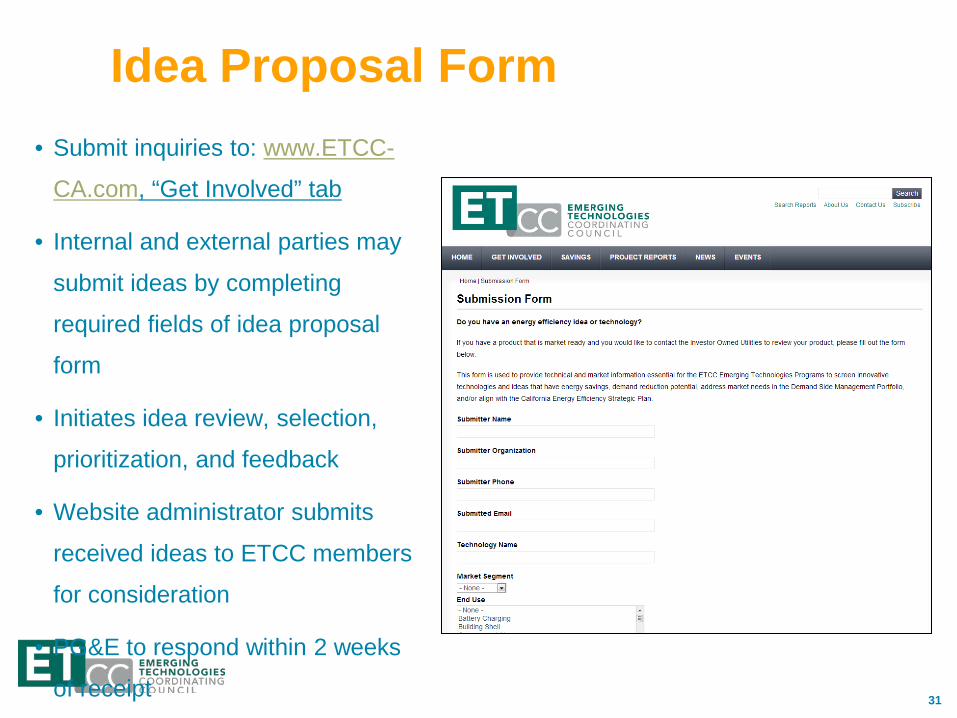
Idea Proposal Form • Submit inquiries to: www.ETCC-
CA.com, “Get Involved” tab
• Internal and external parties may
submit ideas by completing
required fields of idea proposal
form
• Initiates idea review, selection,
prioritization, and feedback
• Website administrator submits
received ideas to ETCC members
for consideration
• PG&E to respond within 2 weeks
of receipt
32
Thank You!
Thank you all for taking time from your busy schedules to attend this event! Please feel free to ask questions and be sure to take advantage of this wonderful networking opportunity.
33
Energy Management Programs at CA Utilities
Moderator: Mananya Chansanchai: Senior Product Manager, Emerging Technologies | PG&E Panelists: Rachel Radell: Project Manager, Energy Research and Development | SMUD Edwin Hornquist: Manager, Emerging Technologies Program | SCE Nathan Taylor: Project Manager, Emerging Technologies | SDG&E Abdullah Ahmed: Manager, Emerging Technologies Program | SoCal Gas
34
Panel Agenda
• Introductions
• Organizational and energy management structure at PG&E
• Organizational structures at CA IOUs and SMUD
• High-level overview of energy management and information technology landscape in California
• Q&A
35
PG&E Customer Energy Solutions Organizational Overview
36
Key Takeaways
• Insight into PG&E’s Customer Energy Solutions team • Overview of energy management at PG&E
37
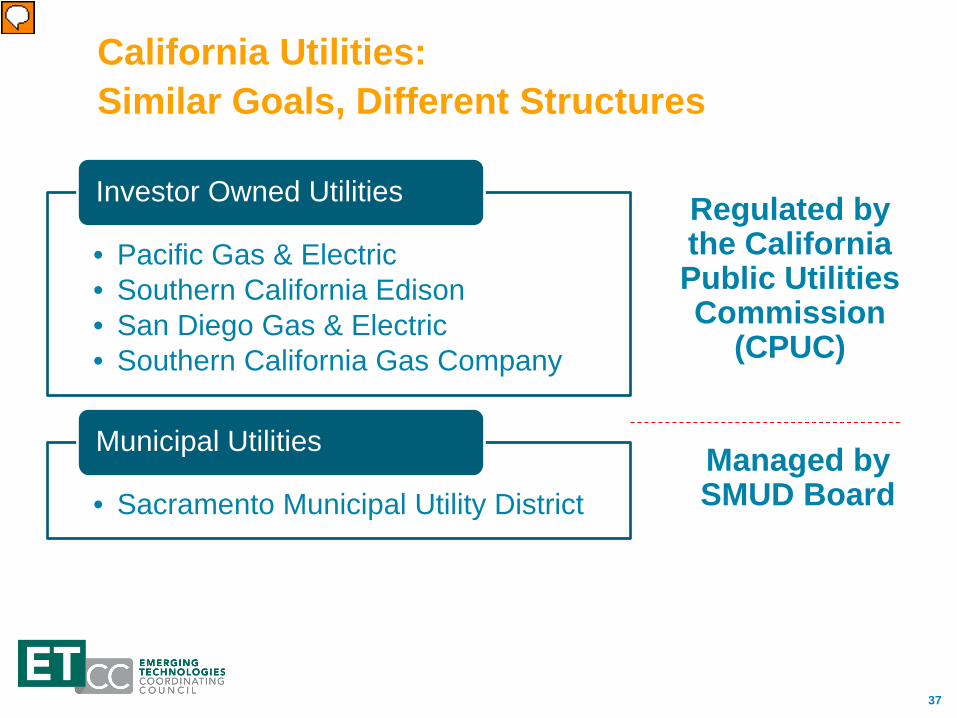
California Utilities: Similar Goals, Different Structures
• Pacific Gas & Electric • Southern California Edison • San Diego Gas & Electric • Southern California Gas Company
Investor Owned Utilities
• Sacramento Municipal Utility District
Municipal Utilities
Regulated by the California Public Utilities Commission
(CPUC)
Managed by SMUD Board
Presenter
Presentation Notes
Will introduce that even within IOUs, organizational structures vary greatly Four CA investor owned utilities and XXXXX municipal utilities (CONFIRM THIS). The IOUs are all regulated by the California Public Utilities Commission (CPUC), while the municipal utilities do not have a common regulatory entity. Rather, for example
38
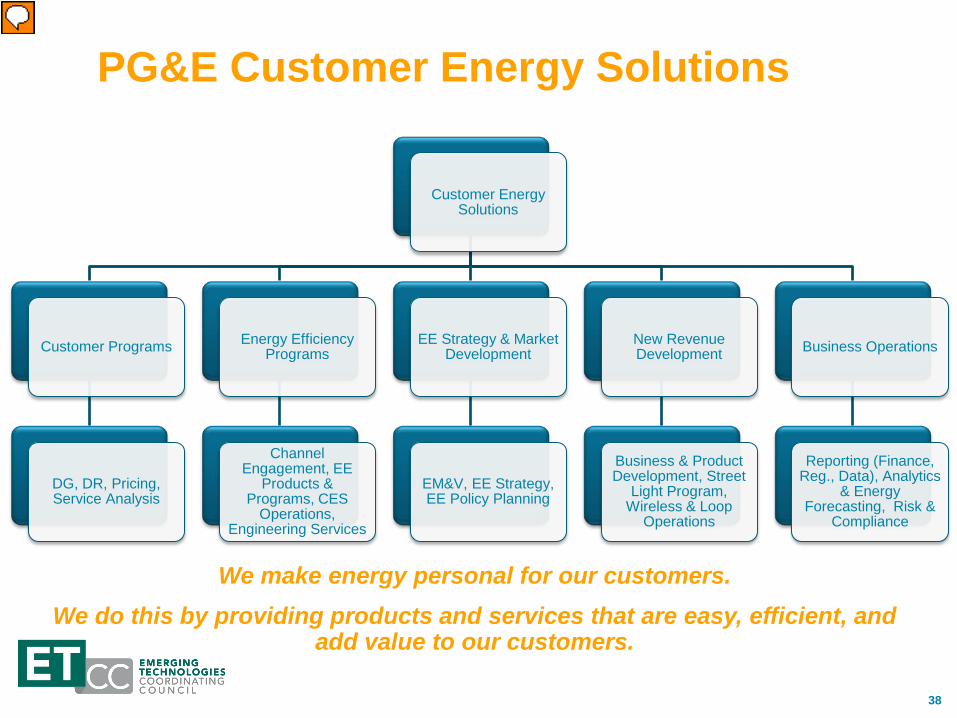
PG&E Customer Energy Solutions
Customer Energy Solutions
Customer Programs
DG, DR, Pricing, Service Analysis
Energy Efficiency Programs
Channel Engagement, EE
Products & Programs, CES
Operations, Engineering Services
EE Strategy & Market Development
EM&V, EE Strategy, EE Policy Planning
New Revenue Development
Business & Product Development, Street
Light Program, Wireless & Loop
Operations
Business Operations
Reporting (Finance, Reg., Data), Analytics
& Energy Forecasting, Risk &
Compliance
We make energy personal for our customers. We do this by providing products and services that are easy, efficient, and
add value to our customers.
Presenter
Presentation Notes
Customer Programs: The panels later today will include representatives from this team and will review Demand Response, Home Area Network, Green Button Connect and Pricing. Energy Efficiency Programs: EE Products & Programs team develops energy efficiency products and programs; channel engagement, which includes our 3P, GCP and trade professional network, is responsible for the delivery of those products and programs. Our next panel will include members from the EE products and programs team. EE Strategy and Market Development: This team is our strategy and policy team as it relates to energy efficiency and they’re responsible for helping us grow the portfolio by focusing on ways to keep PG&E active in the CA energy landscape. Brian Smith of the Evaluation Measurement & Verification team will be speaking during our last panel of the day. Coordination across the organization is a work in progress and we’re getting better. One way to assist in that is the common email address for any energy management inquiries to PG&E. This will allow all inquiries to be funneled via one location and dispersed to the appropriate people.
39
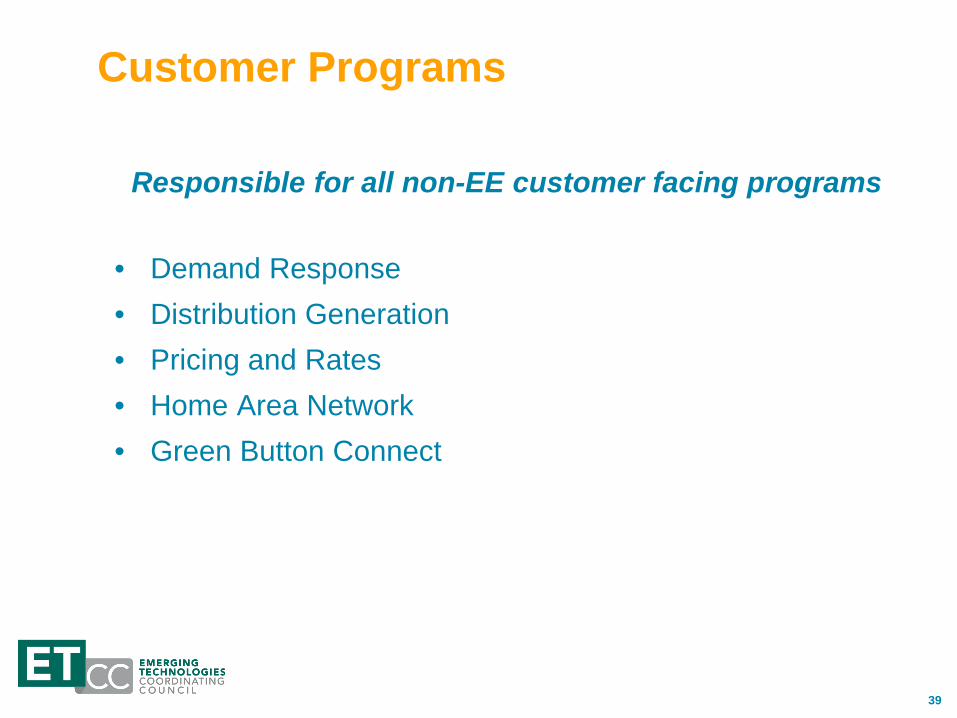
Customer Programs
Responsible for all non-EE customer facing programs
• Demand Response • Distribution Generation • Pricing and Rates • Home Area Network • Green Button Connect
40
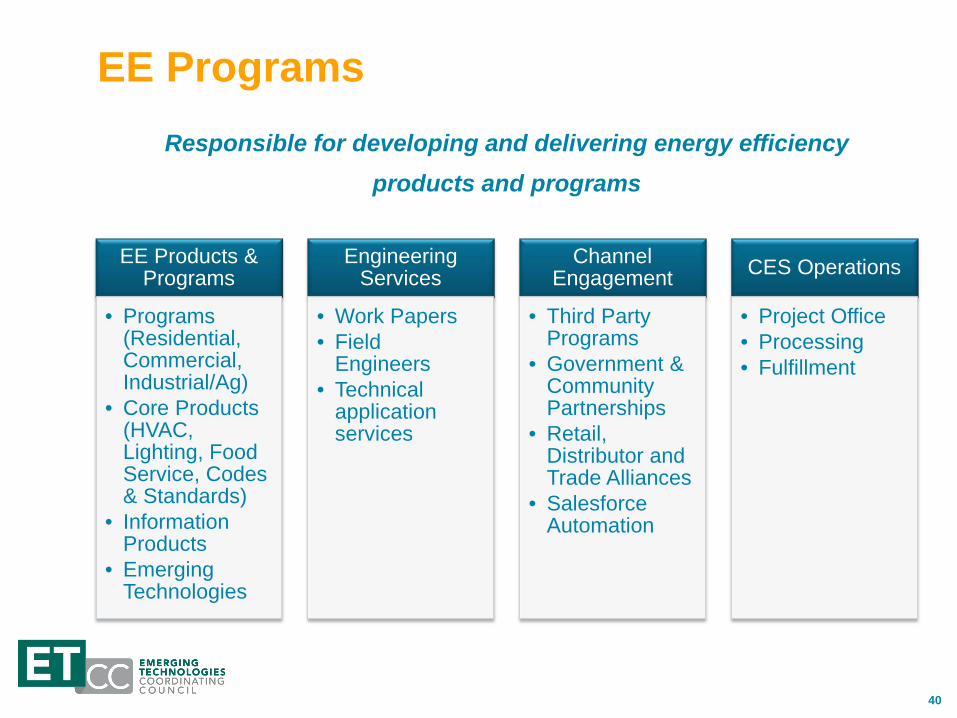
EE Programs
EE Products & Programs
• Programs (Residential, Commercial, Industrial/Ag)
• Core Products (HVAC, Lighting, Food Service, Codes & Standards)
• Information Products
• Emerging Technologies
Engineering Services
• Work Papers • Field
Engineers • Technical
application services
Channel Engagement
• Third Party Programs
• Government & Community Partnerships
• Retail, Distributor and Trade Alliances
• Salesforce Automation
CES Operations
• Project Office • Processing • Fulfillment
Responsible for developing and delivering energy efficiency products and programs
41
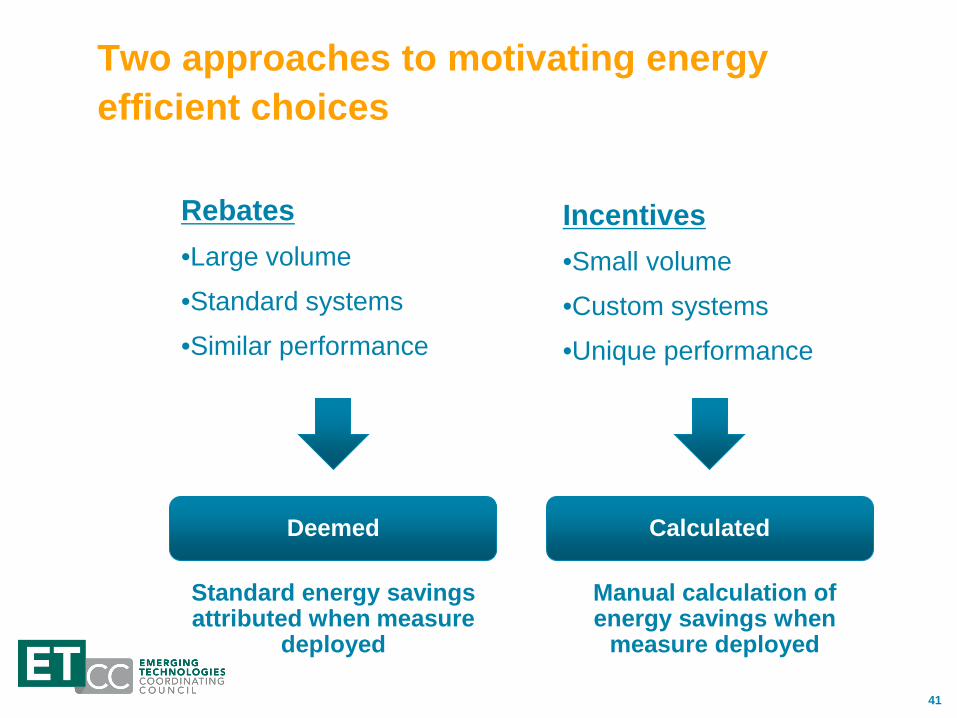
Two approaches to motivating energy efficient choices
Rebates •Large volume
•Standard systems
•Similar performance
Incentives •Small volume
•Custom systems
•Unique performance
Deemed Calculated
Standard energy savings attributed when measure
deployed
Manual calculation of energy savings when
measure deployed
42
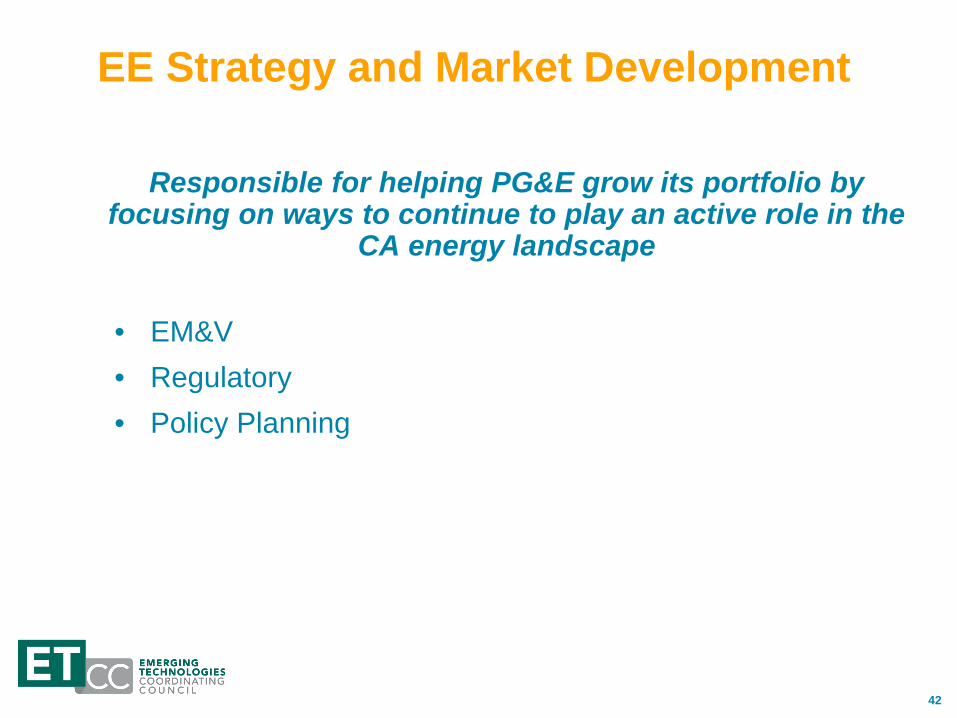
EE Strategy and Market Development
Responsible for helping PG&E grow its portfolio by focusing on ways to continue to play an active role in the
CA energy landscape
• EM&V • Regulatory • Policy Planning
43
Enabling Energy Management at PG&E • SmartMeterTM provides the platform for
the evolution to integrated customer energy management
• Enables tools that allow customers the ability to see how they’re using energy and make informed decisions that help reduce energy use
• Automation and Behavioral Savings are the next frontier
Presenter
Presentation Notes
Customer needs and marketplace have evolved so we need to develop innovative solutions More complicated landscape Pricing changes (i.e. time varying pricing) SmartMeter data availability Electric vehicles, on-site generation and storage Integrating these solutions and integrating into the electric grid Today’s panelists will discuss the various ways that the utilities are trying to develop and implement those innovative solutions
44
Organizational Structures Energy Management at the CA Utilities
45
Sacramento Municipal Utility District
Rachel Radell
46
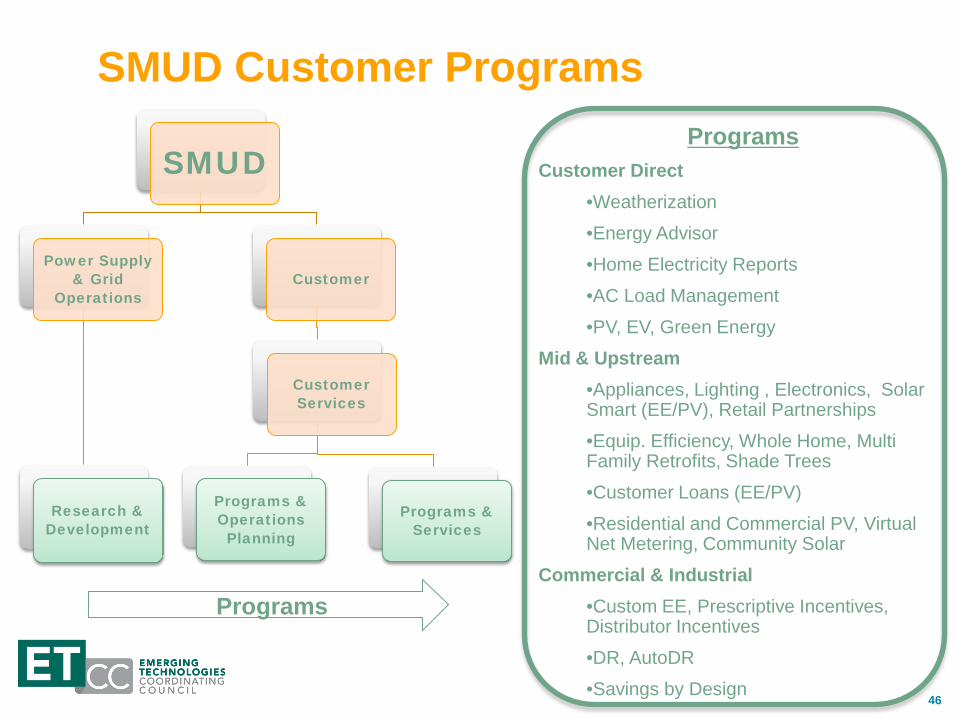
SMUD Customer Programs
SMUD
Power Supply & Grid
Operations
Research & Development
Customer
Customer Services
Programs & Operations Planning
Programs & Services
Programs
Programs Customer Direct
•Weatherization
•Energy Advisor
•Home Electricity Reports
•AC Load Management
•PV, EV, Green Energy
Mid & Upstream •Appliances, Lighting , Electronics, Solar Smart (EE/PV), Retail Partnerships
•Equip. Efficiency, Whole Home, Multi Family Retrofits, Shade Trees
•Customer Loans (EE/PV)
•Residential and Commercial PV, Virtual Net Metering, Community Solar
Commercial & Industrial •Custom EE, Prescriptive Incentives, Distributor Incentives
•DR, AutoDR
•Savings by Design
47
Southern California Edison Edwin Hornquist
48 48
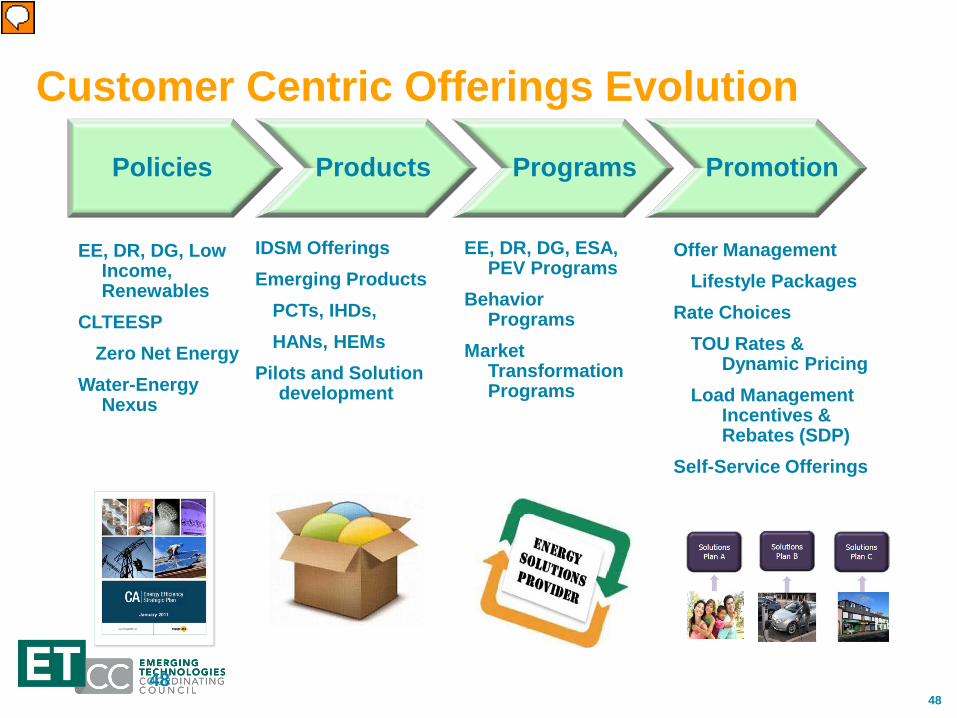
Customer Centric Offerings Evolution
Policies Products Programs Promotion
EE, DR, DG, Low Income, Renewables
CLTEESP Zero Net Energy
Water-Energy Nexus
IDSM Offerings Emerging Products
PCTs, IHDs, HANs, HEMs
Pilots and Solution development
EE, DR, DG, ESA, PEV Programs
Behavior Programs
Market Transformation Programs
Offer Management Lifestyle Packages
Rate Choices TOU Rates &
Dynamic Pricing Load Management
Incentives & Rebates (SDP)
Self-Service Offerings
Presenter
Presentation Notes
Oversight of offerings
49
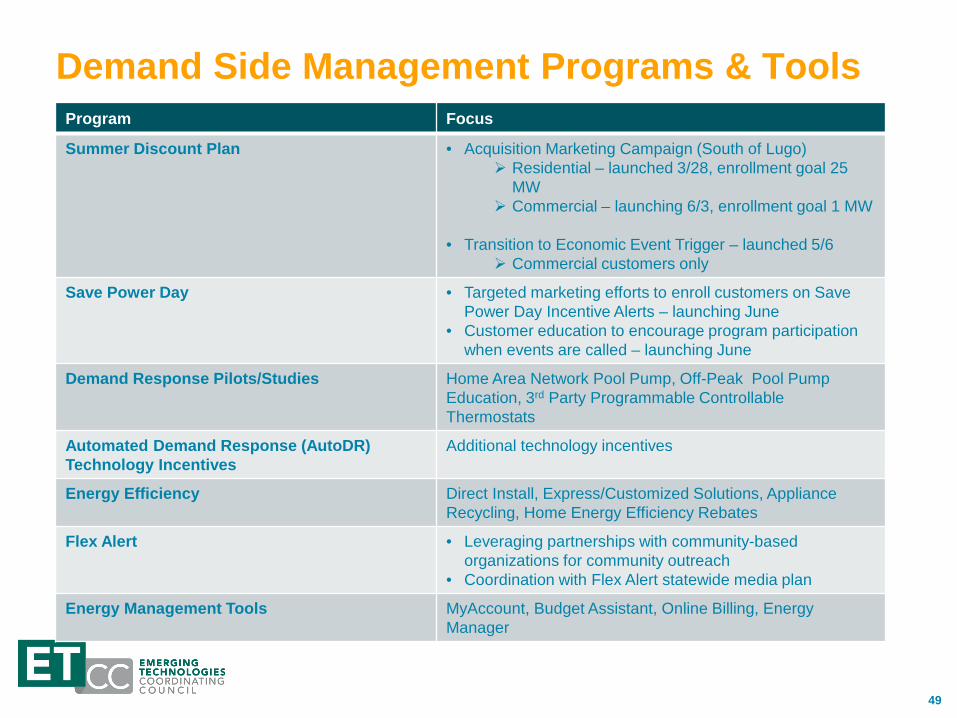
Program Focus
Summer Discount Plan • Acquisition Marketing Campaign (South of Lugo) Residential – launched 3/28, enrollment goal 25
MW Commercial – launching 6/3, enrollment goal 1 MW
• Transition to Economic Event Trigger – launched 5/6
Commercial customers only
Save Power Day • Targeted marketing efforts to enroll customers on Save Power Day Incentive Alerts – launching June
• Customer education to encourage program participation when events are called – launching June
Demand Response Pilots/Studies Home Area Network Pool Pump, Off-Peak Pool Pump Education, 3rd Party Programmable Controllable Thermostats
Automated Demand Response (AutoDR) Technology Incentives
Additional technology incentives
Energy Efficiency Direct Install, Express/Customized Solutions, Appliance Recycling, Home Energy Efficiency Rebates
Flex Alert • Leveraging partnerships with community-based organizations for community outreach
• Coordination with Flex Alert statewide media plan
Energy Management Tools MyAccount, Budget Assistant, Online Billing, Energy Manager
Demand Side Management Programs & Tools
50
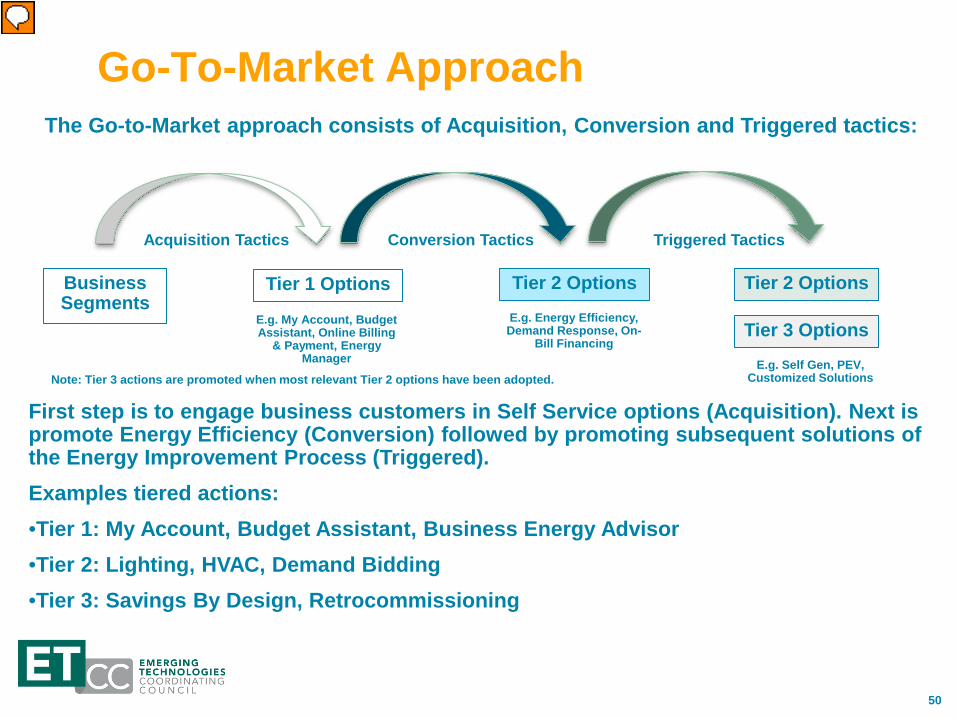
Go-To-Market Approach
The Go-to-Market approach consists of Acquisition, Conversion and Triggered tactics:
First step is to engage business customers in Self Service options (Acquisition). Next is promote Energy Efficiency (Conversion) followed by promoting subsequent solutions of the Energy Improvement Process (Triggered). Examples tiered actions: •Tier 1: My Account, Budget Assistant, Business Energy Advisor •Tier 2: Lighting, HVAC, Demand Bidding •Tier 3: Savings By Design, Retrocommissioning
Business Segments
Tier 1 Options Tier 2 Options Tier 2 Options
Acquisition Tactics Conversion Tactics Triggered Tactics
Tier 3 Options E.g. My Account, Budget Assistant, Online Billing
& Payment, Energy Manager
E.g. Energy Efficiency, Demand Response, On-
Bill Financing
E.g. Self Gen, PEV, Customized Solutions Note: Tier 3 actions are promoted when most relevant Tier 2 options have been adopted.
Presenter
Presentation Notes
First step is to engage business customers in Self Service options (Acquisition). Next is promote Energy Efficiency (Conversion) followed by promoting subsequent solutions of the Energy Improvement Process (Triggered).
51
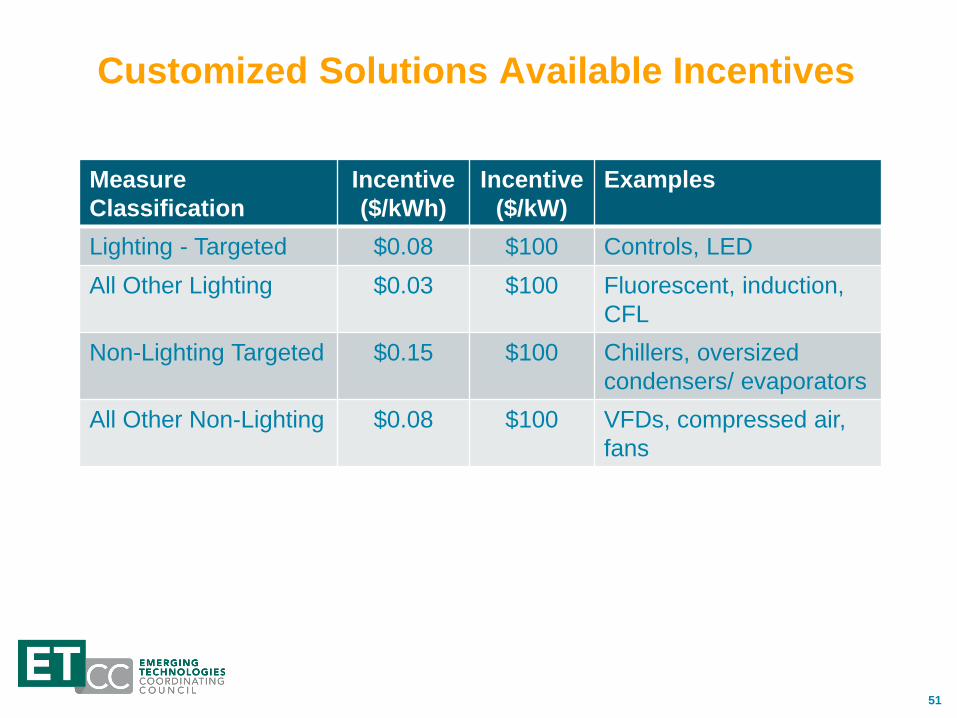
Measure Classification
Incentive ($/kWh)
Incentive ($/kW)
Examples
Lighting - Targeted $0.08 $100 Controls, LED All Other Lighting $0.03 $100
Fluorescent, induction, CFL
Non-Lighting Targeted $0.15 $100
Chillers, oversized condensers/ evaporators
All Other Non-Lighting $0.08 $100 VFDs, compressed air, fans
Customized Solutions Available Incentives
52
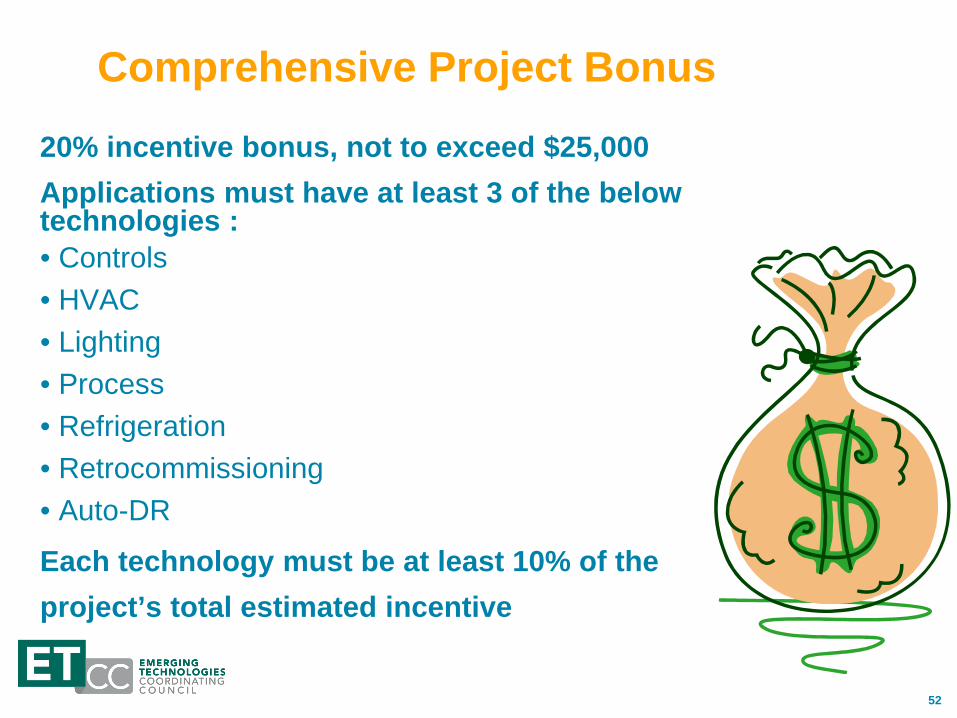
20% incentive bonus, not to exceed $25,000 Applications must have at least 3 of the below technologies : • Controls • HVAC • Lighting • Process • Refrigeration • Retrocommissioning • Auto-DR
Each technology must be at least 10% of the project’s total estimated incentive
Comprehensive Project Bonus
53
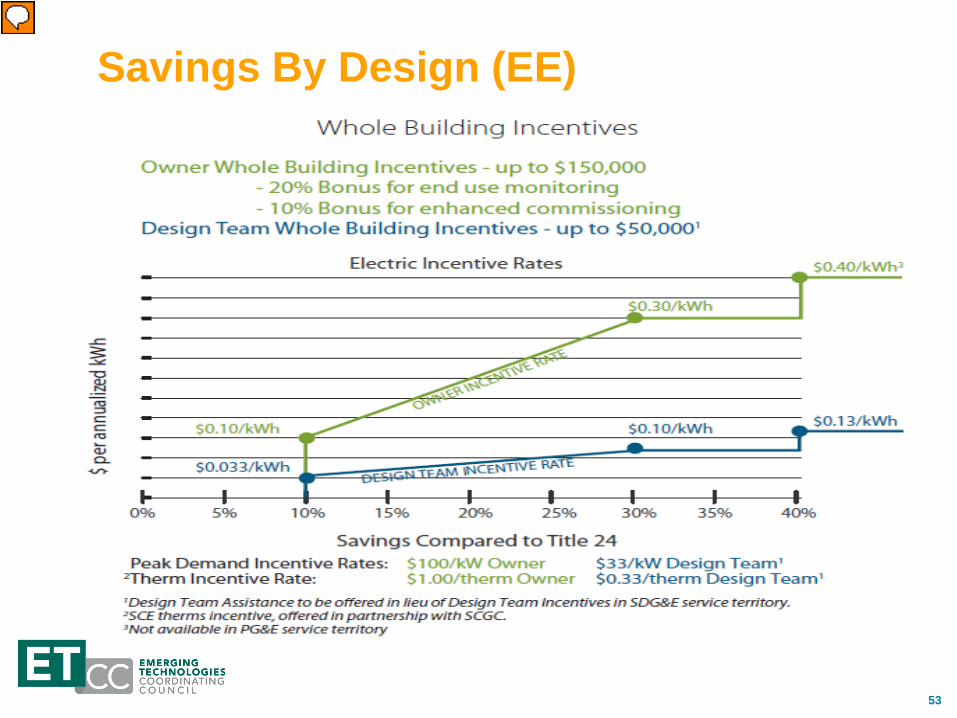
Savings By Design (EE)
Presenter
Presentation Notes
New for 2013: Increased end use monitoring kicker to 20% (end use metering equipment able to monitor and record lighting, HVAC, process, and plug loads separately) Eliminated green building certification incentive 40% incentive (to encourage Net Zero) Eliminated Integrated Design Team Stipend
54
San Diego Gas & Electric Southern California Gas Nate Taylor
55
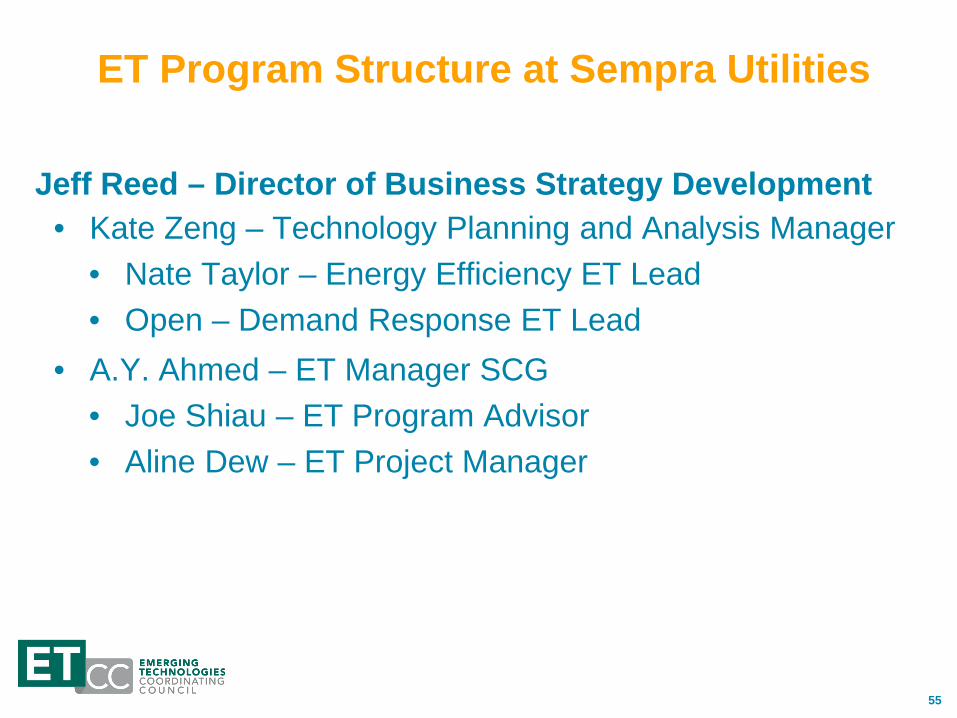
ET Program Structure at Sempra Utilities
Jeff Reed – Director of Business Strategy Development • Kate Zeng – Technology Planning and Analysis Manager
• Nate Taylor – Energy Efficiency ET Lead • Open – Demand Response ET Lead
• A.Y. Ahmed – ET Manager SCG • Joe Shiau – ET Program Advisor • Aline Dew – ET Project Manager
56
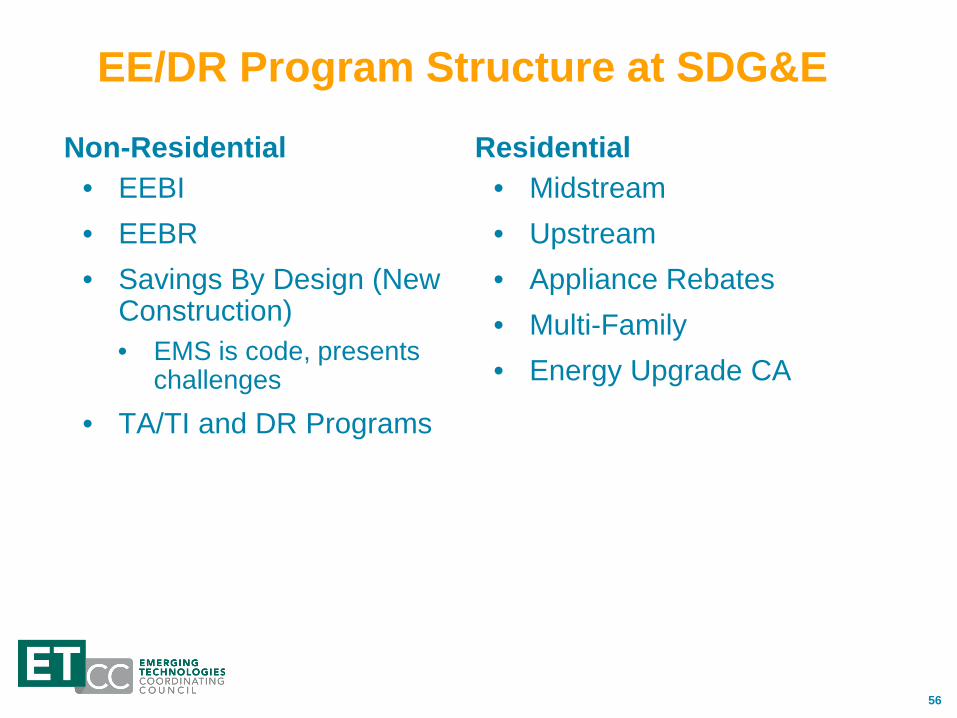
EE/DR Program Structure at SDG&E
Non-Residential • EEBI • EEBR • Savings By Design (New
Construction) • EMS is code, presents
challenges
• TA/TI and DR Programs
Residential • Midstream • Upstream • Appliance Rebates • Multi-Family • Energy Upgrade CA
57
Other Programs at SDG&E
IDEEA365 and Other 3PP Strategy Group
• Green Button Data • Customer Information • Behavioral Programs • HAN Team
58
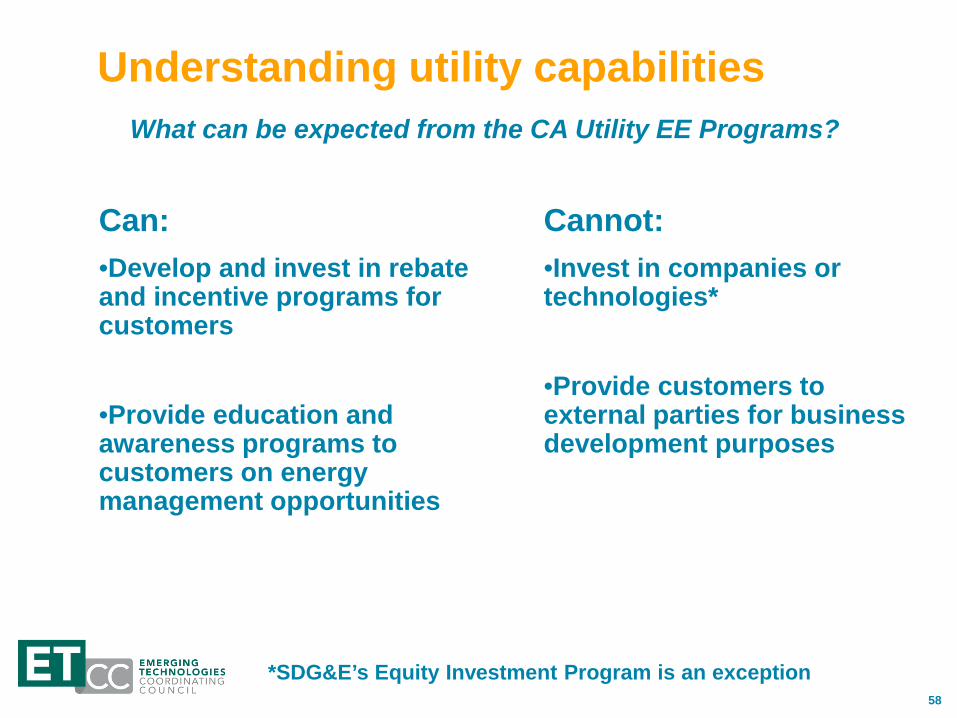
Understanding utility capabilities
Cannot: •Invest in companies or technologies*
•Provide customers to external parties for business development purposes
Can: •Develop and invest in rebate and incentive programs for customers •Provide education and awareness programs to customers on energy management opportunities
What can be expected from the CA Utility EE Programs?
*SDG&E’s Equity Investment Program is an exception
59
Southern California Gas A. Ahmed
60
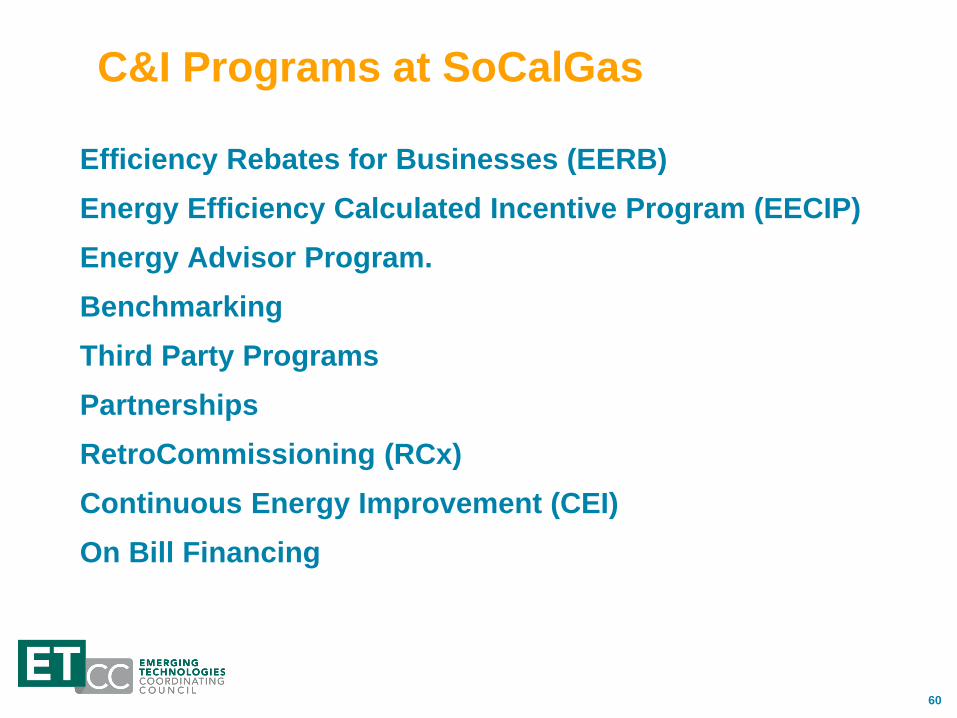
C&I Programs at SoCalGas
Efficiency Rebates for Businesses (EERB) Energy Efficiency Calculated Incentive Program (EECIP) Energy Advisor Program. Benchmarking Third Party Programs Partnerships RetroCommissioning (RCx) Continuous Energy Improvement (CEI) On Bill Financing
61
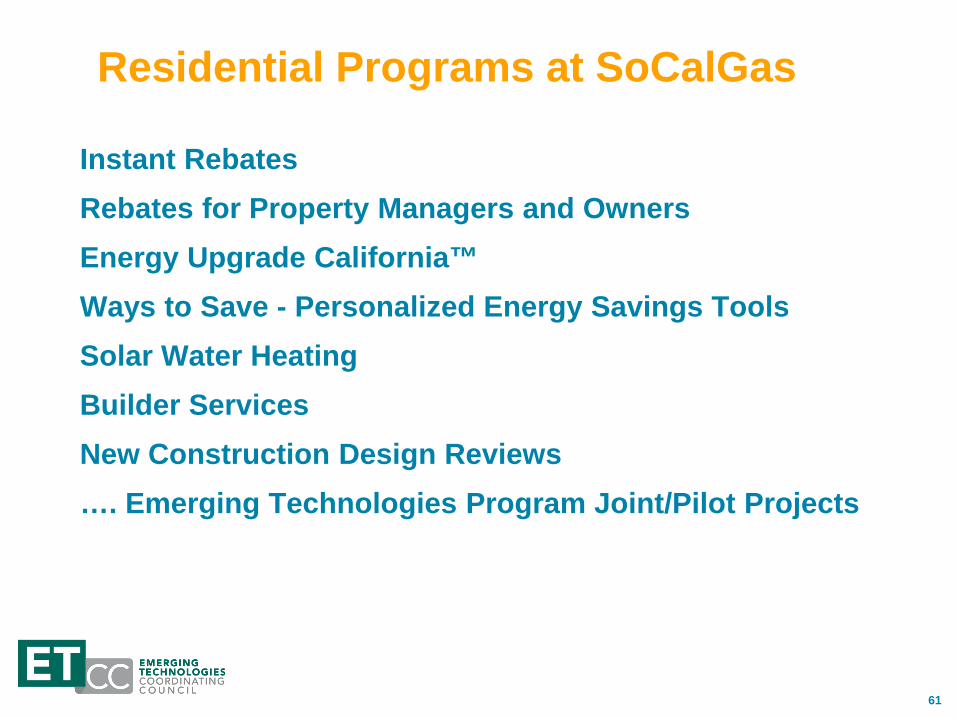
Residential Programs at SoCalGas
Instant Rebates Rebates for Property Managers and Owners Energy Upgrade California™ Ways to Save - Personalized Energy Savings Tools Solar Water Heating Builder Services New Construction Design Reviews …. Emerging Technologies Program Joint/Pilot Projects
62
Energy Management Landscape Emerging Technologies Program Perspective
63
Energy Management via ET Programs
• Demand Response Opportunities • Energy Efficiency and Optimization Opportunities • Policy Considerations • Emerging Technology Program Projects and Initiatives
64
Demand Response and ET
Completing Field Assessments and Demonstrations • Perform M&V to understand the potential demand
reduction for strategies and technologies • Assessing the customer impact of various strategies • Determining ability of technology to respond to DR signals
as well as communicate statuses in accordance with protocols (OpenADR, etc.)
Presenter
Presentation Notes
DR Et function, what looking to test with EMS
65
EE and Optimization Opportunities
ET’s Role for New and underutilized Strategies • Field Assessment at a customer site for new • Demonstration/Showcases for underutilized
EEBI • Deploy proven strategies through existing custom incentive
programs. • Incentives are paid based on annual, time dependent
(demand reduction), kWh savings and vary depending on technology from $.01-.14/kWh
66
Policy and Implementation Consideration
• Behavioral “Gray Area” • Consistency and “Modelabilty”/Predictability
• Options to standardize M&V and shorten test periods
• Persistence • Retro-commissioning availability. Potential ~10% Incentive
Kicker for New Construction Projects.
• IDSM • EE vs. DR • Shift from DR to EE (DR events could “pilot” facility comfort
level for permanent modification for certain measures)

67
Current ETP Projects and Initiatives
Project Utility
HVAC Optimization BMS Overlay (EE/DR) SDG&E
Integrated BMS for Lighting, HVAC, EV, Storage, Renewables (EE/DR/Ancillary Services)
SDG&E
Business Energy Reports PG&E
EMIS Baseline Performance Criteria & Testing Protocols PG&E
Small Commercial EMS PG&E
Sunverge & Energate Smart Community Demonstration SMUD
3rd Party Programmable Controllable Thermostats SCE
68
ETP Projects and Initiatives (cont’d)
Advanced Lighting Controls Systems • Statewide Initiative to Co-develop Best Practices for M&V • Goal of Standardizing findings and rigor of methodology • Hope to inform a future model for these installations
• Simplify EEBI > Move to EEBR
69
Contact Information PG&E Energy Management Program / Product Managers
Mananya Chansanchai, PG&E • [email protected]
Rachel Radell, SMUD • [email protected]
Edwin Hornquist, SCE • [email protected]
Nate Taylor, SDG&E • [email protected]
Abdullah Ahmed • [email protected]

70
Q&A and Panel Discussion

71
Networking Break
72
Energy Efficiency and Behavior Management Technology
Moderator: Daniel Ohlendorf: Expert Product Manager, Information Products | PG&E Panelists: Derek Okada: Senior Project Manager, DSM Strategy Planning | PG&E Leo Carrillo: Principal Product Manager, Information Products | PG&E Ray Manion: Homeowner
73
TRIO Roundtable – 8/19/13
Energy Efficiency and Behavior Management Technology
Technology Resource Innovation Outreach (TRIO) Roundtable
August 19, 2013
Derek M. Okada Senior Project Manager, DSM Strategic Planning
Southern California Edison
74 74 TRIO Roundtable – 8/19/13
Discussion
• Evolving Utility Customer Strategies
• Behavioral Frameworks
• Overview of Energy Advisor Programs
• Program and Services Offerings
• Behavioral Program Considerations
75
TRIO Roundtable – 8/19/13
Adopting customer’s preferred way of communication and frame of reference is essential to changing behavior towards
energy usage and increasing participation in behavior programs
76 76 TRIO Roundtable – 8/19/13
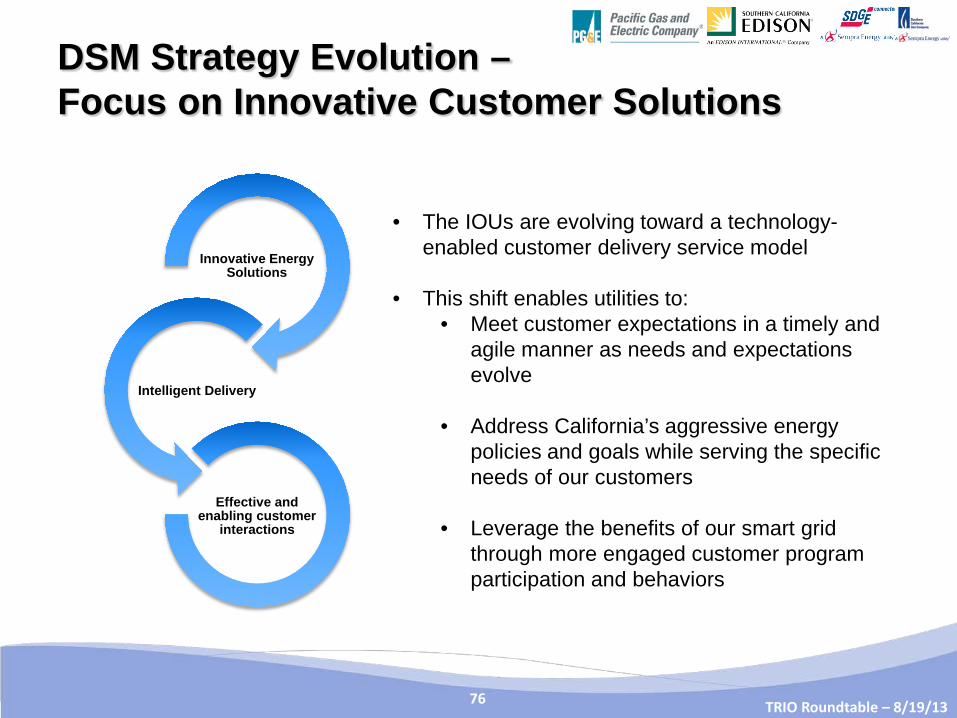
DSM Strategy Evolution – Focus on Innovative Customer Solutions
Innovative Energy Solutions
Intelligent Delivery
Effective and enabling customer
interactions
• The IOUs are evolving toward a technology-enabled customer delivery service model
• This shift enables utilities to: • Meet customer expectations in a timely and
agile manner as needs and expectations evolve
• Address California’s aggressive energy policies and goals while serving the specific needs of our customers
• Leverage the benefits of our smart grid through more engaged customer program participation and behaviors

77 77 TRIO Roundtable – 8/19/13
Organizational Evolution – Develop Customer Centric Offerings
Policies Products Programs Promotion
• EE, DR, DG, Low Income, Renewables
• CLTEESP • Zero Net
Energy • Water-Energy
Nexus
• IDSM offerings • Emerging
products • PCTs, IHDs, • HANs, HEMs
• Pilots and solution development
• EE, DR, DG, ESA, PEV programs
• Behavior programs • Market
transformation programs
• Offer Management • Lifestyle Plans
• Rate Choices • TOU Rates & Dynamic
Pricing • Load Management
Incentives & Rebates (SDP)
• Self-Service Offerings
78 78 TRIO Roundtable – 8/19/13
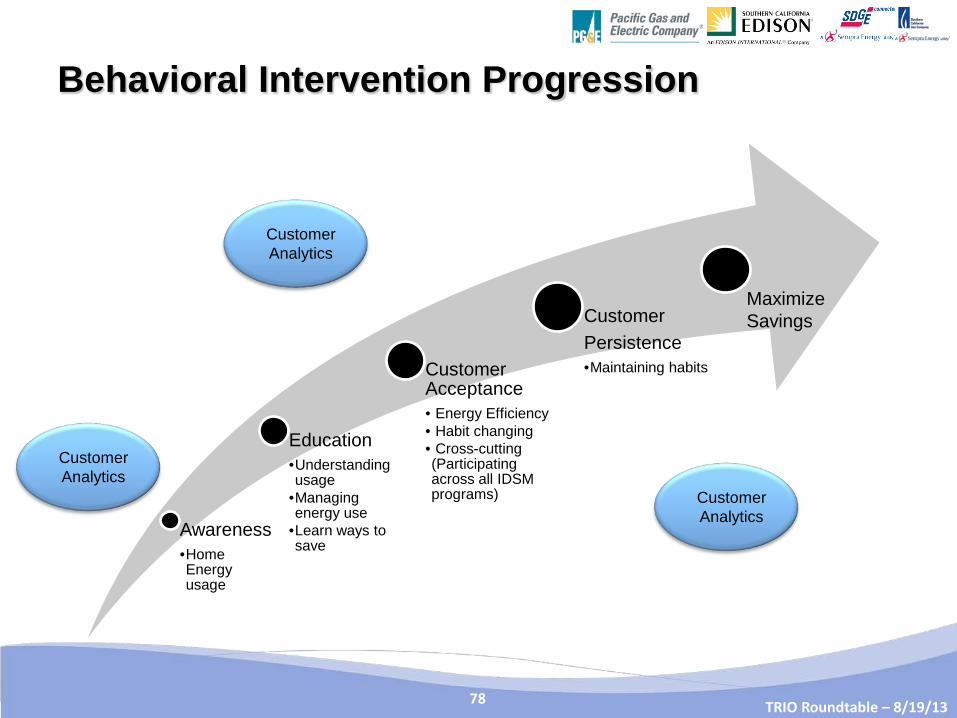
Behavioral Intervention Progression
Awareness •Home Energy usage
Education •Understanding usage
•Managing energy use
•Learn ways to save
Customer Acceptance • Energy Efficiency • Habit changing • Cross-cutting (Participating across all IDSM programs)
Customer Persistence •Maintaining habits
Customer Analytics
Customer Analytics
Customer Analytics
Maximize Savings
79 79 TRIO Roundtable – 8/19/13
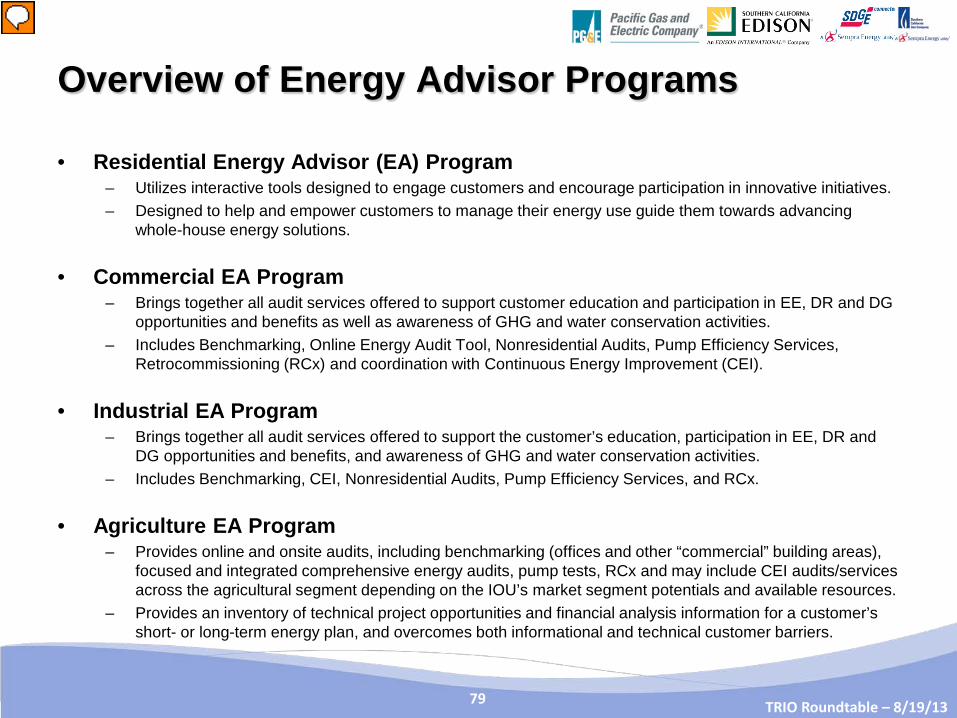
• Residential Energy Advisor (EA) Program – Utilizes interactive tools designed to engage customers and encourage participation in innovative initiatives. – Designed to help and empower customers to manage their energy use guide them towards advancing
whole-house energy solutions.
• Commercial EA Program – Brings together all audit services offered to support customer education and participation in EE, DR and DG
opportunities and benefits as well as awareness of GHG and water conservation activities. – Includes Benchmarking, Online Energy Audit Tool, Nonresidential Audits, Pump Efficiency Services,
Retrocommissioning (RCx) and coordination with Continuous Energy Improvement (CEI).
• Industrial EA Program – Brings together all audit services offered to support the customer’s education, participation in EE, DR and
DG opportunities and benefits, and awareness of GHG and water conservation activities. – Includes Benchmarking, CEI, Nonresidential Audits, Pump Efficiency Services, and RCx.
• Agriculture EA Program – Provides online and onsite audits, including benchmarking (offices and other “commercial” building areas),
focused and integrated comprehensive energy audits, pump tests, RCx and may include CEI audits/services across the agricultural segment depending on the IOU’s market segment potentials and available resources.
– Provides an inventory of technical project opportunities and financial analysis information for a customer’s short- or long-term energy plan, and overcomes both informational and technical customer barriers.
Overview of Energy Advisor Programs
Presenter
Presentation Notes
Energy Advisor Program (EA). The Energy Advisor subprogram will utilize interactive tools designed to engage customers and encourage participation in innovative initiatives. These initiatives are designed to help customers understand and empower them to manage their energy use, and will guide them, where appropriate, towards advancing whole-house energy solutions. Although the IOUs share similar Energy Advisor subprogram theory, design, and goals, they may implement subprogram logistics differently because of their different service territories. The Commercial Energy Advisor Program (EA) brings together under one program all audit services offered to support customer education and participation in energy efficiency, demand response and self-generation energy reducing opportunities and benefits, along with awareness of greenhouse gas and water conservation activities. These services include Benchmarking, Online Energy Audit Tool, Nonresidential Audits, Pump Efficiency Services, Retrocommissioning (RCx) and coordination with CEI as described below. Industrial Energy Advisor Program brings together under one program all audit services offered to support the customer’s (1) education; (2) participation in energy efficiency, demand response and self-generation energy reducing opportunities and benefits; and (3) awareness of greenhouse gas and water conservation activities. These services include Benchmarking, Continuous Energy Improvement (CEI) (see CEI sub-program PIP), Nonresidential Audits, Pump Efficiency Services, and retrocommissioning (RCx). Agriculture Energy Advisor Program provides online and onsite audits, including benchmarking (offices and other “commercial” building areas), focused and integrated comprehensive energy audits, pump tests, retrocommissioning (RCx) and may include Continuous Energy Improvement (CEI) audits/services across the agricultural segment depending on the IOU’s market segment potentials and available resources. The Program provides an inventory of technical project opportunities and financial analysis information for a customer’s short- or long-term energy plan, and overcomes both informational and technical customer barriers
80 80 TRIO Roundtable – 8/19/13
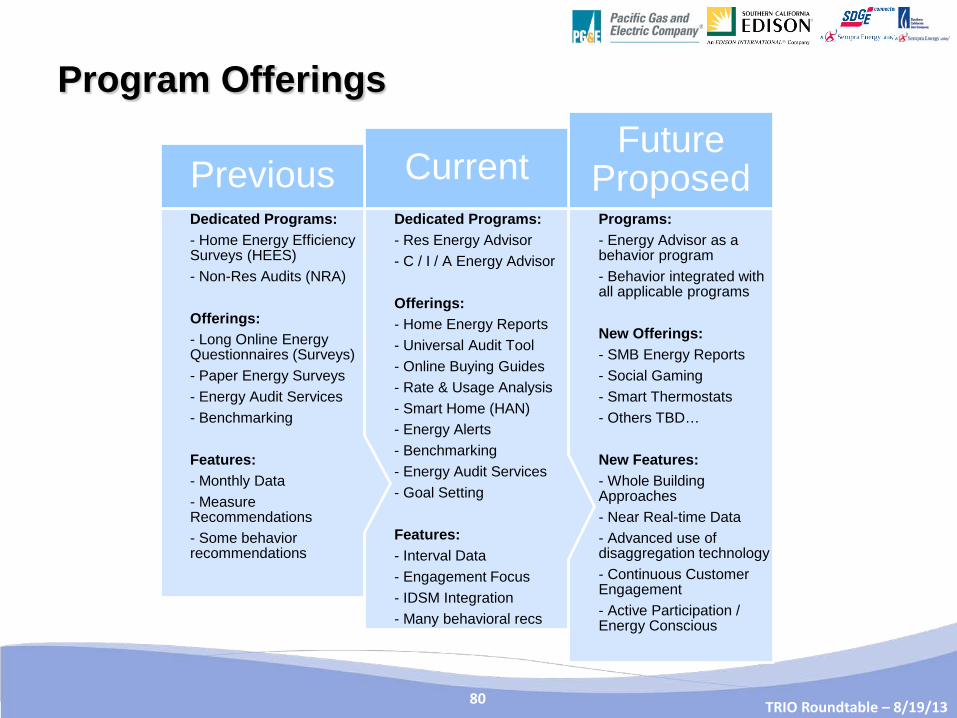
Program Offerings
Programs: - Energy Advisor as a behavior program - Behavior integrated with all applicable programs New Offerings: - SMB Energy Reports - Social Gaming - Smart Thermostats - Others TBD… New Features: - Whole Building Approaches - Near Real-time Data - Advanced use of disaggregation technology - Continuous Customer Engagement - Active Participation / Energy Conscious
Future Proposed
Dedicated Programs: - Res Energy Advisor - C / I / A Energy Advisor Offerings: - Home Energy Reports - Universal Audit Tool - Online Buying Guides - Rate & Usage Analysis - Smart Home (HAN) - Energy Alerts - Benchmarking - Energy Audit Services - Goal Setting Features: - Interval Data - Engagement Focus - IDSM Integration - Many behavioral recs
Current Dedicated Programs: - Home Energy Efficiency Surveys (HEES) - Non-Res Audits (NRA) Offerings: - Long Online Energy Questionnaires (Surveys) - Paper Energy Surveys - Energy Audit Services - Benchmarking Features: - Monthly Data - Measure Recommendations - Some behavior recommendations
Previous
81 81 TRIO Roundtable – 8/19/13
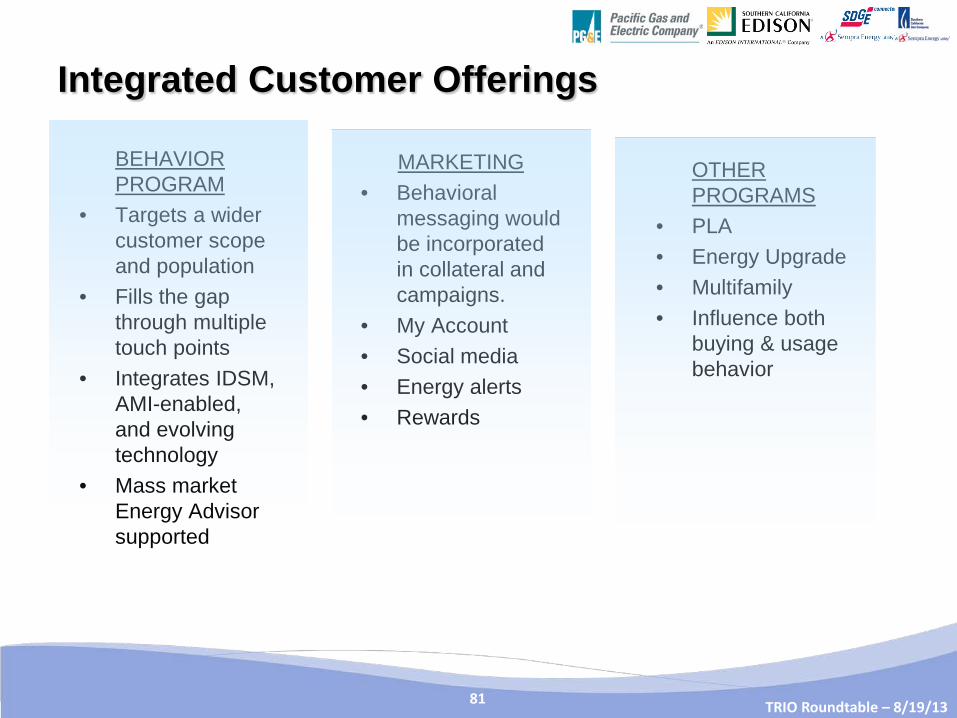
Integrated Customer Offerings
MARKETING • Behavioral
messaging would be incorporated in collateral and campaigns.
• My Account • Social media • Energy alerts • Rewards
OTHER PROGRAMS
• PLA • Energy Upgrade • Multifamily • Influence both
buying & usage behavior
BEHAVIOR PROGRAM
• Targets a wider customer scope and population
• Fills the gap through multiple touch points
• Integrates IDSM, AMI-enabled, and evolving technology
• Mass market Energy Advisor supported
82 82 TRIO Roundtable – 8/19/13
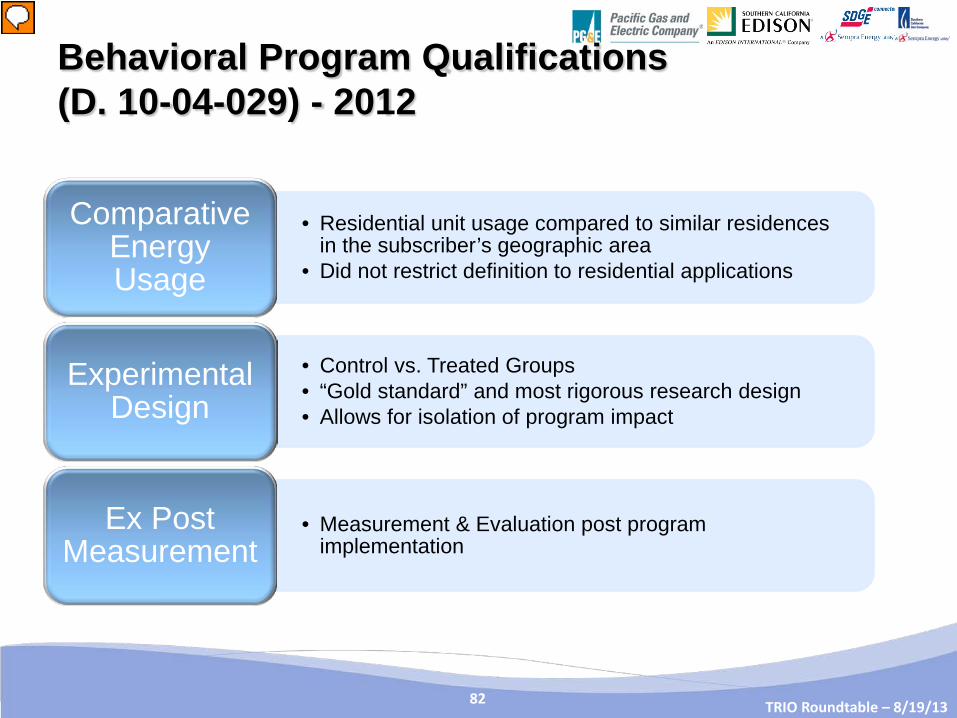
Behavioral Program Qualifications (D. 10-04-029) - 2012
• Residential unit usage compared to similar residences in the subscriber’s geographic area
• Did not restrict definition to residential applications
Comparative Energy Usage
• Control vs. Treated Groups • “Gold standard” and most rigorous research design • Allows for isolation of program impact
Experimental Design
• Measurement & Evaluation post program implementation
Ex Post Measurement
Presenter
Presentation Notes
As outlined in D10-04-029 and D12-11-015 for 2013-2014, IOU-administered behavior programs must meet three minimum criteria: (1) comparative energy usage and disclosure, (2) experimental design, and (3) ex-post evaluation for reporting. Furthermore, each of the IOUs was directed to reach 5% of its residential population by 2014 using behavior program as defined above. D12-11-015 also encouraged the utilities to initiate a workshop to work with stakeholders to initiate a process to expand the behavior program definition and to initiate additional behavior program activities
83 83 TRIO Roundtable – 8/19/13
• For interventions with claimable energy savings, IOUs are likely to be asked to do the following: – Link proposed intervention strategy to acceptable social science
theories, – Support “under-utilized” intervention behavior strategies as defined by
the behavior whitepaper, – Ensure that the intervention strategy is verifiable, evaluable and
measurable (e.g., Randomized Control Trial, Quasi-Experimental Design and other accepted M&E protocols),
– Utilize ex-post and ex-ante energy savings reporting/
Anticipated Evaluation Approach for 2015 & Beyond
84 84 TRIO Roundtable – 8/19/13
Q&A
Derek Okada Southern California Edison (626) 302-0790 [email protected]
85
TRIO Roundtable – 8/19/13
Energy Management Technology & Products
Technology Resource Innovation Outreach (TRIO) Roundtable August 19, 2013
Leo Carrillo
Principal Product Manager, Energy Management Systems and Information Products Pacific Gas & Electric Co.
86
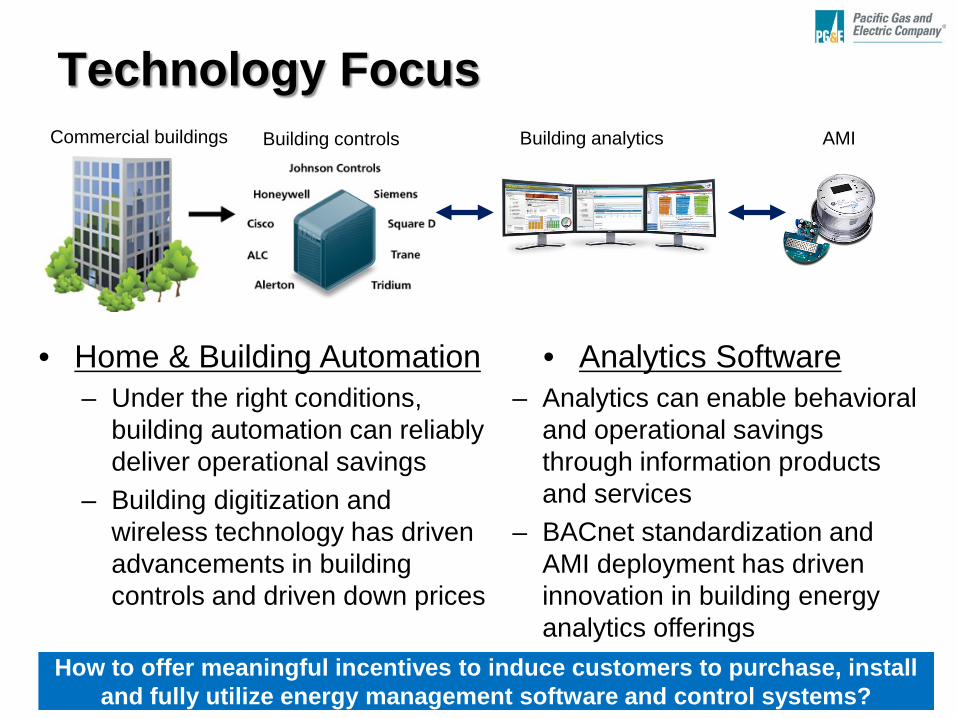
Technology Focus
• Home & Building Automation – Under the right conditions,
building automation can reliably deliver operational savings
– Building digitization and wireless technology has driven advancements in building controls and driven down prices
• Analytics Software – Analytics can enable behavioral
and operational savings through information products and services
– BACnet standardization and AMI deployment has driven innovation in building energy analytics offerings
Building controls Building analytics AMI Commercial buildings
How to offer meaningful incentives to induce customers to purchase, install and fully utilize energy management software and control systems?
87
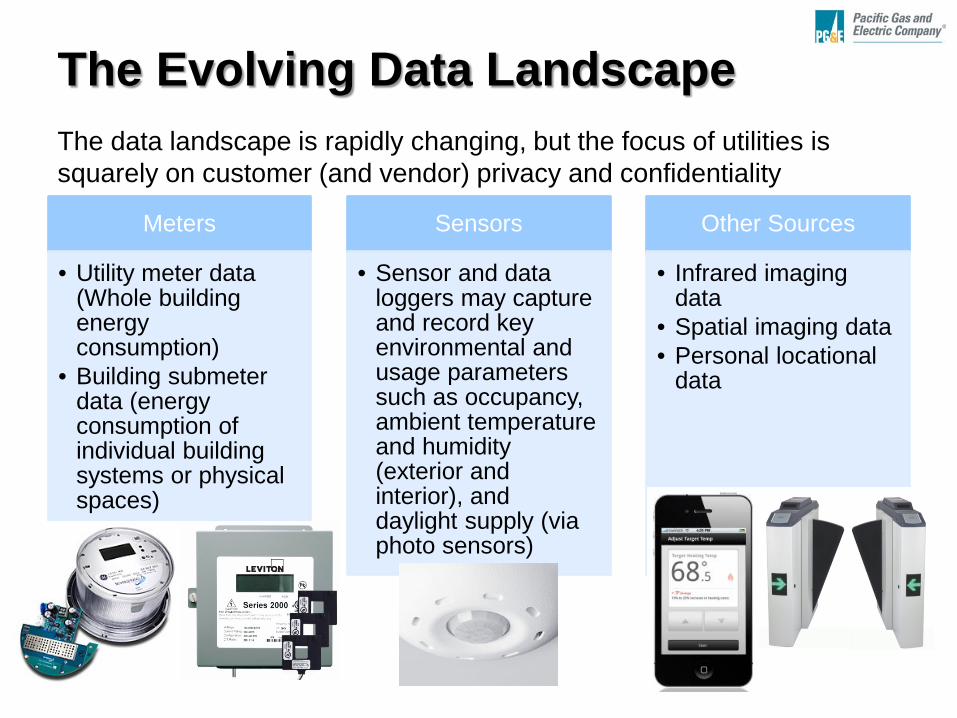
The Evolving Data Landscape
Meters
• Utility meter data (Whole building energy consumption)
• Building submeter data (energy consumption of individual building systems or physical spaces)
Sensors
• Sensor and data loggers may capture and record key environmental and usage parameters such as occupancy, ambient temperature and humidity (exterior and interior), and daylight supply (via photo sensors)
Other Sources
• Infrared imaging data
• Spatial imaging data • Personal locational
data
The data landscape is rapidly changing, but the focus of utilities is squarely on customer (and vendor) privacy and confidentiality
88
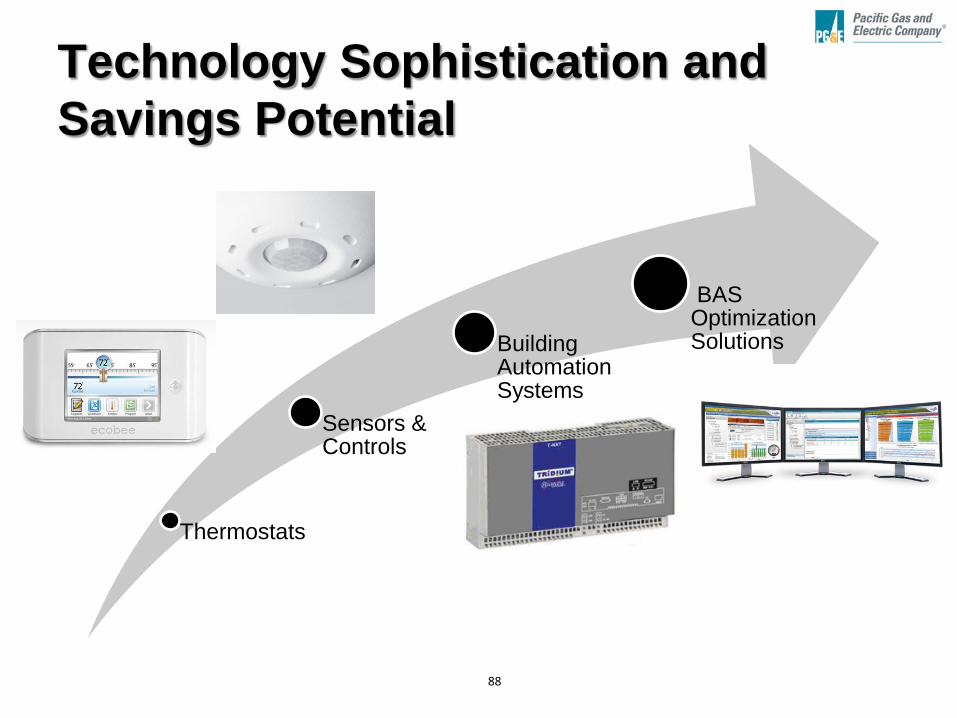
Technology Sophistication and Savings Potential
Thermostats
Sensors & Controls
Building Automation Systems
BAS Optimization Solutions
89
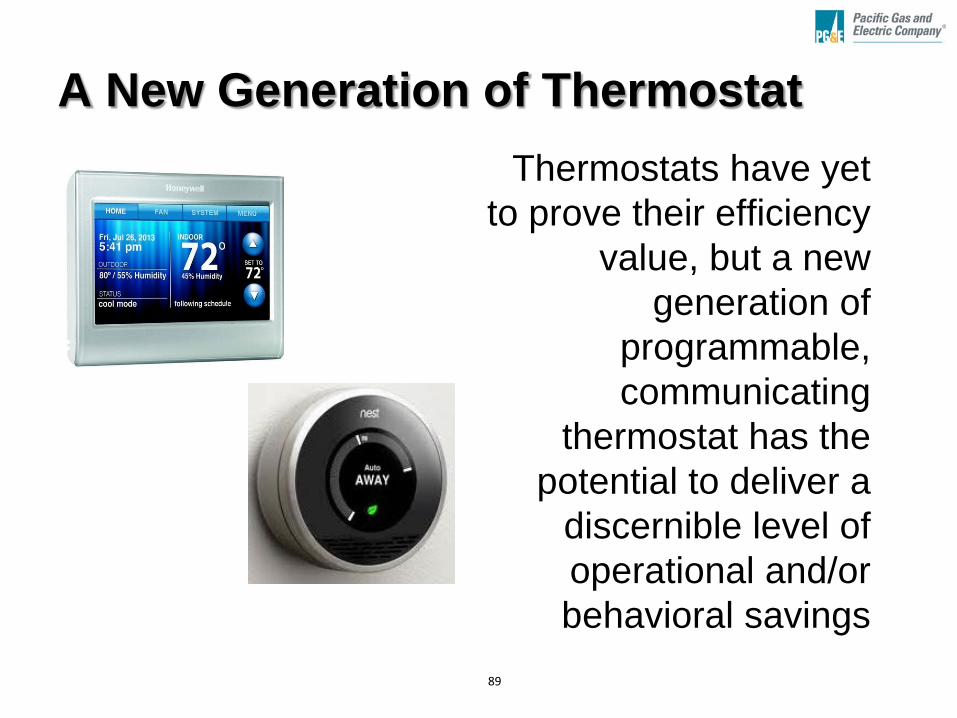
A New Generation of Thermostat Thermostats have yet
to prove their efficiency value, but a new
generation of programmable, communicating
thermostat has the potential to deliver a
discernible level of operational and/or behavioral savings
90
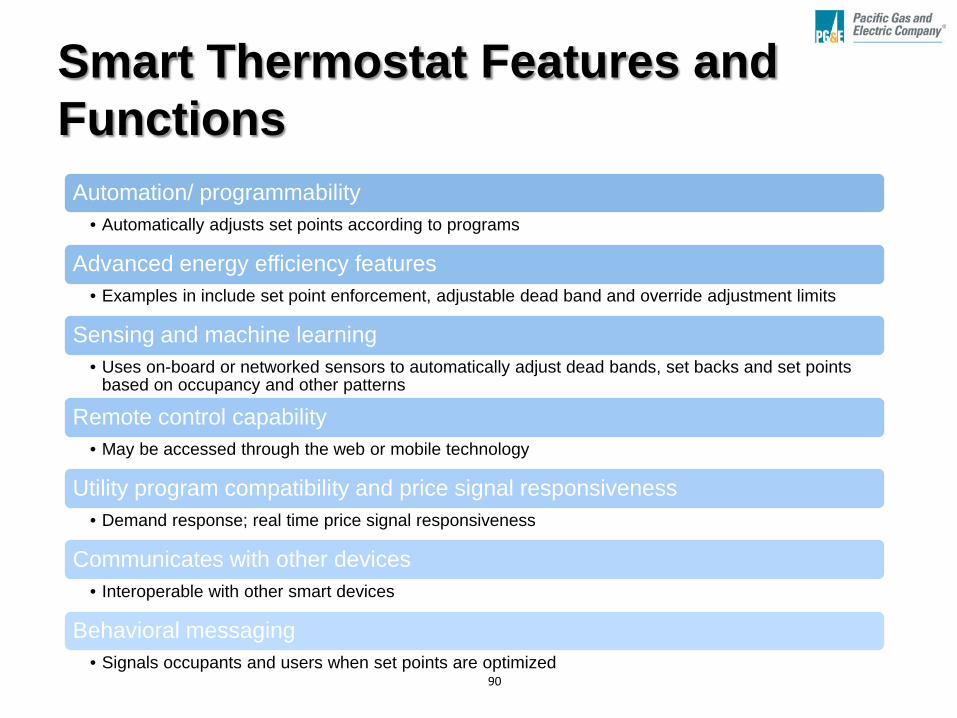
Smart Thermostat Features and Functions
Automation/ programmability • Automatically adjusts set points according to programs
Advanced energy efficiency features • Examples in include set point enforcement, adjustable dead band and override adjustment limits
Sensing and machine learning • Uses on-board or networked sensors to automatically adjust dead bands, set backs and set points
based on occupancy and other patterns
Remote control capability • May be accessed through the web or mobile technology
Utility program compatibility and price signal responsiveness • Demand response; real time price signal responsiveness
Communicates with other devices • Interoperable with other smart devices
Behavioral messaging • Signals occupants and users when set points are optimized
91
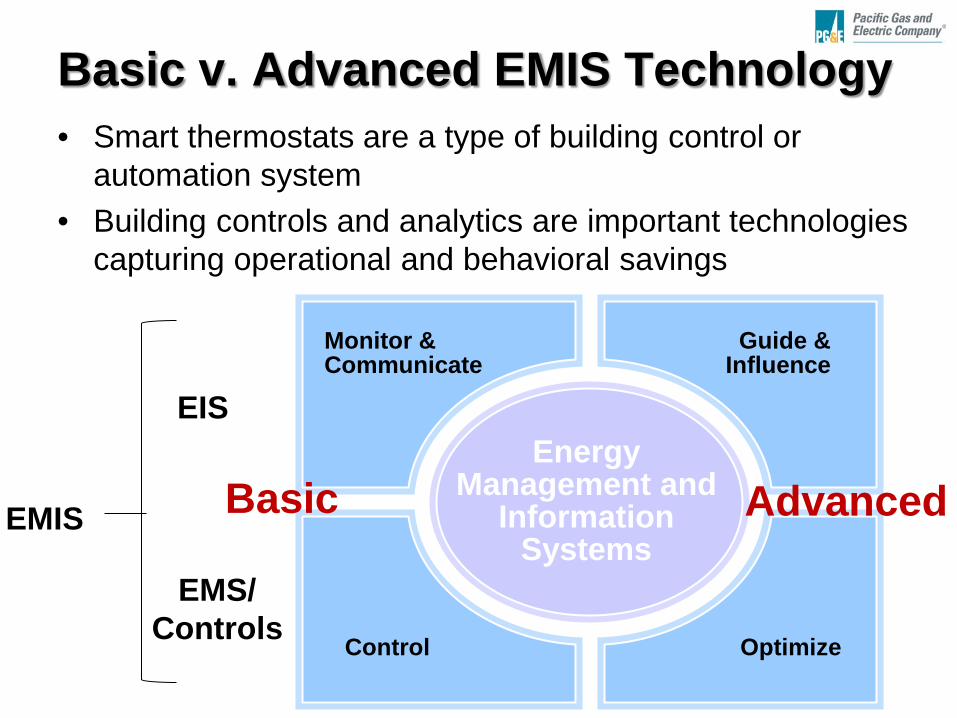
Basic v. Advanced EMIS Technology
Energy Management and
Information Systems
Monitor & Communicate
Guide & Influence
Control Optimize
EIS
EMS/ Controls
EMIS Basic Advanced
• Smart thermostats are a type of building control or automation system
• Building controls and analytics are important technologies capturing operational and behavioral savings
92
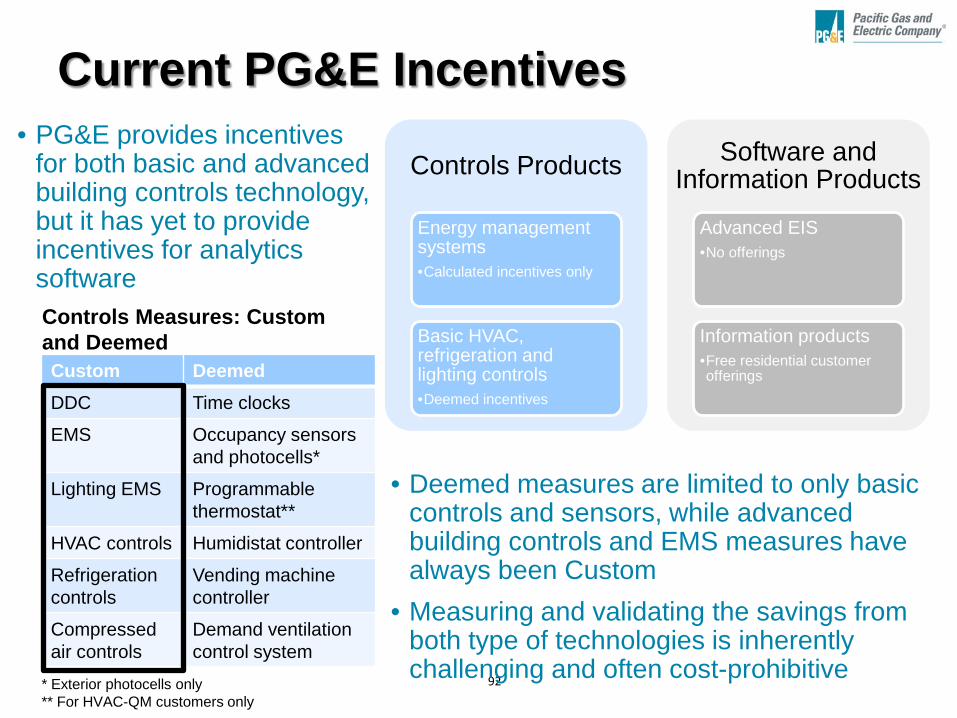
Current PG&E Incentives
Controls Products
Energy management systems •Calculated incentives only
Basic HVAC, refrigeration and lighting controls •Deemed incentives
Software and Information Products
Advanced EIS •No offerings
Information products •Free residential customer offerings
• Deemed measures are limited to only basic controls and sensors, while advanced building controls and EMS measures have always been Custom
• Measuring and validating the savings from both type of technologies is inherently challenging and often cost-prohibitive
Custom Deemed DDC Time clocks
EMS Occupancy sensors and photocells*
Lighting EMS Programmable thermostat**
HVAC controls Humidistat controller
Refrigeration controls
Vending machine controller
Compressed air controls
Demand ventilation control system
Controls Measures: Custom and Deemed
• PG&E provides incentives for both basic and advanced building controls technology, but it has yet to provide incentives for analytics software
* Exterior photocells only ** For HVAC-QM customers only
93
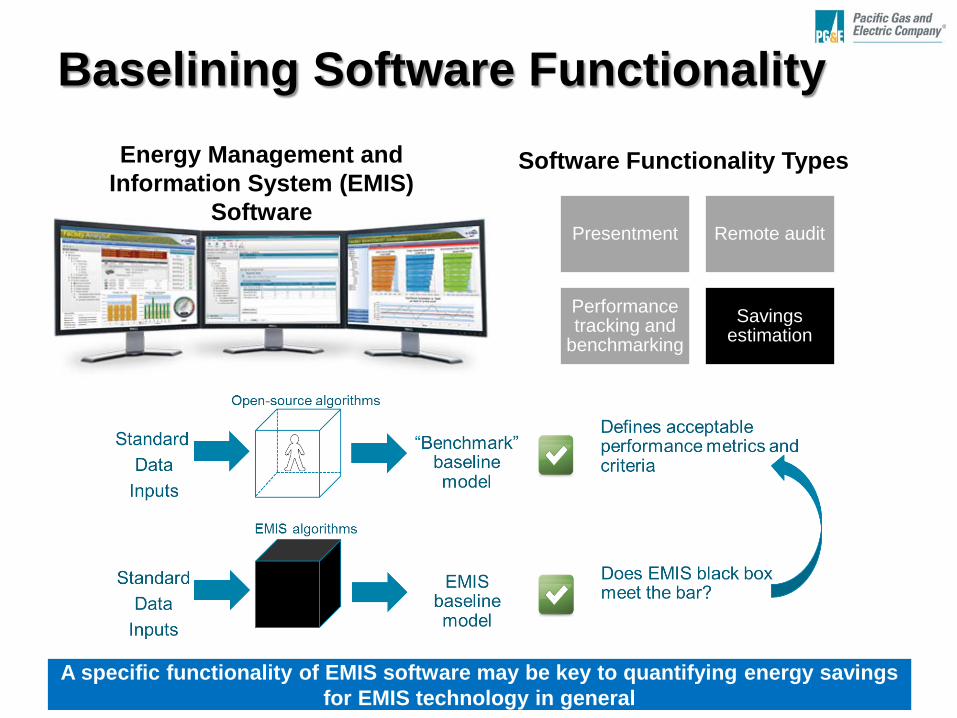
Baselining Software Functionality
A specific functionality of EMIS software may be key to quantifying energy savings for EMIS technology in general
Presentment Remote audit
Performance tracking and
benchmarking Savings
estimation
Energy Management and Information System (EMIS)
Software
Software Functionality Types
94
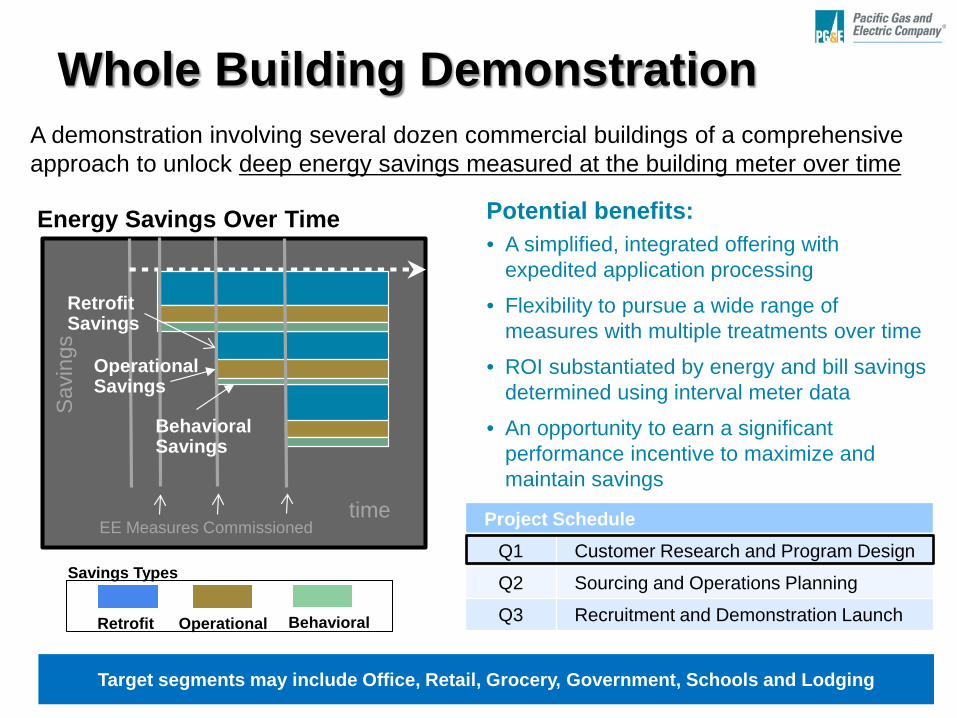
Whole Building Demonstration A demonstration involving several dozen commercial buildings of a comprehensive approach to unlock deep energy savings measured at the building meter over time
Project Schedule Q1 Customer Research and Program Design
Q2 Sourcing and Operations Planning
Q3 Recruitment and Demonstration Launch
Energy Savings Over Time
Sav
ings
EE Measures Commissionedtime
Retrofit Savings
Operational Savings
BehavioralSavings
Retrofit Operational Behavioral
Savings Types
Potential benefits: • A simplified, integrated offering with
expedited application processing
• Flexibility to pursue a wide range of measures with multiple treatments over time
• ROI substantiated by energy and bill savings determined using interval meter data
• An opportunity to earn a significant performance incentive to maximize and maintain savings
Target segments may include Office, Retail, Grocery, Government, Schools and Lodging
95 95 TRIO Roundtable – 8/19/13
Questions?
Leo Carrillo Principal Product Manager
Energy Management Systems and Information Products
Pacific Gas & Electric Co. [email protected]
96
Networking Lunch
97
Demand Response, Home Area Networks and Data Management Moderator: Jonathan Burrows: Senior Product Manager, DR Emerging Technologies | PG&E Panelists: Amy Kight Costadone: Principal Product Manager, Demand Response – 3rd Party Data Platforms | PG&E Mark Martinez: Senior Manager, DSM Strategy and Policy | SCE Prateek Chakravarty: VP, Business Development and Marketing | Bidgely Albert Chiu: Expert Product Manager, Customer Energy Solutions | PG&E
98
Pacific Gas & Electric Amy Kight Costadone: Principal Product Manager, Demand Response – 3rd Party Data Platforms
99
Agenda
1) Framework
2) What are the platforms?
3) What are the benefits?
4) How can vendors get involved?
100
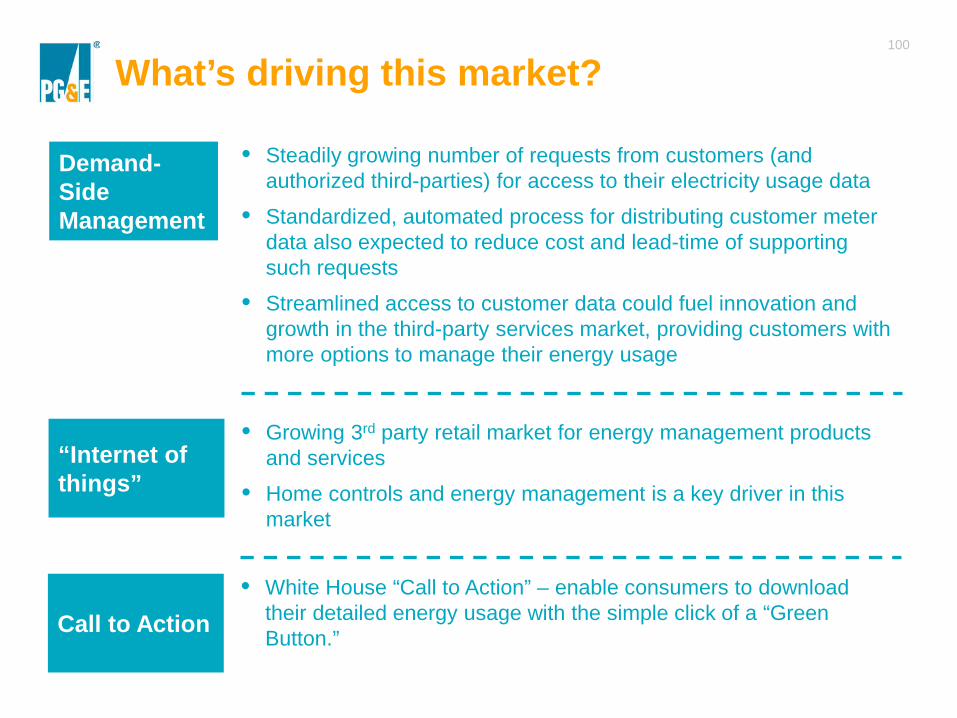
What’s driving this market?
• Steadily growing number of requests from customers (and authorized third-parties) for access to their electricity usage data
• Standardized, automated process for distributing customer meter data also expected to reduce cost and lead-time of supporting such requests
• Streamlined access to customer data could fuel innovation and growth in the third-party services market, providing customers with more options to manage their energy usage
Demand-Side Management
“Internet of things”
• Growing 3rd party retail market for energy management products and services
• Home controls and energy management is a key driver in this market
Call to Action • White House “Call to Action” – enable consumers to download
their detailed energy usage with the simple click of a “Green Button.”
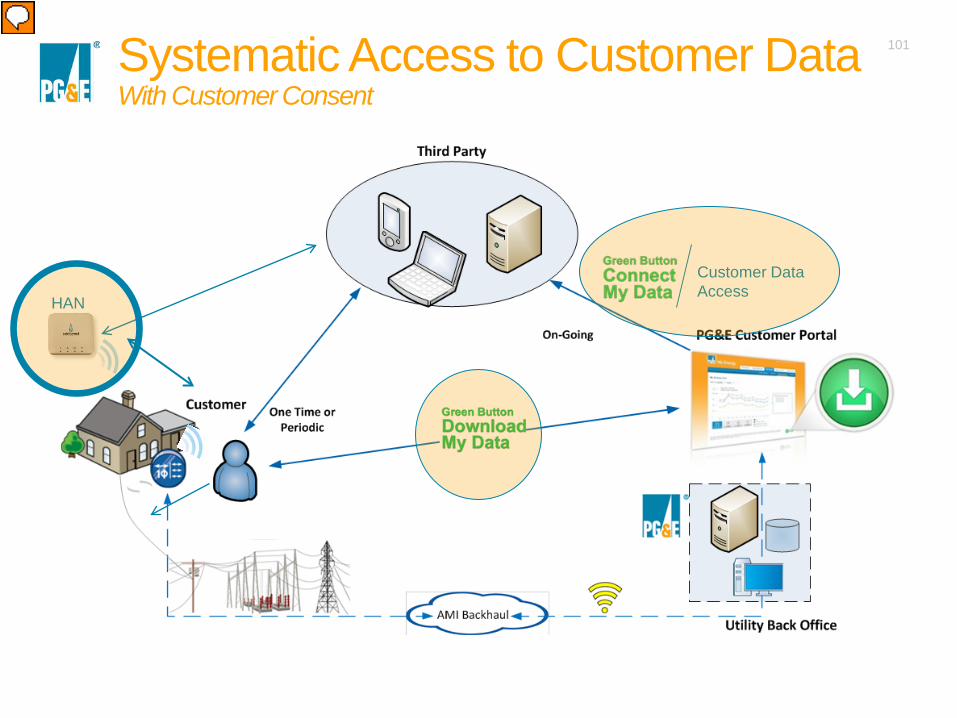
101 Systematic Access to Customer Data With Customer Consent
Customer Data Access
HAN
Presenter
Presentation Notes
With the installation of SmartMeter technology, energy consumption data is readily available and at a much more granular level PG&E’s goal is to provide energy usage data to consumers to empower them to consider how their daily consumption affects their bill and the environment Real Time: Home and Business Area Network AMI Interval Data:Green Button -> Customer Data Access (CDA)

102
WHAT ARE THESE PLATFORMS?
103
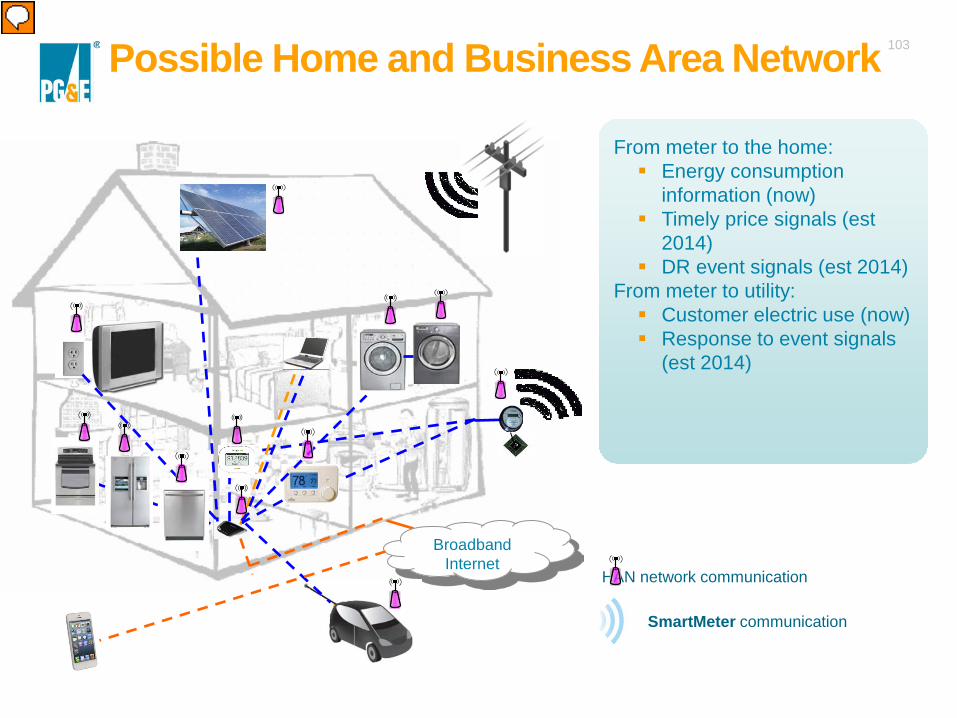
Broadband Internet
Possible Home and Business Area Network
HAN network communication
SmartMeter communication
From meter to the home: Energy consumption
information (now) Timely price signals (est
2014) DR event signals (est 2014)
From meter to utility: Customer electric use (now) Response to event signals
(est 2014)
Presenter
Presentation Notes
HAN: Is a network contained within a customer's premise that connects smart devices and appliances and enables control, communication and sensing between the devices and appliances enables customers to derive economic benefits and generate environmental benefits by deploying smart appliances and in-home energy displays to monitor and control their energy use SmartMeter communication technology will enable customers to build their own Home Area Network (HAN) Utility to Consumer communication: Near-real time energy usage information Pricing information DR event signals Consumer to Utility communication: Actual energy usage information Response to signals Some of this information can also be transmitted via the internet to connected devices. Some dates are estimated based on pending filings
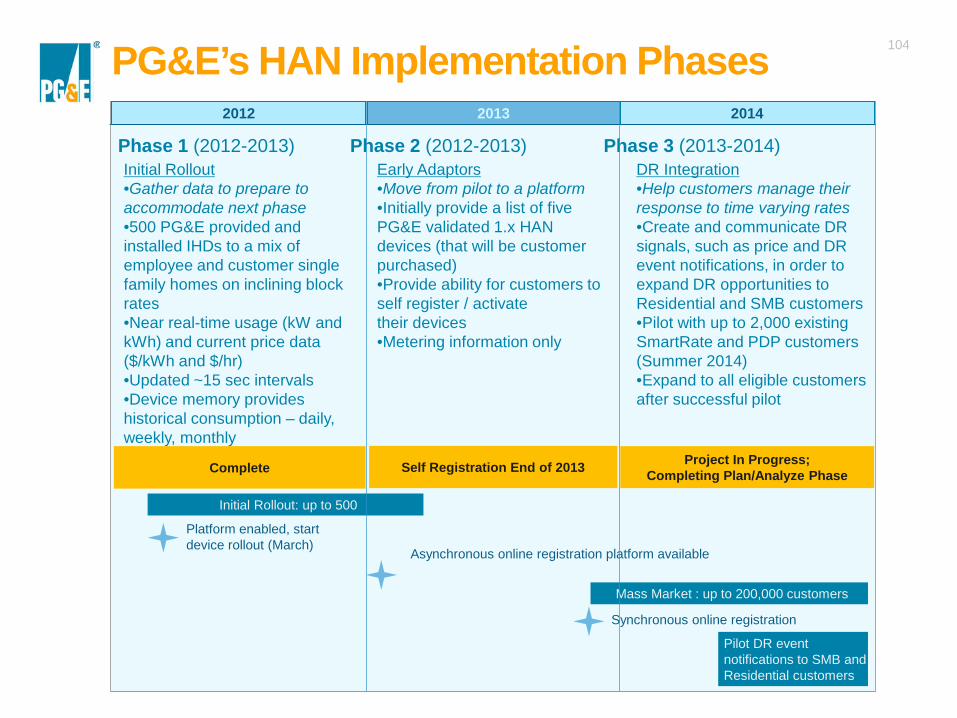
104 PG&E’s HAN Implementation Phases
Initial Rollout: up to 500
Early Adaptors •Move from pilot to a platform •Initially provide a list of five PG&E validated 1.x HAN devices (that will be customer purchased) •Provide ability for customers to self register / activate their devices •Metering information only
Initial Rollout •Gather data to prepare to accommodate next phase •500 PG&E provided and installed IHDs to a mix of employee and customer single family homes on inclining block rates •Near real-time usage (kW and kWh) and current price data ($/kWh and $/hr) •Updated ~15 sec intervals •Device memory provides historical consumption – daily, weekly, monthly
DR Integration •Help customers manage their response to time varying rates •Create and communicate DR signals, such as price and DR event notifications, in order to expand DR opportunities to Residential and SMB customers •Pilot with up to 2,000 existing SmartRate and PDP customers (Summer 2014) •Expand to all eligible customers after successful pilot
2012 2013 2014
Platform enabled, start device rollout (March)
Asynchronous online registration platform available
Early Adoption: up to 25,000
Mass Market : up to 200,000 customers
Phase 1 (2012-2013) Phase 2 (2012-2013) Phase 3 (2013-2014)
Synchronous online registration
Pilot DR event notifications to SMB and Residential customers
Project In Progress; Completing Plan/Analyze Phase Complete Self Registration End of 2013
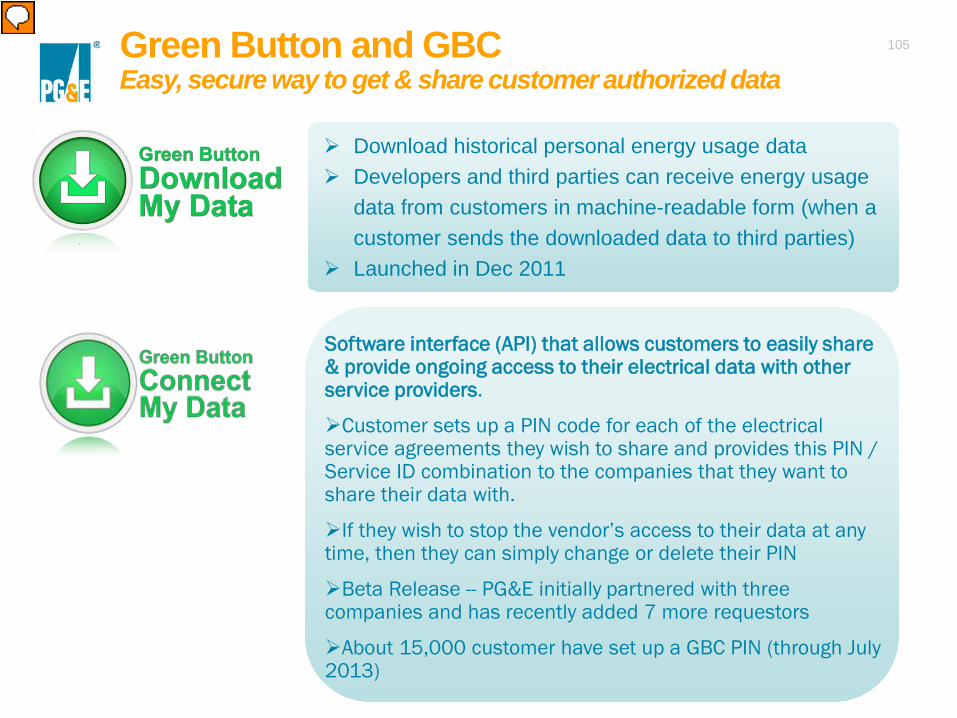
105 Green Button and GBC Easy, secure way to get & share customer authorized data Download historical personal energy usage data
Developers and third parties can receive energy usage data from customers in machine-readable form (when a customer sends the downloaded data to third parties)
Launched in Dec 2011 Software interface (API) that allows customers to easily share
& provide ongoing access to their electrical data with other service providers.
Customer sets up a PIN code for each of the electrical service agreements they wish to share and provides this PIN / Service ID combination to the companies that they want to share their data with.
If they wish to stop the vendor’s access to their data at any time, then they can simply change or delete their PIN
Beta Release -- PG&E initially partnered with three companies and has recently added 7 more requestors
About 15,000 customer have set up a GBC PIN (through July 2013)
Presenter
Presentation Notes
Formats for current Green Button data are XML (Extensible Markup Language) and CSV (Comma Separated Values). Contains 13 months of Smart Meter Data As of June 30th 2012, 184,982 customers have downloaded their energy usage via Green Button Beta for GBC in underway, with 3 service participants (PEV4ME, Unplug Stuff, and Leafully)
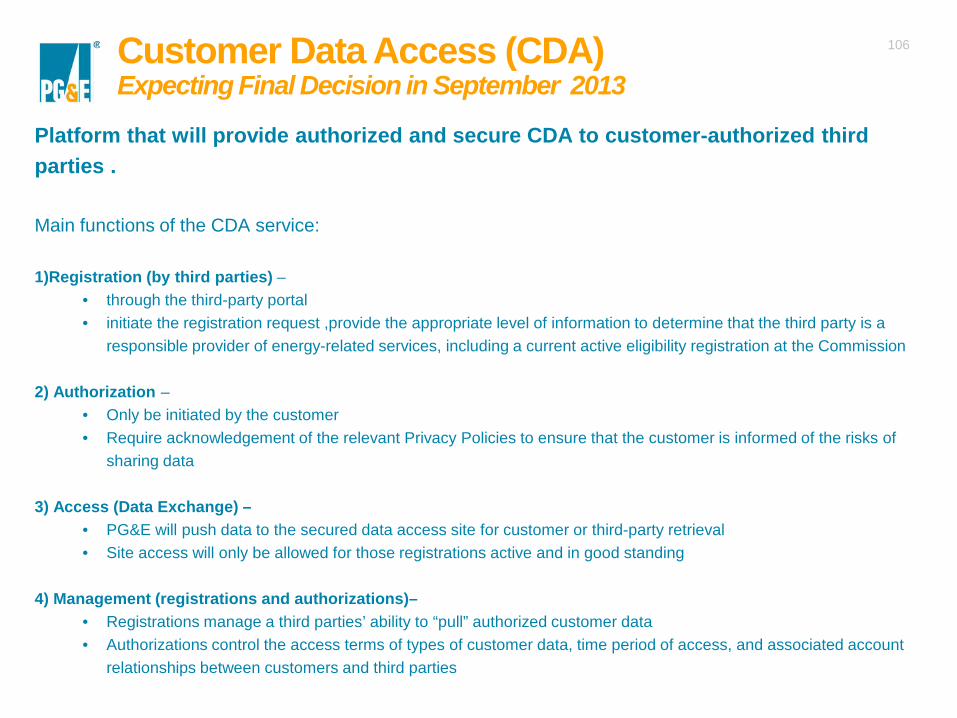
106 Customer Data Access (CDA) Expecting Final Decision in September 2013
Platform that will provide authorized and secure CDA to customer-authorized third parties . Main functions of the CDA service: 1)Registration (by third parties) –
• through the third-party portal • initiate the registration request ,provide the appropriate level of information to determine that the third party is a
responsible provider of energy-related services, including a current active eligibility registration at the Commission 2) Authorization –
• Only be initiated by the customer • Require acknowledgement of the relevant Privacy Policies to ensure that the customer is informed of the risks of
sharing data 3) Access (Data Exchange) –
• PG&E will push data to the secured data access site for customer or third-party retrieval • Site access will only be allowed for those registrations active and in good standing
4) Management (registrations and authorizations)– • Registrations manage a third parties’ ability to “pull” authorized customer data • Authorizations control the access terms of types of customer data, time period of access, and associated account
relationships between customers and third parties
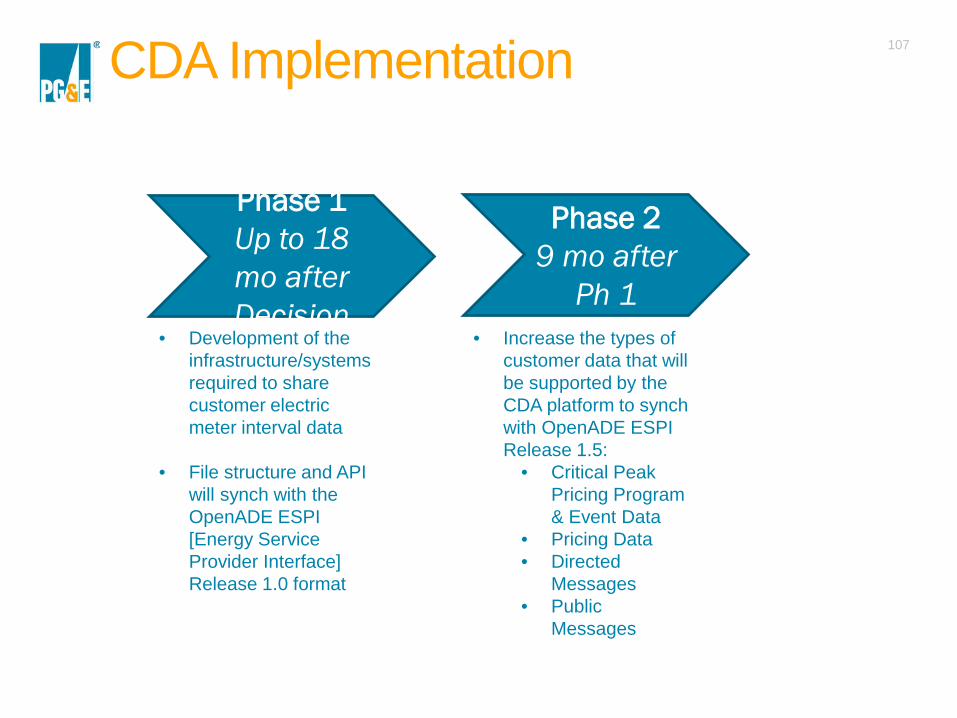
107 CDA Implementation
• Development of the infrastructure/systems required to share customer electric meter interval data
• File structure and API
will synch with the OpenADE ESPI [Energy Service Provider Interface] Release 1.0 format
• Increase the types of customer data that will be supported by the CDA platform to synch with OpenADE ESPI Release 1.5:
• Critical Peak Pricing Program & Event Data
• Pricing Data • Directed
Messages • Public
Messages
Phase 1 Up to 18 mo after Decision
Phase 2 9 mo after
Ph 1

108
WHY ARE THEY IMPORTANT?
109
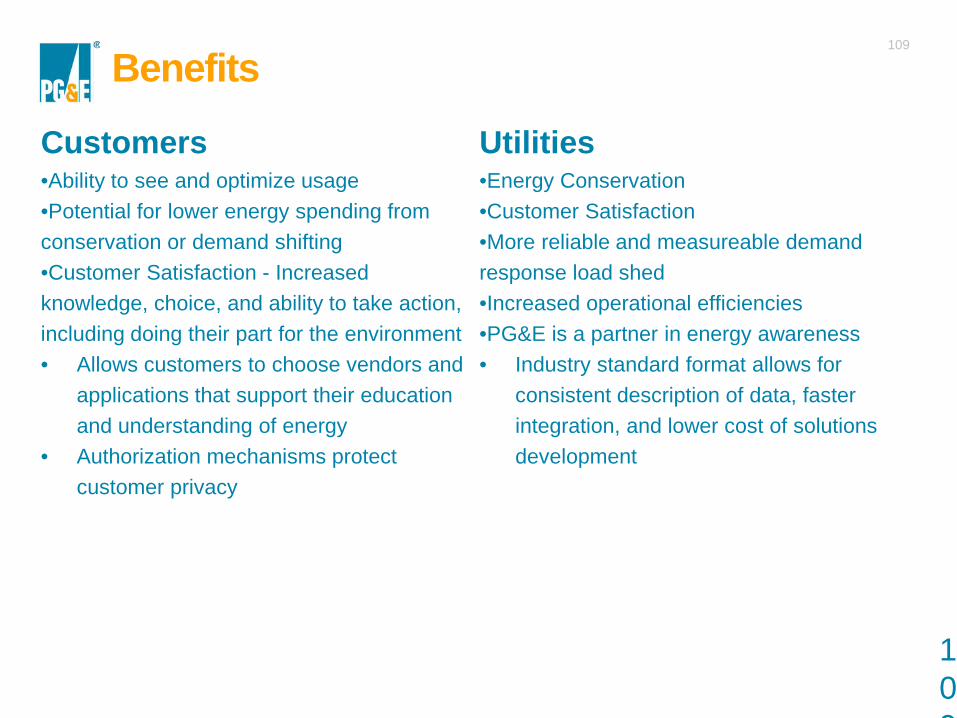
Benefits
Customers •Ability to see and optimize usage •Potential for lower energy spending from conservation or demand shifting •Customer Satisfaction - Increased knowledge, choice, and ability to take action, including doing their part for the environment • Allows customers to choose vendors and
applications that support their education and understanding of energy
• Authorization mechanisms protect customer privacy
Utilities •Energy Conservation •Customer Satisfaction •More reliable and measureable demand response load shed •Increased operational efficiencies •PG&E is a partner in energy awareness • Industry standard format allows for
consistent description of data, faster integration, and lower cost of solutions development
109

110
HOW CAN VENDORS GET INVOLVED?
111
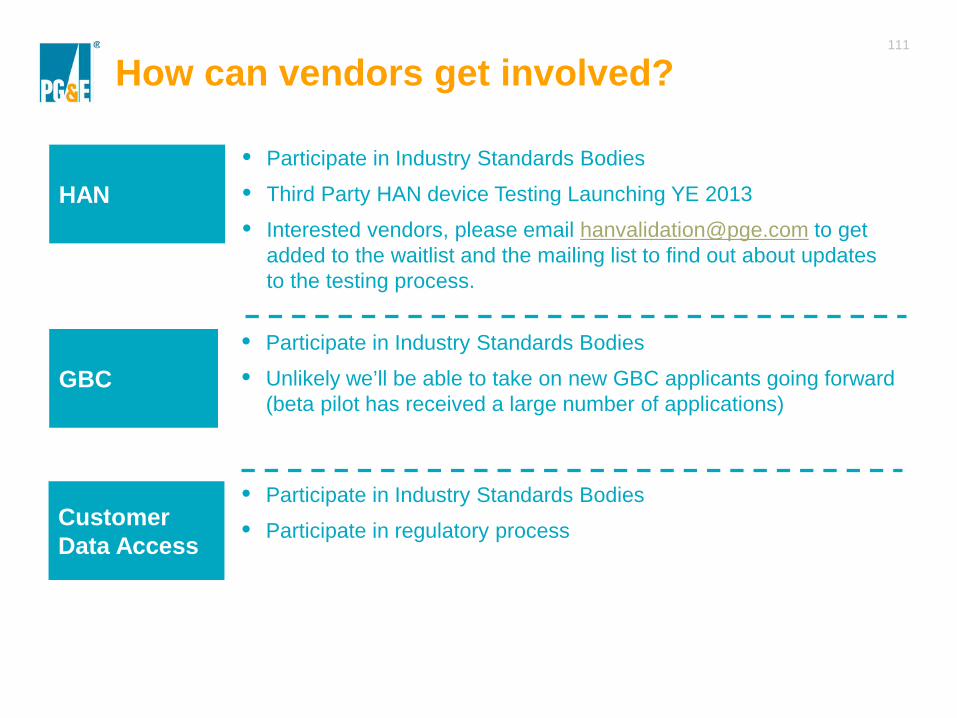
How can vendors get involved?
• Participate in Industry Standards Bodies
• Unlikely we’ll be able to take on new GBC applicants going forward (beta pilot has received a large number of applications)
GBC
Customer Data Access
• Participate in Industry Standards Bodies
• Participate in regulatory process
HAN • Participate in Industry Standards Bodies
• Third Party HAN device Testing Launching YE 2013
• Interested vendors, please email [email protected] to get added to the waitlist and the mailing list to find out about updates to the testing process.
113
Southern California Edison Mark Martinez: Senior Manager, DSM Strategy and Policy
Engaging Our Customers Through Enabling Technology
TRIO – August 2013
115 © Copyright 2013, Southern California Edison
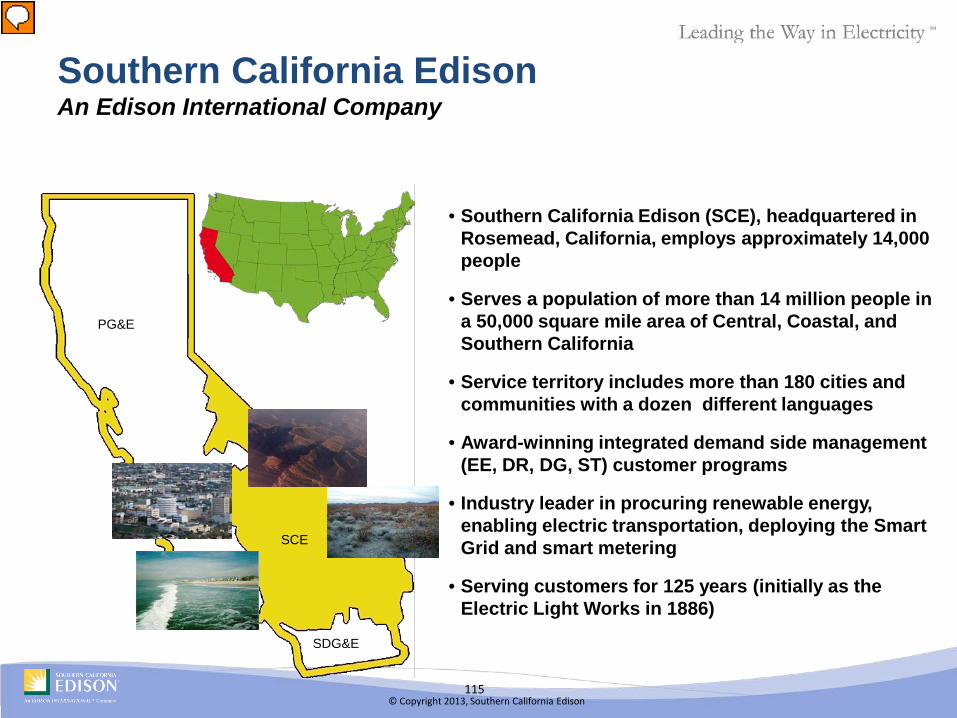
Southern California Edison An Edison International Company
PG&E
SCE
SDG&E
• Southern California Edison (SCE), headquartered in Rosemead, California, employs approximately 14,000 people
• Serves a population of more than 14 million people in a 50,000 square mile area of Central, Coastal, and Southern California
• Service territory includes more than 180 cities and communities with a dozen different languages
• Award-winning integrated demand side management (EE, DR, DG, ST) customer programs
• Industry leader in procuring renewable energy, enabling electric transportation, deploying the Smart Grid and smart metering
• Serving customers for 125 years (initially as the Electric Light Works in 1886)
Presenter
Presentation Notes
SCE does not serve the City of Los Angeles and certain other cities. Population served More than 13 million people Over 4.8 million customer accounts 5,000 large businesses 280,000 small businesses Financial $10 billion operating revenues Wholly owned subsidiary of Edison International (EIX) 2010 – SCE had 18,230 employees Power Delivery Stats 16 utility connections 4,990 transmission and distribution circuits 425 transmission and distribution crews Power delivered to customers in 2010 – 42% purchased, 24% CDWR, 34% SCE owned generation Distribution – 60,000 circuit miles overhead lines, 43,500 circuit miles underground, 700 distributions stations Environmental Leadership One of the largest portfolios of energy efficiency and demand response programs in US One of the largest portfolios of renewable energy in the US – 19.4%, current contracts and transmission projects will bring to approximately 20% once implemented Wind – 2, 057 MW Capacity, 29% of renewable portfolio Geothermal – 956 MW Capacity, 53% of renewable portfolio Solar – 383 MW Capacity, 6 % of renewable portfolio Small Hydro – 201 MW Capacity, 5% of renewable portfolio Biomass – 123 MW Capacity, 7% of renewable portfolio San Onofre Nuclear Generating Station (SONGS) is one of the largest nuclear generating stations in the U.S. with two active 1,100-megawatt units. It is the region’s largest power source with 2,200 MW of output – enough power to meet the needs of 1.4 million average Southern California homes at a point in time.San Onofre power is available 97% of the time between refueling outages, day and night, whether the sun shines or the wind blows. The plant currently saves utility customers approximately $250 million per year compared to the average cost of alternate available power sources.
116 © Copyright 2013, Southern California Edison
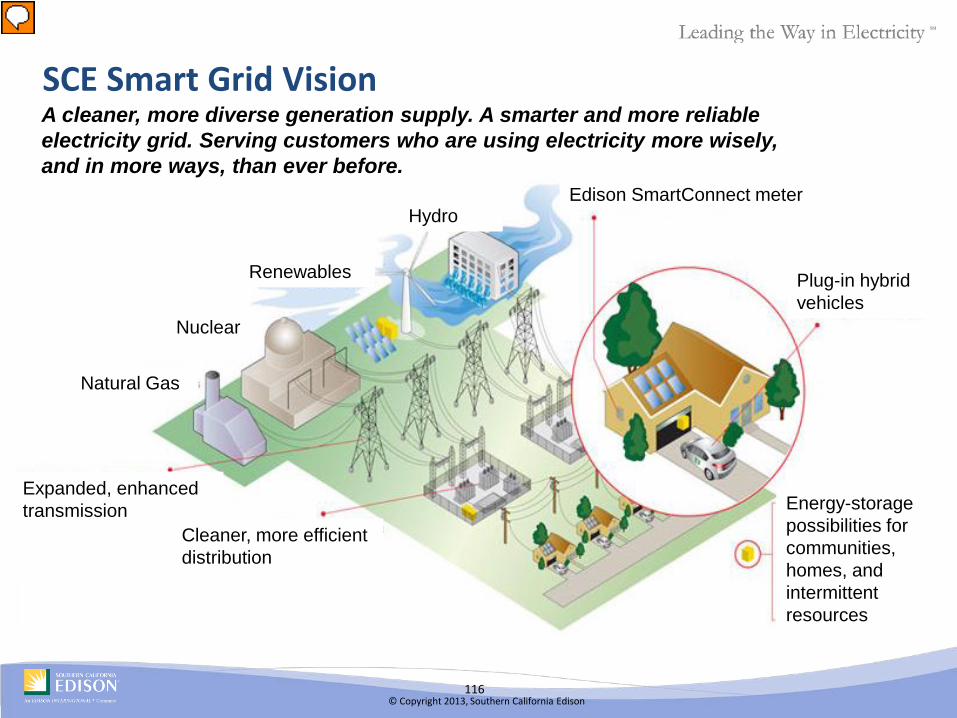
SCE Smart Grid Vision
© Copyright 2008, Southern California Edison
Natural Gas
Expanded, enhanced transmission
Cleaner, more efficient distribution
Energy-storage possibilities for communities, homes, and intermittent resources
Hydro
Renewables
Nuclear
Edison SmartConnect meter
Plug-in hybrid vehicles
Natural Gas
Expanded, enhanced transmission
Cleaner, more efficient distribution
Energy-storage possibilities for communities, homes, and intermittent resources
A cleaner, more diverse generation supply. A smarter and more reliable electricity grid. Serving customers who are using electricity more wisely, and in more ways, than ever before.
Presenter
Presentation Notes
SCE 125 Years of traditional operations: Manually read 44 million meters Conduct 2 million non-credit related field visits Handle more than 15 million inbound customer contacts Issue about 55 million bills Process over 50 million payments Collect about $10 billion in revenue SCE’s Vision of a Smart Grid Develop and deploy a more reliable, secure economic, efficient, safe and environmentally-friendly electric system SmartConnect, SCE’s advanced metering program focuses on: Efficient energy use in homes Provide the foundation to support introduction of electrical vehicles and home energy management Provide the information necessary to empower customers to make informed energy decisions Key challenges to be addressed are: What is the Customer Experience with Smart Grid, mobility, social media and collaboration? How to protect our data and make better decisions through smarter analytics? SCE’s vision of a smart grid is to develop and deploy a more reliable, secure, economic, efficient, safe and environmentally-friendly electric system covering all facets of electricity from production through transmission, distribution, and its smart use in homes, businesses and vehicles. This shows what we at EIX, and SCE see evolving in industry and our service territory Our initiatives are driven by policy objectives set at the State level, as well as Federal level 5 key themes that we believe will position Edison for future in energy delivery in this Smart Grid world. One is focus on renewable distributed energy resources and storage integration; second is on grid control and asset optimization; workforce effectiveness we think is an essential element; smart metering; and then energy smart customer solutions including the car, smart appliances, and the smart thermostat – the goal of which is to modernize our grid to improve reliability, safety, and cost effectiveness while delivering more customized solutions and environmentally friendly energy supply to meet our customers’ energy management needs. (Source: Paul De Martini) Energy Storage : Key to the puzzle is cost effective energy storage. Largest today 1 megawatt lithium battery. High density battery has to be safe (does not explode) or highly toxic (can’t dispose). Needs to be high density, small, and cheap. Advanced Distribution:We know about a power outage today because we get the call. We are looking to integrate millions of data points, with phasors to analyze what is happening over a large area. Workforce Effectiveness: An area SCE find integral to smart grid development – finding ways to enable workers to work more effectively and safely. Edison SmartConnect: Edison SmartConnect advanced metering system will provide customers with valuable information regarding both real-time and historical usage patterns, and notification regarding energy price escalations during peak hours. The system will also give suggested tips for conserving energy across a variety of media. Connected Home: Edison SmartConnect will also enable price-responsive control options of appliance and devices in the home through the Home Area Network (HAN) interface. SCE’s smart grid will also spark greater use of plug-in vehicles by increasing system flexibility.
117 © Copyright 2013, Southern California Edison
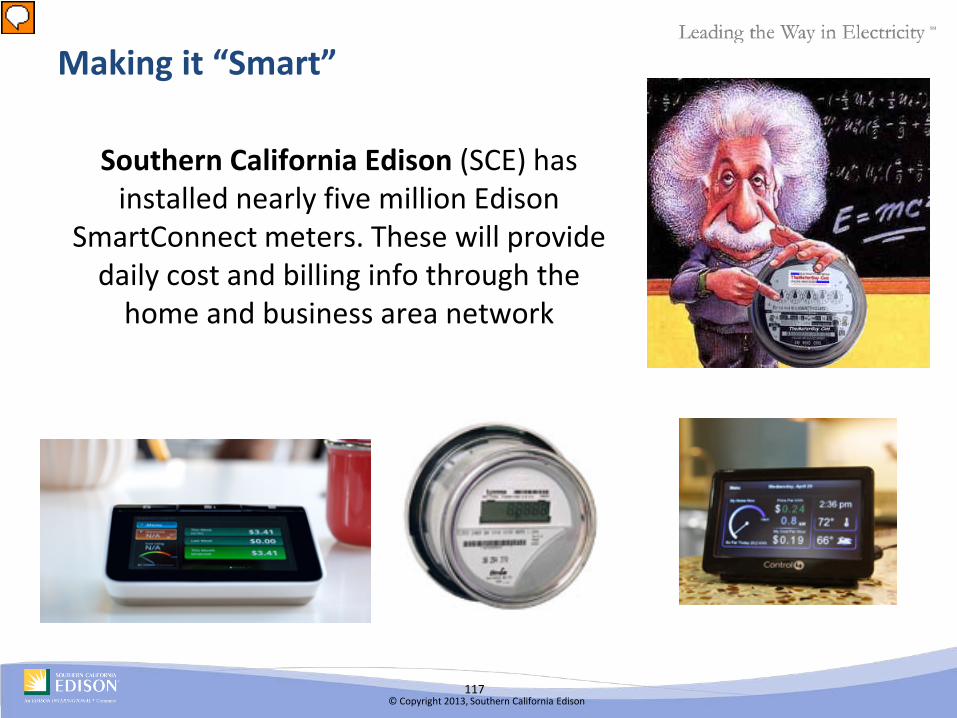
Making it “Smart”
Southern California Edison (SCE) has installed nearly five million Edison
SmartConnect meters. These will provide daily cost and billing info through the
home and business area network
Presenter
Presentation Notes
SCE does not serve the City of Los Angeles and other cities. Population served More than 14 million people 15 Counties - 430 Cities Approx. 4.9 million accounts More than 4.8 million residential customers 5,000 large businesses 280,000 small businesses Financial Assets $40.3 Billion $10.57 billion operating revenues (2011) Wholly owned subsidiary of Edison International (EIX) 2010/2011 – SCE had approx. 18,000 employees Power Delivery Stats 16 utility connections 12,206 transmission and subtransmission circuits 89,938 miles of distribution circuits 930 substations 425 transmission and distribution crews EE and Renewables One of the largest portfolios of energy efficiency and demand response programs in US – over last 5 years, SCE’s energy efficiency programs have helped customers save more than 8.6 billion killowatt-hours, enough to power more than 1.2 million homes for a year 2011 – Generates 43% of electricity it provides to customers 2011 – SCE purchased 15.4 Billion Kilowatt-hours of renewable energy One of the largest portfolios of renewable energy in the US – 21.1% in 2011, current contracts and transmission projects will increase portfolio Wind – 35% of renewable portfolio Geothermal – 47% of renewable portfolio Solar – 6 % of renewable portfolio Small Hydro – 201 MW Capacity, 5% of renewable portfolio Biomass – 6% of renewable portfolio Rates and Bill Comparison Though SCE residential rates are above the national average, partially due to higher cost for renewables, average monthly mills are lower than national average High rate levels offset by significantly lower average CA customer usage, 44% lower residential usage than national average from relatively mild climate and higher efficiency building standards Rates: 2011 Sales by Class of Service Residential: 34% Commercial: 45% Industrial: 10% Public: 5% Ag/Resale & Other: 6%
118 © Copyright 2013, Southern California Edison
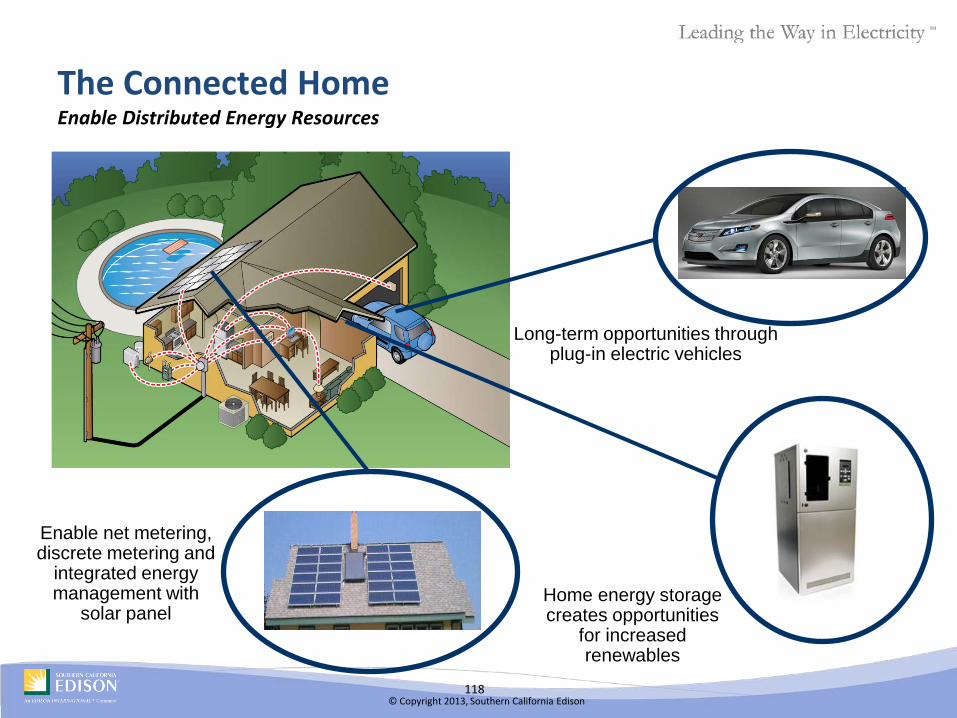
Long-term opportunities through plug-in electric vehicles
Enable net metering, discrete metering and
integrated energy management with
solar panel Home energy storage creates opportunities
for increased renewables
The Connected Home Enable Distributed Energy Resources
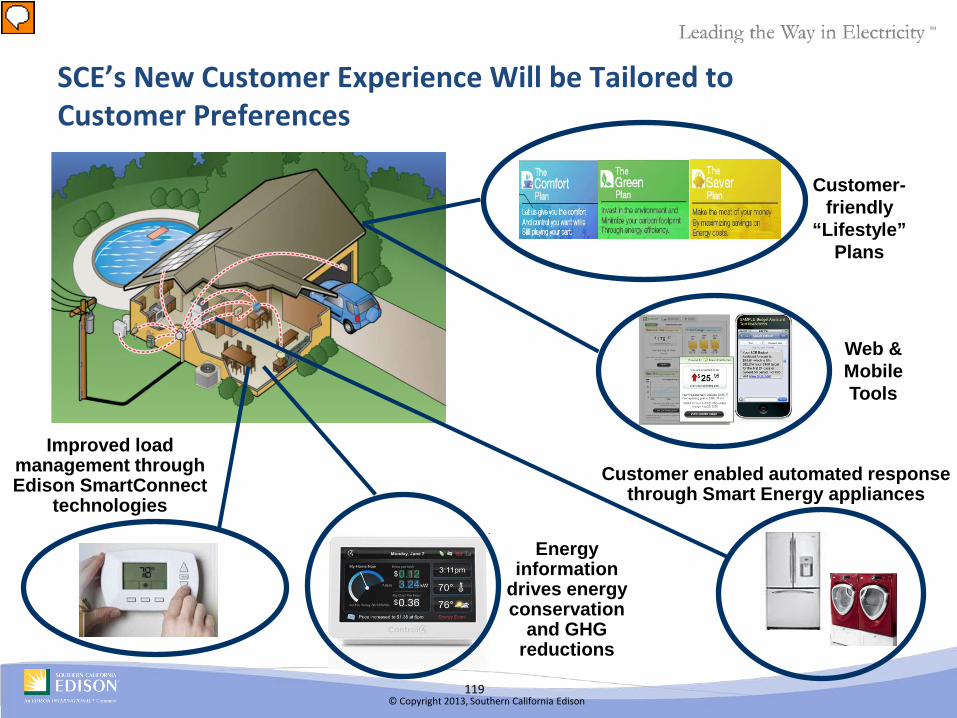
119 © Copyright 2013, Southern California Edison
Customer enabled automated response through Smart Energy appliances
Improved load management through Edison SmartConnect
technologies
Energy information
drives energy conservation
and GHG reductions
SCE’s New Customer Experience Will be Tailored to Customer Preferences
Customer-friendly
“Lifestyle” Plans
Web & Mobile Tools
Presenter
Presentation Notes
Engaged leading smart appliance Manufacturer to develop smart energy-enabled appliances Evaluating products in SCE’s lab Included in SCE’s Irvine Smart Grid Demonstration project with U.S. Department of Energy Soon we will be able to offer a personalized customer experience powered by technology Relevant targeted customer experience, recognize who you are (when you come to sce.com – we’ll know what you last browsed, what program you would most likely qualify for or be interested in based on historical behavior and segmentation) With advanced technology, we can offer even more choices to fit your preference IVR Advanced Speech Recognition – (Q4’11, pending CCO feasibility assessment and testing) Web advances on sce.com (see examples below) SCE.com (pending PMT and budget approvals) Outage Maps Click to call, Chat, Co-browsing (CCO Web Service Pilot – may even be able to done in ’09, but dependent on successful bid, feasibility, and testing / integration with SCE.com) Robust Analysis & Recommendation Tools Transaction Status Tracking Customer communication preferences CRM Phase I Integrated DSM Back-Office Program Management New Partner Energy Information Programs (e.g. Microsoft) Automation Planned Outage Notification DSM Program Enrollment Remote credit disconnect/reconnect Mainstream Electric Vehicle Customer Programs / Processes “Lifestyle” Plans Pre-packaged rates, DSM programs, billing/payment options CSS replacement Tom Walker ? (by Sept – systems swag for yellow book) Dynamic Pricing Residential Off Peak Savings Plan (TOU) Residential Save Power Day Incentive (PTR) C&I Time of Use (TOU Plan) Summer Advantage Incentive (CPP) Programmable Communicating Thermostat (PCT)
120 © Copyright 2013, Southern California Edison
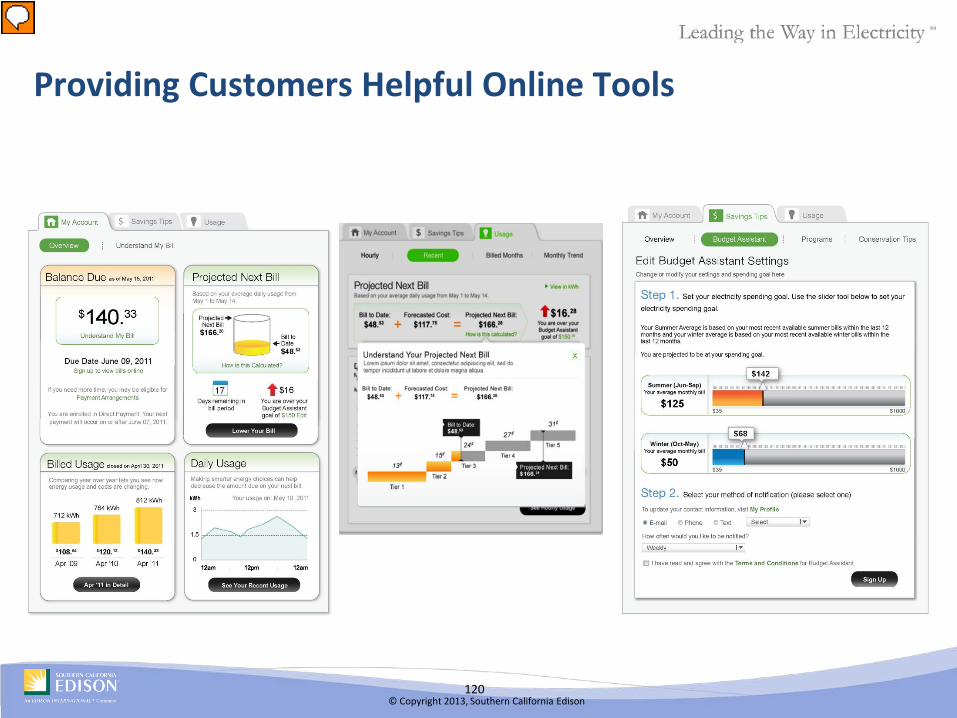
Providing Customers Helpful Online Tools
Presenter
Presentation Notes
Yesterday’s hourly electricity usage refreshed daily (posted by 8 a.m.) Daily usage within current bill cycle (“recent usage”) Daily average kWh usage (roll-over) Daily high temperature for your geographic area (roll-over) The “projected next bill” for current bill cycle – refreshed daily Estimated bill costs based on current usage (“bill-to-date”) Projection of kWh usage above / below last months usage Projection of $ amount above/below an established spending goal Last month’s usage and bill amounts ($) compared with previous 2 years Tier position & tier pricing (where you’re at & where you’re going) Calculated number of days remaining until your next billing cycle Budget Assistant – performance notifications Save Power Day performance reports Summer Advantage Incentive performance reports Remote Service Turn-on / Turn-off Daily “Events” annotated over daily usage bars Daily & Maxim Demand (C&I customers)
121 © Copyright 2013, Southern California Edison
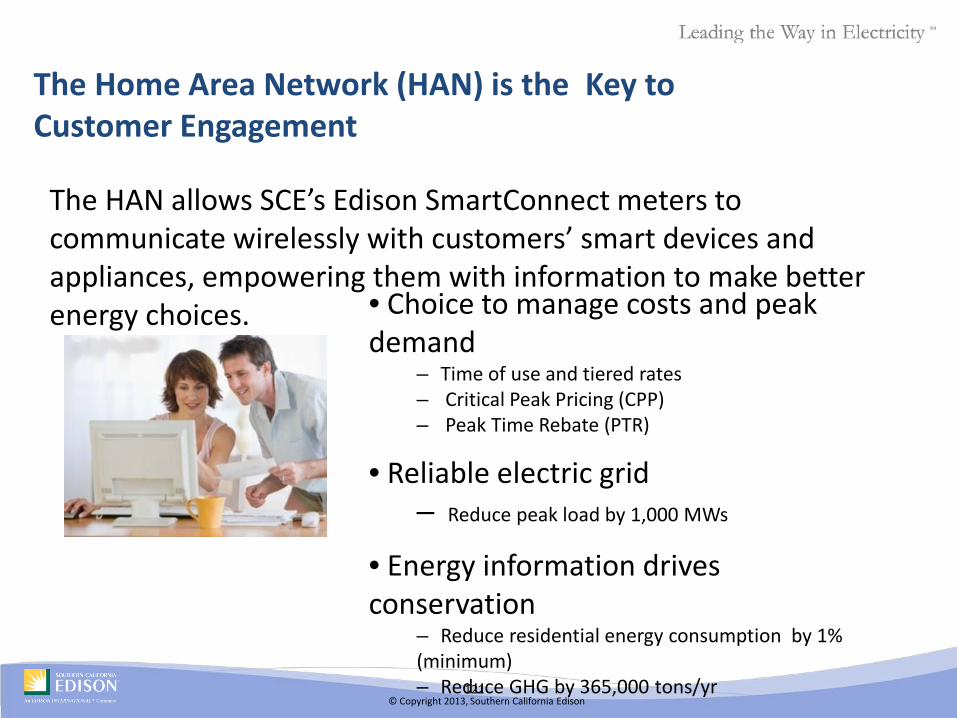
The Home Area Network (HAN) is the Key to Customer Engagement
The HAN allows SCE’s Edison SmartConnect meters to communicate wirelessly with customers’ smart devices and appliances, empowering them with information to make better energy choices. • Choice to manage costs and peak
demand – Time of use and tiered rates – Critical Peak Pricing (CPP) – Peak Time Rebate (PTR)
• Reliable electric grid – Reduce peak load by 1,000 MWs
• Energy information drives conservation
– Reduce residential energy consumption by 1% (minimum) – Reduce GHG by 365,000 tons/yr
122 © Copyright 2013, Southern California Edison
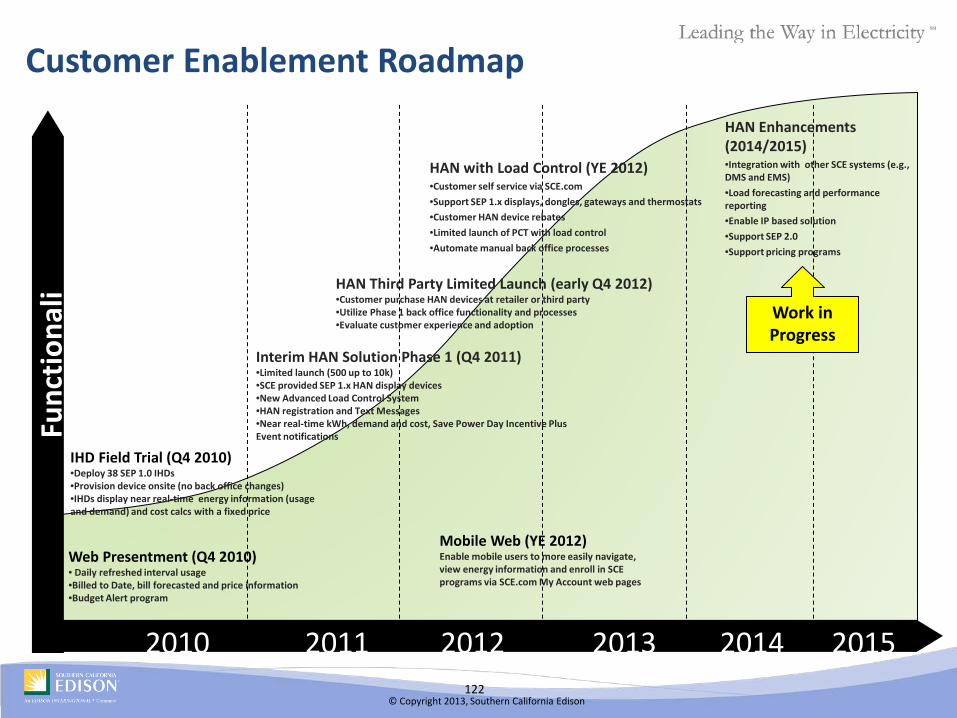
Customer Enablement Roadmap Fu
nctio
nali
ty
Interim HAN Solution Phase 1 (Q4 2011) •Limited launch (500 up to 10k) •SCE provided SEP 1.x HAN display devices •New Advanced Load Control System •HAN registration and Text Messages •Near real-time kWh, demand and cost, Save Power Day Incentive Plus Event notifications
Web Presentment (Q4 2010) • Daily refreshed interval usage •Billed to Date, bill forecasted and price information •Budget Alert program
IHD Field Trial (Q4 2010) •Deploy 38 SEP 1.0 IHDs •Provision device onsite (no back office changes) •IHDs display near real-time energy information (usage and demand) and cost calcs with a fixed price
HAN with Load Control (YE 2012) •Customer self service via SCE.com •Support SEP 1.x displays, dongles, gateways and thermostats •Customer HAN device rebates •Limited launch of PCT with load control •Automate manual back office processes
Mobile Web (YE 2012) Enable mobile users to more easily navigate, view energy information and enroll in SCE programs via SCE.com My Account web pages
HAN Third Party Limited Launch (early Q4 2012) •Customer purchase HAN devices at retailer or third party •Utilize Phase 1 back office functionality and processes •Evaluate customer experience and adoption
HAN Enhancements (2014/2015) •Integration with other SCE systems (e.g., DMS and EMS) •Load forecasting and performance reporting •Enable IP based solution •Support SEP 2.0 •Support pricing programs
Work in Progress
2010 2011 2012 2013 2014 2015
123 © Copyright 2013, Southern California Edison
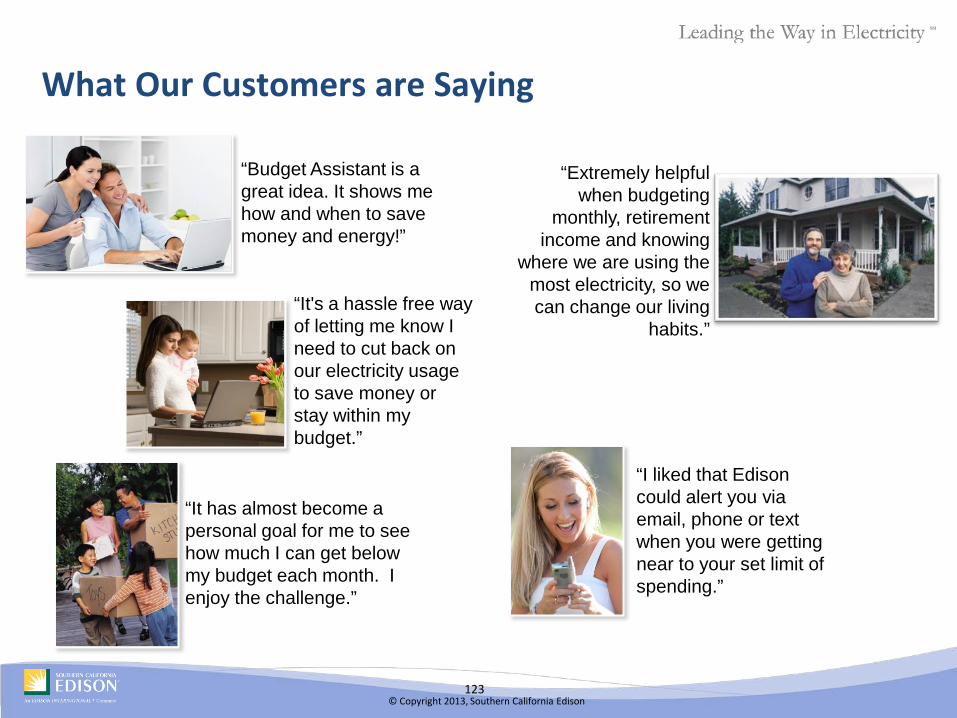
What Our Customers are Saying
“Budget Assistant is a great idea. It shows me how and when to save money and energy!”
“Extremely helpful when budgeting
monthly, retirement income and knowing
where we are using the most electricity, so we can change our living
habits.” “It's a hassle free way of letting me know I need to cut back on our electricity usage to save money or stay within my budget.”
“I liked that Edison could alert you via email, phone or text when you were getting near to your set limit of spending.”
“It has almost become a personal goal for me to see how much I can get below my budget each month. I enjoy the challenge.”
124 © Copyright 2013, Southern California Edison
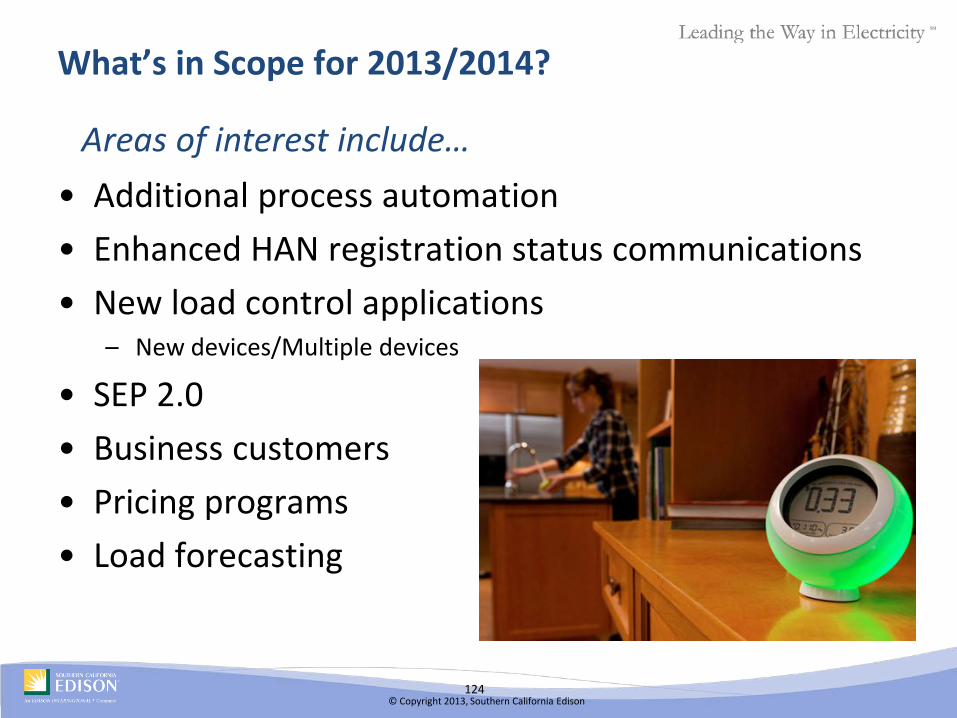
What’s in Scope for 2013/2014?
• Additional process automation • Enhanced HAN registration status communications • New load control applications
– New devices/Multiple devices
• SEP 2.0 • Business customers • Pricing programs • Load forecasting
Areas of interest include…
125 © Copyright 2013, Southern California Edison
Guiding Principles
• Customer First: Think about how your customers will accept the processes, and how it will scale
• Collaborate: Bring your business leaders, technology teams, and
vendors to the table when designing your implementation
• Look Forward: Balance your design between existing capabilities and where you want to be in the future (don’t get trapped by traditional processes)
• Partnership: Choose vendors engaged in standard’s groups. While they are moving targets, make sure you are not locked into obsolete technology
Presenter
Presentation Notes
So, in summary, these are some of our key lessons learned for this demand response implementation: - Bring your business leaders, technology teams, and vendors to the table when designing your implementation - Balance your design between existing capabilities and where you want to be in the future (don’t get trapped by traditional processes) - Think about how your customers will accept the processes – and how it will scale… - Choose vendors engaged in standard’s groups. While they are moving targets, make sure you are not locked into obsolete technology
126 © Copyright 2013, Southern California Edison
Giving Our Customers the Power to Invest in What Matters Most to Them: Their Families and Businesses
Presenter
Presentation Notes
Bring it back to engaging customers through technology – to change how we do business with them, creating a RELATIONSHIP with them HAN is one of the final pieces in our Edison SmartConnect’s vision of connecting the grid to the meter to the home and is paving the way to a new energy future – engaging customers, enabling them to have the ability to control their energy costs – giving them the control to determine HOW and WHEN they want to save
127 © Copyright 2013, Southern California Edison
Get to Know More About the Utility’s Rate Programs
Presenter
Presentation Notes
For more information on the Edison SmartConnect program visit or call us at any of the contact numbers listed below: To visit us online, go to www.sce.com/edisonsmartconnect For general information about the program, email us at: [email protected] For general questions about Edison SmartConnect, contact 1-800-810-2369.

128 © Copyright 2013, Southern California Edison
Like Us on Facebook!
Edison’s Smart Meter web site: www.sce.com/smartconnect
Learn More About SCE’s Home Area Networks
www.sce.com/han
TO LEARN MORE
20
129
Bidgely Prateek Chakravarty: VP, Business Development and Marketing
GB and HAN Experience PG&E TRIO Forum Aug 2013
Bid
gely
Pro
prie
tary
130
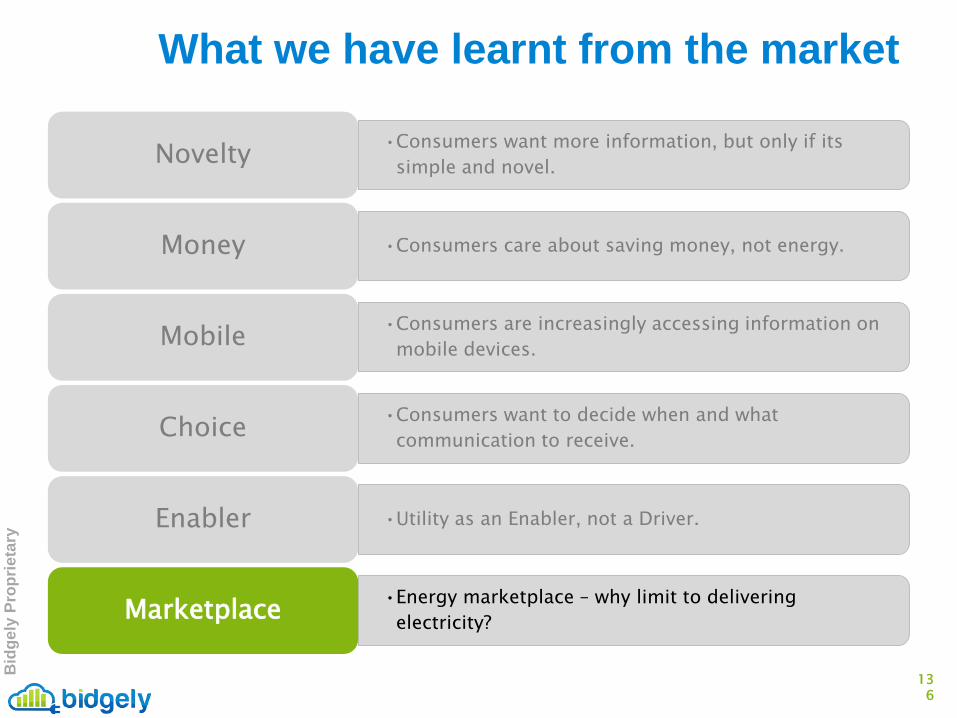
What we have learnt from the market
Bid
gely
Pro
prie
tary
131
•Consumers want more information, but only if its simple and novel. Novelty
What we have learnt from the market
Bid
gely
Pro
prie
tary
132
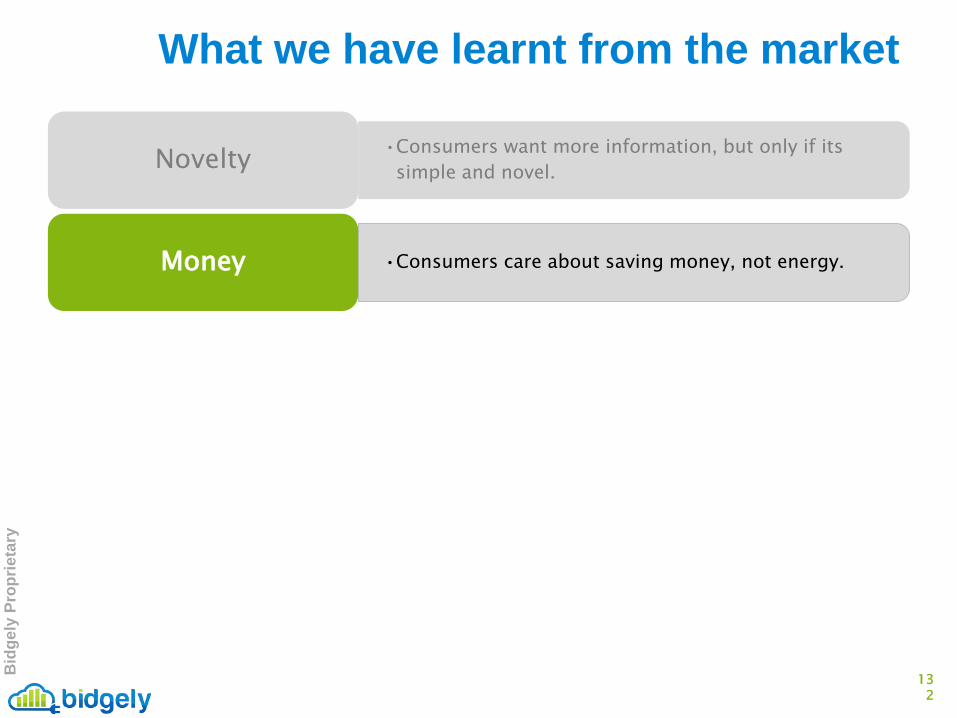
•Consumers want more information, but only if its simple and novel. Novelty
•Consumers care about saving money, not energy. Money
What we have learnt from the market
Bid
gely
Pro
prie
tary
133
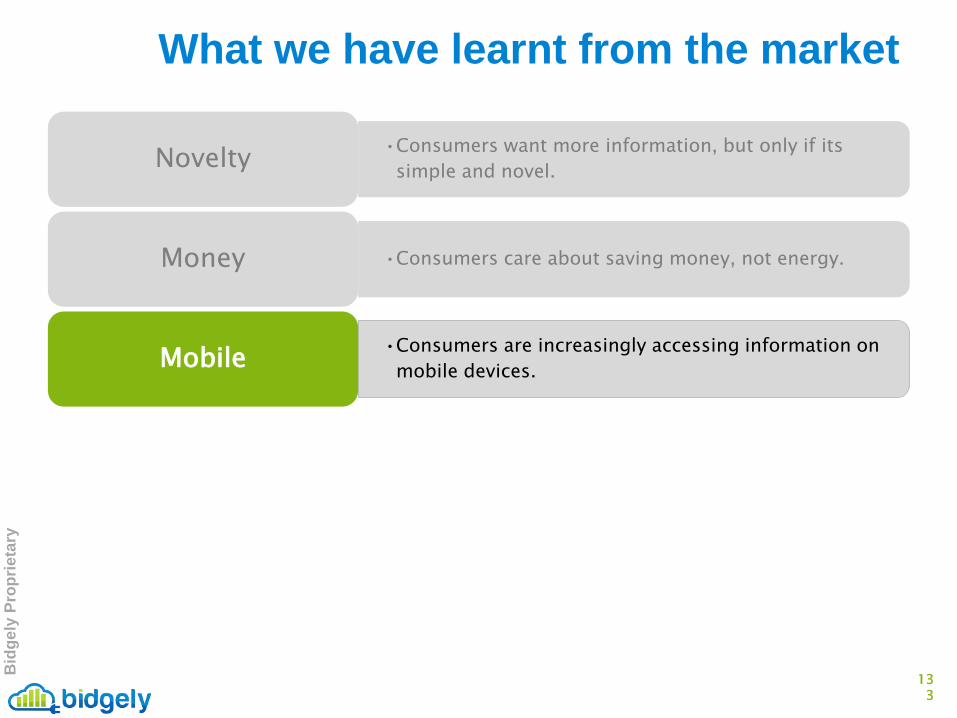
•Consumers want more information, but only if its simple and novel. Novelty
•Consumers care about saving money, not energy. Money
•Consumers are increasingly accessing information on mobile devices. Mobile
What we have learnt from the market
Bid
gely
Pro
prie
tary
134
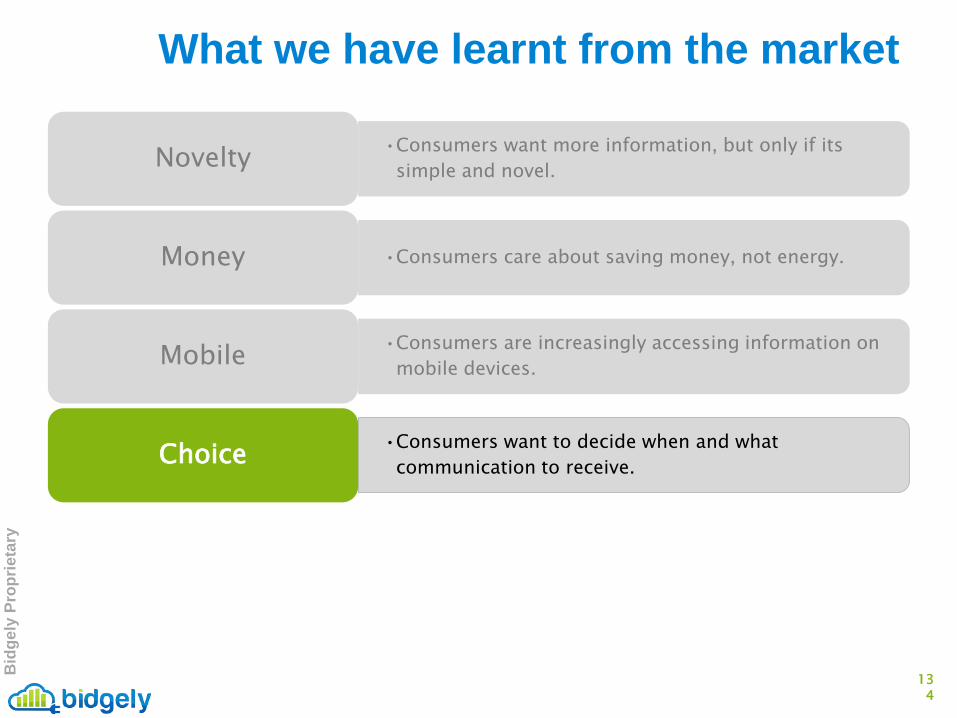
•Consumers want more information, but only if its simple and novel. Novelty
•Consumers care about saving money, not energy. Money
•Consumers are increasingly accessing information on mobile devices. Mobile
•Consumers want to decide when and what communication to receive. Choice
What we have learnt from the market
Bid
gely
Pro
prie
tary
135
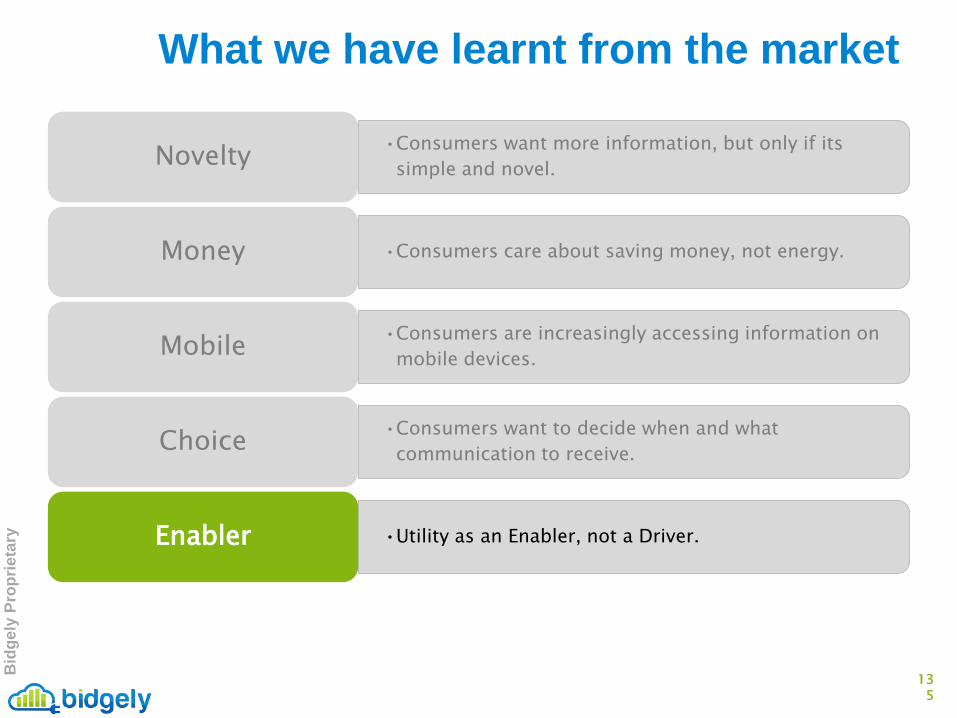
•Consumers want more information, but only if its simple and novel. Novelty
•Consumers care about saving money, not energy. Money
•Consumers are increasingly accessing information on mobile devices. Mobile
•Consumers want to decide when and what communication to receive. Choice
•Utility as an Enabler, not a Driver. Enabler
What we have learnt from the market
Bid
gely
Pro
prie
tary
136
•Consumers want more information, but only if its simple and novel. Novelty
•Consumers care about saving money, not energy. Money
•Consumers are increasingly accessing information on mobile devices. Mobile
•Consumers want to decide when and what communication to receive. Choice
•Utility as an Enabler, not a Driver. Enabler
•Energy marketplace – why limit to delivering electricity? Marketplace
What we have learnt from the market
Bid
gely
Pro
prie
tary
137
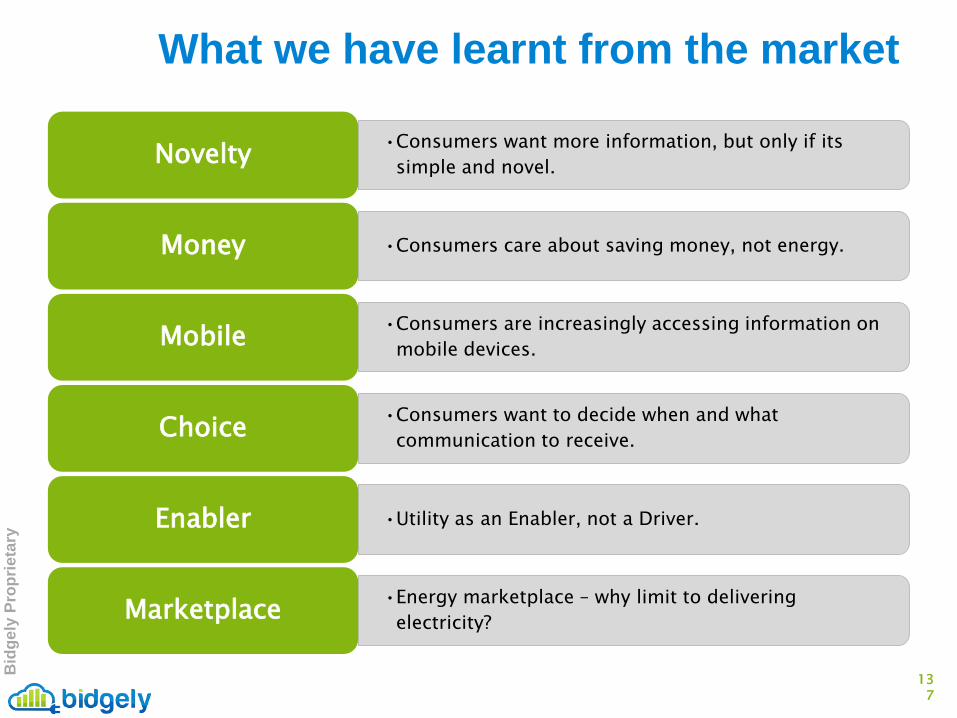
•Consumers want more information, but only if its simple and novel. Novelty
•Consumers care about saving money, not energy. Money
•Consumers are increasingly accessing information on mobile devices. Mobile
•Consumers want to decide when and what communication to receive. Choice
•Utility as an Enabler, not a Driver. Enabler
•Energy marketplace – why limit to delivering electricity? Marketplace
138
Pacific Gas & Electric Albert Chiu: Expert Product Manager, Customer Energy Solutions
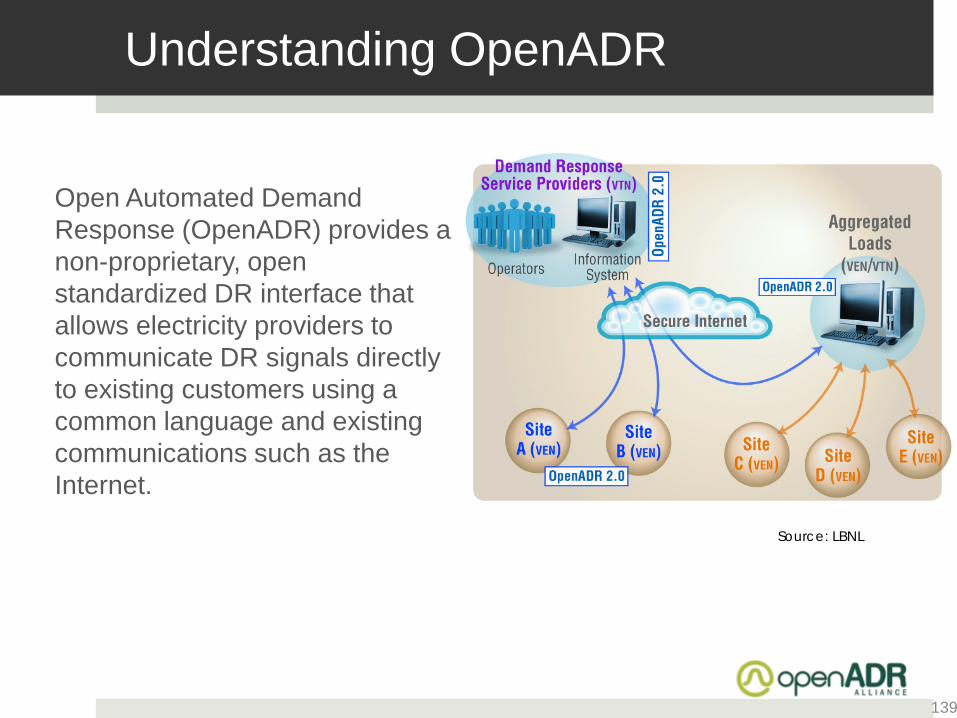
Understanding OpenADR
Open Automated Demand Response (OpenADR) provides a non-proprietary, open standardized DR interface that allows electricity providers to communicate DR signals directly to existing customers using a common language and existing communications such as the Internet.
139
Source: LBNL
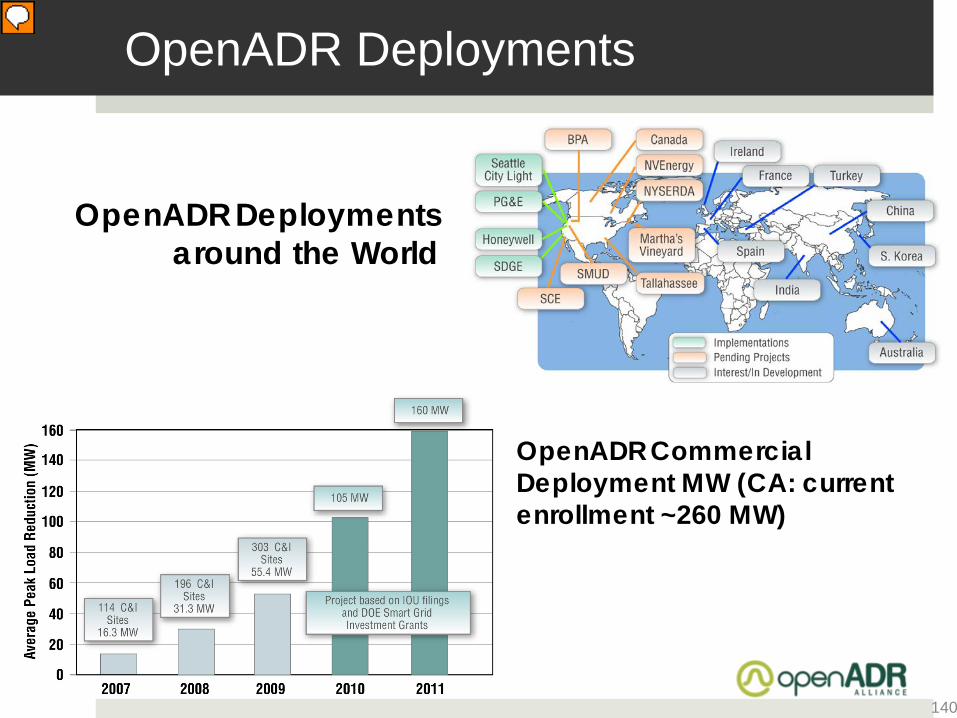
OpenADR Deployments
OpenADR Commercial Deployment MW (CA: current enrollment ~260 MW)
OpenADR Deployments around the World
140
Presenter
Presentation Notes
While a lot of other standards are still being discussed on the drawing board, OADR is already deployed in many projects.
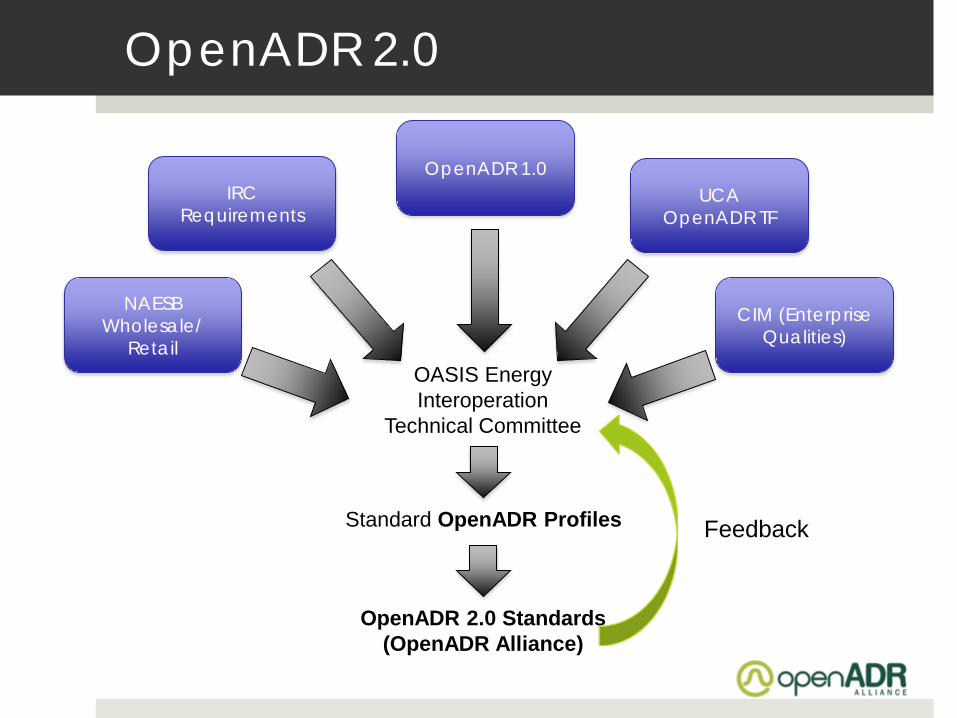
OpenADR 2.0
OASIS Energy Interoperation
Technical Committee
CIM (Enterprise Qualities)
NAESB Wholesale/
Retail
UCA OpenADR TF
IRC Requirements
OpenADR 1.0
Standard OpenADR Profiles
OpenADR 2.0 Standards (OpenADR Alliance)
Feedback
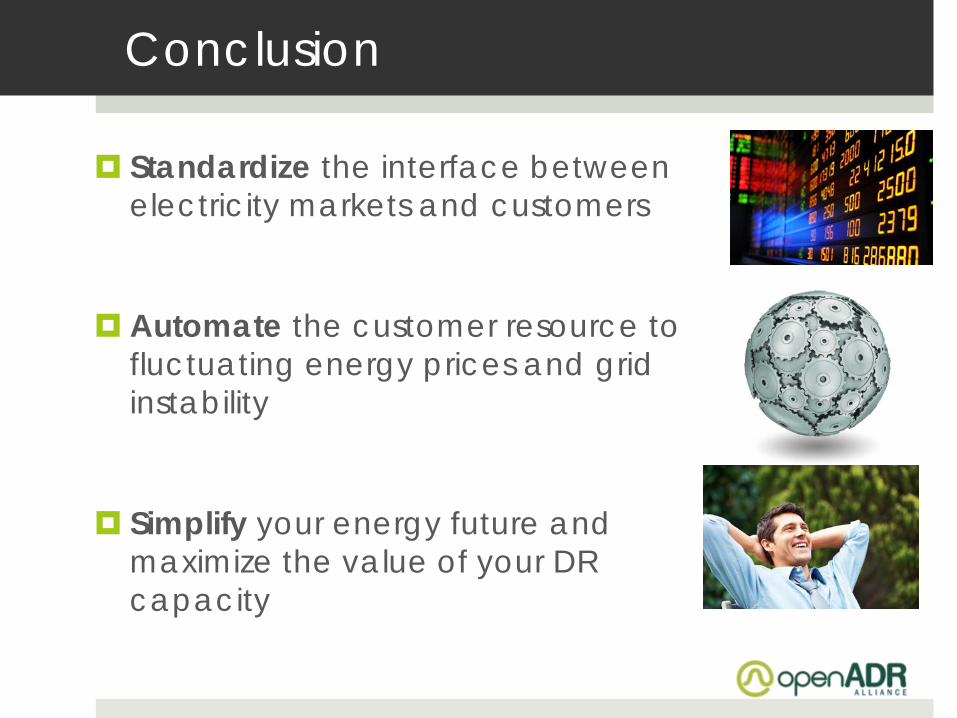
Conclusion
Standardize the interface between electricity markets and customers
Automate the customer resource to fluctuating energy prices and grid instability
Simplify your energy future and maximize the value of your DR capacity
143
Networking Break
144
Pricing and Rates Speaker: Andrew Au: Product Manager for Commercial Time Varying Pricing | PG&E
145
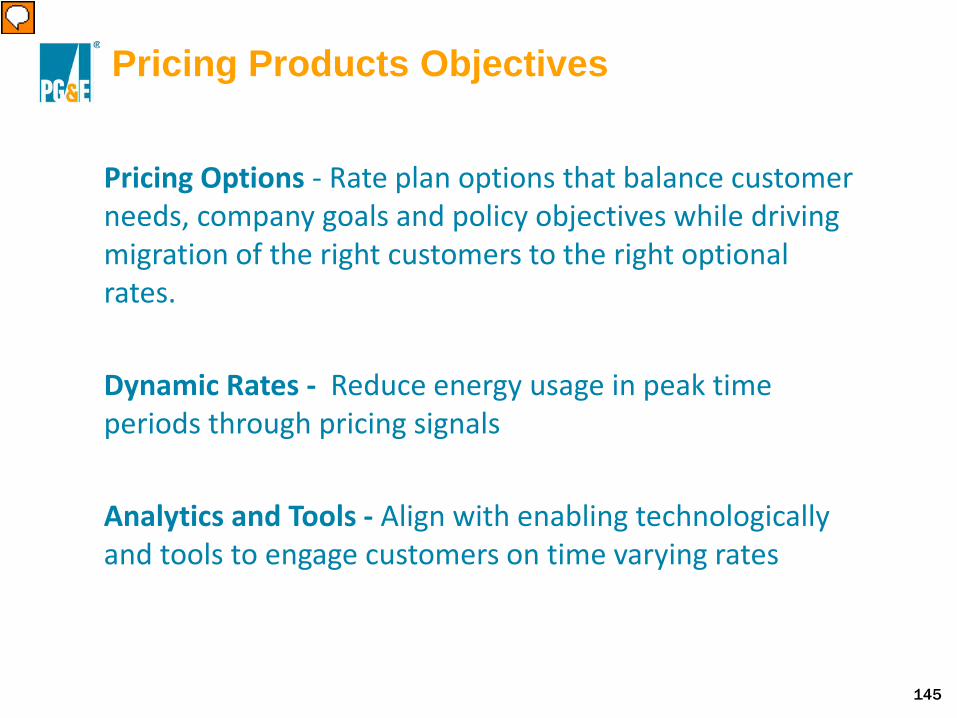
Pricing Products Objectives
Pricing Options - Rate plan options that balance customer needs, company goals and policy objectives while driving migration of the right customers to the right optional rates.
Dynamic Rates - Reduce energy usage in peak time periods through pricing signals
Analytics and Tools - Align with enabling technologically and tools to engage customers on time varying rates
Presenter
Presentation Notes
now we’re sitting on a platform of trillions of data points, and suddenly we can use interval data to identify trends, to create innovative pricing options and to design new tools and analytics that weren’t previously possible. But we’re a utility, not an IT company so how can you help us? Pricing options – we have a lot of rates. a large portfolio of confusing rate options. We want options customers understand and can participate on to meet both company and statewide savings initiatives Dynamic rates – peaker plants are dirty and expensive. last year we started a transition plan to move all of our commercial customers first to Time of use rates then to an Opt Out PDP rate. How can we get more load out of these ½ million customers? Analytics and tools – customers think about utilities 6 min a year. We either need to create new tools that drive customer engagement, or build innovative automated solutions that do it for them. I want to tell Siri I only want a power bill of $100 a month, and let her do the rest.
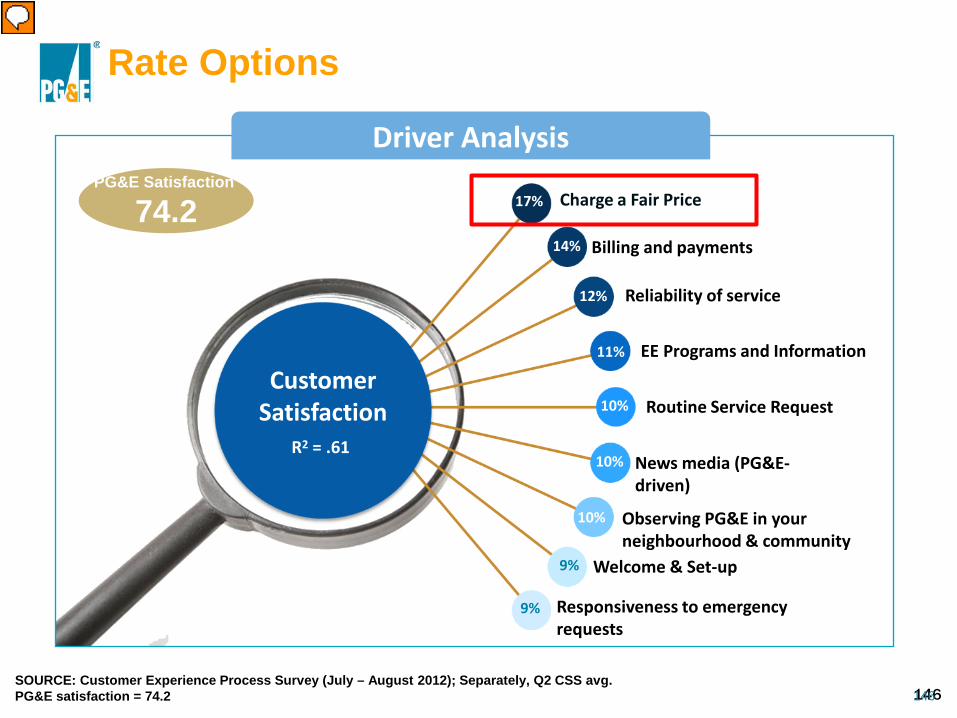
146 146
Brand
Rate Options
Customer Satisfaction
Charge a Fair Price
Billing and payments
Reliability of service
EE Programs and Information
Routine Service Request
News media (PG&E-driven)
Observing PG&E in your neighbourhood & community
Welcome & Set-up
Responsiveness to emergency requests
17%
14%
12%
11%
10%
10%
10%
9%
9%
R2 = .61
Driver Analysis
SOURCE: Customer Experience Process Survey (July – August 2012); Separately, Q2 CSS avg. PG&E satisfaction = 74.2
PG&E Satisfaction
74.2
Presenter
Presentation Notes
It’s harder to run effective EE, DR and Solar programs when our customers aren’t satisfied with their service. First and foremost on their minds are price, ease of paying their bill, and keeping the lights on. JD Power “Price Index scores increase when customers are provided pricing options that meet their lifestyle.” Utilities that communicate rate choice, ease of understanding and customer education achieve higher satisfaction scores than those utilities who do not.
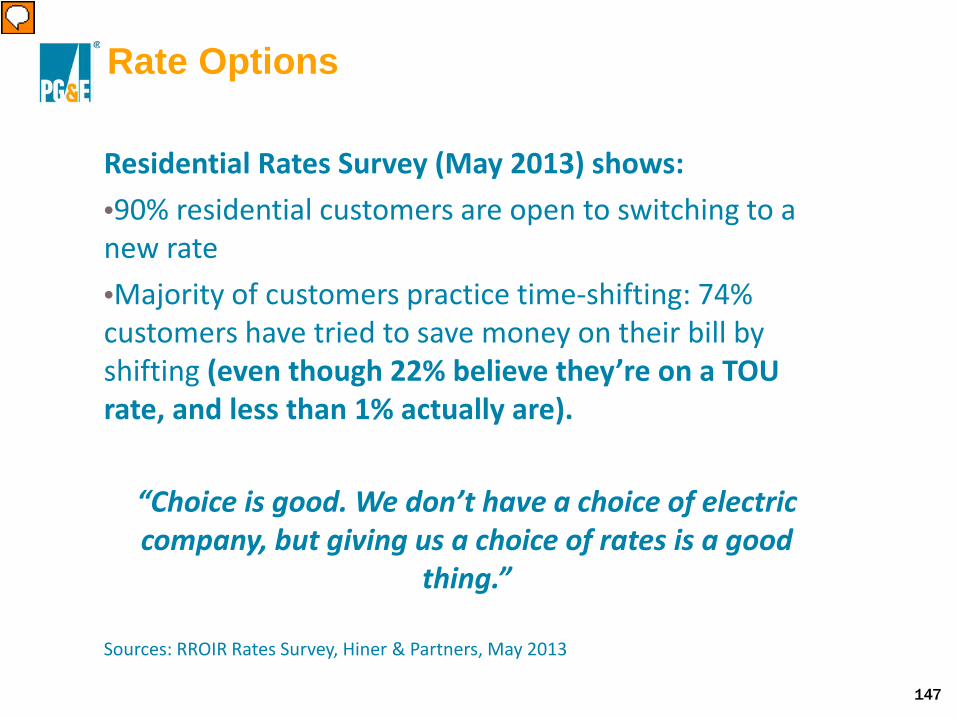
147
Rate Options
Residential Rates Survey (May 2013) shows: •90% residential customers are open to switching to a new rate •Majority of customers practice time-shifting: 74% customers have tried to save money on their bill by shifting (even though 22% believe they’re on a TOU rate, and less than 1% actually are).
“Choice is good. We don’t have a choice of electric company, but giving us a choice of rates is a good
thing.”
Sources: RROIR Rates Survey, Hiner & Partners, May 2013
Presenter
Presentation Notes
Our customers want to change, and many of them already have but they aren’t benefiting from it With flat rates the only way to save is to use less.
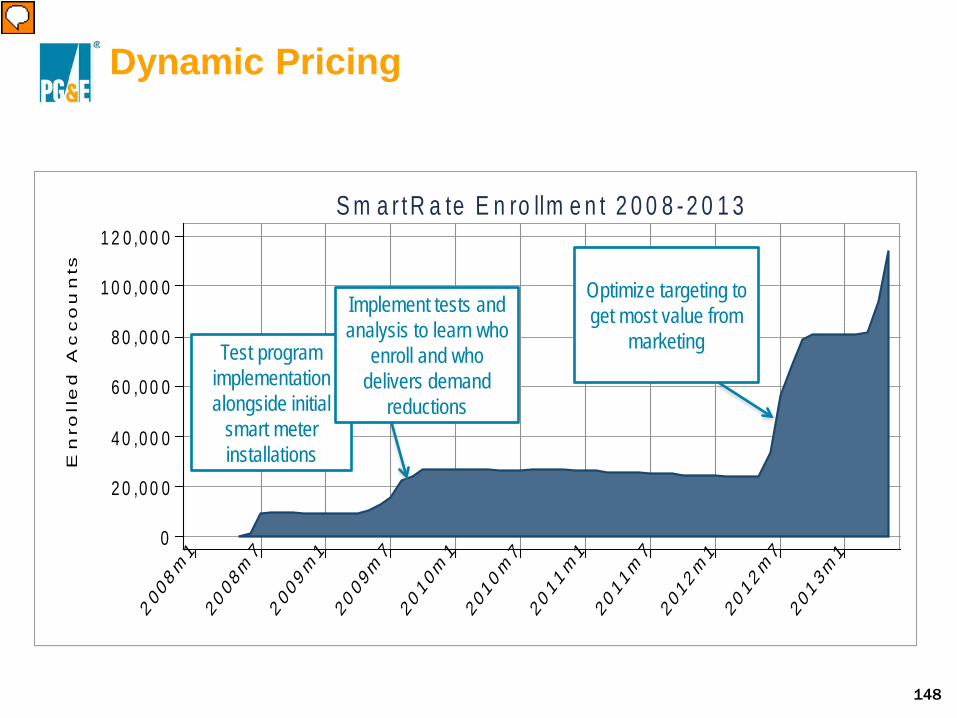
148
Dynamic Pricing
0
2 0 ,0 0 0
4 0 ,0 0 0
6 0 ,0 0 0
8 0 ,0 0 0
1 0 0 ,0 0 0
1 2 0 ,0 0 0
En
roll
ed
Ac
co
un
ts
2 0 0 8 m1
20 08m7
2 009 m1
20 09m7
20 10m1
2010 m7
20 11 m1
20 11m7
2012 m1
20 12 m7
201 3m1
S m a r t R a te E n ro llm e n t 2 0 0 8 - 2 0 1 3
Test program implementation alongside initial
smart meter installations
Optimize targeting to get most value from
marketing Implement tests and analysis to learn who
enroll and who delivers demand
reductions
Presenter
Presentation Notes
We’ve created programs to support these engaged custoemrs. There are many pilots going on around the country, but few full scale implementations of residential CPP programs PG&E is the first and largest implementation of voluntary CPP rates SmartRate™ first marketed in 2008 120,000+ customer currently enrolled Prices are 60₵ higher on 15 event days from 2-7pm, in exchange customers get a around 10% the rest of summer Consistent demand reduction and bill savings The plan comes with bill protection for the customer’s first full season, so they can try it risk-free. Communicate complex CPP rates isn’t easy. We had steady participation in the first few years around 20k, but from the very beginning, we gathered insights using a test and learn strategy. This analysis helped us get to where we are today and we saw a dramatic increase in enrollments over the past 18 months from 20k to 120k
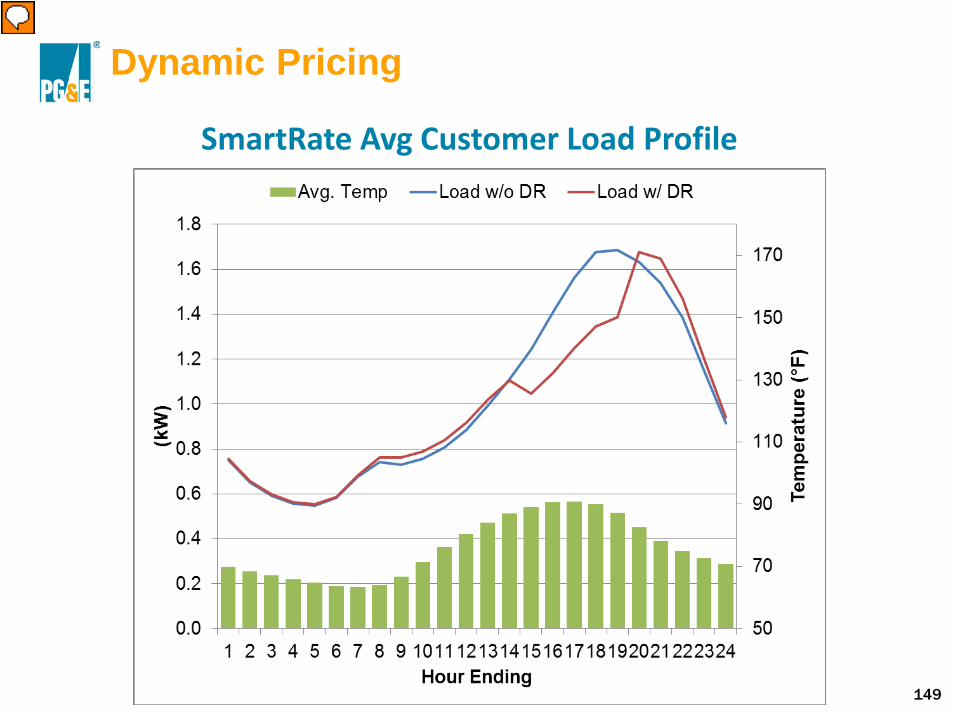
149
Dynamic Pricing
SmartRate Avg Customer Load Profile
Presenter
Presentation Notes
It works! Avg load reduction = .35kW or 20-30% Total load 41 MW
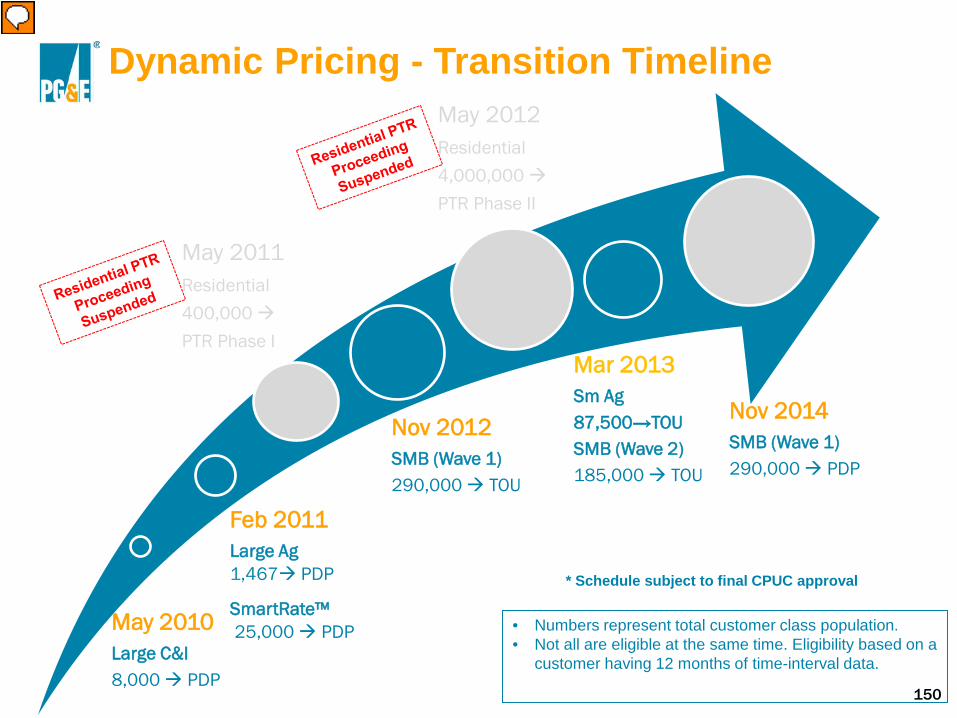
150
• Numbers represent total customer class population. • Not all are eligible at the same time. Eligibility based on a
customer having 12 months of time-interval data.
Dynamic Pricing - Transition Timeline
May 2010 Large C&I 8,000 PDP
Feb 2011 Large Ag 1,467 PDP
SmartRate™ 25,000 PDP
Nov 2012 SMB (Wave 1) 290,000 TOU
Mar 2013 Sm Ag 87,500→TOU SMB (Wave 2) 185,000 TOU
Nov 2014 SMB (Wave 1) 290,000 PDP
May 2011 Residential 400,000 PTR Phase I
May 2012 Residential 4,000,000 PTR Phase II
* Schedule subject to final CPUC approval
Presenter
Presentation Notes
Here’s the real opportunity 2014 ~1/4 million new SMB PDP customers. How do we help them understand this opportunity, and to consistently provide load?
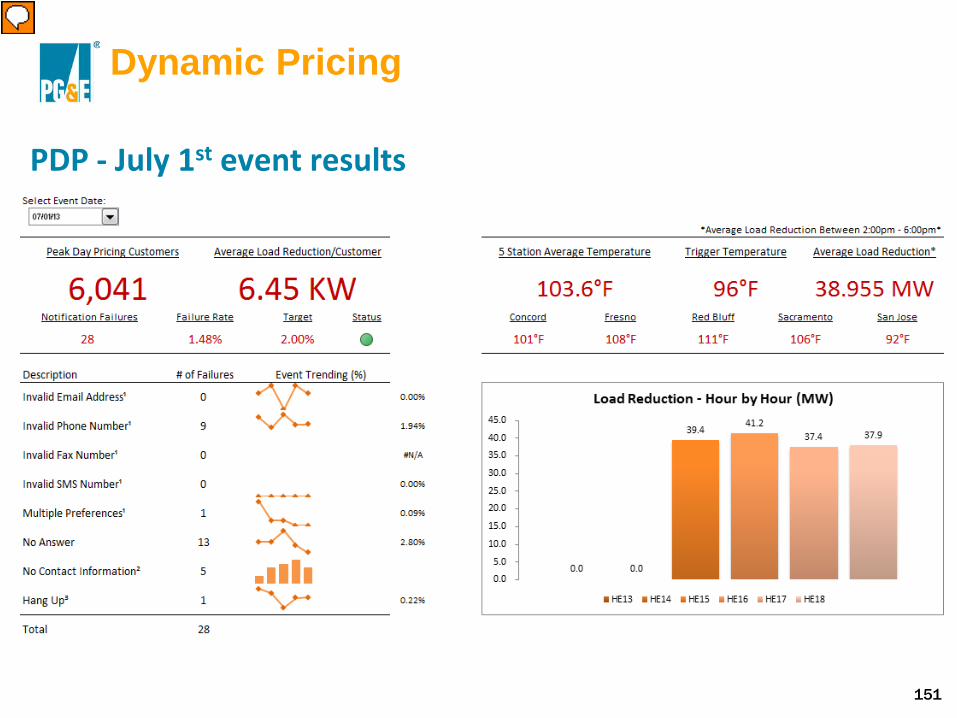
151
Dynamic Pricing
PDP - July 1st event results
Presenter
Presentation Notes
On par with PDP
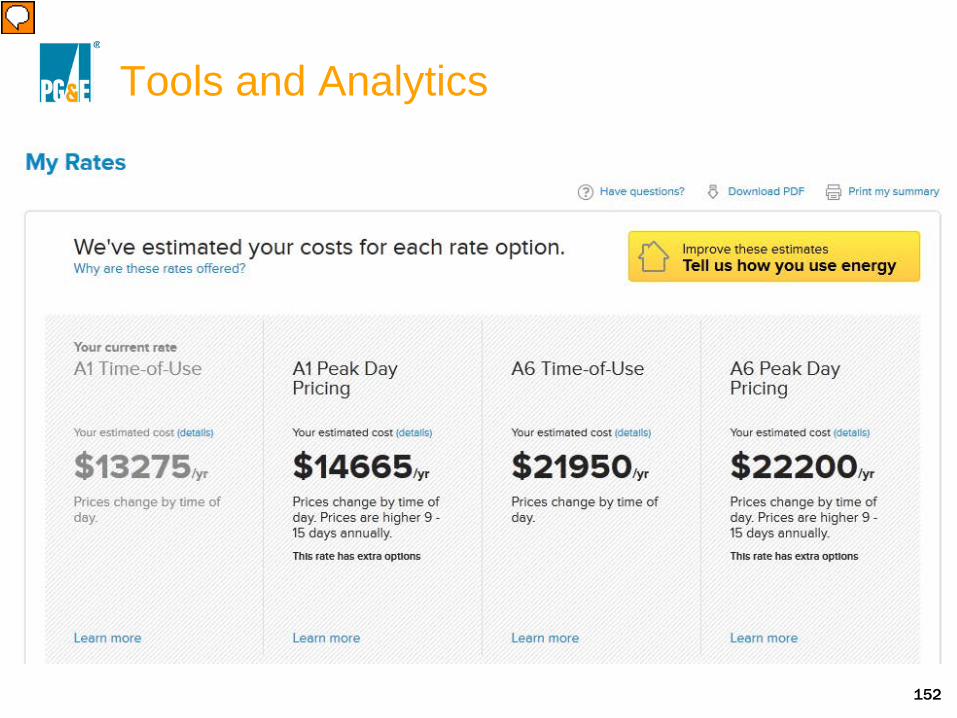
152
Tools and Analytics
Presenter
Presentation Notes
Here’s the challenge: how do we get this type of customer to try the rate? What customized actionable advise can I give him to help him save? Simply presenting data is the present, analytics and intelligence are the future
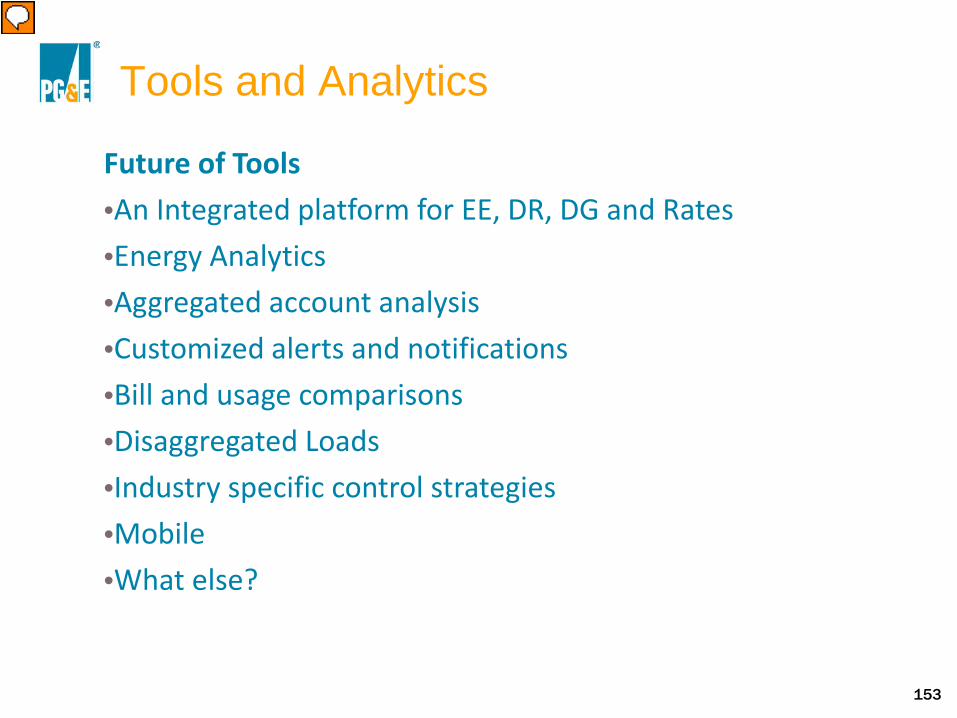
153
Tools and Analytics
Future of Tools •An Integrated platform for EE, DR, DG and Rates •Energy Analytics •Aggregated account analysis •Customized alerts and notifications •Bill and usage comparisons •Disaggregated Loads •Industry specific control strategies •Mobile •What else?
Presenter
Presentation Notes
More than half of our res NEMs customers are on flat rates! I hope you solar installers aren’t doing your ROI based on the flat rate to make the customer buy a bigger system! Energy analytics – who is the customer, what do they use power, does something look abnormal and what unique and actionable recommendations can we make?
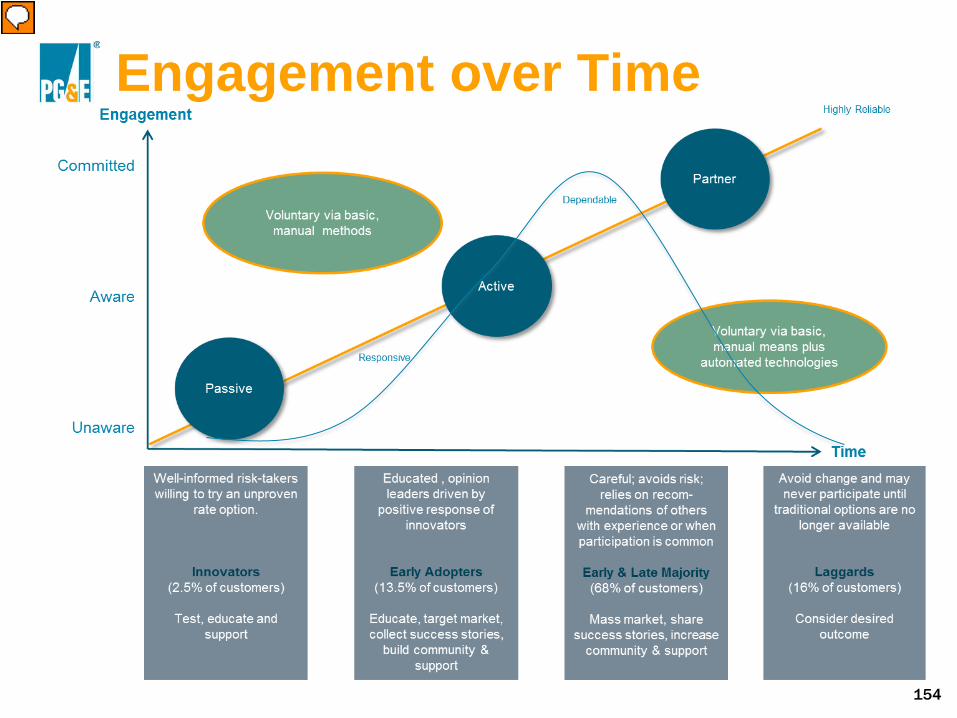
154
Engagement over Time
Presenter
Presentation Notes
Ultimately, getting the customer to engage is one of the primary goals, and understanding who the customers are who are most likely to engage and targeting those customers first with an invitation to join us is the first step. They will help move the rest of the market forward from this current passive state to one that helps both the customer realize their goals of control, options and savings and the utility’s goal in having a dependable partner for load reduction when we need it.
156
Evaluation, Measurement and Validation Speaker: Brian Arthur Smith: Manager, EM&V | PG&E
157
Presentation Overview
• What is EM&V • What EM&V does • Our involvement with Emerging Technology projects • Deliverables/typical time lines • Q/A
158
What is EM&V?
• Evaluation, measurement and verification • EM&V has three teams in PG&E
– Energy Efficiency (“EE”) has most comprehensive research portfolio, with IOU ability to formulate a portion of research
– Demand Response (“DR”) mostly regulatory driven, focused on confirming past demand reductions and predicting future ones
– California Solar Initiative/Direct Generation (“CSI/DG”) mostly regulatory driven, also seeks to confirm past impacts and predict future ones
159
What Does EE EM&V Do?
• EE EM&V Evaluates Trial/Program Performance • Evaluation does “Formative” research – how to
improve the design and operation of PG&E’s trials/portfolio/programs. This includes: – Assessment of energy savings potential for potential and
current products in the EE portfolio – Conduct process evaluations – Oversee market assessments/ characterizations – Do ad-hoc data mining
• Evaluation also: – Advocates for new evaluation methods, policies, protocols – Provides ad-hoc analyses to management – Responds to data requests – Reviews, comments and advocates for accuracy in CPUC-
led impact evaluations
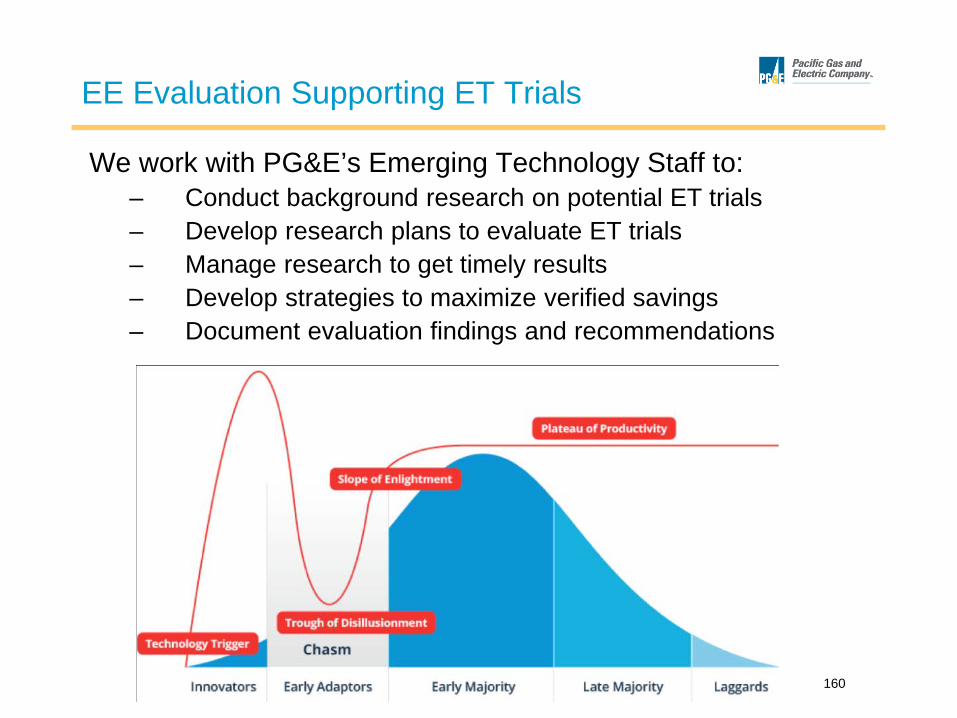
160
EE Evaluation Supporting ET Trials
We work with PG&E’s Emerging Technology Staff to: – Conduct background research on potential ET trials – Develop research plans to evaluate ET trials – Manage research to get timely results – Develop strategies to maximize verified savings – Document evaluation findings and recommendations
161
TRIO Questions that EM&V Seeks to Answer
• What are the unit energy savings (“UES”) from a new technology? – Hours of use – Delta Watts
• What’s the size of the potential market? • What are the key issues that inform estimates of
customer uptake? – Benefits and costs – Barriers
162
Market Assessments/Characterization Research
• Understand size of energy savings opportunities • Understand market dynamics, business cycles, key
players, barriers and opportunities • Develop market baseline • Investigate barriers to program participation and
other obstacles to program implementation • Recommend program interventions that can result in
energy savings from untapped opportunities
163
Some Examples of Our Work
• All EM&V-funded research is in the public domain • Final reports posted on CALMAC.org • Reach out to EM&V if you have questions
– Lucy Arnot is key contact: [email protected] – Reach me at [email protected]
164
Wrap-Up
Speaker: Aaron Panzer: Manager, Emerging Technologies Prgoram | PG&E
Please Complete Evaluation Forms
165
Networking with IOU Program Managers
166
Thank You Please Complete Evaluation Forms