Energy Investments After The Fall: Opportunity Or Slippery ... Chanos Grant's Fall... · James...
27
Energy Investments After The Fall: Opportunity Or Slippery Slope? Grant’s Fall 2015 Conference October 20, 2015 James Chanos Kynikos Associates
Transcript of Energy Investments After The Fall: Opportunity Or Slippery ... Chanos Grant's Fall... · James...

Energy Investments After The Fall:Opportunity Or Slippery Slope?
Grant’s Fall 2015 ConferenceOctober 20, 2015
James ChanosKynikos Associates

2
Energy Complex Upended
• High oil prices and cheap credit fuelled ramp in energy exploration and production (E&P)– Shale in the US– Large Liquefied Natural Gas
(LNG) projects in Asia, Australia, and Africa
• OPEC cracks– Members have competing
interests– Politics pressuring economics
• Tensions rise as budgets are under pressure– Higher breakeven costs for
government promises– Social stability at risk
Energy Has Repriced Over The Last Year
Source: Bloomberg

3
US Shale Revolution
• Shale revolution was a game changer– Crude oil production in the US rose
by 55% between 2009 and 2014 – Net crude imports fell by 20%
between 2009 and 2014– The US is the world’s largest oil and
gas producer
• Production of unconventional wells has high initial production followed by steep decline rates – Wells can see production declines by
70% in year 1, 50% in year 2, and 30% in year 3
– Creates need to invest continually in order to maintain production levels
• As global supply of oil has outgrown demand, oil price has plunged
Shale Production Boom (kboe/d)
Source: EIA, Bloomberg

4
A Gusher Of E&Ps
• Shale E&P in the US is an unconsolidated sector with little control over production and pricing– Largely funded by low Fed rates
• Short term management compensation plans are tied to production growth– Return on capital metrics are rare– Well participation agreements are
common
• Public valuations are tied to production growth– Investors relied on NAV and
EV/EBITDA, both of which are heavily dependent on production growth
• Most E&Ps need to spend 120% of cash flow to grow production with prices between $50-60/bbl
Source: Morgan Stanley, BMO
US E&P High Yield Issuance ($B)
* 2015E based on annualized YTD October 15, 2015 issuances

5
E&Ps Reduced Costs In An Unanticipated Fashion
• High cost US oil was expected to cut production to balance the market
• Rather than cutting production, E&Ps optimized cost per barrel and lowered 2015 costs by 30-50%– Squeezed service providers– Retreated to core areas– Focused on drilling efficiency
• US production is expected to grow 6% in 2015 despite a 59% drop in the US rig count since September 2014
• Production expected to decline 4% in 2016 at the current strip
Source: EIA, Baker Hughes, Bloomberg
US Rig Count Vs. Production

6
E&P Accounting Allows Flexibility
• Widespread use of full-cost accounting– While drilling and completion is always capitalized, businesses vary in how
aggressive they are in capitalizing costs– Drilling and completion, exploration, unsuccessful drilling/exploration efforts,
gathering and transport, G&A and interest expenses can all be capitalized– Allows E&Ps to defer depreciation of capitalized costs associated with
unproven reserves– Flatters EBITDA and leverage ratios
• Due to the variation in capitalization policies across businesses, it is important to know how aggressive the policy is when evaluating cash costs and margins– It is equally important to watch out for changes in policy
• GAAP reserve testing and PV-10 methodology in a deflationary price environment can lead to overstated reserves and valuations– Assumed selling price for all reserves is based on a trailing twelve month
average (1st day of each month) – Cost structure used in reserve tests reflect current cost environment

7
E&Ps Squeezed
• US oil and gas supply currently cannot tap global demand– Despite price declines, production continues– Federal approvals for exporting limited quantities of US oil and petroleum
products are beginning
– E&P company executives are lobbying Congress to lift the export ban on crude
• High yield producers are challenged to fund capex in a low price oil environment– Equity issuance decreased to $1.8B in 3Q15 from $7.4B in 1Q15
– Debt issuance decreased to $4.0B in 3Q15 from $12.8B in 1Q15
– Small and medium-sized E&P company liquidity is dependent on reserve-based credit facilities and borrowing bases are expected to drop as much as 15% in October 20151
– The weakest companies are starting to collapse under the weight of debt, as 8 bankruptcies have been announced in YTD15 vs. 3 bankruptcies between 2012 and 2014
Source: EIA, Goldman Sachs, Citi, Morgan Stanley; 1) “Oil Patch Braces for Financial Reckoning”, Wall Street Journal, September 15th, 2015
8
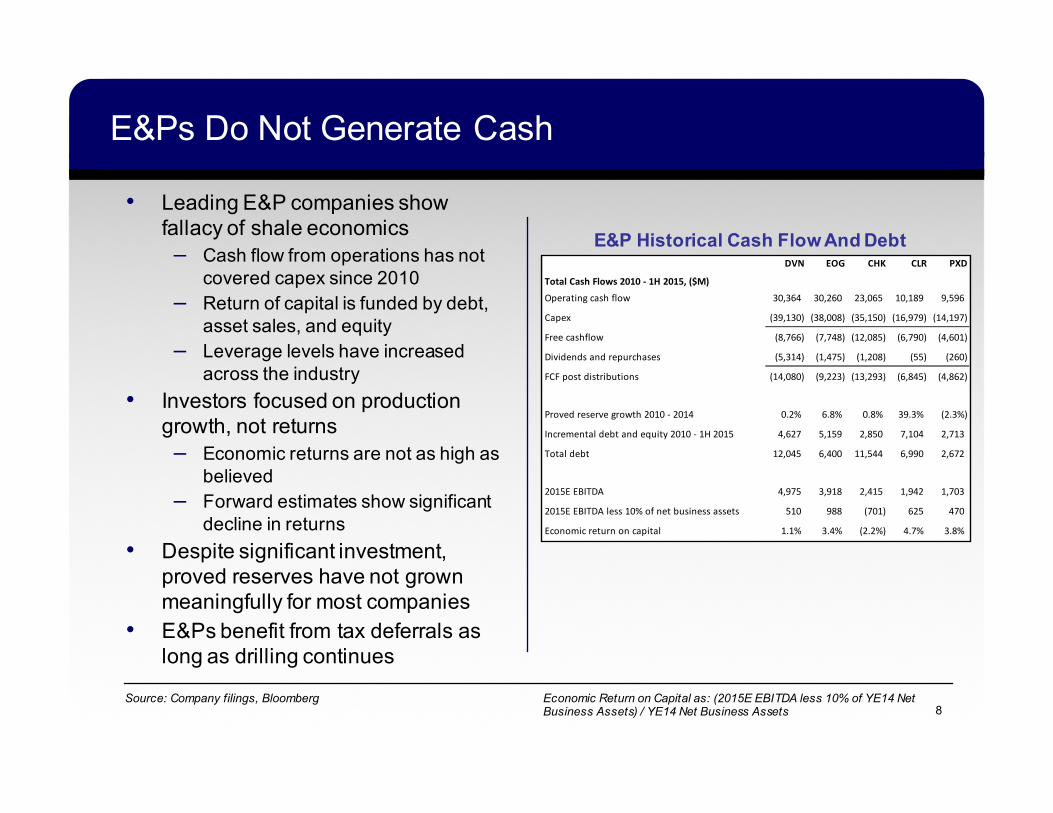
E&Ps Do Not Generate Cash
• Leading E&P companies show fallacy of shale economics– Cash flow from operations has not
covered capex since 2010– Return of capital is funded by debt,
asset sales, and equity– Leverage levels have increased
across the industry• Investors focused on production
growth, not returns– Economic returns are not as high as
believed – Forward estimates show significant
decline in returns• Despite significant investment,
proved reserves have not grown meaningfully for most companies
• E&Ps benefit from tax deferrals as long as drilling continues
E&P Historical Cash Flow And Debt
Source: Company filings, Bloomberg Economic Return on Capital as: (2015E EBITDA less 10% of YE14 Net Business Assets) / YE14 Net Business Assets
DVN EOG CHK CLR PXD
TotalCashFlows2010-1H2015,($M)Operatingcashflow 30,364 30,260 23,065 10,189 9,596
Capex (39,130) (38,008) (35,150) (16,979) (14,197)
Freecashflow (8,766) (7,748) (12,085) (6,790) (4,601)
Dividendsandrepurchases (5,314) (1,475) (1,208) (55) (260)
FCFpostdistributions (14,080) (9,223) (13,293) (6,845) (4,862)
Provedreservegrowth2010-2014 0.2% 6.8% 0.8% 39.3% (2.3%)
Incrementaldebtandequity2010-1H2015 4,627 5,159 2,850 7,104 2,713
Totaldebt 12,045 6,400 11,544 6,990 2,672
2015EEBITDA 4,975 3,918 2,415 1,942 1,703
2015EEBITDAless10%ofnetbusinessassets 510 988 (701) 625 470
Economicreturnoncapital 1.1% 3.4% (2.2%) 4.7% 3.8%

9
Liquidity Analysis Might Come Back In Vogue
• Traditional signs of balance sheet stress paint a dire picture
– Current and quick ratios routinely below 1.0x
• Low cash on balance sheets matters– Investors no longer interested in funding
capex in excess of cash flow
• High yield energy market is stretched and issuers are becoming increasingly constrained by covenants
– Traditional source of E&P capital
– Energy spreads are 480 bps wider than average high yield spreads
– Unused revolver capacity key to current ratio covenant compliance
• Energy bulls cite revolver capacity and distant financing maturities as reason to ignore depleted balance sheets
1H15 E&P Liquidity and Leverage ($M)
Source: S&P Capital IQ, Bloomberg Shading: current and quick ratios less than 1.0x, net debt / 2016E EBITDA greater than 3.0x and cash less than $100m
As of 2Q15 Current Ratio Quick RatioNet Debt /
2016 EBITDA CashCPG 0.4x 0.2x 1.9x 17UPL 0.5x 0.3x 5.7x 5CRZO 0.6x 0.2x 3.4x 2OAS 0.7x 0.4x 4.4x 14ERF 0.7x 0.4x 2.0x 1RRC 0.7x 0.2x 4.3x 1WLL 0.7x 0.6x 3.7x 60CXO 0.8x 0.5x 2.1x 0CHK 0.8x 0.7x 5.1x 2,051SWN 0.8x 0.5x 2.7x 37EGN 0.8x 0.3x 1.2x 2CLR 0.9x 0.8x 3.4x 25COG 0.9x 0.6x 1.8x 15SM 1.0x 0.5x 2.4x 0LPI 1.0x 0.5x 3.6x 58NFX 1.0x 0.6x 1.9x 42HES 1.1x 0.8x 1.6x 931APC 1.2x 1.0x 2.7x 2,173ECA 1.2x 0.9x 2.9x 496DVN 1.2x 0.8x 2.7x 1,725FANG 1.2x 0.8x 1.6x 45PXD 1.3x 0.6x 1.3x 219MRO 1.4x 1.2x 2.8x 1,572COP 1.4x 1.0x 1.7x 3,813MUR 1.4x 1.0x 1.7x 909DNR 1.5x 0.6x 6.0x 4WPX 1.5x 0.8x 2.0x 317RICE 1.5x 1.2x 2.5x 257ARX 1.6x 1.2x 0.9x 178EOG 1.6x 1.2x 1.1x 1,367QEP 1.7x 1.4x 2.8x 446GPOR 2.2x 1.8x 0.9x 525APA 2.3x 1.9x 1.6x 2,950EQT 2.4x 2.0x 0.8x 1,958XEC 2.5x 2.4x 0.7x 857

10
Is Bank Liquidity A Mirage?
• Banks of all sizes are increasingly vocal about their concerns with the energy sector
– Significant YTD reserve building, with negative credit migration expected to continue
– Emphasizing active engagement with borrowers and increased regulatory scrutiny
• Seemingly benign revolver redeterminations are accompanied by less publicized covenant adjustments
– A major Wall Street bank modified 72 out of 74 loans in its oil and gas book1
• Even “best-in-class” E&Ps are reluctant to tap revolvers– Despite $2.3B of revolver availability, CXO
decided to issue $794M of equity
• Return to growth cannot happen without cheap equity and debt, neither of which exist today
High Yield Issuers Are IncreasinglyMore Reliant On Equity ($B)
Source: Morgan Stanley, Company filings; 1) “The tangle of loose lending to tight oil”, Financial Times, October 15th, 2015
* 2015E based on annualized YTD October 15, 2015 issuances

Total Cash Flows 2009 - 1H15 ($B)BP Chevron RDS Total Exxon
Operating cashflow 130.0 210.8 232.0 161.8 296.6
Capex (89.2) (185.5) (196.8) (156.2) (204.1)
Free cashflow 40.8 25.3 35.2 5.6 92.6
Dividends and buybacks (26.9) (54.5) (69.3) (44.0) (174.3)
FCF post distributions 13.9 (29.1) (34.1) (38.4) (81.7)
Total reserves CAGR, 2009-2014 (0.8%) (0.2%) (1.3%) 1.4% 1.6%
Incremental debt 2009-2Q15 18.0 21.6 17.9 30.0 24.2
Total debt 2Q15 52.1 31.8 52.9 56.5 33.8
Total debt 2009 34.0 10.2 35.0 26.4 9.6
ROIC LTM 2Q15 3.5% 7.7% 13.5% 3.7% 12.1%
ROIC 2009 15.4% 14.7% 19.3% 18.0% 21.6%
ROIIC 2009-2Q15 (52.7%) (1.1%) (0.6%) (13.0%) 0.8%
11
Big Oil Is Pumping Negative Cash Flow
• Cash flow after distributions is negative– Distributions support stock price– Growing debt funding the gap– Buybacks starting to be curtailed
• Paying more for less– Big 51 production has declined 12%
to 5,502mboe in 2014 from 6,235mboe in 2010
– Costs per barrel increased 82% to $29.6/bbl in 2014 from $16.2/bbl in 2010
• Replacing less reserves at a higher cost– Costs per organic barrel addition is
up almost 4x to $35.1/bbl in 2014 from $9.5/bbl in 2009
– Reserve replacement ratio was 76% in 2014, the lowest level since 2007
Source: Company filings
1) Big 5 includes BP, Chevron, Royal Dutch Shell, Total, ExxonMobil
IOC Historical Cash Flow And Debt
ROIC calculated as: EBIT / Net Business AssetsROIIC calculated as: (LTM 2Q15 EBIT – 2009 EBIT) / (2Q15 NBA –2009 NBA)
Note: BP LTM 2Q15 EBIT excludes Gulf of Mexico related losses

More LNG Projects Coming Online
• Global LNG supply/demand balance now unfavorable for producers– Global capacity to increase to 400Mt
in 2018 from 290Mt in 2013– Bulls argue insufficient supply
constrained demand after the past 3 years of stagnant growth
• Major projects coming online– Australia has $180B invested in top 6
projects bringing 53Mtpa online over the next two years
– US LNG exports to begin in 4Q15– ExxonMobil and Total ramping
production in Papua New Guinea• North American proposed projects
– US has 22 proposed projects with capacity of 270Mtpa, equivalent to 94% of global capacity in 2014
– British Columbia has 19 LNG projects proposed
Source: Australian Petroleum Production and Exploration Association, International Gas Union Global LNG Report 2015 Edition, US Department of Energy, Bernstein 12
Major LNG Projects – Break-Even Prices($/mmBtu FOB)
13
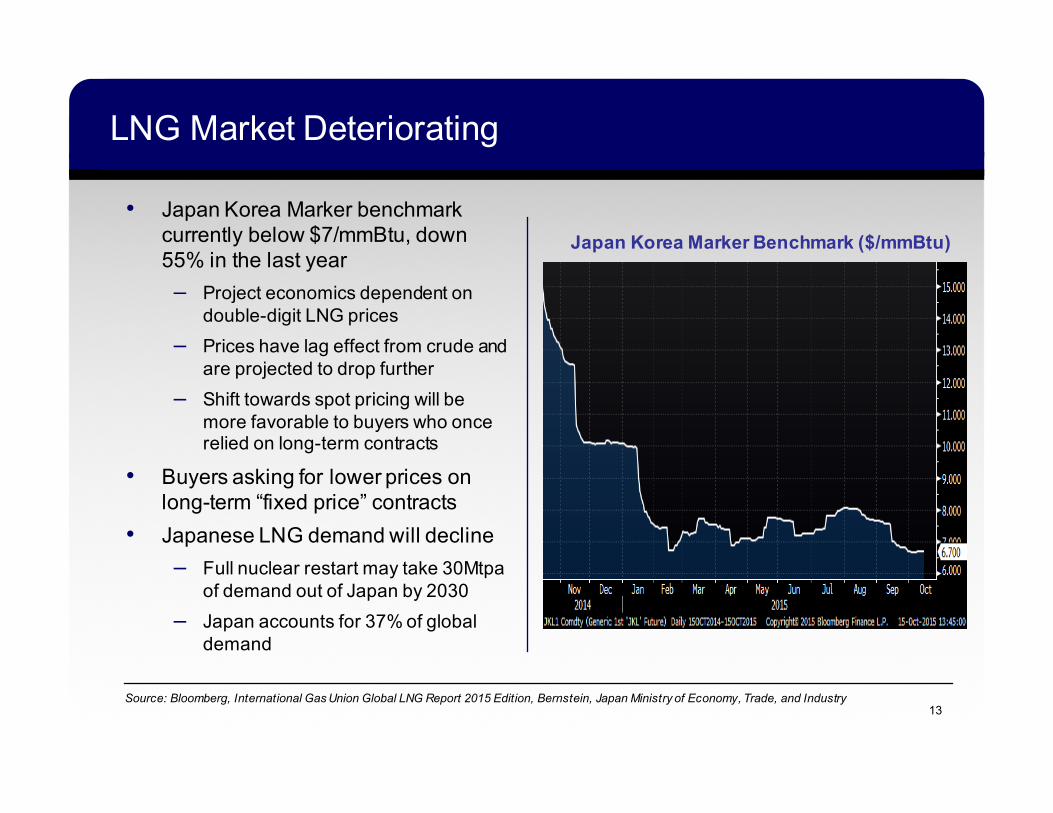
LNG Market Deteriorating
• Japan Korea Marker benchmark currently below $7/mmBtu, down 55% in the last year– Project economics dependent on
double-digit LNG prices– Prices have lag effect from crude and
are projected to drop further– Shift towards spot pricing will be
more favorable to buyers who once relied on long-term contracts
• Buyers asking for lower prices on long-term “fixed price” contracts
• Japanese LNG demand will decline– Full nuclear restart may take 30Mtpa
of demand out of Japan by 2030– Japan accounts for 37% of global
demand
Source: Bloomberg, International Gas Union Global LNG Report 2015 Edition, Bernstein, Japan Ministry of Economy, Trade, and Industry
Japan Korea Marker Benchmark ($/mmBtu)

14
Are LNG Contracts Indestructible?
• Most contracts are not publicly disclosed• Petronet breaks contract with Qatar
– It is cheaper purchase spot cargoes and pay $1.4B upfront fee than pay for the agreed-upon volume and price
– Contract was in year 11 out of 25– Only willing to take 70% of agreed-upon
volumes, when the minimum was 90%• Shell CEO says long-term LNG contracts
have pricing formulas reviewed every 3 to 6 years
– 85 to 90% of Shell’s LNG contracts are long-term (2 or more years)
– Growing concern that Chinese regulators may ask for changes in LNG contracts or asset sales to approve BG takeover
• Japanese buyers showing unwillingness to take test batches of LNG from new projects in Australia
• Qatar, the largest supplier of LNG, no longer opposed to making changes to existing contracts
Source: Company Filings, BG Group, Shell CEO Comments at Barclays CEO Energy Conference, September 8, 2015, Reuters, Egypt Independent, Bloomberg, Barclays
“There is no doubt that different contractarrangements are being experimented with asbuyers look to manage price risk”
-Robert Franklin, ExxonMobil Gas & PowerMarketing President
September 16, 2015
“We are moving into a buyers’ market andpeople will go the way that offers better options”
-Prabhat Singh, Petronet LNG CEO October 5, 2015

15
Royal Dutch Shell

16
Shell’s $70B Bet On LNG And Brazil
• Shell pays 50% premium to acquire BG Group, a restructuring story focused on LNG and Brazil
– Bull oil case of $110/bbl, base case of $90/bbl
– Pro-forma a more levered entity with $68B of net debt and declining cash flow
• An expensive solution to aid struggling legacy upstream portfolio
– Shell proved reserve replacement ratio of 26% in 2014, the lowest of the Big 5 since 2010
– Production rates declined 11% to 2.7Mboe/d in 2Q15 from 3.1Mboe/d in 2Q14
• Pro-forma LNG capacity of 70Mtpa by 2020, equivalent to 17% of estimated global trade
• Major LNG projects in Australia dependent on strong Asian demand
Source: Bloomberg, International Gas Union Global LNG Report 2015 Edition, Redburn, Bernstein, Citi, UBS, Company filings
Shell And BG Pro-Forma ($M)
Shell BG Combined Shell BG CombinedCash 21,607 5,295 26,902 20,288 5,295 25,583Total debt 45,540 17,507 63,047 78,225 14,961 93,186Net debt 23,933 12,212 36,145 57,937 9,666 67,603
CFFO 45,044 7,397 52,441 30,573 6,234 36,807Capex 31,854 8,510 40,364 28,789 6,243 35,032FCF 13,190 (1,113) 12,077 1,784 (9) 1,775
EBITDA 51,888 8,846 60,734 38,705 6,013 44,718Capex 31,854 8,510 40,364 28,789 6,243 35,032EBITDA-Capex 20,034 336 20,370 9,916 (230) 9,686
Production (kboe/d) 3,166 606 3,772 2,961 667 3,628
2015E2014
Assumption: 2015 Total debt assumes deal closes in 2015

2020 ($B)
BP Chevron RDS/BG Total Exxon
EBITDA 32.4 35.4 52.8 53.9 52.7
Capex (19.4) (23.8) (35.6) (21.1) (25.3)
EBITDA - Capex 13.0 11.6 17.2 32.8 27.4
Total Enterprise Value 123.1 169.3 253.2 143.3 345.6
TEV/EBITDA 3.8x 4.8x 4.8x 2.7x 6.6x
TEV/(EBITDA - Capex) 9.5x 14.6x 14.7x 4.4x 12.6x
17
The Dream Of The Combined Shell And BG
• Greater production– Total production expected to increase
15% by 2020 to 4.3Mboe/d– Brazil deep water production
expected to account for nearly all growth in oil production
• Growing cash flows– CFFO to increase to $53B in 2020
from $43B once the deal closes in 2016
– $2.5B in synergies by 2018
• Higher distributions– Annual dividends raised to $15B from
$12B in combined pro-forma 2014– $25B in buybacks between 2017-
2020 driven by oil price recovery
• $30B in asset sales between 2016 and 2018 to offset incremental debt
2020E Financials For The Big 5 ($B)
Sources: Company filings, Goldman Sachs, Bernstein, Bloomberg
18
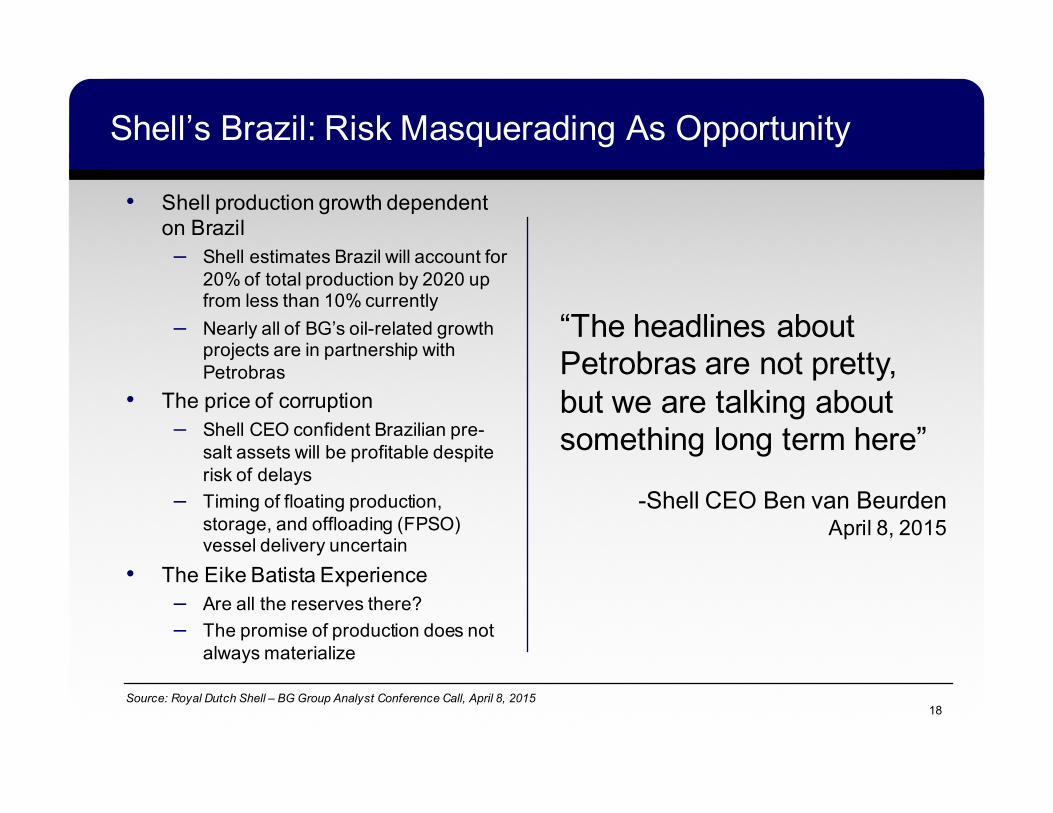
Shell’s Brazil: Risk Masquerading As Opportunity
• Shell production growth dependent on Brazil– Shell estimates Brazil will account for
20% of total production by 2020 up from less than 10% currently
– Nearly all of BG’s oil-related growth projects are in partnership with Petrobras
• The price of corruption– Shell CEO confident Brazilian pre-
salt assets will be profitable despite risk of delays
– Timing of floating production, storage, and offloading (FPSO) vessel delivery uncertain
• The Eike Batista Experience– Are all the reserves there?– The promise of production does not
always materialize
Source: Royal Dutch Shell – BG Group Analyst Conference Call, April 8, 2015
“The headlines about Petrobras are not pretty, but we are talking about something long term here”
-Shell CEO Ben van BeurdenApril 8, 2015

19
Cheniere Energy

20
Cheniere’s Dream
• Annual EBITDA of $4.1B from 9 trains– Baseline cash flows are guaranteed on 20-year “take or pay” contracts– Cash flows from liquefaction fees will easily cover construction costs and pay off debt– Uncontracted volumes will find buyers who will pay liquefaction fees of $3.50/mmBtu– Buyers are responsible for shipping to end users, so demand is locked in– 100% utilization rate at all times
• LNG capacity from Sabine Pass and Corpus Christi will total 40Mtpa– Equivalent to 10% of the global market by 2020
• No commodity pricing risk gives Cheniere an unique position in the LNG market– Other producers are responsible for producing gas that feeds into LNG projects, thus
there are minimal capex requirements once the projects are online– Sales agreements are indexed to 115% of Henry Hub, which is cheap relative to gas
prices elsewhere– Liquefaction costs only $1/mmBtu but fees range between $2.25-3.50/mmBtu
• Activist involvement will manage cost base more efficiently– Icahn raises stake to 12% from 8% and granted two seats on the board
• Cost to build LNG facilities are at a fraction of Australian projects• First US exporter of LNG beginning in 4Q15Source: Company filings, Goldman Sachs, Raymond James

21
Cheniere Reality
• Annual EBITDA of $1.7B from 7 trains generated by contracted volumes– Stock is trading at 16x 2020 EV/EBITDA generated from contracted volumes– Does not factor in possible delays to LNG train buildout, which is common across the industry– Difficulty finding buyers willing to commit to long-term contracts
• 87% of commissioned capacity is on “take or pay” contracts which represent less than half of Cheniere’s dream EBITDA
• 13% of capacity is uncontracted and will struggle to breakeven regardless of destination– Filings do not show sensitivities to Asian LNG prices below $8/mmBtu– Management assumes gross margins of $4-7/mmBtu on uncontracted volumes, which implies a
premium to spot prices– Global LNG markets will remain oversupplied when spare capacity is available for marketing
• Liquefaction terminals have an average utilization rate of 88%• Cheniere is a complex holding company structure with multiple operating joint ventures• Most of the LNG trains have not been completed and still need funding
– All 7 trains will cost $29B, but less than half of all construction is complete– Construction of Corpus Christi trains 1 and 2 will cost $12B
• Operating level financing has caveats– Class B shares of Cheniere Energy Partners (CQP) increase by 3.5% compounded each quarter
• Management unsure if first LNG cargo will meet 4Q15 target
Source: Company filings, BG Group, Bloomberg, Barclays

22
Residential Solar Market Is Uneconomical
• Government largess, not economics, drive residential rooftop systems– Net metering allows residential
systems to sell electricity to utilities at retail rates
– IRS rules encourage rooftop solar via 30% investment tax credit (ITC) and accelerated depreciation
– Residential rooftop systems are more than twice as expensive per watt as utility scale solar projects
• Of 6GWs total US solar photovoltaic installations in 2014, 1.2GWs were residential rooftop systems, most of them in California
• SolarCity and others finance systems to households lacking sufficient income and upfront capital to take advantage of the arbitrage
US Solar PV System Installed Costs ($/watt)
Source: Solar Energy Industries Association - Solar Market Insight Report 2015 Q2

23
SolarCity
24
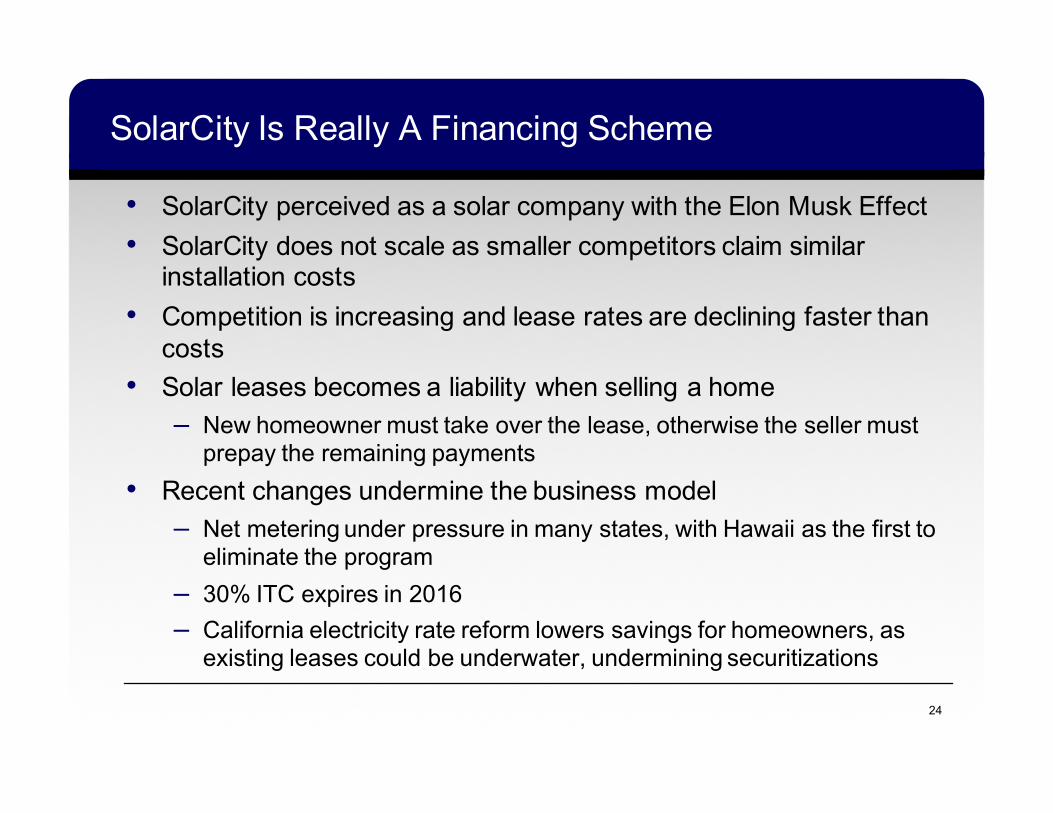
SolarCity Is Really A Financing Scheme
• SolarCity perceived as a solar company with the Elon Musk Effect• SolarCity does not scale as smaller competitors claim similar
installation costs• Competition is increasing and lease rates are declining faster than
costs• Solar leases becomes a liability when selling a home
– New homeowner must take over the lease, otherwise the seller must prepay the remaining payments
• Recent changes undermine the business model– Net metering under pressure in many states, with Hawaii as the first to
eliminate the program– 30% ITC expires in 2016– California electricity rate reform lowers savings for homeowners, as
existing leases could be underwater, undermining securitizations

25
SolarCity Math
• Returns on invested capital based on lease revenues are below 8%
• Claims >30% margins on its leasing business, but requires outside capital to build new systems
• 2Q15 LTM FCF of $(1.9B) including new systems
• Uses 6% discount rate to calculate the net present value of 20-year residential leases– Assumes that 90% of customers
will renew the contract for another 10 years
Annualized Lease Revenue / Invested Capital
Source: Company filings
26
Thank You To Grant’s Fall 2015 Conference

Important Disclosure
THIS DOCUMENT IS FOR PRELIMINARY INFORMATIONAL PURPOSES ONLY AND IS NOT AN OFFERING TO SELL INTERESTS IN THE STRATEGIES. AN OFFERING CAN ONLY BE MADE BY DELIVERY OF THE OFFERING MEMORANDUM AND ASSOCIATED DOCUMENTS FROM THE PROPER STRATEGY TO QUALIFIED INVESTORS. NEVERTHELESS, YOU ARE NOT TO RELY SOLELY UPON THE DATA HEREIN TO MAKE AN INVESTMENT DECISION.
QUALIFIED INVESTORS SHOULD CAREFULLY REVIEW THE RESPECTIVE OFFERING MEMORANDUM FOR A COMPLETE DESCRIPTION OF THE POTENTIAL MERITS AND RISKS INVOLVED.
PAST PERFORMANCE IS NOT NECESSARILY INDICATIVE OF FUTURE RESULTS.
NO OFFER TO SELL OR SOLICITATION OF AN OFFER TO BUY WILL BE MADE IN ANY JURISDICTION IN WHICH SUCH OFFER SOLICITATION WOULD BE UNLAWFUL.
THIS DOCUMENT HAS BEEN PROVIDED FOR INFORMATIONAL AND ILLUSTRATION PURPOSES, IS FURNISHED ON A CONFIDENTIAL BASIS, IS INTENDED ONLY FOR THE USE OF THE AUTHORIZED RECIPIENT AND MAY NOT BE DISTRIBUTED TO ANY OTHER PERSON WITHOUT THE PRIOR WRITTEN CONSENT OF KYNIKOS ASSOCIATES LP. CERTAIN INFORMATION PROVIDED HEREIN IS OBTAINED FROM SOURCES, INCLUDING PUBLICLY AND PRIVATELY AVAILABLE INFORMATION, THAT KYNIKOS ASSOCIATES LP CONSIDERS TO BE RELIABLE; HOWEVER, KYNIKOS ASSOCIATES LP CANNOT GUARANTEE AND MAKES NO REPRESENTATION AS TO THE ACCURACY OF SUCH INFORMATION. INFORMATION PROVIDED IS AS OF THE DATE(S) INDICATED AND IS SUBJECT TO CHANGE.
THIS DOCUMENT AND THE INFORMATION CONTAINED HEREIN ARE PROPRIETARY INFORMATION OF KYNIKOS ASSOCIATES LP AND MAY NOT BE REPRODUCED OR OTHERWISE DISSEMINATED IN WHOLE OR IN PART WITHOUT THE PRIOR WRITTEN CONSENT OF KYNIKOS ASSOCIATES LP.
CONFIDENTIAL – DO NOT COPY OR DISTRIBUTE
© KYNIKOS ASSOCIATES LP – ALL RIGHTS RESERVED.